
By:
The Lewin Group
Submitted to:
The Office of the Assistant Secretary for Planning and Evaluation and
The National Institute of Mental Health,
U.S. Department of Health and Human Services
This report was prepared by Catherine Harrington, Razmic Gregorian, Eric Gemmen, Christina Hughes, Katharine Golden, Gail Robinson, and Leslie Scallet of The Lewin Group. This report was prepared under contract for the Office of Health Policy, Office of the Assistant Secretary for Planning and Evaluation, and The National Institute for Mental health, Department of Health and Human Services. The content of this report is solely the responsibility of The Lewin Group. For more information, please contact Catherine Harrington at 703-269 5730.
"
Chapter I: Introduction
A. Understanding of the Problem
Drug benefits are the fastest growing major cost component both of private insurance and Medicaid, averaging 12.2% growth per year compared to 5.1% for total health spending (1993-1998).1 In 1997, $78.9 billion were spent on prescription drugs, representing 7% of total health care expenditures.2 More specifically, spending on the newer antidepressants such as fluoxetine, sertraline, and paroxetine increased by 240% between 1993 and 1998, representing 11.8% ($5 billion) of the total increase in drug expenditures over this time period.3
To slow the growth in pharmaceutical costs, health care payers have initiated utilization control mechanisms. Examples include restricted formularies (i.e., lists of pharmaceuticals approved for reimbursement that may include only the older, less expensive, and sometimes less effective medications), limits on the numbers of prescriptions or units allowed and prior authorization requirements for newer medications. In the case of substance abuse, many plans do not offer access to any substance abuse treatment, making pharmaceutical intervention much less likely or even impossible. To consumers, families, and mental health advocates these controls translate into denials of care.
In fact, many consumers, clinicians, and advocates believe that denying or reducing access to drugs may cost more in the long term. Instead of using effective pharmacotherapies early, consumers and advocates contend that precious time and money is wasted in older or less effective treatments. Consequently, the quality of their lives suffers. While criticism for using these practices often focuses on managed care organizations (MCOs), similar cost control measures exist in traditional insurance, including Medicaid.
New medications introduced in the last decade represent a significant advance in the effective treatment of mental illnesses. In general, the newer medications have proven efficacious in treating various mental disorders (particularly schizophrenia and major depression), with a noticeable reduction in, or absence of, the adverse side effects often associated with the older generation of psychiatric medications. These agents include Selective Serotonin Reuptake Inhibitors (SSRIs), other new generation antidepressants (e.g., nefazadone, venlafaxine, bupropion, mirtazapine), and atypical antipsychotics (e.g., risperidone, olanzapine, quetiapine). More specifically, newer generation drugs feature real-world effectiveness, ease of dosing, and improved safety.
Timely use of the most effective drug therapies can reduce the need for inpatient treatment and minimize the disabling effects of severe illnesses and disorders, such as schizophrenia and major depressive disorder. Furthermore, the milder side effects of many of the newer medications may ensure better compliance with therapy. Together, these factors can result in marked improvement in the productivity and quality of life for both the consumer and the consumer's family.
However, these newer medications are often substantially more expensive than the medications they are intended to replace. For example, the average wholesale price (AWP) for the antidepressant fluoxetine is $150.10 for a 30-day supply of an average therapeutic dose while a 30-day supply of the older antidepressant, amitriptyline, lists between $3.00 for a generic version and $5.00 for the branded version.
Although not formally related, this study benefited from prior work conducted by The Lewin Group on this topic for the Substance Abuse and Mental Health Services Administration (SAMHSA). In 1998, The Lewin Group conducted a trend analysis concerning the status of pharmacy benefits for behavioral health under public insurance.4 In that study, representatives from primary stakeholder groups were interviewed to determine the principal barriers in place that act to restrict access to the newer psychotropic medications. The trend paper summarized those findings and made an assessment of existing data sources and published literature to determine the extent to which the issues identified by the stakeholders could be (or had been) addressed from existing sources.
Until the present study, however, no primary research had been conducted on these questions. Most of the complaints were based on anecdotal experience. Nevertheless, such experiences did raise a clear policy concern as to whether health care payers have gone too far in controlling the utilization of pharmaceuticals. This is especially true as managed care programs assume increasing responsibility for caring for the severely mentally ill, and as the issue of mental health parity and the scope of desirable benefits are publicly debated and often legally mandated in various forms.
B. Purpose of Study
The Assistant Secretary for Planning and Evaluation (ASPE), United States Department of Health and Human Services and the National Institute of Mental Health (NIMH) commissioned the present study to identify, document, and assess the factors that affect access to and utilization of new generation antidepressant and antipsychotic medications. Three primary questions guided this assessment:
- What are the formal policies and procedures implemented by health care payers that affect consumer access to and utilization of psychiatric medications? Are these policies and procedures different for psychiatric medications than for other medication classes?
- How does the implementation of these policies and procedures affect access to and utilization of these medications?
- Do policies, procedures, and modes of implementation (regardless of whether they differ for mental health) create barriers to adequate mental health care?
For the purposes of this study, access and utilization are defined in the broadest terms to include issues of awareness, acceptance, availability, affordability, and adequacy of treatment.
The study is designed to assist the U.S. Department of Health and Human Services to evaluate existing and proposed policies in this area by developing important insights and knowledge concerning the complex processes related to access, utilization, and coverage of newer psychotropic medications from a variety of perspectives. This study is also designed to identify clinical and health policy issues where further research is needed.
C. Scope of Study
From its outset, this study was designed to answer the above questions by evaluating six principal issues that work together to influence the degree to which consumers have access to and are able to use the most up to date pharmaceutical therapies for mental illnesses. Broadly speaking, these issues include:
- The existing policies, guidelines, and practices that affect the availability and use of the new antidepressant and antipsychotic medications from the perspective of the stakeholders;
- The factors or considerations that are perceived as obstacles or barriers to the use of newer psychotropic medications (i.e., "access");
- Obstacles or problems associated with current formulary policies or clinical guidelines that may inhibit appropriate use of these medications (i.e., "utilization");
- Patterns of antidepressant and antipsychotic utilization in Medicaid between 1995 and 1998;
- The cost-effectiveness of newer medications as assessed through a limited literature review supplemented by discussions with key stakeholders; and
- Emerging trends in the coverage of pharmaceuticals that likely will post the most significant threats to the widespread accessibility of newer technologies.
Newer Antidepressant and Antipsychotic Medications
The antidepressants and antipsychotics of interest to this study are shown Exhibits I-1 and I-2, respectively, by generic and brand names. The principal antidepressants considered in this study include the Selective Serotonin Reupatke Inhibitors (SSRIs) and other newer antidepressants including venlafaxine, bupropion, nefazadone, and mirtazapine. These agents contrast with older classes of antidepressants, namely the Tricylcic Antidepressants (TCAs) and Monoamine Oxidase Inhibitors (MAOIs).
Pharmacotherapy is an important component of effective treatment of mental illness. Effective treatments for mental disorders date to the 1950s. For example, older antidepressants (e.g., TCAs) have proven to be effective; however, difficulties in dosing often lead to less than satisfactory results in common use (i.e., the "real world"). Furthermore, the lethal dose of TCAs is relatively low compared to the standard therapeutic dose. This danger is especially high for patients in crisis who may be suicide-prone. Newer agents such as SSRIs have generally proven as efficacious as the TCAs, and often have simpler (i.e. once a day) dosing and are far less lethal in overdose. They have also proven helpful in treating an array of other illnesses including obsessive-compulsive disorder, panic disorder, and social phobia.
Nonetheless, the side effect profiles of both TCAs and newer agents can be unpleasant. TCAs are associated with side effects such as constipation, dry mouth, urinary retention, and sedation, while SSRIs, carry the risk of sexual dysfunction, sleep disruptions, and increased anxiety. Venlafaxine has an associated risk of hypertension, while bupropion has a risk of seizures. In general, however, simpler dosing regimens and more acceptable side effect profiles for the newer drugs are thought to improve compliance and success.5
Exhibit I-1. Representative Antidepressants Marketed the United States, 1999
| Generic Name | Brand Names |
|---|---|
| Selective Serotonin Reuptake Inhibitors | |
| Citalopram | CelexaTM |
| Fluoxetine | Prozac® |
| Fluxvoxamine | Luvox® |
| Paroxetine | Paxil® |
| Sertraline | Zoloft® |
| Tricyclic Antidepressants (Representative) | |
| Amitriptyline | Elavil® |
| Desipramine | Norpramin® |
| Imipramine | Tofranil® |
| Nortriptyline | Pamelor® |
| Trazodone | Desyrel® |
| Monoamine Oxidase Inhibitors (MAOIs) | |
| Phenelzine | Nardil® |
| Tranylcypromine | Parnate® |
| Others | |
| Bupropion | Wellbutrin®, Wellbutrin® SR |
| Mirtazapine | Remeron® |
| Nefazadone | Serzone® |
| Venlafaxine | Effexor®, Effexor® XR |
The antipsychotic agents (Exhibit I-2) principally considered in this study include the archetype of the "atypical" antipsychotics, clozapine, together with three newer agents, risperidone, olanzapine, and quetiapine. These agents were designed to replace older generation pharmaceuticals including the phenothiazine class, haloperidol, and other miscellaneous antipsychotic agents.
Exhibit I-2. Representative Antipsychotics Marketed in the United States, 1999
| Generic Name | Brand Name |
|---|---|
| Atypical Antipsychotics | |
| Risperidone | Risperdal® |
| Olanzapine | Zyprexa® |
| Quetiapine | Seroquel® |
| Clozapine | Clozaril® |
| Typical Antipsychotics | |
| Haloperidol | Haldol® |
| Chlorpromazine | Thorazine® |
| Fluphenazine | Prolixin® |
Similarly, older antipsychotics (e.g., haloperidol, chlorpromazine) have proven effective for many patients. However, the duration of effect is often short-lived and these agents have no benefit for the so-called negative symptoms of schizophrenia, such as social withdrawal. The older agents are also associated with very high risks of extrapyramidal side effects (EPS) and tardive dyskinesia (TD) that often are associated with poor patient compliance and severe distress for both the patient and their families. The newer agents (e.g., risperidone, olanzapine, quetiapine) are generally as effective as the older agents and show promise in the treatment of negative symptoms. Clozapine has shown superior efficacy, especially in treatment-refractory patients. The newer agents typically have milder side effect profiles that may assist with compliance. Clozapine, however, is associated with a significant risk of agranulocytosis. Risperidone is not without some risk of EPS, while olanzapine is associated with weight gain, and quetiapine with somnolence.5
Barriers to Access and Utilization of Newer Antidepressants and Antipsychotics: Starting Points for the Study
Based on previous reports and the 1998 trend analysis, a number of issues and factors had been identified that were used as an initial starting point to organize this research. The cost of newer medications has clearly been identified as a key issue. The increased costs associated with the development and use of the newer antidepressants and antipsychotics may pose significant barriers to their general and unrestricted use by consumers. From one perspective, the higher price of any new medication is justified as a means of recovering research and development costs. These costs include identifying a potential product and evaluating it through various required phases of pre-clinical and clinical testing that are needed to obtain formal approval of the drug from the Food and Drug Administration (FDA). This costly development and approval process typically takes several years, and no assurances exist that a marketable product will result. Even after FDA approval is obtained and the product is marketed, post-marketing issues may turn a profitable product into an unprofitable one.
Both public and private health care payers are also under considerable financial pressure, and may resist covering newer agents in an effort to control increasing prescription expenditures. Even if the clinical efficacy of a newer but more expensive medication is demonstrably superior to an older less costly medication, the cost-benefit decision point is not clear cut. Use of the less effective, but less expensive, medication may be defensible from the point of view that the added clinical value does not justify the higher cost of the newer medication on a routine basis.
However, the value of reduced or absent side effects and/or enhanced clinical efficacy may have cost implications that can counter-balance or offset the higher drug acquisition costs. Medications with fewer and/or more moderate side effects may improve patient compliance with therapy, which may lead to improved effectiveness when used in clinical practice. This improved real-world effectiveness may lead to improved day to day functioning while reducing other health care costs, such as those for physician or hospital visits.
While cost-savings and cost-effectiveness are often treated as equivalent, it is important to recognize that cost-savings do not accrue equally to all stakeholders. For example, health care payers reap the benefit of any savings in direct medical costs, while the consumer's interest lies in the most effective treatment with the mildest side effects, regardless of cost. Furthermore, the practice of administering budgets for individual health care sectors separately (e.g., pharmacy, psychiatric services, hospitals), often prevents health care payers from recognizing the overall net savings as individual service sectors struggle to manage their individual budgets.
Realistically, numerous factors affect the extent to which newer antidepressants and antipsychotics reach individuals who might benefit from them. Based on the 1998 trend analysis, it was thought that some of these factors would include:
- Physician (both primary care and psychiatrist) knowledge, attitude, and prescribing practices regarding newer psychotropic medications;
- Patient knowledge, attitudes and compliance with prescribed medication regimens;
- Drug benefit coverage decisions made by both private and public insurance plans, including
- Formulary acceptance,
- Patient cost-sharing requirements,
- Prior authorization requirements, and
- Requirements for a psychiatrist to prescribe psychotherapeutics;
- Formal or informal business arrangements between pharmaceutical companies, managed care organizations, and treatment facilities to promote or restrict access to and utilization of certain drugs;
- The extent and type of marketing efforts by pharmaceutical companies.
These factors are likely to vary by the kind of insurance coverage or health care system being considered, plan organization, and the type of health delivery model used.
D. Methodology
The present analysis was developed based on published literature, pharmaceutical claims, and primary research with stakeholders. It focuses on antidepressants and antipsychotics as general classes of pharmacotherapy, with emphasis on agents introduced to the US market after 1988. Chapters III -- V rely primarily on published literature and primary interviews. Chapter VI relies on Medicaid pharmaceutical claims, while Chapter VII relies on published literature. A description of each type of source follows.
Published Literature
Several individual searches of the databases MEDLINE and HEALTHSTAR were conducted in August 1999. All searches were limited to human subjects and English language. Cost studies were restricted to studies conducted in the United States, unless no studies for that agent were available. In this case, selected studies conducted in Europe or Canada were included. Relevant articles identified through the literature search were obtained and reviewed. Subsequent to this review, we collected additional literature cited in the reference section of the review articles. The formal literature review was supplemented by studies maintained in-house by our expert mental health services staff. Because the first of the pharmaceuticals of interest to this study was introduced in 1988 (fluoxetine, i.e., Prozac®), the literature searches were restricted to articles published from 1988.
These literature searches had several goals:
- Identify articles that describe the prevalence and impact of major depression and schizophrenia in the US
- Identify published articles that describe the impact of barriers on access to and utilization of new pharmaceutical agents
- Identify articles that compare the effectiveness of newer pharmacotherapies to older ones and seek to establish appropriate treatment criteria. The survey focused primarily on real-world effectiveness studies, in order to capture the extent to which the newer medications are associated with improved treatment compliance and the potential to offset costs related to subsequent delay or prevention of psychiatric relapse, recurrence of illness, or re-hospitalization.
- Identify articles that evaluate the cost-effectiveness of newer antidepressant and antipsychotic medications. This literature search encompassed cost-effectiveness across all areas of service delivery with particular emphasis on the often-competing interests of various cost centers.
In addition, The Lewin Group obtained and reviewed both formulary policies and clinical practice guidelines of selected health plans, insurance programs, public health care delivery systems, and managed care organizations. Strict guidelines were followed to preserve anonymity and confidentiality in order to protect the proprietary interests of the organizations involved.
Medicaid Drug Rebate Data
Quarterly, state level data on prescription drug utilization are available from the Health Care Financing Administration(now known as Centers for Medicare and Medicaid Services(CMS)) (HCFA(now known as CMS)). These data are reported at the National Drug Code (NDC) level, allowing analysis of utilization of individual pharmaceutical agents within the Medicaid system. While these data are representative of the US Medicaid population, state-level analyses are difficult in some States due to missing data. The completeness of the data is also compromised in States where Medicaid Managed Care has assigned the responsibility for paying for pharmaceuticals to the participating managed care organizations.
Although there are limitations in the data, The Lewin Group conducted time-series analysis of antidepressant and antipsychotic drug utilization data between 1985 and 1998 for 45 States. Data from six States were excluded for the following reasons:
- Arizona and Tennessee do not report Medicaid drug utilization data at all;
- Texas has not reported since the second quarter of 1995;
- Colorado has not reported since the fourth quarter of 1996;
- Data from Indiana appears very erratic;
- 1995 and 1996 data from Wyoming appear to be off by a factor of 10; and
- Connecticut did not report data for 1998.
Expert Interviews
The Lewin Group identified a set of key topics and issues that affect access to and utilization of antidepressant and antipsychotic medications that were not adequately discussed in the literature. These topics included, but were not restricted to:
- Inclusion or exclusion of specific medications from the approved formulary lists;
- Pre-Authorization requirements for specific medications;
- Choice of preferred or first-line medications and the reasons for these choices;
- Generic or therapeutic substitution practices;
- Restrictions or variations in prescriber credentialling;
- Coordination of benefits between inpatient and outpatient services;
- Policies requiring patients to accept medication as a condition for psychotherapy, or otherwise restricting access to psychotherapy; and
- Allowances for provider and patient choice in medications.
The interview guides and survey instruments developed for this data collection are included in Appendix A. Exhibit I-3 presents the respondent organizations interviewed for this study. A fuller discussion of rationale for choosing each respondent is presented in Appendix B. A full list of all respondents is included in Appendix C.
Exhibit I-3. List of Key Informants
| Key Informants | Number of Site Visits | Number of Telephone Interviews |
|---|---|---|
| Pharmaceutical companies | 3 | 2 |
| Managed behavioral health care companies | 1 | 2 |
| Large health maintenance organizations | 2 | 3 |
| Pharmacy Benefit Managers | 5 | |
| Employers | 3 | |
| Federal Programs | 2 | |
| State Medicaid Programs | 4 | |
| Department of Defense | 1 | 1 |
| Veterans Administration | 1 | 1 |
| State Mental Health Systems | 4 | |
| Provider Associations | 2 | |
| Consumer and Advocacy Associations | 2 | |
| Totals | 12 | 25 |
E. Organization of the Report
Following this introduction, Chapter II summarizes the principal findings of the study. Chapter III provides a detailed discussion of the distinctions between the concepts of "access" and "utilization" that underlie the entire report. Chapters IV and V detail the findings of the primary research interviews investigating the state of access to and utilization of newer antidepressant and antipsychotic medications during the term of this study (1998-1999). Chapter VI presents an analysis of Medicaid pharmaceutical claims designed to establish patterns of antidepressant and antipsychotic utilization by state Medicaid programs between 1995 and 1998. In addition this chapter compares utilization of these psychotherapeutics with the utilization of other classes of medications to gain insight into whether the uptake of newer psychotherapeutics by Medicaid is slower than for other classes. Chapter VII reviews the pharmacoeconomic literature for antidepressant and antipsychotic medications. Finally Chapter VIII highlights areas for further research and identifies key trends and potential issues that may raise policy concerns in the future.
Chapter II. Principal Findings
As discussed in the introduction, the present study was guided by three principal questions about the status of pharmaceutical benefits for psychotherapeutic medications. We consider each of these questions in turn.
What are the formal policies and procedures implemented by health care payers that affect consumer access to and utilization of psychiatric medications? Are these policies and procedures different for psychiatric medications than for other medication classes?
The present research indicates that psychotherapeutics are covered on an equal basis with pharmaceuticals of other classes. No evidence of selective application of more restrictive utilization controls, prior authorization requirements, or restrictive formularies was found. These problems appear to have existed in the past, but the policies have been changed in recent years. A few health care payers require that a psychiatrist prescribe psychotherapeutic drugs. Usually this restriction, where it exists, applies only to antipsychotic medications.
How does the implementation of these policies and procedures affect access to and utilization of these medications?
The assertion that access to newer psychotherapeutics is impeded by the implementation of managed care policies and procedures is difficult to substantiate. The evidence from analysis of pharmaceutical claims suggests that, as a group, new generation antidepressant and antipsychotics have diffused into common use at approximately the same rate as have new generation pharmaceuticals in other classes.
However, few healthcare payers have implemented programs to pro-actively facilitate the diagnosis and treatment of mental illness. Fewer still have attempted to measure the outcomes of mental health interventions. The modest programs to support these goals may suggest that the implementation of policies and procedures acts to inhibit access to and utilization of psychotherapeutic medications by consumers who would benefit from them in a more general way. This problem is not specific to the utilization of pharmaceuticals, but reflects a general need for more efforts in providing mental health services.
Do policies, procedures, and modes of implementation (regardless of whether they differ for mental health) create barriers to adequate mental health care even if similar policies, procedures, and modes of implementation do not create similar barriers for adequate care for other conditions?
The concerns of consumers, advocates, and providers suggests that the barriers that are in place to regulate utilization of medications of all classes may be too burdensome for mental health consumers and their providers to navigate effectively. Consumers requiring mental health care may have greater difficulty than some others in asserting their needs and entitlements within complex administrative systems. However, it is possible that a number of other consumer populations with long-term, debilitating conditions would find utilization controls imposed by health care payers difficult to navigate as well. However, the degree to which the mental health services system is burdensome to its consumers has not been compared in any systematic way to the burden imposed by physical health systems on patients with other long-term debilitating conditions.
The impact of pharmaceutical utilization controls or cost-sharing requirements on mental health consumers who may have concurrent physical illnesses is likely to be more severe than it is for consumers without mental illnesses. Mental health consumers are more likely to exceed quantity limits and incur higher dollar amounts in cost-sharing than are other consumers for this reason. This may force the consumer or provider to make a choice between filling a prescription to treat the physical illness and filling a prescription to treat the mental illness. This problem is compounded because providers of mental and physical health services may not be fully aware of all concurrent medications the patient requires. The lack of coordinated care increases the potential for adverse drug interactions, even as it may increase the complexity of how to coordinate care to assure that the patient receives all necessary treatments. This problem is an interesting area for possible exploration.
A. Access to Newer Antidepreseant and Antipsychotic Medications
Pharmaceutical Benefits
Pharmaceutical benefits are commonly available for psychotherapeutic agents.
- Most health care payers interviewed covered pharmaceuticals to at least some degree.
- Employers offer pharmaceutical benefits as part of comprehensive health insurance. Employers work with carriers to design benefits, but rarely become involved in the details of individual drug coverage.
- Behavioral Health Managed Care Organizations rarely become involved with the administration of pharmaceutical benefits and therefore exercise only limited influence over these.
- Psychiatric medications are usually covered as part of the general pharmaceutical benefit; rarely are these carved out from the general benefit.
- Pharmaceutical benefits are financed by a mix of capitated and fee-for-service arrangements, although fee-for-service appears to be regaining popularity.
- Although consumer advocacy organizations claim that psychotherapeutics are covered at a lower level than other medications, this research found no evidence to support this claim at the administrative level.
Limits on prescription coverage and cost sharing requirements apply equally to all classes of medications.
- Consumer associations and pharmaceutical manufacturers contend that psychotherapeutics often are subject to higher copayments or lower total cost caps than are other classes of drugs.
- Our research has not validated this concern.
- Copayments required for branded drugs are universally higher than those required for generics. Therefore copayments required for new generation psychotherapeutics are usually higher than those required for generic medications of any class.
- None of the Medicaid programs interviewed require different cost sharing for psychiatric drugs compared to other drug classes.
- Copayment requirements differ only by whether the drug dispensed is a branded drug or a generic drug.
- Currently, 12 State Medicaid programs (Arkansas, California, Florida, Georgia, Mississippi, Nevada, New York, North Carolina, Oklahoma, Texas, West Virginia, Wyoming) limit the number of prescriptions per patient per month.
- All but two States (Indiana and Iowa) place limits on the number of refills per prescription or the quantity that can be dispensed at any one time.
- Within the private sector, limits and cost-sharing requirements are applied equally to all drug classes.
- None of the private insurers interviewed restrict the number of prescriptions reimbursed per recipient.
- Individual plans may have annual limits on the dollar amount reimbursed. This limit applies to all pharmaceuticals and is not selectively supplied to psychotherapeutics.
- None of the private insurers demand higher copayments for psychotherapeutic agents than they do for other drug classes.
- Most plans require a higher copayment for branded drugs than they do for generics.
- Several plans are moving to "three tiered copay" whereby different copayments are required for generics, drugs designated by the payer as "preferred brands", and drugs designated "non-preferred brands." The designation "preferred" and "non-preferred" is one made by the health care payer and reflects a complex (and usually proprietary) assessment of issues including efficacy, safety, therapeutic duplication, use and abuse potential, cost, and cost-effectiveness. Within several plans examined, new generation psychotherapeutics do not appear to be forced wholesale into the "non-preferred" group. Rather, the preferred group usually includes a selection of several new generation antidepressants (typically 3 or 4) and antipsychotics (typically at least 2), with the balance of the group being placed in the third tier.
- None of the private insurers interviewed restrict the number of prescriptions reimbursed per recipient.
- State programs were unaware of any problems with continuity of care between treatment settings.
- State programs were unaware of any systematic differences between the pharmacy benefit coverage between Medicaid and State Mental Health programs.
- These often work off the same formulary and route purchases through the same channels.
- The DoD and VA reported no systematic problems insuring the continuity of care between inpatient and outpatient settings.
- The VA has established procedures to insure a patient is managed consistently when discharged from an inpatient setting.
- Private payers uniformly report that access to psychotherapeutic agents is no different between inpatient or outpatient settings.
- Most MCOs make allowances for a new enrollee to continue treatment on non-formulary drugs started while insured by another payer.
- The issue of prescriber credentialling largely applies to antidepressants.
- Many payers are concerned about inappropriate use of antidepressants for purposes other than the treatment of depression. Restrictions on the prescription of these agents by primary care physicians are designed to avoid misuse.
- Most providers and payers agree that prescription of antipsychotics by primary care physicians is not medically appropriate.
Formularies
Manufacturers, providers and consumers concur that formularies are no longer restricting access to newer psychotherapeutic agents
- Closed formularies are maintained by 8 State Medicaid programs (California, Colorado, Hawaii, Illinois, Michigan, Montana, Ohio, and South Dakota). All HCFA(now known as CMS)-approved drugs are covered if Prior Authorization (PA) is obtained.
- Only California appears to severely restrict the choice of pharmaceutical agents available without PA.
- None of the State Mental Health Systems interviewed for this study exclude any of the newer antidepressant or antipsychotic medications from coverage.
- Formularies were used by over 75% of HMOs in 1997, up from less than 50% in 1990. At the same time, physicians appear to have increasing influence over the choice of medications included on the formulary.
- Employers do not generally get involved with the specifics of formulary management. Most of the employers interviewed stated that they had open formularies.
- The formularies of the New York State prison system and the Navajo Region of the Indian Health Service are closed. These programs most aggressively pursue switching of patients from non-formulary to formulary drugs.
The concept of "open, closed, or restricted" formulary is changing in meaning and is not an accurate depiction of access.
- In 1997, 33% of plans used formularies described as "closed."
- Often, closed formularies allow non-formulary drugs to be reimbursed if prior authorization is obtained.
- Closed formularies are being replaced by "preferred" drug lists, whereby physicians are encouraged, but not required, to prescribe a particular drug.
- In 1997, 52% of plans used formularies described as "selective" or "partially closed."
Plans with closed formularies may take active steps to enforce the formulary. These may include:
- Physician profiling;
- Claim lockouts;
- Withholding physician bonuses; and
- Imposing financial penalties.
Effectiveness and cost are the most frequently cited barriers to formulary approval. The relative importance of each of these factors depends on the class of drugs and particular interest of an individual health plan.
- Any drug for which the manufacturer has entered into a rebate agreement with HCFA(now known as CMS) is eligible for inclusion on Medicaid formularies.
- There are only 10 exceptions, mostly barbiturates and benzodiazepines.
- Medi-Cal, on the other hand, has a more complex method of approving drugs for formulary inclusion. These criteria were published in a journal article describing the information needs for this purpose.6 In addition, Medi-Cal makes available its criteria for formulary review.
- Private health care payers maintain pharmacy and therapeutics committees that review formularies on a regular basis. These committees are made up of physicians, pharmacists, and administrators.
- Employers do not maintain their own P&T committees, but work with their MCOs and PBMs to design a formulary suitable to their needs.
Newer antidepressant and antipsychotic medications have attained formulary status in most of the programs surveyed in this study.
- Most payers cover at least two of the four SSRIs approved in the US for the treatment of depression (fluoxetine, paroxetine, citalopram, sertraline), and at least one other new antidepressant (venlafaxine, nefazadone, bupropion).
- Most payers cover at least one of the new-generation antipsychotics.
- The private sector has embraced the newer agents, although formularies appear to be more actively managed than in the public sector
- The formulary status of the newer antidepressant and antipsychotic agents is consistent with the pattern observed for other classes of branded pharmaceutical agents.
Prior Authorization
Provider and consumer associations interviewed report that prior authorization and paperwork requirements are now the primary barrier to access.
- These groups contend that prior authorization is required more for mental health pharmaceuticals than other drugs.
- These groups also contend that paperwork requirements to obtain PA are unduly burdensome.
- The present research suggests that PA is becoming increasingly automated and that this trend is adding efficiency to the process.
Antipsychotics no longer require prior authorization as a matter of policy. However there are some restrictions at the facility (community) level. PA may be more common for antidepressants.
- State Medicaid programs may require PA only when therapeutic "equivalents" exist.
- HCFA(now known as CMS) has the authority to monitor and regulate the process of obtaining PA and determine whether processes are unduly burdensome.
- Prior Authorization for antipsychotics is relatively rare within the private sector.
- PA is implemented at the request of the client to the company administering pharmaceutical benefits.
- PA is required no more frequently for psychotherapeutics than it is for other classes of pharmaceuticals
- The trend in private insurance appears to be towards open formularies with more active management of "lifestyle" drugs (e.g., drugs for migraine, erectile dysfunction) via utilization controls.
Step Care
Traditional step care protocols, whereby patients are required to try an older generation agent prior to obtaining approval for reimbursement of a newer one, have largely disappeared.
Currently, it is more common for payers to designate one or two preferred pharmaceuticals chosen from the newer agents. Patients must first experience a treatment failure on a preferred agent prior to being reimbursed for a non-preferred agent.
- These practices may contribute to the perception that access is too cumbersome.
- These practices may require switching among pharmaceutical agents within a given class (e.g., SSRIs).
B. Utilization of Antidepressant and Antipsychotic Medications
Treatment Guidelines and Preferred Medications
HCFA(now known as CMS) does not instruct States on the choice of appropriate medications for use in specific illnesses. However, HCFA(now known as CMS) did request that States make atypical antipsychotics available for first-line treatment of schizophrenia if requested by physicians.
State Medicaid and State Mental Health programs have not widely adopted treatment guidelines for depression or schizophrenia. This situation has begun to change somewhat with the advent of Medicaid Managed Care.
- The Texas Medication Algorithm Project algorithms for schizophrenia, depression, and bipolar disorder are the outstanding examples of explicit protocols for the management of the mentally ill within public systems.
There is no consensus on the best first line agents for the treatment of schizophrenia or depression among private payers.
- Treatment guidelines within private sector payers are only beginning to appear for depression. Schizophrenia is not a primary concern in the private sector.
- Several PBMs are developing treatment guidelines that recommend the use of new generation agents first-line, together with guidelines for dosing. These guidelines do not endorse one agent over another.
- Employers do not generally concern themselves with the selection of preferred or covered pharmaceutical agents. Likewise, they do not develop or adopt treatment guidelines or disease algorithms for depression, bipolar disorder or obsessive-compulsive disorder.
- However, health benefits consultants report that they generally encourage employers to cover the most up-to-date pharmacotherapies for mental illness.
- Most BHMCOs are not involved in the writing of clinical practice guidelines for the treatment of mental illnesses.
Clinical Development and Marketing
Manufacturers express no bias against developing a new drug for mental health indications in comparison with physical health indications.
- However, because many persons with mental illness have public health insurance, patient recruitment and retention in trials can be a greater challenge for behavioral health than for physical health drugs.
The MCOs and PBMs interviewed reported that traditional clinical trials are of relatively short duration and measure outcomes using instruments not readily translatable into regular clinical practice, such as standardized psychiatric rating scales.
Manufacturers devote considerable effort to marketing psychotherapeutics to physicians and patients, although tactics vary. The extent to which marketing efforts affect sales success has not been quantified.
Although it is generally assumed that manufacturer contracts and rebates may affect drug utilization, no data exists to support this idea, largely because such data are considered trade secrets.
Utilization Management
All of the payers interviewed maintain some form of drug utilization review (DUR) program.
- Most payers use DUR as an educational tool to encourage good prescribing practices.
- Several payers use DUR as a monitoring tool to enforce compliance with formulary, PA and treatment guidelines.
Monitoring of psychotropic medications occurs no differently than for other classes of pharmaceuticals and tracks duplication, overuse, under-use and possible drug interactions.
Provider and Patient Compliance
-
Programs that monitor patients for compliance with therapy or providers for compliance with treatment guidelines are in their infancy.
- Provider compliance is a greater priority within the private sector than the public sector.
- Provider compliance programs generally do not operate in traditional Medicaid programs. Any willing provider (AWP) legislation generally excludes the possibility of provider credentialling.
- State Mental Health programs do not monitor their providers for compliance with treatment or prescribing guidelines on a statewide basis. These programs often are implemented at the level of the individual hospital or community mental health center.
- The DoD and the VA are more aggressive in monitoring provider practice patterns. Both routinely review provider records to monitor for compliance with formularies, evaluate dosing patterns, and monitor inappropriate use of medications at the treatment facility level.
- Although most payers interviewed use formularies and treatment guidelines primarily as educational tools, several do enforce compliance. Both incentives and disincentives are used to encourage provider compliance, although these practices appear to be less common than many fear.
- Many plans are beginning to implement comprehensive disease management programs that include a provider component.
- PBMs generally do not enforce physician compliance with treatment guidelines or disease management programs, but encourage compliance through education and notification.
- Maintaining patient confidentiality often precludes adequate data collection and monitoring on a case-specific basis.
- Employers monitor providers for compliance with guidelines via concurrent or retrospective DUR. Furthermore, employers may partner with their PBMs or HMOs to conduct provider education.
- Patient compliance and disease management programs appear to be more common in the private sector than the public sector. Compliance or disease management programs are less common for schizophrenia than they are for depression.
- Patient confidentiality remains a barrier to the effective implementation of disease management programs. This is especially true in the public sector
- Manufacturers focus on physician compliance rather than patient compliance due to concerns for patient confidentiality and greater ease of tracking physicians.
- Patient compliance and disease management programs have not necessarily proven financially beneficial to manufacturers.
- PBMs, MCOs and employers are beginning to implement case management programs for depression and to a lesser degree, schizophrenia, even though case management is often delegated to behavioral health carve-outs.
- Programs that focus on screening and diagnosis are more common than those that actually focus on case management.
- Employer-sponsored programs designed to assist patients in recognition and treatment of mental illness are not as common as physician-targeted programs.
- Employers expressed reluctance to implement these programs due to patient confidentiality, the difficulty of data acquisition and the difficulty of demonstrating value of these programs.
- Employee assistance programs (EAPs) play a primary role in the detection of mental illness, acting as triage networks and referral mechanisms.
- Once employees are undergoing treatment for mental illness, BHO carve-outs may provide generic case management.
- PBMs are reluctant to operate patient compliance programs due to confidentiality concerns. However, one PBM offers compliance assistance for antidepressants and will survey physicians for effectiveness.
- Provider compliance is a greater priority within the private sector than the public sector.
The patient-targeted programs that do exist do not generally take into account cultural differences in populations that may affect the success of these programs.
The management of patients who become severely mentally ill is not uniform across service sectors. There are few special programs for these patients.
C. Utilization of Newer Antidepressant and Antipsychotic Medications by State Medicaid Programs 1995-1998
New generation antipsychotics and antidepressants have been accepted into common use within Medicaid programs.
- In 1998, 51% of the 11 million Medicaid antipsychotic prescriptions were for atypicals.
- In contrast, atypicals accounted for 17.5% of 9.1 million Medicaid antipsychotic prescriptions in 1995.
- In 1998, 62% of the 19 million Medicaid antidepressant prescriptions were for new-generation, branded antidepressants.
- In contrast, new generation antidepressants accounted for 44% of 13.6 million Medicaid antidepressant prescriptions in 1995.
The introduction of atypical antipsychotics and new-generation antidepressants has been accompanied by a growth in the total market for antipsychotics and antidepressants in Medicaid.
- The growth in both number of prescriptions for and cost of antidepressants and antipsychotics outpaces that of the aggregate by more than 2-fold.
Antidepressants and antipsychotics account for nearly 9% of Medicaid pharmaceutical prescriptions and nearly 19% of Medicaid pharmaceutical reimbursements.
- Although the number of all prescriptions (i.e., from any therapeutic category) reimbursed by Medicaid has remained relatively constant between 1995 and 1998, expenditures have increased by over 40%.
- Prescriptions for antipsychotics grew 11% between 1995 and 1998 while expenditures increased by more than 160%.
- Total Medicaid spending on antipsychotics exceeded $1.3 billion in 1998.
- Uptake of atypical antipsychotics is driving pharmacy costs for this class.
- Prescriptions for antidepressants grew 40% between 1995 and 1998 while expenditures increased by approximately 96%.
- Total Medicaid spending on antidepressants reached $985 million in 1998.
- Increased numbers of prescriptions together with uptake of new-generation antidepressants is driving pharmacy costs for this class.
New-generation antidepressants and antipsychotics have been accepted into common use by Medicaid programs at about the same rate and to the same extent as other innovator drugs.
Utilization of Antipsychotics
In 1998, 51% of all Medicaid prescriptions for antipsychotics were for atypical antipsychotics. Expenditures on atypicals accounted for 89% of total spending on antipsychotics.
- In 1998, Medicaid programs in 45 States analyzed paid for nearly 11 million prescriptions for antipsychotics.
- Phenothiazines accounted for the largest share of antipsychotic prescriptions, with approximately 3.0 million prescriptions, or a 26% share.
- Risperidone ranked second in number of prescriptions (2.8 million, 25%).
- Olanzapine ranked third in number of prescriptions (2.2 million, 20%).
- These 11 million prescriptions corresponded to expenditures of $1.3 billion.
- Olanzapine accounted for the largest share of spending for antipsychotics at $536 million (42%).
- Risperidone ranked second at $395 million (31%).
- Clozapine accounted for the third largest share of expenditures, $172 million (14%).
The use of atypical antipsychotics in Medicaid has grown dramatically since 1995. Concomitantly, the use of antipsychotics as a class has grown by 20% since 1995.
- Medicaid antipsychotic prescriptions rose from 9.2 million in 1995 to 11 million in 1998, an increase of nearly 20%.
- It appears that the introduction of atypical antipsychotics did not merely replace older therapies, but instead expanded the market for use of these agents as a category.
- Medicaid prescriptions for risperidone increased from just over 1 million in 1995 (12% of total) to nearly 2.8 million in 1997 (25% of total).
- Medicaid prescriptions for olanzapine have risen from 43,000 prescriptions in 1996 (0.5%) to over 2.1 million prescriptions in 1998 (20%).
- Prescriptions for oral haloperidol decreased from 2.1 million in 1995 (23%) to 1.6 million in 1998 (18%).
- Prescriptions for phenothiazines decreased from 4.2 million in 1995 (47%) to just under 3 million in 1998 (27%).
- This trend of increasing numbers of antipsychotic prescriptions may indicate that more patients are willing to use the newer agents.
- This trend may also reflect increased use in the management of other diseases, such as the behavioral disturbances associated with dementia.
- It appears that the introduction of atypical antipsychotics did not merely replace older therapies, but instead expanded the market for use of these agents as a category.
Expenditures on antipsychotics have vastly outpaced the growth in number of prescriptions.
- Total Medicaid prescriptions for antipsychotics increased from 9.2 million in 1995 to nearly 11 million in 1998, an increase of 20%.
- Total expenditures increased from $484 million in 1995 to $1.3 billion in 1998, an overall increase of 160%.
In several high-volume States (FL, IL, MA, MD, MI, PA) risperidone has become the most frequently prescribed class of antipsychotic, outpacing the national averages.
The uptake of newer antipsychotic agents into Medicaid immediately post-launch has been rapid.
- From launch in the 4th quarter of 1996, olanzapine gained 8% market share within four full quarters of marketing.
- At the end of the second full year on the market, olanzapine attained a market share of 16%.
- The number of olanzapine prescriptions more than doubled in the second year on the market.
- From the time of the launch of olanzapine, risperidone market share increased from 17% to 22%
- During this same period the number of risperidone prescriptions increased nearly 50%.
- The uptake of quetiapine has been slow relative to olanzapine.
- This difference may largely be attributed to market timing and marketing savvy.
Utilization of Antidepressants
In 1998, 62% of antidepressant prescriptions were for new-generation, branded antidepressants.
- Medicaid programs in 45 States paid for over 19 million prescriptions for antidepressants.
- The selective serotonin reuptake inhibitors (SSRIs) comprised 48% of total antidepressant prescriptions in 1998.
- Prescriptions for the three leading agents (fluoxetine, paroxetine, and sertraline) were nearly equal with approximately 3 million prescriptions each, or a 15-16% share each.
- Tricyclic antidepressants accounted for 27% of total prescriptions
- The four other new generation antidepressants (bupropion, mirtazapine, nefazadone, and venlafaxine) together accounted for 14% of prescriptions.
- The selective serotonin reuptake inhibitors (SSRIs) comprised 48% of total antidepressant prescriptions in 1998.
- In 1998, Medicaid expenditures on antidepressants in these 45 States reached nearly 1 billion dollars ($985 million).
- Together, fluoxetine, sertraline and paroxetine comprised over 70% of all Medicaid spending on antidepressant drugs in 1998 ($711 million).
- Fluoxetine accounted for 30% ($288 million) of all Medicaid spending for antidepressants in 1998.
- Spending for sertraline reached only $214 million (23% of all Medicaid dollars reimbursed for antidepressants in 1998).
- Dollars spent on paroxetine comprised only $199 million (20% of all Medicaid dollars spent on antidepressants in 1998).
- TCAs accounted for only 5% of all Medicaid dollars reimbursed for antidepressants ($54 million).
- Other new antidepressants bupropion, venlafaxine, nefazadone, and mirtazapine together accounted for expenditures of approximately $173 million or 18% of total expenditures.
- Together, fluoxetine, sertraline and paroxetine comprised over 70% of all Medicaid spending on antidepressant drugs in 1998 ($711 million).
The use of new-generation antidepressants in Medicaid grew dramatically between 1995 and 1998. As with antipsychotics, the growth in use of newer antidepressants rapidly outpaced the replacement of older agents.
- Prescriptions for antidepressants increased from 13.7 million in 1995 to 19.3 million in 1998, an increase of over 40%.
- Sertraline prescriptions increased from just over 2 million in 1995 to just over 3 million in 1998.
- Fluoxetine prescriptions increased from just over 2 million in 1995 to just fewer than 3 million in 1998.
- Paroxetine prescriptions increased from 1.2 million in 1995 to 2.9 million in 1998, an increase of 130%.
- Prescriptions for TCAs fell from 6 million prescriptions in 1995 to 5 million in 1998 -- a 20% decrease.
Medicaid expenditures for antidepressants outpaced the rate of growth in number of prescriptions between 1995 and 1998.
- Total expenditures increased from $500 million in 1995 to $985 million in 1998--an average increase of 25% per year, and an overall increase of 96%.
- Much of this increase can be attributed to the steady, yet significant rise of the three leading SSRI antidepressants.
- Expenditures for paroxetine increased nearly three-fold (an increase of $128 million over four years.
- Expenditures for fluoxetine increased 73% ($120 million).
- Expenditures for sertraline increased 64% ($84 million).
- Expenditures for TCAs fell from $77 million in 1995 to $54 million in 1998.
- Much of this increase can be attributed to the steady, yet significant rise of the three leading SSRI antidepressants.
Comparison of Psychotherapeutic Utilization with Utilization of Other Drug Classes
New-generation antidepressants and antipsychotics have been accepted into common use by Medicaid programs at about the same rate and to the same extent as other innovator drugs.
- Newer antipsychotics appear to be proportionally more expensive than other new generation pharmaceuticals such as oral antidiabetics. Newer antidepressants appear to be roughly equivalent in cost to these other classes.
D. Cost-Effectiveness of Newer Antidepressant and Antipsychotic Medications
Cost-Effectiveness of Newer Antidepressants
Published cost-effectiveness literature shows no clear differences in total treatment costs associated with the use of different antidepressant agents, although individual studies have claimed that one particular agent is superior to another.
- In numerous studies, researchers failed to find a difference in cost or effectiveness between treatment groups.
- Several individual studies have found that treatment with newer agents is cost-saving compared to treatment with older agents
- A few other studies have found that treatment with newer agents is cost-saving compared to treatment with older agent.
- Modest evidence suggests that SSRIs are more cost-effective than TCAs.
- The evidence for the cost-effectiveness of other new-generation agents such as venlafaxine and nefazadone is less convincing, but suggests similar cost-effectiveness to SSRIs.
The clearest result from these studies is that patient compliance with the newer antidepressants is considerably better than with TCAs. For this reason, the newer antidepressants may be more cost-effective than the older antidepressants.
These studies indicate that reliance on older generation antidepressants as preferred therapy is unlikely to realize any cost-savings if total health-systems costs are to be included. As a result the exclusion of new generation antidepressants on cost grounds cannot be justified.
Cost-Effectiveness of Newer Antipsychotics
Evidence from the pharmacoeconomic literature shows that treatment using the new antipsychotics exhibits economic advantages over treatment using the older antipsychotics. This evidence for olanzapine and clozapine is superior to the corresponding evidence for risperidone.
The results of numerous studies together provide strong evidence of clozapine's superior cost-effectiveness relative to older, typical antipsychotics in treatment resistant schizophrenia.
The paucity of well-designed studies precludes drawing any conclusions regarding relative pharmacoeconomic differences among atypical antipsychotics.
Chapter III. Defining Access and Utilization
The United States Department of Health and Human Services charged The Lewin Group with the task of elucidating the mechanisms that affect the extent to which Americans receive the most up-to-date pharmacotherapies for the treatment of mental illness. In examining this problem, we determined that this question is made up of two separate components that work together to affect whether a particular drug is used widely in the health care system. These two components may be described as Access and Utilization. Access refers to structural issues (e.g. coverage and benefit) within the health care benefit system that determine whether a health care service is available for use. Utilization is a more subjective concept and reflects the degree to which services that are available are actually used by the consumer. In turn, each of these components is influenced by several factors.
A. Defining Access
Simply stated, "Access" to a particular health care service may be defined as the set of factors that affect the potential ability of an individual or a group to acquire timely and appropriate use of that service. Traditionally, access to health care services has been limited by race, gender, age, and class.7 These factors cannot be controlled by the design of the health care system. Health care payers have more direct control over access via the design of their benefit programs. Among these, four principal factors affect access to pharmaceuticals. These include:
- Pharmaceutical benefit characteristics (e.g., coverage, cost sharing, coverage policies);
- Formularies;
- Prior authorization requirements; and
- Step care protocols.
Under step care programs, physicians are required to attempt to treat a patient with a designated first-line drug and document treatment failure or patient intolerance prior to using another "reserved" agent. In general it is thought that the designated first-line drug is an older, often cheaper, and perhaps less effective drug than the reserved drug. Alternatively, patients may be required to try a new-generation, formulary drug before being given reimbursement for another non-formulary, new-generation drug. Step care programs are similar to prior authorization programs in that they often serve to control prescribing practices.
Pharmaceutical Benefit Design
Benefit design is the primary mechanism that influences access to newer pharmaceuticals. Some health plans do not cover pharmaceutical benefits at all (e.g., Medicare), while others place restrictions on the number of prescriptions a given beneficiary may receive each month (e.g., several State Medicaid programs). Furthermore, coordination of benefits between inpatient and outpatient, access to specialty psychiatric care, and payment responsibility represent three ways in which benefit design can affect access. Based on our review of the literature and on previous research, we identified the following issues as factors that primarily impact benefit design:
- Coverage of pharmaceuticals;
- Financing methods;
- Limits on the number of prescriptions reimbursed per month and whether these are different for psychiatric drugs than for other drug classes;
- Cost sharing requirements for pharmaceuticals and whether these are different for psychiatric drugs than for other drug classes;
- Continuity of care between inpatient and outpatient settings;
- Coordination of benefits among different payers;
- Access to specialty psychiatric care; and
- Prescriber credentialling.
Formularies
The most basic drug formulary is a descriptive list of medications available in a given health care setting. Early formularies were lists of all medications available in a hospital pharmacy. Eventually, some formularies began to limit the availability of unlisted agents, thereby serving a regulatory function. These "restrictive" formularies have been adopted by many health care payers as a method of containing costs by restricting access to expensive medications.
The use of formularies to control costs has been questioned on both scientific and policy grounds. Levy and Cocks extensively reviewed the literature on the effects of restrictive formularies on overall health care costs.8 The authors conclude that although drug costs decreased in categories where restrictions were imposed (16 of 27 published case studies), the predominant effect of these restrictions was to shift costs by increasing utilization of either non-restricted drugs or other health care services (13 of 16 studies). The authors conclude that none of the studies clearly showed an association between drug restrictions and reduced costs in other health service categories.
In a 1992 study, Moore and Newman found that while implementation of a restricted formulary could reduce a State's Medicaid drug expenditures, these savings are more than offset by spending increases caused by service substitution elsewhere in the system. This study included estimates for effects on spending for mental health services specifically, although particular pharmaceuticals were not mentioned.9
Horn and co-workers found that restricted formularies tended to increase utilization of other health care resources for patients with diagnoses of arthritis, asthma, epigastric pain/ulcer, hypertension, and otitis media.10,11 Because this study has encountered stringent criticism for methodological flaws, these results should be interpreted with caution.12
More recently, Streja and coworkers compared the outcomes of patients from an HMO in California that designated a single "preferred" SSRI agent (paroxetine) with the outcomes of patients enrolled in an HMO that designated two agents as preferred (paroxetine, fluoxetine). Patients were treated by the same group of 22 board-certified primary care physicians. These researchers found that patients from the HMO with a single preferred SSRI were 80% less likely to complete therapy than were patients from the HMO that had 2 preferred agents. Although differences in completion rates varied with the choice of first-line agent (paroxetine, fluoxetine, or sertraline), the formulary effect was independent of the initial drug used to treat the patient. This study is the first of its kind to show a direct impact of a limited formulary including newer antidepressants on outcomes, independent of the agent chosen for therapy.13
Prior Authorization
Prior authorization (PA) is a gatekeeping mechanism put in place in some health care programs whereby a patient or provider must obtain special approval prior to the dispensing of a particular set of drugs. Individuals within the health care payer organization approve or deny a particular prescription request based on a defined set of criteria. PA requirements have been criticized for creating a physician "hassle factor," that is to say, the documentation required to get a PA drug approved is too burdensome for most physicians to be willing to pursue.
The rationale for using PA is based on several assumptions. These may include:
- No clinically important efficacy or effectiveness differences exist between two agents of a given class. Therefore, it is only necessary to reimburse one of these agents on a routine basis.
- Clinically important safety differences exist between two agents of a given class. Therefore, it is necessary to require special permission to dispense a particular drug to insure consumer protection.
The agents designated for prior authorization have the potential for abuse by either providers or patients. Therefore it is necessary to restrict access to these agents and document clinical necessity prior to dispensing.
-
The agents designated for prior authorization are more expensive than other alternatives, while their increased benefit is less clear. Because lowering pharmaceutical expenditures is a valid endpoint in its own right or directly correlates with overall medical cost savings, dispensing of the more expensive agent should require special permission.
Step Care Protocols
Under step care programs, physicians are required to attempt to treat a patient with a designated first-line drug and document treatment failure or patient intolerance prior to using another "reserved" agent. In general it is thought that the designated first-line drug is an older, often cheaper, and perhaps less effective drug than the reserved drug. Alternatively, patients may be required to try a new-generation, formulary drug before being given reimbursement for another non-formulary, new-generation drug. Step care programs are similar to prior authorization programs in that they often serve to control prescribing practices.
B. Defining Utilization
Utilization is defined as the use of a health care service, procedure, device, or pharmaceutical. Utilization is influenced by access, although the actual utilization of a given pharmaceutical may not reach the maximum level expected given a specified level of "access." Utilization can be recorded in a number of ways: per capita, hospital length of stay, physician office visits, or number prescriptions. With regard to utilization of pharmaceuticals, four principal factors affect utilization:
- Physician Habits and Treatment Guidelines;
- Pharmaceutical Marketing;
- Utilization Review; and
- Patient Compliance and Disease Management.
Physician Habits and Treatment Guidelines
Ultimately, a pharmaceutical agent can only be used as often as physicians are willing to prescribe it. Therefore, physician preferences, perceptions, and prescribing habits play a significant role in determining the extent to which a new technology is utilized in the health care system. Factors that influence physician preference, perceptions, and prescribing habits include awareness of newer agents, the length of time an agent as been on the market, the clinical profile of the agents, and the physician's education or treatment philosophy.
Physicians may be influenced somewhat by the publication of treatment guidelines. These may either come from a nationally recognized expert source, such as the American Psychiatric Association, or may be produced in-house by a health plan. These guidelines may play a role in influencing physician-prescribing decisions to a greater or lesser degree.
Clinical Development and Pharmaceutical Marketing
Perhaps the most fundamental driver of pharmaceutical utilization is the clinical trial history of a particular drug. A pharmaceutical is approved for use by the FDA for a particular indication based on the clinical trials submitted by the manufacturer. The labeling therefore reflects only the evidence presented by the manufacturer in the filing. A drug may be effective in many more indications than that for which it is approved for marketing by the FDA. Examples include fluvoxamine, an SSRI approved for marketing in the US only for the treatment of Obsessive-Compulsive Disorder, although it is widely used as an antidepressant in Europe. Similarly, atypical antipsychotics are used with some frequency for the treatment of bipolar disorder and the treatment of behavioral disturbances in dementia patients, even though these medications are only approved for use in schizophrenia and related illnesses. Health care payers are therefore often placed in a difficult situation: is it proper to reimburse a drug used to treat an indication for which it is not approved, even if such use is commonplace?
Post-approval, pharmaceutical marketing plays an important role in influencing physician and consumer awareness of current therapies. This influence comes partially through physician education: pharmaceutical representatives distribute literature (approved by the FDA) documenting the appropriate use and efficacy of the agents they represent. In addition, the industry sponsors numerous physician education symposia and programs that qualify for continuing medical education (CME) credit either at a local level or at national meetings. Furthermore, marketing to physicians often involves the distribution of pharmaceutical samples, the availability of which may have an influence on which agent within a particular class of similar drugs is chosen by the physician for an individual patient. In 1997, the pharmaceutical industry spent approximately $7.0 billion on marketing (i.e. "detailing") to health care professionals.14 In addition to direct detailing of health care professionals, the pharmaceutical industry places advertisements in clinical and trade journals to promote products. Recently, antidepressants have led other classes of drugs in spending for journal-based advertising. In 1999, citalopram, the antidepressant co-marketed by Forest and Parke-Davis, was the most-advertised product in this class, followed closely by Eli Lilly's fluoxetine.15
In recent years, Direct-to-Consumer (DTC) marketing has become more prevalent. The 10 drugs most heavily advertised to consumers in 1998 accounted for $9.3 billion (or approximately 22%) of the total increase in drug spending between 1993 and 1998.16 During the first 10 months of 1998, pharmaceutical companies spent $1.1 billion on DTC ads, compared with $1.0 billion in 1997. The only psychotherapeutic entering the top five drugs in DTC spending was Glaxo Wellcome's Zyban, a version of bupropion approved as a smoking-cessation aid, that totaled $5.7 million in advertising expenditures.17
Utilization Review
Utilization management and review (DUR) are programs utilized by many payers to promote patient safety and manage costs by an increased review and awareness of outpatient prescribed drugs. The theory behind utilization review is that more careful scrutiny of drug prescribing and dispensing patterns should help avoid unfavorable drug-drug interactions, drug-disease interactions, therapeutic duplication and over-prescribing by providers. DUR programs may be administered either prospectively or retrospectively. As a result of OBRA 1990, States were encouraged by enhanced federal funding to design and install point-of-sale electronic claims management systems that interface with their information systems operations to facilitate review of pharmaceutical utilization in real-time.
Several studies have shown that PRODUR programs have had a positive effect on patient safety, provider prescribing habits and dollars saved. For example, a GAO report examined the PRODUR systems of five States (Maryland, Missouri, New Mexico, Oregon, Pennsylvania) to evaluate their effect on patient safety and cost savings. During a 12-month period, the systems alerted pharmacists to over 6 million prescriptions that had the potential causing unfavorable medical events due to drug-drug interactions, overutilization, and pregnancy. Approximately 10% of these alerts resulted in canceling prescriptions due to possible risks to patients. These cancellations resulted in savings of over $5 million to these five States.18
Patient Compliance and Disease Management
Faced with rising health care costs and limited resources health care providers seek new ways to provide high-quality, cost-efficient care, especially for patients with chronic illnesses such as depression and schizophrenia. Several years ago, disease management emerged as a promising innovation with the potential to achieve this goal. The Boston Consulting Group first used the phrase "disease management" in its current sense in a 1993 report. Since that time, disease management techniques have been adopted and applied in a variety of delivery settings in the private sector and in Medicaid primary care case management.
Disease management is a term used to define various systematic, integrated approaches to the complete management of a disease state. In contrast to the compartmentalized delivery of health care that has traditionally been the norm in the United States, disease management uses a patient-centered approach to provide all components of care, and focuses on both quality and total cost. This approach includes coordination of physician care (e.g., primary care, specialty care) with pharmaceutical care and institutional care as well as various components of a disease state (e.g., co-morbidities of diabetes mellitus such as hyperlipidemia and renal disease). In addition to emphasizing continuity of care and a multidisciplinary approach, disease management also promotes patient empowerment through health education and encourages compliance with successful treatment programs, including medication.
Although formal disease management programs appear to be more common for physical illnesses such as diabetes and asthma, the utility of these programs in the treatment of severe mental illnesses such as depression and schizophrenia should not be overlooked.
Chapter IV. The Current State of Access to Newer Antidepressant and Antipsychotic Medications
Newer antidepressant and antipsychotic medications were much more readily available to health care consumers in 1999 than they were when first introduced. Primary research indicated few cases where newer agents were either not reimbursed or older agents were designated as preferred first-line agents. Notably, many respondents indicated that the removal of restrictions (e.g., demonstrating failure first on conventional therapy) was a relatively recent policy change. In this section, we report on the status of access as assessed in our research.
In summary, this study found:
Health care payers almost always cover psychotherapeutics as part of a general pharmaceutical benefit. As such, most health care payers provide coverage for psychotherapeutics on an equal basis with other drug classes and do not apply special restrictions to antidepressants or antipsychotics as general classes. Specifically, psychotherapeutics as a class are not generally:
- Financed separately from the general pharmaceutical benefit;
- Subject to lower maximum benefit levels, higher levels of cost sharing, or more restrictive number of prescriptions;
- Covered so differently between treatment settings or payers that continuity of care is compromised; or
- Subject to rigid prescriber credentialling processes.
New generation antidepressants and antipsychotics are widely included on health plan formularies. Few formularies completely exclude newer psychotherapeutics. However, not all formularies include every new generation antidepressant and antipsychotic agent.
- Most formularies include at least three new generation antidepressants and at least one new generation antipsychotic.
- Informants surveyed indicated that psychotherapeutics are not subject to more rigorous formulary review than are other classes of drugs. These is some evidence that psychotherapeutics are evaluated less stringently.
- The inclusion of new-generation antidepressants and antipsychotics on many health plan formularies is a relatively recent change from previous policy.
Prior authorization is a more common utilization control than is formulary exclusion.
- Antipsychotics are largely free of prior authorization requirements at the policy level. These requirements may be imposed at the local level.
- Prior authorization is more frequently required for antidepressants because
- These agents have a higher potential for misuse; and
- These agents are used by a much larger section of the population and therefore represent more important targets for utilization control.
Step care protocols whereby treatment failure on generic agents is required before a patient is allowed access to new generation agents appear to be largely in the past.
Each of these issues is discussed in further detail below.
A. Benefit Design
Coverage of Pharmaceuticals and Financing Arrangements
Most health care payers interviewed covered pharmaceuticals to at least some degree. We found only one case where psychiatric medications are covered as a benefit separate from the general pharmaceutical benefit. Financing represents a mix of fee-for-service and capitation arrangements, although it appears that payers are abandoning capitation and risk-sharing in a return to fee-for-service financing.
Two out of the four consumer and provider associations interviewed (NAMI, AAFP) reported that differences in the coverage of behavioral health and other (e.g., physical health) pharmaceuticals were more common in the private sector than in the public sector. The most commonly cited reason for this difference was that managed care plans have more restricted access. In this study, we did not observe that psychotherapeutics are being singled out for special restrictions or exclusions because they are psychotherapeutics. Payers who place restrictions on pharmaceutical benefits do not generally discriminate among drug classes.
- Public Programs
Of the four Medicaid programs (California, Georgia, Texas, Wisconsin) and the four State Mental Health System programs (Arizona, Maryland, Massachusetts, and Ohio) interviewed, seven manage their pharmacy programs internally. The Massachusetts State Mental Health System contracts with a third party vendor to manage its program. Seven of the eight States interviewed (Wisconsin is the exception) reported that their pharmacy benefit is generally integrated with other benefits and financed through a mix of capitation and/or fee-for-service arrangements. Exhibit IV-1 outlines the reimbursement mechanisms for each state's pharmacy benefit.
Exhibit IV-1. Reimbursement Mechanisms for Pharmacy Benefit under Medicaid and State Mental Health System Programs
| Method | Medicaid | SMHS |
|---|---|---|
| Fee-for-service | California Georgia Texas Wisconsin |
Maryland (for psychiatric drugs through Public Mental Health System)
Ohio (outpatient settings) |
| Capitated | Wisconsin | Arizona Maryland (for drugs provided under managed care) |
| Global Budget | N/A | Massachusetts Ohio (inpatient settings) |
The DoD has carved out its pharmacy benefit within Tri-Care to Pharmaceutical Benefit Managers (PBMs) through the various TriCare managed care plans. Patients are instructed to first use an Military Treatment Facility (MTF). MTF's generally have limited formularies. If the MTF is not available or if the required drug is not available on the formulary, patients then order the drug from the PBM. If the drug is ordered through the PBM, the patient is responsible for a higher level of cost-sharing. The PBM program is administered on a fee-for-service basis. The VA internally manages the pharmacy benefit from within the global VA budget, fully integrating it with other benefits.
- Private Payers
Private health care payers reported a variety of methods to finance and manage pharmaceutical benefits. MCOs sometimes finance pharmaceuticals through capitation, although this arrangement varies to meet the needs of their customers (e.g., employers, Medicare, and Medicaid). It appears that MCOs are increasingly moving towards financing pharmaceuticals on a fee-for-service basis. In addition, several HMOs continue to operate risk-sharing arrangements for pharmaceuticals with their physicians.
Most HMOs interviewed manage the pharmacy benefit internally. A few carve it out. Again this arrangement varies by plan and by the client being served. Even in cases where the benefit is managed internally, the HMO may contract the services of a PBM to process claims or provide other services. In almost all cases, psychotherapeutics are covered under the same pharmacy benefit as that for physical health. It is unclear whether the financing arrangement has any direct correlation with the comprehensiveness of formulary offerings.
PBMs generally finance pharmaceutical benefits on a fee-for-service basis for both their MCO and employer clients. However, PBMs occasionally enter into risk sharing or capitation arrangements. PBMs generally manage pharmaceutical benefits for all outpatient pharmaceutical classes, including psychotherapeutics. However, long-acting injectable formulations of antipsychotics, may be covered under the behavioral or physical health benefit because these are usually administered in a provider's office, clinic, or hospital. The covered lives serviced by a PBM include all persons who obtain some or all pharmacy benefit services through the PBM. The services provided by a PBM to its MCO and employer clients may include mail service, claims processing, and/or formulary and utilization management. Some MCOs or employer clients use a PBM only to provide one or two of these services, while others utilize the complete spectrum of services.
Employers may finance pharmaceutical benefits either through full capitation through their MCO carriers or on a fee-for-service basis. In the latter case, employers will often work with a PBM to provide pharmaceutical benefits. Although employers work with their carriers to design benefits, they rarely become intimately involved with the details of coverage.
Behavioral Health Managed Care Organizations (BMHCOs) prefer not to cover pharmaceuticals. BMHCOs prefer instead to leave the pharmacy benefit integrated with the general pharmacy benefit. In a few cases (e.g. Arizona's State behavioral health managed care program) the BMHCO manages the pharmacy benefits for behavioral health directly. In Arizona, this benefit is financed on a capitated basis.
- Special Populations
Both the New York State prison system and Indian Health Service report financing pharmacy benefits out of their global budget. This method is generally similar to fee-for-service.
Limits on Prescription Coverage and Cost Sharing Requirements
Consumer associations and pharmaceutical manufacturers report that psychotherapeutics often are subject to higher copayments or lower total cost caps than are other classes of drugs. Our research has not validated this concern. It is clear that the copayments required for branded drugs are universally higher than those required for generics, but this differential applies to all branded drugs, regardless of indication.
- Public Programs
No differences in cost sharing between psychiatric drugs and other drug classes exist in any of the Medicaid programs interviewed. Differences do exist between the copays required for branded and generic drugs. Co-payment requirements within Medicaid pharmacy benefit programs are regulated by Federal statute. In 1997, 17 States required no co-payment for prescription benefits, whereas co-payments ranged between $0.50 and $3.00 in the remaining programs. Co-payments for pharmacy benefits within Medicaid managed care programs are regulated by the waiver operating in that State and vary from plan to plan.19
Currently, 12 State Medicaid programs (Arkansas, California, Florida, Georgia, Mississippi, Nevada, New York, North Carolina, Oklahoma, Texas, West Virginia, Wyoming) limit the number of prescriptions per patient per month, while all but two States (Indiana and Iowa) place limits on the number of refills per prescription or the quantity that can be dispensed at any one time. Restrictions on the number of prescriptions range from 10 per year (West Virginia) to 6 per month (several States). States that impose limits most commonly limit recipients to either 3 or 6 prescriptions per month.19 These prescription limitations apply regardless of therapeutic class. Several States interviewed recognized that these limitations can pose problems for patients with other illnesses requiring frequent prescriptions, and indicated that often these restrictions can be worked around by "staggering" the filling of different prescriptions from month to month. For example, Wisconsin limits recipients to three prescriptions per month. However, maintenance medications can be dispensed in 90-day supplies. In contrast, none of the State Mental Health programs reported any limitations on the number of prescriptions that could be dispensed to any one beneficiary in a given month.
The DoD and the VA do not require co-payment for prescriptions if the prescription is dispensed from a DoD or VA facility pharmacy. If the prescription is dispensed at a non-DoD or VA pharmacy, a nominal co-payment is required, ranging between $2 and $9. The level of copayment is set based on whether the drug is a branded or a generic drug. Drug class does not affect copayment.
- Private Payers
None of the private insurers interviewed reported restricting the number of prescriptions reimbursed per recipient. However, individual plans may have annual limits on the dollar amount reimbursed. This limit applies to all pharmaceuticals and is not selectively applied to psychotherapeutics. Similarly, private sector insurers do not demand higher copayments for psychotherapeutic agents than they do for other drug classes. Most plans require a higher copayment for branded drugs than they do for generics. Therefore, because the newer psychotherapeutic agents do not have generic equivalents available, there mayappear to be a difference between the copayment required for these newer psychotherapeutics than is required for many "physical health" drugs.
The "three tiered copay" is a new method of cost sharing being introduced by many health care payers. These arrangements are causing increasing concern among both consumers and pharmaceutical manufacturers. Whereas "classical" copayment systems require a higher copayment for a branded products than for generic ones (e.g., $10 brand, $5 generic), these new copay systems create 3 groups: generic, "preferred brand," and "non-preferred brand." The designation of "preferred" and "non-preferred" is not simply a statement of superior drug efficacy. Rather, drugs are grouped into these categories based on a complex decision made by the MCO that considers a range of issues including efficacy, safety, therapeutic duplication, use and abuse potential, cost and cost-effectiveness. The specific rationale for placing any specific drug in one of these tiers is generally regarded as a trade secret. The ability of the MCO to negotiate contracts with pharmaceutical manufacturers likely plays a role in this process, although no MCO or manufacturer was willing to discuss this issue.
Under one proposed system for Blue Choice (Rochester, NY area), copayments for generics would range between $2 and $10, preferred brands between $12 and $25, and non-preferred brands between $30 and $40. These copayment levels reflect a marked change from the previous "nominal" copayments. In most of these three-tiered systems, individual new generation antidepressants and antipsychotics appear in both the "preferred" and "non-preferred" categories. Although, many of the newer psychotherapeutics are classified as "non-preferred," there does not appear to be any "singling out" of psychotherapeutics as a class for higher copayments. Indeed, several popular antibiotics, antihistamines, statins, and calcium channel blockers are placed in the non-preferred class.20
- Special Populations
Neither the New York State corrections system nor the Indian Health Service requires cost sharing of its recipients.
Continuity of Care and Coordination of Benefits
Consumer associations expressed concern that patients were forced to change medications when the transitioning between treatment settings (e.g., inpatient to outpatient) because of formulary restrictions, or when transferring among payers. These associations were also concerned that the agents used in inpatient settings were chosen more for cost reasons than out of concern for appropriate care. Provider associations indicated that it was common to change a patient's medication when the patient is admitted to inpatient treatment, largely because the admission likely indicates that current therapy is not working. Respondents from the pharmaceutical industry indicated that coordination between inpatient and outpatient care was a problem in the past, but that this issue has resolved with increasing access to newer agents.
The choice of psychotherapeutic agent in an inpatient setting likely plays a role in the ultimate treatment choice for many, but certainly not all, patients with mental illnesses. Individual hospitals will have internal formularies that are not subject to the allowances or restrictions of health care payers. Therefore, it is quite possible that the agent used to stabilize a patient after a hospital admission will not be on the formulary of the patient's health care payer when discharged. Payers have differing ways of approaching these scenarios, although in most they did not perceive the issue to be much of a problem. This disconnect between perceptions of consumers and providers and those of payers suggests a need for more extensive follow-up research, public education, or payer training on these issues.
- Public Programs
State programs were unaware of any problems with continuity of care between treatment settings. This is likely because most State programs have open formularies (see next section). Likewise, State programs were unaware of any systematic differences between the pharmacy benefit coverage between Medicaid and State Mental Health programs, as these often work off the same formulary and route purchases through the same channels. In two States (AZ, MD) Medicaid has assigned authority for behavioral health services to a single state agency for mental health, leading to nearly seamless coordination between the two programs. State Mental Health programs more actively coordinate pharmaceuticals between inpatient and outpatient than do Medicaid programs.
Similarly, the DoD and VA reported no issues with continuity of care between inpatient and outpatient settings. In fact, the VA requires that outpatient clinics follow treatment protocols established for the patient during hospitalization. In order to assure continuity, the VA requires that a VA physician be consulted prior to a patient's refilling a prescription in an outpatient clinic after release from an inpatient setting.
- Private Payers
Private payers uniformly report that coverage for psychotherapeutic agents is no different between inpatient or outpatient settings. One MCO specifically reported explicit allowances for patients to continue taking non-formulary drugs upon discharge from the hospital. However, hospital formularies may dictate the choice of drugs available to the patient in an inpatient setting, independent of the insurer's formulary. Hospital formularies are usually hospital-specific and health care payers do not generally have any direct say in their composition.
- Special Populations
The Indian Health Service reports no difference between its inpatient and outpatient formularies. Therefore, if patients are treated within IHS inpatient hospitals or day treatment facilities, they will have no coordination issues. However, inpatient psychiatric admissions are contracted to other facilities. In these cases, the IHS will attempt to switch patients from non-formulary drugs started in hospitals to agents of similar class when they transition to the outpatient setting.
Access to Specialty Care and Prescriber Credentialling
Consumer associations report that prescriber credentialling can act as a serious barrier to access to newer psychotherapeutics. Interviews with key informants for this study indicate that there are several cases where health care payers require that a psychiatrist write the prescription for a designated medication. However, these requirements are not widespread and operate almost exclusively in the private sector.
The issue of prescriber credentialling largely applies to antidepressants. Most providers and payers agree that prescription of antipsychotics by primary care physicians (PCPs) is not medically appropriate. Many payers are concerned about inappropriate use of antidepressants for purposes other than the treatment of depression (e.g., weight loss, work performance improvement), and therefore may impose restrictions on the prescription of these agents by PCPs in an effort to prevent this.
- Public Programs
None of the Medicaid or State Mental Health programs interviewed require that a psychiatrist prescribe antidepressants or antipsychotics. The DoD and VA reported that either a primary care physician or psychiatrist can prescribe antidepressants or antipsychotics. DoD did report that some medical treatment facilities restrict prescribing priviledges to psychiatrists. However, this practice is highly discouraged by DoD.
- Private Payers
Private sector insurers indicated a range of prescriber credentialling ranging from moderate restrictions to none. For example, one MCO interviewed requires primary care physicians to obtain psychiatrist approval for prescription for selected antidepressants. At this MCO, these agents include bupropion, venlafaxine, nefazadone, mirtazapine, and monoamine oxidase inhibitors. PCPs may prescribe any TCA or SSRI of their choice without obtaining this approval. Psychiatrists in this MCO have free choice of any psychotherapeutic included on the formulary.
Similarly, one of three PBMs interviewed reported that any outpatient drug prescribed by a psychiatrist is covered without question. However, this PBM requires prior authorization (PA) for all psychotherapeutic prescriptions from PCPs. Other PBMs require no prescriber credentialling.
Although most employers do not become intimately involved with the details of prescribing, Motorola has adopted a more activist approach to meet employee needs and insure quality. In 1995, Motorola embarked on a partnership with Private Healthcare Systems (PHCS) to create a customized network of providers within the Motorola benefits system. To date it has identified approximately 100,000 physicians, 900 hospitals, and 4,000 mental health care providers nationwide who are permitted to prescribe without obtaining special authorization. Employees may nominate new providers on an ongoing basis. After a trial period these providers can achieve the same status as other providers.
- Special Populations
In the New York State prison system, the prison staff psychiatrist or primary care physician manages mental health service delivery. This management includes pharmaceuticals. There are no restrictions on who can prescribe specific prescription drugs.
The Navaho region of the Indian Health Service reported that up until one year ago, only psychiatrists were allowed to prescribe SSRIs. This restriction has been removed. However, the IHS still requires that a psychiatrist prescribe antipsychotic medications.
B. Formularies
The four provider and consumer associations interviewed reported that formularies are no longer impeding access to newer psychotherapeutics. All four associations have witnessed a diffusion of new drugs, namely the newer generation antidepressants and antipsychotics, in the market.
The manufacturers interviewed concurred, reporting that formulary access either under fee-for-service arrangements or in hospital settings was a problem of the past. Manufacturers believed psychotropics to be regarded differently than physical drugs, both favorably and unfavorably. Specifically, an informant from one manufacturer thought formulary approval was easier or faster for psychotropics due to high visibility and publicity of extreme cases and political pressure (e.g., from consumer and advocacy groups). Manufacturers approach to formulary access appears to be advocating broad class coverage, even as they work to achieve "preferred" status for their own product where possible by demonstrating superior effectiveness or cost-effectiveness.
The concept of "open, closed, or restricted" formulary is changing in meaning. A closed formulary generally means that non-formulary medications will not be reimbursed. Often, however, closed formularies allow non-formulary drugs to be reimbursed if prior authorization is obtained. A 1997 survey indicated that only 19% of closed formularies did not allow physicians to override formulary restrictions.21,22,23 However, plans with closed formularies may also impose monetary penalties on physicians who routinely prescribe non-formulary medications.
The use of "preferred" drug lists, whereby physicians are encouraged, but not required, to prescribe a particular drug is also growing, and may be replacing the traditional formulary. In 1995, 70% of HMOs maintained preferred pharmaceutical lists, while 83% did so in 1998. Often patients receiving a non-preferred drug are required to pay a higher co-payment (39.1% of plans in 1995, 71.7% of plans in 1998).24
Formulary status and approach to management
Public Programs
According to Health Care Financing Administration(now known as Centers for Medicare and Medicaid Services(CMS)) (HCFA(now known as CMS)) formularies should not generally affect access in State Medicaid programs. Currently, only ten drugs are not approved for reimbursement by HCFA(now known as CMS). These are mainly barbiturates and benzodiazepines. Formulary acceptance is the same for all classes of drugs. In other words, HCFA(now known as CMS) does not apply a different set of criteria required for reimbursement approval to one drug class as opposed to another. HCFA(now known as CMS) monitors state formularies through utilization review.
Occasionally, HCFA(now known as CMS) has taken a pro-active approach toward influencing State Medicaid formularies and policies regarding coverage of particular prescription drugs. For example, a recent letter from HCFA(now known as CMS) to all State Medicaid Directors has urged the inclusion of atypical antipsychotics on Medicaid formularies.25
While the Omnibus Budget Reconciliation Act of 1990 (OBRA 1990) abolished the rights of States to maintain closed formularies for Medicaid, States with previously restricted formularies continued to make fewer drugs available than other States.26 Because many States incurred large increases in costs as a result of this provision in OBRA 1990, States were allowed once again to restrict formularies in 1993. Currently, closed formularies are maintained in 8 States (California, Colorado, Hawaii, Illinois, Michigan, Montana, Ohio, South Dakota). A closed formulary does not necessarily indicate relative restrictiveness.27 For example, Kentucky maintains an open formulary, but includes less than 50% of all FDA-approved drugs in its formulary. Most of the excluded drugs are generics with multiple manufacturers. Our interviews reveal that only Medi-Cal excludes any of the newer antidepressant and antipsychotic drugs. None of the State Mental Health Systems interviewed for this study exclude the newer antidepressant and antipsychotic medications from coverage. Neither State Mental Health systems nor Medicaid programs are required to use therapeutic substitution; however, Medicaid programs are required by HCFA(now known as CMS) to use generic substitution.
The DoD includes all FDA-approved drugs on the formulary for its managed care programs (i.e., TriCare). The formulary in place at the military treatment facilities is closed but providers can prescribe off formulary with prior authorization. TriCare also operates a mail order program via Merck-Medco that uses a preferred drug list that includes a limited number of newer antidepressants and atypical antipsychotics. Additions to the formulary are based on consumer need and cost.
The Veteran's Administration (VA), like DoD, has a closed formulary but allows off formulary prescriptions pending prior authorization. Pharmaceutical additions to the formulary are based on effectiveness, safety, and experience in the VA system.
Private Payers
Formularies are used by over 75% of HMOs, up from less than 50% in 1990 although leveling off from 1993. The trend appears to be toward closing formularies: in 1997, 33% of HMO formularies were classified as "closed" (up from 28% in 1996) and an additional 52% were described at "selective" or "partially closed" (up from 39% in 1996).21,22,28 However, within this trend toward more stringent formularies, physicians appear to have increasing influence over the choice of medications included.24,29
The managed care organizations (MCOs) interviewed for this study varied in their formulary status from open to restricted to closed. Formularies often vary by customer type or customer preference. For example, an MCO may offer several formulary options ranging from completely open to somewhat restricted to very restricted. The choice of formulary is then left to the discretion of the purchaser, such an employer, group, or individual. Larger employers and groups are more likely to choose a more expensive option such as an open formulary. Smaller or extremely cost-sensitive sensitive employers may opt for restricted formulary that is available at a lower cost. Often, the options available to individuals will also include a more restricted formulary. Furthermore, individual clients groups may further restrict or expand the "national formulary" of their providing MCO. MCOs enforce formulary compliance in a variety of ways: physician profiling, claim lockouts, and physician bonuses. MCOs reported difficulty in tracking formulary compliance for mental health drugs due to mis-coding or non-coding of mental illnesses (e.g., depression) at the time of claim submission.
Drug switching reportedly occurs less frequently with mental health pharmaceuticals than with other drug classes. The MCOs interviewed, with one exception, do not endorse active switching; more commonly, MCOs request that the dispensing pharmacist consult with the prescribing physician to discuss alternatives prior to dispensing a non-formulary drug. This latter practice is referred to as "outbound calling." The MCOs interviewed were unwilling to discuss their rationale for targeting specific drugs for outbound calling. However, it is likely that the most frequently targeted drugs are chosen on the basis of high abuse or misuse potential, high volume utilization, safety concerns, or cost.
Employers do not generally get involved with the specifics of formulary management. Most of the employers interviewed stated that they had open formularies. Most employers interviewed reported using the formulary recommended by the MCO or PBM administering their pharmacy benefit. However, one employer reported working with its PBM to expand the options on formulary. Employers leave formulary compliance in the hands of the managed care organizations or pharmacy benefit managers.
Special Populations
The formulary in the New York State prison system is closed, as is that used by the Navajo Region of the IHS. In general, formulary overrides are not permitted, and these payers routinely substitute a formulary drug of the same class for a non-formulary drug, even if that means switching a patient's medication. The New York State prison system reported continuing to encourage the use of generic antidepressants and antipsychotics due to budgetary constraints.
Factors influencing the formulary decision
-
The formulary decision-making process ranges from a relatively simple administrative process to a complex review of the efficacy and economics of a therapeutic class, depending on the payer type and the individual benefit package.
The pharmaceutical manufacturers interviewed indicated that several factors impede the pace of formulary review. The most frequently cited barriers to formulary approval included effectiveness and cost. The relative importance of each of these factors depends on the class of drugs and particular interest of an individual health plan. One manufacturer indicated that for a therapeutic area with no clearly effective options, such as Alzheimer's Disease, any new drug that shows efficacy would be approved almost immediately. This is not the case in a crowded therapeutic area such as depression where none of the new agents have been demonstrated to be clearly superior to any of the others.
- Public Programs
In Medicaid, any drug for which the manufacturer has entered into a rebate agreement with HCFA(now known as CMS) is eligible for inclusion on Medicaid formularies. There are only 10 exceptions, mostly barbiturates and benzodiazepines. Most States have open formularies and immediately reimburse any agent approved for reimbursement by HCFA(now known as CMS) on the basis of a rebate agreement.
Medi-Cal, on the other hand, has a more complex method of approving drugs for formulary inclusion. Medi-Cal revises its formulary either when it elects to undertake a complete therapeutic class review, or when a pharmaceutical manufacturer petitions for addition to the formulary between review cycles. Medi-Cal conducted a complete review of the antidepressant therapeutic class in mid 1990s with assistance from Eli Lilly. These criteria were published in a journal article describing the information needs for this purpose.6 In addition, Medi-Cal makes available its criteria for formulary review.
The DoD maintains a Pharmaceutical and Therapeutics (P&T) Committee comprised of 13 members, which meets quarterly. P&T Committees also exist in individual Military Treatment Facilities (MTFs). These must meet at least quarterly to consider new drugs; most meet once per month. New drugs are added to the formulary based on efficacy, side effects, and cost of the particular drug. Consumer need also influences the decision-making process.
The VA convenes a Medical Advisory Panel (MAP) monthly via telephone phone basis to discuss new pharmaceuticals. The MAP also convenes in person every quarter. Furthermore, the 22 Veterans Integrated Service Networks (VISNs) maintain individual formulary committees to review new drugs. Effectiveness, safety, and experience in the VA system are the primary factors upon which the formulary decision-making process is based. New drugs can be added at any time and the criteria for evaluating antidepressants and antipsychotics does not differ from those applied to other drug classes.
- Private Payers
In the private sector, health care payers maintain pharmacy and therapeutics committees that review formularies on a regular basis. These committees are made up of physicians, pharmacists, and administrators. The physician group may or may not include a psychiatrist. In general other mental health professionals are not included on P&T committees. Employers do not maintain their own P&T committees, but work with their MCOs and PBMs to design a formulary suitable to their needs. One employer reported that it was more likely for his company to want to expand a PBM's "national formulary" than shrink it.
The private payers interviewed differed on the most important pieces of information necessary to make formulary decisions. Employers, PBMs and MCOs all ranked safety and efficacy first. However, they differed on the relative importance of cost and choice. Summary rankings are shown in Exhibit IV-2 below.
- Public Programs
Exhibit IV-2. Relative Importance of Issues Affecting Formulary Decisions
| Issue | PBM Rank | MCO Rank | Employer Rank |
|---|---|---|---|
| Safety | 1 | 2 | 1 |
| Effectiveness | 2 | 1 | 2 |
| Cost | 3 | 5 | 3 |
| Cost-Effectiveness | 4 | 6 | 5 |
| Avoid Duplication | 5 | 4 | 6 |
| Consumer And Provider Choice | 6 | 3 | 4 |
MCOs and PBMs often work together in designing formularies. Formal reviews of the literature are the most common method for determining drug suitability for formulary inclusion. However, these payers may revise their formularies in the response to provider requests. These payers indicated that it is unlikely that psychotherapeutics receive either faster or slower review than other therapeutic classes. Expedited review is utilized only when the product is approved by the FDA and designated as first-in-class innovator drugs. This designation indicates that the drug represents a marked change or improvement in therapeutic strategy.
The Formulary Status of Newer Antidepressant and Antipsychotic Medications
-
Newer antidepressant and antipsychotic medications have attained formulary status in most of the programs surveyed in this study. Although most payers provide for the coverage of at least several of the newer agents first-line, not all payers cover every newer agent without prior authorization.
The present survey shows that most payers cover at least two of the four SSRIs approved in the US for the treatment of depression (fluoxetine, paroxetine, citalopram, sertraline), and at least one other new antidepressant (venlafaxine, nefazadone, bupropion). Coverage of fluvoxamine and mirtazapine appears to be the most scant. The approval of bupropion for the treatment of smoking cessation appears to have increased the frequency of requiring prior authorization for the dispensing of this drug. Likewise, the new-generation antipsychotics (risperidone, olanzapine, quetiapine) have also achieved formulary status.
- Public Programs
Among Medicaid programs interviewed for this study, only California maintains a restricted formulary. Medi-Cal conducted a therapeutic class review of antidepressants in the mid-1990s. This review resulted in the addition of fluoxetine and paroxetine to the Medi-Cal formulary in 1996. At the same time drugs fluvoxamine, bupropion, and nefazadone were added to the formulary. The antipsychotics risperidone, olanzapine, and quetiapine were also added via petition between 1996 and 1998.
The four State Mental Health agencies interviewed all reported open formularies. Only mirtazapine and citalopram were reported as exclusions. Citalopram was approved in the 4th quarter of 1998, and therefore is likely too new to have achieved widespread formulary acceptance. The reasons for the exclusion of mirtazapine are less clear, although the lack of a clear advocacy for its inclusion cannot help its uptake.
The CHAMPUS program of the Department of Defense maintains a system wide formulary that represents the minimal set of pharmaceuticals covered for treatment within military treatment facilities (MTFs). The national formulary is generally somewhat more limited in scope than those that may be in used in individual MTFs. For example, the national formulary includes a limited selection of newer antidepressants and antipsychotics on its formulary. TCAs and haloperidol are specifically included on the national formulary. In addition, each individual military treatment facility (MTF) must include at least one SSRI on its own formulary. Although these formularies are technically closed, providers can prescribe off formulary with prior authorization. The DoD has made the addition of at least one SSRI to the national formulary a priority.
The Veteran's Administration (VA) includes one SSRI (citalopram) and one atypical antipsychotic (quetiapine) on formulary. Off-formulary prescriptions are allowed, however, pending prior authorization.
- Private Payers
The private sector has embraced the newer agents, although formularies appear to be more actively managed than in the public sector. A review of over forty managed care formularies (in addition to those MCOs interviewed for this study) found no managed care plans or PBMs who did not include at least two of the newer antidepressants on their formulary. However, few plans includedevery newer agent. Results of the survey for antidepressants are shown in Exhibit IV-3 below.
Exhibit IV-3. Formulary Status of Antidepressants in 41 Managed Care Plans
Agent Reimbursed without Qualification PA Required Not Reimbursed Higher Copay Required Total Fluoxetine 27 8 4 2 41 Paroxetine 37 2 2 41 Sertraline 28 9 3 1 41 Venlafaxine 31 8 1 1 41 Bupropion 33 7 1 41 Nefazadone 37 4 41 As can be seen in Exhibit IV-3, paroxetine (N=37) and nefazadone (N=37) are the drugs most frequently included on formulary in these 41 plans, followed by bupropion (N=33), venlafaxine (N=31), and sertraline (N=31). Fluoxetine is the drug most frequently not reimbursed (N=4), followed by sertraline, paroxetine, and venlafaxine. Again, it should be stated that in none of the formularies reviewed are newer antidepressants excluded outright. Rather, at least two SSRIs are reimbursed, together with at least one or more of the other newer agents.
Formulary coverage of newer antipsychotics is even more widespread than is that of newer antidepressants. Exhibit IV-4 shows the results of the survey of 41 health plans for antipsychotics.
Exhibit IV-4. Formulary Status of Antipsychotics in 41 Managed Care Plans
Agent Reimbursed without Qualification PA Required Not Reimbursed Higher Copay Required Total Risperidone 34 5 1 1 41 Olanzapine 32 5 2 2 41 Quetiapine 20 6 12 3 41 Clozapine 26 12 1 2 41 As shown in Exhibit IV-5, risperidone is refused reimbursement by only one plan, olanzapine by only two plans, and clozapine by only one plan. In a small minority of cases, these agents are reimbursed but require higher copayments as non-formulary drugs. Only 50% of plans surveyed covered quetiapine at the time of this survey. This likely represents the relatively recent approval date of quetiapine (4thquarter 1997) relative to the frequency of updating of published formularies. It may also represent a lack of demand for quetiapine. This lack of demand may reflect curiosities in the treatment of schizophrenia. Clozapine is utilized as a second or third line agent for the treatment of schizophrenia. Clinicians and plans may prefer to use the agents with which they are most familiar (i.e., risperidone and olanzapine) prior to switching to clozapine for treatment refractory patients, leaving quetiapine without a therapeutic niche.
The formulary status of the newer antidepressant and antipsychotic agents is consistent with the pattern observed for other classes of pharmaceutical agents. For example, Exhibit IV-5 shows the formulary status of the statin class of lipid lowering agents. This drug class is a useful comparator to psychotherapeutics because it represents a class of branded agents that, with few exceptions, has failed to differentiate themselves one from another. A clear exception is atorvastatin, which has been shown to be the most powerful of these agents. The statins have similar per day costs to the SSRIs. However, statins have no historical antecedents, as do the psychotherapeutics, and therefore comparison is not strictly parallel.
Exhibit IV-5. Formulary Status of Lipid Lowering Agents (HMG-co-A Reductase Inhibitors, i.e., Statins) in 40 Managed Care Plans
Agent Reimbursed without Qualification PA Required Not Reimbursed Higher Copay Required Total Fluvastatin 35 2 3 40 Atorvastatin 32 5 3 40 Pravastatin 31 5 3 1 40 Simvastatin 15 13 9 3 40 At first glance, it would appear that coverage of the statins is slightly more generous than that of the newer antidepressants. However, one would expect that a drug class with only four options would show a slightly higher rate of formulary inclusion of each agent than a drug class with over seven options.
- Public Programs
- Special Populations
The formulary for the New York State Department of Corrections is more limited with regard to antidepressants than antipsychotics. The antipsychotic formulary includes both risperidone and quetiapine, while excluding olanzapine. However, the antidepressant formulary excludes six of the newer agents: citalopram, paroxetine, bupropion, nefazadone, venlafaxine, and mirtazapine. Use of newer antidepressants and antipsychotics is discouraged because of the cost. Generics are used to the extent possible, if therapeutic efficacy remains unchanged as a result of use.
The Navajo Region of the Indian Health Service includes five of the newer antidepressants on its formulary: fluoxetine, sertraline, paroxetine, bupropion, and venlafaxine. The antipsychotics included on formulary are risperidone and olanzapine. Clozapine is not included on the IHS formulary because patients with treatment refractory schizophrenia will usually be referred to an outside provider and reimbursed on a fee-for-service basis.
C. Prior Authorization
The provider and consumer associations interviewed reported that formularies are no longer impeding access to newer medications. This view has been confirmed by the research presented above. These groups felt that prior authorization and paperwork requirements were now the primary barrier to access. The four associations interviewed reported that prior authorization is required more for mental health pharmaceuticals than other drugs. It is unclear the degree to which PA requirements are proving unduly burdensome. Our research shows that PA is becoming increasingly automated and that this trend is adding efficiency to the process.
The pharmaceutical manufacturers interviewed disagreed as to whether PA is required more or less for psychotherapeutics than for other drugs. They agreed that antipsychotics no longer require prior authorization as a matter of policy (e.g., Medicaid, VA, MCO). However there are some restrictions at the facility (community) level. PA may be more common for antidepressants. In the public sector, manufacturers attempt to overcome the budgetary reasons for PA in different ways. For example, Government Affairs departments may work with government officials to expand the overall mental health budget in order to expand access to their newer psychotherapeutics. In the private sector, manufacturers' reimbursement department may discuss drug products with CEOs of health plans to demonstrate value.
Public Programs
HCFA(now known as CMS) has no statutory or regulatory authority over States' PA programs, provided that therapeutic alternatives are available without PA. However, HCFA(now known as CMS) has some authority over process issues. For example, in response to complaints from advocacy groups on PA programs that were too active and involved cumbersome paperwork, HCFA(now known as CMS) performed a state-by-state analysis on atypical antipsychotics. HCFA(now known as CMS)'s research verified that some PA programs were indeed too active based on the criteria of "reasonable process." In response, HCFA(now known as CMS) sent a letter to States requiring a 24-hour response rate and 72-hour emergency drug supply for drugs that required prior authorization. Based on the number of complaints received by HCFA(now known as CMS), this action appears to have resolved many of the problem areas.
State Medicaid and Mental Health programs interviewed reported few drugs that required prior authorization, as would be expected for programs with open formularies. California requires PA for several non-formulary antidepressants, including citalopram, sertraline, venlafaxine, and mirtazapine. When required, any certified health care provider can request PA, and a response is obtained via fax in 24 hours. Medi-Cal reports that the system may take longer when the 20 consulting pharmacists who review PA requests are overwhelmed by request volume. All States require prior authorization for clozapine, as required by Federal law.
Within the DoD system, prior authorization programs vary by military treatment facility (MTF). On the base, primary care physicians, psychiatrists, pharmacists, physician assistants, and nurses can initiate a PA request. This request must be justified by safety and effectiveness arguments. The Pharmaceutical and Therapeutic Committee reviews PA requests. The VA requires no PA except for clozapine. A primary care physician or psychiatrist initiates all PA requests.
Private Payers
Within the private sector, the MCOs interviewed believed that PA is required less often for psychotherapeutics than for other drug classes. Based on the above review of formularies, presented above, it appears that PA for a specific antidepressant may be somewhat more common than for a specific statin, although PA for obtaining access to any newer antidepressant is not any more common. Three of the MCOs interviewed made all antidepressants and antipsychotics available without PA. One MCO interviewed required PA for venlafaxine and nefazadone. Approval of these requests required documentation of a treatment failure with a first-line agent, typically an SSRI.
The PBMs interviewed reported that prior authorization programs are rare. When they exist, they typically are designed at the request of an MCO or employer client. The PBMs interviewed indicated that PA is required for psychotherapeutics no more frequently than for other drug classes. One PBM indicated that PA was probably most common in anti-infectives, where there was a need to reserve many newer agents for treatment-resistant strains of bacteria. Some PBMs attempt to integrate PA with physician education and monitoring of appropriate care. For example, one PBM is in the process of instituting a prior authorization program for all behavioral health pharmaceuticals on the formulary if the prescription exceeds the FDA-recommended dose. Safety and efficacy were named the prime factors for justifying PA. Primacy care physicians or psychiatrists initiate such a request. Employer or MCO clients may specify additional PA approval criteria. Staff pharmacists of the PBM usually review the request with or without the consultation of a staff physician. Decisions take approximately 24 hours by phone or fax through an automated system.
The employer-sponsored health plans interviewed do not operate prior authorization programs for psychotherapeutic drugs. These employers report that they do not see the value in prior authorization. In fact, one employer eliminated their prior authorization program at their employees' request. Instead, this employer now educates physicians about cost-effective prescribing. The current trend appears to be toward open formularies, with management of "lifestyle" drugs (e.g., drugs for migraine, erectile dysfunction) via quantity limits or higher co-payments. Otherwise, employers are rarely involved in the management of the utilization of individual drugs.
Special Populations
Prior authorization does not generally operate in the New York State corrections system. Off-formulary drugs are theoretically available in the IHS via prior authorization. Any physician can make a PA request. The staff pharmacists and clinical directors at the central area office review these requests. A decision is returned in three working days, although provisions are made for emergency distribution of the requested drugs. The IHS has not implemented an automated PA system at this juncture.
D. Step Care
A principal finding of this study is the absence of traditional step care protocols, whereby patients are required to try an older generation agent prior to obtaining approval for reimbursement of a newer one. This situation represents a shift from the situation several years ago, where trial of either a tricyclic antidepressant or a typical antipsychotic was more routinely required prior to the approval of the dispensing of a new-generation agent.
It is more common, however, that providers or patients demonstrate a failure on at least one new-generation formulary drug, prior to being reimbursed for a non-formulary agent. Although this procedure does not represent full and open access to every FDA approved drug, it is consistent with open access to the newest and most-up-to-date treatment modalities.
Chapter V. The Current State of Antidepressant and Antipsychotic Utilization
Although newer antidepressant and antipsychotic medications were much more readily available to health care consumers in 1999 than they were when first introduced, health care payers have been less aggressive at promoting appropriate use than they had been at discouraging inappropriate use. Primary research indicated few cases where payers have implemented processes and procedures to insure appropriate prescribing and dosing, detection of mental illness, reimbursement, or patient compliance with care. These programs appear to be in their infancy, with many respondents indicating that their programs were relatively new. In this section, we report on the status of utilization as assessed in our research.
In summary, this study found:
Health care payers have not been active in designing treatment algorithms or comparing the effectiveness of competing agents head to head.
- The treatment algorithms that do exist largely give general guidance to the clinician and leave choice of individual agents and precise dosage to the clinician.
- Treatment algorithms are more common in closed systems such as group model HMOs and payers such as DoD or the VA.
- The paucity of specific guidance reflects the lack of consensus as to which of the newer agents is superior and for whom.
Clinical development and marketing decisions affect the utilization of any pharmaceutical agent. However the impact of marketing strategies on utilization has not been assessed in any systematic way.
Most payers use some form of utilization review mechanism to track the utilization of psychotherapeutics.
- These programs are applied to any drug class that may represent a large proportion of spending.
- The goal of these programs is to track duplication, overuse, underuse, and possible drug interactions.
Payers are more likely to monitor providers for compliance with formularies or protocols than they are to monitor consumers for compliance with therapy.
A. Treatment Guidelines and Preferred Medications
Guidelines for the treatment of schizophrenia, depression and other mental disorders have been produced by various sources. By and large, however, these have been the products of individual health plans, health service programs, or professional associations. Two sets of guidelines have come from national sources: The Agency for Health Care Policy and Research (AHCPR) has published guidelines for the treatment of depression in primary care30 as well as the findings of the Patient Outcomes Research Team (PORT) study on the treatment of Schizophrenia.31 The American Psychiatric Association produces clinical practice guidelines for a variety of mental illnesses including Major Depressive Disorder32 and Schizophrenia.33 In general, all guidelines list effectiveness, safety, patient history, and cost as important factors to consider in making treatment decisions.
National Guidelines
The AHCPR depression guidelines, published in 1993, describe a range of issues to be considered in the selection of a pharmacological therapy for depression. These guidelines specify that one of the SSRIs available at the time of publication (fluoxetine, sertraline, and paroxetine), bupropion, trazadone, or a secondary amine TCA (e.g., notriptyline, desipramine) are appropriate first-line choices for the treatment of depression. The guidelines also make specific recommendations regarding dosing of each type of agent, recognizing that TCAs are frequently underdosed. These guidelines recognize that the case for superior efficacy of any one single agent is not clear and that patient preference and physician experience should factor into the decision.
Similarly, the recommendations of the PORT focus on dosing and management of care.31 The guidelines recommend that an antipsychotic other than clozapine be used first line and that the dosing level be in the range of 300 -- 1,000 chlorpromazine equivalents per day for at least six weeks. Specifically the guidelines state
Since studies have found no superior efficacy of any antipsychotic medication over another in the treatment of positive symptoms, except for clozapine in the treatment-refractory patients, choice of the antipsychotic medication should be made on the basis of patient acceptability, prior individual drug response, individual side-effect profile, and long-term treatment planning.
Guidelines from The American Psychiatric Association for the treatment of both depression32 and schizophrenia33 are similar to guidelines discussed above. They provide general guidance to the physician on approach to treatment, but fall short of endorsing any one particular agent or class thereof. The APA depression guideline recommends that any non-MAO antidepressant is an appropriate first-line therapy for a patient with depression unless the patient presents with atypical depression or has had a prior good response to a MAO inhibitor. For patients with atypical depression either an SSRI or a MAO inhibitor is an appropriate first choice. The schizophrenia guideline recommends conventional antipsychotics and risperidone are reasonable first-line medications for patients in acute phases of schizophrenia. Although not completely reviewed at the time of publication, these guidelines recognize that olanzapine and quetiapine may fall into this category as well. The APA schizophrenia guidelines reserve clozapine for treatment-refractory schizophrenia.
Neither the NMHA nor NAMI endorse any particular treatment algorithm. The consumer associations generally believe that all drugs should be available on formulary and defer to the medical community for the choice of individual drugs for an individual patient.
Public Program Guidelines
The Health Care Financing Administration(now known as Centers for Medicare and Medicaid Services(CMS)) does not in general instruct States on the choice of individual pharmaceutical agents for inclusion in formulary or treatment guidelines. However, HCFA(now known as CMS) has sent a letter to State Medicaid Directors urging the coverage of atypical antipsychotics as first line agents for the treatment of schizophrenia.25
In general, State Medicaid and State Mental Health programs have not adopted treatment guidelines for depression or schizophrenia. This situation has begun to change somewhat with the advent of Medicaid Managed Care. The outstanding example of treatment guidelines in development and implementation are those developed by the Texas Medication Algorithm Project (TMAP), which is being conducted in four phases.34 In Phase I, algorithms for schizophrenia, depression, and bipolar disorder were developed.
The algorithm for the treatment of nonpsychotic depression makes treatment recommendations for six stages of therapy. In Stage I, the algorithm recommends monotherapy with an SSRI, bupropion, nefazadone, venlafaxine or mirtazapine. In Stage II (after partial or nonresponse), the algorithm recommends trying either a different medication from the Stage I list or a TCA. Alternatively, augmentation is recommended after partial response at each stage. In Stage III, the algorithm recommends use of an antidepressant in a class other than one used in Stage I or II. The algorithm also states that the use of a MAOI may be appropriate in Stage III. Stages IV-VII recommend (in this order) lithium augmentation, combination therapy, electroconvulsive therapy (ECT), or any other antidepressant not listed in Stages I-III.35
The TMAP schizophrenia algorithm recommends use in any order of olanzapine, quetiapine or risperidone whether or not the patient has a history of failure on a typical antipsychotic. After non-response to the two remaining atypical agents or to a typical agent (in patients with no history of failure on a typical agent), clozapine is recommended. In the case of non-compliance with the second atypical antipsychotic, haloperidol decanoate or fluphenazine decanoate is recommended. With partial response to clozapine, an augmenting agent is recommended. With non-response or refusal on clozapine, the algorithm recommends either the use of combinations of atypical and/or typical antipsychotics or the combination of an antipsychotic with ECT.35
In Phase II of TMAP, a feasibility trial determined the suitability of the recommendations, as well as strategies and resources necessary for implementation into the public sector. Phase III, a clinical impact study, compares treatment as usual (TAU) to the algorithms. This study will determine whether the algorithms and associated efforts (e.g., patient/family education and increase in clinical staff to implement the algorithms) produce better clinical outcomes and whether they affect service utilization (and therefore cost). Phases II and III provided clinical staff and physicians with continuing education to ensure understanding and use of the algorithms and medications. Preliminary results indicate that the physicians largely followed the algorithms, requested ongoing continuing medical education/information for the new algorithms, and plan to continue use of the algorithms after completion of the study.35 Respondents within the VA and the DoD reported that treatment guidelines have been found useful in the management of patients with mental illness within organizations.
The VA's Medical Advisory Panel (MAP) for Pharmacy Benefits Management recently developed guidelines for the pharmacologic management of major depression as part of a greater effort to standardize and reduce treatment costs for common diseases within the VA. Currently there are no guidelines for the management of schizophrenia at the national level within the VA or the DoD.36
These guidelines for the treatment of depression rely primarily on APA, AHCPR and other evidence-based published guidelines. Guidelines are reviewed and updated routinely. The guidelines are intended to "assist practitioners in clinical decision-making, to standardize and improve the quality of patient care, and to promote cost-effective drug prescribing."
The guidelines focus on pharmacotherapy from a primary care perspective, encouraging monitoring, appropriate dosage, and maintenance therapy, or referral to a psychiatrist if necessary. The guidelines also state that a psychiatrist should immediately evaluate patients who present with depression and suicidal thoughts and/or symptoms of psychosis. Though no one therapy for depression is recognized as clearly superior, SSRIs are recommended as first-line antidepressants due to the lower risk for suicide in overdose. In developing the guidelines, the MAP did not find sufficient evidence to recommend one SSRI over another.
Private Sector Guidelines
Several health care payers and health maintenance organizations have produced more explicit guidelines for the choice of antidepressant and antipsychotic medications. These range in scope from designations of preferred medications to more comprehensive sets of guidelines for the management of these illnesses.
Among the payers interviewed in this study, there was no consensus on the choice of recommended first line agents. In general, however, payers are more concerned about managing antidepressant utilization than they are about managing the utilization of antipsychotics. This is largely because the antidepressants (in particular the SSRIs) have a far greater potential for misuse, including their use in the promotion of weight loss, performance enhancement (the "better than well" effect), and the treatment of melancholy that does not constitute depression.
In designing treatment guidelines/disease management, most MCOs try to integrate pharmaceuticals with non-pharmacotherapies. Plans may recommend choice of agents by brand, drug class, dose, duration of therapy, side effects, and required follow-up care. Although distribution of guidelines is not common, one of the five plans interviewed reported distributing these materials to the patient as well as making them available for sale to other health plans. The focus of the program at one large, group-model HMO was more one of physician monitoring and education. This MCO has implemented guidelines to insure better management of depressed patients.
Another large, group-model HMO recommends that either a TCA or an SSRI is an appropriate first-line choice for an antidepressant, leaving the option to the physician. Another group-model HMO admitted to recommending the least expensive agent available, whether it was an SSRI or a TCA.
First-line choices for antipsychotics likewise vary by payer, although few actively promote the use of atypical over typical antipsychotics. One HMO reported promoting the use of typical antipsychotics first-line even though prior authorization requests for atypicals are never denied.
Several PBMs are in the process of developing diagnosis and treatment guidelines (e.g., disease management, preferred drug list). Several reported using the AHCPR guidelines for depression, while others reported following those of their MCO clients. One large PBM has organized an outcomes research division to inform its development of guidelines for the diagnosis and treatment of depression. On the other hand, another large PBM feels that its role in the treatment selection should be minimal and that guidelines should be as general as possible. PBMs reported marketing the guidelines and programs they develop to providers, consumers, and employer and MCO clients.
Often, treatment guidelines published by PBMs have embraced the most up-to-date pharmacotherapies. For example, treatment guidelines published by the pharmaceutical benefits manager PCS state that SSRIs are the drugs of first choice for the treatment of depression, citing less risk of overdose, decreased side effects, increased patient compliance, and demonstrated cost effectiveness. At the time of publication, the national formulary of PCS included all five SSRIs currently available in the US. These guidelines also recommend atypical antipsychotics as first-line therapy for "patients experiencing psychotic episodes in which both positive and negative symptoms are apparent."37 PCS has also implemented formal disease management programs for both depression and schizophrenia.
Pharmaceutical manufacturers play a role in developing treatment guidelines, although these generally cannot focus on their product or pharmacotherapy alone. Rather, they aim for broad coverage of a class of drugs and integration of pharmaceuticals into overall treatment of the disease. One manufacturer stated that most schizophrenia guidelines have atypicals as first-line. Manufacturers may also assist academic institutions with the development of treatment guidelines. This was particularly true for schizophrenia guidelines, such as TMAP.
Employers do not generally concern themselves with the selection of preferred or covered pharmaceutical agents. Likewise, they do not develop or adopt treatment guidelines or disease algorithms for depression, bipolar disorder or obsessive-compulsive disorder. However, health benefits consultants report that they generally encourage employers to cover the most up-to-date pharmacotherapies for mental illness. Only one employer interviewed reported implementing a disease management program for depression, although others expressed interest. This program was a PBM-sponsored program monitored through the PBM contract.
Surprisingly, most BHMCOs are not involved in the writing of clinical practice guidelines for the treatment of mental illnesses. Magellan, the largest BMHCO, recently announced a program to produce general guidelines on the use of antidepressant medications as a component of comprehensive mental health care. However, these guidelines will focus on prescribing practices and appropriate use. They will not endorse specific pharmaceutical agents. The guidelines are being developed within a 3-year program designed to identify prescribing patterns for antidepressants. These guidelines will develop an independent Expert Consensus Panel Guidelines that specify a standard of care. The program will also analyze prescribing data to identify the appropriateness of prescribing in current practice. Finally, the program will develop an educational program to instruct physicians on appropriate prescribing protocols. These guidelines are being developed in collaboration with Eli Lilly.38
Special Population Guidelines
The New York State department of Corrections currently administers treatment algorithms and guidelines for the treatment of mental illness. The primary goals of these programs are to provide the highest level of care combined with some level choice to individuals with mental illness.
The Navaho region of the IHS reports no formal guidelines for the treatment of depression or schizophrenia. The principal goal of the treatment strategy within the IHS is symptomatic relief. The Service believes that its primary obstacle to providing effective treatment of mental illnesses within Native American populations is a resistance to "Anglo" medicine a priori. Therefore, the IHS often partners with traditional Medicine Men or seeks to portray itself as an alternative to these.
B. Clinical Development and Marketing
Clinical Development and Trial Design
The clinical trials submitted for review to the FDA by the manufacturer determine the indications for which a drug may be marketed. Although trials used to obtain approval may be sufficient to convince regulatory authorities that a new drug is safe and effective, their design may or may not be adequate to convince health care payers that a new drug represents a therapeutic advance over existing therapies. Therefore, trial design from first toxicology testing to pivotal trials and post-marketing studies is of paramount importance in affecting future drug utilization.
Numerous factors influence which drugs manufacturers choose to develop, and for which particular indications:
- Market competition or saturation;
- In-house clinical expertise and infrastructure;
- Potential market size and patient recruitment potential; and
- Reimbursement status of target population.
In general, manufacturers express no bias against developing a new drug for mental health indications in comparison with physical health indications. One manufacturer did mention that because most behavioral health users have public health insurance, patient recruitment and retention could be a greater challenge for behavioral health than for physical health drugs. This could be especially true in non-institutionalized schizophrenia patients, for example. Similarly, if a product demonstrates potential for both mental health and physical health indications, a lack of clinical expertise in mental health may lead the manufacturer to pursue the physical health indication. In general, manufacturers do not design trials for specific racial/ethnic groups or special populations (e.g., children) unless requested to do so by the FDA.
The MCOs and PBMs interviewed reported that traditional clinical trials are of relatively short duration and measure outcomes using instruments not readily translatable into regular clinical practice, such as standardized psychiatric rating scales. As a result, many manufacturers conduct outcomes studies that measure clinical, quality of life and/or economic endpoints. The respondents interviewed in this study indicated that in order to speed formulary acceptance, manufacturers should:
- Complete head-to-head comparisons with competing agents;
- Conduct long-term trials;
- Conduct real world effectiveness trials in naturalistic settings; and
- Include measures of "big picture" issues such as employee productivity.
Some health care payers are beginning to standardize their operating procedures for the review of new agents. For example, Regence BlueShield (Seattle, WA)39 and Blue Cross/Blue Shield of Colorado and Nevada40 have published guidelines for the submission of clinical and economic data supporting formulary consideration.
Manufacturers are responding to the request for such studies. We are aware of numerous outcomes studies of this type for both antidepressants and antipsychotics. Eli Lilly has conducted two direct comparisons of olanzapine and risperidone.41 Janssen is conducting a comparison of outcomes in patients treated with risperidone to those achieved in patients treated with one of 13 different conventional antipsychotics (this trial is named the ROSE trial). Often, payers are conducting this work themselves. For example, Group Health of Puget Sound conducted a comparison of the efficacy and cost-effectiveness of SSRIs to TCAs in a naturalistic, primary care setting.42
Marketing
Manufacturers devote considerable effort to marketing psychotherapeutics to physicians, although tactics vary. For example, both Janssen and Eli Lilly maintain a specialized detail force for mental health, whereas SmithKline Beecham promotes paroxetine largely through a non-specialty force. AstraZeneca promotes quetiapine through a generalized sales force dedicated to central nervous system products.14
The experience of a company in marketing through certain channels may affect the success of a particular drug. Eli Lilly and Janssen are recognized as experts in mental health marketing. The synergy of fluoxetine and olanzapine doubtless provide Lilly with a certain advantage in promotion. On the other hand, the relative inexperience of AstraZeneca in the mental health market may account in part for the slow diffusion of quetiapine in the treatment of schizophrenia.
It is generally assumed that manufacturer contracts and rebates may affect drug utilization. However, no data exists to support this idea, largely because such data are considered trade secrets. Indeed, none of the manufacturers or health care payers interviewed would discuss any such arrangements. For example, Medi-Cal requires manufacturers to enter into supplemental rebate arrangements with the State prior to including a drug on the formulary, although the exclusion of a drug from the formulary does not necessarily represent the failure of the manufacturer to offer Medi-Cal an acceptable rebate. However, Medi-Cal would not disclose the terms of any such arrangements. Our research does not support the assertion that rebate arrangements are more or less common for physical health medications than they are for psychotherapeutics. Although several MCOs and PBMs participate in volume-based or market share-based rebates or contracts for psychotherapeutics, the significant price differential between the branded and generic therapies prevents contracts or rebates from demonstrating considerable cost-effectiveness to providers.
To increase consumer demand and awareness for particular drugs, manufacturers often use direct-to-consumer advertising. There is a strong belief among consumer and provider associations that direct-to-consumer (DTC) marketing affects drug utilization. However, there are currently no data to support this. This issue may represent another area where follow up research may be useful.
The NMHA believes that direct-to-consumer advertising disseminates valuable information to patients that they may not otherwise receive. However, other respondents feel that marketing efforts may be merely a form of physician or consumer "brainwashing." That is to say, physicians are convinced to prescribe drugs manufactured by the company whose representative visits most frequently, even as consumers grow to demand the drugs with the most appealing promotional materials. The APA reported that DTC marketing probably increases drug utilization, but has not collected data to support this.
Several manufacturers maintain websites that describe their drugs or the diseases they are intended to treat. Sites generally have areas for consumers and for providers. Manufacturers believe these methods of promotion to be effective, but did not provide data on their direct effect on product sales. Sites are often named for the drug on which they provide information. Examples include citalopram (www.Celexa.com), fluoxetine (www.Prozac.com), paroxetine (www.Paxil.com), olanzapine (www.Zyprexa.com), and quetiapine (www.Seroquel.com). Solvay maintains a comprehensive site of information on the treatment of obsessive compulsive disorder (www.ocdresource.com). The paroxetine site now focuses heavily on the use of paroxetine in the treatment of social anxiety disorder, the newest indication for paroxetine. The launch of paroxetine for social anxiety disorder also represents one of the most visible uses of DTC in the mental health area.
Providers express some frustration at the potential for misinformation and the increase in consumer demand for particular products that may or may not be the best therapy for a patient who demands it.
C. Utilization Management
Health care payers have turned to utilization review (DUR) as a primary means of quality assurance and cost-containment. All of the payers interviewed maintain some form of utilization review program. DUR monitors providers, identifies outliers (i.e., over/under-prescribers), and screens patients (e.g., high cost cases eligible for disease management). The majority of providers use DUR as an educational tool to encourage good prescribing practices. Several providers use DUR as a monitoring tool to enforce compliance with formulary, PA and treatment guidelines.
Public Programs
HCFA(now known as CMS) performs drug utilization analysis on an ad hoc basis for the mental health therapeutic classes. The findings of HCFA(now known as CMS)'s reviews are not for public distribution. All Medicaid and State Mental Health Agencies perform some type of drug utilization review, in accordance with the requirements OBRA '90. A survey of Medicaid programs found that 14 States perform DUR in-house, 31 contract the process out, and 4 do a combination of the two.19 A large majority of States (42) perform Prospective DUR (PRODUR) in addition to retrospective DUR.
The DoD performs DUR through a contract staff. For mental health prescriptions, the goal is to minimize duplicated medications and overdosing. The VA has a national in-house DUR database that is reviewed on a regular basis.
Private Payers
Most PBMs track and monitor drug utilization. The majority of DUR programs run through PBMs are retrospective only (although two PBMs run concurrent DUR). They are either managed in-house or through the main health plan. Quality assurance is the most important goal of DUR, followed by formulary compliance (and reduction of drug costs). DUR is often used to identify physicians who are over- or under-prescribers of medications. This identification helps to target physician education initiatives. Criteria for DUR include assuring appropriate dosage, preventing drug interactions, and formulary compliance. One PBM tracks individual physician utilization patterns rather than tracking utilization at the request level. Another PBM has a quality initiative based upon SSRI compliance.
MCOs either perform DUR in-house or contract out to PBMs. Clinical pharmacists run the DUR program at one MCO (in-house, prospective, retrospective and concurrent). The goals of DUR are quality assurance (i.e., appropriate use of drugs in a cost-effective manner) and cost minimization. Monitoring of psychotropic medications occurs no differently than for other classes of pharmaceuticals and tracks duplication, overuse, under-use and possible drug interactions. One MCO interviewed has set standards of compliance for both acute and maintenance phase antidepressant treatment. Utilization review found that the majority (65%) of patients receiving antidepressant medication met their standards for acute phase treatment by remaining on the antidepressant during the entire phase, and almost 50% met the six-month long continuation phase standards by remaining on the drug during that time period.
Employers generally contract out to a PBM or other source for DUR. For these payers, DUR primarily serves as a screening device to identify patients in need of disease management.
BMHCOs are involved in utilization management for both their public and their private sector clients. However, these organizations focus on the entire scope of care and seek to insure that patients are cared for in the least intensive locus of care that meets their mental health needs.
Although the use of psychotherapeutics is part of the continuum of care, the BMHCOs are not generally involved in either the choice of particular agents or the administration of pharmaceutical benefits. The single BMHCO interviewed who is involved in managing pharmaceutical benefits performs utilization review and case management for its MCO, employer, or State customers. This company often serves as an administrative organization for their customers by the handling cost and utilization data necessary to project risk and justify rates. The BHMCO emphasized that available data are not adequate for analysis and stressed the need for better data collection.
Special Populations
The New York State Corrections system did not report engaging in any formal DUR activities. The IHS performs DUR in-house, designed to assure quality, safety, formulary compliance, and cost minimization. Criteria included in regular reviews of drug classes include overuse, underuse, and avoidance of drug-drug interactions. These criteria do not differ from those used in other drug classes.
D. Compliance
Programs that monitor patients for compliance with therapy, or providers for compliance with treatment guidelines, are in their infancy. Provider compliance programs usually take the form of monitoring for adherence to a formulary, although programs that monitor for compliance with treatment guidelines are growing in popularity. It should be remembered, however, that treatment guidelines usually take the form of recommendations on overall pathways of care (usually including the use of pharmaceuticals), rather than rigid guidelines on drug choice and dosing recommendations. Therefore, monitoring physicians for the appropriate use of psychotherapeutics is yet to be widely used.
Payers have been slow to implement patient compliance programs, largely because requirements for maintaining patient confidentiality make tracking mental health patients difficult at best. Nevertheless, some employers and managed care plans have begun to implement such programs in the form of call centers or educational programs (e.g., pamphlets). Disease management programs are intended to foster patient compliance; however, pharmaceutical compliance is only one aspect of these programs. PBMs take the most active role in encouraging patient compliance with pharmacotherapy by using various forms of reminders to patients to refill prescriptions.
Provider Compliance
Provider compliance is a greater priority within the private sector than the public sector. This trend is consistent with the trend toward greater use of restrictive formularies and treatment guidelines in the private sector. Provider compliance programs are likely to grow in the future as the private sector insurers become increasingly concerned with cost-effectiveness.
The APA tracks prescribing practices of a sample of psychiatrists through the Practice Research Network (PRN). This program monitors issues such as the use of different classes of medications. The APA also attempts to monitor dosing practices, although these data have not been published. The primary goal of the PRN is to follow current practices in the treatment of mental illnesses and provide a platform for education to improve the quality of treatment provided by clinicians.
Local chapters of NAMI have engaged in educating provider groups and associations about clinical practice guidelines, such as those published by the APA. As in the case of the PRN, a primary goal of these initiatives is provider education in an attempt to improve care quality.
- Public Programs
Provider compliance programs generally do not operate in traditional Medicaid programs. Most drugs are available on formulary and few treatment guidelines are employed. Any willing provider (AWP) legislation generally excludes the possibility of provider credentialling. Medicaid Managed Care programs may monitor physicians for compliance, but this was not within the scope of our research.
State Mental Health programs do not monitor their providers for compliance with treatment or prescribing guidelines on a statewide basis. These programs often are implemented at the level of the individual hospital or community mental health center. As may be expected, such programs vary in scope between individual sites. The outstanding example is the TMAP (Texas Medicaid Algorithm Project). In Phase II of this program, a feasibility trial, physicians self-reported their use of the algorithms and preliminary results indicated the majority complied with the guidelines and would continue to use them after completion of the trial.34,35 Physician manuals are available at the Texas Department of Mental Health and Mental Retardation. The program does not plan to monitor providers for compliance with algorithms. However, some pharmaceutical prescribing patterns are monitored (e.g., different dosages accepted for different indications). Data collected in monitoring physicians is reviewed and physicians are contacted to confirm unique circumstances (via letters, etc.).
The DoD and the VA are more aggressive in monitoring provider practice patterns. Both routinely review provider records to monitor for compliance with formularies, evaluate dosing patterns, and monitor inappropriate use of medications. These evaluations are generally carried out at the local (i.e., treatment facility) level. The VA also carries out an external peer review of physician treatment practices.
- Private Payers
Within the private sector, strategies to monitor and encourage compliance with formularies and treatment guidelines include DUR, physician profiling, self-reported surveys and peer review. Physician profiling is perhaps the most aggressive of these methods, as individual physicians are provided with counts of their prescribing of individual drugs on a regular basis. Although most payers interviewed use formularies, treatment guidelines, and profiling primarily as educational tools, several do enforce compliance. Physicians who are found to prescribe off formulary frequently may be targeted by the payer for either education or encouragement to comply with the formulary. Both incentives (e.g., rebates) and disincentives (e.g., withholding of physician bonuses) are used to encourage provider compliance, although these practices appear to be less common than many may fear.
Manufacturers track provider treatment patterns in two ways. First, manufacturers monitor physicians who are high prescribers either of a particular medication or a general class of medications. Prescription data are available for purchase from several sources including IMS Health and Scott-Levin. These data form the basis for a manufacturer's detailing strategy by identifying physicians who are likely to prescribe a particular product or who may be candidates to target for switching. Furthermore, manufacturers target the broader payer population, offering rebates or contracts to health plans to encourage use of a particular product. Second, manufacturers may encourage physician compliance on the individual level by offering physician education programs or materials. One manufacturer also reported offering incentives to physicians who increase patient compliance and reintegration rates.
Most MCOs do not monitor providers for compliance with treatment guidelines or algorithms. However, many plans are beginning to implement comprehensive disease management programs that include a provider component.
One HMO interviewed reported instituting an early detection pilot study for depression within one of its medical groups. This program was developed internally and its organization and outcomes have not been published. This HMO reported that the goal of this pilot program was to develop a screening tool that included depression assessment and treatment guidelines for use by primary care physicians. The goal of this program was to screen patients for undetected or undiagnosed depression. The study team developed a simple, easy-to-use screening form and worked closely with the medical director and providers to improve it over the course of the study. The study team also offered training to providers on use of the assessment tool and treatment strategies. The HMO believes that the program has been successful in a variety of ways. First, this program achieved detection rates that approach what the Agency for Health Care Policy and Research reports as the actual prevalence of depression. Further, most of these patients are willing to pursue treatment. Lastly, physicians are complying with the study, even though the bonuses paid to physicians for performing the detection screen have run out.
Similarly, another integrated MCO is operating a pilot project to systematize the treatment of depression within primary care. The program specifically aims to demonstrate that primary care clinics can develop systems that consistently manage and follow-up depressed patients and to describe and evaluate the change process used to do this, the new care process and its effects. The project has found that regular low-end management (such as 4-5 minute telephone calls with patients) can have as much of an impact as medication on patients with depression.
Finally, another large group model HMO has developed a more comprehensive disease management program for depression. The program consists of disease management guidelines for use in both primary care and specialty behavioral health settings. The guidelines give recommendations for appropriate dosing of medications, and specify that either TCAs or SSRIs are acceptable first-line choices of medication for depression. The choice of a particular agent is left to the physician who is expected to consider cost in making a choice of agent. The program collects data on patients enrolled in the program, including measures of illness severity, medication regimen, costs and treatment outcomes. Within the first year of operation, this program successfully enrolled 50% of new depression patients.
PBMs generally do not enforce physician compliance with treatment guidelines or disease management programs, but encourage compliance through education and notification. One PBM asks physicians to complete a volunteer survey. Another runs a quality initiative based upon SSRI compliance. Maintaining patient confidentiality often precludes adequate data collection and monitoring on a case specific basis.
Employers monitor providers for compliance with guidelines via concurrent or retrospective DUR. This process is usually contracted out to a PBM or other outside source. Furthermore, employers may partner with their PBMs or HMOs to conduct provider education. Employers who take a more activist role in the management of their health benefits report that they are attempting to implement programs to monitor providers for quality assurance purposes.
- Special Populations
In the correctional system, providers are internally monitored for compliance with treatment algorithms and guidelines through the health information management department. The management department generates pharmacy profiles of physicians and patients which provides a vehicle for "auditing" provider compliance.
The Indian Health Service does not monitor providers for adherence to treatment guidelines on a regional or national level. Individual treatment facilities develop their own protocols and clinicians are monitored for compliance at that facility.
Patient Compliance/Disease Management
Patient compliance and disease management programs appear to be more common in the private sector than the public sector. This observation likely reflects several trends currently operating in the mental health services sector. These trends include:
- Public sector programs such as Medicaid and State Mental Health agencies have been aggressively moving their mental health patients into managed care programs. These agencies likely look to the managed care vendor to provide compliance and disease management.
- Private sector insurers are increasingly cost-conscious and seek to manage costs by insuring quality of care via these programs.
Health care payers are not necessarily convinced of the economic value of compliance and disease management programs. While patient confidentiality remains a barrier to data collection, adequate data is not available to discern the cost-effectiveness of these programs. Despite this uncertainty, some payers continue to offer patient compliance and disease management programs as an added value to patients. Several payers interviewed (mostly private sector) are currently developing or have implemented patient registries or quality of life initiatives for depression. As is the case with treatment guidelines, compliance/disease management programs are less common for schizophrenia than for depression.
Although the national consumer and provider associations do not run patient compliance programs, both NAMI and NMHA maintain outreach programs to underserved populations and are beginning to increase those efforts.
- Public Programs
The outstanding public sector example of disease management and compliance is TMAP. TMAP worked with 20-30 patients, consumers and NAMI to design a 6-step patient and family education program. This program includes an array of educational materials ranging from pamphlets to videotapes. These materials cover issues such as how to monitor medications, and speak with physicians about mental illness. Twelve States have requested copies of these pamphlets, which are available from the Texas Department of Mental Health and Mental Retardation.35
In the DoD health care programs, the goal of military service is to maintain worldwide deployability of its active duty officers. Therefore, if a mental illness is documented, medical retirement might be mandated, regardless of disease severity. These policies vary among the service branches. For instance, the Navy and Marine Corps are more likely to allow individuals with a mild mental illness, such as depression, to continue service than the Army and Air Force. An individual might be asked to retire if a particular mental illness affects his/her "fitness to do duty." Dependents and retirees are not affected by this rule unless they would be stationed overseas with an active duty officer. One DoD health care product has the motto: "We are the HMO that goes to war." Therefore, ensuring that an individual who could go to war and handle weapons is of sound mental health lies at the heart of the military's mission of worldwide deployability.
- Private Payers
Although it is widely assumed that patient compliance with therapy should ultimately reduce overall medical costs, it is clear that private payers are only beginning to investigate whether this is actually the case.
Manufacturers focus on physician compliance rather than patient compliance due to concerns for patient confidentiality and greater ease of tracking physicians. Furthermore, patient compliance and disease management programs have not necessarily proven financially beneficial to manufacturers. One manufacturer noted that their depression guidelines have not been widely adopted and, in general, there is no accurate measurement of effectiveness for these programs.
Despite these limitations, several manufacturers have begun to develop or implement programs that attempt to assist patients in complying with antidepressant or antipsychotic treatment regimens. Strategies include automated refill systems, 800 hotlines, patient education programs, and the sending of reminders to providers. Manufacturers distribute programs/guidelines to consumers, families, providers and sometimes health plans.
PBMs, MCOs and employers are beginning to implement case management programs for depression and to a lesser degree, schizophrenia, even though case management is often delegated to behavioral health carve-outs. Programs that focus on screening and diagnosis are more common than programs that actually focus on case management.
One integrated HMO interviewed has implemented a confidential health risk assessment program for members that is administered via telephone. Confidential feedback is provided to the health plan member, with recommendations for individual lifestyle and health improvements. Results of the employee's risk data are also sent to their health care provider. This payer is also testing new approaches to chronic care delivery. One recent initiative involves the use of telephone follow-up. Nurses and care managers make a total of six telephone calls during the first six months following a mental health episode -- initially at two-week intervals and phasing into one call every two months. Staff are evaluating the success of this approach and believe that it contributes more to health outcomes than more traditional chronic care (e.g., medications, self-care, other types of follow-up).
This HMO has also implemented programs to monitor and insure follow-up after hospitalizations for mental illness and proper management of antidepressant medications. For example, the HMO tracks the percentage of hospitalized mental health patients age six years and older who were continuously enrolled for 30 days after discharge and who received some form of outpatient treatment (ambulatory care or day/night treatment). Sixty-eight percent of the patients who met these criteria sought outpatient care within seven days of discharge; 86% sought such treatment within 30 days of discharge. Similarly, this HMO monitors three performance indicators that assess multiple facets of appropriate treatment. Each measures the percentage of patients with new episodes of depression who were treated with antidepressant medication and who meet specified treatment criteria.
Employer-sponsored programs designed to assist patients in recognition and treatment of mental illness are not as common as physician-targeted programs. Employers expressed reluctance to implement these programs due to patient confidentiality, the difficulty of data acquisition and the difficulty of demonstrating value of these programs. When in place, they are usually designed and run through the MCO or PBM. Employee assistance programs (EAPs) often serve as a triage mechanism for minor episodes of mental illness or as screening and referral services. When presented with more serious cases, EAPs serve as a referral mechanism to get patients experiencing mental illness into the proper treatment system. At one employer, patients are targeted for a depression screening/education/awareness program through DUR. Pharmacotherapy is an essential part of this employers depression program.
Once employees are undergoing treatment for mental illness, BHO carve-outs may provide generic case management. However, few formal programs are in place, again, due to the difficulty of data acquisition and patient confidentiality.
In general, PBMs are reluctant to operate patient compliance programs due to confidentiality concerns. However, one PBM offers compliance assistance for antidepressants and will survey physicians for effectiveness. Others are planning programs to improve patient compliance (e.g., packaging medications in a box that can be placed on a kitchen counter or dresser).
- Special Populations
In designing disease management programs, the manufacturers interviewed did not report explicitly considering physiological differences based on ethnicity (although one manufacturer considers gender). Neither do manufacturers consider sociological perceptions of psychotherapeutics among different cultural groups, although one manufacturer acknowledges that the condition and treatment of schizophrenia is highly dependent on the social/cultural environment (e.g., stigma).
Our respondents reported that patients in correctional facilities of New York State are not forced or coerced to take their medications, but are encouraged through education.
One respondent from within the Indian Health Service indicated that difficulties in patient compliance with "Anglo" medicine is no greater in patients with mental illness than in those with any other disease. This respondent indicated that if the consumer accepted "Anglo" medicine, then compliance with therapy was generally pretty good. In attempting outreach among Native American populations who are suspicious of "Anglo" medicine, the IHS may attempt to work with traditional medicine men and women to increase their credibility among these patients.
- Severely Mentally Ill Populations
The management of patients who become severely mentally ill (SMI) is not uniform across service sectors. Most patients in public programs already meet the criteria of SMI or SED (for severely emotionally disabled children). However, the experience of patients in other insurance programs may be somewhat different.
Pharmaceutical companies have developed no major programs for high cost episodes of care or lifetimes of care (e.g., one that might offer discounts/incentives to increase access/compliance/utilization in high cost cases). One manufacturer believes the greatest costs (in high-cost cases) are generated by hospital days, not drug utilization, and should be accounted for through the medical benefit, not the pharmacy benefit. Another manufacturer is planning a program for combination therapies and additional drugs for treatment resistant patients.
One mixed-model HMO has organized a team of case managers to attempt to reduce inpatient admissions among its high utilizing mental-health population. The case managers are bachelors' level social workers who conduct outreach, help patients with medication, keep appointments, and increase compliance. The team approaches the appropriate clinician about each high-utilization patient and tries to help the provider treat the patient. This HMO believes this program has been very helpful in reducing the number of admissions among the high utilization population and is popular among patients.
The benefits consultant interviewed suggested that employers are rarely familiar or experienced with cases that become eligible for public assistance under SMI/SED guidelines. This is because employees who become this ill generally leave the workforce and are cared for under SSI disability provisions. One employer interviewed provides 60% of pay until age 65 for those out on disability and provides health coverage for two years (i.e., until Medicare eligibility under SSDI has been established). Furthermore, employers may not be aware that a patient has exceeded his or her maximum lifetime benefit until that patient has done so. In these cases administrative override is at least possible. The focus continues to be on maintaining the patient within least intensive locus of care. Strategies to promote least intensive locus of care include providing a flexible benefit design (e.g., exchange inpatient days for other types of treatment; no limit on benefits up to 1 million dollars for a lifetime). For example, in some behavioral health carve-outs, high cost/lifetime of treatment cases are managed separately.
Currently the PBMs interviewed do not have case management programs for patients on psychotropics or for high cost cases. Nor are there special programs for underserved populations.
Chapter VI. Patterns of Antipsychotic and Antidepressant Utilization in Medicaid, 1995-1998
The truest measure of access to and utilization of pharmaceuticals is analysis of actual patterns of claims processed for individual drugs. Although analysis of these patterns across all health care payers is outside the scope of this research, this section analyzes trends in utilization of antidepressants and antipsychotics in Medicaid between 1995 and 1998.
In brief, this analysis found:
Antidepressants and antipsychotics account for a large proportion of Medicaid pharmaceutical prescriptions and reimbursements. The impact of newer antidepressants and antipsychotics on expenditures is out of proportion to the number of prescriptions for these agents.
- In 1998, antidepressants and antipsychotics accounted for 9% of Medicaid prescriptions but 19% of Medicaid drug expenditures.
- Although the total number of prescriptions reimbursed by Medicaid has remained relatively constant between 1995 and 1998, expenditures have increased by over 40%.
- The growth rate in both number of prescriptions for and cost of antidepressants and antipsychotics outpaces that observed in Medicaid pharmacy benefits as a whole by more than 2-fold.
The volume of Medicaid antidepressant and antipsychotic prescriptions grew dramatically between 1995 and 1998.
- Medicaid antipsychotic prescriptions increased nearly 20% between 1995 and 1998.
- Antipsychotic prescriptions totaled 9.1 million in 1995.
- Antipsychotic prescriptions totaled 11 million in 1998.
- Medicaid antidepressant prescriptions grew by over 40% between 1995 and 1998.
- Antidepressant prescriptions totaled 13.6 million in 1995.
- Antidepressant prescriptions totaled 19 million in 1998.
Total expenditures by Medicaid programs for antidepressants and antipsychotics grew dramatically between 1995 and 1998.
- Medicaid antipsychotic expenditures increased nearly 160% between 1995 and 1998.
- Antipsychotic expenditures totaled $484 million in 1995.
- Antipsychotic expenditures totaled $1.3 billion in 1998.
- Medicaid antidepressant expenditures grew by over 96% between 1995 and 1998.
- Antidepressant expenditures totaled $592 million in 1995.
- Antidepressant expenditures totaled $985 million in 1998.
New generation antipsychotics been accepted into common use within Medicaid programs.
- In 1998, 51% of the 11 million prescriptions for antipsychotics were for atypical antipsychotics. Three 2nd generation atypicals were available in 1998.
- In contrast, atypicals accounted for only 17.5% of 9.1 million Medicaid antipsychotic prescriptions in 1995. Only one 2ndgeneration atypical was available in 1995 (risperidone).
- The use of atypical antipsychotics in Medicaid has more than doubled since 1995.
- Concomitantly, the use of typical antipsychotics in Medicaid has dropped by 25% since 1995.
- In contrast, atypicals accounted for only 17.5% of 9.1 million Medicaid antipsychotic prescriptions in 1995. Only one 2ndgeneration atypical was available in 1995 (risperidone).
New generation antipsychotics have not simply supplanted typical antipsychotics. Rather the total market for antipsychotics in Medicaid has grown since their introduction. Increased use of atypical antipsychotics has driven expenditures.
New generation antidepressants have been accepted into common use in Medicaid.
- In 1998, 62% of the 19 million Medicaid antidepressant prescriptions were for new-generation, branded antidepressants.
- In contrast, new generation antidepressants accounted for from 44% of 13.6 million Medicaid antidepressant prescriptions in 1995.
- The market share of new generation antidepressants has grown by approximately 50% since 1995.
- Concomitantly, the market share of TCAs in Medicaid has decreased by nearly 50%.
- In contrast, new generation antidepressants accounted for from 44% of 13.6 million Medicaid antidepressant prescriptions in 1995.
- The selective serotonin reuptake inhibitors (SSRIs) comprised 46% of total antidepressant prescriptions in 1998.
- Prescriptions for the three leading agents (fluoxetine, paroxetine, and sertraline) were nearly equal with approximately 3 million prescriptions each, or a 15-16% share each.
- Tricyclic antidepressants accounted for 27% of total prescriptions in 1998.
Increased Medicaid expenditures for antidepressants have been driven both by uptake of new generation, branded agents and increased prescription volume.
- Much of this increase can be attributed to the steady, yet significant rise of the three leading SSRI antidepressants (fluoxetine, sertraline, and paroxetine).
- Together, spending for fluoxetine, sertraline and paroxetine comprised over 70% of all Medicaid spending on antidepressant drugs in 1998 ($711 million).
- TCAs accounted for only 5% of all Medicaid dollars reimbursed for antidepressants ($54 million).
New generation antidepressants have not simply supplanted tradition antidepressants. Rather the total market for antidepressants in Medicaid has grown since their introduction.
Utilization of new-generation antidepressants and antipsychotics varies among the states. Not all states have adopted new-generation agents as quickly as others.
New-generation antidepressants and antipsychotics have been accepted into common use by Medicaid programs at about the same rate and to the same extent as other innovator drugs.
- Newer antipsychotics appear to be proportionally more expensive than other new generation pharmaceuticals such as oral antidiabetics.
- Newer antidepressants appear to be roughly equivalent in cost to these other classes.
A. Methodology
Quarterly, state level data on prescription drug utilization are available from the Health Care Financing Administration(now known as Centers for Medicare and Medicaid Services(CMS)) (HCFA(now known as CMS)). These data are reported at the National Drug Code (NDC) level. These data include all pharmaceuticals reimbursed through State Medicaid pharmacy programs. However, these data exclude prescriptions dispensed to Medicaid recipients enrolled in managed care plans where pharmacy benefits are included in the capitation arrangement. Therefore these data will miss drug utilization within those plans. As most Medicaid Managed Care plans are limited to the AFDC or TANF populations, therefore, one would expect that this deficiency would affect the analysis of antidepressant utilization more than it would antipsychotic utilization.
While these data are representative of the US Medicaid population, state-level analyses are difficult in some States due to missing data. Arizona and Tennessee fail to report Medicaid drug utilization data at all while Texas has not reported since the second quarter of 1995, and Colorado has not reported since the fourth quarter of 1996. Connecticut reported no data for 1998. Other States with questionable data include Indiana, Kansas, and Wyoming (1995 and 1996 data appear to be off by a factor of 10).
A total of 19 States report data for all 16 quarters of 1995-1998. Data imputation was accomplished for 13 other States using a linear or exponential growth interpolation model in Microsoft Excel. Missing data were imputed for States missing up to three quarters of data over the 1995-1997 period. Imputation of missing data allows analysis of data from 44 States and the District of Columbia (i.e., "45 States"). Data from Connecticut is included for years 1995-1997, but not 1998. Based on information from HCFA(now known as CMS) form 2082 (1998), these 46 States accounted for over 80% of Medicaid recipients in 1998. Only Arizona, Tennessee, Texas, Colorado, Kansas, and Indiana are excluded because of missing or suspect data.
Because the Medicaid data do not report diagnosis or dosage associated with each prescription, we were unable to analyze use of antidepressants and antipsychotics as a function of disease treated. Rather, we summarize all Medicaid use of these agents regardless of diagnosis. It should be emphasized that these data, therefore, include the use of antidepressants and antipsychotics for the treatment of illnesses other than schizophrenia or major depressive disorder. For antipsychotics, these illnesses may include behavioral disturbances in various forms of dementia as well as treatment-refractory depression and bi-polar illness. Antidepressants may be used to treat Obsessive-Compulsive Disorder, Attention Deficit Disorder, Generalized Anxiety Disorder, Bulimia, chronic pain, and sleeplessness to name a few.
In the following discussion, the word "prescription" should be understood to refer to, on average, a month's supply of medication. Using this definition requires claims data for clozapine to be divided by a factor of 4.3 to achieve comparability to prescriptions for other agents (this method accounts for Federal supply limitations of 7 days).
The monetary figures quoted for drug expenditures are net of rebate (i.e., the rebate amount returned to the State Medicaid agencies, as required by OBRA 1990, has been factored out of the expenditure data). As a result, Medicaid reimbursements represent a lower bound estimate of actual costs.
B. Trends in Medicaid Pharmaceutical Coverage
Total prescriptions in Medicaid were relatively flat between 1995 and 1998. Medicaid programs reimbursed 327 million prescriptions in 1995 and 331 million prescriptions in 1998. During the same period, antipsychotic prescriptions increased by nearly 20% while antidepressant prescriptions increased by just over 40%.
However, prescription expenditures increased by 43% between 1995 and 1998. Medicaid programs paid almost $8.9 billion for prescription drugs in 1995 and $12.8 billion in 1998. During the same period, expenditures on antipsychotics increased by approximately 160%, while prescriptions for antidepressants increased by 96%.
In 1998, the 11 million Medicaid antipsychotic prescriptions accounted for only 3% of all Medicaid prescriptions. However, the $1.3 billion spent for these pharmaceuticals represented nearly 11% of total expenditures. Similarly, the 19 million antidepressant prescriptions accounted for nearly 6% of total prescriptions, while the $985 million spent for these agents approached 8% of expenditures. Therefore, although antidepressants and antipsychotics account for nearly 9% of total Medicaid prescriptions in 1998, their impact to total pharmaceutical costs is nearly twice as large as their market share.
C. Utilization of Antipsychotics in Medicaid, 1995-1998
The American Hospital Formulary lists nearly twenty different agents that are classified as antipsychotics. Most of these belong to the general class of phenothiazine derivatives. For the purposes of this analysis, antipsychotic medications were grouped into 8 general categories as indicated in Exhibit VI-1 below.
In 1998, 51% of All Medicaid Prescriptions for Antipsychotics were for Atypical Antipsychotics. Expenditures on Atypicals Accounted for 89% of Total Spending on Antipsychotics
-
In 1998, Medicaid programs in the 45 States analyzed paid for nearly 11 million prescriptions for antipsychotics. Exhibit VI-2 shows the market share in Medicaid for each class of antipsychotic in 1998. Phenothiazines accounted for the largest share of antipsychotic prescriptions, with approximately 3.0 million prescriptions, or a 26% share. Risperidone ranked second in number of prescriptions (2.8 million, 25%) followed by olanzapine (2.2 million, 20%), and haloperidol (1.6 million, 15%). Clozapine prescriptions accounted for 4% of total prescriptions (442,000 prescriptions). Quetiapine logged only 174,000 prescriptions in its first full year on the market (2%), slightly less than the number of prescriptions for injectable haloperidol (185,666, 2% share). As a group, atypical antipsychotics accounted for just over 53% of all prescriptions for antipsychotics in 1998 (4.6 million).
Exhibit VI-1. Antipsychotic Categories
| Class Grouping | Trade Names and Examples |
|---|---|
| Risperidone | Risperdal® |
| Olanzapine | Zyprexa® |
| Quetiapine | Seroquel® |
| Clozapine | Clozaril® Generics (from 1998) |
| Haloperidol | Haldol® Generics |
| Injectable Haloperidol | Haldol® decanoate |
| Phenothiazines | Chlorpromazine (Thorazine®) Fluphenazine (Prolixin®) Perphenazine (Trilafon®) Thioridazine (Mellaril®) Other Phenothiazines |
| Others | Loxapine (Loxitane®) Molindone (Moban®) Pimozide (Orap®) Thiothixene (Navane®) Others |
In dollar terms, these 11 million prescriptions corresponded to expenditures of $1.3 billion. As seen in Exhibit VI-3, olanzapine accounted for the largest share of spending for antipsychotics at $536 million (42%). Risperidone ranked second at $395 million (31%), followed by clozapine at $172 million (14%). Oral haloperidol and phenothiazines accounted for only 2% ($12.3 million) and 6% ($75.6 million) of expenditures, respectively. Quetiapine accounted for 2% of total antipsychotic expenditures ($24 million). Atypical antipsychotics account for the vast majority of expenditures on antipsychotics: in 1998, just over $1.1 billion, or 89% of expenditures.
Oral formulations comprise the vast majority of the outpatient Medicaid market. Injectable haloperidol accounted for 2% of prescriptions (185,666) and 2% of expenditures ($27.6 million) in 1998.
Exhibit VI-4 presents the data in Exhibits VI-2 and VI-3 in tabular format.
Exhibit VI-2. Market Share of Antipsychotic Classes in 45 Medicaid States, 1998. Total Prescriptions = 11 Million
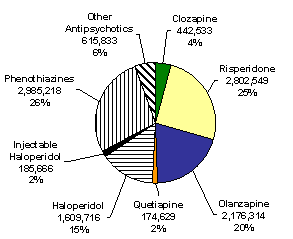
Source: The Lewin Group analysis of HCFA(now known as CMS) Medicaid Drug Rebate Program Data, 1998. 45 States Reporting.
Exhibit VI-3. Market Share of Antipsychotic Classes in 45 Medicaid States, 1998. Total Expenditures = $1.3 Billion
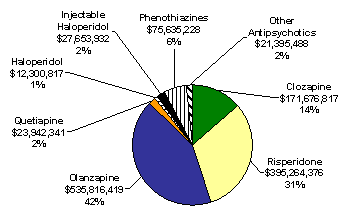
Source: The Lewin Group analysis of HCFA(now known as CMS) Medicaid Drug Rebate Program Data, 1998. 45 States Reporting.
Exhibit VI-4. Share of Medicaid Antipsychotic Prescriptions and Expenditures by Class, 1998
| Prescriptions | Expenditures | |||
|---|---|---|---|---|
| Class | Number (000s) |
% of Medicaid Antipsychotic Rx |
Cost (Millions) |
% of Medicaid Antipsychotics $ |
| Clozapine | 443 | 4% | $172 | 14% |
| Risperidone | 2,803 | 26% | $395 | 31% |
| Olanzapine | 2,176 | 20% | $536 | 42% |
| Quetiapine | 174 | 2% | $24 | 2% |
| Haloperidol | 1,610 | 15% | $12 | 1% |
| Injectable Haloperidol | 186 | 2% | $28 | 2% |
| Phenothiazines | 2,985 | 27% | $76 | 6% |
| Other Antipsychotics | 615 | 6% | $21 | 2% |
| All Antipsychotics | 10,992 | 100% | $1,265 | 100% |
Source: The Lewin Group analysis of HCFA(now known as CMS) Medicaid Drug Rebate Program Data, 1998. 45 States Reporting.
The Use of Atypical Antipsychotics In Medicaid Has Grown Dramatically Since 1995
Exhibit VI-5 depicts national trends in prescriptions for antipsychotics in Medicaid between 1995 and 1998. Overall, antipsychotic prescriptions rose from 9.2 million in 1995 to 11 million in 1998, an increase of nearly 20%. At the same time, total expenditures increased from $484 million in 1995, to $894 million in 1997 and $1.3 billion in 1998, an overall increase of 160% (Exhibit VI-6).
This disproportionate growth in expenditures as compared to prescriptions has been driven by the rapid uptake of newer agents. The data in Exhibit VI-7 also show that since the introduction of risperidone in 1994 and olanzapine in 4th quarter of 1996, there have been steady increases in the number of prescriptions for these agents. These occurred alongside a concomitant decrease in the number of prescriptions for oral haloperidol and phenothiazines both in terms of total prescriptions and in terms of market share. Thus, it appears that the introduction of atypical antipsychotics did not merely replace older therapies, but instead expanded the market for use of these agents as a category.
Exhibit VI-5. Antipsychotic Prescription Trends in Medicaid, 1995-1998
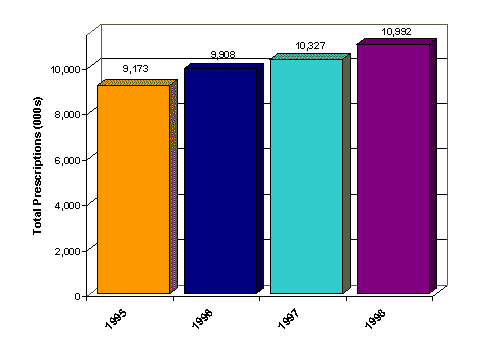
Source: The Lewin Group analysis of HCFA(now known as CMS) Medicaid Drug Rebate Program Data, 1995-1998. 46 States reporting, 1995-1998, 45 States Reporting, 1998.
Exhibit VI-6. Antipsychotic Prescription Trends in Medicaid, Total Expenditures, 1995-1998
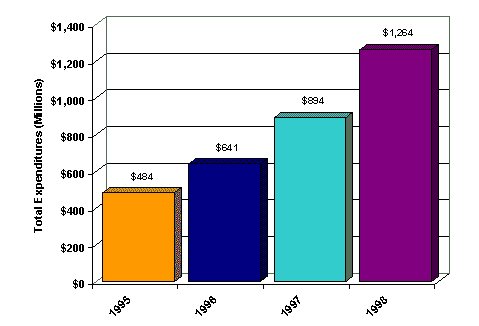
Source: The Lewin Group analysis of HCFA(now known as CMS) Medicaid Drug Rebate Program Data, 1995-1997. 46 States reporting, 1995-1998, 45 States Reporting, 1998.
As shown in Exhibit VI-7, Medicaid prescriptions for risperidone increased from just over 1 million in 1995 (12% of total) to nearly 2.8 million in 1997 (25% of total). Similarly, the diffusion of olanzapine has also been rapid: 43,000 prescriptions were paid for by Medicaid in 1996 (0.5%), while just over 2.1 million prescriptions were covered in 1998 (20%). In contrast, prescriptions for oral haloperidol decreased from 2.1 million in 1995 (23%) to 1.6 million in 1998 (18%), and prescriptions for phenothiazines decreased from 4.2 million in 1995 (47%) to just under 3 million in 1997 (27%).
Clozapine prescriptions also increased between 1995 and 1997, but the rate of growth did not match that of risperidone and olanzapine. Medicaid paid for 506,000 prescriptions of clozapine in 1995 and 590,000 prescriptions in 1997, an increase of nearly 25%. Clozapine prescriptions as a percent of total, however, remained virtually constant at approximately 5.5% during this time period. Clozapine prescriptions dropped in 1998 to 442,000 (4%). This result is not surprising given that clozapine is used almost exclusively for treatment-refractory schizophrenia. The introduction of olanzapine in 1996 likely resulted in physicians moving clozapine to third-line therapy (after both risperidone and olanzapine) in difficult-to-treat patients, resulting in a reduction in the number of clozapine prescriptions. Similarly, use in injectable haloperidol prescriptions remained steady.
Exhibit VI-7. Antipsychotic Prescription Trends in Medicaid by Class, 1995-1998
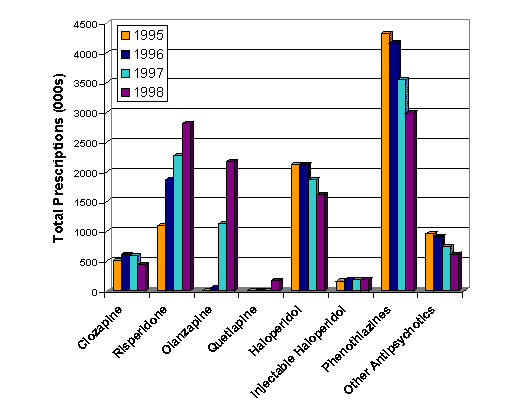
Source: The Lewin Group analysis of HCFA(now known as CMS) Medicaid Drug Rebate Program Data, 1995-1998. 45 States reporting, 1995-1998, 46 States Reporting, 1998.
In 1995, reimbursements for clozapine and risperidone each accounted for 33% of total antipsychotic expenditures (approximately $165 million each, see Exhibit VI-8). Reimbursements for phenothiazines accounted for an additional $101 million, or 20%. In 1996, Medicaid expenditures for risperidone reached $269 million (42%), while expenditures for clozapine increased only slightly to $198 million (31%). Phenothiazines accounted for an additional $103 million, or 16%. In 1998, risperidone expenditures reached $395 million (31%), while olanzapine reached $536 million in Medicaid reimbursements (42%). Spending for clozapine remained nearly constant in the range between $170 million and $192 million. By 1998, the $172 million spent on clozapine by these 45 programs represented only 14% of total expenditures for antipsychotics. This amount represents a smaller share of total spending than in previous years (e.g., in 1995, 21% of antipsychotic expenditures were for clozapine). Phenothiazines accounted for $76 million in 1998, or 6% of total spending.
Exhibit VI-8. Antipsychotic Prescription Trends in Medicaid, Total Expenditures by Class, 1995-1998
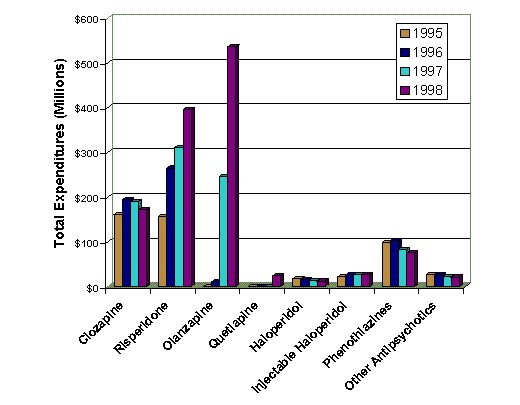
Source: The Lewin Group analysis of HCFA(now known as CMS) Medicaid Drug Rebate Program Data, 1995-1997. 46 States reporting, 1995-1998, 45 States Reporting, 1998.
Patterns of Antipsychotic Utilization in High-Volume States
Recognizing that national data may not be reflective of trends in individual States, utilization trends for 12 high-volume States (in number of prescriptions) in 1998 were analyzed in greater detail. The States included in this analysis were: California, Florida, Georgia, Illinois, Maryland, Massachusetts, Michigan, New Jersey, New York, Ohio, Pennsylvania, and Wisconsin, all of which are among those with the highest utilization and among those interviewed for the present study. (Texas, a state with a large Medicaid population and an interview subject for this study, is excluded because Texas Medicaid reported no pharmaceutical utilization data to HCFA(now known as CMS) in 1998.)
Exhibit VI-9 reports the volume of antipsychotic medications paid for under Medicaid in these twelve high-volume States, which account for 64% of prescription volume for antipsychotics reported by Medicaid programs in 1998. Moreover, the 12 States account for 67% of the total amount reimbursed for antipsychotics in 1998.
Exhibit VI-9. Number of Antipsychotic Prescriptions and Total Amount of Medicaid Reimbursement for 12 High-Volume Prescription States, 1998
| Prescriptions | Expenditures | |||
|---|---|---|---|---|
| State | Number (Thousands) |
% of Medicaid Antipsychotic Rx's |
$ Amount (Millions) |
% of Medicaid Antipsychotic $ |
| CA | 1,401 | 13% | $191 | 16% |
| NY | 1,261 | 11% | $150 | 12% |
| IL | 582 | 5% | $69 | 6% |
| OH | 646 | 6% | $68 | 6% |
| FL | 540 | 5% | $65 | 5% |
| MA | 557 | 5% | $64 | 5% |
| PA | 548 | 5% | $55 | 4% |
| NJ | 372 | 3% | $38 | 3% |
| MI | 330 | 3% | $38 | 3% |
| WI | 304 | 3% | $34 | 3% |
| GA | 300 | 3% | $27 | 2% |
| MD | 195 | 2% | $16 | 1% |
| 12-State Total | 7,036 | 64% | $815 | 67% |
| US Total | 10,992 | 100% | $1,219 | 100% |
Source: HCFA(now known as CMS) Medicaid Drug Rebate Program Data, 1998. 45 States Reporting.
Exhibit VI-10 depicts the share of total antipsychotic utilization in each state for five categories of antipsychotics: clozapine, risperidone, olanzapine, oral haloperidol, phenothiazines, and quetiapine. In interpreting these data, it should be remembered that phenothiazine prescriptions might reflect use for other disorders.
Exhibit VI-10.Market Share of Antipsychotics in 12 High-Volume Medicaid States as a Percent of Total Antipsychotic Prescriptions, 1998
| State | Clozapine | Haloperidol | Olanzapine | Phenothiazines | Quetiapine | Risperidone |
|---|---|---|---|---|---|---|
| CA | 4% | 17% | 20% | 31% | 1% | 19% |
| NY | 3% | 13% | 20% | 29% | 1% | 28% |
| IL | 7% | 15% | 18% | 24% | 3% | 27% |
| OH | 4% | 14% | 21% | 27% | 2% | 25% |
| FL | 3% | 12% | 19% | 28% | 2% | 29% |
| MA | 6% | 12% | 26% | 24% | 2% | 26% |
| PA | 4% | 14% | 19% | 24% | 1% | 30% |
| NJ | 4% | 14% | 18% | 30% | 0% | 28% |
| MI | 7% | 15% | 19% | 24% | 2% | 27% |
| WI | 6% | 14% | 19% | 24% | 2% | 24% |
| GA | 2% | 18% | 14% | 34% | 1% | 21% |
| MD | 3% | 16% | 22% | 25% | 0% | 28% |
Source: Lewin Group Analysis of HCFA(now known as CMS) Medicaid Drug Rebate Program Data, 1998. The columns do not add to 100%. Data for the "Other Antipsychotics" category are excluded in the interest of space and clarity.
The data in Exhibit VI-10 show:
- Phenothiazines were the most frequently prescribed antipsychotic in 5 States (California, Georgia, New Jersey, New York, Ohio).
- Phenothiazines accounted for between 24% (several States) and 31% (CA) of prescriptions.
- Risperidone was the most frequently prescribed antipsychotic in 6 other States (Florida, Illinois, Massachusetts, Maryland, Michigan, Pennsylvania).
- Risperidone accounted for between 19% (CA) and 30% (PA) of total scripts.
- Medi-Cal lagged the rest of its peers in adoption of risperidone.
- In Wisconsin, there were roughly equal numbers of prescriptions for phenothiazines and risperidone in 1998.
- Olanzapine ranked third in total prescriptions in every state except for California, Massachusetts and Georgia. The share of prescriptions accounted for by olanzapine ranged from 14% (Georgia) to 26% (Massachusetts).
- Olanzapine prescriptions outnumbered risperidone prescriptions in Medi-Cal in 1998 by 15,000.
- In Massachusetts, olanzapine prescriptions equaled those for risperidone with 26% of the total each.
- In Georgia olanzapine ranked fourth with only 14% share.
- Haloperidol ranked fourth in every state except Georgia, capturing between 14% and 19% of to prescriptions.
- Clozapine, generally reserved for treatment-refractory cases of schizophrenia, accounted for between 2% (Georgia) and 7% (Illinois, Michigan) of total antipsychotic prescriptions.
- Quetiapine gained no more than 3% market share in any state.
The Uptake of Newer Antipsychotic Agents into Medicaid Immediately Post-Launch has been Rapid
Two antipsychotic agents have been launched in the last two years: olanzapine in the 4th quarter of 1996 and quetiapine in the 4thquarter of 1997. The rates of uptake of each of these two drugs illustrate many of the factors that affect the rate of uptake of a new antipsychotic agent.
As shown in Exhibit VI-11, the rate of uptake of olanzapine has been remarkably fast. From launch in the 4th quarter of 1996, olanzapine gained 8% market share within four full quarters. At the end of the second full year on the market, olanzapine attained a market share of 16% in the 45 Medicaid jurisdictions included in the analysis. This change represents a doubling of the number of prescriptions dispensed over the previous year. In contrast, quetiapine obtained only 4% market share within its first four quarters on the market, only half that of olanzapine.
These results indicate that Medicaid has increasingly accepted atypical antipsychotics, and in recent years has done so rather quickly. These gains in market share for olanzapine and quetiapine occurred in a Medicaid market that was transitioning from typical to atypical antipsychotics. This trend is further evidenced by the fact that from the time of the launch of olanzapine, risperidone market share increased from 17% to 22%, while the number of risperidone prescriptions increased nearly 50%.
There are likely many reasons for the slow uptake of quetiapine relative to olanzapine. First, the uptake of olanzapine was extremely fast by most standards. Furthermore, quetiapine was the third entrant in to the field of second generation, relatively undifferentiated atypical antipsychotics. As a result, clinicians may have been reluctant to learn to use a third new agent that did not offer any clear advantages over familiar therapies (i.e., risperidone, and olanzapine). Finally, the fact that the manufacturer of quetiapine, Zeneca (now AstraZeneca) was relatively inexperienced at marketing pharmaceuticals to the mental health services sector likely slowed diffusion of quetiapine even further.
Exhibit VI-11. Uptake of Newer Antipsychotic Medications in Medicaid and Growth of Prescription Volume 1996-1998
| Year | Qtr | Olanzapine | Quetiapine | Risperidone | |||
|---|---|---|---|---|---|---|---|
| Prescriptions (000s) |
Share | Prescriptions (000s) |
Share | Prescriptions (000s) |
Share | ||
| 1996 | 4 | 1,282 | 1% | 23,496 | 17% | ||
| 1997 | 1 | 5,177 | 4% | 24,676 | 17% | ||
| 1997 | 2 | 9,024 | 6% | 26,967 | 18% | ||
| 1997 | 3 | 11,517 | 8% | 26,688 | 18% | ||
| 1997 | 4 | 13,487 | 10% | 26,534 | 19% | ||
| 1998 | 1 | 17,164 | 12% | 422 | 0% | 29,634 | 20% |
| 1998 | 2 | 21,332 | 13% | 337 | 0% | 33,476 | 20% |
| 1998 | 3 | 23,732 | 15% | 5,381 | 3% | 33,883 | 21% |
| 1998 | 4 | 25,487 | 16% | 6,925 | 4% | 35,155 | 22% |
Source: The Lewin Group analysis of HCFA(now known as CMS) Medicaid Drug Rebate Program Data, 1998. 45 States Reporting.
D. Utilization of Antidepressants in Medicaid, 1995-1998
The American Hospital Formulary lists over 30 different agents that are classified as antidepressants. Most of these belong to the general class of tricyclic antidepressants. For the purposes of this analysis, antidepressant medications were grouped into 12 general categories as indicated in Exhibit VI-12 below.
Exhibit VI-12. Antidepressant Classes
| Generic Name | Examples and Brand Names |
|---|---|
| Citalopram | CelexaTM |
| Fluoxetine | Prozac® |
| Fluxvoxamine | Luvox® |
| Paroxetine | Paxil® |
| Sertraline | Zoloft® |
| Tricyclic Antidepressants (Representative) | Amitriptyline (Elavil®) Desipramine (Norpramin®) Imipramine (Tofranil®) Nortriptyline (Pamelor®) |
| Trazodone | Desyrel® |
| Monoamine Oxidase Inhibitors (MAOIs) | Phenelzine (Nardil®) Tranylcypromine (Parnate®) |
| Bupropion | Wellbutrin® Wellbutrin® SR Zyban® |
| Mirtazapine | Remeron® |
| Nefazadone | Serzone® |
| Venlafaxine | Effexor®, Effexor® XR |
In 1998, 62% of the 19 Million Medicaid Antidepressant Prescriptions were for New-Generation, Branded Antidepressants
-
In 1998, Medicaid programs in these 45 States paid for over 19 million prescriptions for antidepressants. Exhibit VI-13 shows the market share in Medicaid for each class of antidepressant in 1998. The selective serotonin reuptake inhibitors (SSRIs) citalopram, fluoxetine, fluvoxamine, paroxetine, and sertraline comprised 48% of total antidepressant prescriptions in 1998. Prescriptions for the three leading agents (fluoxetine, paroxetine, and sertraline) were nearly equal with approximately 3 million prescriptions each, or a 15-16% share each. Tricyclic antidepressants accounted for 27% of total prescriptions, or approximately 5 million prescriptions. Trazodone, with 2.2 million prescriptions in 1998, took 12% of the market. The four other new generation antidepressants (bupropion, mirtazapine, nefazadone, and venlafaxine) together accounted for 14% of prescriptions or approximately 2.7 million prescriptions. In total, new generation antidepressants accounted for over 62% of all prescriptions in Medicaid in 1998.
In dollar terms, these 19 million prescriptions corresponded to expenditures of nearly 1 billion dollars ($985 million). As seen in Exhibit VI-14, fluoxetine, while comprising only 15% of all Medicaid antidepressant prescriptions, accounted for 30% ($288 million) of all Medicaid spending for antidepressants in 1998 -- the highest among all antidepressants. The cost of fluoxetine is far greater than one would expect by making market share comparisons to similar agents. For example, sertraline accounted for more prescriptions in 1998 than fluoxetine, but spending for sertraline reached only $214 million (23% of all Medicaid dollars reimbursed for antidepressants in 1998). Similarly, dollars spent on paroxetine comprised only $199 million (20% of all Medicaid dollars spent on antidepressants in 1998) while the number of prescriptions was roughly equal to that of fluoxetine. Together, fluoxetine, sertraline and paroxetine comprised over 70% of all Medicaid spending on antidepressant drugs in 1998 ($711 million). While TCAs made up one-quarter of all prescriptions in 1998, they accounted for only 5% of all Medicaid dollars reimbursed for antidepressants ($54 million). The other new antidepressants bupropion, venlafaxine, nefazadone, and mirtazapine together accounted for expenditures of approximately $173 million or 18% of total expenditures, while capturing 14% of total prescriptions.
The data in Exhibits VI-13 and VI-14 are depicted in tabular form in Exhibit VI-15.
The Use of New-Generation Antidepressants in Medicaid Grew Dramatically Between 1995 and 1998
Exhibit VI-16 depicts national trends in prescriptions for antidepressants in Medicaid between 1995 and 1998. Overall, prescriptions for antidepressants increased substantially in this period. Antidepressant prescriptions increased from 13.7 million in 1995 to 19.3 million in 1998, an increase of over 40%. Exhibit VI-17 reports trends in Medicaid expenditures for antidepressants between 1995 and 1998. Total expenditures increased steadily from $500 million in 1995, to $630 million in 1996, to $760 million in 1997 and to $985 billion in 1998--an average increase of 25% per year, and an overall increase of 96%. Much of this increase can be attributed to the steady, yet significant rise of the three leading SSRI antidepressants.
Prescriptions increased for every class of antidepressant except for TCAs and MAOIs. These trends are shown in Exhibit VI-18. Prescriptions for sertraline and fluoxetine increased by approximately 45% each, from already substantial bases in 1995. Sertraline prescriptions increased from just over 2 million in 1995 to just over 3 million in 1998. Fluoxetine prescriptions increased from just over 2 million in 1995 to just fewer than 3 million in 1998. Paroxetine prescriptions increased from 1.2 million in 1995 to 2.9 million in 1998, an increase of 130%. Fluvoxamine experienced more than a four-fold increase in prescriptions from 1995 to 1998 (72,885 to 306,967, an increase of 321%) while bupropion prescriptions increased 264%. Prescriptions for venlafaxine doubled over the same period. During the same period, prescriptions for TCAs fell from 6 million prescriptions in 1995 to 5 million in 1998.
Exhibit VI-13. Market Share of Antidepressant Classes in 45 Medicaid States, 1998. Total Prescriptions = 19 Million
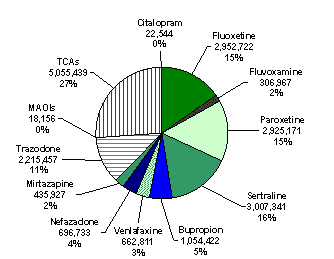
Source: The Lewin Group analysis of HCFA(now known as CMS) Medicaid Drug Rebate Program Data, 1998. 45 States Reporting.
Exhibit VI-14. Market Share of Antidepressant Classes in 45 State Medicaid Programs, 1998. Total Expenditures = $985 Million
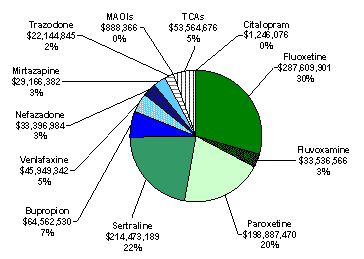
Source: The Lewin Group analysis of HCFA(now known as CMS) Medicaid Drug Rebate Program Data, 1998. 45 States Reporting.
Exhibit VI-15. Share of Medicaid Antidepressant Prescriptions and Expenditures by Class, 1998
| Prescriptions | Expenditures | |||
|---|---|---|---|---|
| Class | Number (000s) |
% of Medicaid Antidepressant Rx's |
$ (Millions) |
% of Medicaid Antidepressant $ |
| Fluoxetine | 2953 | 15% | $288 | 29% |
| Fluvoxamine | 307 | 2% | $34 | 3% |
| Paroxetine | 2925 | 15% | $199 | 20% |
| Sertraline | 3007 | 16% | $214 | 22% |
| Bupropion | 1054 | 5% | $64 | 7% |
| Venlafaxine | 663 | 3% | $45 | 5% |
| Nefazadone | 697 | 4% | $33 | 3% |
| Mirtazapine | 436 | 2% | $29 | 3% |
| Trazodone | 2215 | 11% | $22 | 2% |
| MAOIs | 18 | 0% | $1 | 0% |
| TCAs | 5055 | 26% | $54 | 5% |
| All Antidepressants | 19,354 | 100% | $985 | 100% |
Source: The Lewin Group analysis of HCFA(now known as CMS) Medicaid Drug Rebate Program Data, 1998. 45 States Reporting.
Exhibit VI-16. Antidepressant Prescription Trends in Medicaid, 1995-1998. Total Prescriptions in Thousands
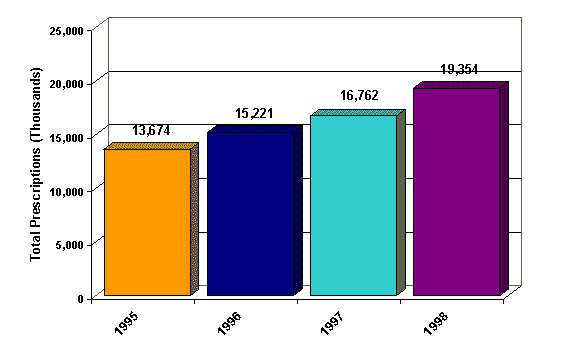 Source: The Lewin Group analysis of HCFA(now known as CMS) Medicaid Drug Rebate Program Data, 1995-1998. 46 States reporting, 1995-1997, 45 States Reporting, 1998.
Exhibit VI-17.Antidepressant Prescription Trends in Medicaid, 1995-1998. Expenditures in Millions
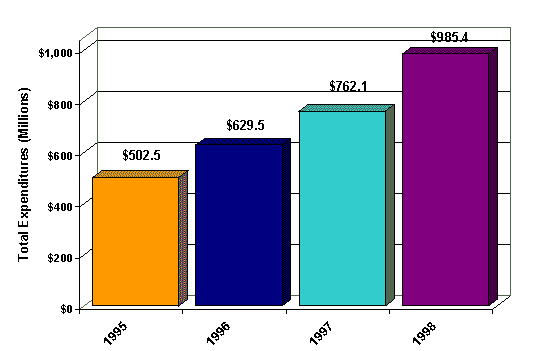 Source: The Lewin Group analysis of HCFA(now known as CMS) Medicaid Drug Rebate Program Data, 1995-1998. 46 States reporting, 1995-1997, 45 States Reporting, 1998.
The data in Exhibit VI-18 also show that since the introduction of nefazadone in 1995 and mirtazapine in 1996, there have been steady increases in the number of prescriptions for these agents. By the end of its second year on the market, nefazadone claimed 697,000 prescriptions, nearly 4% of the market, while mirtazapine claimed 436,000 prescriptions or almost 3%. In addition, in its first quarter on the market (Q4, 1998) citalopram accumulated 22,544 prescriptions. Industry reports have indicated that citalopram claimed 10% of the SSRI market by November 1999, making it the forth most successful pharmaceutical launch in history43 It is unclear how citalopram has been received by Medicaid, however, as 1999 data was not available at the time of this study.
Exhibit VI-18. Antidepressant Class Prescription Trends in Medicaid 1995-1998. Total Prescriptions in Thousands
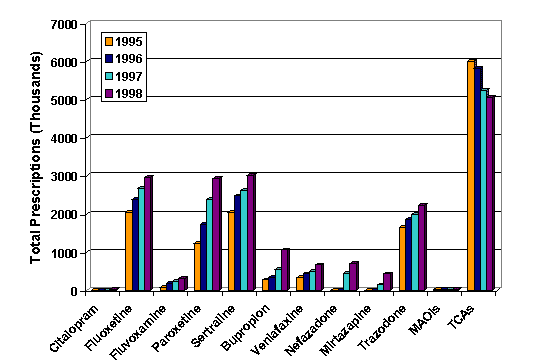
Source: The Lewin Group analysis of HCFA(now known as CMS) Medicaid Drug Rebate Program Data, 1995-1998. 46 States reporting, 1995-1997, 45 States Reporting, 1998.
As shown in Exhibit VI-19, expenditures for paroxetine increased nearly three-fold (an increase of $128 million over four years), while expenditures for fluoxetine increased 73% ($120 million), and expenditures for sertraline increased 64% ($84 million). Expenditures for venlafaxine, bupropion, and nefazadone enjoyed large percentage increases over these years, but, as lower-volume antidepressants, the total reimbursed for these agents was not nearly as large as the total for the three leading agents. Expenditures for bupropion increased nearly 3-fold between 1997 and 1998, likely reflecting increased use of this agent as an aid to smoking cessation (a new indication for bupropion in 1997). In terms of dollars reimbursed, only TCAs fell significantly, from $77 million in 1995, to $67 million in 1996, to $54 million in 1997 and 1998.
As the total amount reimbursed for antidepressants increased steadily over this period, the market share of each of the antidepressant classes remained fairly constant during the years 1995 to 1998. With the largest share of the market, fluoxetine's share fell somewhat: from 33% in 1995 and 1996 to 32% in 1997 and to 29% in 1998. Likewise, sertraline, accounting for the second largest share of expenditures, also saw its share fall slightly, from 26% in 1995 to 22% in 1998. Expenditures for TCAs' fell as a percentage of total costs as well: from 15% in 1995 to 5% in 1998. Among the high-volume antidepressants, only paroxetine experienced an increase in terms of total share of Medicaid expenditures. Expenditures for paroxetine increased from 14% of total in 1995 to 20% in both 1997 and 1998. Bupropion, while beginning from a much lower dollar base in 1995, saw its Medicaid market share rise from 2% in 1995 to 6% in 1998.
Exhibit VI-19. Antidepressant Class Prescription Trends in Medicaid, 1995-1998. Total Expenditures in Millions
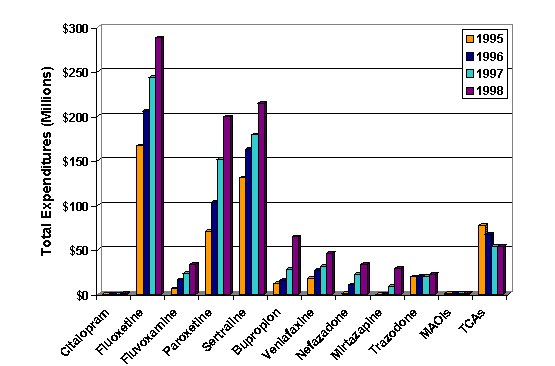 Source: The Lewin Group analysis of HCFA(now known as CMS) Medicaid Drug Rebate Program Data, 1995-1998. 46 States reporting, 1995-1997, 45 States Reporting, 1998.
Patterns of Antidepressant Utilization in High-Volume States
Recognizing that national data may not be reflective of trends in individual States, utilization trends for 12 high-volume States (in number of prescriptions) in 1998 were analyzed in greater detail. The States included in this analysis are: California, Florida, Georgia, Illinois, Maryland, Massachusetts, Michigan, New Jersey, New York, Ohio, Pennsylvania, and Wisconsin. These States are among those both with the highest utilization and those interviewed for the present study. Texas, a state with a large Medicaid population and an interview subject for this study, is excluded because Texas Medicaid reported no pharmaceutical utilization data to HCFA(now known as CMS) in 1998.
Exhibit VI-20 reports the volume of antidepressant medications paid for under Medicaid in these 12 high-volume States. These 12 States alone comprise 58% of prescription volume and 59% of the total amount reimbursed for antidepressants reported by Medicaid programs in 1995-1998.
Exhibit VI-20. Number of Antidepressant Prescriptions and Total Amount of Medicaid Reimbursement for 12 High Volume States, 1995-1998
| Prescriptions | Expenditures | ||||
|---|---|---|---|---|---|
| State | Number (000s) |
% | $ Amount (Millions) |
% | Cost per Prescription |
| CA | 1,903 | 10% | $260 | 10% | $137 |
| NY | 1,733 | 9% | $272 | 10% | $157 |
| OH | 1,183 | 6% | $159 | 6% | $134 |
| PA | 988 | 5% | $169 | 5% | $171 |
| MA | 1,195 | 6% | $172 | 6% | $144 |
| FL | 977 | 5% | $134 | 5% | $137 |
| IL | 808 | 4% | $108 | 4% | $134 |
| MI | 601 | 3% | $102 | 3% | $170 |
| GA | 549 | 3% | $74 | 3% | $135 |
| WI | 489 | 3% | $68 | 2% | $139 |
| NJ | 415 | 2% | $71 | 2% | $171 |
| MD | 261 | 1% | $38 | 1% | $146 |
| 12-State Total | 11,104 | 58% | $1,629 | 59% | $147 |
| US Total | 19,255 | 100% | $2,726 | 100% | $142 |
Source: HCFA(now known as CMS) Medicaid Drug Rebate Program Data, 1995-1998. 46 States reporting, 1995-1998, 45 States Reporting, 1998.
At first glance it would appear that there are some unexpected trends in the data. For example, Massachusetts Medicaid, a relatively small state program, paid for more prescriptions than did programs in much larger States including Pennsylvania and Illinois. Similarly, Medi-Cal only covered marginally more prescriptions than did New York Medicaid, a program half its size.
These apparent anomalies likely reflect a variety of programmatic differences among the Medicaid programs in these states. Although a comprehensive analysis of these differences is beyond the scope of this study, we believe that factors that influence these differences include:
- The population eligible for Medicaid and/or Medicaid Managed Care in each state;
- The penetration of Managed Care into a State's Medicaid population; and
- The financing arrangements for pharmaceutical coverage within states that have managed care programs (i.e., full capitation, partial capitation, or fee for service).
It is reasonable that managed care arrangements affect the utilization of pharmacy services for antidepressants more so than for antipsychotics. This is because whereas most persons with diagnoses of schizophrenia meet the criteria for classification as disabled, only a small portion of those with depression experience a severe enough episode to meet this designation. Most states exclude disabled persons from full capitation Medicaid Managed Care programs. Patients who use antidepressants may have a range of illnesses including depression, dysthymia, and anxiety disorders. The severity of these illnesses may cause a patient to become disabled. However, this is not usually the case. Therefore, many patients who at some time in their care require an antidepressant may be enrolled in a full-capitation Medicaid Managed Care program. As many of these programs have in the past covered prescription medications, prescriptions for these patients are effectively removed from the data reported to HCFA(now known as CMS).
Because of the difficulty in precisely determining the number of Medicaid eligibles who receive pharmaceutical benefits through their managed care plans, a more interesting measure of the utilization of antidepressants in Medicaid populations is the average cost per prescription. As shown in the final column of Exhibit VI-20, the cost per prescription ranges from a low of $134 per prescription in Ohio and Illinois, to a high of $171 in New Jersey and Pennsylvania. Other "low cost" States include Georgia ($135) and California ($137). Other high cost States include Michigan ($170). The difference in average prescription cost is not large and cannot by itself serve as an indicator of the utilization of newer or older agents.
Exhibit VI-21 depicts the share of total antidepressant utilization in each of the several classes of antidepressants: three high-volume SSRIs (fluoxetine, paroxetine, and sertraline), SSRIs as a class (including citalopram and fluvoxamine), the combined class of "other new antidepressants" (i.e., bupropion, mirtazapine, nefazadone, and venlafaxine) trazadone, and TCAs. MAOIs are excluded because they do not constitute a relevant percentage of the total. In brief, Exhibit VI-21 shows:
- Utilization of all new-generation antidepressants ranges between a low of 51% in California to a high of 69% in New Jersey.
- New generation antidepressants accounted for less than 65% of total prescriptions only in California (51%), Maryland (62%), and Illinois (58%).
- SSRIs account for between 42% (California) and 53% (New Jersey) of total antidepressant prescriptions.
- SSRIs account for 52% of prescriptions in Florida, Maryland, New York, and Pennsylvania.
- The other new antidepressants account for between 9% (California) and 17% (Michigan, Massachusetts) of total prescriptions.
- TCAs are the most commonly-prescribed antidepressants in California, where they account for 35% of all prescriptions, fully 5% greater market share than in the next highest state (Georgia, 30%). In other States, TCAs account for between 19% (Massachusetts) and 26% (Illinois).
- Sertraline is the most commonly prescribed antidepressant in every state except for California, where it is not on formulary, and New York (where it is slightly outpaced by fluoxetine).
- In these States, sertraline prescriptions account for between 16% and 19% of total prescriptions
- In California sertraline prescriptions account for only 3% of prescriptions.
- Paroxetine is the most commonly prescribed antidepressant in California, where it accounts for 20% of prescriptions.
- Fluoxetine is the most-commonly prescribed in New York, where it accounts for 17% of total prescriptions.
- Maryland has the lowest rate of prescribing for fluoxetine, where it accounts for only 13% of the market.
Exhibit VI-21. Market Share of Antidepressants in 12 High-Volume Medicaid States as Percent of Total Prescriptions, 1998
| State | Fluoxetine | Paroxetine | Sertraline | All SSRIs |
Other New |
All New |
TCAs |
|---|---|---|---|---|---|---|---|
| CA | 18% | 20% | 3% | 42% | 9% | 51% | 35% |
| NY | 17% | 17% | 17% | 52% | 16% | 68% | 23% |
| IL | 16% | 13% | 16% | 46% | 12% | 58% | 30% |
| OH | 15% | 14% | 19% | 49% | 16% | 65% | 26% |
| FL | 16% | 14% | 17% | 48% | 17% | 65% | 19% |
| MA | 15% | 16% | 19% | 52% | 13% | 65% | 22% |
| PA | 16% | 14% | 19% | 50% | 17% | 67% | 23% |
| NJ | 14% | 18% | 19% | 53% | 16% | 69% | 22% |
| MI | 17% | 16% | 17% | 52% | 14% | 66% | 25% |
| WI | 15% | 14% | 19% | 50% | 16% | 66% | 22% |
| GA | 16% | 15% | 19% | 52% | 16% | 68% | 21% |
| MD | 13% | 15% | 18% | 48% | 14% | 62% | 25% |
Source: HCFA(now known as CMS) Medicaid Drug Rebate Program Data, 1998. 46 States reporting, 1995-1998, 45 States Reporting, 1998.
E. Comparison of Psychotherapeutic Utilization with Utilization of Other Drug Classes
A primary concern of this study has been to determine whether newer psychotherapeutics are subject to more stringent utilization controls than are other classes of pharmaceuticals. In this section, we compare the utilization of psychotherapeutics with the utilization of other classes of pharmaceuticals that have seen the introduction of newer agents in recent years.
The new oral antidiabetic agents make constitute an excellent comparator group to psychotherapeutics for a number of reasons:
- Diabetes represents a major cost center for health care payers, as does mental health;
- Pharmacotherapy for diabetes and mental illness is always a long-term commitment;
- New pharmacologic agents, representing new mechanisms of action, entered a therapeutic area dominated by generics; and
- These new antidiabetic agents were introduced during the same time period as the atypical antipsychotics (1994-1997).
The oral antidiabetics included in this analysis are described in Exhibit VI-22, below.
Exhibit VI-22. Oral Antidiabetic Categories
| Generic Name | Examples and Brand Names | Launch Date |
|---|---|---|
| Acarbose | Precose® | 1995 |
| Glimepiride | Amaryl® | 1995 |
| Glipizide (extended release) | Glucotrol® XL | 1994 |
| Metformin | Glucophage® | 1995 |
| Repaglinide | Prandin® | 4th quarter 1997 |
| Troglitazone | Rezulin® | 1st quarter 1997 |
| Generic Sulfonyl Ureas (Representative) Acetohexamide Chlorpropamide Glipizide Glyburide |
Dymelor® Diabinese® Gluotrol® DiaBeta®, Micronase® |
Prior to 1995 |
Medicaid prescriptions for oral antidiabetic agents increased from 4.1 million in 1995 to 7.6 million in 1998, an increase of 82%. At the same time, expenditures for these agents increased nearly 3-fold, increasing from $114 million in 1995 to $311 million in 1998.
Proportionally, the increase in spending for oral antidiabetics was far smaller than the increase observed for the psychotherapeutic classes. Exhibit VI-23 shows the ratio between the percentage increase in expenditures and the percentage increase in total prescriptions between 1995 and 1998 for the three classes, antipsychotics, antidepressants, and oral antidiabetics. The results show that the ratio between the increase in expenditures and the increase in prescriptions is 8.0 for antipsychotics. (It should be remembered that clozapine prescriptions were relatively flat during this time, and therefore the increase in cost is largely attributable to other new agents.) For antidepressants this ratio is 2.4, whereas for oral antidiabetics this ratio is 2.1. These data show that the cost (in terms of pharmaceutical expenditures) of converting to newer agents is far greater for antipsychotics than it is for either antidepressants or oral antidiabetics. However, the cost for converting to newer antidepressants is only marginally greater than that for oral antidiabetics.
Exhibit VI-23. Comparison of Increase in Prescriptions and Expenditures for 3 Pharmaceutical Classes in Medicaid, 1995-1998
| Class | % Increase in Prescriptions |
% Increase in Expenditures |
Ratio |
|---|---|---|---|
| Antipsychotics | 20% | 160% | 8.0 |
| Antidepressants | 40% | 96% | 2.4 |
| Oral Antidiabetics | 82% | 172% | 2.1 |
Source: HCFA(now known as CMS) Medicaid Drug Rebate Program Data, 1995-1998. 46 States reporting, 1995-1998, 45 States Reporting, 1998.
In spite of this difference in cost it appears that newer oral antidiabetics have replaced older agents only marginally faster than atypical antipsychotics have replaced traditional antipsychotics. In 1995, only 11% of all prescriptions for oral antidiabetics were for an agent other than a generic sulfonyl urea, by 1998, 55% of all prescriptions were for a newer agent. In contrast, whereas in 1995, only 16% of all antipsychotic prescriptions were for an atypical agent, in 1998, 51% of antipsychotic prescriptions were for an atypical antipsychotic.
Chapter VII. Pharmacoeconomics of Newer Antidepressant and Antipsychotic Medications
As health care in the United States has become increasingly cost-conscious, providers are increasingly encouraged not only to consider the outcomes of treatment alternatives, but also to consider and justify costs. Similarly, payers have begun to examine the interaction of cost and effectiveness more carefully. The cost-effectiveness of newer antidepressants44-49 and antipsychotics50-52 has been the subject of several recent reviews. In addition, numerous reviews of individual agents exist.53-58 The following review of the cost-effectiveness literature is designed to provide a high-level overview of the subject and the principal conclusions. The reader is referred to the reviews cited above for more detailed information.
In brief, the following limited review of the literature found:
Antidepressants
The literature provides no consistent differences in total treatment costs associated with the use of different antidepressant agents, although individual studies have claimed that one particular agent is superior to another.
- The vast majority of studies are sponsored by pharmaceutical manufacturers.
- Most of these studies have found that treatment with the pharmaceutical manufactured by the sponsor is no more costly than treatment with comparative agents.
- It is unlikely that manufacturers would allow publication of a study that found a negative result for their agent.
- However, results from studies sponsored by manufacturers do not differ substantially from those obtained from studies sponsored by independent or government sources.
Several case studies have found that treatment with newer agents is cost-saving compared to treatment with older agents, although a few other studies have found the converse to be true. If differences do exist, it might be said that modest evidence exists for SSRIs being more cost-effective than TCAs.
- Antidepressant treatment with fluoxetine may yield lower costs than treatment with TCAs -- particularly for post-initiation therapy. Stronger evidence exists, however, for greater compliance with fluoxetine than with TCAs.
- Studies on the costs of paroxetine relative to imipramine are inconclusive; however the evidence is strong for greater compliance or treatment continuation for paroxetine.
- Treatment with sertraline may result in lower total costs than treatment with TCAs. One study also asserts that sertraline is more effective than TCAs. Taken together, it is reasonable to conclude that treatment with sertraline is more cost-effective than treatment with TCAs.
- The evidence on venlafaxine tends to suggest that treatment with venlafaxine is more cost-effective than treatment with either TCAs or trazadone.
- Although two studies differ on the relative costs of treatment with nefazodone, both studies do suggest that treatment with nefazodone is more cost-effective than treatment with imipramine.
The pharmacoeconomic evidence on the SSRI studies makes it reasonable to conclude that no clear distinctions exist between these SSRIs--fluoxetine, sertraline and paroxetine--with respect to either costs or cost-effectiveness of treatment. Data claiming cost superiority for venlafaxine over SSRIs is of insufficient quantity to be convincing.
In numerous cases researchers have failed to find a difference between treatment groups.
Patient compliance with the newer antidepressants is considerably better than with the old. To that effect, the newer antidepressants may be more cost-effective than the older antidepressants, particularly over longer courses of therapy.
These studies do not support the preferred use of older agents (i.e., TCAs) as a valid method of cost-containment, if total health-systems cost are to be included.
Antipsychotics
Evidence from the pharmacoeconomic literature shows that treatment using the new antipsychotics exhibits economic advantages over treatment using the older antipsychotics. This evidence for olanzapine and clozapine is superior to the corresponding evidence for risperidone.
- The limited models comparing risperidone and clozapine to the older antipsychotics suggest that, despite their higher medication costs, risperidone and clozapine may be more cost-effective than older antipsychotics (e.g., haloperidol) in the treatment of schizophrenia.
- The pharmacoeconomic evidence on risperidone versus typical antipsychotics presents no clear advantage for risperidone in terms of efficacy; although on balance, risperidone may have a slight edge in cost-effectiveness.
- Olanzapine appears to be more cost-effective than haloperidol in the treatment of schizophrenia.
- The manufacturers of quetiapine have carefully designed a naturalistic comparative pharmacoeconomic trial in order to compare quetiapine to usual care. No results are yet available from this trial.
- The results of numerous studies together provide strong evidence of clozapine's superior cost-effectiveness relative to older, typical antipsychotics in treatment-resistant schizophrenia.
The paucity of well-designed studies precludes drawing any conclusions regarding relative pharmacoeconomic differences among atypical antipsychotics.
- Current inconsistencies regarding the dosages in the 2nd generation atypical antipsychotics head-to-head (risperidone vs. olanzapine) studies render the evidence inconclusive as to which agent is more cost-effective.
A. Overview of Pharmacoeconomics
The term "cost-effectiveness" has been broadly applied to several methods of pharmacoeconomic analysis which compare the clinical and/or quality of life outcomes and costs associated with competing pharmacological agents. Measurements used in pharmacoeconomic analyses of the newer psychotropic therapies include cost-of-illness, cost-minimization, cost-effectiveness, cost-benefit, and cost-utility. The principal difference among these types of analyses are outlined in Exhibit VII-1 below.
In addition to differences in analysis strategy, pharmacoeconomic studies vary by method of data collection. Although stand-alone medical outcomes or economic measurements collected during randomized clinical trials (i.e., "piggyback" trials) are the "gold-standard" for pharmacoeconomic analyses, these are expensive to conduct and have not been widely implemented in the study of mental health. Retrospective or prospective medical claims analysis and decision-analytic economic models are far more common.59
Exhibit VII-1. Comparison of Pharmacoeconomic Methodologies
| Measurement | Definition |
|---|---|
| Cost-of-illness | Examines all direct and indirect costs of an illness to a population |
| Cost-minimization | Assumes equivalent outcomes and compares costs of treatment to determine which is least costly |
| Cost-effectiveness | Compares the costs of treatments with the health benefits derived; frequently addresses cost optimization more than reduction (measures marginal cost per unit of improved outcome) |
| Cost-benefit | Converts all costs, benefits, and negative effects to monetary units ($) to determine which treatment has the lowest cost-to-benefit ratio |
| Cost-utility | Applies preferences values to outcomes in cost-effectiveness studies; examines effects on length and quality of life, using such outcomes as the quality-adjusted life-year (QALY) |
Adapted from Conner et al 1999.44
To date, few well-designed pharmacoeconomic studies have been conducted to evaluate the cost-effectiveness of the newer antipsychotic and antidepressant medications compared to conventional therapies. Although experts emphasize the superiority of large-scale, prospective, comparative studies in pharmacoeconomic evaluation,59 the majority of studies use less reliable, and perhaps more convenient methods of economic analysis.
Analysis of claims from a health care payer can take one of several approaches. If the comparison groups are used concurrently in clinical practice, it may be possible to identify patients who have taken either therapy and analyze average costs between treatment groups. The majority of economic studies to date in the literature are uncontrolled retrospective historical analyses which estimate cost-savings for competing treatments. In these studies the researchers examine the costs of treatment (and other outcomes) one year prior to and one to two years following treatment with the study medication. In the pre-study phase, patients may have been treated with one of several therapeutic strategies. For this reason, such studies lack a true control group, making it difficult to attribute cost and clinical outcomes to a specific course of therapy.
Decision-analytic models are a convenient tool to estimate the true cost-effectiveness of treatment over a lifetime. However, these models rely heavily on clinical and economic assumptions because good evidence on lifetime costs and utilities are not currently available.53 Sensitivity analyses that adjust the clinical and economic outcomes probabilities are essential to demonstrating the validity of these models. This is especially true when one outcome parameter may be ill-defined or where these parameters may be obtained from studies that are not strictly applicable to a real-world setting.
Until the mid to late 1990's, retrospective, often uncontrolled, historical analyses were most common in evaluating cost-effectiveness of newer antipsychotics, whereas retrospective reviews of health care payer claims were most common for evaluating cost-effectiveness of newer antidepressants. A small number of large-scale real-world effectiveness trials have recently been conducted or are currently in progress for both antidepressants and antipsychotics.
In the 13 years since the initial launch of bupropion in the United States, physicians and patients have rapidly adopted new-generation antidepressant and antipsychotic medications as first-line treatments for depressive and psychotic illnesses. These new agents have provided treatment alternatives to established therapies such as the tricyclic antidepressants (TCAs) and the typical antipsychotics that had been in use for more than two decades. These new agents have also brought with them price tags that are substantially larger than those associated with the agents they hoped to replace.
Although it has been broadly assumed in the popular understanding that new generation antidepressant and antipsychotic medications are more effective than the older generations, the argument for their use, based on efficacy alone, is far from clear. A recent meta-analysis of antidepressant agents published by the Agency for Health Care Policy and Research concluded that SSRIs and other new-generation antidepressants are no more effective than TCAs.60 As a result, the rationale for the use of these newer (and more expensive) agents has rested on arguments surrounding ease of use, tolerability, general safety, safety in overdose (i.e., easy of suicide attempts), and (perhaps consequently) net cost-savings to the total health care system. Indeed, Hylan and coworkers warn that compliance with therapy by a patient depends on the particular pharmaceutical used itself, and therefore assuming equal efficacy as a result of equal use is not tenable.48
B. The Cost-Effectiveness of Newer Antidepressant Medications
The Cost of Depressive Illness in the United States
Any understanding of the cost-effectiveness of a medical therapy must be based on both the cost of the illness being treated as well as the effectiveness of the therapy. Several cost of illness studies on depressive or affective disorders have been conducted in the US. One estimate placed the cost of affective disorders in 1990 at $30.4 billion, an increase of 46% over 1985.61 Medications accounted for approximately 2% of the $406 million direct medical costs in this study. These researchers also estimated that in 1985, the U.S. lost $6 billion in indirect costs, largely due to deaths related to these disorders.
Another study estimated that the total cost of depressive disorders in the U.S. was $43.7 billion. 62 Of this amount, direct medical costs accounted for more than $12 billion, with $7.5 billion lost to indirect costs. The cost of medications was estimated at $1.17 billion, or approximately 10% of direct medical costs. Note, however, that both of these studies were conducted before the introduction of most of the antidepressant agents of interest in this report.
Pharmacoeconomic Analyses of Specific Pharmaceutical Agents
The Lewin Group identified 40 studies that evaluate the pharmacoeconomics of newer antidepressant medications to a reliable level of rigor. Twenty-nine studies compare newer antidepressants to older antidepressants; 11 studies compare newer antidepressants to other newer antidepressants. The majority of these studies are retrospective analyses of claims data from health care payers, predominantly managed care plans. Several other studies are decision-analytic models that incorporate both claims data, the results of randomized clinical efficacy trials, and the results of expert panel interviews. Finally, a small number of studies are prospective, randomized economic clinical trials conducted either in a naturalistic health care setting or as a "piggy back" to a clinical trial.
On balance, the literature shows that there is no overall difference in total treatment costs associated with the use of different pharmaceutical agents, although individual studies have claimed that one particular agent is superior to another. In some cases, studies have found that treatment with newer agents is cost-saving compared to treatment with older agents, whereas in others the reverse has been shown to be true. In numerous cases, researchers have failed to find a difference between treatment groups.
The majority of these studies have been sponsored by pharmaceutical manufacturers. As a result, one might expect publication bias to color the results. In fact, in all the studies reviewed below, treatment with the agent manufactured by the sponsor appears to be at least no more costly in terms of total direct medical costs than treatment with the comparative agents. The claim that one newer agent is economically superior over another may appear inherently specious if the study is sponsored by the manufacturer claiming superiority. However, the result that treatment with new-generation antidepressants is at worst no more costly in terms total direct medical costs than treatment with older agents is confirmed by studies sponsored by government agencies or other third parties.
The following discussion is limited to studies conducted from the perspective of the US healthcare system. Reference is made to studies conducted in other countries when they are of very high quality or the results compare and contrast to those for the US.
- Newer Antidepressants Compared to Older Antidepressants
- SSRIs as a Class
Smith and Sherrill found that cost of treatment of depressed patients in TennCare with SSRIs or with TCAs did not differ substantially.63 This retrospective 12-month analysis of claims from a U.S. Medicaid agency (TennCare) compared total costs incurred 76 patients treated with an SSRI (fluoxetine, paroxetine, or sertraline) and 76 patients treated with a TCA. All patients had a confirmed diagnosis of major depressive disorder (ICD-9 code 296.2, 296.3) or depression not elsewhere classified (ICD-9, 311). The total cost for depression-related treatment for a patient treated with an SSRI was $54,164, whereas for those treated with a TCA this cost was $55,838. Because this difference did not achieve statistical significance, the authors concluded that the cost of treating depression was identical between the two treatment groups. It is worth noting that patients covered by the Medicaid agency whose claims were used had been required to experience two treatment failures prior to initiating SSRI therapy. It is therefore possible that the SSRI patients in this study were inherently more difficult to treat than were the TCA patients.
Boyer and Feigner found that treatment of depressed patients with an SSRI led to substantially lower costs than treatment with a TCA when both short-term and maintenance costs were considered.64 Total costs were lower even though total pharmaceutical costs were much higher for the SSRI group. Their model compared direct costs over a six-month period of initial treatment with an SSRI (fluoxetine, paroxetine, or fluvoxamine) versus initial treatment with a TCA. The model assumed that 10% of patients with acute depression would require maintenance treatment, and that 10% would withdraw. The model also assumed that 65% of those who withdrew and 25% of those who were compliant would experience relapse. Based upon these assumptions, the investigators concluded that initial treatment with TCAs would be $1,374 less than with SSRIs. However, when both short-term and maintenance therapy costs were considered, SSRIs were less expensive than TCAs. Per 1000 patients, direct costs of starting treatment with an SSRI, costs of hospitalization, and costs of outpatient visits were estimated to be $47,257, $67,188, and $11,546 less, respectively, than with TCAs. Drug costs were estimated to be $31,476 per 1000 patients more for SSRIs than for TCAs.
- Fluoxetine
In pharmacoeconomic studies comparing an SSRI to TCAs, fluoxetine has been the most frequently studied antidepressant. Some of these studies also have arms comparing fluoxetine to other SSRIs. Only one of these studies is a randomized prospective trial conducted in a naturalistic setting.46
Taken together, this set of studies suggests that treatment with fluoxetine may yield lower costs than treatment with TCAs -- particularly for post-initiation therapy. Most studies conclude there is no difference between the total costs for treating a patient with fluoxetine and the total costs for treating a patient with a TCA, although a few claim economic superiority for fluoxetine over TCAs. Stronger evidence exists, however, for greater compliance with fluoxetine than with TCAs.
Simon and Fishman46 conducted the only prospective, randomized economic clinical trial comparing the cost of treating depressed patients with fluoxetine first-line versus the cost of treating with desipramine or imipramine in a primary care HMO setting. In an intent-to-treat analysis of the six-month trial, the investigators observed no significant difference among drug groups for symptom reduction, Quality of Life, or total healthcare cost endpoints. Patients initiating on fluoxetine were more likely to continue the originally prescribed antidepressant and were also more likely to refill prescriptions than were patients initiating on a TCA. Furthermore, the dropout rate during the first month of treatment was higher in the TCA groups than in the fluoxetine groups. Dropouts were largely driven by unacceptable adverse effects.
Croghan et al. conducted a retrospective database study using 2-stage econometric modeling to estimate healthcare costs of primary care patients receiving one year of initial therapy with fluoxetine (n=799), trazadone (n=89), or one of two classes of TCAs (amitriptyline/imipramine (n=104) or desipramine/nortriptyline (n=250)). Overall, the results suggest that fluoxetine is at least as cost-effective as trazadone or the TCAs.65 Total direct healthcare costs per patient (including hospitalizations, labs, radiology, physician visits, other outpatient services and drugs costs) were no different between the four treatment groups, although total mental healthcare costs were less for the trazadone cohort than for fluoxetine or the TCAs. However, the percentage of patients continuing medication continuously for at least six months was substantially greater with fluoxetine than with trazadone and the TCAs. Likewise, the percentage of patients switching from initial therapy was lowest with fluoxetine. Although the study is limited by its homogenous population, it did control for observed and unobserved characteristics in the econometric modeling, adding credence to the results.
Sclar et al. conducted a retrospective database study coupled with a multivariate regression analysis to compare the total one-year direct medical costs accumulated by patients prescribed either fluoxetine or one of three TCAs (amitriptyline, nortriptyline, desipramine).66 The researchers concluded that use of a TCA was associated with greater per patient post-initiation total healthcare costs ($366) compared to treatment with fluoxetine. The drivers of this increased cost included increases in physician visits, hospital visits, and laboratory costs. Although this study included no direct measure of treatment outcomes, it did show that patients were more likely to continue treatment on fluoxetine than they were on a TCA. The 701 patients in the study were representative of private sector depressed patients. The average age was over 40 and approximately 75% were women. This study, however, did not control for unobserved differences across patients.
In a later study, Sclar, et al. compared claims of patients treated with fluoxetine (n=180) to those treated with amitriptyline (n=211) and nortriptyline (n=159).67 This study tracked costs over a 3.5-year period immediately subsequent to the launch of fluoxetine in the U.S. (1988-1991). The authors concluded that patients treated with fluoxetine had nearly 26% less depression-related health care expenditures than those treated with amitriptyline and over 28% less than those treated with nortriptyline. Again, no direct measure of effectiveness was included. However, patients initiating on amitriptyline were more than three times as likely to require a change in antidepressant pharmacotherapy, while patients initially prescribed nortriptyline were nearly four times more likely to change medication relative to patients initially prescribed fluoxetine. Similarly, 64% of patients initiating on fluoxetine received at least 180 days supply, whereas only 52% of patients on amitriptyline and 48% of patients on nortriptyline received at least this amount. The patients in this study were similar to those in the previous analysis.
In the largest retrospective study conducted to date, Simon et al. compared overall mean total six-month health service costs for patients treated with fluoxetine (n=2,180) versus those for patients treated with imipramine (n=1,721) or desipramine (n=1,268).46 This study, based on HMO medical claims, concluded that although treatment with fluoxetine increased total costs, the increase was not significant statistically. This study included no direct measure of treatment effectiveness.
In a retrospective database study using 2-stage econometric modeling, Hylan et al. (1998) compared the costs of one year of treatment with fluoxetine (n=1,251) with those of treatment with TCAs (n=698).68An intent-to-treat, multivariate analysis showed that patients who initiated therapy with fluoxetine had significantly lower total direct health care costs than patients initiating with TCAs. Treatment costs included costs of hospitalizations, ER, lab and physician visits, other outpatient services, and drugs. The patient claims included in this study were restricted to those for patients with a new episode of depression who were receiving initial therapy, selected from U.S. fee-for-service private insurance claims (MarketScan 1990 to 1994). These investigators controlled for observed and unobserved differences between treatment groups more explicitly than in the previous study by using 2-stage econometric modeling.
Obenchain et al. (1997) conducted a retrospective bootstrap analysis to compare total annual charges incurred by patients taking fluoxetine, TCAs or trazadone for a new episode of depression.69 On average, treatment with fluoxetine (n=799), relative to treatment with trazadone or TCAs (n=443), resulted in a negative incremental cost-effectiveness ratio (ICER). Specifically, fluoxetine realized a reduction in annual charges by $16.48 (0.2%) per patient for each percentage increase in effectiveness. However, the 95% upper confidence limit on the ICER was positive, implying that fluoxetine may actually increase annual per patient charges. The authors stated that any such increase was no more than $130 per patient (1.8%) for each percentage increase in the proportion of patients remaining stable on initial pharmacotherapy for at least 6 months.
Data for this study were collected from the MarketScan database (1990-92) for a period of 12 months proceeding the index event of a diagnosis for depression and a prescription for antidepressant medication. A new episode was identified as a treatment-free period of four months prior to the index event. Patients participated in either fee-for-service or managed care health insurance plans for employed individuals and families. The principal measure of effectiveness was the proportion of patients remaining stable on the antidepressant for at least six consecutive months.
While this study may provide a more reliable and widely applicable approach to statistical analyses of the cost-effectiveness of competing treatments, it has several limitations. For example, sufficient data were not available at the time of the study to make comparisons among SSRIs or to evaluate trazadone and TCAs in separate cohorts. Furthermore, the study relied on effectiveness measures from medical claims data, which do not provide detailed clinical outcomes, such as symptom scores.
- Paroxetine
Several decision-analytic models have been developed which compare treatment with paroxetine to that with a TCA, namely imipramine. The models estimate that direct medical costs incurred with first-line treatment with paroxetine are no more--if not less--than costs for first-line treatment with imipramine. Several of these studies demonstrate that higher continuation rates (and lower dropout rates) of paroxetine contribute to its superior cost-effectiveness over TCAs. The models described here use results from randomized clinical trials to estimate treatment costs in the clinical practice setting. As a result, external validity of the studies is questionable. Comparative studies based in a naturalistic setting would be more useful in assessing the cost-effectiveness of paroxetine compared to TCAs.
In 1995, Bentkover and Feighner designed a clinical decision analytic model to estimate the annual direct medical costs of treatment with paroxetine or imipramine. 70 Efficacy and effectiveness probabilities were taken from a six-week clinical trial in 717 patients with major depression. The authors concluded that first-line treatment with paroxetine costs no more--if not less--than treatment with imipramine, due to reduced rates of relapse and fewer hospitalizations. Average annual direct medical costs were estimated to be $100 less for paroxetine than imipramine ($2,348 and $2,448, respectively). Sensitivity analysis reveals that the model is robust to changes in major parameters including hospitalization costs and relapse rates. However, it is sensitive to short-term dropout rates (total direct medical costs remain lower for paroxetine than for imipramine when the continuation rate is greater than 47% for paroxetine and constant at 46% for imipramine). It should be noted that this model potentially underestimates the total costs of treatment because it excludes indirect costs and treatment costs due to adverse events.
The clinical trial data used in the above model were used to power two other decision-analytic models that estimate the costs of successful versus failed therapy with paroxetine and imipramine in the UK 71 and Canada.72 As with the Bentkover study, the models estimated treatment patterns from focus groups and obtained costs from health database claims (private and public for the UK and Canada, respectively). In the UK model, when the costs of successful treatment and dropouts were considered separately, successful treatment with paroxetine was associated with lower costs than with imipramine, indicating that poorer tolerance and higher dropout rate increased treatment costs. However, no difference in total costs between the two medications was found. One limitation of the UK study is that it assumes medication discontinuation rates differ by 20% between paroxetine and imipramine, a value greater than that used in other studies. The Canadian model demonstrated cost savings of $96 CAN per patient for the paroxetine group compared to imipramine.
In all three models, sensitivity analysis revealed that continuation rates and dropout rates, rather than drug costs and relapse rates, are the most important predictors of the overall costs of care. For example, in the Canadian model, Paroxetine was cost effective only if the daily costs of medication were less than $4 CAN and the continuation rate was greater than 47%.72Although the UK and Canadian models support the findings of the U.S. model, they are not necessarily generalizable to the US.
- Sertraline
Studies comparing treatment with sertraline to that with TCAs are limited in methodology. Both of the studies reviewed below suggest that treatment with sertraline results in lower costs than treatment with TCAs. One study also asserts that sertraline is also more effective than TCAs. Taken together, it is reasonable to conclude that treatment with sertraline is more cost-effective than treatment with TCAs.
Skaer et al. conducted a retrospective database analysis comparing direct health service expenditures for treatment with sertraline to that with TCAs (amitriptyline, desipramine and nortriptyline) in a U.S. managed care setting.73 Multivariate regression analysis revealed that sertraline use resulted in significantly lower direct medical costs than TCAs for one year of treatment following initiation of therapy ($168 per patient, or 21% less than TCAs). Costs associated with depression-related physician visits and general and psychiatric hospitalizations were significantly lower for sertraline than for TCAs, while prescriptions costs were significantly higher and psychiatric costs were similar for sertraline and TCAs. The mean number of prescriptions (for a 30-day supply) was higher for the sertraline group than for TCA recipients (7.5 vs. 4.8) suggesting a more favorable tolerability profile with sertraline compared to TCAs. The study included 823 patients diagnosed with depression who were taking the study medications and for whom 18 months of health service data were available (6 months prior to and 12 months after receiving the initial prescription). Authors noted that this study is limited by its retrospective design, a lack of indirect cost data and the fact that HMO patients tend to be younger than the general population of patients with depression.
Forder et al. used a retrospective quasi-experimental design to compare treatment costs and cost-effectiveness in patients who received sertraline (n=190) or TCAs (n=188) during a large clinical trial in the UK.74 This model showed no significant differences in utilization of generic healthcare and social care services between the sertraline and TCA groups. However, mean costs associated with the use of inpatient and outpatient hospital care and community psychiatric nursing care were significantly lower in the sertraline group in both intent-to-treat and completer analyses. Overall mean costs were significantly lower for the sertraline group than for the TCA group as determined using some statistical tests, but not others. A significantly higher proportion of patients in both the intent-to-treat and completer analysis were rated by GPs as "somewhat improved" or "very much improved" for sertraline than for the TCA group. Resulting cost-effectiveness ratios favored sertraline for all definitions of costs and outcomes except for the acquisition costs of drugs alone.
This study has been criticized for failing to include costs associated with work absence and/or reduced productivity into indirect costs and for the lack of an incremental cost-effectiveness analysis. In addition, opportunity costs, which are not easily validated, accounted for a rather high percentage of total costs. However, no significant differences were found between opportunity costs in the two groups.
- Venlafaxine
Einarson et al. (1995) conducted a meta-analysis of randomized control trials to power a decision analytic model comparing the cost-effectiveness of treatment with venlafaxine to that of treatment with TCAs and trazadone.75 Total inpatient depression-related medical costs were greater for patients treated with TCAs ($12,513), than for patients treated with venlafaxine ($12,201), or trazodone ($11,492). Total outpatient depression-related costs were again greatest for TCAs ($3,061), followed by venlafaxine ($2,401) and trazadone ($1,896). Medical care costs included costs of hospitalization, all physician visits, lab tests, radiology and medications. Venlafaxine patients experienced greater improvements in diagnostic test scores (62% reduction in HAM-D scores) than did patients treated with either TCAs (51%) or trazadone (49%).
Cost-effectiveness ratios that calculated costs per symptom-free day in the inpatient setting were lowest for the venlafaxine group ($93), followed by trazadone ($108), and TCAs ($124). In the outpatient setting, trazadone was the most cost-effective agent at $20 per symptom free day, followed by venlafaxine ($23), and TCAs ($29). Although meta-analysis of randomized clinical trials is a powerful tool to obtain good probability estimates, the external validity of the RCT is questionable, especially when estimating outpatient costs.
Using a similar framework as the U.S. model, Einarson et al. evaluated the cost-effectiveness of venlafaxine and TCAs from the perspective of the Canadian healthcare system.76 In this analysis, venlafaxine was more cost-effective in terms of expected costs per success and per symptom free day (SFD) than TCAs both in the inpatient and outpatient setting. Venlafaxine was also dominant for all incremental pharmacoeconomic analyses. This model was robust for outpatients, but somewhat sensitive to changes in parameters for inpatients. In the worst case inpatient scenario, TCAs were superior to venlafaxine; in the worst case outpatient scenario, venlafaxine remained more cost-effective than TCAs.
Griffiths et al. (1999) conducted a retrospective database analysis of nine U.S. managed healthcare plans to compare treatment with venlafaxine to treatment with TCAs77. Patients were included who had switched from an SSRI after at least two consecutive months of therapy followed by at least two consecutive months of a TCA (n=172) or venlafaxine (n=188). Total direct healthcare costs were not significantly different between the two treatment groups. Further analysis by prescriber specialty and diagnosis code showed cost differences between the groups. While mean depression-coded costs were significantly greater for the venlafaxine group than for the TCA group ($1,948 vs. $1,396), mean non-depression coded costs were significantly lower. When psychiatrists were the initial prescribers of second-line therapy, significant cost differences were observed, but not with primary care physicians. In addition, patients receiving TCAs were more likely to visit an outpatient medical facility and a medical specialist other than a psychiatrist and were also more likely to receive anti-anxiety medications. The study suggests that the greater costs of pharmacotherapy with venlafaxine may be offset by a reduction in costs due to other medical services. The model is strengthened by considering observed and unobserved differences across patients. Limitations of this study include the lack of detailed clinical data on the severity of depression or the patients' complete history of antidepressant therapy. In addition, submitted charges were used as a proxy for costs. Overall the model suggests that venlafaxine is as cost-effective as TCAs for second-line therapy.
The evidence on venlafaxine suggests that treatment with venlafaxine is more cost-effective than treatment with either TCAs or trazadone. Comparison of cost-effectiveness relative to SSRIs will be discussed later in the text.
- Nefazodone
Four models compare nefazodone to TCAs. Two of these include fluoxetine in the comparison and are discussed later in this section. Although the studies discussed below differ on the relative costs of treatment with nefazodone, they do suggest that treatment with nefazodone is more cost-effective than treatment with imipramine.
Using a Markov state-transition decision analytic model, Revicki et al. compared the lifetime costs and utility outcomes for three groups in a typical US managed care setting:78
- Treatment with nefazodone;
- Treatment with imipramine; and
- Step care with imipramine followed by nefazodone.
Results of the base case analysis estimated lifetime medical costs (discounted at 5%) to be lower for imipramine and step care than for nefazodone ($15,348, $16,061, and $16,669, respectively). However, QALYs were greater for nefazodone treatment than for imipramine or the step approach (14.64, 14.32, and 14.40, respectively). The resulting cost-effectiveness ratio comparing nefazodone with imipramine was $4,065/QALY. This cost falls within the suggested criteria to be adopted into the Canadian healthcare system and may be equally, if not more acceptable in the U.S.
The model was robust to adjustments in key parameters such as compliance rates, discount rates and maintenance treatment probabilities. Sensitivity analyses demonstrated that cost-effectiveness ratios for nefazodone compared with imipramine ranged from $2,572 to $5,841 per QALY gained. Comparing nefazodone to the step approach, cost-effectiveness ratios ranged from $1,436 to $6,764 per QALY gained. Limitations of the study include the omission of indirect costs, the assumption that the target patient population was 30-year old women, and the general limitations of economic models which rely on clinical trial data and expert opinion. The study is also limited in its applicability to the managed care setting. Overall, the study demonstrates that nefazodone is cost-effective compared to imipramine or step care with imipramine and nefazodone.
Unlike the U.S. model, an earlier Canadian model estimates medical costs for nefazodone to be lower than those for imipramine. These differences are explained by differences in model parameters such as hospitalization, compliance rates and depression recurrence rates.78
- SSRIs as a Class
- Newer Antidepressants Compared
Although most researchers have focussed on the cost-effectiveness of newer antidepressants compared to their older competitors, a few studies have been conducted comparing the cost-effectiveness of two or more new-generation antidepressants. Results have varied in these studies, and there is no apparent consensus that any one new agent is superior either in terms of effectiveness or cost-effectiveness.
- Fluoxetine Compared to Sertraline
Boyer et al. performed the only prospective, double-blind, randomized, trial to date which compares treatment costs within the class of SSRIs.79 Conducted in a primary care setting in France, this six month multicenter study compared treatment with fluoxetine (n=120) and sertraline (n=122) in patients with major depression. In this study, treatment with fluoxetine was associated with greater treatment costs than was treatment with sertraline, while clinical outcomes appear similar. Clinical outcomes revealed equivalent efficacy for sertraline and fluoxetine at mean dosages of 55 mg and 26 mg, respectively. 65% and 67% of patients remained at their starting dosage and mean duration of therapy was 153 and 158 days for sertraline and fluoxetine, respectively. Total costs per patient from the insurer's perspective were FF2936 for sertraline and FF3224 for fluoxetine; societal costs were FF7780 and FF8706, respectively. Per patient savings in medical resources utilization were FF23 less for sertraline than fluoxetine from the insurer perspective and FF74 less from the societal perspective. Per patient savings due to depression-related absenteeism were FF118 less for sertraline than fluoxetine from the insurer perspective and FF443 less from the societal perspective. Statistical data were not provided.
Most of the total costs incurred in both groups (67.0% of total costs for the sertraline group and 69.7% of the cost for the fluoxetine groups) were due to indirect costs, primarily due to absences from work. Overall, the difference in total costs between the two groups was mostly due to differences in indirect costs.
For this study, clinical and quality of life assessments were made at study entry and after four and six months of treatment. Patients with at least a 50% decrease in MADRS scores at 4 months that was maintained for 2 additional months were considered responders. Direct and indirect costs were calculated from both the societal perspective (patient out-of-pocket costs plus sickness insurance reimbursement) and the healthcare provider (sickness insurance) perspective. Total costs were assessed as the sum of direct and indirect costs related to medication, all physician visits, medical investigations, hospitalizations, paramedical procedures, work absenteeism, and lost productivity. Sickness insurance costs were determined by mean reimbursement rates by a French national health insurance fund for salaried workers. Societal costs were calculated on the basis of market prices or price rates for health products and services. Because sertraline was not available on the French market at the time of the study, no costs were attributed to either of the study medications for both direct and indirect cost analyses.
Despite the difficulty of extrapolating these results to the U.S. healthcare system, the prospective trial design and naturalistic setting make this study more reliable than previous analyses. As such, the results of this study suggest that sertraline is more cost-effective than fluoxetine, although these results should be interpreted with caution.
- Fluoxetine Compared to Sertraline and Paroxetine
Both of the following studies evaluate the cost of treatment of depression with fluoxetine versus those same costs of treatment with sertraline and paroxetine. These studies, based on retrospective analysis of claims data with or without econometric modeling show fluoxetine to be superior to the other SSRIs in terms of cost of treatment. However, these studies use data collected shortly after the launch date of the newer SSRIs. Outcomes may be skewed due to physician unfamiliarity with the drug and the fact that paroxetine and sertraline may have been used early on as second-line therapy for patients who discontinued fluoxetine.
In a retrospective database study described above, Hylan et al. also compared the costs of one year of treatment with fluoxetine (n=1,251) to those for paroxetine (n=136) and sertraline (n=508).68 Univariate analysis found no significant differences in mean health care costs across the three antidepressant medications. However, significant differences (p<0.0001) were found in median total and mental health care costs. Total median healthcare costs were $3,466, $3,491 and $3,613 per patient for fluoxetine, sertraline and paroxetine, respectively. Median mental health costs were $1,187, $970, and $1,048 per patient, respectively.
Multivariate analysis, controlling for observed and unobserved characteristics, found that only patients who initiated therapy with fluoxetine had significantly lower total direct health care costs than with TCAs. Patients initiating therapy on sertraline or paroxetine did not incur lower total direct health care costs than did patients initiating with TCAs. In addition, patients initially treated with fluoxetine had significantly lower total health care costs than those treated with sertraline. This result contradicts that found in the Boyer study. Hylan et al. found no difference in total health care costs between the fluoxetine and the paroxetine groups. Total mental health care costs were not significantly different across the three medications.
These findings should be interpreted cautiously for several reasons. First it should be noted that a dosage of 50mg/day was used for sertraline instead of the later recommended dosage of 100mg/day, which could have impacted clinical outcomes. More importantly, the analyses were conducted using claims from 1990-1994, a period when paroxetine and sertraline were recently introduced to market. Therefore, prescribers may have been more familiar with fluoxetine than paroxetine or sertraline and may not have used the newer SSRIs in the most efficacious and economical way. As the authors suggest, it would be useful to replicate this analysis using more current data, following patients over a longer time span.
In 1995 Sclar et al. performed a similar analysis using insurance claims data from a network model HMO system.80Multivariate regression analysis estimated that total direct depression-related health service expenditures per patient were less for fluoxetine than for paroxetine or sertraline ($442,29, $744.06, and $756.23, respectively).The percentage of patients requiring dosage titration between the first and last prescriptions were greatest for sertraline (40.3%), followed by paroxetine (28.1%) and fluoxetine (16.1%).
Again, these results should be interpreted with caution for several reasons. As with the previously described analysis by Hylan et al., paroxetine and sertraline had been newly introduced during the study period. Therefore, increased treatment costs may reflect physician practices that could have improved since the time of the study. The managed care patient population was homogenous and potentially younger and with fewer comorbidities than a general population of patients with depression. Furthermore, initial dosages and sources of cost data are not clearly defined. Finally, unlike the study by Hylan, unobserved differences across patients were not considered and may have skewed results.
Given the results of the Boyer study in the previous section, it is reasonable to conclude that no clear distinctions exist between these SSRIs--fluoxetine, sertraline and paroxetine--with respect to either costs or cost-effectiveness of treatment.
- Venlafaxine Compared to SSRIs
The studies by Einarson et al. discussed above also included a comparison of venlafaxine to SSRIs.75 The results of these studies exhibit mild evidence for venlafaxine being more cost-effective than SSRIs. From the U.S. healthcare payer perspective, total inpatient depression-related costs were greater for venlafaxine ($12,201) than for SSRIs ($11,864), while total outpatient depression-related costs were greater for SSRIs ($2,412) than for venlafaxine ($2,401). Venlafaxine patients experienced greater reductions in their HAM-D scores (62%) than did patients on SSRIs (30%). Cost-effectiveness ratios calculated that costs per symptom-free day in the inpatient setting were lower for venlafaxine ($93) than SSRIs ($146). This superiority was maintained in the outpatient setting: venlafaxine ($23), SSRIs ($25).
In the Canadian application of this model, these researchers found that venlafaxine was more cost-effective in terms of expected costs per success and per symptom free day than were the SSRIs in both the inpatient and the outpatient settings. Venlafaxine was also dominant for all incremental pharmacoeconomic analyses. However, in sensitivity analyses, SSRIs were more cost-effective than was venlafaxine in an inpatient worst case scenario, although venlafaxine remained dominant in all outpatient analyses.76
- Fluoxetine Compared to Sertraline
C. The Cost-Effectiveness of Newer Antipsychotic Medications
The Cost of Schizophrenia and Related Illness in the United States
Cost of illness studies on psychotic disorders in the U.S. reveal that patients with schizophrenia consume a disproportionate percentage of national healthcare dollars. It has been reported that although schizophrenia occurs in only 1% of the general population, patients with the disorder consume approximately 2.5% of total U.S. healthcare dollars and 22% of the costs of all mental illness.50,51,81Furthermore, patients with schizophrenia consume 10% of Social Security benefits, occupy up to 25% of all hospital beds, and account for 40% of long-term care days.51
Rupp & Keith estimated the total cost of schizophrenia in 1990 to be $33 billion.81 Of this amount, $17 billion was attributable to direct medical costs while $12 billion were attributable to indirect costs.82 Wyatt et al. estimated the indirect cost of schizophrenia to be much higher by using a "productive person-years" method.83 These researchers estimated the total costs of schizophrenia in the U.S. in 1991 to be $65 billion ($19 billion in direct costs and $46 billion in indirect costs).82 It is important to note that these cost of illness studies were conducted before the introduction of many of the antipsychotic agents discussed in this report. Since the early 1990s, atypical agents such as risperidone, clozapine and olanzapine may have contributed to a reduction in total costs or the proportion of U.S. health care dollars consumed by patients with schizophrenia.
Pharmacoeconomic Analyses of Specific Antipsychotic Agents
We reviewed 38 studies that evaluate the pharmacoeconomics of newer antipsychotic medications to a relevant level of rigor. Only a small number of studies are prospective, randomized economic clinical trials conducted either in a naturalistic health care setting or as a "piggy back" to a clinical trial. Many of these studies are retrospective analyses of claims data from public and private health care payers. Several other studies are decision-analytic models that incorporate both claims data, the results of randomized clinical efficacy trials, and the results of expert panel interviews.
Most studies conducted to date in schizophrenia are not technically "cost-effectiveness" studies that measure cost per successful patient outcome over time, but cost-minimization analyses that measure total cost savings per patient over time. An ideal study would explicitly measure direct and indirect medical costs associated with the use of newer antipsychotic medications. Until recently, most published studies have used only a proxy for these costs (such as reduction in hospital days) to estimate cost-effectiveness.54 This proxy is useful because traditionally a majority of medical costs incurred in treating patients with schizophrenia are due to hospital costs. However, full enumeration of total medical costs is desirable.
As for antidepressants, many of these studies have been sponsored by pharmaceutical manufacturers. However, 12 of these studies were funded at least in part by government agencies or private foundations. Nonetheless, one might expect publication bias to color the results. In fact, in all the studies reviewed below, treatment with the agent manufactured by the sponsor appears to be at least no more costly in terms of total direct medical costs than treatment with the comparative agents. The claim that one newer agent is economically superior over another may appear inherently specious if the study is sponsored by the manufacturer claiming superiority. However, the result that treatment with new-generation antipsychotics is at worst no more costly in terms total direct medical costs than treatment with older agents is confirmed by studies sponsored by government agencies or other third parties.
The following discussion is limited to studies conducted from the perspective of the US healthcare system. Reference is made to studies conducted in other countries when they provide unique data or the results compare and contrast to those for the US.
- Studies of Single Agents that Measure Impact on Hospital Admissions and/or Stays
We reviewed several historical comparator studies for risperidone which report data on reduction in hospital days and/or number of admissions one or two years after treatment compared with one year prior to treatment. Most of these studies do not report cost outcomes. Those that do will be discussed later in this report. Results from intent-to-treat analyses were variable. Treatment with risperidone resulted in anywhere from a 1% increase in hospitalization days to a 58% reduction in hospitalization days compared to the time period before treatment with risperidone 82,84-88 Completer (i.e., patients who did not drop out of the study) analyses consistently demonstrated improvement with risperidone treatment, which resulted in anywhere from a 20% to 74% decrease in hospitalization days.84,85,87,89,90 Where reported, the number of admissions either remained constant 84 or were reduced (up to 67%).82,86-88 (See Exhibit VII-2.)
Several clozapine studies also use hospitalization as a proxy for cost.91,92 These studies indicate a reduction in hospital days over a 2.5 year period and some improvement in patients who remain hospitalized. (See Exhibit VII-2.)
These types studies have several limitations. (The reader is referred to Foster and Goa 1998 for a more detailed explanation.54) First, the retrospective historical comparator design may lead to historical bias. In the absence of a control group, it is difficult to determine the extent to which improvement in the post-index period is attributable to the study medication. Most of the studies do not specify which type of treatment (e.g., pharmacotherapy, counseling) patients were receiving prior to treatment with risperidone. Furthermore, in their review of risperidone, Foster and Goa note that with the movement away from inpatient to community care, treatment patterns may have changed during the study period.54 Although two studies reviewed concluded that changes in policy did not explain the reduction in hospital days by risperidone.82,93 In addition, inconsistencies in the criteria for hospital admission, patient demographics, the availability of hospital beds and other external factors can affect hospitalization rates. Therefore hospitalization data may not be an ideal measure of cost-effectiveness. Finally, long-term studies indicate that healthcare utilization in patients with schizophrenia declines over time due to several factors.54 Therefore, real time studies would provide more reliable data than would historical comparisons.
Most of the studies reviewed concerning olanzapine, quetiapine and clozapine which report hospitalization rates incorporate these data into overall medical costs. Hospitalization data for these treatments will not be reviewed independently, but will be incorporated into more detailed reviews of these studies.
Exhibit VII-2. Studies Using Hospitalization as a Proxy for Costs in Treatment with Risperidone or Clozapine
| Reference | Study Design/Methodology (Duration, months) | Major findings |
|---|---|---|
| Risperidone | ||
| Addington, DE (1993)89 | Historical comparator retrospective study/completer analysis (6/6) | Hospitalization days down 20% |
| Finley, et al (1998)85 | Historical comparator retrospective database study/univariate logistic regression analysis, completer analysis (6/6) | Hospitalization days down 43% |
| Lindstrom, E (1995)90 | Historical comparator retrospective database study/ completer analysis (6/6) | Hospitalization days down 38% |
| Historical comparator retrospective database study/ITT analysis (6/6) | Hospitalization days down 31% | |
| Historical comparator retrospective database study/completer analysis (12/12) | Hospitalization days down 54% | |
| Philipp, M.87 | Historical comparator retrospective database study/pts. treated under clinical trial conditions for some or all of the period after the initiation of risperidone, ITT analysis (6/6) | Hospitalization days up 1%, # admissions down 24% |
| Historical comparator retrospective database study/pts. treated under clinical trial conditions for some or all of the period after the initiation of risperidone, completer analysis (6/6) | Hospitalization days down 74%, # admissions down 67% | |
| Clozapine | ||
| Frankenberg, FR. (1992)91 | Historical comparator retrospective analysis (6 mos/2.5 yrs) | Reduced number and length of hospitalizations for clozapine responders |
| Wilson, WH. (1992)92 | Historical comparator retrospective evaluation (6/6) | 34 pts. (92%) remained hospitalized after 6 mos; privilege level: 38% much improved; 24% somewhat improved |
-
- Comparisons Among Antipsychotics
- Newer Antipsychotics Compared to Older Antipsychotics
Several economic models suggest that, despite their higher medication costs, risperidone, olanzapine, and clozapine may be more cost-effective than older antipsychotics (e.g., haloperidol) in the treatment of schizophrenia.
Palmer, et al constructed a five-year Markov model to compare the cost of treatment of schizophrenia in the U.S. using olanzapine, haloperidol, or risperidone.94 Results were normalized to 1995 U.S. dollars. For the five-year period of the model, patients treated with olanzapine experienced 6-7 months more time in a disability-free state (Brief Psychiatric Rating Scale (BPRS) score <18) than those treated with haloperidol. The total direct medical costs of treating patients with olanzapine over the five-year period were $1,539 less than for haloperidol and $1,875 less than for risperidone. Patients treated with olanzapine first-line showed a 1.6% reduction in total costs versus haloperidol. Cost savings were due to reduced hospitalization rates, relapse rates and lower suicide rates.
The analysis was robust for variations in the discount rate, the rate and/or costs of suicide attempts, frequency duration and/or cost of hospitalization and/or other medical resource utilization estimates. However, the model was sensitive to drug dosages of olanzapine and risperidone and a decrease in length of stay. Risperidone becomes more cost-effective than olanzapine when the dosages are lowered and raised, respectively. Olanzapine is no longer cost saving when the initial duration of hospitalization is halved. As a result, the model has been criticized for using a dose of olanzapine (10 mg/day) that is lower than generally used in clinical practice, while using a dose of risperidone (6 mg/day) that is much higher than generally used. Furthermore, the high risperidone dosages may aggravate side effects (e.g., extrapyramidal syndrome (EPS)) and limit the real world effectiveness of risperidone in the simulation.
This model was populated using probability estimates obtained from a one-year international comparative trial of olanzapine (10mg/day) versus haloperidol (15mg/day) and a 28-week comparative trial of olanzapine (10mg/day) versus risperidone (6mg/day).41,95 Additional inputs to this model were obtained from the medical literature and an international advisory panel of psychiatrists and health economists. This expert opinion was used to extrapolate clinical data from 1 year or 28 weeks to the 5-year timeline--one of the major limitations of this model. The model examined the cost of treating patients experiencing multiple schizophrenia episodes, while excluding treatment-resistant patients or those experiencing a first-break episode.
A recent historical comparator pilot study by Galvin examined the medical records of 37 patients with schizophrenia, schizoaffective disorder or bipolar disorder one year before and one year after treatment with atypical agents (risperidone and clozapine).96 Based upon patients' detailed medical records, the study estimates an annual total cost savings of $3000 per patient in the community mental health setting when treatment is moved to an atypical agent. There are several limitations inherent to this small-scale community-based study. For example, the entry criteria may have introduced a selection bias by excluding clients who were most intolerant or least responsive to older antipsychotic medications and could not continue their use for one year. Although the study was small, uncontrolled, and retrospective in design, its focus on the community mental health setting is more naturalistic than large-scale clinical trials and set an important example for future research.
- Risperidone Compared to Haloperidol
The pharmacoeconomic evidence of risperidone versus typical antipsychotics indicates that the costs incurred for treatment with risperidone approximately equal those incurred for treatment with haloperidol. Results from these studies suggest that risperidone, despite its higher acquisition cost, does not significantly increase overall treatment costs compared to conventional antipsychotics and is at least as effective. However, several considerations raised by Zito suggest that experimental design and reporting of data from the large multi-center trials of risperidone compared to haloperidol favored clinical and economic outcomes for the atypical agent.50 On the other hand, economic analyses that assume equal compliance rates or effectiveness for risperidone and haloperidol may underestimate potential cost savings with risperidone.97,98
Janssen Pharmaceuticals, the manufacturer of risperidone, is currently sponsoring a multicenter, randomized clinical trial across 21 investigative sites in the U.S. The trial, named the Risperidone Outcomes Study of Effectiveness (ROSE), compares treatment with risperidone to 13 conventional agents in patients with schizophrenia or schizoaffective disorder. The trial examines clinical, quality of life, and economic outcomes in a typical U.S. clinical practice setting. Clinical outcomes include changes in psychiatric symptoms, side effects, health-related quality of life, drug satisfaction, therapy switching, rehospitalization for relapse and use of psychiatric services. Economic outcomes focus on the costs of mental health-specific care. 99
In 1997, Mahmoud et al. presented a cost analysis of the ROSE trial at the 36th Annual Meeting of the American College of Neuropsychopharmacology. Estimates of national average costs were used to calculate mean costs per patient. The intent-to-treat analysis favored conventional agents over risperidone in total, acute care, outpatient and medication costs. Intent-to-treat analyses included patients having prolonged drug-free periods, polypharmacy, or crossing over to receive alternative treatment; patients who remained in the treatment arm (50% of those randomized to risperidone and 61% of those randomized to conventional agents) may have received multiple or concurrent antipsychotic agents.100 Total costs for treatment with risperidone were $1,963 higher than for treatment with conventional agents, but the results were not judged to be statistically significant. When patients switching therapies were excluded from analysis yields, risperidone was cost saving compared to conventional agents in total, acute care and outpatient treatment costs. Although the total costs differed between the types of analysis, mean positive and negative scores on the PANSS showed greater improvement at one year with risperidone than with conventional agents in both types of analyses. Further publication of trial data was not found at the time of this study.
Davies et al. developed a robust decision-analytic model to compare treatment with risperidone or haloperidol over a two-year period in patients with chronic schizophrenia.101 The authors constructed a decision tree that considered ten possible clinical scenarios. The expected cost per favorable outcome was $11,395 (1993 Australian dollars) less for risperidone than haloperidol over the two year period (cost per patient treated was $2,783 less for risperidone than haloperidol). Direct costs included cost of drugs, general practitioner visits, psychiatrist visits, hospitalization, social worker consultations, lab tests and hotel accommodation. Probability estimates (e.g., efficacy, tolerability, and drop-out rate) were derived from meta-analysis of clinical trials and expert opinion. The model was robust to sensitivity analysis and the break-even point for treatments to be of equal cost was an 11.8% difference in effectiveness. Using baseline assumptions, risperidone was found to be 20% more effective than haloperidol. It should be noted that costs, reported in Australian dollars, may not necessarily be applicable to the U.S. setting.
Glazer & Ereshefsky developed a US-based decision-analytic model which is less robust than the one described above.98The model estimated which of three possible treatment paths would have the lowest total direct costs during the first year after discharge from a hospital for a 29-year old male with a history of relapse and rehospitalization for schizophrenia. While compliance rates were varied for each of the three treatment options (65% for risperidone 6mg/day, 50% for oral haloperidol 15mg/day, and 80% for depot haloperidol decanoate, 150 mg/month), clinical outcomes probabilities were assumed the same for each treatment. Total direct treatment costs were less for depot haloperidol decanoate than for continuing oral haloperidol, and both were less than for treatment with risperidone. Sensitivity analysis showed that when the compliance rates for risperidone were increased to 80% and assuming 25% discount on the cost of medication, total one-year direct costs with risperidone were $1,862 less than with oral haloperidol and $705 less than haloperidol decanoate.
We have reviewed 11 historical comparator studies which examine the costs of treatment one year before and one to two years after treatment with risperidone. The pretreatment costs may have included treatment with haloperidol or other typical antipscyhotic agents. Costs were obtained from regional medical claims databases or unspecified sources. In most cases (5 of 7 ITT analyses82,10284-86,88,103 and 4 of 4 completer analyses84,89,93,104,105) risperidone resulted in overall cost savings (range, $308 to $2596 in U.S., 1993-1997 dollars). The historical comparator studies that used intent-to-treat analyses (i.e., including cross-over and treatment-resistant patients, etc.) found that the reduction in costs with risperidone was generally smaller than that observed in studies that included only treatment successes. Furthermore, these studies generally find that savings are more significant in the second year of therapy (cost savings may approach 50%), suggesting that long-term comparative economic studies are needed to demonstrate the true cost-effectiveness of antipsychotic treatment.
Only two of the historical comparator studies found that treatment with risperidone increased total costs over treatment with haloperidol when crossover patients were included.84,88 However, in neither of these cases, did treatment costs increase by more than 3%. That one of these studies found inpatient costs to be 10% higher after treatment is misleading.54 In this study, inpatient costs included all inpatient care in hospitals, skilled nursing facilities, psychiatric facilities and department of correction facilities. After initiation of risperidone, acute inpatient care costs actually decreased, while other inpatient costs increased. Furthermore, in both of these studies, there was a very low rate of acute inpatient care before initiation of treatment. Therefore, substantial cost savings could not be achieved.54
A more recent retrospective study conducted by Schiller et al. compared treatment with risperidone to conventional therapies in a community mental health setting.106 This study used a quasiexperimental mixed-model analysis and obtained outcomes and service utilization data from outpatient charts and databases. Results found no difference in clinical outcomes, measured by Global Assessment of Functioning (GAF) scores, but a trend towards higher total costs for risperidone. The $370 increase in total costs with risperidone was attributed mainly to higher medication costs and medication-related outpatient visits, but only the difference in medication costs was statistically significant. Mental health service costs and lab costs were obtained from county year-end (1994) cost reports of San Francisco community mental health services. Medication costs were average wholesale prices. One limitation of this study is the comparability of the two groups. The risperidone group was selected based upon a change in medication, whereas the comparison group was not. The authors note that a higher service utilization in the risperidone group in the pre-risperidone period may have produced possible selection bias. The authors suggest that given the possible selection bias, restricting use of risperidone based upon an increase in costs is not justified.
Nightengale (1995) conducted a small naturalistic retrospective cohort study which estimated the monthly costs for risperidone (n=28) compared to haloperidol (n=24) inpatients with schizophrenia, schizoaffective disorder or major depression with psychotic features. 97 The study found no significant differences in length of follow-up, length of stay, or hospitalization rates between the two treatment groups. The haloperidol cohort used significantly fewer physician services than did the risperidone cohort (every 127 days versus every 75 days). However, haloperidol patients were more likely to be admitted to day hospitals. Although the difference in monthly costs per patient between the risperidone and haloperidol groups were not judged by the authors to be significant ($1,636 versus $1,759, p=0.04693), the total monthly cost per patient was considerably lower in the risperidone cohort ($123.24 less per patient than haloperidol). Although the setting of care is realistic, the 100% compliance rate assumed by the authors for both medications is not. Considering that compliance with risperidone may be greater than with haloperidol in reality, the study may have underestimated cost savings with risperidone.
- Olanzapine Compared to Haloperidol
Studies comparing olanzapine to haloperidol provide solid evidence that olanzapine is more cost-effective than haloperidol.
Several prospective economic analyses have been conducted as "piggy back" studies to an international comparative trial of olanzapine versus haloperidol.95 This trial enrolled patients with schizophrenia, schizophreniform disorder or schizoaffective disorder were followed during a 6-week acute phase (n=551, olanzapine; n=266, haloperidol) and 46-week maintenance phase (n=270, olanzapine; n=74, haloperidol). Clinical and resource utilization data were collected in 174 clinical centers in 17 countries, 66 of which were in the US. Although prospective studies such as these are ideal, the analyses were limited because economic data were not collected for patients after they withdrew. Several economic models imputed missing values to determine incremental cost-effectiveness. Several of the analyses are published in full94,107-110, while others have only appeared as abstracts or presentations (Dutch and German analyses)111,112 Overall, the prospective analyses indicate that olanzapine is associated with lower total costs than haloperidol and possibly risperidone in moderately to severely ill patients with chronic schizophrenia.
In a basic cost analysis, Hamilton et al. used resource utilization data from an international trial to estimate direct medical costs for those patients who completed treatment with olanzapine or haloperidol.108 Olanzapine showed a trend toward greater efficacy compared to haloperidol in the acute phase based upon the BPRS scale. This trend did not attain statistical significance in the maintenance phase according to BPRS, PANSS and QLS scores. Total costs were significantly lower for olanzapine in the acute phase ($388 lower over 6 weeks) but not in the maintenance phase ($636 lower over 46 weeks). These results are considered conservative because patients who discontinued therapy were not considered. It should be noted that significantly fewer patients treated with haloperidol completed the acute phase of treatment than did patients treated with olanzapine (43% versus 64%).
Subsequently, Obenchain et al. developed a mixed effects linear model to estimate cost-effectiveness of olanzapine compared to haloperidol over the one-year study period of the international trial. 107 The model used homogenous variance components and imputed missing values for patients who discontinued treatment early. Total direct medical expenditures per patient were estimated to be $10,301 lower for patients treated with olanzapine than haloperidol (p<0.0001). Patients taking olanzapine experienced on average 18.3 more symptom-free days than those taking haloperidol (symptom-free = BPRS score <18 on items 0 to 6). The incremental cost-effectiveness ratio estimated annual savings of $563 per symptom-free day gained. Mean annual hospitalization costs were $10,856 less with olanzapine (p=0.007). Bootstrap analysis was highly stable for the finding that olanzapine is associated with greater efficacy and lower costs. However, results were somewhat sensitive to drug costs, which were based upon dosages of 10mg/day for olanzapine and 15mg/day for haloperidol. If recalculated on the basis of the cost of olanzapine at 20 mg/day, the annual savings are reduced to $7,542 per patient.
Two retrospective historical comparator studies compared costs for six months before and after treatment with olanzapine.113,114 Results of both studies showed that total medical costs did not increase (and may have decreased) despite an increase in medication costs. As discussed earlier, these studies have significant limitations including potential selection artifacts and historical bias. 53
- Quetiapine Compared to Usual Care
In light of the previously published, and often poorly designed, cost-effectiveness literature on risperidone and olanzapine, the manufacturers of quetiapine are conducting a well-designed naturalistic comparative pharmacoeconomic trial. Hong et al. have described the design of a multicenter, open-label, randomized, comparative, effectiveness trial for treatment with quetiapine or "usual care" in revolving door patients.115. The primary objective of the trial is to compare the rates ofrehospitalization due to psychiatric, medical, or social consequences of schizophrenia or schizoaffective disorder for revolving door patients treated with quetiapine or usual care. In this study, "usual care" is defined as treatment with any first-line oral or depot antipsychotic -- including atypicals, excluding clozapine -- commercially available at the time of the trial in the United States. (Clozapine is excluded from the study because it is not a first-line antipsychotic and clozapine-treated cohorts are biased towards treatment-resistance and chronicity.) The study will also assess the use of inpatient and outpatient health services, quality of life (SF-36, BASIS-32), and outcomes such as efficacy, safety, compliance, and patient satisfaction. The trial duration is 53 weeks.
The study design for this trial focused on a subpopulation of patients with the greatest potential for cost savings by treatment with quetiapine or usual care. The appropriate minimal threshold for revolving-door status was calculated from hospitalization rates and inpatient payments obtained from MedStat MarketScan databases (1/91-12/92) and Medi-Cal data (7/91-6/93). Analysis of medical claims databases indicated that patients with schizophrenia with an annual hospitalization rate of at least 1.0 (=10% of total sample) generate about 50% of inpatient costs. Therefore the minimal threshold for revolving-door status was defined as 1.0 admission per year. It was estimated that 182 patients would be necessary for each arm of the trial to detect a 15% difference in rehospitalization rates, the value expected to result in significant reduction in hospitalization costs.
Preliminary assessments indicate patients had had two hospitalizations in the past two years, one hospitalization and one admission to a crisis shelter for conditions related to schizophrenia or schizoaffective disorder in the past year, or at least three admissions to a crisis shelter in the past year. Settings included U.S. clinical settings associated with community mental health centers, state psychiatric facilities, private psychiatric hospitals, university hospitals, and VA hospitals. No further publication of these trial results was found at the time of this study.
- Risperidone Compared to Olanzapine
Current inconsistencies regarding the dosages in the risperidone Compared to olanzapine studies render the evidence inconclusive as to which agent is more cost-effective.
Grainger et al. presented preliminary results of a resource utilization and quality of life analysis of the 28-week clinical trial comparing risperidone and olanzapine.116 In the 91 evaluated patients, mean total direct medical costs were $493 lower per patient with olanzapine than risperidone (p<0.01). This figure was statistically significant after controlling for hospitalization status at baseline and length of hospitalization prior to randomization. Mean medication costs were significantly higher for olanzapine than risperidone (+$655). However, mean inpatient and outpatient costs per patient were significantly lower for olanzapine (-$318 and -$829, respectively). These preliminary results must be interpreted with caution, because of the small sample size and because the study is not yet published in full. Furthermore, costs for nonresponders and discontinuers were not assessed beyond the acute treatment phase. Finally, the study has been criticized because it uses doses for risperidone that are higher (6 mg/day) and doses of olanzapine that are lower (10 mg/day) than is customary in clinical practice.53
A more recent short-term comparative study used more realistic dosages for risperidone and olanzapine (4.8 and 12.5 mg/day, respectively). Risperidone was potentially more effective and as safe as olanzapine and it was suggested that treatment costs would be lower with risperidone. 117
- Clozapine Compared to Typical Antipsychotics for Treatment Refractory Schizophrenia
Collectively, the results of the numerous following studies together provide strong evidence of clozapine's superior cost-effectiveness relative to older, typical antipsychotics for treatment-resistant schizophrenia.
Clozapine, the first atypical antipsychotic, has been studied extensively for treatment-resistant schizophrenia. The side effects common to traditional antipsychotics are not found with clozapine (EPS, tardive dyskinesia, etc.). However, the risk of agranulocytosis is greater with clozapine and it is reserved for treatment-refractory cases. Generally the higher acquisition cost with clozapine is offset by a reduction in hospital days. Overall, studies demonstrate that clozapine is no more costly, and more effective than conventional therapy in patients with treatment-resistant schizophrenia.
Rosenheck et al. completed the only prospective, randomized double-blind comparative study evaluating the cost-effectiveness of clozapine (n=205, 552mg/day) versus haloperidol (n=218, 28mg/day).118 Patients were older males with treatment refractory schizophrenia and a history of high inpatient service utilization (30-364 days in previous year). An intent-to-treat analysis showed no significant cost savings associated with treatment with clozapine (total health costs were $2,441 less and societal costs were $2,773 less for clozapine than haloperidol). Outpatient treatment and medication costs were substantially more costly for the clozapine group than for the haloperidol group. These costs were offset by fewer hospital days in the clozapine group (24.3 fewer hospital days). Treatment with clozapine was also associated with significantly better clinical outcomes. The clozapine group showed improvements in PANSS scores relative to the haloperidol group, as well as significantly higher scores on QOL and EPS assessment scales. Overall, clozapine was cost neutral, but more clinically effective than haloperidol. This study was considered to be a more definitive cost-effectiveness analysis than previous studies.
Essock et al. reported results from a prospective randomized open-label study comparing clozapine (n=138, 486mg/day) with standard care (n=89, neuroleptic/psychosocial services).119 Patients were screened in 1991 from Connecticut's State psychiatric hospitals for treatment-resistant schizophrenia (>=2 drug trials) or schizoaffective disorder. The trial lasted two years. Hospitalization (i.e., time to readmission and probability of discharge) was used as a proxy for costs. Preliminary data show decrease in the rate of readmission for those treated with clozapine compared to those treated with typical agents (3% versus 29% at 6 months and 17 versus 41% at 1 year for clozapine versus typical agents). However, the probability of discharge was not significantly better for clozapine than for standard care. BPRS and QOL scores reveal that patients treated with clozapine show significantly reduced side effects and disruptiveness than those treated with conventional antipsychotics. However, clozapine was no more effective than were typical agents in reducing symptoms, improving QOL or probability of life.
Another historical comparator retrospective study compares clozapine (n=133) to conventionals (n=51) one year prior to and two years after therapy in treatment-resistant patients.120 Total costs for the clozapine group were increased in the first year after treatment but decreased in the second year of treatment for both ITT and completer analysis. Cost-reductions were more substantial in completer analysis, but ignoring the cost of drop-outs is misleading.50 The net treatment costs over the three-year period were $1,029 greater for the clozapine group than the neuroleptic group for those patients who completed treatment (for clozapine, n=87 one year before and first year after index date; n=46 in second year). However, assuming a shorter initial hospital stay (14 days), clozapine was found to be more cost-saving (3-year net savings of $15,036).
Another historical comparator study compares the cost of treatment with clozapine (n=86) to conventional therapy (n not stated) five years prior to and one and two years after treatment. Costs and probability estimates were taken from manufacturers' quarterly reports and patient records from a clinical investigation.121 Clozapine patients were participating in a clinical trial in the inpatient setting. Patients receiving conventional therapies were considerably less seriously ill than clozapine patients (which may underestimate the benefit of clozapine). The study found an average cost savings of $20,000 by the second year for patients who completed two years of treatment with clozapine versus patients who were treated with conventional antipsychotics. However, the study did not measure clinical outcomes for the control group. The rehospitalization rate was substantially lower for clozapine versus conventional antipsychotics (27.8% versus 56.2%). Total hospital costs from the five-year period before treatment to one and two years after treatment went from $73,403 to $58,941 to $28,367 with clozapine and $72,121 to $67,934 to $61,518 with conventional therapy, demonstrating substantial cost-savings in the second year.
A small retrospective historical comparator study evaluated clozapine responders with two years of follow-up (n=37) in a university-based ambulatory clinic. Cost data (inpatient and outpatient treatment, housing costs, other costs, and family burden) were available for 47 of the 96 treatment-resistant patients who participated in a clinical study. Outcome measurements were psychopathology, quality of life, global functioning, work function and rehospitalization. Results indicated that a dramatic decrease in the frequency and cost of rehospitalization contributed to a significant decrease in cost of treatment for patients who continued clozapine treatment for at least two years. For the 37 patients who continued clozapine treatment for two years, costs decreased by $22,936 per year per patient. Including drop-outs, there was a savings of $8,702/year/patient. The study is limited by the retrospective collection of cost data, on average three years after the start of treatment with clozapine.122
The results of these numerous studies together provide strong evidence of clozapine's superior cost-effectiveness relative to older, typical antipsychotics in treatment-resistant schizophrenia. Several other uncontrolled historical comparator studies have been conducted on clozapine (Exhibit VII-3).
The retrospective historical comparator studies in Exhibit VII-3 compare one year before and up to 2.5 years after index treatment with clozapine. Overall results showed a decrease in number of patients hospitalized and/or the hospitalization rate. Results varied from cost increases to cost savings. Several studies demonstrate that although total medical costs may initially increase, by the second year of treatment cost savings begin to be realized.
There are many limitations to these studies. For example, few studies include a control group. In addition, completer analyses fail to acknowledge cases which dropped out but incurred high medical costs.50
- Newer Antipsychotics Compared to Older Antipsychotics
- Comparisons Among Antipsychotics
Exhibit VII-3. Historical Comparison Studies with Clozapine
| Reference | Study Design/Methodology (Duration, months) | Major findings |
|---|---|---|
| Frankenberg, et al. (1992)91 | Historical comparator retrospective analysis (6 mos/2.5 years) | Costs of each 6-month follow-up period in each of three settings; mean savings of $4-9k per 6-mo period at 6 months of clozapine treatment; mean savings of $19-42k per 6-mo period at 2.5 yrs of treatment; reduced number and length of hospitalizations for clozapine responders |
| Wilson (1992)92 | Historical comparator retrospective evaluation (6/6) | 34 pts (92%) remained hospitalized after 6 mos; privilege level: 38% much improved; 24% somewhat improved |
| Ghaemi, et al. (1998)123 | Historical comparator retrospective analysis (12/12) | Cost savings: $9,635 per patient per year; decreased hospitalizations |
| Luchins, et al,(1998) 124 | Historical comparator service utilization and cost assessment/ITT analysis(12/12) | Mean annual costs: drugs $648 to $6,760; medication, community services, & housing: marginal increase in total cost of treatment; mean rate of hospitalization reduced >50%, hospital days down from 23.5 to 7.6 days |
| Meltzer, et al. (1993)122 | Historical comparator retrospective database study/ITT analysis (24/24) | 2yr total cost savings: $8,702/yr/pt |
| Reid, et al. (1994)125 | Historical comparator retrospective evaluation (up to 2.5yrs) | Significantly reduced bed days and fewer hospitalizations were generalized to savings of $50,250/pt/yr at 2.5yr of treatment |
| Revicki, et al.(1990)120 | Historical comparator retrospective comparison (12/24) | Total costs (drug, hospital, outpatient services, after-care services); at 1yr: up $10,040 (completer), up $9,664 (ITT); after 2 yrs: down $9,011 (completer), down $3,518 (ITT); net effect: up $1,029 (completer), up $6,146 (ITT) |
| Honigfeld, et al. (1990)121 | Historical comparator retrospective analysis (5yrs vs 1 yr, 2 yrs) | Hosp costs/yr for 5-yr period before treatment to 1 & 2 yrs aft treatment w/clozapine vs typical ($73,403 to $58,941 to $28,367 vs $72,121 to $67,934 to $61,518); total MH care costs before to 2 yrs after treatment ($80,440 to $55,867 vs $73,067 to $64,878) Rehospitalization rate (27.8% vs 56.2%). BPRS & adverse effects reported. |
Chapter VIII. Future Directions in the Benefits Status of Psychotherapeutic Pharmaceuticals
The present study provides a single snapshot of a landscape that is rapidly changing. Numerous factors are affecting the structure of the health care payment system in the United States and the combination of these will likely result in a vastly different state of access to and utilization of pharmaceuticals in general and psychotherapeutics specifically. We believe that the principal factors include:
- The appearance of new chemical entities and generic competition to the current class of "new" psychotherapeutic medications;
- The changing understanding of the formulary by health care payers;
- The emergence of "three-tier" copayment schemes;
- The growth of mental health parity legislation; and
- Continued change in the structure of managed care and regulatory steps to assure quality.
A. New Chemical Entities and Generic Competition
The entry of new chemical entities into the psychotherapeutic market in the coming years will profoundly alter the dynamics shaping access to and utilization of these products in much the same way the launch of the current generation of products changed the market within the last decade. It can be expected that these products will be launched with at least modest price premiums to current agents.
Since the end of the primary research phase of this product, Pharmacia & Upjohn has launched reboxetine (Vestra®) as a new therapy for depression. This drug is the first in what is likely to be a new class of antidepressants that work almost exclusively on the norepinephrine system. Pfizer is expected to re-submit a New Drug Application for a new atypical antipsychotic, ziprasidone (Zeldox®) in 2000, even though this product was received a non-approvable letter from FDA in 1999.
In addition, our research shows over 10 new products for depression in Phase III, with launch dates expected as early at 2002. An additional 17 products are in Phase II, with expected launch dates as early as 2003. For schizophrenia or other psychotic disorders, we are aware of more than seven products in Phase III or already launched in other countries. It may be expected that several of these will attempt launch in the US.
However, even as these new agents are launched, the current group of antidepressants and antipsychotics will be nearing the end of their patent life. Fluoxetine will lose its patent exclusivity in 2003, with many of the other antidepressants following closely behind. The entry of generic competition will drive the prices of these agents down, even as their manufacturers attempt novel methods of extending their brand identity. For example, both Eli Lilly and Forest Labs have obtained use patents for stereochemically-pure isomers of their products, fluoxetine and citalopram. These products are currently in clinical development, and their ability to extend brand life will largely depend on the extent to which they exhibit any improvement in therapeutic profile. Eli Lilly is also testing a combination product containing both fluoxetine and olanzapine to be used in severe and/or atypical depression.
B. The Changing Meaning of the Formulary
The formularies used by health care payers is changing from a list of approved drugs that can be reimbursed to a list of preferred drugs that will be reimbursed automatically without question or paperwork. Rarely is reimbursement denied for a non-formulary drug if the consumer or provider is persistent. However, the extent to which this "hassle factor" prevents consumers or providers petitioning for off-formulary coverage is unknown.
This change in the character of formularies has been possible as many drug classes have several competing agents that offer arguably similar mechanisms of action. Therefore, for example, some formularies include a choice of only one or two SSRIs for automatic reimbursement based on the argument that all SSRIs "are the same." This argument is applied to numerous other drug classes as well, although the differential efficacy of particular agents within other drug classes is often more clear-cut.
It is commonly asserted that response to psychotherapeutics by an individual is idiosyncratic and there is no way of predicting a priori whether any one agent from a class is more likely to work in a particular individual than is another. If this assertion is true, then the interpretation and policy implications will differ depending on the perspective considered. From one perspective the use of preferred drug lists is likely to compromise the quality of mental health care because the preferred agent will not work in all eligible populations. From another perspective, use of a preferred drug list is justified because it is impossible to know whether the preferred agent will be effective in a particular patient until it is tried. Nonetheless, given that there is at least some evidence that restriction of therapeutic options to only one preferred agent is detrimental to outcomes in the treatment of depression, this formulary effect (independent of specific agent) is fertile ground for further rigorous research.13
C. Three-Tiered Copayment Requirements: Placing Greater Choice in the Hands of Consumers at a Cost
The introduction of three-tiered copayment systems represents a significant shift in how cost-sharing is applied to pharmaceutical benefits. Alongside a general increase in the level of cost-sharing required, these systems give a higher level of choice to the consumer in making pharmacotherapy decisions. Whereas in the past, the only difference in cost-sharing was between generic and branded products, three-tiered systems allow consumers a choice between two types of branded products: preferred and non-preferred. Consumers will be reimbursed for non-preferred products, but the cost-sharing required to obtain these products is significantly higher than for preferred products. Therefore consumers are allowed to make a value tradeoff on their own: is the difference in preference, efficacy, or side effects worth the difference in cost.
Although three-tiered copayment plans currently proposed cut across all drug classes, it is reasonable to assume that these plans will have a more significant impact on any group of patients who have one or more chronic, debilitating illness, such as a mental illness. This is because patients may be required to incur the higher levels of cost-sharing for one or more maintenance medication in addition to the cost sharing incurred for prescriptions to treat acute conditions.
D. Mental Health Parity Legislation: Promise and Threat
Debate continues to rage over guaranteed "parity" in insurance benefits for mental health treatment. Generally, insurers and employers resist parity along with all mandates. Advocates promote parity as a matter of equity for people who happen to suffer from a mental rather than physical form of illness, and also argue that such coverage would increase productivity and reduce costs (e.g., for physical health care, disability benefits).
Nationally, a limited form of parity was enacted in 1996, prohibiting group health plans that offer mental health benefits from imposing more restrictive annual or lifetime limits on spending for mental illnesses than they do for physical illnesses. To date, this law -- which took effect January 1, 1998 -- does not appear to have raised employer costs or tightened benefit packages in any significant way. Some plans may have countered the law through more restrictive day/visit limits or reductions in reimbursement rates for providers. Advocates continue to pursue expansions of the law, particularly to include substance abuse and to prohibit differential co-payment requirements or day/visit limits. The Administration is supportive, but will not push the issue until after Congress considers The Patients' Bill of Rights legislation (see below). The legislative outlook for expansion of parity is probably weak in the short term, but it will continue to be pursued over time. The outlook for expansion in Federally-controlled programs (e.g., Federal employees, Department of Defense) is more positive. The Federal Employee Health Benefits Program is scheduled to require parity beginning in 2001.
At the same time, individual States continue to consider and implement parity in varying forms. This legislation is an extension or alternative to the mandated minimum mental health insurance benefits that many States enacted or considered in the 1980s. To date, at least 28 states have enacted some form of parity. The chief differences concern whether the coverage includes substance abuse/chemical dependency services, only "severe mental illnesses," or all mental health conditions. In addition there is variation in the population covered by the parity legislation, ranging from most insured people to only a limited population (e.g., state employees).
Parity legislation may inadvertently pose threat to coverage of all FDA-approved psychotherapeutics. Plans that engage in aggressive formulary management of other drug classes may be able to use a parity argument to do the same for psychotherapeutics. The net result may be a less comprehensive selection of psychotherapeutics being reimbursed than had been previously.
E. The Changing Role of Managed Care
Resistance to managed care has centered on the restriction of patients' choice of plan and provider; on plans' denial of services or reimbursement; and on plans' continual reduction of provider reimbursement rates. Both Congress and most state legislatures continue to consider Patients' Bill of Rights legislation as a way to ensure some level of quality of care. The President's Commission on Consumer Protection and Quality drafted a bill of rights in 1997, which has been mandated for all Federal agencies administering or managing managed care programs, and the Administration has made Congressional enactment of a strong bill of rights a high legislative priority. While Congress rejected such legislation in the last session, they have responded to continuing public pressure by again introducing more limited bills, and some action may be taken leading up to the next election.
Mental health is a leading source of egregious examples of managed care "abuses." Plans are thought to use a highly restrictive definition of "medical necessity" to limit or deny mental health treatment, especially inpatient care. Choice of providers, access to specialty providers, and confidentiality are highly sensitive issues in mental health care, particularly for individuals with long-term or chronic conditions. Moreover, experienced specialty mental health providers -- particularly those accustomed to public sector grant funding -- have had difficulty adapting to managed care contracts and reimbursement structures. All of these concerns are subsumed within the "quality" and "patients' rights" issue.
At the same time, several managed care organizations have removed prior approval requirements designed to ascertain "medical necessity." These restrictions were usually applied to procedures and hospital inpatient admissions. However, in some cases pharmaceuticals are included in these regulations. It appears that managed care plans are beginning to adopt a less adversarial role in controlling utilization, moving instead to a role of physician education and assuring quality.
Managed care has contributed significantly to reducing mental health's share of the premium dollar (in private insurance) as well as to a fundamental restructuring of the public system, with a similar loss of visibility and importance for mental health within state governments. As a result, the constituency has less clout in demanding quality. However, the constituency is very experienced in challenging the public care system, and would be active users of any grievance/appeal and litigation options that are enacted to protect managed care consumers.
Pharmaceuticals play into these issues in several ways. First, the mental health constituency demands the latest and best medications as a key element of quality. Second, new medications are recognized as a major factor in cost increases -- particularly in mental health (with a high incidence of new drugs available). The mental health constituency is very concerned that cost pressures (with the reduced premium share or funding for mental health) may encourage managed care plans to replace clinician time with medication. An increasing concern will be whether the costs of mental health medications come out of the shrinking mental health portion of the premium/capitation rate, or out of the overall health dollar.
It is not at all clear, however, that psychotherapeutics will be alone in terms of pressure to reduce costs. Psychotherapeutics are generally considered as one of five major pharmaceutical cost centers that also include anti-infectives, cardiovascular, gastro-intestinal, and analgesics. One may expect that as the population ages, most of these categories will encounter increasing pressure to control costs as the number of patients who are candidates for these drugs increases (especially cardiovascular and gastro-intestinal agents). Although cardiovascular and gastro-intestinal drugs are potentially capable of reducing the volume of expensive medical procedures (e.g., coronary artery bypass graft, percutaneous transluminal coronary angioplasty, or endoscopy), the effects of such shifts (should they occur) remain equally unclear.
Appendixes
Appendix A. Interview Protocol
The following document displays a generic form of the interview protocol used in this study. Please note that this template was tailored specifically for the type of respondent being interviewed.
- General Background
- Services Provided
- Number of covered lives
- Geographic area(s) covered _______________________
- Full time clinical staffing
- Medical directors
- Number ______________________________
- Specialty (ies) _________________________
- Pharmacists
- Number ___________________
- Psychiatrists
- Number ___________________
- Psychologists
- Number ___________________
- Benefit Design
- Which of the following coverages do you offer?
- Inpatient Mental Health
- Outpatient Mental Health
- Employee Assistance Programs (EAP)
- Other:
- Are pharmaceutical benefits provided for:
- Inpatient
- Outpatient
- EAP
- Other:
- What types of patients do you manage?
- What persons or patients otherwise denied coverage (e.g., drug coverage for non-Medicaid populations) are eligible for your programs?
- Once patients have exceeded their limit on services provided under your plans, where do they typically receive their care?
- In what settings does your system provide mental health services?
- State hospital
- Community-based Centers
- Individual Providers
- Who is responsible for managing the plan's pharmacy benefit?
- (If carved out to PBM) Can you describe the extent to which benefits are coordinated between your plans and the PBMs?
- Are you at risk for the pharmacy benefit?
- How are pharmaceutical benefits financed?
- What mechanisms are in place to coordinate inpatient and outpatient pharmaceutical benefits, with particular regard to the use of different medications?
- Are there any pharmaceuticals that require a specialist to prescribe in order to approve coverage (i.e., are there drugs that a Primary Care Physician (PCP) is not allowed to prescribe)?
- Please describe any differences between what is covered for inpatient versus outpatient services.
- Antipsychotics
- Antidepressants
- Do your plans have differences in the pharmaceutical benefits for behavioral health relative to other classes of pharmaceuticals?
- Do psychotropic drugs available to your covered persons vary according to:
- Inpatient/outpatient?
- Prescriber specialty?
- EAP or other programs?
- Are pharmaceutical benefits for psychotropics reimbursed under the pharmacy benefit or under the behavioral health benefit?
- Which of the following coverages do you offer?
- Formulary Issues
- Do your plans use a formulary?
- Which of the following products are included on your formulary?
| Antipsychotics | SSRIs | Others |
|---|---|---|
| Risperidone (Risperdal) |
Citalopram (Celexa) |
Buproprion (Wellbutrin) |
| Olanzapine (Zyprexa) |
Fluoxetine (Prozac) |
Nefazadone (Serzone) |
| Quetiapine (Seroquel) |
Fluxvoxamine (Luvox) |
Venlafaxine (Effexor) |
| Clozapine (Clozaril) |
Paroxetine (Paxil) |
TCAs (Elavil, Pamelor, etc.) |
| Haloperidol (Haldol) |
Sertraline (Zoloft) |
MAOIs (Nardil, etc.) |
| Chlorpromazine (Thorazine) |
Mirtazapine (Remeron) |
|
| Others (fluphenazine, etc.) |
-
- Are there any State laws mandating coverage for a particular psychotropic drug?
- Do you actively enforce compliance with the formulary? What methods do you use?
- Do you engage in switching practices?
- Active switching
- Outbound calling
- Others (specify)
- Is switching more or less frequent for psychotropics than for physical health medications?
- Do you use or require generic or therapeutic substitution? For which drugs?
- What is the composition of your P & T committee? How often do they meet to consider new products?
- Do you include any behavioral health specialists on your P&T committee?
- (If a PBM is in place) Please describe your working relationship with the PBM's P&T committee.
- Please describe how decisions are made to include/exclude particular drugs from approved formulary lists.
- What are the most important pieces of information necessary to make formulary decisions? Please rank these from most to least important.
- Safety
- Effectiveness
- Cost effectiveness
- Cost
- Therapeutic duplication
- Consumer/provider choice
- Do these practices differ for psychotropics compared to other pharmaceutical classes? (If yes, rerank question 4)
- Are external benefit consultants used in the decision-making process to set drug benefit coverage policies?
- Do you run any real world effectiveness trials, registries, or formal reviews of specific drug classes to assess their suitability for formulary inclusion?
- Do you collect any pharmacoeconomic/cost-effectiveness data on recipients of psychotropic medications?
- How does consumer demand for a particular drug influence your decision to include it on your formulary or otherwise make it available to your patients?
- Is the mean time from FDA approval to formulary acceptance longer for psychotropics than other class of drugs?
- What can manufacturers do to speed formulary acceptance (e.g., present cost-effectiveness data from a prospective clinical trial, modify trial design to demonstrate superiority over current agents, etc.)?
- What are you doing to speed formulary review of new products?
- What is currently in place as far as contracts and rebates with pharmaceutical companies? Are these different for psychotropics versus other therapeutic classes?
- Mail Service
- Are psychotropics available through mail service programs?
- Are the available discounts to the consumer/payer through mail order the same as those available for physical health medications?
- Treatment Guidelines, Disease Management and Other Related Programs
- Please describe your approach to inpatient and outpatient case management for schizophrenia, depression, obsessive compulsive disorder, and manic depressive-bipolar disorder.
- Where do pharmaceuticals fit within the sum of treatment for schizophrenia, depression, OCD, and MD/Bipolar disorder? Please cite specific practices or drugs.
- Have you designed any treatment or diagnosis algorithms for schizophrenia, depression, MD-bipolar disorder, or OCD?
- Describe your approach to designing these programs/algorithms.
- How do these protocols differ between the State hospital, Community-based Centers, and Medicaid (if applicable)?
- What are your first-line choices for (indicate class or brand name, and rationale)?
- Antipsychotics
- Antidepressants
- Are step-care protocols administered by your pharmacy claims processor?
- If a new psychotropic is added to the formulary and treatment protocols and practice guidelines are updated or altered, how are these disseminated to the providers?
- Provider and Patient Compliance
- Do you monitor providers for compliance with guidelines? Please describe how you do so.
- How effective have these programs been in assuring quality (e.g., appropriate choice of medication and/or dosing).
- Do you use any formal programs to assist patients with medication compliance? Please describe.
- Can you estimate the number of covered lives?
- What is the program status?
- How effective have these programs been?
- What measures of effectiveness do you use?
- Do you monitor providers' prescribing practices to insure they dose patients correctly (e.g., prescribe at least a minimal therapeutic does, etc.)? If so, how do you monitor this?
- Do you have any special programs for treating high cost (e.g., treatment refractory) cases?
- High-cost episodes of care
- High-cost lifetime of care
- Do you offer any discounts, incentives, or other programs to increase access/compliance/utilization for use in high cost cases?
- Have you designed (do you use) any special programs to target historically under-served populations (e.g., African Americans, Hispanics)? Please describe.
- Prior Authorization
- What psychotropic drugs are commonly placed on your prior authorization list?
- What is your justification for requiring PA?
- Who initiates a PA request?
- Who reviews a PA request?
- How long does a PA request take for a decision?
- How is the requestor notified of PA decision?
- Do you have an automated PA processing system (e.g., computer, telephone, etc.)?
- Appeal Programs
- Please describe the appeal mechanisms for
- Not medically necessary PA determinations (if PA exists)
- Off formulary coverage
- Do you assist patients/providers in making appeals for denied coverage?
- What information is required to make an appeal?
- What percent of appeals are overturned?
- Generally speaking, why are appeals overturned?
- Who adjudicates appeals?
- Do consumers/providers have the right to appeal to an outside, independent adjudicator?
- During the appeal process are there usually provisions to make emergency approvals for dispensing of the contested drug?
- DUR and Related Programs
- Please describe your DUR program.
- Is the program:
- In-House
- Contracted
- Who monitors the DUR program?
- What is the major goal of the DUR program?
- What steps do you usually take to enforce formulary compliance, attempt to reduce drugs costs?
- What types of DUR criteria apply to psychtropics?
Appendix B. Interview Strategy
This study focused on identifying and interviewing individuals from a variety of organizations or programs represented by the following perspectives:
- Pharmaceutical companies;
- Managed behavioral health care companies;
- Health maintenance organizations;
- Pharmacy benefit managers;
- Employer-provided insurance plans;
- Publicly-funded insurance (Medicaid, Veteran's Administration, CHAMPUS);
- State Mental Health systems;
- Corrections system;
- Provider associations; and
- Consumer and advocacy groups.
In order to determine which entities or groups should be interviewed under each perspective, a qualitative approach was utilized. Moreover, the project officers and The Lewin Group team identified specific criteria that were used to select each interview target. From this criteria, a possible pool of candidates for each type of respondent was generated based on expert recommendations, data collected from the literature and other trade press articles, and personal contacts at the respective entity. Many of the final interview respondents were self-selected, as interviews with some companies or organizations proved particularly challenging and the project team resorted to alternate candidates.
The information that follows lists the specific criteria for each respondent type and consequently, the final list of candidates. No delineation is made as to whether the interview respondent was a first, second, or third choice.
A. Pharmaceutical Companies
Pharmaceutical manufacturers were selected based on the following criteria: 1) medium to large size company; and 2) company has current products and products in development in the area of newer atypical antidepressants and/or antipsychotics. As a result, Janssen, AstraZeneca, Eli Lilly, and GlaxoWellcome (GW) were selected.(1) GW and Eli Lilly are both large companies with current pharmaceuticals directed toward treating depression. Eli Lilly also has an atypical antipsychotic on the market to treat schizophrenia. Medium-sized firms include AstraZeneca and Janssen, both of which offer atypical antipsychotics to treat schizophrenia. Specialized neuropharmaceutical companies (e.g., Neurogen) do not have products in development beyond Phase I, and were excluded for this reason. 1
1 One pharmaceutical company is not listed for confidentiality reasons.
| Originator | Name | Current Indications | Phase III | Mechanism of Action |
|---|---|---|---|---|
| Large Pharmaceutical Companies | ||||
| Glaxo Wellcome | Wellbutrin® |
|
Unknown | |
| Eli Lilly and Company | Prozac® |
|
|
Selective serotonin reuptake inhibitor (SSRI) |
| Zyprexa® (olanzapine) |
|
|
Multiple | |
| Medium Sized Pharmaceutical Companies | ||||
| AstraZeneca | Seroquel® |
|
Unknown | |
| Janssen | Risperdal® |
|
Unknown | |
B. Managed Behavioral Health Care Organizations
The criteria used to select three managed behavioral health care organizations (MBHCOs) for this study included:
- Number of covered lives;
- Geographic proximity (in order to fulfill the required two site visits);
- Client make-up; and
- Involvement in other social service sectors.
As a result, Magellan and Value/Options were selected as they represent the two largest MBHCOs and are located in the Washington, DC metropolitan area which is in close proximity to The Lewin Group offices. Additionally, Magellan and Value/Options are involved in other sectors, such as the prison system, welfare, and state Medicaid programs. The third MBHCO, United Behavioral Health, was selected for its client make-up, which favors the private sector (off-setting the large public sector client make-up of Magellan and Value/Options) and because The Lewin Group has an excellent relationship with UBH.
| Organization (Covered Lives) |
Reason For Inclusion |
|---|---|
| Magellan (65 million) |
|
| Value/Options (22 million) |
|
| United Behavioral Health (UBH) (16 million) |
|
C. Large Integrated HMOs
In order to examine a more typical arrangement, The Lewin Group decided to focus on integrated health maintenance organizations (HMOs) for this study. Consequently, The Lewin Group identified participants based on the following criteria:
- Receive favorable NCQA ratings;
- Offer nationally-recognized behavioral health programs;
- Cover over 500,000 lives;
- Operate under at least one of the following models: group, staff, network, PPO; and
- Operate in geographically diverse regions.
Additionally, the pool of HMOs interviewed were required to represent a variety of financing mechanisms and risk-sharing arrangements (i.e., fee-for-service, capitation) as well as pharmacy management models (i.e., in-house, carve-out). The final HMOs selected included: FirstOption, Harvard Pilgrim, HealthPartners, Group Health, and Kaiser Permanente.
| HMO | Reason For Inclusion |
|---|---|
| First Option (New Jersey) (250,000, consolidated w/Physicians Health Services as of 1/2000) |
|
| Harvard Pilgrim (1.6 million) |
|
| HealthPartners (Minnesota) (800,000) |
|
| Group Health Cooperative of Puget Sound (Washington) (600,000) |
|
| Kaiser Permanente Mid-Atlantic (540,000) |
|
D. Pharmaceutical Benefits Managers
The following criteria were used to select the pharmacy benefit managers (PBMs) interviewed:
- National or regional market presence;
- Independently operated or carved out from other entity; and
- Linked to other interview respondent type (i.e., employer, Medicaid program).
As a result, five PBMs were identified and interviewed: Value Rx/Express Scripts, PCS Health System, Rx Innovations, Prescription Solutions, and Advance Paradigm.
| Company (Covered Lives) | Reason for Inclusion |
|---|---|
| Value Rx/Express Scripts (38.5 million) |
|
| PCS Health System (>50 million) |
|
| Rx Innovations (~5,000) |
|
| Prescription Solutions (>3 million) |
|
| Advance Paradigm (27 million) |
|
E. Employers
In order to gain an industry-wide perspective on the approach to behavioral health and pharmacy benefits, The Lewin Group interviewed the William Mercer Corporation. As a result, the following criteria were identified as necessary characteristics of the employers selected for this study:
- Place a high priority on behavioral health;
- Provide a range of innovative and flexible benefits (e.g., offer multiple levels of care beyond inpatient and outpatient treatment);
- Encourage employees to access behavioral health care;
- Represent a geographically diverse group;
- Operate national lines of business; and
- Self-insure.
From this established criteria, two employers were named: Motorola and Delta Airlines. Motorola and Delta were identified as large Fortune 500 employers who self-insure, and with whom The Lewin Group has established contacts. Motorola presents an interesting perspective as it customized a behavioral health specialist provider network based on employee preferences and past claims data in order to ensure that its employees requiring mental health or substance abuse treatment receive the highest possible quality of care. On the other hand, Delta Airlines, as a member of the airline industry, faces a variety of challenges specific to pilots. Namely, federal regulations ground pilots taking psychoactive medications, including standard antidepressants, and often make pilots fearful of seeking any behavioral health treatment. Delta recognized the special needs of this unique population and has attempted to structure its benefits plan accordingly.
| Company (Covered Lives) | Reason for Inclusion |
|---|---|
| Motorola (58,800 employees) |
|
| Delta Airlines (200,000) |
|
F. Federal and State Programs (HCFA(now known as CMS), IHS, CHAMPUS, VA, Medicaid)
The Health Care Financing Administration(now known as Centers for Medicare and Medicaid Services(CMS)) (HCFA(now known as CMS)) and the Indian Health Service (IHS) were automatically selected without the use of specific criteria in order to provide a necessary background behind federally-operated and state- or tribally-administered public insurance programs. More specifically, HCFA(now known as CMS) handles the administration of the publicly funded programs, Medicaid and Medicare. The IHS is responsible for the Native American population which has a documented prevalence of behavioral health disorders in its communities.
The Civilian Health and Medical Program of the Uniformed Services (CHAMPUS) and the Veteran's Administration (VA) were selected as additional federal interviews, but ones that provide more narrow perspectives, largely dictated by the specific populations served under each program. Under CHAMPUS, active duty individuals and their dependents along with retirees are covered, while the VA covers those individuals who were in active duty but retired due to a service-related disability or are a dependent of a veteran. These two perspectives present unique snapshots as Federal programs instituted on an individual basis through treatment facilities (CHAMPUS) or networks (VA). Additionally, the CHAMPUS viewpoint provides and interesting perspective into the social and cultural issues associated with serving in the military with a diagnosed mental illness.
On the state level, four Medicaid programs were selected based on the following criteria:
- Represent geographic diversity;
- Offer range of benefits from generous to less comprehensive;
- Utilize a variety of reimbursement mechanisms (i.e., managed care, fee-for-service); and
- Structure behavioral health and pharmaceutical services in different ways (i.e., integrated, carve-out).
As such, California, Georgia, Texas, and Wisconsin were selected. Each state handles the administration of its behavioral health and pharmacy benefit in a slightly different manner and each state has different restrictions attached to its formulary and/or prescription coverage.
| Program (Covered Lives) |
Reason for Inclusion |
|---|---|
| Federal | |
| HCFA(now known as CMS) |
|
| Indian Health Service, Navajo Region (201,583) |
|
| Department of Defense (8 million) |
|
| Veteran's Administration (10-11 million) |
|
|
State |
|
| California (4.9 million) |
|
| Texas (2.5 million) |
|
| Georgia (1.2 million) |
|
| Wisconsin (390,000) |
|
G. State Mental Health Systems
The following criteria were used to identify four public sector mental health systems to be interviewed:
- Complement the state Medicaid programs that were selected to be interviewed;
- Represent geographic diversity (Southwest, Mid-Atlantic, New England, and Midwest); and
- Operate a system either closely tied to or completely separate from its state Medicaid program.
As a result, Arizona, Maryland, Massachusetts, and Ohio were selected to be interviewed. More specifically, Arizona, Ohio, and Maryland operate separate public sector mental health systems from their state Medicaid programs. However, Arizona uses the same infrastructure as its Medicaid program and Maryland consistently collaborates with its Medicaid program. Massachusetts integrates its Medicaid and state mental health systems under a managed care framework.
| State (Covered Lives, Reported by Respondent) | Reason for Inclusion |
|---|---|
| Ohio (250,000) |
|
| Massachusetts (24,500) |
|
| Arizona (102,000) |
|
| Maryland (Not Reported) |
|
H. Corrections System
The corrections system was selected as an interview type because of the documented mental illness of the population it serves. More specifically, New York's correctional system was identified through expert recommendations as an appropriate interview target because it is well-known for instituting a progressive and innovative prison system statewide.
I. Professional Associations
Two professional associations, the American Psychiatric Association (APA), which represents psychiatrists, and the American Academy of Family Physicians (AAFP), which represents family physicians, were identified to participate in this study. Since psychiatrists primarily prescribe antipsychotics and antidepressants and primary care physicians (often family practice physicians) can prescribe antidepressants and/or make referrals to a psychiatrist for such a prescription, these two professional associations were selected as the most appropriate to present the desired perspectives of physician prescribing practices around the use of newer atypical antipsychotics and antidepressants.
| Association | Reason for Inclusion |
|---|---|
| American Psychiatric Association |
|
| American Academy of Family Physicians |
|
J. Consumer Advocay Associations
Two consumer associations, the National Alliance for the Mentally Ill (NAMI) and the National Mental Health Association (NMHA), were selected because of their national presence in the mental health field. Additionally, NAMI specializes in advocating for consumers who suffer from schizophrenia and their families. These two organizations' perspectives were essential in understanding the consumers' point-of-view and gaining a more balanced picture of the access and utilization issues associated with newer atypical antidepressants and antipsychotics.
| Association | Reason for Inclusion |
|---|---|
| National Alliance for the Mentally Ill |
|
| National Mental Health Association |
|
Appendix C. Interview Respondents
| Stakeholder Group | Interviews Completed | Request for Interview Refused or Unable to Schedule |
|---|---|---|
| Federal Government | Health Care Financing Administration(now known as Centers for Medicare and Medicaid Services(CMS)) Indian Health Service
Pharmaco-Economic Center Mental Health Policy Division Tri-Care Mental Health Benefits
Veterans Administration Mental Health Division |
|
| State Mental Health Systems | Arizona Maryland Massachusetts Ohio |
|
| State Medicaid Programs | California Georgia Texas Wisconsin |
|
| State Correctional Systems | New York State | |
| Pharmaceutical Companies | AstraZeneca
(Anonymous by Request)
|
AstraZeneca
Pfizer Solvay Pharmaceuticals |
| Health Maintenance Organizations (HMOs) | Harvard Pilgrim Health Partners (MN) First Option (NJ) Group Health (WA) Kaiser Permanente Mid-Atlantic |
Aetna US Healthcare, Mid-Atlantic Health Options HMO (BCBC, Florida) Kaiser Permanente, Northern California Kaiser Permanente, Pacific Northwest |
| Pharmacy Benefit Managers (PBMs) | ValueRx/Express Scripts PCS Health System Prescription Solutions PBM Division of Pacificare (CA) Rx Innovations Division of Value/Options One Additional PBM (Anonymous by Request) |
|
| Behavioral Health Managed Care Organizations (BHMCOs) | Magellan Value Options |
United Behavioral Health |
| Employers | Delta Airlines Motorola William Mercer and Company |
Washington Business Group on Health |
| Consumer and Advocacy Associations | National Alliance for the Mentally Ill National Mental Health Association |
|
| Provider Associations | American Academy of Family Physicians American Psychiatric Association |
American College of Physicians |
Note: Due to geographic and other scheduling difficulties, it was often necessary to conduct more than one interview with each respondent. As a result, the number of interviews reported in Table I-3 is greater than the number of interviewees.
Reference List
| 1. | Health Care Financing Administration(now known as Centers for Medicare and Medicaid Services(CMS)). National health expenditures projections. 1999. |
| 2. | National health expenditures aggregate amounts and average annual percent change, by type of expenditure: selected calendar years 1960-97. Accessed November 17, 1999. Web Page. Available at: www.hcfa.gov/stats/nhe%2Doact/tables/t10.htm. |
| 3. | The National Institute for Health Care Management. Issue brief: factors affecting the growth of prescription drug expenditures. 1999. |
| 4. | The Lewin Group. Health plan benefit barriers to access to pharmaceutical therapies for behavioral health. The Substance Abuse and Mental Health Services Administration; 1998. |
| 5. | Physicians' Desk Reference. 53 ed. Montvale, NJ: Medical Economics Company; 1999. |
| 6. | Croghan TW, Johnstone BM, Buesching DP, Kessler RC. Information needs for medication coverage decisions in a state Medicaid program. Med Care. 1999;37:AS24-31. |
| 7. | Calkins D, Fernadopulle RJ, Marino BS e. Health Care Policy. Cambridge, MA: Blackwell Science; 1995. |
| 8. | Levy RA, Cocks D. Component Management Fails to Save Health Care System Costs. Resong, VA: National Pharmaceutical Council; 1996. |
| 9. | Moore WJ, Newman RJ. US Medicaid drug formularies: do they work? Pharmacoeconomics. 1992;1:28-31. |
| 10. | Horn SD. HMO formularies and care costs. Lancet. 1996;348:619-20. |
| 11. | Horn SD. Unintended consequences of drug formularies. Am J Health Syst Pharm. 1996;53:2204-6. |
| 12. | Ross-Degnan D, Soumerai SB. HMO formularies and care costs. Lancet. 1996;347:1264. |
| 13. | Streja DA, Hui RL, Streja E, McCombs JS. Selective contracting and patient outcomes: a case study of formulary restrictions for selective serotonin reuptake inhibitor antidepressants. Am J Managed Care. 1999;5:1133-42. |
| 14. | Scott-Levin. Press Release: The Pharmaceutical Industry: More Reps and More Promotion Fuel New Launches. June 18, 1999. |
| 15. | Scott-Levin. Press Release: Antidepressants Top Medical Journal Advertising. August 26, 1999. |
| 16. | Issue Brief: Factors Affecting the Growth of Prescription Drugs Expenditures. National Institute for Health Care Management; 1999. |
| 17. | Scott-Levin. Press Release: Spending on Rx Drug Ads Reaches $1.1 Billion in First 10 Months of 1998; Surpasses 1997 Total. January 27, 1999. |
| 18. | Government of the United States. Washington, DC: General Accounting Office; 1996. |
| 19. | The Lewin Group. Pharmaceutical Benefits Under State Medical Assistance. Reston, VA: National Pharmaceutical Council; 1998. |
| 20. | Smith SJ. HMO Raises Drug Co-Pay. Rochester Democrat and Chronicle. August 9, 1999:(A);8A. |
| 21. | Drug formularies. Is their growth among HMOs leveling off? Med Econ. 1997;74:39. |
| 22. | Managed care outlook. Formularies get stricter. Manag Care. 1997;6:130. |
| 23. | Meltzer HY. Outcome in schizophrenia: beyond symptom reduction. J Clin Psychiatry. 1999;60 Suppl 3:3-7; discussion 8. |
| 24. | Lawrence J. Formularies tighten and physicians adapt. Manag Care. 1998;7:23-6, 29-30. |
| 25. | Richardson S. Letter to State Medicaid Directors. February 12, 1998. |
| 26. | Walser BL, Ross-Degnan D, Soumerai SB. Do open formularies increase access to clinically useful drugs? Health Aff. 1996;15:95-109. |
| 27. | The Lewin Group. Pharmaceutical Benefits Under State Medical Assistance. Reston, VA: National Pharmaceutical Council; 1996. |
| 28. | Data watch. Is this the way to manage pharmacy costs? Bus Health. 1997;15:94. |
| 29. | Cassak D. Managing Physicians, Managing Prescriptions. In Vivo. 1998;April:37-47. |
| 30. | Depression Guideline Panel. Depression in Primary Care: Volume 2. Treatment of Major Depression. Clinical Practice Guideline, Number 5. Rockville, MD: U.S. Department of Health and Human Services, Public Health SErvice, Agency for Health Care Policy and Research. AHCPR Publication No. 93-0551. 1993. |
| 31. | Lehman AF, Steinwachs DM. Translating research into practice: the Schizophrenia Patient Outcomes Research Team (PORT) treatment recommendations. Schizophr Bull. 1998;24:1-10. |
| 32. | American Psychiatric Association. Practice Guidelines for Major Depressive Disorder in Adults. Washington, DC: American Psychiatric Association. 1993. |
| 33. | American Psychiatric Association. Practice Guidelines for the Treatment of Patients With Schizophrenia. Washington, DC: American Psychiatric Association; 1997. |
| 34. | Shon SP, Crismon ML, Toprac MG, et al. Mental health care from the public perspective: the Texas Medication Algorithm Project. J Clin Psychiatry. 1999;60 Suppl 3:16-20; discussion 21. |
| 35. | TMAP website. accessed December 8, 1999. Web Page. Available at: www.mhmr.state.tx.us/meds. |
| 36. | Department of Veterans Affairs VHA. Publication No. 97-0006. 1997. |
| 37. | PCS website. Clinical formulary and prescribing guidelines. Accessed January 5, 2000. Web Page. Available at: www.druglist.com. |
| 38. | Magellan Develops Guidelines for Antidepressant Use. PharmacoEconomics & Outcomes News. 1999;214:7. |
| 39. | Sullivan S, Mather D, Augenstein D, Atherly D, Fullerton DSP. Guidelines for the submission of clinical and economic data supporting formulary consideration. Am J Managed Care. 1999;5:277. |
| 40. | Langley PC, Martin RE. Managed care guidelines for the economic evaluation of pharmaceuticals. Am J Manag Care. 1997;3:1013-21. |
| 41. | Tran PB, Hamilton SH, Kuntz AJ, et al. Double-blind comparison of olanzapine versus risperidone in the treatment of schizophrenia and other psychotic disorders. J Clin Psychopharmacol. 1997;17:407-18. |
| 42. | Revicki D, Simon G, VonKorff M, Wagner E, Heiligenstein J, Luce B. Cost-effectiveness of fluoxetine versus tricyclic antidepressants: a randomized study in primary care. Annu Meet Int Soc Technol Assess Health Care. 1996;12:32. |
| 43. | Celexa scripts for patients under 20 account for 4% of use--Forest. The Pink Sheet. 1999;61:14-15. |
| 44. | Conner TM, Crismon ML, Still DJ. A critical review of selected pharmacoeconomic analyses of antidepressant therapy. Ann Pharmacother. 1999;33:364-72. |
| 45. | Sclar DA, Skaer TL, Robison LM, Stowers JK. Economic appraisal of antidepressant pharmacotherapy: critical review of the literature and future directions. Depress Anxiety. 1998;8 Suppl 1:121-7. |
| 46. | Simon GE, Fishman P. Cost implications of initial antidepressant selection in primary care. Pharmacoeconomics. 1998;13:61-70. |
| 47. | Stewart A. Choosing an antidepressant: effectiveness based pharmacoeconomics. J Affect Disord. 1998;48:125-33. |
| 48. | Hylan TR, Buesching DP, Tollefson GD. Health economic evaluations of antidepressants: a review. Depress Anxiety. 1998;7:53-64. |
| 49. | Davis R, Wilde M. Sertraline: a pharmacoeconomic evaluation of its use in depression. Pharmacoeconomics. 1996;10:409-31. |
| 50. | Zito J. Pharmacoeconomics of the new antipsychotics for the treatment of schizophrenia. Schizophrenia. 1998;21:181-202. |
| 51. | Brown CS, Markowitz JS, Moore TR, Parker NG. Atypical antipsychotics: Part II: Adverse effects, drug interactions, and costs. Ann Pharmacother. 1999;33:210-7. |
| 52. | Revicki DA. Pharmacoeconomic studies of atypical antipsychotic drugs for teh treatment of schizophrenia. Schizophrenia Research.1999;35:S101-109. |
| 53. | Foster RH, Goa KL. Olanzapine. A pharmacoeconomic review of its use in schizophrenia. Pharmacoeconomics. 1999;15:611-40. |
| 54. | Foster RH, Goa KL. Risperidone. A pharmacoeconomic review of its use in schizophrenia. Pharmacoeconomics. 1998;14:97-133. |
| 55. | Glazer WM, Johnstone BM. Pharmacoeconomic evaluation of antipsychotic therapy for schizophrenia. J Clin Psychiatry. 1997;58 Suppl 10:50-4. |
| 56. | Revicki DA. Pharmacoeconomic evaluation of treatments for refractory schizophrenia: clozapine-related studies. J Clin Psychiatry.1999;60 Suppl 1:7-11; discussion 28-30. |
| 57. | Wilde MI, Benfield P. Fluoxetine. A pharmacoeconomic review of its use in depression. Pharmacoeconomics. 1998;13:543-61. |
| 58. | Wilde MI, Whittington R. Paroxetine. A pharmacoeconomic evaluation of its use in depression. Pharmacoeconomics. 1995;8:62-81. |
| 59. | Revicki DA. Methods of pharmacoeconomic evaluation of psychopharmacologic therapies for patients with schizophrenia. J Psychiatry Neurosci. 1997;22:256-66. |
| 60. | Mulrow D.C., William J.W., Trivedi M., et. al. Rockville, MD. Agency for Health Care Policy and Research. 1999. AHCPR Publication ; No. 99-E014. |
| 61. | Rice DP, Miller LS. The economic burden of affective disorders. Br J Psychiatry Suppl. 1995:34-42. |
| 62. | Greenberg PE, Stiglin LE, Finkelstein SN, Berndt ER. The economic burden of depression in 1990. J Clin Psychiatry. 1993;54:405-18. |
| 63. | Smith W, Sherrill A. A pharmacoeconomic study of the management of major depression: patients in a TennCare HMO. Medical Interface. 1996;88-92. |
| 64. | Boyer W, Feighner J. The financial implications of starting treatment with a selective serotonin reuptake inhibitor or tricyclic antidepressant in drug-naive depressed patients. Jonsson B RJ, editors. Health Economics of Depression. Chichester, West Sussex: Wiley; 65-75. |
| 65. | Croghan TW, Lair TJ, Engelhart L, et al. Effect of antidepressant therapy on health care utilization and costs in primary care.Psychiatr Serv. 1997;48:1420-6. |
| 66. | Sclar DA, Robison LM, Skaer TL, et al. Antidepressant pharmacotherapy: economic outcomes in a health maintenance organization.Clin Ther. 1994;16:715-30; discussion 74. |
| 67. | Sclar DA, Skaer TL, Robison LM, Galin RS, Legg RF, Nemec NL. Economic outcomes with antidepressant pharmacotherapy: a retrospective intent-to-treat analysis. J Clin Psychiatry. 1998;59 Suppl 2:13-7. |
| 68. | Hylan TR, Crown WH, Meneades L, et al. Tricyclic antidepressant and selective serotonin reuptake inhibitors antidepressant selection and health care costs in the naturalistic setting: a multivariate analysis. J Affect Disord. 1998;47:71-9. |
| 69. | Obenchain RL, Melfi CA, Croghan TW, Buesching DP. Bootstrap analyses of cost effectiveness in antidepressant pharmacotherapy.Pharmacoeconomics. 1997;11:464-72. |
| 70. | Bentkover J, Feighner J. Cost analysis of paroxetine versus imipramine in major depression. Pharmacoeconomics. 1995;8:223-232. |
| 71. | Jonsson B, Bebbington P. What price depression? The cost of depression and the cost-effectiveness of pharmacological treatment. Br J Psychiatry. 1994;164:665-73. |
| 72. | Lapierre Y, Bentkover J, Schainbaum S, Manners S. Direct cost of depression: analysis of treatment costs of paroxetine versus Imipramine in Canada. Can J Psychiatry. 1995;40:370-7. |
| 73. | Skaer T, Sclar D, Robison L, Galin R, Legg R, Nemic N. Economic valuation of amitriptyline, desipramine, nortriptyline, and sertraline in the management of patients with depression. Current Therapeutic Research. 1995;56:556-67. |
| 74. | Forder J, Kavanagh S, Fenyo A. A comparison of the cost-effectiveness of sertraline versus tricyclic antidepressants in primary care.Journal of Affective Disorders. 1996;38:97-111. |
| 75. | Einarson TR, Arikian S, Sweeney S, Doyle J. A model to evaluate the cost-effectiveness of oral therapies in the management of patients with major depressive disorders. Clin Ther. 1995;17:136-53. |
| 76. | Einarson TR, Addis A, Iskedjian M. Pharmacoeconomic analysis of venlafaxine in the treatment of major depressive disorder.Pharmacoeconomics. 1997;12:286-96. |
| 77. | Griffiths RI, Sullivan EM, Frank RG, et al. Medical resource use and cost of venlafaxine or tricyclic antidepressant therapy. Following selective serotonin reuptake inhibitor therapy for depression. Pharmacoeconomics. 1999;15:495-505. |
| 78. | Revicki DA, Brown RE, Keller MB, Gonzales J, Culpepper L, Hales RE. Cost-effectiveness of newer antidepressants compared with tricyclic antidepressants in managed care settings. J Clin Psychiatry. 1997;58:47-58. |
| 79. | Boyer P, Danion J, Bisserbe J, Hotton J, Troy S. Clinical and economic comparison of sertraline and fluoxetine in the treatment of depression. Pharmacoeconomics. 1998;13:157-69. |
| 80. | Sclar DA, Robison LM, Skaer TL, et al. Antidepressant pharmacotherapy: economic evaluation of fluoxetine, paroxetine and sertraline in a health maintenance organization. J Int Med Res. 1995;23:395-412. |
| 81. | Rupp A, Keith J. The cost of schizophrenia: assessing the burden. Psychiatr Clin North Am. 1993;16:413-23. |
| 82. | Albright P, Livingstone S, Keegan D, Ingham M, Shrikhande S, Le Lorier J. Reduction of healthcare resource utilisation and costs following the use of risperidone for patients with schizophrenia previously treated with standard antipsychotic therapy. A retrospective analysis using the Saskatchewan health linkable database. Clin Drug Invest. 1996;11:289-99. |
| 83. | Wyatt R, Henter I, Leary M, et al. An economic evaluation of schizophrenia. Soc Pyschiatry Psychiatr Epidemiol. 1995;31:196-205. |
| 84. | Carter C, Stevens M, Durkin M. Effects of risperidone therapy on the use of mental health care resources in Salt Lake County, Utah.Clin Ther. 1998;20:352-63. |
| 85. | Finley PR, Sommer BR, Corbitt JL, Brunson GH, Lum BL. Risperidone: clinical outcome predictors and cost-effectiveness in a naturalistic setting. Psychopharmacol Bull. 1998;34:75-81. |
| 86. | Lacro JP, Vonderscher CN, Kodsi AB ea. Cost analysis of risperidone in veterans with schizophrenia or schizoaffective disorder. Annual Meeting of the New Clinical Drug Evaluation Unit: Boca Raton (FL), USA. |
| 87. | Philipp M. Risperidone in patients with schizophrenia: acute responses and effects on one-year hospitalization rates. 149th Annual Meeting of the American Psychiatric Association: New York. |
| 88. | Viale G, Mechling L, Maislin G, Durkin M, Engelhart L, Lawrence BJ. Impact of risperidone on the use of mental health care resources. Psychiatr Serv. 1997;48:1153-9. |
| 89. | Addington DE, Jones B, Bloom D, et al. Reduction of hospital days in chronic schizophrenic patients treated with risperidone: a retrospective study. Clin Ther. 1993;15:917-26. |
| 90. | Lindstrom E, Eriksson B, Hellgren A, et al. Efficacy and safety of risperidone in the long-term treatment of patients with schizophrenia. Clin Ther. 1995;17:402-12. |
| 91. | Frankenberg FR, Zanarini MC, Cole JO, McElroy SL. Hospitalization rates among clozapine-treated patients. A prospective cost-benefit analysis. Ann Clin Psychiatry. 1992;4:247-50. |
| 92. | Wilson WH. Clinical review of clozapine treatment in a state hospital. Hospital and Community Psychiatry. 1992;43:700-3. |
| 93. | Guest JF, Hart WM, Cookson RF, Lindstrom E. Pharmacoeconomic evaluation of long-term treatment with risperidone for patients with chronic schizophrenia. British Journal of Medical Economics. 1996;10:69-67. |
| 94. | Palmer CS, Revicki DA, Genduso LA, Hamilton SH, Brown RE. A cost-effectiveness clinical decision analysis model for schizophrenia. Am J Manag Care. 1998;4:345-55. |
| 95. | Tollefson GD, Beaseley CM, Tran PV, et al. Olanzapine versus haloperidol in the treatment of schizophrenia, schizoaffective and schizophreniform disorders: Results of an international collaborative trial. Am J Psychiatry. 1997;154:457-65. |
| 96. | Galvin PM, Knezek LD, Rush AJ, Toprac MG, Johnson B. Clinical and economic impact of newer versus older antipsychotic medications in a community mental health center. Clin Ther. 1999;21:1105-16. |
| 97. | Nightengale BS, Garrett L, Waugh S, Lawrence BJ, Andrus J. Economic outcomes associated with the use of risperidone in a naturalistic group practice setting. Am J Manag Care. 1998;4:360-6. |
| 98. | Glazer WM, Ereshefsky L. A pharmacoeconomic model of outpatient antipsychotic therapy in "revolving door" schizophrenic patients. J Clin Psychiatry. 1996;57:337-45. |
| 99. | Mahmoud R, Engelhart L, Ollendorf D, Oster G. The Risperidone Outcomes Study of Effectiveness (ROSE): a model for evaluating treatment strategies in typical psychiatric practice. J Clin Psychiatry. 1999;60 Suppl 3:42-7; discussion 48. |
| 100. | Mahmoud R et al. 36th Annual Meeting of the American College of Neuropsychopharmacology: Kameula, Hawaii. |
| 101. | Davies A, Langley PC, Keks NA, Catts SV, Lambert T, Schweitzer I. Risperidone versus haloperidol: II. Cost-effectiveness. Clin Ther. 1998;20:196-213. |
| 102. | LeLorier J, Petersen T, Albright PS. A retrospective cohort study of the RAMQ database to study the impact of risperidone use in the province of Quebec. 150th Annual Meeting of the American Psychiatric Association: San Diego. |
| 103. | Nightengale BS, Crumly JM, Liao J, Lawrence BJ, Jacobs EW. Economic outcomes of antipsychotic agents in a Medicaid population: traditional agents vs. risperidone. Psychopharmacol Bull. 1998;34:373-82. |
| 104. | Hart WM, Lindstrom E, Guest JF. Economic impact of theuse of risperidone for the treatment of chronic schizophrenia in Ireland. Ir J Psychiatry. 1997;16:12-6. |
| 105. | Thompson D. Cost of switching from neuroleptics to risperidone and clozapine: a pilot study of the San Diego County Mental Health Services. Clin Drug Invest. 1997;14:428-33. |
| 106. | Schiller MJ, Shumway M, Hargreaves WA. Treatment costs and patient outcomes with use of risperidone in a public mental health setting. Psychiatr Serv. 1999;50:228-32. |
| 107. | Obenchain RL JB. Mixed-model imputation of cost data for early discontinuers from a randomized clinical trial. Drug Information Journal. 1999;33:191-209. |
| 108. | Hamilton SH, Revicki DA, Edgell ET, Genduso LA, Tollefson G. Clinical and economic outcomes of olanzapine compared with haloperidol for schizophrenia. Pharmacoeconomics. 1999;15:469-80. |
| 109. | Almond S, O'Donnell O. Cost analysis of the treatment of schizophrenia in the UK: a comparison of olanzapine and haloperidol.Pharmacoeconomics. 1998;13:575-88. |
| 110. | Sacristan JA, Gomez C, Salvador-Carulla L. Analisis coste-effectividad de olanzapine frenta a haloperidol en el tratamiento de la esquizofrenia en Espana. Actas Luso Esp Neurol Psiquiatr Cienc Afines. 1997;25:225-34. |
| 111. | Post HA, van Hout BA. Cost effectiveness of olanzapine in comparison to risperidone and haloperidol. Annu Meet Int Soc Technol Assess Health Care. 1997;13:134. |
| 112. | Spannheimer A, Clouth J. Pharmacoeconomic evaluation of the treatment of schizophrenia in Germany: a comparison of olanzapine and haloperidol. Data on File, Eli Lilly and Company. 1999. |
| 113. | Sacristan JA, Gomez JC, Martin J. Pharmacoeconomic assessment of olanzapine in the treatment of refractory schizophrenia based on a pilot clinical study. Clin Drug Invest. 1998;15:29-35. |
| 114. | Weiss MA, McCollum M. Cost impact of using olanzapine at a Veterans Affairs Medical Center (abstract). ValueHealth. 1998;1:25. |
| 115. | Hong WW, Rak IW, Ciuryla VT, et al. Medical-claims databases in the design of a health-outcomes comparison of quetiapine ('Seroquel') and usual-care antipsychotic medication. Schizophr Res. 1998;32:51-8. |
| 116. | Grainger DL, Edgell ET, Anderson SW, et al. Resource use and quality of life of olanzapine cmopared with risperidone: results from an international randomized clinical trial. 11th Annual Congress of the European College of Neuropsychopharmacology: Paris, France. |
| 117. | Risperdal vs. Zyprexa battle rages on. The Pink Sheet. 1998;2385:21. |
| 118. | Rosenheck R, Cramer J, Xu W, et al. A comparison of clozapine and haloperidol in hospitalized patients with refractory schizophrenia. Department of Veterans Affairs Cooperative Study Group on Clozapine in Refractory Schizophrenia. N Engl J Med.1997;337:809-15. |
| 119. | Essock SM, Hargreaves WA, Dohm FA, Goethe J, Carver L, Hipshman L. Clozapine eligibility among state hospital patients.Schizophr Bull. 1996;22:15-25. |
| 120. | Revicki et al. Hosp Community Psychiatry. 1990;41:850-54. |
| 121. | Honigfeld G, Patin J. A two-year clinical and economic follow-up of patients on clozapine. Hospital and Community Psychiatry.1990;41:882-5. |
| 122. | Meltzer HY, Cola P, Way L, et al. Cost effectiveness of clozapine in neuroleptic-resistant schizophrenia. Am J Psychiatry.1993;150:1630-8. |
| 123. | Ghaemi SN, Ziegler DM, Peachey TJ, Goodwin FK. Cost-effectiveness of clozapine therapy for severe psychosis. Psychiatr Serv.1998;49:829-31. |
| 124. | Luchins DJ, Hanrahan P, Shinderman M, Lagios L, Fichtner CG. Initiating clozapine treatment in the outpatient clinic: service utilization and cost trends. Psychiatr Serv. 1998;49:1034-8. |
| 125. | Reid WH. The treatment of psychosis: resetting the drug cost 'thermostat'. J Clin Psychiatry. 1994;55 Suppl B:166-8. |