
Final Report
Prepared for:
Susan Bogasky
Assistant Secretary for Planning and Evaluation (ASPE)
U.S. Department of Health and Human Services
Prepared by:
Barbara Gage, PhD
Melissa Morley, PhD
Pamela Spain, PhD
Melvin Ingber, PhD
RTI International
This report was produced under the direction of Susan Bogasky, Project Officer, Office of the Assistant Secretary for Planning and Evaluation (ASPE), Office of Health Policy. The findings and conclusions of this report are those of the authors and do not necessarily represent the views of ASPE or HHS.
Abstract
This project continues the analysis of Medicare beneficiary level episodes of post-acute care. RTI builds on its previously funded ASPE project by expanding the episode file to include 2006 claims. The episode definition initiates with an acute hospital stay and includes all Medicare post acute care services (e.g., long-term care hospitals, skilled nursing facilities, home health agencies, inpatient rehabilitation facilities, outpatient therapy), Part B services, hospice and durable medical equipment. The analysis provides trends on transfer patterns, average payments, average readmission rates, severity of illness factors and other descriptive characteristics of Medicare post acute care users.
"Executive Summary
This report examines Medicare beneficiary episodes of post-acute care (PAC). The importance of understanding beneficiary patterns of cost and use of post-acute services is particularly critical given recent estimates from MedPAC that 2007 spending on PAC was over $45 billion dollars (MedPAC, 2008). Numerous studies have focused on the costs and use of individual services in the Medicare program, including numbers of users, program costs per user, and the factors associated with those costs and use. But few have viewed these patterns across an episode.
Policymakers are calling for greater attention to beneficiary episodes of care in order to understand patterns in service use across PAC providers within the current setting-based payment systems. Examining an episode-based approach allows one to consider the related sets of services that beneficiaries need to treat a condition, or set of conditions. Understanding these related services is critical to facilitating efficiency and improvements in health care quality across the continuum of care. Our work shows that over a third (35.2 percent) of all beneficiaries discharged from acute hospitals go on to use other services. Of those who do, almost 80.0 percent are discharged to either skilled nursing facilities (SNF, 41.1 percent) or sent home with home health services (HHA, 37.4 percent). Another 9.0 percent are discharged to outpatient therapy services (OP). The remaining 10-12.0 percent are leaving the hospital for continued services at a specialized hospital, such as an acute-level inpatient rehabilitation facility (IRF, 10.3 percent) or long term care hospital (LTCH, 2.0 percent).
Understanding these service patterns and the factors that explain them is critical for assessing whether Medicare beneficiaries have access to appropriate services while ensuring that Medicare covers the most cost-effective options with the public Trust Funds. This research examines the relative importance of these different services and how their use varies by individual beneficiary characteristics, such as medical conditions, and the local availability of service options. The work presented here examines episodes of care that can answer questions such as how do individual costs vary by type of health condition and severity of illness? How are institutional, community-based, and physician services tied together for different types of patients?
An episode of care in this work begins when a beneficiary is admitted for an index acute hospital stay in 2006 following a 60-day period without acute hospital or PAC use (HHA, LTCH, IRF, SNF, or OP) and includes all claims until a 60-day gap in acute or PAC service use. The 60-day gap in service use is consistent with Medicare rules on the "spell of illness" definition which applies to SNFs and inpatient hospitals. According to Medicare's definition, a spell of illness includes all readmission and skilled nursing facility service use until a 60-day period without readmission or skilled nursing facility use1. The 60-day period is also consistent with the home health 60-day episode definition.2
The episode definition assumes that services following the index acute admission are related to the original hospitalization and allows us to look at the patterns of care for individual beneficiaries until a 60-day gap in services. This approach differs from many studies of chronic illness trajectories which examine only service use associated with treating a particular condition. By including all claims within these windows of time, we are able to assign claims to episodes when it may not be clear by examining diagnoses codes alone that claims are related. For example, diagnoses codes on inpatient rehabilitation claims are often coded as rehabilitation though they may be related to an episode that initiated in an inpatient acute hospital with a diagnosis of stroke. Our time based approach to constructing episodes allows us to link related claims that may not have similar diagnoses.
Using a person-level approach to defining an episode of care allows us to consider people, their related service use, and the factors that predict cost and utilization. Defining related services lets us consider the effect of comorbidities and severity of illness in explaining total beneficiary costs and use variation, rather than examining services treating a specific condition as though each service were independent of the patient's complicating conditions. This work builds on studies of state and regional variations in Medicare expenditures per service (MedPAC, 2008; Wennberg, Fisher, et al, 2003; Gage, Moon, and Chi, 1999) and looks at the total program costs per patient across an episode of care, similar to past work by this team (Gage, 1999; Gage, Morley, Spain, and Ingber, 2007).
Section 1 Background
Few medical services are used in isolation, with the exception of physician services. Typically, patients requiring treatment in a hospital also need related follow-up services, with at least their physician, and often with home health, skilled nursing facility, or outpatient services. These services may be considered related as they are part of the beneficiary's treatment for the original illness requiring hospital admission. Yet, little work examines the relative use of these services across an episode of care.
The one exception is with the chronically ill populations, where policymakers and insurers recognize these populations use multiple services and have tried to focus case management and other practices on coordinating care for these populations. These efforts typically focus on physician services and their role in managing costs, use, and outcomes for these high use populations. Some have also begun including hospital use in these studies as research has shown that the higher cost chronically ill populations often have inpatient admissions associated with physician services. Yet, few studies effectively consider the post-hospital services; an oversight as they account for a substantial share of both the chronically ill and other beneficiary's total episode of care costs. They also may be key to controlling adverse outcomes and reducing avoidable hospitalizations.
This study focuses on all Medicare beneficiaries (chronic and acute care populations) with a hospital admission in 2006 following 60 days without acute or PAC use. Beneficiaries are assigned to a condition-group based on the DRG recorded on the acute hospital claim. In examining episodes of care, we consider the range of services that may be related to treating this condition. Beneficiaries are assigned to a group based on the DRG on the index acute hospital claim. This allows us to characterize a beneficiary's use of services based on the initial reason for admission though diagnoses on subsequent claims may differ from the diagnoses on the index claim.
Second, this study examines the effects of organizational relationships on the likelihood of using different types of services. While medical conditions are hypothesized to be the most significant predictor of service use, the availability of substitute services is also an important factor (Gage, 1999; Gage et al, 2007; Gage, Morley, and Green, 2006; Bewkes-Buntin, 2005). Understanding not only the availability, but the effect of financial or other types of relationships is important for considering future policy options, including mechanisms for bundling payments across an episode of care.
This report analyzes variations in costs and utilization patterns for Medicare beneficiaries in different parts of the country. The analyses control for case-mix differences, both the primary conditions and the types and severity of comorbid conditions. The analyses also control for differences in resources in each state as we consider the factors that predict the type of post-hospital care, level of care, costs of care, and outcomes.
Section 2 Data and Methods
Multiple data sources are used to construct episodes of care, identify organizational relationships, and examine local supply variation. Episodes begin with an index hospitalization3 and continue through discharges to inpatient rehabilitation hospitals, long term acute care hospitals, skilled nursing facilities, home health agencies, and outpatient therapy services.4 Costs and use of physicians and other practitioners, hospice, and durable medical supplies during the episode are also examined. These patterns of care analyses allow us to study order of services as well as volume and relative probability of service use for different populations or beneficiaries with certain health conditions.
Measures of formal and informal relationships between hospital and post-acute providers also are constructed. Formal relationships are defined by hospital ownership of a subprovider, such as a hospital-based rehabilitation unit or skilled nursing facility. Informal relationships are defined by "co-location" factors such as independently-owned providers being physically within 250 yards of each other, in effect, creating a medical mall or campus. Proximity is important in creating access to services, particularly for someone requiring transportation services, such as an ambulance between settings. Other informal relationships are defined by the presence of a satellite facility within another provider. This satellite may be located within a hospital campus or co-located with other healthcare providers in the community besides the parent facility. We hypothesize that these physically close providers may provide benefits to the acute hospitals despite the lack of formal "ownership" relationships.
Hospitals have an incentive to discharge their cases within the average lengths of stay (ALOS) window used to set their payment rates in order to avoid losses on a particular case. Having a post-acute provider nearby allows this discharge to occur at the earliest time possible. Further, each post-acute provider has their own payment system in which the patient may be viewed as "profitable" or not. If a hospital owns the post-acute provider, they may encourage the PAC site to admit the patient if the anticipated hospital "savings" or reduced losses are greater than the anticipated PAC losses. For some cases, discharge to the PAC may be a win-win situation where the hospital limits its costs and the PAC payment rate is profitable for that patient.5
Section 3 Results
Geographic Distribution of Post Acute Care Providers. The availability of PAC services varies widely across the nation. Skilled nursing facilities and home health agencies are available in every state, although certain states, such as Texas, California, Florida, Ohio, and Illinois have particularly high numbers of PAC providers compared to other states. In addition to looking at the number of PAC providers, it is important to consider the number of beneficiaries that they serve. After controlling for number of residents, states including Louisiana have a high supply of providers per beneficiary population. States with the highest supply of IRF beds per beneficiary included the District of Columbia (2.66 beds per 1,000 beneficiaries), Louisiana (2.09 beds per 1,000 beneficiaries), Arkansas (1.82 beds per 1,000 beneficiaries), and Texas (1.53 beds per 1,000 beneficiaries). The states with the highest supply of SNF beds per beneficiary population included North Dakota (62.69 beds per 1,000 beneficiaries), Iowa (59.98 beds per 1,000 beneficiaries), and Louisiana (57.66 beds per 1,000 beneficiaries). The two states with the highest number of LTCH beds per beneficiary included Massachusetts (3.92 beds per 1,000 beneficiaries) and Louisiana (3.08 beds per 1,000 beneficiaries). Services were less available in some of the rural states. Maryland had the fewest IRF beds per beneficiary, Alaska had the fewest SNF beds per beneficiary, and seven states had no LTCH beds (Montana, New Hampshire, Alaska, Iowa, Maine, Vermont, and Oregon). The majority of LTCHs, SNFs, and HHAs are free-standing, or not owned by an acute hospital. The majority of IRFs, on the other hand, tend to be hospital-based units (Table 3-1 and Table 3-2).
Organizational Relationships. Organizational relationships were another area we examined in this work. In looking at the discharges from acute hospitals to first site of PAC, we found that organizational relationships between the acute hospital and the PAC provider varied significantly depending on the type of PAC provider used. For example, in 2006, over 83.0 percent of discharges to LTCHs were to freestanding providers compared to 47.3 percent of discharges to freestanding IRFs. This difference reflects the differences in supply of each type of provider (Section 3.1.3, Table 3-3). We also examined the role of organizational relationships further in the multivariate models to explain variations in episode costs and use (Section 3.9). Acute hospitals that have a subprovider, such as a hospital-based rehabilitation unit or skilled nursing facility unit or which own a home health agency or have a co-located LTCH, had longer length acute stays. However, the availability of these services was not significantly associated with the probability of using PAC. In other words, the PAC providers appeared to be located by hospitals treating longer-stay, possibly sicker populations. But this did not affect whether a patient used PAC, all else equal, such as their severity of illness and precipitating conditions.
Post-Acute Care Episodes. Using the episode definition in our analysis, about 15.0 percent of all beneficiaries had at least one index admission to an acute hospital in 2006.6 Of these, 35.2 percent were discharged to a post-acute site of care for further treatment. Skilled nursing facilities were the most common discharge destination for PAC users (41.1 percent of all PAC users), followed by home with home health care (37.4 percent). Inpatient rehabilitation hospitals and hospital outpatient therapy providers accounted for 10.3 percent and 9.1 percent, respectively of first sites following hospital discharge. LTCHs are the least commonly used PAC provider; only 2.0 percent of all PAC users were discharged to LTCHs (Section 3.2, Table 3-4 and Section 3.7, Figure 3-2).
Type of Condition. The importance of PAC services varies by type of condition being treated in the acute hospital. The most frequent acute hospital admission in 2006 was in DRG 544: Major Joint Replacement or Reattachment of Lower Extremity.7 This DRG represents over 5.0 percent of all hospital discharges in 2006, and 87.0 percent of beneficiaries with this discharge go on to use PAC services. The next most common acute DRGs by volume for PAC users are DRG 089: Simple Pneumonia and DRG 127: Heart Failure and Shock. While these two DRGs account for high numbers of acute admissions, beneficiaries with these conditions are much less likely to use PAC; only one-third of each of these cases will be discharged to PAC. Still, because of the high number of admissions in these categories, the DRGs rank 3rd and 4th in terms of the highest PAC volume (Section 3.3, Table 3-6 and Table 3-7).
Most PAC admissions can be stratified by whether they need PAC for treating medical conditions or functional impairments. Among the medical conditions, such as pneumonia, septicemia, and other infections, beneficiaries are likely to be discharged to SNFs or HHAs where these conditions rank high in the frequency of admissions. Beneficiaries discharged after joint replacements and back problems are much more likely to be discharged to rehabilitation hospitals and skilled nursing facilities. LTCHs are more likely to admit the more medically complex cases whereas IRF patients need to be healthy enough to sustain 3 hours of therapy per day, on average (Table 3-7).
Severity of Illness. Severity of illness typically distinguishes between PAC site of care, all else equal. LTCH admissions tend to have higher severity ratings, whether on the APR-DRG (severity level 3 or 4) or MS-DRG system, whereas SNF and HHA admissions tend to be in severity groups 2 or 3. IRF and outpatient admissions tend to be in severity groups 1 or 2. These differences reflect the expected variation in medical severity for each level of care (Section 3.4, Table 3-8).
Comorbid conditions, as measured by Hierarchical Condition Categories (HCCs), are another indicator of severity of illness or number of complicating conditions. The HCCs were used in these analyses because they to provide a convenient method for collapsing ICD-9 codes into meaningful disease groupings to identify comorbid or complicating conditions. In these analyses, we counted the number of HCCs per beneficiary, regardless of the reason for acute hospitalization. In looking at mean length of stay and payments in the acute hospital, the general trend is that the mean length of stay and mean payment increase with increasing numbers of HCCs. For example, DRG 014 (Stroke), beneficiaries with one HCC had an episode mean length of stay of 82.6 days and mean episode payments of $23,442, whereas, stroke beneficiaries with five or more HCCs had mean episode length of stays of 108.9 days and mean episode payments of $35,659 (Section 3.5, Table 3-12).
Readmission rates similarly vary by the type of condition. Beneficiaries admitted for diagnoses such as pneumonia or heart failure had higher readmission rates compared to beneficiaries with rehabilitative diagnoses. For example, over 43.0 percent of beneficiaries in DRG 127: Heart Failure & Shock had an acute readmission during their episode compared to only 14.3 percent of beneficiaries in DRG 544: Major Joint Replacement or Reattachment of Lower Extremity (Section 3.4, Table 3-10).
Patterns of Care. Considering the patterns of care in the Medicare program and how the mix of services may vary depending on the patients' complexity and the resources available in their local market area can be invaluable. The pattern analysis tables and figures (Section 3.7, Tables 3-19 to 3-22 and Figures 3-2 to 3-7) help us understand the way services are combined to treat individual patients. Of the 35.2 percent of hospital discharges to PAC, 52.0 percent of them go on to use additional services after the first PAC site. The episode payments and length of stay vary extensively depending by the extent to which higher cost institutional services are part of the episode or longer lasting, ambulatory services, such as home health or outpatient therapy. In the most common first site of PAC (SNFs which admitted 41.0 percent of PAC users), average payment per SNF stay was $8,759. For beneficiaries subsequently discharged to HHA, average payments were an additional $3,544. For beneficiaries discharged from SNF to LTCH, average payments were an additional $29,118. Further, seeing how these patterns varied for medical versus rehabilitation cases was also useful for considering expected care trajectories and costs.
Composition of Total Episode Payments. In Section 3.8 we analyzed the composition of Medicare spending on post-acute care episodes by looking at the proportion of total episode payments attributable to each type of service. The episode composition analyses were performed overall, and by severity level for all DRGs and also for DRGs 089: Simple Pneumonia & Pleurisy and DRG 544: Major Joint Replacement or Reattachment of Lower Extremity. Across all DRGs, the largest share of episode spending is for the index acute admission (34.3 percent) followed by spending on SNFs (17.9 percent). Though payments for beneficiaries using LTCHs are very high, the proportion of total episode spending on LTCH services was only 3.7 percent due to the small number of beneficiaries using this service overall. In looking at the distribution of spending by severity level, we see that the proportion of total episode spending on LTCH services increases with increasing severity. In looking at the distribution of payments for beneficiaries in DRG 089 compared to DRG 544, we see that the proportion of spending for SNF is higher for beneficiaries in DRG 089 compared to those in DRG 544, and that the proportion of spending on index acute admissions and IRF services is higher for beneficiaries in DRG 544 reflecting the use of surgical procedures and frequency of use of rehabilitation services for beneficiaries in this DRG (Section 3.8, Figures 3-8 to 3-16).
Physician Use. We also examined physician use during an episode of care (Section 3.8, Table 3-23). Over 90.2 percent of the beneficiaries in our hospital discharge sample had a physician visit in the hospital. Over 68.0 percent had an inpatient consultation, 60.0 percent had an emergency room visit, and 55.0 percent had an office visit sometime during the episode of PAC. The highest payments were associated with hospital visits (over $1,100). The physician visit patterns also differed between the medical and rehabilitation cases. Medical cases, such as DRG 089: Simple Pneumonia & Pleurisy, were more likely to have seen a physician in the ER and more likely to have a NF visit than the patients in DRG 544: Major Joint Replacement or Reattachment of Lower Extremity which were more likely to have fewer visits of every kind.
In sum, this report provides a great deal of insight on the factors associated with using post-acute care and the types of PAC services used. The leading indicator appears to be the patients' medical conditions and severity of illness although availability of alternative services is also critical to service use.
Section 4 Discussion
These analyses provide important information for understanding who uses PAC services, how their likelihood of using PAC services differs by certain characteristics, and which factors are most important in predicting hospital length of stay, probability of PAC use, relative probability of PAC site of care choices, hospital readmission rates, and average episode payments. Age and severity of illness factors were important in all the multivariate models predicting these outcome variables (Section 3.9, Tables 3-24 to 3-27).
In this work, we compare several measures of severity including APR-DRG, MS-DRG and HCCs. The additional contribution of the HCC indicators to the multivariate models flagging comorbid conditions proved quite useful to improving the explanatory power of the models. Greater severity was associated with longer length stay, as expected, regardless of measure used. Severity was also important for explaining the probability of PAC use and the type of PAC service used. Patients with higher severity scores were more likely to use LTCHs, followed by SNFs, then IRFs, and last home health services relative to outpatient therapy services.
Organizational relationships were also important for predicting use. We also found greater likelihood of using a type of PAC if the hospital had a subprovider or co-located PAC provider of that type. For example, multivariate models showed a greater likelihood of using IRFs if the hospital has a subprovider or co-located IRF and a lower likelihood if the hospital had a SNF subprovider, all else equal. Similarly, having a co-located LTCH increased the likelihood of LTCH use while the presence of a SNF or HHA reduced the likelihood of LTCH use, all else equal. And the same is true for the presence of a SNF.
Both these factors (severity and organizational relationships) were also important for predicting readmission rates and average episode payments (Section 3.9, Table 3-27). The probability of readmission increased as severity increased and having a subprovider was negatively associated with readmission rates. Both factors were also statistically significantly associated with episode payments; as severity increased, so did the average payment per episode. Similarly, average episode payments were higher for beneficiaries treated in hospitals with PAC subproviders. This may reflect different resource mixes of the hospitals or reflect higher likelihood of using subproviders where they exist, all else equal.
This work provides an important starting point for predicting beneficiary costliness and outcome variations. Understanding the contributions of better severity and medical complexity measures allows us to refine payment and outcome models. During the coming year, we will be adding data from the Chronic Care Warehouse (CCW) dataset to identify beneficiaries in our 2006 episode file with chronic conditions. Similar to some of the analyses presented in this report, we will look at the patterns of use and expenditures associated with having one or more chronic conditions. This will further allow us to refine the information describing a beneficiary's medical complications and is more comprehensive than our limited application of the HCCs to the index acute admission claims. Second, we will also examine alternative episode definitions including fixed and variable length episodes and episodes initiating in IRF, LTCH, HHA, or outpatient therapy without an index acute hospital admission-so-called community entrants to Medicare post-acute care services. This work will serve as the basis of exploring potential episode-based payment or bundling options and will build on some of the episode composition work presented here.
1. Background
The Medicare program spent over $428 billion dollars in 2007 providing health care coverage to primarily elderly and disabled populations (MedPAC, 2008). The largest share of these expenditures was associated with inpatient hospital care (30.0 percent) which was used by at least 15.0 percent of all beneficiaries (See Section 3). Post-acute care (PAC), including services provided by long-term acute care hospitals (LTCHs), inpatient rehabilitation facilities (IRFs), skilled nursing facilities (SNFs), and home health agencies (HHAs) accounted for $45.1 billion or nearly 10.0 percent of all Medicare spending (MedPAC, 2008). SNF expenditures alone accounted for $21 billion, home health, $14.1 billion, IRF spending was $5.6 billion, and LTCH expenditures accounted for $4.4 billion, despite the small numbers of LTCH users. While most of these services are used in combination with a hospital stay, past research and policy analysis has typically focused on the costs or use of individual providers.
Of beneficiaries with an inpatient hospital stay following 60 days without inpatient, HHA, LTCH, SNF, or IRF use, over one third are discharged to post-acute providers. Most are using skilled nursing facilities (41.1 percent) or home health agencies (37.4 percent) for continuing nursing or therapy services but many are also discharged to inpatient rehabilitation hospitals (10.3 percent), LTCHs (2.0 percent) or outpatient therapy providers (9.1 percent). This study builds on work completed last year for the Assistant Secretary of Planning and Evaluation (ASPE) to examine Medicare program costs on an episode of care basis. For beneficiaries with at least one hospital stay during 2006, we examine their total episode cost and utilization, including their relative use of index acute admissions, SNFs, IRFs, LTCHs, HHAs, hospital outpatient therapy (HOPD), and acute hospital readmissions. This year's work differs from last year's study because it broadens the analysis to include physician services, durable medical equipment, and hospice services that are used during an episode of care. This broader approach provides more comprehensive information on each beneficiary's complete episode of care. While per person physician costs are small relative to inpatient and PAC costs, they provide important information on patterns of care and may be useful for understanding the current role that physicians play and the potential for improving care with this broader approach to analysis. This study also examines how episodes vary by individual beneficiary characteristics, market characteristics, and the interorganizational, or financial relationships among providers associated with each episode.
This study is particularly unique because it begins to consider whether a formal or informal relationship between a hospital and a PAC provider influences the acute hospital discharge's likelihood of PAC use, and specifically the type of PAC service used, which in turn, may have a dramatic effect on individual episode costs of care. As noted in our earlier work (Gage, Morley, Spain, and Ingber, 2007), very little has been done in this area, particularly across an episode of care.
Local health care markets have continued to evolve over the past 20 years, as payment policies and population needs have changed. Many hospitals have subproviders or hospital-based PAC units. For example, about one-fifth of all acute hospitals in 2007 had a hospital-based SNF unit or an IRF unit or both (2007 POS, Table 3.1). Hospitals also frequently own HHAs, accounting for 17.0 percent of all HHAs (2007 POS, Table 3.1). LTCHs have also expanded over the last decade, opening hospitals-within-hospitals (HWH), which in effect, are units in acute hospitals that specialize in longer-stay patients.8 Hospitals with formal relationships, such as ownership of PAC providers, may have a financial incentive to discharge their patients earlier to a PAC site, and depending on the type of case and the relative Medicare payments, to one type of setting over another. The subproviders may or may not be profitable given that their role in the system may be to reduce losses for higher cost providers, such as the acute hospitals. Further, these relative roles may exist for providers located close to one another but without the formal ownership relationship. Other factors, such as service availability may also affect some of these decisions to transfer patients between sites of care. While these incentives may have a limited explanatory power relative to individual medical factors, their importance may vary by the type of case and level of severity; yet few studies have been done to examine these differences.
The informal relationships have been particularly difficult to study because satellite facilities of one PAC provider may be located in a complementary acute care setting across town. Satellite facilities are authorized in the regulations, but little information exists on where they are actually located. Their bed counts, billing addresses, and other program regulatory materials are tied to the parent organization masking the effects of these satellites while they operate as pseudo "subprovider units." Unlike PAC providers that are subproviders, satellite facilities have a choice to enter a market, suggesting they operate in areas with win-wins for both the hospital and the PAC provider. As shown in last year's study, these colocated providers, to the extent that we could identify them, were significantly associated with site of care choices, or determining the type of PAC used.
The goal of this study is to evaluate the impact of organizational relationships, both formal and informal, on the total cost and use of services across an episode of care. This study examines how acute-PAC provider relationships may affect transfer patterns across post-acute settings. Our analyses focus on the types of patients likely to use PAC, and after controlling for case-mix differences, examines the effects of organizational relationships on the PAC decisions, the types of PAC used, the likelihood of hospital readmissions, and the associated lengths of stay and costs of care in each setting. As with last year's study which focused on 2005 episodes, the primary focus of the multivariate work is on the relationship between the hospital with the index admission and the first PAC provider. Descriptive information is provided on the longer episodes and their service composition for episodes occurring within sets of related providers. This study also begins to examine the additional cost and frequency of physician, durable medical equipment (DME), and hospice services during an episode. This work will be continued as we begin to identify the role of physicians' services within the larger episode and examine the extent to which these services are provided concurrently in inpatient settings, the office, or the home and identify whether they precede hospitalizations, provide follow-up care, or are more frequent among beneficiaries with certain types of conditions.
In this study we also examine how provider organizational relationships may affect transfer patterns across post-acute settings. The analyses presented here use existing data sources and innovative methodologies, such as those developed by the medical geographers, to describe the current distribution of post-acute providers in the United States. Also included in the study are analyses of the average utilization and Medicare payments for a post-acute episode of care and the effects of organizational links between acute hospitals and PAC providers on the likelihood of transfers to a Medicare post-acute provider. This study examines transfer patterns across post-acute care settings using a 5.0 percent national sample of 2006 Medicare claims data. The results of these analyses provide information on how post-acute transfer patterns from the acute hospital to the first site of PAC are affected by the presence of hospital-based subproviders and colocated providers. Further, this study provides information on the roles of physicians throughout the course of the episode. These analyses all begin with an index acute hospital stay but they will be expanded next year as we also examine episodes that begin in the community as well as those initiated by an index acute hospitalization.
This year's study also introduces the effects of Medicare Severity Diagnosis Related Groups (MS-DRGs) as explanatory variables for variations in beneficiary costs and use. While last year's work incorporated All Patient Refined Diagnosis Related Groups (APR-DRGs) to explain the severity of individuals' health conditions, the Medicare program now uses the MS-DRG system to risk-adjust payments for inpatient acute stays. In this study, we examine the relative explanatory power of the two systems–one based on the presence of specific comorbid conditions with a particular primary diagnosis, and one based on the presence of certain complicating comorbidities with any primary diagnosis. We also explored the role of comorbid conditions in understanding costs and use using Hierarchical Condition Categories (HCCs). The HCCs were used in these analyses because they to provide a convenient method for collapsing ICD-9 codes into meaningful disease groupings to identify comorbid or complicating conditions. These three methods of measuring severity were important explanatory variables to our multivariate analyses predicting any use of PAC, first site of PAC, index acute admission length of stay, acute hospital readmission, and total episode payments.
2. Data and Methods
2.1 Data Sources
The primary data source for this study was the 2006 Medicare claims data that provided information on utilization and Medicare payments associated with each hospital discharge and post-acute care episode. Two other data sources were examined for their use in determining the nature of organizational relationships between hospitals and PAC providers. These sources were the Hospital Cost Report Information System (HCRIS) and the Online Survey and Certification Reporting System (OSCAR).
Medicare Claims Data. The 2006 Medicare claims files were used to track patterns of post-acute care use, including PAC service mix, length of stay, payment, and acute hospital readmission rates. The Medicare claims files were used to build episodes of acute plus PAC using inpatient acute, IRF, LTCH, SNF, HHA, and outpatient therapy claims. Note that inpatient acute claims included both prospective payment system (PPS) and critical access hospital (CAH) claims. The individual DRG numbers discussed throughout this paper refer to the FY 2006 CMS DRG system. Although they were not part of the episode definition, we also assigned Medicare carrier claims (including physician services, independent clinical laboratories, ambulance providers, and freestanding ambulatory surgery centers), hospice, and DME claims to the episodes based on dates of service in order provide a more comprehensive understanding of the resources associated with beneficiary care during PAC episodes. Medicare claims were also used to examine transfer patterns within PAC episodes to learn more about factors predicting first site of care after an acute hospital discharge and subsequent settings of care in a PAC episode. Using Medicare inpatient admission claims, we applied case mix measures to the PAC episodes using the 3M Health Information Systems APR-DRG and the newly developed MS-DRG software to assign severity of illness measures to index hospitalizations. The APR-DRG and MS-DRG groupers were used to distinguish beneficiary severity level at index acute hospitalization. Medicare inpatient claims data were also used to identify comorbid conditions, as defined by the Hierarchical Conditions Categories (HCCs) software. The use of APR-DRGs, MS-DRGs, and use of HCCs is explained further in Section 2.4.2.
Online Survey and Certification Reporting System (OSCAR). The 2007 OSCAR database contains information on facility characteristics including ownership, bed capacity, and rural versus urban location. These facility characteristics have been used in both descriptive and multivariate analysis. The OSCAR data were the source for initial geographic analyses looking at the distribution of different types of post-acute providers by state. The OSCAR data were also used to identify colocated providers using the provider address reported in the OSCAR files. After geocoding the addresses in the OSCAR data to identify the latitude and longitude of each provider, RTI used geographic information systems (GIS) to identify colocated facilities, defined as those within 250 yards of each other. This definition of co-location is consistent with regulations defining colocated LTCHs. However, because the OSCAR data typically report corporate addresses and not individual provider addresses, we suspect the colocation factor is under-reported in our analyses.
Hospital Cost Report Information System (HCRIS). The HCRIS files (FY 2005-2006) are available for hospitals, hospices, renal dialysis facilities, SNFs, and HHAs. Facility identification numbers (IDs) for wholly owned hospital-based PAC settings were identified from the parent institutions' files and linked to provider IDs in the Medicare claims episode of care files. By linking provider IDs in this way, we were able to track referral patterns to related hospital-based subproviders. RTI explored using the OSCAR files versus the HCRIS data to identify hospital-based subproviders and found that the HCRIS data were more reliable than the OSCAR data for this purpose. Subproviders have formal ownership relationships that must be reported in the HCRIS data.
2.2 Episode Construction
Study Period. The 2006 Medicare claims were the basis for the analysis. Although the analysis took place using the 2006 data, we also used data from the last quarter 2005 and first 6 months of 2007 to impose our episode construction criteria. Episodes begin with an index acute hospital admission following a 60-day period without acute, LTCH, IRF, SNF, or HHA service use. Episodes include all claims until a 60-day gap in LTCH, IRF, SNF, HHA, or outpatient therapy service use. By using both the 2005 and 2007 data, we limit any left-hand or right-hand truncation issues in analyzing the full 2006 claims file.9
Since the last post-acute prospective payment system was implemented in 2002, the data reflect full implementation of the post-acute prospective payment systems. Although the primary source of data analyses presented here is the 2006 Medicare claims, this study also compared findings to the previous ASPE study on 2005 PAC episodes (Gage, Morley, Constantine, et al., 2008).
Episode Definition. PAC episodes were based on live beneficiary discharges from an index hospitalization into one of the related care settings: IRF, LTCH, SNF, HHA, or hospital outpatient therapy.10 Hospital outpatient therapy services were included in the definition of PAC use because of the importance of these services among elderly beneficiaries in need of rehabilitation services. These services may be particularly important for beneficiaries requiring therapy services after illness or surgery, but not meeting the eligibility criteria for inpatient rehabilitation, skilled nursing or home health care.
Individual episodes were created at the beneficiary level. Each beneficiary's claims were sorted chronologically to construct a file of the PAC services. Identification of an index admission requires a 60-day period prior to the index acute hospital admission without an inpatient acute or post-acute (defined as LTCH, IRF, SNF, or HHA) claim. We used the following criteria to identify the start of a PAC episode of care:
Within 5 days of discharge from an acute hospital bed, first PAC admission to:
- An IRF bed in either a freestanding IRF or a distinct part unit within acute hospital; or
- An LTCH bed; or
- An SNF bed; or
Within 14 days of discharge from an acute hospital bed, first PAC admission to:
- An HHA; or
- Hospital outpatient therapy service use.
PAC episodes are variable in length and include all claims subsequent to the first PAC service until a 60-day gap in use of inpatient acute, LTCH, IRF, SNF, HHA, or outpatient therapy services occurs. Acute hospital readmissions are included in the PAC episode. We used this variable length episode definition rather than a fixed length episode in order to capture longer periods of service use that may be related to an index acute hospital admission. Alternative episode definitions and specific methods for grouping claims to acute hospitalizations will be the focus of ongoing work in 2009.
Part B, Hospice, and Durable Medical Equipment Claims. In addition to the acute and PAC claims mentioned above, the 2006 episode files also included Part B (including physician services and therapy), hospice claims, and DME claims. These claims were included in the 2006 episode construction to provide a more comprehensive understanding of the resources associated with beneficiary care during PAC episodes. PAC episode start and end dates were determined based on acute and PAC claims as defined above. All Part B, hospice, and DME claims falling between the episode start and end dates were assigned to episodes of care. Part B therapy (physical therapy, occupational therapy, and speech therapy) claims were separated out from other Part B physician claims to better understand the use of both Part B therapy and hospital outpatient therapy services in episodes of PAC.
2.3 Defining Organizational Relationships
In our analyses, we have identified three types of organizational relationships for health care providers:
- Freestanding providers
- Hospital-based (owned) subproviders
- Colocated providers (excluding subproviders)
Hospital-based subproviders were identified through the HCRIS data. These data contain the provider ID numbers of all HHA, SNF, and IRF subproviders and their respective hosts. These data provided an accurate measure of the post-acute providers that an acute hospital owns.
Colocated providers were identified using the addresses reported in the OSCAR data. RTI geocoded the addresses for all post-acute providers in the OSCAR data to identify the latitude and longitude of each provider. RTI used this geocoded data with GIS to identify colocated facilities. Colocated providers were defined as those within 250 yards of each other. Though collocated providers may not have a formal organizational relationship with each other, their proximity is likely indicative of an informal relationship. It is important to note that the accuracy of this colocation definition is directly related to the level of accuracy of the address reported in OSCAR. Provider chains may report their corporate address in the OSCAR file, rather than the address of a specific provider, which limits the reliability of this measure.
The three types of organizational relationships are mutually exclusive. For example, a hospital-based subprovider was classified as such, though it is also likely to be colocated (located within 250 yards) with the acute provider. Colocated providers were restricted to those providers that are colocated but not identified as a hospital-based subprovider. This relationship is particularly relevant to LTCHs as LTCHs cannot be subproviders of acute hospitals under current rules. However, a substantial number are colocated within a hospital although they must be certified (and meet the conditions of) independent hospitals. All other organizational relationships not otherwise defined as hospital-based subprovider or colocated were defined as freestanding.
One type of organizational relationship that we were unable to define using these data sources was satellite providers. A satellite provider is a provider that is owned by another organization but operates at a separate geographic location. Satellite providers do not have unique provider IDs which prevents them from being identified as separately located entities through OSCAR or HCRIS data. These providers have the same provider IDs as their parent organization in most instances. Providers are required to report satellite facilities to their fiscal intermediaries but this is not done consistently. Geographic information on these providers is, therefore, unavailable although many function similarly to a subproviders by making beds available to the host facility. Hence, while the host provider may have no measurable financial relationship with the satellite provider, it may have an incentive to discharge to the satellite facility to reduce the length of stay associated with its payment. The satellite PAC provider also gains because they have a close referral source to increase their admissions; however, this relationship is not visible without accurate location information on each set of beds.
Chain relationships are another problematic area for measuring formal ties. The OSCAR data contain a variable identifying chain membership for each organization. Affiliation with a chain may reduce provider costs by allowing shared services across the corporation. However, the chain variable in the OSCAR data is not reliable and leads to undercounting of organizational relationships that exist between post-acute providers. The Provider Enrollment Chain Ownership System (PECOS) data are a relatively new dataset that has the potential to capture the location of satellite and other interorganizational relationships; however, the level of completeness of the data at this time is not sufficient for the current study.
Using the available data on organizational relationships, we created a set of variables to identify the type of organizational relationships. These variables identified the presence or absence of any subprovider, or any colocated provider for acute providers in the sample. More specifically, additional variables were created to identify whether the acute hospital had any IRF, SNF, or HHA subproviders or any IRF, or SNF colocated provider. These variables were used in multivariate analysis to predict any PAC service use, first post-acute discharge setting, index acute admission length of stay, episode payments, and acute hospital readmission during the post-acute episode.
2.4 Descriptive and Multivariate Analyses
2.4.1 Supply of Services
The 2007 Provider of Service (POS) data were used to examine the distribution of post-acute providers nationally. This included looking at the number of freestanding versus hospital-based SNFs, IRFs, HHAs, and freestanding versus HwH LTCHs in each state.11 These analyses also looked at the distribution of types of colocated providers across the United States. The purpose of this analysis was to understand the distribution of types of providers in different geographic areas of the country. For example, LTCHs are not available in every state and freestanding IRFs are not common in many areas of the country. This supply table shows the variation of supply and helps in interpreting observed differences in utilization of services by geographic area.
Bed supply variables were also created for the multivariate regression models using the 2007 POS data. These variables measured the number of LTCH, IRF, and SNF beds per 1,000 Medicare beneficiaries in each state. These bed supply variables were used in the multivariate analyses to contribute to an understanding of acute index admission length of stay, the likelihood of any PAC utilization, the first setting of PAC for beneficiaries discharged to PAC, and episode payments and acute hospital readmissions. By including the supply variables in the multivariate models it is possible to examine the magnitude of the effect of supply of PAC services on utilization.
2.4.2 Post-Acute Care Episode Analyses
Episodes of care were constructed to understand the factors associated with the use of different PAC services during an episode. Transition patterns were analyzed to learn more about the proportion of patients discharged to each post-acute setting. DRG-specific episode patterns were also examined to identify variations in condition-specific discharge patterns. Key variables of interest in the episode analyses were utilization and payments by type of PAC service. Note that the Medicare payment amounts on each claim were used and these payment amounts reflect any payment adjustments made for outlier costs, or facility characteristics, such as indirect medical education (IME), disproportionate share payments (DSH), and local wage differences.
The PAC episode data were also case-mix adjusted using both the 3M APR-DRG grouping software and the MS-DRG software. Several revisions of the Medicare DRG system have been implemented to overcome the limitations of DRGs. These revisions include the refinement of the way principal diagnoses and procedures are stratified into categories based on the presence or absence of substantial complication or comorbidity (CC) in secondary diagnoses. In the March 2008 ASPE report, RTI used only APR-DRGs to case-mix adjust PAC episodes due to the timing of the analyses and the release of the MS-DRGs. In this study, both the APR-DRGs and the MS-DRGs were used for case-mix. The use of the APR-DRGs allows for comparison to the previous analyses and the use of the MS-DRGs reflects current Medicare policy.
Comorbid conditions were also measured using Hierarchical Condition Categories (HCCs). The HCCs were used in these analyses because they to provide a convenient method for collapsing ICD-9 codes into meaningful disease groupings to identify comorbid or complicating conditions. HCCs were assigned to the index acute admission claims to identify the presence or absence of a comorbid condition. The HCCs provided additional information on the effects comorbidity on service utilization. A description of the application of the APR-DRG, MS-DRG, and HCC software to the 2006 PAC episode files follows.
APR-DRG System. In the 1980s, CMS developed All-Patient DRGs (AP-DRGs) and expanded Medicare DRGs to include neonatal, obstetric, and other conditions typical to the under-65 population. This resulted in the development of almost 1,200 DRGs, yet patient severity of illness and mortality were not predicted and many secondary diagnoses were not included in the AP-DRG system. AP-DRGs formed the basis for APR-DRGs which were developed by 3M Health Information Systems in the early 1990s. APR-DRGs added severity of illness and risk-of-mortality subclasses for each base APR-DRG. In determining the severity level, 3M revised the CC list to accommodate the non-Medicare population. 3M also incorporated principal diagnosis, age, interactions of multiple secondary diagnoses, and combinations of non-operating procedures with principal diagnosis. The severity of illness and risk-of-mortality subclasses have levels of 1 to 4, indicating minor, moderate, major, and extreme, respectively. Based on these enhancements, APR-DRGs represented a significant improvement over previous severity-adjusting systems.
MS-DRG System. In FY2008 CMS adopted Medicare-Severity (MS) diagnosis-related groups (MS-DRGs) to account for differences in patient mix in the Medicare inpatient hospital payment system (Wynn and Scott, 2007). The grouping logic for the MS-DRG system is the same as the CMS-DRG logic. It collapses paired DRGs (DRGs distinguished by the presence or absence of CCs and/or age) into base DRGs and then splits the base DRGs into CC-severity levels. The general structure of the MS-DRG logic establishes three mutually exclusive, hierarchical severity levels for each base DRG: 1) with major CCs (MCCs), 2) with CCs, and 3) without CCs. However, severity levels are consolidated for a base DRG if the following criteria for a subgroup will not be satisfied:
- At least a 3.0 percent reduction in variance would result
- At least 5.0 percent of discharges in the MS-DRG would be assigned to the subgroup
- At least 500 discharges would be assigned to the CC or MCC subgroup
- Subgroups would have at least a 20.0 percent difference in average charges between them
- Subgroups would have at least a $4,000 difference in average charges between them
When the subgroups did not meet these criteria, the MCC and CC severity levels were collapsed in one of three ways: "With CC/MCC DRG" and "Without CC/MCC DRG" Or " with MCC DRG" and "without MCC DRG" (collapsing "no cc" and "cc" severity levels. Third, some base MS-DRGs were not subdivided at all because of insufficient differences between the subgroups (based on the previously listed criteria, such as 3.0 percent reduction in variance or a $4,000 difference in average charges between subgroups). This variable stratification complicates the definition of severity across DRGs. Within each DRG, a discharge is assigned to the highest severity level of any secondary diagnosis. There is no adjustment in the severity-level for additional factors or CCs, except that certain conditions with high-cost devices are assigned to a CC severity level.
In March 2007, RAND released a report evaluating the MS-DRG system and other severity-adjusted DRG systems that the agency was considering (Wynn and Scott, 2007). They found that, in comparison to the other severity-adjusted systems, the MS-DRGs have a much higher percentage of discharges assigned to the lowest severity level. For example, 60.0 percent of discharges are assigned to Severity Level 0 in the MS-DRG system, compared to only 20.0 percent in the APR-DRG system. Wynn and Scott cite several reasons for this, including the re-assessment of CC assignments, the collapsing of the no CC and CC severity levels in some DRGs, and no severity subgroups in 53 base DRGs. The researchers also found that the MS-DRGs explain 43.0 percent of the cost variation, which was a 9.0 percent improvement over the unadjusted CMS-DRGs.
Wynn and Scott (2007) note that although the underlying logic of the MS-DRG system uses standard severity levels (for which lower numbers indicate lower levels of severity), the criteria for establishing severity subgroups result in severity levels that vary by base DRG. Because the severity levels are often collapsed and the resulting subgroups depend on the particular DRG, the MS-DRG is a more complicated system to understand than the other severity-adjusted DRG systems. Wynn and Scott did, however, note that one major advantage of the MS-DRG system over other severity-adjusting systems is that the CC list and severity-level assignments reflect current Medicare data and the logic therefore likely reflects current patterns of care.
As noted previously, in the March 2008 ASPE report, RTI used only APR-DRGs to case-mix adjust PAC episodes due to the timing of the analyses and the release of the MS-DRGs. For the research described herein, both the APR-DRG and the MS-DRG grouper software packages were used to assign a severity-of-illness measure to the index acute hospitalization. Analyses of utilization, length of stay, and Medicare payments were performed by DRGs and by APR-DRGs and MS-DRGs to learn more about differences in post-acute service use by diagnosis and severity level. Severity adjustment using the APR-DRG system allows for comparison to similar analyses using 2005 Medicare claims data performed in the previous ASPE March 2008 project. Applying the APR-DRG system to the 2006 data also provides an opportunity to understand some of the differences between the APR-DRG and MS-DRG systems.
The DRG-specific nature of the MS-DRG grouping logic means that it is not possible to have direct comparisons between the APR-DRGs and the MS-DRGs. Direct comparisons between the two groupings were not made in this report; rather, we report utilization and payments separately by APR-DRG and MS-DRG in order to illustrate the different post-acute care patterns by each of the severity groupers.
Comorbidities. Comorbidities are conditions that exist at the same time as the primary condition in the same patient (CDC, 2008). For example, hypertension is a comorbidity of many conditions such as diabetes, ischemic heart disease, and end-stage renal disease. Many of the common comorbidities are also chronic diseases, including cardiovascular disease, cancer, and diabetes. These conditions are among the most prevalent, costly, and preventable of all health problems (CDC, 1999). Chronic illness accounts for 70.0 percent of deaths and over 75.0 percent of direct health care costs in the United States (Thrall, 2005). Because people with comorbid and chronic illnesses have greater health needs at any age, they account for a disproportionately high share of healthcare costs (Hoffman, 1996). About 20.0 percent of all Medicare beneficiaries have five or more chronic conditions, and chronic, comorbid conditions account for over two-thirds of Medicare spending (Berenson, 2004).
It is important to examine the impact of comorbid conditions on an acute event to understand the resource drivers in high-cost populations, such as the chronically ill. In order to examine the effect of chronic and complicating conditions on PAC utilization and costs, we examined the HCCs present in our sample of beneficiaries with an index acute hospital claim in 2006. As described in detail below, the HCC software is generally used for risk-adjustment purposes. The software generates a set of variables to indicate the presence of comorbid conditions and also generates a risk score that can be used in risk-adjustment models. For these analyses, we used only the variables indicating the presence of comorbid conditions.
In 2004, CMS began to use the CMS-HCC risk-adjusted payment approach, which uses diagnostic and demographic information on the claims to predict resource use (Pope et al. 2004; Noyes et al. 2006). This risk adjustment model uses a subset of International Classification of Diseases, 9th Revision, Clinical Modification (ICD-9-CM) diagnosis codes from the claims to place beneficiaries into 70 disease groups called HCCs. Each HCC includes conditions that are related clinically and have similar effects on costs. Several researchers have incorporated HCCs into models to represent comorbidities (Pope et al. 2004; Noyes et al. 2006; Ettner et al. 2001). The principal application of the condition categories (CCs) is to predict costs of Medicare Advantage plan enrollees. In that case the incremental cost of having a disease in each CC is determined statistically and the effect of the CCs and selected demographic factors are summed to create a predicted total. The same classes, with different incremental costs, are used for aged and disabled community dwelling, long-term institutionalized and ESRD beneficiaries.
The classification system was developed in a collaborative process with physicians and econometricians. The clinical foundation of small, clinically homogeneous groups of ICD-9-CM codes was merged with data-driven information to develop the larger CC groupings. Some of the CCs are themselves grouped into hierarchies of related conditions. During a year, a person may be diagnosed with lower and higher levels of severity of a condition. When the hierarchy is imposed, only the highest cost level is used in describing the person. Having been coded with a lower related CC also adds to the prediction. In the diabetes hierarchy, if a person has been coded with simple diabetes, diabetes with ophthalmologic manifestations and diabetes with renal manifestations, the only CC used would be the last in the group. Use of the hierarchy with the CCs is optional.
The classification system, with or without the hierarchy, has been used in other settings in which controlling for risk is important. For example, the hospital mortality ratings on the Medicare Compare web site are developed with sets of the CCs as part of the risk adjustment
The HCC system was created using the guidance of several principles (Pope et al. 2004), including:
- HCCs are clinically meaningful. They all relate to a reasonably well-specified disease or medical condition that defines the category.
- HCCs predict medical expenditures. Diagnoses in the same HCC are reasonably homogeneous with respect to their effect on both the current and future year's costs.
- HCCs have adequate sample sizes. Diagnostic categories that will affect payment have adequate sample sizes to permit stable expenditure estimates. Extremely rare diagnostic categories cannot reliably determine expected costs.
- HCCs use hierarchies. The most severe manifestation of a given disease process defines its impact on costs, so that related conditions are treated hierarchically, with more severe forms of a condition being flagged for a person (and less serious ones not being flagged).
- HCC system does not reward coding proliferation. The number of times that a particular code appears does not increase predicted costs.
- HCC classification system assigns all ICD-9 codes. There is exhaustive classification, because each diagnosis code contains relevant clinical information.
The CMS HCC software generates variables identifying the presence or absence of 189 conditions. For the purposes of these analyses we looked at the 70 most common conditions. Appendix A shows the 70 HCC groups that are used in this analysis.
It is important to note that hierarchies are imposed among related conditions, so that a person is only coded for the most severe manifestation among related diseases. Also, although HCCs reflect hierarchies among related disease categories, for unrelated diseases, HCCs are allowed to accumulate. For example, a beneficiary with heart disease, stroke, and diabetes will have at three separate HCCs coded (and their costs are predicted to reflect the increments for all three diseases). As Pope and colleagues note, the HCC model is more than simply additive because some disease combinations interact. For example, the presence of congestive heart failure (CHF) and chronic obstructive pulmonary disease (COPD) is likely to increase predicted costs by more than the sum of the separate increments for beneficiaries who have CHF or COPD alone. In this study we report on the total episode cost by the presence or absence of certain combinations of comorbidities that are often present together within the same individual (COPD and CHF; diabetes and renal failure).
In order to calculate the HCC categories as measures of comorbidity in our sample, we used the available CMS-HCC software originally developed by RTI researchers (reference 18 in Noyes; Pope et al. 2004). The goal in using the HCCs was to learn more about the extent of chronic and comorbid conditions for beneficiaries using PAC and to learn more about how the presence of chronic and comorbid conditions affects the use of services within episodes of care. The HCCs provide a convenient method of collapsing ICD-9 codes into meaningful disease groupings.
Though the HCCs are generally based on a year's worth of claims data for the purposes of risk adjustment, in this case, the HCCs are used for their ability to provide meaningful disease groupings for understanding chronic and comorbid conditions. HCCs were constructed by running the acute index admission diagnoses reported on the claims through the CMS HCC software. The program assigns individuals to up to 70 HCC groups based on diagnoses on the claims. We used the diagnosis codes on the index hospital admission claims to calculate the HCC indicators.
We performed two specific analyses using these HCC indicators of comorbidity. First, we examined prevalence and rank order for the 20 most frequent HCCs in our overall PAC sample. We present the prevalence and rank order of these 20 HCCs for the beneficiaries with index acute hospital admissions in five most common DRGs in our sample. These results are presented in Table 3-11. Next, we calculated the number of HCC indicators assigned to each beneficiary and categorized beneficiaries based on this number (i.e., 0, 1, 2, 3, 4, or 5 or more HCCs). We used these categories to examine index acute hospital admission and episode length of stay and payments for the beneficiaries with index acute hospital admissions in the five most common DRGs in our sample. These results are presented in Table 3-12.
2.4.3 Multivariate Analyses
Five multivariate models were run to examine the effects of beneficiary demographics, supply of PAC providers, severity of illness, and organizational relationships on any post-acute service use, index admission length of stay, first site of PAC, acute hospital readmission during post-acute episodes, and total Medicare payments for episodes of PAC.
The models predicting post-acute service use and readmission during post-acute episodes were binomial logistic regression models in which the dependent variables were the presence or absence of a post-acute episode claim (1/0) or an acute hospital readmission during the episode of care. The models predicting index admission length of stay and total Medicare payments for episodes of post-acute care were ordinary least squares (OLS) regression models with a continuous dependent variable indicating the beneficiary's length of stay in the index hospitalization and the Medicare payment amount for the PAC episode. The fifth model was a multinomial logistic regression model predicting the first site of post-acute care for the subset of hospital discharges with a post-acute episode claim. The reference group for this model was hospital outpatient therapy meaning that all coefficients generated from the model are interpreted in comparison to beneficiaries discharged to hospital outpatient therapy. The model predicts the odds of being discharged to SNF, HHA, IRF, or LTCH compared to being discharged to hospital outpatient therapy.
These five models were run using three sets of independent variables. These sets of variables differ based on the severity measures. Table 2-1 contains the variables used in the multivariate models and highlights the differences in the use of severity measures across modules.
The independent variables across models included demographic characteristics such as gender, Medicaid status, age, and race; severity of illness level; supply of IRF, SNF, and LTCH beds per state; and census division. The supply measures of beds per beneficiary per state were included to control for availability of PAC providers and potential provider substitution. These measures are based on 2007 Medicare POS. Home health agencies and hospital outpatient departments are widely available across the nation and were not identified in these models. Characteristics of the discharging acute hospital were also included in the models predicting any post-acute service use, acute admission length of stay, readmission during a post-acute episode, and post-acute care episode payments.
These variables included number of beds in the acute hospital, urban versus rural location, and for-profit versus not-for-profit versus government-run control.
| Variable Names | Independent Variables | |||
|---|---|---|---|---|
| Set 1 | Set 2 | Set 3 | ||
| Demographics | Female | X | X | X |
| Any Medicaid in 2005 | X | X | X | |
| Aged 65-74 | X | X | X | |
| Aged 75-84 | X | X | X | |
| Aged 85+ | X | X | X | |
| Post-Acute Care Supply Variables | IRF beds/1,000 beneficiaries/state | X | X | X |
| SNF beds/1,000 beneficiaries /state | X | X | X | |
| LTCH beds/1,000 beneficiaries /state | X | X | X | |
| Census Division Indicators | Middle Atlantic | X | X | X |
| East North Central | X | X | X | |
| West North Central | X | X | X | |
| South Atlantic | X | X | X | |
| East South Central | X | X | X | |
| West South Central | X | X | X | |
| Mountain | X | X | X | |
| Pacific | X | X | X | |
| Organizational Relationships Variables | Presence of colocated providers | X | X | X |
| Presence of subproviders | X | X | X | |
| Characteristics of Discharging Acute Hospital | Number of Beds | X | X | X |
| Urban Location | X | X | X | |
| Not-for-Profit | X | X | X | |
| Government Owned | X | X | X | |
| Index Acute DRG | DRG 209 544 Major Joint & Limb Reattachment Procedures of Lower Extremity | X | X | |
| DRG 089 Simple Pneumonia & Pleurisy Age > 17 w CC | X | X | ||
| DRG 014 Specific Cerebrovascular Disorders Except TIA | X | X | ||
| DRG 127 Heart Failure & Shock | X | X | ||
| DRG 210 Hip & Femur Procedures Except Major Joint Age > 17 w CC | X | X | ||
| APR-DRG Severity Measure | APR-DRG Severity Index = moderate | X | ||
| APR-DRG Severity Index = major | X | |||
| APR-DRG Severity Index = extreme | X | |||
| MS-DRG Severity Measure | MS-DRG Severity Index = CC | X | X | |
| MS-DRG Severity Index = MCC | X | X | ||
| Hierarchical Condition Category Indicators | HCC80 Congestive Heart Failure | X | ||
| HCC92 Specified Heart Arrhythmias | X | |||
| HCC108 Chronic Obstructive Pulmonary Disease | X | |||
| HCC19 Diabetes without Complication | X | |||
| HCC131 Renal Failure | X | |||
| HCC79 Cardio-Respiratory Failure and Shock | X | |||
| HCC158 Hip Fracture/Dislocation | X | |||
| HCC164 Major Complications of Medical Care and Trauma | X | |||
| HCC105 Vascular Disease | X | |||
| HCC96 Ischemic or Unspecified Stroke | X | |||
| Demographics | Female | X | X | X |
| Any Medicaid in 2005 | X | X | X | |
| Aged 65-74 | X | X | X | |
| Aged 75-84 | X | X | X | |
| Aged 85+ | X | X | X | |
| Post-Acute Care Supply Variables | IRF beds/1,000 beneficiaries/state | X | X | X |
| SNF beds/1,000 beneficiaries /state | X | X | X | |
| LTCH beds/1,000 beneficiaries /state | X | X | X | |
| HCC83 Angina Pectoris/Od Myocardial Infarction | X | |||
Indicator variables for the five most frequent hospital DRGs for PAC users were included in the first two sets of independent variables to capture the added effect of particular diagnoses and the impact of medical versus rehabilitation DRGs in each of the models. These top five DRGs included DRG 544: Major Joint & Limb Reattachment Procedures of Lower Extremity; DRG 089: Simple Pneumonia & Pleurisy Age > 17 w CC; DRG 014: Specific Cerebrovascular Disorders Except TIA; DRG 127: Heart Failure & Shock; and DRG 210: Hip & Femur Procedures Except Major Joint Age > 17 w CC. These five DRGs encompass the most common three DRGs in each PAC setting except for LTCHs. The two most common LTCH DRGs are for tracheostomy procedures and these DRGs are discharged to non-LTCH settings with very low frequency. The uncommon observance of these DRGs in the other PAC settings led to model convergence issues when these DRGs were included.
Organizational relationship variables were also included in each multivariate model. The models predicting any PAC use, acute hospital readmission, PAC episode payment, and predicting acute index admission length of stay included dummy variables indicating if the acute index hospital had any type of subprovider or any type of colocated provider. The multinomial logit model included more specific organizational relationship variables indicating the presence or absence of specific post-acute subproviders or colocated providers. Because the multinomial logit predicts the specific setting of PAC, it is important to know whether the acute index hospital has an organizational relationship with the type of post-acute provider to which a beneficiary is discharged. Correlations were run for all independent variables included in the multivariate models and no significant correlation was noted.
As indicated in Table 2-1, the three sets of independent variables used in the multivariate analyses varied in terms of the severity measures included. The APR-DRG severity measures were used in order to compare the results of the regressions using the 2006 Medicare claims data to the results using 2005 Medicare claims data as reported in last year's findings. In the second set of independent variables, we replaced the APR-DRG severity variables with the MS-DRG severity variables in order to reflect current CMS policy which has mandated the use of MS-DRGs as of FY 2008. Given that the MS-DRGs have fewer categories that measure differences in clinical severity of illness, we also ran a third set of independent variables to include HCC indicator variables along with the MS-DRGs. In these models we removed the indicators for the five most frequent hospital DRGs due to high correlation of these variables to the HCCs. We included HCC indicators variables for HCCs present in 5.0 percent of beneficiaries in the sample. These HCCs included:
- HCC80 Congestive Heart Failure
- HCC92 Specified Heart Arrhythmias
- HCC108 Chronic Obstructive Pulmonary Disease
- HCC19 Diabetes without Complication
- HCC131 Renal Failure
- HCC79 Cardio-Respiratory Failure and Shock
- HCC158 Hip Fracture/Dislocation
- HCC164 Major Complications of Medical Care and Trauma
- HCC105 Vascular Disease
- HCC96 Ischemic or Unspecified Stroke
- HCC83 Angina Pectoris/Old Myocardial Infarction
3. Results
3.1 Geographic Distribution of Providers
This section provides an overview of the availability of PAC services throughout the United States. We focus on the overall distribution of providers by state, the number of providers per 1000 beneficiaries/state and the differences in the share that are freestanding versus hospital-based providers.
In 2007, according to analysis of the Online Survey and Certification Reporting System (OSCAR), there were almost 26,000 post-acute providers in the United States. The majority of PAC providers are the 15,056 SNFs and the 9,286 HHAs, followed by the 1,203 IRFs, and 397 LTCHs. The majority of SNFs, HHAs and LTCHs tend to be freestanding providers whereas IRFs are primarily hospital-based units.
As Figure 3-1 and Table 3-1 show, the geographic distribution of SNFs, IRFs, and LTCHs varies widely across the United States. Overall, Texas had the most PAC providers, with over 3,000. California, Florida, Ohio, and Illinois all had between 1,245 and 1,964 PAC providers in 2007. In contrast, 26 states (particularly in the Midwest and West regions) had fewer than 350 freestanding or hospital-based SNFs, IRFs, HHAs, and LTCHs in 2007.
Figure 3-1. Distribution of Freestanding versus Hospital-Based SNFs, IRFs, and Freestanding and HWH LTCHs in 2007
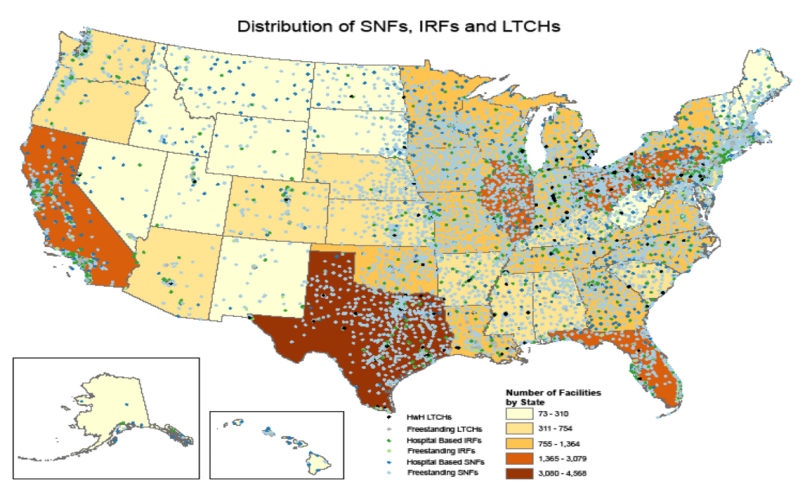
Figure 3-1 is titled "Distribution of Freestanding versus Hospital-Based SNFs, IRFs, and Freestanding and HWH LTCHs in 2007." It is a map the total number of SNF, IRF, and LTCH providers by state. There are five levels of shading based on total number of providers per state. The levels of shading correspond to the following breakdowns: 1.) 73-310 facilities per state; 2.) 311-754 facilities per state; 3.) 755-1,364 facilities per state; 4.) 1,365-3,079 facilities per state; and 5.) 3,080-4,568 facilities per state. States with the fewest total providers include Nevada, Idaho, Montana, Utah, Wyoming, North Dakota, South Dakota, New Mexico, Alabama, Hawaii, West Virginia, Maine, New Hampshire, and Vermont. States with the highest number of total providers include California, Texas, Florida, Illinois, Ohio, and Pennsylvania. In addition to looking at the total number of providers per state, this map also displays the location of each type of freestanding or hospital-based provider across the United States. The source for this analysis was the 2007 POS data.
SOURCE: RTI analysis of 2007 POS data.
Table 3-2 shows the number of acute, SNF, IRF, and LTCH beds per 1,000 beneficiaries. This provides more information on the supply of post-acute care relative to the Medicare beneficiary population in each state. The picture of availability changes somewhat once we control for population size. Texas, which has the highest number of PAC providers, also ranks very high in the number of beds per beneficiary. However, after controlling for Medicare beneficiaries residing in the state, Texas ties with Nevada for the state with the fourth highest number of IRF beds per 1,000 beneficiaries (1.53 beds per 1,000 beneficiaries) but ranks 16th in the number of SNF beds per 1,000 beneficiaries (45.22 beds per 1,000 beneficiaries) and 5th in the number of LTCHs bed per 1,000 beneficiaries (1.51 beds per 1,000 beneficiaries). The other high volume states, such as California are not among the top 20 in terms of beds per 1,000 beneficiaries. States with the highest supply of IRF beds per beneficiary included the District of Columbia (2.66 beds per 1,000 beneficiaries), Louisiana (2.09 beds per 1,000 beneficiaries), Arkansas (1.82 beds per 1,000 beneficiaries), and Texas and Nevada (both 1.53 beds per 1,000 beneficiaries). The states with the highest supply of SNF beds per beneficiary population included North Dakota (62.69 beds per 1,000 beneficiaries), Iowa (59.98 beds per 1,000 beneficiaries), and Louisiana (57.66 beds per 1,000 beneficiaries). The two states with the highest number of LTCH beds per beneficiary included Massachusetts (3.92 beds per 1,000 beneficiaries) and Louisiana (3.08 beds per 1,000 beneficiaries). Delaware was the state with the lowest supply of acute hospital beds per beneficiary (2.90 beds per 1,000 beneficiaries), Maryland had the fewest IRF beds per beneficiary (0.19 beds per 1,000 beneficiaries), Alaska had the fewest SNF beds per beneficiary (11.14 beds per 1,000 beneficiaries), and seven states had no LTCH beds (Montana, New Hampshire, Alaska, Iowa, Maine, Vermont, and Oregon). This analysis demonstrates the variation in supply of providers across the nation as well as the variation in supply of providers per Medicare beneficiary. This variation has implications for use of services during episodes of post-acute care.
| State | Acute Hospital |
SNF | IRF | LTCH | HHA | ||||
|---|---|---|---|---|---|---|---|---|---|
| Hospital Based |
Free- standing |
Hospital Based |
Free- standing |
HwH | Free- standing |
Hospital Based |
Free- standing |
||
| SOURCE: RTI analysis of 2007 POS data (ASPEPAC2_MM31). | |||||||||
| Total | 4,961 | 1,127 | 13,929 | 983 | 220 | 139 | 258 | 1,602 | 7,684 |
| Alabama | 103 | 16 | 213 | 10 | 7 | 1 | 5 | 45 | 101 |
| Alaska | 23 | 11 | 4 | 3 | – | – | – | 9 | 7 |
| Arizona | 80 | 3 | 132 | 17 | 6 | 1 | 4 | 13 | 73 |
| Arkansas | 79 | 15 | 200 | 19 | 8 | 2 | 4 | 58 | 116 |
| California | 357 | 134 | 1063 | 73 | 6 | – | 14 | 80 | 628 |
| Colorado | 74 | 14 | 179 | 16 | 3 | 3 | 4 | 26 | 110 |
| Connecticut | 33 | 5 | 239 | 8 | 1 | – | 3 | 5 | 80 |
| Delaware | 5 | 2 | 36 | 3 | – | 1 | – | 2 | 17 |
| District of Columbia | 7 | 5 | 14 | 2 | 1 | – | 2 | 1 | 24 |
| Florida | 186 | 16 | 661 | 30 | 14 | – | 12 | 31 | 811 |
| Georgia | 145 | 48 | 309 | 30 | 3 | 4 | 11 | 29 | 72 |
| Hawaii | 23 | 17 | 26 | – | 1 | – | 1 | 6 | 8 |
| Idaho | 42 | 17 | 59 | 5 | 1 | – | 1 | 16 | 33 |
| Illinois | 185 | 56 | 647 | 43 | 4 | – | 6 | 70 | 428 |
| Indiana | 117 | 23 | 466 | 36 | 7 | 9 | 3 | 52 | 159 |
| Iowa | 118 | 26 | 389 | 14 | – | – | – | 68 | 109 |
| Kansas | 145 | 12 | 257 | 17 | 4 | 3 | 2 | 57 | 78 |
| Kentucky | 96 | 31 | 261 | 12 | 6 | 6 | 1 | 36 | 68 |
| Louisiana | 131 | 21 | 271 | 31 | 22 | 10 | 31 | 23 | 198 |
| Maine | 40 | 9 | 104 | 4 | 1 | – | – | 6 | 23 |
| Maryland | 47 | 17 | 211 | – | 2 | – | 4 | 6 | 43 |
| Massachusetts | 70 | 14 | 424 | 6 | 8 | – | 17 | 14 | 114 |
| Michigan | 145 | 25 | 379 | 48 | 4 | 11 | 9 | 39 | 361 |
| Minnesota | 133 | 55 | 325 | 17 | 1 | – | 2 | 78 | 137 |
| Mississippi | 101 | 14 | 157 | 14 | – | 7 | 3 | 15 | 41 |
| Missouri | 115 | 20 | 465 | 32 | 4 | 3 | 4 | 57 | 114 |
| Montana | 62 | 32 | 59 | 5 | – | – | – | 25 | 11 |
| Nebraska | 87 | 8 | 188 | 7 | 1 | 2 | – | 44 | 29 |
| Nevada | 34 | 9 | 37 | 9 | 3 | 2 | 3 | 4 | 67 |
| New Hampshire | 26 | 3 | 71 | 3 | 2 | – | – | 4 | 32 |
| New Jersey | 75 | 15 | 347 | 8 | 8 | – | 7 | 14 | 35 |
| New Mexico | 41 | 4 | 63 | 4 | 5 | 1 | 1 | 13 | 55 |
| New York | 206 | 67 | 588 | 70 | – | – | 4 | 73 | 118 |
| North Carolina | 115 | 36 | 384 | 21 | 2 | 3 | 4 | 35 | 134 |
| North Dakota | 45 | 16 | 67 | 4 | – | 2 | – | 18 | 5 |
| Ohio | 171 | 40 | 916 | 54 | 3 | 13 | 8 | 68 | 411 |
| Oklahoma | 127 | 12 | 268 | 21 | 2 | 3 | 11 | 55 | 159 |
| Oregon | 58 | 4 | 117 | 10 | – | – | – | 34 | 23 |
| Pennsylvania | 170 | 59 | 650 | 64 | 18 | 12 | 11 | 59 | 266 |
| Puerto Rico | 52 | 5 | 3 | 1 | 1 | – | – | 4 | 45 |
| Rhode Island | 11 | 1 | 85 | 4 | 1 | – | 1 | 2 | 20 |
| South Carolina | 60 | 16 | 157 | 12 | 5 | 2 | 4 | 17 | 51 |
| South Dakota | 62 | 12 | 81 | 5 | – | 1 | – | 27 | 15 |
| Tennessee | 125 | 22 | 277 | 25 | 6 | 7 | 2 | 29 | 110 |
| Texas | 394 | 37 | 1,038 | 84 | 34 | 26 | 46 | 89 | 1,740 |
| Utah | 40 | 9 | 76 | 8 | 1 | – | 3 | 8 | 65 |
| Vermont | 14 | 3 | 37 | 3 | – | – | – | – | 12 |
| Virginia | 90 | 18 | 239 | 18 | 7 | – | 4 | 42 | 146 |
| Washington | 89 | 12 | 222 | 21 | 1 | 1 | 1 | 25 | 35 |
| West Virginia | 55 | 26 | 97 | 2 | 5 | 1 | 1 | 26 | 35 |
| Wisconsin | 124 | 25 | 347 | 27 | 1 | 2 | 2 | 33 | 95 |
| Wyoming | 26 | 10 | 23 | 3 | – | – | 1 | 12 | 15 |
| State | Acute Beds Per 1,000 Beneficiaries |
IRF Beds Per 1,000 Beneficiaries |
SNF Beds Per 1,000 Beneficiaries |
LTCH Beds Per 1,000 Beneficiaries |
|---|---|---|---|---|
| SOURCE: RTI analysis of 2007 POS data (ASPEPAC2_MM31). | ||||
| Alabama | 18.73 | 0.92 | 34.65 | 0.53 |
| Alaska | 15.82 | 0.51 | 11.14 | 0.00 |
| Arizona | 11.06 | 0.92 | 19.20 | 0.30 |
| Arkansas | 12.17 | 1.82 | 45.17 | 0.47 |
| California | 12.33 | 0.55 | 26.43 | 0.35 |
| Colorado | 10.71 | 0.99 | 34.24 | 0.78 |
| Connecticut | 9.78 | 0.36 | 56.83 | 1.27 |
| Delaware | 2.90 | 0.75 | 33.34 | 0.28 |
| District of Columbia | 36.53 | 2.66 | 32.26 | 1.68 |
| Florida | 11.31 | 0.76 | 25.99 | 0.24 |
| Georgia | 13.45 | 0.88 | 37.61 | 0.69 |
| Hawaii | 12.90 | 0.56 | 21.52 | 0.06 |
| Idaho | 8.87 | 0.72 | 31.41 | 0.21 |
| Illinois | 15.33 | 0.98 | 38.35 | 0.55 |
| Indiana | 9.88 | 1.26 | 50.86 | 0.66 |
| Iowa | 13.56 | 0.55 | 59.98 | 0.00 |
| Kansas | 18.90 | 1.27 | 47.76 | 0.42 |
| Kentucky | 16.83 | 1.05 | 37.30 | 0.83 |
| Louisiana | 12.45 | 2.09 | 57.66 | 3.08 |
| Maine | 11.68 | 0.77 | 28.36 | 0.00 |
| Maryland | 19.05 | 0.19 | 36.56 | 0.68 |
| Massachusetts | 12.00 | 1.24 | 49.53 | 3.92 |
| Michigan | 8.89 | 0.90 | 30.09 | 0.65 |
| Minnesota | 10.37 | 0.56 | 47.87 | 0.52 |
| Mississippi | 18.19 | 0.85 | 34.47 | 0.87 |
| Missouri | 12.20 | 1.04 | 48.62 | 0.50 |
| Montana | 12.21 | 0.80 | 47.71 | 0.00 |
| Nebraska | 15.56 | 0.77 | 54.56 | 0.53 |
| Nevada | 9.86 | 1.53 | 18.26 | 0.84 |
| New Hampshire | 13.12 | 1.10 | 38.98 | 0.00 |
| New Jersey | 18.93 | 0.87 | 40.85 | 0.31 |
| New Mexico | 12.79 | 1.18 | 23.76 | 0.33 |
| New York | 12.08 | 0.86 | 43.73 | 0.37 |
| North Carolina | 11.25 | 0.72 | 33.35 | 0.33 |
| North Dakota | 14.61 | 0.86 | 62.69 | 0.70 |
| Ohio | 11.77 | 0.76 | 53.17 | 0.69 |
| Oklahoma | 14.07 | 1.25 | 47.60 | 1.17 |
| Oregon | 8.84 | 0.30 | 19.95 | 0.00 |
| Pennsylvania | 6.92 | 1.41 | 39.94 | 0.62 |
| Rhode Island | 10.78 | 0.93 | 49.75 | 2.90 |
| South Carolina | 13.38 | 0.92 | 26.85 | 0.46 |
| South Dakota | 12.84 | 1.01 | 47.21 | 0.19 |
| Tennessee | 17.81 | 1.17 | 29.34 | 0.36 |
| Texas | 11.93 | 1.53 | 45.22 | 1.51 |
| Utah | 8.64 | 0.94 | 31.89 | 0.48 |
| Vermont | 8.03 | 0.60 | 33.00 | 0.00 |
| Virginia | 11.88 | 0.76 | 26.43 | 0.18 |
| Washington | 8.17 | 0.57 | 25.01 | 0.13 |
| West Virginia | 20.89 | 0.90 | 27.44 | 0.17 |
| Wisconsin | 8.69 | 0.79 | 43.42 | 0.19 |
| Wyoming | 13.64 | 0.63 | 40.32 | 0.04 |
3.1.1 Freestanding versus Hospital within Hospital Long-Term Care Hospitals
LTCHs are among the smallest number of PAC providers. These hospitals treat medically complex cases often following discharge from an acute intensive care unit (Gage et al, 2007). They are not available in all parts of the nation, although they have grown immensely over the past 20 years, more than doubling in number. The majority are located in the Northeast and Southern parts of the United States. In 2007, there were 397 LTCHs in the United States, the majority of which were freestanding (258, or 65.0 percent) as opposed to being located with acute hospitals, so-called hospital within hospitals (HWH). It is notable that the majority of states in the West region and a large proportion of states in the Midwest region had fewer than 9 LTCHs per state in 2007. The exception was California, which had 14 LTCHs (all freestanding) and Oklahoma, which also had 14 LTCHs (11 of which were freestanding). Most notably, the states of Montana, New Hampshire, Alaska, Iowa, Maine, Vermont, and Oregon had no LTCHs in 2007. Although overall, most LTCHs were freestanding in 2007, Texas, Ohio, and Pennsylvania, were the states with the most colocated HWH LTCHs, with 26, 13, and 12, respectively. HWHs include colocated providers and satellite facilities. Texas also had the most freestanding LTCHs (46), followed by Louisiana (31). Overall, between 2006 and 2007, there was a slight shift in the number of freestanding versus HwH LTCHs. The number of HWH LTCHs decreased 6.0 percent from 148 to 139 and the number of freestanding LTCHs increased from 244 to 257.
3.1.3 Organizational Relationships in Post-Acute Episodes
The next set of tables examines differences in the proportion of episodes that are discharged to freestanding, subprovider, or colocated PAC services and how these patterns differed from 2005 to 2006 (Table 3-3). These numbers reflect the supply of each type of provider nationally. For example, LTCHs are primarily freestanding hospitals. In 2005, 20.4 percent of acute discharges to LTCHs nationally were to colocated LTCHs, which include LTCHs within 250 yards of the acute provider (Gage, Morley, Constantine, et al., 2008). However, this proportion did decrease to 16.3 percent in 2006. A potential explanation for this decrease may be related to CMS' new policy in FY 2005 limiting the proportion of total LTCH admissions from collocated acute hospitals. This policy, known as the 25 Percent Threshold Rule, limited the number of LTCH admissions from colocated acute hospitals to 25.0 percent of an LTCH's total admissions. Across the other types of PAC providers (IRF, SNF, and HHA), there were only very slight changes in the proportion of beneficiaries discharged to each type of provider between 2005 and 2006.
Although we observed that the total number of freestanding IRFs in the United States is relatively small, the volume of discharges to freestanding IRF providers was approaching half of all beneficiaries admitted to IRFs following discharge from the acute hospital. This is due to the fact that freestanding IRFs are generally much larger than rehabilitation units within acute hospitals. The majority of discharges to SNFs and HHAs are to freestanding providers. The proportion of discharges to providers that are colocated, but do not have a formal subprovider relationship is very small for IRFs, SNFs, and HHAs (all less than 3.0 percent).
| 2005 | ||||
|---|---|---|---|---|
| First PAC Setting | N | % Discharges | ||
| Discharges to Freestanding Provider | Discharges to Hospital-Based Subprovider | Discharges to Colocated Provider | ||
| LTCH | 2,368 | 79.6 | - | 20.4 |
| IRF | 12,759 | 49.3 | 47.8 | 2.9 |
| SNF | 46,129 | 83.8 | 13.5 | 2.7 |
| HHA | 41,726 | 76.9 | 21.9 | 1.2 |
| 2006 | ||||
|---|---|---|---|---|
| First PAC Setting | N | % Discharges | ||
| Discharges to Freestanding Provider | Discharges to Hospital-Based Subprovider | Discharges to Colocated Provider | ||
| SOURCE: RTI analysis of 2006 Medicare Claims 5% sample (MM2Y002). | ||||
| LTCH | 2,235 | 83.7 | - | 16.3 |
| IRF | 11,240 | 47.3 | 50.2 | 2.5 |
| SNF | 44,929 | 84.4 | 12.7 | 2.9 |
| HHA | 40,865 | 78.0 | 20.8 | 1.2 |
3.1.2 Freestanding versus Hospital-based Inpatient Rehabilitation Facilities and Skilled Nursing Facilities
There were 1,203 IRFs in the United States in 2007 compared to 1,224 in 2006. The vast majority of IRFs are hospital-based (983, or 82.0 percent). Texas was the most densely populated in terms of IRFs, with 118 (84, or 71.0 percent hospital-based). After Texas, the three states with the most IRFs were Pennsylvania with 82 IRFs (64, or 78.0 percent Hospital-based), California with 79 IRFs (73, or 92.0 percent hospital-based), and New York with 70 (100.0 percent hospital-based). In contrast to these states, the majority of U.S. states had fewer than 20 IRFs. In fact, Hawaii had only one IRF in 2007. Though hospital-based units are more common than freestanding IRFs, IRF units are generally smaller and have a lower volume of admissions compared to freestanding IRF providers.
There were 15,056 SNF providers in 2007. SNFs are by far the most prevalent type of post-acute care facility in the U.S. In contrast to LTCHs and IRFs, the vast majority of SNFs were freestanding (13,929, or 93.0 percent). The three states with the most SNFs in 2007 were California, with 1,197 (1,063, or 89.0 percent, freestanding), Texas, with 1,075 (1,038, or 97.0 percent, freestanding), and Ohio, with 956 (916, or 96.0 percent, freestanding).
Home health agencies are also widely available across the United States. There were 9,286 HHAs in 2007. Of these, 17.3 percent were hospital-based and 82.7 percent were freestanding. States with the highest numbers of home health agencies include Florida (827 home health agencies) and Texas (1,738 home health agencies).
3.2 Post-Acute Care Episodes: First Post-Acute Site of Care, Index Admission Length of Stay and Payment
This section looks at the use of post-acute services, particularly the first site of care following the hospital discharge but also provides information on the reasons for hospitalization, the length of stay, and the average payments for the stay prior to PAC use.
Over 14.0 percent of beneficiaries had an acute hospital discharge meeting our episode criteria of an acute hospital stay following a 60-day window without acute or PAC service use.12 Of these, 35.2 percent were discharged to a post-acute site of care for further treatment. The largest share of those discharged to PAC were discharged to SNFs (41.1 percent) or home health agencies (37.4 percent) while inpatient rehabilitation hospitals and hospital outpatient therapy providers accounted for 10.3 percent and 9.1 percent, respectively (Table 3-4). Only a small number of beneficiaries with index acute hospital admissions were discharged to LTCHs (2.0 percent). Note that the proportion of beneficiaries discharged to SNF and HHA differed very little from similar analyses conducted using 2005 data (Table 3-5). However, there was a slight decrease in the proportion of beneficiaries discharged to IRF in 2006 compared to 2005 (11.4 percent in 2005 vs. 10.3 percent in 2006) and a corresponding increase in the proportion of beneficiaries discharged to hospital outpatient therapy (8.0 percent in 2005 vs. 9.1 percent in 2006) indicating a shift to increasing use of outpatient therapy services.
| Discharge Destination | N | % of Acute Discharges (%) |
Mean Length of Stay (days) |
Mean Payment ($) |
|---|---|---|---|---|
| NOTE: 35.2 percent of live discharges from index acute hospitalizations went on to use PAC in 2006. SOURCE: RTI analysis of 2006 Medicare Claims 5% sample (MM2Y002). |
||||
| LTCH | 2,235 | 2.0 | 16.8 | $32,486 |
| IRF | 11,240 | 10.3 | 6.9 | 12,725 |
| SNF | 44,929 | 41.1 | 7.4 | 9,417 |
| HHA | 40,865 | 37.4 | 6.1 | 10,044 |
| Hospital Outpatient Therapy | 9,967 | 9.1 | 4.8 | 7,589 |
| Discharge Destination | N | % of Acute Discharges (%) |
Mean Length of Stay (days) |
Mean Payment ($) |
|---|---|---|---|---|
| NOTE: 34.8 percent of live discharges from index acute hospitalizations went on to use PAC in 2005. SOURCE: RTI analysis of 2005 Medicare Claims 5% sample (mmor075b). |
||||
| LTCH | 2,368 | 2.1 | 16.4 | $30,204 |
| IRF | 12,759 | 11.4 | 6.7 | 12,003 |
| SNF | 46,129 | 41.2 | 7.6 | 9,085 |
| HHA | 41,726 | 37.3 | 6.3 | 9,929 |
| Hospital Outpatient Therapy | 8,897 | 8.0 | 4.9 | 7,531 |
Patients discharged to SNFs had an average acute index admission length of stay of 7.4 days compared with 6.9 days for patients discharged to IRFs. Acute hospital payments averaged $9,417 for beneficiaries discharged to SNFs and $12,725 for patients discharged to IRF. The shorter lengths of stay and higher index acute hospital payments for patients discharged to IRFs reflect the patient populations discharged to the IRF setting. These beneficiaries include those receiving surgical procedures for hip and knee replacements or other procedures that lead to higher resource utilization in the acute care setting.
3.3 Diagnosis Related Groups by Hospital and Post-Acute Care Setting
Table 3-6 presents the 20 most common acute hospital DRGS in 2006 (for beneficiaries who go on to PAC as well as beneficiaries not using PAC). For each DRG, Table 3-6 shows the total number of hospital discharges, the percent of all hospital discharges that each DRG accounts for, the average Medicare payment for index acute hospital stays with this DRG, and the percent of beneficiaries in the DRG that go on to use PAC services. The most common type of acute hospital discharge is DRG 544: Major Joint Replacement or Reattachment of Lower Extremity. This DRG represents over 5.0 percent of all hospital discharges in 2006, and 87.0 percent of beneficiaries is this DRG go on to use PAC services. The next two most common acute hospital DRGs are DRG 089: Simple Pneumonia and DRG 127: Heart Failure and Shock. While these two DRGs account for high numbers of acute hospital discharges, they are much less likely to use PAC; only one-third of each of these cases is discharged to PAC. Still, as shown on Table 3-7, these DRGs rank 3rd and 4th in terms of the highest volume of discharges among beneficiaries using PAC services. Despite the fact that only one-third of beneficiaries in these two DRGs go on to use PAC following hospital discharge, the high volume of these DRGs in the acute hospital leads to their high proportion in the PAC population. Two DRGs that are most common in acute hospital discharges but that are not likely to use PAC services are DRG 143: Chest Pain and DRG 588: Percutaneous Cardiovascular Procedure, with less than 10.0 percent and 5.0 percent, respectively use PAC. Although DRG 544 is the most common DRG for hospital discharges, it is not the most costly. DRG 148: Major Small & Large Bowel Procedures represents only 1.0 percent of all hospital discharges, yet the average acute index admission payment for is $19,713, the highest among the 20 most common acute hospital DRGs. Almost half these cases (46.4 percent of live hospital discharges)
Table 3-7 presents the 20 most common acute hospital DRGs discharged to PAC by volume and the percent of beneficiaries discharged to each first site of care for each DRG. Note the overlap between Tables 3-6 and 3-7, in that 15 of the top 20 DRGs for all hospital discharges are among the top 20 DRGs discharged to PAC. DRG 545: Revision of Hip or Knee Replacement and DRG 236: Fractures of Hip and Pelvis are two DRGs for which over 80% of all discharges go on to use PAC services but are not among the 20 most common DRGs for all acute hospital discharges.
The goal of Table 3-7 is to show how patients with the same index acute hospital DRG may be discharged to multiple settings, although the distribution of discharges by type of setting may differ by whether the case is primarily medical or rehabilitation-oriented. The DRG from the index acute admission, rather than the diagnosis on the post-acute care claim, was used in order to standardize the analysis of post-acute episodes. Note that the 2006 DRG designations are presented here.
Of the 35.2 percent of beneficiaries in our episode file with an index acute hospital discharge who go on to use PAC, the most common DRG is 544 Major Joint & Limb Reattachment Procedures of Lower Extremity (typically hip or knee replacement procedures). Over 87.0 percent of beneficiaries in this DRG go on to use PAC. These rehabilitation patients are admitted to a range of settings following discharge from the acute hospital. In this DRG, 19.4 percent are discharged to IRFs, 37.3 percent are discharged to SNFs, and 35.7 percent are discharged to HHAs. In our analyses of the 2005 episode data, DRGs 209 and 544 were coded separately, and in 2006 both of these DRGs were combined. The proportion of beneficiaries in this DRG discharged to IRF decreased from 2005 to 2006. In 2005, 25.7 percent of beneficiaries in DRG 209 were discharged to IRF (23.2 percent of beneficiaries in DRG 544). In 2006, 19.4 percent of beneficiaries in DRG 544 were discharged to IRF. This decrease is likely due to increased compliance with statutory requirements that at least a minimum percentage of an inpatient rehabilitation facility's (60.0 percent of admissions, as of July 2006) patient population require treatment for at least one of thirteen conditions.
| Acute Index DRG1 | Number of All Hospital Discharges | Percent of All Hospital Discharges | Mean Acute Index Admission Payment | Percent Using PAC |
|---|---|---|---|---|
| 1. NOTE: FY 2006 DRG titles were used in this analysis. SOURCE: RTI analysis of 2006 Medicare Claims 5% sample. |
||||
| 544: Major Joint Replacement or Reattachment of Lower Extremity | 17,475 | 5.5 | $10,504 | 87.3 |
| 089: Simple Pneumonia & Pleurisy Age > 17 w CC | 13,911 | 4.3 | $5,069 | 33.6 |
| 127: Heart Failure & Shock | 12,165 | 3.8 | $5,229 | 33.7 |
| 088: Chronic Obstructive Pulmonary Disease | 9,655 | 3.0 | $4,275 | 25.3 |
| 014: Specific Cerebrovascular Disorders except TIA | 8,398 | 2.6 | $6,413 | 58.1 |
| 182: Esophagitis, Gastroent & Misc Digest Disorders Age > 17 w CC | 8,071 | 2.5 | $3,967 | 17.9 |
| 143: Chest Pain | 6,580 | 2.1 | $2,448 | 7.8 |
| 174:G.I. Hemorrhage w CC | 6,448 | 2.0 | $5,201 | 22.6 |
| 558: Percutaneous Cardiovascular Proc w Drug-Eluting Stent | 6,025 | 1.9 | $12,587 | 3.5 |
| 320: Kidney & Urinary Tract Infections Age > 17 w CC | 5,666 | 1.8 | $4,229 | 42.3 |
| 138: Cardiac Arrhythmia & Conduction Disorders w CC | 5,646 | 1.8 | $4,100 | 21.9 |
| 316: Renal Failure | 5,106 | 1.6 | $6,823 | 36.2 |
| 416: Septicemia Age > 17 | 4,981 | 1.6 | $9,165 | 40.1 |
| 296: Nutritional & Misc Metabolic Disorders Age > 17 w CC | 4,946 | 1.5 | $3,979 | 35.5 |
| 557: Percutaneous Cardiovasc Proc with Drug Eluting Stent w major cardiovascular diagn | 4,081 | 1.3 | $17,055 | 13.7 |
| 210: Hip & Femur Procedures except Major Joint Age > 17 w CC | 4,055 | 1.3 | $10,013 | 87.6 |
| 141: Syncope and Collapse | 3,605 | 1.1 | $3,647 | 27.3 |
| 524: Transient Eschemia | 3,527 | 1.1 | $3,408 | 25.1 |
| 277: Cellulitis Age > 17 w CC | 3,110 | 1.0 | $4,394 | 38.7 |
| 148: Major Small & Large Bowel Procedures w CC | 3,097 | 1.0 | $19,713 | 46.4 |
| Acute Index DRG1 | Total Hospital Discharges for PAC Users |
Percent Using PAC2 | Percent of Beneficiaries Discharged to Each Setting3 | ||||
|---|---|---|---|---|---|---|---|
| LTCH | IRF | SNF | HHA | Outpatient | |||
| 1. FY 2006 DRG titles were used in this analysis. 2. Indicates the percent of beneficiaries discharged from the acute hospital with this DRG who go on to use PAC. 3. Indicates the percent of PAC users in the DRG discharged to each type of post-acute setting. SOURCE: RTI analysis of 2006 Medicare Claims 5% sample. |
|||||||
| 544: Major Joint Replacement or Reattachment of Lower Extremity | 15,261 | 87.3 | 0.3 | 19.4 | 37.3 | 35.7 | 7.4 |
| 014: Specific Cerebrovascular Disorders Except TIA | 4,882 | 58.1 | 1.8 | 34.4 | 35.6 | 19.7 | 8.5 |
| 089: Simple Pneumonia & Pleurisy Age >17 w CC | 4,675 | 33.6 | 1.2 | 1.8 | 47.3 | 37.4 | 12.2 |
| 127: Heart Failure & Shock | 4,096 | 33.7 | 1.1 | 1.9 | 39.1 | 49.4 | 8.5 |
| 210: Hip & Femur Procedures except Major Joint Age >17 w CC | 3,552 | 87.6 | 1.1 | 25.3 | 63.9 | 7.1 | 2.6 |
| 088: Chronic Obstructive Pulmonary Disease | 2,439 | 25.3 | 1.8 | 2.3 | 32.4 | 52.2 | 11.3 |
| 320: Kidney & Urinary Tract Infections Age >17 w CC | 2,396 | 42.3 | 0.7 | 2.0 | 63.6 | 25.1 | 8.7 |
| 416: Septicemia Age >17 | 1,996 | 40.1 | 3.5 | 3.0 | 57.8 | 26.0 | 9.8 |
| 316: Renal Failure | 1,848 | 36.2 | 1.5 | 2.5 | 53.2 | 31.9 | 10.9 |
| 296: Nutritional & Misc Metabolic Disorders Age >17 w CC | 1,757 | 35.5 | 0.7 | 3.0 | 53.7 | 32.5 | 10.1 |
| 243: Medical Back Problems | 1,565 | 52.8 | 0.7 | 9.9 | 52.0 | 27.9 | 9.5 |
| 174: G.I. Hemorrhage w CC | 1,455 | 22.6 | 0.7 | 2.3 | 48.0 | 37.9 | 11.2 |
| 182: Esophagitis, Gastroent & Misc Digest Disorders Age >17 w CC | 1,445 | 17.9 | 0.8 | 2.8 | 42.2 | 41.6 | 12.7 |
| 148: Major Small & Large Bowel Procedures w CC | 1,437 | 46.4 | 4.2 | 4.4 | 38.2 | 50.3 | 2.9 |
| 079: Respiratory Infections & Inflammations Age >17 w CC | 1,370 | 45.2 | 2.8 | 1.9 | 61.8 | 25.0 | 8.5 |
| 121: Circulatory Disorders w Ami & Major Comp Disch Alive | 1,363 | 45.8 | 1.8 | 4.3 | 50.6 | 38.7 | 4.6 |
| 138: Cardiac Arrhythmia & Conduction Disorders w CC | 1,234 | 21.9 | 0.7 | 2.4 | 39.2 | 47.7 | 10.1 |
| 277: Cellulitis Age >17 w CC | 1,205 | 38.7 | 1.9 | 1.5 | 38.8 | 46.2 | 11.6 |
| 236: Fractures of Hip & Pelvis | 1,064 | 81.3 | 0.7 | 14.7 | 66.3 | 12.8 | 5.6 |
| 545: Revision of Hip or Knee Replacement | 1,037 | 83.8 | 1.2 | 20.3 | 34.4 | 37.9 | 6.3 |
The thirteen conditions meeting the statutory requirements include hip fractures, but do not include knee replacements. Therefore, beneficiaries with knee replacements are more likely to be discharged to the other PAC settings, especially SNFs as IRFs try to maintain compliance with the 60.0 percent rule and maintain inpatient rehabilitation facility status and payments under the IRF prospective payment system.
The second most common DRG among PAC users is DRG 014 Specific Cerebrovascular Disorders except TIA. Over 58.0 percent of beneficiaries discharged from an acute hospital stay in this DRG go on to use PAC services. These beneficiaries are most frequently discharged from the hospital to SNFs (35.6 percent) or IRFs (34.4 percent), and a smaller proportion are discharged to HHAs (19.7 percent). Beneficiaries in DRG 089 Simple Pneumonia are less likely to use any PAC services (33.6 percent), and when they are discharged to PAC, they are typically discharged to less intense settings of care such as SNF (47.3 percent) or HHA (37.4 percent). In general, the majority of PAC cases are discharged to SNFs or HHAs but, as shown in Table 3-7, IRF services make up a substantial share of services used for certain DRGs, such as DRG 014, DRG 210 Hip and Femur Procedures Except Major Joint, DRG 236 Fractures of Hip & Pelvis, and DRG 545 Revision of Hip or Knee Replacement. These results clearly indicate that the first site of PAC varies by DRG.
While patients may be discharged to different settings, the relative frequency of that type of case within each setting may vary. Table 3-8 illustrates the relative ranking within each site of care for the top 20 index acute hospital DRGs by volume among beneficiaries discharged to PAC. As noted above, DRG 544 was the most common DRG with 15,261 admissions in 2006. This high volume DRG was also the most common admission to IRF, SNF, HHA, and hospital outpatient therapy settings, and ranked 9th for beneficiaries discharged to LTCHs.
| Acute Index Admission DRG2 | First Site of PAC | |||||||||||||||||
|---|---|---|---|---|---|---|---|---|---|---|---|---|---|---|---|---|---|---|
| Total PAC Users | LTCH | IRF | SNF | HHA | Hospital Outpatient Therapy | |||||||||||||
| Rank | # | % | Rank | # | % | Rank | # | % | Rank | # | % | Rank | # | % | Rank | # | % | |
| 1. Indicates the ranking of this DRG by setting. For example, DRG 544 is the 9th most frequent DRG for beneficiaries discharged to LTCH and accounts for 2.2 percent of beneficiaries discharged to this PAC setting. 2. FY 2006 DRG titles were used in this analysis. SOURCE: RTI analysis of 2006 Medicare Claims 5% sample (MM2Y096). |
||||||||||||||||||
| 544: Major Joint Replacement or Reattachment of Lower Extremity | 1 | 15,261 | 14.0 | 9 | 50 | 2.2 | 1 | 2,963 | 26.4 | 1 | 5,684 | 12.7 | 1 | 5,442 | 13.3 | 1 | 1,122 | 11.3 |
| 014: Specific Cerebrovascular Disorders Except TIA | 2 | 4,882 | 4.5 | 3 | 89 | 4.0 | 2 | 1,678 | 14.9 | 4 | 1,738 | 3.9 | 5 | 960 | 2.3 | 3 | 417 | 4.2 |
| 089: Simple Pneumonia & Pleurisy Age >17 w CC | 3 | 4,675 | 4.3 | 7 | 57 | 2.6 | 15 | 84 | 0.7 | 3 | 2,212 | 4.9 | 3 | 1,749 | 4.3 | 2 | 572 | 5.7 |
| 127: Heart Failure & Shock | 4 | 4,096 | 3.7 | 10 | 44 | 2.0 | 17 | 78 | 0.7 | 5 | 1,600 | 3.6 | 2 | 2,024 | 5.0 | 4 | 350 | 3.5 |
| 210: Hip & Femur Procedures except Major Joint Age >17 w CC | 5 | 3,552 | 3.3 | 13 | 38 | 1.7 | 3 | 899 | 8.0 | 2 | 2,269 | 5.1 | 33 | 253 | 0.6 | 20 | 93 | 0.9 |
| 088: Chronic Obstructive Pulmonary Disease | 6 | 2,439 | 2.2 | 11 | 43 | 1.9 | 30 | 56 | 0.5 | 12 | 790 | 1.8 | 4 | 1,274 | 3.1 | 5 | 276 | 2.8 |
| 320: Kidney & Urinary Tract Infections Age >17 w CC | 7 | 2,396 | 2.2 | 30 | 16 | 0.7 | 40 | 48 | 0.4 | 6 | 1,523 | 3.4 | 8 | 601 | 1.5 | 6 | 208 | 2.1 |
| 416: Septicemia Age >17 | 8 | 1,996 | 1.8 | 4 | 70 | 3.1 | 28 | 59 | 0.5 | 7 | 1,153 | 2.6 | 15 | 519 | 1.3 | 8 | 195 | 2.0 |
| 316: Renal Failure | 9 | 1,848 | 1.7 | 17 | 27 | 1.2 | 41 | 47 | 0.4 | 8 | 983 | 2.2 | 9 | 589 | 1.4 | 7 | 202 | 2.0 |
| 296: Nutritional & Misc Metabolic Disorders Age >17 w CC | 10 | 1,757 | 1.6 | 38 | 12 | 0.5 | 34 | 53 | 0.5 | 9 | 944 | 2.1 | 11 | 571 | 1.4 | 10 | 177 | 1.8 |
| 243: Medical Back Problems | 11 | 1,565 | 1.4 | 41 | 11 | 0.5 | 10 | 155 | 1.4 | 11 | 813 | 1.8 | 17 | 437 | 1.1 | 13 | 149 | 1.5 |
| 174: G.I. Hemorrhage w CC | 12 | 1,455 | 1.3 | 48 | 10 | 0.4 | 50 | 33 | 0.3 | 14 | 698 | 1.6 | 13 | 551 | 1.3 | 11 | 163 | 1.6 |
| 182: Esophagitis, Gastroent & Misc Digest Disorders Age >17 w CC | 13 | 1,445 | 1.3 | 40 | 11 | 0.5 | 45 | 40 | 0.4 | 17 | 610 | 1.4 | 7 | 601 | 1.5 | 9 | 183 | 1.8 |
| 148: Major Small & Large Bowel Procedures w CC | 14 | 1,437 | 1.3 | 6 | 61 | 2.7 | 24 | 63 | 0.6 | 18 | 549 | 1.2 | 6 | 723 | 1.8 | 56 | 41 | 0.4 |
| 079: Respiratory Infections & Inflammations Age >17 w CC | 15 | 1,370 | 1.3 | 12 | 38 | 1.7 | 62 | 26 | 0.2 | 10 | 846 | 1.9 | 26 | 343 | 0.8 | 18 | 117 | 1.2 |
| 121: Circulatory Disorders w Ami & Major Comp Disch Alive | 16 | 1,363 | 1.2 | 18 | 24 | 1.1 | 29 | 58 | 0.5 | 15 | 690 | 1.5 | 14 | 528 | 1.3 | 31 | 63 | 0.6 |
| 138: Cardiac Arrhythmia & Conduction Disorders w CC | 17 | 1,234 | 1.1 | 51 | 9 | 0.4 | 56 | 29 | 0.3 | 19 | 484 | 1.1 | 10 | 588 | 1.4 | 17 | 124 | 1.2 |
| 277: Cellulitis Age >17 w CC | 18 | 1,205 | 1.1 | 19 | 23 | 1.0 | 78 | 18 | 0.2 | 20 | 467 | 1.0 | 12 | 557 | 1.4 | 15 | 140 | 1.4 |
| 236: Fractures of Hip & Pelvis | 19 | 1,064 | 1.0 | 65 | 7 | 0.3 | 9 | 156 | 1.4 | 13 | 705 | 1.6 | 60 | 136 | 0.3 | 34 | 60 | 0.6 |
| 545: Revision of Hip or Knee Replacement | 20 | 1,037 | 0.9 | 39 | 12 | 0.5 | 5 | 210 | 1.9 | 25 | 357 | 0.8 | 21 | 393 | 1.0 | 29 | 65 | 0.7 |
The most common admissions to the IRF setting are for orthopedic procedures (DRG 544, and DRG 210) as well as stroke (DRG 014). Though pneumonia is the third most common index acute hospital DRG among beneficiaries discharged to PAC, and also ranks highly among beneficiaries discharged to SNF (3rd), HHA (3rd), and hospital outpatient therapy (2nd), pneumonia ranks 15th among beneficiaries discharged to IRF. This result is expected due to the intensive rehabilitation services delivered in IRFs. Another notable finding here is the relatively high ranking of DRG 210 Hip & Femur Procedures Except Major Joint Age > 17 w CC, among beneficiaries discharged to IRF (3rd) and SNF (2nd) compared to beneficiaries discharged to HHA (33rd) and hospital outpatient therapy (20th) reflecting the more frequent use of inpatient services following acute hospital discharge for beneficiaries in this DRG. In general, the top 20 DRGs for index acute admissions are common across the post-acute care settings except in LTCHs. The top DRGs for discharges to LTCHs are related to ventilator cases which occur in very small numbers overall.
3.4 Description of the Post-Acute Care Sample
Table 3-9 describes the study population in terms of their demographics and severity levels (APR-DRGs, FY 2008 CMS MS-DRGs, and HCCs). These results are shown for both non-PAC users and PAC users. For beneficiaries using PAC services, the demographics and severity within each setting are presented. The proportions show the characteristics of cases discharged to each PAC setting as their first site following hospital discharge. Severity indicators are presented for 2006 only as these analyses were not conducted on 2005 claims.13 The demographics for 2006 are essentially unchanged from those in 2005, with a few exceptions noted here.
| No PAC Use | PAC Users By First Discharge Destination | |||||||||||||
|---|---|---|---|---|---|---|---|---|---|---|---|---|---|---|
| PAC Users | LTCH | IRF | SNF | HHA | Outpatient | |||||||||
| 2005 | 2006 | 2005 | 2006 | 2005 | 2006 | 2005 | 2006 | 2005 | 2006 | 2005 | 2006 | 2005 | 2006 | |
| 1. Other includes Asian, Hispanic, North American Native, Unknown, and Other. SOURCE: RTI analysis of 2005 and 2006 Medicare Claims 5% sample (mmor075b, pcs06). |
||||||||||||||
| Total Episodes | 209,547 | 201,392 | 111,879 | 109,236 | 2,368 | 2,235 | 12,759 | 11,240 | 46,129 | 44,929 | 41,726 | 40,865 | 8,897 | 9,967 |
| % | 65.2% | 64.8% | 34.8% | 35.2% | 2.1% | 2.0% | 11.4% | 10.3% | 41.2% | 41.1% | 37.3% | 37.4% | 8.0% | 9.1% |
| Demographics (%) | ||||||||||||||
| Female: | 53.6 | 53.4 | 63.4 | 63.0 | 52.6 | 51.9 | 63.8 | 62.7 | 67.4 | 67.5 | 60.6 | 60.2 | 58.3 | 57.0 |
| Age: | ||||||||||||||
| Less than 65 | 19.2 | 19.7 | 8.6 | 8.8 | 18.1 | 20.0 | 8.5 | 8.7 | 5.5 | 8.7 | 10.2 | 10.4 | 14.6 | 14.4 |
| 65-74 Years | 35.7 | 35.4 | 25.3 | 25.4 | 29.2 | 28.4 | 31.7 | 30.5 | 17.3 | 14.5 | 30.4 | 30.7 | 32.5 | 32.7 |
| 75-84 Years | 32.5 | 32.1 | 39.3 | 38.5 | 36.0 | 35.0 | 42.9 | 41.9 | 40.2 | 39.5 | 39.0 | 38.1 | 32.4 | 32.3 |
| 85 Years and Over | 12.6 | 12.8 | 26.8 | 27.3 | 16.6 | 16.6 | 16.9 | 18.9 | 37.0 | 37.3 | 20.5 | 20.8 | 20.5 | 20.6 |
| Race: | ||||||||||||||
| White | 84.3 | 84.4 | 87.0 | 86.9 | 77.6 | 75.6 | 87.2 | 87.6 | 89.1 | 88.9 | 85.1 | 85.4 | 86.9 | 85.6 |
| Black | 11.0 | 10.9 | 9.4 | 9.4 | 16.9 | 18.3 | 8.9 | 8.5 | 8.3 | 8.4 | 10.3 | 10.2 | 9.6 | 10.3 |
| Other1 | 4.7 | 4.7 | 3.6 | 3.6 | 5.4 | 6.1 | 3.9 | 3.8 | 2.6 | 2.7 | 4.6 | 4.4 | 3.6 | 4.1 |
| Severity | ||||||||||||||
| APR-DRG Severity Index: | ||||||||||||||
| 1 (low) | 28.8 | 28.6 | 16.0 | 15.5 | 3.6 | 3.7 | 19.4 | 16.7 | 11.7 | 11.5 | 18.7 | 18.4 | 24.3 | 22.7 |
| 2 | 48.8 | 47.5 | 46.5 | 45.4 | 24.1 | 18.3 | 48.5 | 47.1 | 45.7 | 44.6 | 47.6 | 46.6 | 48.9 | 48.5 |
| 3 | 17.5 | 17.4 | 29.3 | 28.5 | 36.6 | 36.9 | 25.7 | 26.4 | 33.3 | 32.2 | 27.3 | 26.5 | 21.8 | 21.0 |
| 4 (high) | 1.9 | 2.1 | 5.9 | 6.3 | 33.2 | 37.4 | 5.4 | 6.8 | 6.9 | 7.0 | 4.0 | 4.3 | 2.9 | 3.5 |
| MS-DRG Severity Index | ||||||||||||||
| w/o CC/MCC | -- | 68.1 | -- | 56.0 | -- | 41.8 | -- | 58.1 | -- | 51.9 | -- | 58.8 | -- | 64.0 |
| CC | -- | 20.5 | -- | 24.5 | -- | 18.1 | -- | 23.9 | -- | 25.6 | -- | 24.6 | -- | 21.0 |
| MCC | -- | 11.4 | -- | 19.5 | -- | 40.0 | -- | 25.6 | -- | 22.5 | -- | 16.6 | -- | 15.0 |
| HCC | ||||||||||||||
| None | -- | 18.3 | -- | 14.5 | -- | 1.7 | -- | 15.0 | -- | 12.1 | -- | 16.4 | -- | 19.5 |
| 1 | -- | 31.0 | -- | 24.1 | -- | 7.3 | -- | 24.8 | -- | 22.9 | -- | 25.4 | -- | 26.4 |
| 2 | -- | 25.5 | -- | 24.4 | -- | 13.9 | -- | 23.9 | -- | 24.8 | -- | 24.6 | -- | 24.4 |
| 3 | -- | 15.3 | -- | 18.5 | -- | 22.6 | -- | 18.5 | -- | 19.6 | -- | 17.8 | -- | 15.7 |
| 4 | -- | 7.0 | -- | 11.3 | -- | 22.7 | -- | 10.7 | -- | 12.4 | -- | 10.3 | -- | 9.1 |
| 5+ | -- | 2.9 | -- | 7.2 | -- | 31.9 | -- | 7.1 | -- | 8.0 | -- | 5.5 | -- | 5.0 |
| Any Medicaid in 2006 | 23.5 | 23.1 | 23.9 | 23.4 | 30.2 | 32.9 | 15.6 | 15.4 | 27.9 | 27.3 | 21.1 | 19.9 | 27.2 | 26.7 |
| Readmission | 30.2 | 30.5 | 42.8 | 43.7 | 29.1 | 30.4 | 30.9 | 31.3 | 30.1 | 30.1 | 25.5 | 25.3 | ||
In both 2005 and 2006, PAC users were more likely to be female and were older, on average, than non-PAC users. In 2006, approximately 63.0 percent of PAC users were female, compared with only 53.0 percent of non-PAC users. Two-thirds of the PAC users (66.0 percent) were over age 75, compared to only 45.0 percent of the non-PAC users. The age distribution also varied among PAC users by first PAC setting. Beneficiaries discharged to SNFs tended to be older than beneficiaries discharged to other PAC settings. Of beneficiaries discharged to SNFs in 2006, 37.0 percent were aged 85 or older, compared with only 21.0 percent of patients discharged to HHAs and 19.0 percent of patients discharged to IRFs.
Severity of illness was measured by both the APR-DRG severity index and the MS-DRG severity index. Note that as discussed in Chapter 2, the APR-DRGs and MS-DRGs use different methods to assign severity levels. Although it is not possible to directly compare these measures, both have been included in our analysis in order to allow for comparisons to our previous work using the APR-DRGs and to reflect the current Medicare policy in adopting the MS-DRG system.
In both 2005 and 2006, severity of illness as measured by APR-DRG was higher for PAC users than for non-PAC users. In 2006, approximately 35.0 percent of PAC users had APR-DRGs in levels 3 or 4, compared with approximately 20.0 percent of non-PAC users. Of 2006 PAC users, beneficiaries discharged to LTCHs had the highest proportion of patients in APR-DRG level 4 (37.0 percent). This was a 4.0 percent increase in the proportion of level 4 patients discharged to LTCHs compared to 2005. Beneficiaries discharged to HHAs and hospital outpatient therapy were more likely to have lower APR-DRG severity levels, compared with beneficiaries admitted to the inpatient PAC settings.
Severity of illness as measured by the MS-DRG severity index also demonstrated that PAC users were more likely to have CCs and MCCs than non-PAC users. Approximately 44.0 percent of PAC users had either CCs or MCCs, compared with 32.0 percent of non-PAC users. Mirroring the findings for APR-DRGs, beneficiaries discharged to LTCHs had the highest proportion of patients in the MCC MS-DRG severity category (40.0 percent). In comparison, only 15.0 percent of beneficiaries discharged to hospital outpatient therapy and 17.0 percent of beneficiaries discharged to HHA were in the MCC MS-DRG severity category.
One interesting finding shown in this table is that there was a significantly higher proportion of beneficiaries in the lowest MS-DRG severity level (no CCs), compared with the number in the lowest APR-DRG severity level. Wynn and colleagues (2007) have noted that compared with the APR-DRG systems, the MS-DRGs have a much higher percentage of discharges assigned to the lowest severity level. Reasons for this are related to the specifics of the MS-DRG methodology. Beneficiaries are assigned to the lowest MS-DRG group in cases in which there is no CC severity level, where the base DRGs are not divided into severity subgroups, and where the DRGs are split into based on the presence of a MCC only.
The presence of comorbid or complicating conditions was examined using the HCCs. A larger proportion of beneficiaries with at least three HCCs used PAC services (37.0 percent), compared with beneficiaries who did not use PAC services (25.0 percent). Conversely, a larger proportion of beneficiaries with none or one HCC do not use PAC services (49.0 percent) compared with beneficiaries who do use PAC services (39.0 percent).
The distribution of the number of HCCs varied among PAC users by first PAC destination. Of beneficiaries discharged to LTCHs, 32.0 percent had five or more HCCs. The distribution of HCCs was more similar for beneficiaries discharged to other settings of post-acute care. Approximately half of all beneficiaries discharged to IRFs, SNFs, HHAs, or hospital outpatient therapy had one or two HCCs.
The last line of Table 3-9 shows the percentage of beneficiaries with readmissions to acute hospitals during their post-acute episodes by first setting of PAC for 2005 and 2006. Overall, more than 30.0 percent of PAC users had a readmission during a PAC episode in both 2005 and 2006. The patterns of readmission rates by first PAC setting were consistent with the patterns observed for APR-DRGs, MS-DRGs, and HCCs in which beneficiaries discharged to LTCH had more severe conditions and higher rates of hospital readmission compared with beneficiaries discharged to other inpatient settings or to home health or hospital outpatient therapy. Over 43.0 percent of beneficiaries discharged to LTCH had an acute hospital readmission during their PAC episode in 2006. Similar readmission rates were observed in 2006 for beneficiaries discharged to IRFs (30.4 percent), SNFs (31.3 percent), and HHAs (30.1 percent). In contrast, readmission rates for beneficiaries discharged to hospital outpatient therapy were 25.3 percent in 2006.
More specific detail on readmission rates per DRG is presented in Table 3-10. This table shows the percentage of beneficiaries with at least one acute hospital readmission during an episode of PAC, and the mean acute readmission payments, for the top ten DRGs by volume among PAC users. Readmission rates in episodes of care clearly vary by DRG. For beneficiaries in the most common DRG, DRG 544, 14.3 percent of beneficiaries had at least one readmission during PAC episodes compared to 32.6 percent of beneficiaries in DRG 014. The DRG with the highest readmission rate among the top 10 most common DRGs was DRG 127 Heart Failure and Shock in which over 43.0 percent of beneficiaries had at least one acute hospital readmission during their PAC episodes. Mean payments associated with readmissions for beneficiaries in DRG 127 were also the highest among the top 10 DRGs at $17,449. These rates, again, reflect differences between the medical and rehabilitation populations.
| N PAC Users |
Mean Episode Payments |
Percent with Readmission |
Mean Readmission Payments |
|
|---|---|---|---|---|
| 1. NOTE: FY 2006 DRG titles were used in this analysis. SOURCE: RTI analysis of 2006 Medicare Claims 5% sample (MM2Y097). |
||||
| Overall Sample of PAC Users | 109,236 | $30,028 | 30.5 | $15,636 |
| Index Acute Admission DRG1 (Top 10 DRGs for PAC Users) | ||||
| 544 Major Joint Replacement or Reattachment of Lower Extremity | 15,261 | $23,985 | 14.3 | $12,952 |
| 014 Specific Cerebrovascular Disorders Except TIA | 4,882 | $33,484 | 32.6 | $13,409 |
| 089 Simple Pneumonia & Pleurisy Age >17 w CC | 4,675 | $20,476 | 31.6 | $13,023 |
| 127 Heart Failure & Shock | 4,096 | $26,076 | 43.1 | $17,449 |
| 210 Hip & Femur Procedures except Major Joint Age >17 w CC | 3,552 | $36,882 | 30.6 | $12,919 |
| 088 Chronic Obstructive Pulmonary Disease | 2,439 | $21,118 | 36.3 | $14,888 |
| 320 Kidney & Urinary Tract Infections Age >17 w CC | 2,396 | $22,039 | 31.8 | $12,994 |
| 416 Septicemia Age >17 | 1,996 | $30,627 | 33.1 | $16,956 |
| 316 Renal Failure | 1,848 | $28,729 | 38.4 | $16,999 |
| 296 Nutritional & Misc Metabolic Disorders Age >17 w CC | 1,757 | $22,852 | 33.1 | $15,078 |
3.5 Comorbidities
3.5.1 Prevalence and Rank Order of Hierarchical Condition Categories
Table 3-11 shows the top 20 most frequently occurring HCCs among PAC users in our sample. This table also shows the rankings of HCCs within the five most common DRGs for post-acute users and the percent of beneficiaries in the DRG with each of the HCC indicators. To populate this table, we generated a list of the top 20 HCCs in PAC users and listed them in order in the table. Then we indicated the ranking for those HCCs for the five most common DRGs for PAC users. Because these are the five most common DRGs in our sample, the same 20 HCCs were the most common HCCs across these DRGs (although in varying rankings).
Overall, CHF (HCC80) was the most prevalent HCC in our sample (22.9 percent), followed closely by Specified Heart Arrhythmias (HCC92; 21.4 percent) and COPD (HCC108; 20.4 percent). Diabetes without Complication (HCC19) and Renal Failure (HCC131) were also highly prevalent in our sample. These five HCCs were the only ones present in more than 10.0 percent of our sample.
The HCC rankings by DRG were generally similar to the rankings overall, with a few exceptions. CHF, heart arrhythmias, and COPD were the top three HCCs for DRG 089 (Pneumonia) and DRG 127 (Heart Failure & Shock). In fact, heart arrhythmia was at least the third most common HCC across all DRGs. CHF was the first or second most common HCC for two of the five most common DRGs (DRG 089 and DRG 127). HCC19 (Diabetes), one of the most common comorbid conditions in the elderly population, is the fourth or fifth most common comorbidity across the top four DRGs (DRG 014, DRG 089, DRG 127, and DRG 210) and was the most common HCC in DRG 544.
Not surprisingly, HCC158 (Hip Fracture/Dislocation) was among least prevalent conditions for most DRGs except DRG 210 (Hip & Femur Procedures) and DRG 544 (Joint and Limb Reattachment Procedures). This HCC was among the least prevalent HCCs in all other DRGs (although it was the seventh most prevalent HCC in the overall sample). Also not surprisingly, the least common HCC in our overall sample, Hemiplegia/Hemiparesis (HCC100), was the second most common HCC for DRG 014 (Stroke).
3.5.2 Episode Length of Stay and Payment by Number of Hierarchical Condition Categories
Table 3-12 shows the number and percent of beneficiaries in each DRG who have zero, one, two, three, four, or five or more HCCs, as well as the mean length of stay and Medicare payment for the overall episode and the index admission, by DRG and number of HCCs.
It is interesting to note the trends in the numbers of HCCs present by each DRG. For most DRGs, the largest proportion of beneficiaries had either two or three HCCs. DRG 014 (Stroke) is the only DRG examined for which all of the beneficiaries had at least one HCC (no beneficiaries have zero HCCs). Also, less than 1.0 percent of beneficiaries in either DRG 127 (Heart Failure & Shock) or DRG 210 (Hip & Femur Procedures) had zero HCCs. However, the majority of beneficiaries with DRG 544 (Joint and Limb Procedures) had no HCCs (43.0 percent). Beneficiaries with DRG 127 (Heart Failure & Shock) had the most HCCs, as 10.0 percent of them have five or more, compared with beneficiaries with DRG 544 (Joint and Limb Procedures), for which only 1.0 percent had five or more.
In looking at mean length of stay and payments, the general trend is that the mean length of stay and mean payment increase with increasing numbers of HCCs. On one hand, for DRG 014 (Stroke), beneficiaries with one HCC had an episode mean length of stay of 82.6 days and mean episode payments of $23,442. On the other hand, stroke beneficiaries with five or more HCCs had episode mean length of stay of 108.9 days and mean episode payments of $35,659. The largest difference in episode payment was noted for DRG 544 (Joint and Limb Procedures). The beneficiaries that had no HCCs had a mean episode payment of $17,774, compared to $35,319 for those who have five or more HCCs.
| Total Sample N=109,236 | DRG 014: Specific Cerebrovascular Disorders Except TIA (N=4,882) | DRG 089: Simple Pneumonia & Pleurisy age > 17 w cc (N=4,675) | DRG 127: Heart Failure & Shock (N=4,096) | DRG 210: Hip & Femur Procedures except Major Joint, age > 17 w CC (N=3,552) | DRG 544: Major Joint or Reattachment Procedures of Lower Extremity (N=15,261) | ||||||||
|---|---|---|---|---|---|---|---|---|---|---|---|---|---|
| HCC | Description | Rank | % | Rank | % | Rank | % | Rank | % | Rank | % | Rank | % |
| 1. NOTE: FY 2006 DRG titles were used in this analysis. SOURCE: RTI analysis of 2006 Medicare Claims 5% sample (ps01). |
|||||||||||||
| HCC80 | Congestive Heart Failure | 1 | 22.9 | 5 | 5.8 | 2 | 16.0 | 1 | 32.8 | 4 | 7.6 | 5 | 6.2 |
| HCC92 | Specified Heart Arrhythmias | 2 | 21.4 | 3 | 9.4 | 3 | 11.6 | 2 | 15.1 | 2 | 8.4 | 3 | 9.8 |
| HCC108 | Chronic Obstructive Pulmonary Disease | 3 | 20.4 | 6 | 4.5 | 1 | 20.3 | 3 | 11.1 | 3 | 8.2 | 4 | 9.5 |
| HCC19 | Diabetes without Complication | 4 | 18.6 | 4 | 8.5 | 4 | 9.0 | 5 | 8.5 | 5 | 6.6 | 1 | 17.1 |
| HCC131 | Renal Failure | 5 | 15.4 | 7 | 3.8 | 5 | 7.4 | 4 | 10.2 | 6 | 4.9 | 9 | 4.0 |
| HCC79 | Cardio-Respiratory Failure and Shock | 6 | 8.2 | 13 | 0.9 | 6 | 5.9 | 6 | 3.1 | 10 | 1.8 | 11 | 2.3 |
| HCC158 | Hip Fracture/Dislocation | 7 | 7.8 | 20 | 0.1 | 20 | 0.1 | 19 | 0.0 | 1 | 38.2 | 2 | 16.5 |
| HCC164 | Major Complications of Medical Care and Trauma | 8 | 6.5 | 18 | 0.2 | 18 | 0.3 | 15 | 0.3 | 7 | 3.5 | 6 | 4.5 |
| HCC105 | Vascular Disease | 9 | 6.4 | 8 | 2.1 | 7 | 2.2 | 8 | 2.1 | 8 | 2.1 | 10 | 2.8 |
| HCC96 | Ischemic or Unspecified Stroke | 10 | 5.0 | 1 | 33.1 | 17 | 0.3 | 16 | 0.2 | 20 | 0.2 | 19 | 0.2 |
| HCC83 | Angina Pectoris/Old Myocardial Infarction | 11 | 4.6 | 10 | 1.5 | 10 | 2.0 | 7 | 2.8 | 9 | 2.1 | 7 | 4.3 |
| HCC2 | Septicemia/Shock | 12 | 4.3 | 16 | 0.3 | 13 | 0.7 | 14 | 0.3 | 19 | 0.3 | 20 | 0.1 |
| HCC81 | Acute Myocardial Infarction | 13 | 4.1 | 15 | 0.4 | 15 | 0.6 | 20 | 0.0 | 14 | 0.7 | 15 | 0.5 |
| HCC74 | Seizure Disorders and Convulsions | 14 | 4.0 | 9 | 2.1 | 9 | 2.1 | 10 | 0.8 | 11 | 1.4 | 12 | 1.4 |
| HCC31 | Intestinal Obstruction/Perforation | 15 | 3.8 | 19 | 0.1 | 14 | 0.6 | 18 | 0.2 | 18 | 0.6 | 13 | 1.1 |
| HCC21 | Protein-Calorie Malnutrition | 16 | 3.7 | 12 | 1.1 | 8 | 2.1 | 9 | 0.9 | 13 | 1.0 | 14 | 0.6 |
| HCC111 | Aspiration and Specified Bacterial Pneumonias | 17 | 3.2 | 11 | 1.2 | 19 | 0.2 | 13 | 0.3 | 17 | 0.6 | 17 | 0.3 |
| HCC38 | Rheumatoid Arthritis and Inflammatory Connective Tissue Disease | 18 | 3.0 | 14 | 0.6 | 11 | 1.6 | 11 | 0.7 | 12 | 1.2 | 8 | 4.1 |
| HCC7 | Metastatic Cancer and Acute Leukemia | 19 | 3.0 | 17 | 0.3 | 16 | 0.6 | 17 | 0.2 | 16 | 0.6 | 18 | 0.3 |
| HCC100 | Hemiplegia/Hemiparesis | 20 | 3.0 | 2 | 11.2 | 12 | 0.9 | 12 | 0.5 | 15 | 0.7 | 16 | 0.4 |
| Index DRG | N HCCs |
N | % | Index Admission | Total Episode | |||
|---|---|---|---|---|---|---|---|---|
| Mean LOS |
Mean LOS |
Mean LOS |
Mean Payment |
|||||
| 1. NOTE: FY 2006 DRG titles were used in this analysis. SOURCE: RTI analysis of 2006 Medicare Claims 5% sample. |
||||||||
| 014 | Specific Cerebrovascular Disorders Except TIA (N=4,882) | 1 | 843 | 17.3 | 4.5 | $5,970 | 82.6 | $23,442 |
| 2 | 1,570 | 32.2 | 5.0 | $6,215 | 95.0 | $27,826 | ||
| 3 | 1,348 | 27.6 | 5.9 | $6,386 | 103.6 | $32,138 | ||
| 4 | 700 | 14.3 | 7.0 | $7,134 | 102.0 | $34,380 | ||
| 5+ | 421 | 8.6 | 9.4 | $7,962 | 108.9 | $35,659 | ||
| 089 | Simple Pneumonia & Pleurisy Age > 17 w CC (N=4,675) | 0 | 379 | 8.1 | 5.3 | $4,968 | 62.8 | $16,096 |
| 1 | 1,125 | 24.1 | 5.3 | $4,998 | 68.5 | $15,909 | ||
| 2 | 1,394 | 29.8 | 6.0 | $5,098 | 70.0 | $17,236 | ||
| 3 | 1,009 | 21.6 | 6.7 | $5,173 | 74.1 | $18,787 | ||
| 4 | 558 | 11.9 | 7.6 | $5,526 | 81.5 | $20,093 | ||
| 5+ | 210 | 4.5 | 8.1 | $5,775 | 92.9 | $23,241 | ||
| 127 | Heart Failure & Shock (N=4,096) | 0 | 4 | 0.1 | 5.5 | $4,935 | 45.8 | $23,969 |
| 1 | 407 | 9.9 | 4.8 | $5,078 | 79.2 | $18,131 | ||
| 2 | 1,112 | 27.1 | 5.4 | $5,193 | 87.0 | $20,040 | ||
| 3 | 1,279 | 31.2 | 6.1 | $5,416 | 94.5 | $23,235 | ||
| 4 | 884 | 21.6 | 6.9 | $5,619 | 92.1 | $22,914 | ||
| 5+ | 410 | 10.0 | 7.8 | $5,906 | 100.4 | $28,350 | ||
| 210 | Hip & Femur Procedures except Major Joint Age > 17 w cc (N=3,552) | 0 | 5 | 0.1 | 4.2 | $8,164 | 86.0 | $23,986 |
| 1 | 758 | 21.3 | 5.1 | $9,543 | 90.0 | $29,426 | ||
| 2 | 1,223 | 34.4 | 5.5 | $9,834 | 94.9 | $31,589 | ||
| 3 | 855 | 24.1 | 6.2 | $9,913 | 102.9 | $34,201 | ||
| 4 | 445 | 12.5 | 7.4 | $10,486 | 103.7 | $34,785 | ||
| 5+ | 266 | 7.5 | 9.6 | $10,990 | 110.6 | $37,477 | ||
| 544 | Major Joint Replacement or Reattachment Procedures of Lower Extremity (N=15,261) | 0 | 6,507 | 42.6 | 3.5 | $10,385 | 56.0 | $17,724 |
| 1 | 4,770 | 31.3 | 4.0 | $10,504 | 62.5 | $20,998 | ||
| 2 | 2,340 | 15.3 | 4.7 | $10,656 | 72.5 | $25,276 | ||
| 3 | 1,032 | 6.8 | 5.8 | $10,774 | 87.0 | $28,568 | ||
| 4 | 414 | 2.7 | 6.9 | $11,077 | 86.8 | $30,807 | ||
| 5+ | 198 | 1.3 | 9.8 | $12,194 | 98.7 | $35,319 | ||
3.6 Post-Acute Care Episode Analysis
In this next section we present analyses of the patterns of PAC episode utilization and payment. We focus on the patterns of use for post-acute users overall, and on the patterns of use for one medical DRG, DRG 089 Simple Pneumonia & Pleurisy Age > 17 w CC; and for one rehabilitative DRG, DRG 544 Major Joint Replacement or Reattachment Procedures of Lower Extremity. These two DRGs were chosen given their frequency in the post-acute population and to illustrate how patterns of use differ for different types of conditions. Utilization and payment analyses are also stratified by severity levels using both the APR-DRGs and the MS-DRGs.
3.6.1 Episode Utilization and Payment, by All Patient Refined Diagnosis Related Group and Medicare Severity Diagnosis Related Group
In Tables 3-13 through 3-15, episode lengths of stay and Medicare payments during PAC episodes are presented for post-acute care users across all DRGs as well as for post-acute care users in DRG 089 and DRG 544. Within these tables, we show the number of beneficiaries with each claim type, the percent using each type of service, the mean length of stay, and the mean Medicare payments. The results are shown overall and then stratified by APR-DRG severity levels 1 through 4 and by MS-DRG severity level (no CCs, with CCs, with MCCs) in Tables 3-16 through 3-18. These tables illustrate different levels of medical severity for hospital discharges overall as well as for different types of cases (pneumonia versus major joint and limb procedures).
For the APR-DRG severity of illness, there are four levels (1-4) which indicate increasing severity. As discussed previously, the MS-DRG severity system stratifies cases by the presence or absence of complicating or comorbid conditions (CCs). Beneficiaries can be classified in up to 3 categories based on the presence of CCs, (although sometimes these categories will be collapsed, as will be discussed for DRG 544). For DRG 089, beneficiaries were classified into 3 categories. The lowest severity level is "No CC," the middle severity level is "CCs," and the highest severity level is "MCCs" (for "major" comorbid or complicating conditions). We must reiterate that the severity-level split for MS-DRGs is DRG-specific and may not have the same meaning across DRGs.
Post-Acute Care Episodes: All DRGs. The average post-acute episode length of stay for all post-acute users in our 2006 episode file was 81.3 days with corresponding average episode payments of over $30,000 (Table 3-13). In looking at the composition of episodes of care for post-acute users, over 60.0 percent of beneficiaries used home health services as part of their episode and nearly 48.0 percent of beneficiaries used skilled nursing facility services. Claims for beneficiaries using LTCH services were associated with the highest payments, but only a small number of beneficiaries used these services as part of their episode (2.9 percent). Looking at patterns of use for beneficiaries using post-acute care by severity level provides more specific information on how services vary by severity level (Table 3-16). When severity is measured using the APR-DRG, the majority of beneficiaries fell in to APR-DRG Level 2 (47.5 percent) and APR-DRG Level 3 (29.8 percent). When using the MS-DRG severity measure, 56.0 percent of beneficiaries were in the lowest severity level.
| All Post-Acute Users (N=109,236) | N | % with Claim | Mean Use | Mean Payment |
|---|---|---|---|---|
|
1. Utilization is measured in days for acute, IRF, LTCH, and SNF; visits for HHA, and units of service for hospital outpatient therapy. SOURCE: RTI analysis of 2006 Medicare Claims 5% sample (MM2Y091). |
||||
| Total Episode (Index Admission + Part A + Part B Days) |
109,236 | - | 81.3 | $30,028 |
| Index Admission (Days) | 109,236 | 100.0 | 6.8 | $10,297 |
| Home Health (Visits) | 65,901 | 60.3 | 25.9 | $3,916 |
| IRF (Days) | 12,819 | 11.7 | 13.9 | $16,289 |
| LTCH (Days) | 3,165 | 2.9 | 32.5 | $38,559 |
| SNF (SNF) | 52,204 | 47.8 | 37.3 | $11,242 |
| Hospital Outpatient Therapy (Services) | 25,007 | 22.9 | 43.5 | $1,258 |
| Part B Therapy | 6,526 | 6.0 | - | $286 |
| Part B Services (excluding Part B therapy) | 108,145 | 99.0 | - | $3,618 |
| Durable Medical Equipment | 46,154 | 42.3 | - | $687 |
| Hospice | 946 | 0.9 | - | $2,797 |
| Acute Readmission (Days) | 33,302 | 30.5 | 11.5 | $15,636 |
| DRG 089: Simple Pneumonia & Pleurisy Age > 17 w CC N = 4,675 | N | % with Claim | Mean Use | Mean Payment |
|---|---|---|---|---|
|
1. Utilization is measured in days for acute, IRF, LTCH, and SNF; visits for HHA, and units of service for hospital outpatient therapy. SOURCE: RTI analysis of 2006 Medicare Claims 5% sample (MM2Y090). |
||||
| Total Episode (Index Admission + Part A + Part B Days) |
4,675 | - | 72.3 | $20,476 |
| Index Admission (Days) | 4,675 | 100.0 | 6.2 | $5,161 |
| Home Health (Visits) | 2,396 | 51.3 | 24.8 | $3,629 |
| IRF (Days) | 131 | 2.8 | 14.6 | $17,448 |
| LTCH (Days) | 88 | 1.9 | 25.1 | $30,352 |
| SNF (SNF) | 2,516 | 53.8 | 35.0 | $10,000 |
| Hospital Outpatient Therapy (Services) | 923 | 19.7 | 30.1 | $946 |
| Part B Therapy | 150 | 3.2 | - | $265 |
| Part B Services (excluding Part B therapy) | 4,651 | 99.5 | - | $2,447 |
| Durable Medical Equipment | 1,893 | 40.5 | - | $599 |
| Hospice | 54 | 1.2 | - | $1,786 |
| Acute Readmission (Days) | 1,479 | 31.6 | 10.5 | $13,023 |
| DRG 544: Major Joint Replacement or Reattachment of Lower Extremity N = 15,261 | N | % with Claim |
Mean Use |
Mean Payment |
|---|---|---|---|---|
|
1. Utilization is measured in days for acute, IRF, LTCH, and SNF; visits for HHA, and units of service for hospital outpatient therapy. SOURCE: RTI analysis of 2006 Medicare Claims 5% sample (MM2Y090). |
||||
| Total Episode (Index Admission + Part A + Part B Days) |
15,261 | - | 64.1 | $23,985 |
| Index Admission (Days) | 15,261 | 100.0 | 4.2 | $10,532 |
| Home Health (Visits) | 10,639 | 69.7 | 18.0 | $3,562 |
| IRF (Days) | 3,082 | 20.2 | 10.7 | $12,284 |
| LTCH (Days) | 99 | 0.6 | 26.1 | $27,729 |
| SNF (SNF) | 6,132 | 40.2 | 24.0 | $8,260 |
| Hospital Outpatient Therapy (Services) | 5,515 | 36.1 | 48.0 | $1,053 |
| Part B Therapy | 639 | 4.2 | - | $295 |
| Part B Services (excluding Part B therapy) | 15,118 | 99.1 | - | $2,628 |
| Durable Medical Equipment | 8,467 | 55.5 | - | $262 |
| Hospice | 28 | 0.2 | - | $1,461 |
| Acute Readmission (Days) | 2,176 | 14.3 | 8.1 | $12,952 |
Post-Acute Care Episodes: DRGs 089 and 544. In looking at beneficiaries in DRGs 089 and DRG 544 overall, there are several important differences in patterns of use (Table 3-14 and Table 3-15). The average episode length of stay for beneficiaries in DRG 089 was 72.3 days compared to 64.1 days for beneficiaries in DRG 544. Though the episode length of day was longer for beneficiaries in DRG 089, the episode payments for these beneficiaries was lower than for beneficiaries in DRG 544 ($20,476 for DRG 089 vs. $23,985 for DRG 544). This difference is likely due to the services received in the inpatient setting. Beneficiaries in DRG 544 are more likely to have received surgical procedures compared to beneficiaries admitted for pneumonia and these procedures are likely reflected in the index acute hospital payments ($5,161 for DRG 089 vs. $10,532 for DRG 544). Use of post-acute services also differed for these beneficiaries. Nearly 70.0 percent of beneficiaries in DRG 544 used home health services in their episodes of post-acute care compared to over 51.0 percent of beneficiaries in DRG 089. A higher proportion of beneficiaries in DRG 089 used SNF services compared to beneficiaries in DRG 544 (53.8 percent vs. 40.2 percent). Beneficiaries in DRG 544 had significantly higher use of IRF services compared to beneficiaries in DRG 089 due as expected give the need for rehabilitative services for beneficiaries recovering from replacement procedures (20.2 percent vs. 2.8 percent).
In Table 3-16 we see that in general, episode lengths of stay and payments rise with increasing severity both when severity is measured using the APR-DRG and when severity is measured using the MS-DRG. For example in looking at episode lengths of stay across all DRGs in the healthiest MS-DRG level, "No CCs", the length of stay was 75.4 days and payments were $26,609 compared to MS-DRG level "MCCs" where length of stay was 91.3 days and payments were $39,587. Patterns of service use within episodes clearly varied by severity level as well. The proportion of beneficiaries using LTCH services increased with increasing severity reflecting the increasing medical complexity of those in the highest severity levels. Similarly, the proportion of beneficiaries using SNF services increased with increasing severity and the proportion of beneficiaries using HHA services decreased with increasing severity indicating the shift from outpatient to inpatient service use for more severely ill beneficiaries.
In the discussion below we look at differences in use and payments for beneficiaries in a medical DRG (DRG 089 Simple Pneumonia & Pleurisy Age > 17 w CC) versus beneficiaries in a rehabilitative DRG (DRG 544 Major Joint and Limb Reattachment Procedures of Lower Extremity).
Post-Acute Care Episodes: DRG 089, By APR-DRG. The majority of beneficiaries with DRG 089 are in APR-DRG severity levels 2 (51.9 percent) or 3 (42.3 percent). Table 3-17 shows that episode length of stay and payments rise with increasing APR-DRG severity. Beneficiaries with APR-DRG severity of illness level 1 had an average of post-acute episode length of stay of 62.4 days and Medicare payments of $15,383. In contrast, those in APR-DRG severity level 4 had episodes averaging 74.2 days and $27,365. These results also show that beneficiaries with pneumonia using LTCH services are more likely to be in the higher APR-DRG levels, level 3 and 4, than patients using other PAC services. For example, 4.4 percent of beneficiaries in severity level 4 had an LTCH admission, compared with less than 1.0 percent in severity group 1. Another finding highlighted in this table is related to the use of home health services, as we found that the percentage of beneficiaries using home health services decreases as APR-DRG severity increases. This result may be due to the increasing likelihood of inpatient service use for beneficiaries of higher severity.
For comparison purposes, Appendix B shows the 2005 results for the mean length of stay and payment, by claim type and APR-DRG, for DRG 089 and DRG 544. While it is useful to compare lengths of stay and rates of utilization across the 2 years, note that episode payments calculated for 2005 did not include DME, hospice, or physician services.
| APR-DRG Severity of Illness Level2,3 | ||||||||||||||||
|---|---|---|---|---|---|---|---|---|---|---|---|---|---|---|---|---|
| 1 (N=16,906) | 2 (N=49,614) | 3 (N=31,192) | 4 (N=6,845) | |||||||||||||
| All Live Discharges (N = 104,557) |
N | % with Claim |
Mean Use4 |
Mean Payment4 |
N | % with Claim |
Mean Use4 |
Mean Payment4 |
N | % with Claim |
Mean Use4 |
Mean Payment4 |
N | % with Claim |
Mean Use4 |
Mean Payment4 |
| Total Episode (Index Admission + Part A + Part B Days) | 16,906 | 16.2* | 68.6 | $21,349 | 49,614 | 47.5* | 79.4 | $26,053 | 31,192 | 29.8* | 86.6 | $34,156 | 6,845 | 6.5* | 102.7 | $63,807 |
| Index Admission (Days) | 16,906 | 100.0 | 4.1 | $8,016 | 49,614 | 100.0 | 5.4 | $8,380 | 31,192 | 100.0 | 8.4 | $11,178 | 6,845 | 100.0 | 17.6 | $27,542 |
| Home Health (Visits) | 11,117 | 65.8 | 21.3 | $3,471 | 30,466 | 61.4 | 25.6 | $3,888 | 18,100 | 58.0 | 27.9 | $4,096 | 3,537 | 51.7 | 32.6 | $4,560 |
| IRF (Days) | 2,059 | 12.2 | 11.9 | $14,091 | 5,946 | 12.0 | 13.7 | $15,978 | 3,475 | 11.1 | 14.8 | $17,317 | 937 | 13.7 | 16.6 | $19,851 |
| LTCH (Days) | 141 | 0.8 | 30.1 | $28,858 | 734 | 1.5 | 30.5 | $32,249 | 1,196 | 3.8 | 30.7 | $36,504 | 968 | 14.1 | 36.6 | $47,734 |
| SNF (SNF) | 5,908 | 34.9 | 32.1 | $9,988 | 23,223 | 46.8 | 36.9 | $11,129 | 16,802 | 53.9 | 38.5 | $11,495 | 3,877 | 56.6 | 40.7 | $12,500 |
| Hospital Outpatient Therapy (Services) | 5,266 | 31.1 | 42.9 | $1,045 | 11,817 | 23.8 | 45.3 | $1,236 | 5,762 | 18.5 | 41.4 | $1,422 | 1,191 | 17.4 | 44.0 | $1,729 |
| Part B Therapy | 907 | 5.4 | - | $244 | 2,795 | 5.6 | - | $276 | 1,986 | 6.4 | - | $314 | 538 | 7.9 | - | $295 |
| Part B Services (excluding Part B therapy) |
16,738 | 99.0 | - | $2,481 | 49,158 | 99.1 | - | $3,066 | 30,875 | 99.0 | - | $4,267 | 6,747 | 98.6 | - | $7,761 |
| Durable Medical Equipment | 7,270 | 43.0 | - | $428 | 20,590 | 41.5 | - | $610 | 13,367 | 42.9 | - | $822 | 3,130 | 45.7 | - | $1,163 |
| Hospice | 55 | 0.3 | - | $2,605 | 349 | 0.7 | - | $2,888 | 393 | 1.3 | - | $2,623 | 103 | 1.5 | - | $2,704 |
| Acute Readmission (Days) | 3,268 | 19.3 | 9.2 | $13,532 | 13,998 | 28.2 | 10.5 | $14,403 | 11,513 | 36.9 | 12.3 | $16,765 | 3,066 | 44.8 | 14.8 | $19,679 |
| MS-DRG Severity of Illness Level5 | ||||||||||||
|---|---|---|---|---|---|---|---|---|---|---|---|---|
| No CCs (N=61,196) | W/CCs (N=26,736) | W/MCCs (N=21,304) | ||||||||||
| All Live Discharges (N = 109,236) |
N | % with Claim |
Mean Use4 |
Mean Payment4 |
N | % with Claim |
Mean Use4 |
Mean Payment4 |
N | % with Claim |
Mean Use4 |
Mean Payment4 |
|
1. Utilization is measured in days for acute, IRF, LTCH, and SNF; visits for HHA, and units of service for hospital outpatient therapy. SOURCE: RTI analysis of 2006 Medicare Claims 5% sample (PSPA070 part 7). |
||||||||||||
| Total Episode (Index Admission + Part A + Part B Days) | 61,196 | 56.0* | 75.4 | $26,609 | 26,736 | 24.5* | 86.7 | $30,238 | 21,304 | 19.4* | 91.3 | $39,587 |
| Index Admission (Days) | 61,196 | 100.0 | 5.3 | $9,573 | 26,736 | 100.0 | 7.0 | $9,344 | 21,304 | 100.0 | 10.9 | $13,573 |
| Home Health (Visits) | 38,250 | 62.5 | 23.5 | $3,735 | 15,950 | 59.7 | 28.9 | $4,084 | 11,701 | 54.9 | 29.6 | $4,278 |
| IRF (Days) | 7,292 | 11.9 | 12.5 | $14,620 | 3,109 | 11.6 | 15.7 | $18,322 | 2,418 | 11.3 | 15.7 | $18,710 |
| LTCH (Days) | 1,306 | 2.1 | 35.5 | $46,009 | 671 | 2.5 | 30.1 | $32,296 | 1,188 | 5.6 | 30.4 | $33,906 |
| SNF (SNF) | 26,796 | 43.8 | 35.2 | $10,758 | 13,546 | 50.7 | 39.5 | $11,716 | 11,862 | 55.7 | 39.5 | $11,792 |
| Hospital Outpatient Therapy (Services) | 15,773 | 25.8 | 44.0 | $1,110 | 5,237 | 19.6 | 45.8 | $1,409 | 3,997 | 18.8 | 38.3 | $1,639 |
| Part B Therapy | 3,131 | 5.1 | - | $265 | 1,835 | 6.9 | - | $303 | 1,560 | 7.3 | - | $307 |
| Part B Services (excluding Part B therapy) |
60,623 | 99.1 | - | $2,998 | 26,467 | 99.0 | - | $3,685 | 21,055 | 98.8 | - | $5,318 |
| Durable Medical Equipment | 25,967 | 42.4 | - | $538 | 11,098 | 41.5 | - | $814 | 9,089 | 42.7 | - | $955 |
| Hospice | 383 | 0.6 | - | $3,117 | 281 | 1.1 | - | $2,779 | 282 | 1.3 | - | $2,380 |
| Acute Readmission (Days) | 15,569 | 25.4 | 10.6 | $14,739 | 9,162 | 34.3 | 11.5 | $15,376 | 8,571 | 40.2 | 13.1 | $17,544 |
| APR-DRG Severity of Illness Level2 | |||||||||||||||||
|---|---|---|---|---|---|---|---|---|---|---|---|---|---|---|---|---|---|
| DRG | 1 (N=153) | 2 (N=2,392) | 3 (N=1,950) | 4 (N=180) | |||||||||||||
| 089 | Simple Pneumonia & Pleurisy Age >17 w CC (N=4,675) | N | % with Claim |
Mean Use3 |
Mean Payment3 |
N | % with Claim |
Mean Use3 |
Mean Payment3 |
N | % with Claim |
Mean Use3 |
Mean Payment3 |
N | % with Claim |
Mean Use3 |
Mean Payment3 |
| Total Episode (Index Admission + Part A + Part B Days) | 153 | 3.3* | 62.4 | $15,383 | 2,392 | 51.2* | 69.4 | $18,657 | 1,950 | 41.7* | 76.6 | $22,471 | 180 | 3.9* | 74.2 | $27,365 | |
| Index Admission (Days) | 153 | 100 | 4.8 | $4,978 | 2,392 | 100 | 5.3 | $4,970 | 1,950 | 100 | 7.0 | $5,263 | 180 | 100 | 10.5 | $6,747 | |
| Home Health (Visits) | 85 | 55.6 | 22.3 | $3,078 | 1,255 | 52.5 | 24.5 | $3,509 | 975 | 50.0 | 25.9 | $3,864 | 81 | 45.0 | 20.0 | $3,226 | |
| IRF (Days) | 2 | 1.3 | 13.0 | $12,579 | 55 | 2.3 | 14.2 | $17,222 | 64 | 3.3 | 15.5 | $18,339 | 10 | 5.6 | 11.0 | $13,969 | |
| LTCH (Days) | 1 | 0.7 | 8.0 | $8,673 | 28 | 1.2 | 25.0 | $27,436 | 51 | 2.6 | 24.8 | $29,353 | 8 | 4.4 | 30.0 | $49,630 | |
| SNF (SNF) | 70 | 45.8 | 33.1 | $8,686 | 1,223 | 51.1 | 34.6 | $9,877 | 1,112 | 57.0 | 35.4 | $10,166 | 111 | 61.7 | 35.9 | $10,510 | |
| Hospital Outpatient Therapy (Services) | 26 | 17.0 | 31.3 | $858 | 526 | 22.0 | 27.4 | $844 | 342 | 17.5 | 34.2 | $1,082 | 29 | 16.1 | 30.6 | $1,272 | |
| Part B Therapy | 6 | 3.9 | - | $210 | 77 | 3.2 | - | $248 | 60 | 3.1 | - | $303 | 7 | 3.9 | - | $184 | |
| Part B Services (excluding Part B therapy) | 152 | 99.3 | - | $1,664 | 2,378 | 99.4 | - | $2,092 | 1,943 | 99.6 | - | $2,821 | 178 | 98.9 | - | $3,771 | |
| Durable Medical Equipment | 41 | 26.8 | - | $340 | 967 | 40.4 | - | $599 | 810 | 41.5 | - | $613 | 75 | 41.7 | - | $593 | |
| Hospice | 2 | 1.3 | - | $1,976 | 20 | 0.8 | - | $2,473 | 28 | 1.4 | - | $1,127 | 4 | 2.2 | - | $2,876 | |
| Acute Readmission (Days) | 38 | 24.8 | 5.9 | $10,369 | 683 | 28.6 | 10.0 | $12,403 | 692 | 35.5 | 11.2 | $13,604 | 66 | 36.7 | 12.1 | $14,869 | |
| MS-DRG Severity of Illness Level4 | |||||||||||||
|---|---|---|---|---|---|---|---|---|---|---|---|---|---|
| DRG | No CCs (N=1,222) | W/CCs (N=2,625) | W/MCCs (N=828) | ||||||||||
| 089 | Simple Pneumonia & Pleurisy Age >17 w CC (N=4,675) | N | % with Claim |
Mean Use3 |
Mean Payment3 |
N | % with Claim |
Mean Use3 |
Mean Payment3 |
N | % with Claim |
Mean Use3 |
Mean Payment3 |
|
1. Utilization is measured in days for acute, IRF, LTCH, and SNF; visits for HHA, and units of service for hospital outpatient therapy. NOTE: *This is a row percent. SOURCE: RTI analysis of 2006 Medicare Claims 5% sample (PSPA070 part 7). |
|||||||||||||
| Total Episode (Index Admission + Part A + Part B Days) | 1,222 | 26.1* | 67.7 | $17,525 | 2,625 | 56.1* | 73.2 | $20,517 | 828 | 17.7* | 76.5 | $24,701 | |
| Index Admission (Days) | 1,222 | 100 | 5.2 | $4,941 | 2,625 | 100 | 6.2 | $5,146 | 828 | 100 | 7.8 | $5,534 | |
| Home Health (Visits) | 636 | 52.0 | 24.0 | $3,376 | 1,379 | 52.5 | 24.7 | $3,670 | 381 | 46.0 | 26.5 | $3,902 | |
| IRF (Days) | 18 | 1.5 | 11.7 | $14,350 | 82 | 3.1 | 15.4 | $17,970 | 31 | 3.7 | 14.1 | $17,867 | |
| LTCH (Days) | 12 | 1.0 | 22.3 | $30,184 | 45 | 1.7 | 27.4 | $31,096 | 31 | 3.7 | 22.9 | $29,336 | |
| SNF (SNF) | 626 | 51.2 | 34.1 | $9,689 | 1,396 | 53.2 | 34.6 | $9,831 | 494 | 59.7 | 37.1 | $10,871 | |
| Hospital Outpatient Therapy (Services) | 267 | 21.8 | 30.2 | $842 | 501 | 19.1 | 28.5 | $849 | 155 | 18.7 | 35.1 | $1,440 | |
| Part B Therapy | 36 | 2.9 | - | $265 | 81 | 3.1 | - | $242 | 33 | 4.0 | - | $322 | |
| Part B Services (excluding Part B therapy) | 1,216 | 99.5 | - | $1,775 | 2,613 | 99.5 | - | $2,443 | 822 | 99.3 | - | $3,456 | |
| Durable Medical Equipment | 452 | 37.0 | - | $528 | 1,123 | 42.8 | - | $600 | 318 | 38.4 | - | $695 | |
| Hospice | 14 | 1.1 | - | $1,321 | 30 | 1.1 | - | $2,034 | 10 | 1.2 | - | $1,696 | |
| Acute Readmission (Days) | 351 | 28.7 | 8.9 | $11,099 | 827 | 31.5 | 10.8 | $13,455 | 301 | 36.4 | 11.6 | $14,080 | |
Post-Acute Care Episodes: DRG 089, By MS-DRG. In Table 3-17, we also present the same episode measures stratified by MS-DRG. In general, the trends observed regarding length of stay and Medicare payments are similar for both MS-DRG and APR-DRG severity groupings. The majority of beneficiaries with pneumonia are in the middle MS-DRG severity group with CCs (56.1 percent), and the smallest proportion are in the highest MS-DRG level MCC (17.7 percent). As we noted for the APR-DRG severity levels, in general, episode length of stay and payments rise with increasing MS-DRG severity levels. For example, pneumonia cases with no CCs have an average of post-acute episode length of stay of 67.7 days and Medicare payments of $17,525. In contrast, those in MS-DRG severity level MCC have episodes averaging 76.5 days in length and $24,701 in Medicare payments.
Post-Acute Care Episodes: DRG 544, By APR-DRG. As Table 3-18 shows, as a contrast to pneumonia cases, beneficiaries with DRG 544 (Major Joint and Limb Reattachment Procedures) have slightly lower APR-DRG severity, because most are in severity levels 1 (30.8 percent) and 2 (47.7 percent). In general, episode length of stay and payments rise with increasing APR-DRG severity. Joint and knee cases with APR-DRG severity of illness level 1 had an average of post-acute episode length of stay of 58.4 days and Medicare payments of $20,513. In contrast, those in APR-DRG severity level 4 had episodes averaging 99 days and $43,823.
These results also show that beneficiaries with joint and knee reattachment procedures who had acute readmissions after PAC are more likely to be in the higher APR-DRG levels, level 3 and 4, than patients using other PAC services. For example, 34.0 percent of the beneficiaries in severity level 4 had an acute readmission, compared with 10.0 percent in severity group 1. Another notable finding is that the percentage of joint and knee cases using outpatient therapy decreases with increasing APR-DRG severity levels (from 44.0 percent in the lowest severity level to 17.0 percent in the highest severity level).
Post-Acute Care Episodes: DRG 544, By MS-DRG. DRG 544 is a DRG that has only two levels of severity when grouped using MS-DRG. The highest severity level is those who have major CCs (MCCs) and the lowest is those do not have MCCs. As noted in Table 3-18, the vast majority of beneficiaries with joint and knee cases do not have MCCs (95.0 percent).
With the exception of claims for hospice and Part B therapy services, episode payments rise with increasing MS-DRG severity levels for knee and joint patients. The most notable rise was in Part B services (excluding Part B therapy), which had a mean payment per episode of $2,580 for those with no MCCs and of $4,366 for those with MCCs (higher severity). Furthermore, 70.0 percent of beneficiaries with no MCCs had home health visits, compared with 63.0 percent of beneficiaries with MCCs. Similarly, 37.0 percent of beneficiaries with no MCCs had hospital outpatient therapy, compared with 28.0 percent of beneficiaries with MCCs. It is likely that these more severe patients required more intensive services through IRF or SNF, given that the proportion using IRF or SNF increases dramatically between those with No MCCs and those with MCCs.
| APR-DRG Severity of Illness Level2 | |||||||||||||||||
|---|---|---|---|---|---|---|---|---|---|---|---|---|---|---|---|---|---|
| DRG | 1 (N=4,686) | 2 (N=7,272) | 3 (N=3,161) | 4 (N=118) | |||||||||||||
| 544 | Major Joint Replacement or Reattachment Procedures of Lower ESOURCE:xtremity (N= 15,237) | N | % with Claim |
Mean Use3 |
Mean Payment3 |
N | % with Claim |
Mean Use3 |
Mean Payment3 |
N | % with Claim |
Mean Use3 |
Mean Payment3 |
N | % with Claim |
Mean Use3 |
Mean Payment3 |
| Total Episode (Index Admission + Part A + Part B Days) | 4,686 | 30.8* | 58.4 | $20,513 | 7,272 | 47.7* | 65.6 | $24,466 | 3,161 | 20.7* | 67.4 | $27,223 | 118 | 0.8* | 99.0 | $43,823 | |
| Index Admission (Days) | 4,686 | 100 | 3.5 | $10,362 | 7,272 | 100 | 4.1 | $10,478 | 3,161 | 100 | 5.0 | $10,764 | 118 | 100 | 12.5 | $14,068 | |
| Home Health (Visits) | 3,278 | 70.0 | 15.9 | $3,348 | 5,022 | 69.1 | 18.5 | $3,630 | 2,259 | 71.5 | 19.6 | $3,679 | 62 | 52.5 | 28.6 | $5,001 | |
| IRF (Days) | 736 | 15.7 | 9.8 | $11,347 | 1,545 | 21.2 | 10.8 | $12,378 | 757 | 23.9 | 11.2 | $12,735 | 40 | 33.9 | 13.2 | $16,415 | |
| LTCH (Days) | 18 | 0.4 | 19.5 | $17,756 | 33 | 0.5 | 31.6 | $31,623 | 40 | 1.3 | 26.0 | $29,834 | 8 | 6.8 | 19.4 | $23,584 | |
| SNF (SNF) | 1,482 | 31.6 | 17.8 | $6,535 | 3,047 | 41.9 | 24.8 | $8,467 | 1,515 | 47.9 | 27.1 | $9,190 | 72 | 61.0 | 48.9 | $15,261 | |
| Hospital Outpatient Therapy (Services) | 2,063 | 44.0 | 49.5 | $1,047 | 2,596 | 35.7 | 47.8 | $1,054 | 828 | 26.2 | 44.8 | $1,065 | 20 | 16.9 | 43.3 | $980 | |
| Part B Therapy | 190 | 4.1 | - | $341 | 300 | 4.1 | - | $282 | 144 | 4.6 | - | $266 | 5 | 4.2 | - | $139 | |
| Part B Services (excluding Part B therapy) | 4,650 | 99.2 | - | $2,218 | 7,191 | 98.9 | - | $2,660 | 3,136 | 99.2 | - | $3,043 | 117 | 99.2 | - | $5,569 | |
| Durable Medical Equipment | 2,760 | 58.9 | - | $233 | 3,996 | 55.0 | - | $261 | 1,645 | 52.0 | - | $305 | 58 | 49.2 | - | $441 | |
| Hospice | 2 | 0.0 | - | $251 | 13 | 0.2 | - | $1,184 | 9 | 0.3 | - | $1,936 | 4 | 3.4 | - | $1,895 | |
| Acute Readmission (Days) | 444 | 9.5 | 6.4 | $11,378 | 1,092 | 15.0 | 8.4 | $13,292 | 593 | 18.8 | 8.7 | $13,448 | 40 | 33.9 | 10.7 | $13,798 | |
| MS-DRG Severity of Illness Level4 | |||||||||
|---|---|---|---|---|---|---|---|---|---|
| DRG | No MCCs (N=14,446) | W/MCCs (N=815) | |||||||
| 544 | Major Joint Replacement or Reattachment Procedures of Lower Extremity (N=15,261) | N | % with Claim |
Mean Use3 |
Mean Payment3 |
N | % with Claim |
Mean Use3 |
Mean Payment3 |
|
1. Utilization is measured in days for acute, IRF, LTCH, and SNF; visits for HHA, and units of service for hospital outpatient therapy. NOTE: *This is a row percent. SOURCE: RTI analysis of 2006 Medicare Claims 5% sample (PSPA070 part 7) |
|||||||||
| Total Episode (Index Admission + Part A + Part B Days) | 14,446 | 94.6* | 62.9 | $23,341 | 815 | 5.3* | 84.8 | $35,409 | |
| Index Admission (Days) | 14,446 | 100 | 4.0 | $10,463 | 815 | 100 | 8.1 | $11,761 | |
| Home Health (Visits) | 10,125 | 70.1 | 17.6 | $3,530 | 514 | 63.1 | 24.7 | $4,191 | |
| IRF (Days) | 2,848 | 19.7 | 10.6 | $12,078 | 234 | 28.7 | 12.6 | $14,781 | |
| LTCH (Days) | 72 | 0.5 | 26.4 | $26,831 | 27 | 3.3 | 25.6 | $30,124 | |
| SNF (SNF) | 5,688 | 39.4 | 23.0 | $7,962 | 444 | 54.5 | 36.8 | $12,070 | |
| Hospital Outpatient Therapy (Services) | 5,288 | 36.6 | 47.6 | $1,040 | 227 | 27.9 | 55.5 | $1,363 | |
| Part B Therapy | 591 | 4.1 | - | $300 | 48 | 5.9 | - | $232 | |
| Part B Services (excluding Part B therapy) | 14,431 | 99.9 | - | $2,580 | 808 | 99.1 | - | $4,366 | |
| Durable Medical Equipment | 8,031 | 55.6 | - | $253 | 436 | 53.5 | - | $426 | |
| Hospice | 19 | 0.1 | - | $1,468 | 9 | 1.1 | - | $1,446 | |
| Acute Readmission (Days) | 1,951 | 13.5 | 7.9 | $12,683 | 225 | 27.6 | 10.4 | $15,292 | |
3.7 Patterns of Use within an Episode
Patterns of care during PAC episodes vary significantly depending on many factors including diagnoses, patient severity, and supply of services. One of the primary goals of this work has been to understand utilization of services within episodes of PAC. While the factors explaining use are explored further in the multivariate analyses, Tables 3-19 and 3-20 present patterns of episode utilization, and the corresponding episode lengths of stay and episode payments for these episode patterns, for both 2005 and 2006. Claims were sorted by date within an episode to create the patterns.
In both 2005 and 2006, approximately 75.0 percent of beneficiaries discharged to PAC had episode patterns from one of thirteen types of episodes. The most common type of episode was index acute hospital to home health (episode pattern=AH). Approximately 23.0 percent of beneficiaries discharged to PAC had this pattern of use. Another 17.0 percent were discharged directly from the index acute hospital to SNF (episode pattern=AS). A smaller proportion of beneficiaries had episode that included acute, SNF, and HHA (episode pattern=ASH; 8.0 percent), however these three episode types alone accounted for nearly 50.0 percent of all episode patterns among PAC users. Of these three episode patterns, ASH corresponded to the highest payments and longest episode length of stay. Compared to the AS episode pattern, AH had lower episode payments due to care in the home setting rather than an inpatient provider, but episode lengths of stay for AH episodes were longer compared to AS episodes due to the nature of home care services as delivered within 60.0-day episodes.
While the majority of beneficiaries have episodes of care with just one or two PAC settings, other beneficiaries have episodes of care with many settings of care. Readmissions to acute hospitals during episodes of care can increase PAC utilization and payments. Although not as common, some beneficiaries move in and out of the different types of providers before reaching the 60-day gap in service use that signals the end of a PAC episode. Patterns of use between 2005 and 2006, were very similar, however there was a slight increase in the proportion of beneficiaries with episode pattern AO (5.4 percent in 2005 vs. 6.0 percent in 2006) and a slight decrease in the proportion of beneficiaries with episode patterns of AIH (3.2 percent in 2005 vs. 2.8 percent in 2006). This result is consistent with analyses presented earlier demonstrating a decrease in the proportion of beneficiaries discharged to IRFs.
| Episode Pattern1 | Count (5% Sample) | Percent of PAC Users (N=111,879) | Cumulative Percent2 | Mean Episode Payment | Mean Episode Length of Stay (days) |
|---|---|---|---|---|---|
|
NOTES: SOURCE: RTI analysis of 2005 Medicare claims 5% sample (mmor167). |
|||||
| AH | 25,916 | 23.2 | 23.2 | $12,483 | 47.0 |
| AS | 19,676 | 17.6 | 40.8 | 16,952 | 43.0 |
| ASH | 8,500 | 7.6 | 48.3 | 21,150 | 75.5 |
| AO | 6,002 | 5.4 | 53.7 | 8,364 | 46.4 |
| AHA | 5,148 | 4.6 | 58.3 | 24,383 | 58.0 |
| AIH | 3,593 | 3.2 | 61.5 | 29,399 | 65.6 |
| ASAS | 2,944 | 2.6 | 64.2 | 31,922 | 79.3 |
| AHO | 2,820 | 2.5 | 66.7 | 13,729 | 87.7 |
| ASA | 2,268 | 2.0 | 68.7 | 26,548 | 48.1 |
| ASO | 2,002 | 1.8 | 70.5 | 18,336 | 87.2 |
| AIO | 1,869 | 1.7 | 72.2 | 25,285 | 77.3 |
| AHAH | 1,603 | 1.4 | 73.6 | 26,238 | 162.5 |
| AI | 1,585 | 1.4 | 75.0 | 24,274 | 17.5 |
| Episode Pattern1 | Count (5% Sample) | Percent of PAC Users (N=109,236) | Cumulative Percent | Mean Episode Payment | Mean Episode Length of Stay |
|---|---|---|---|---|---|
|
1. A=Acute Hospital; H=HHA; I=IRF; L=LTCH; O=Outpatient Therapy; S=SNF. SOURCE: RTI analysis of 2006 Medicare claims 5% sample. |
|||||
| AH | 25,238 | 23.1 | 23.1 | $12,696 | 48.9 |
| AS | 18,714 | 17.1 | 40.2 | 17,930 | 44.2 |
| ASH | 8,474 | 7.8 | 48.0 | 22,208 | 76.4 |
| AO | 6,533 | 6.0 | 54.0 | 8,165 | 40.0 |
| AHA | 4,909 | 4.5 | 58.5 | 25,035 | 57.2 |
| AIH | 3,066 | 2.8 | 61.3 | 30,915 | 69.3 |
| AHO | 2,941 | 2.7 | 64.0 | 14,250 | 88.0 |
| ASAS | 2,934 | 2.7 | 66.7 | 33,346 | 81.7 |
| ASA | 2,092 | 1.9 | 68.6 | 28,106 | 47.2 |
| ASO | 1,993 | 1.8 | 70.4 | 18,805 | 87.1 |
| AHAH | 1,635 | 1.5 | 71.9 | 26,956 | 171.5 |
| AIO | 1,467 | 1.3 | 73.2 | 27,270 | 79.1 |
| AI | 1,382 | 1.3 | 74.5 | 25,330 | 17.4 |
| Episode Pattern2 | Count (5% Sample) | % of PAC Users (N=4,675) | Cumulative Percent | Mean Episode Payment | Mean Episode Length of Stay |
|---|---|---|---|---|---|
|
1. FY 2006 DRG titles were used in this analysis. SOURCE: RTI analysis of 2006 Medicare claims 5% sample (MM2Y012). |
|||||
| AS | 1,218 | 26.1 | 26.1 | $14,018 | 40.5 |
| AH | 1,079 | 23.1 | 49.1 | 7,840 | 53.6 |
| AO | 343 | 7.3 | 56.5 | 5,579 | 31.7 |
| AHA | 240 | 5.1 | 61.6 | 18,434 | 59.8 |
| ASH | 236 | 5.0 | 66.7 | 15,965 | 72.7 |
| ASAS | 151 | 3.2 | 69.9 | 28,093 | 82.5 |
| ASA | 133 | 2.8 | 72.7 | 21,568 | 44.0 |
| AHAH | 76 | 1.6 | 74.4 | 21,350 | 200.1 |
| Episode Pattern2 | Count (5% Sample) | Percent of PAC Users (N=15,261) | Cumulative Percent | Mean Episode Payment | Mean Episode Length of Stay |
|---|---|---|---|---|---|
|
1. FY 2006 DRG titles were used in this analysis. SOURCE: RTI analysis of 2006 Medicare claims 5% sample (MM2Y012). |
|||||
| AH | 3,512 | 23.0 | 23.0 | $13,591 | 33.0 |
| ASH | 1,988 | 13.0 | 36.0 | 20,475 | 56.8 |
| AHO | 1,410 | 9.2 | 45.3 | 14,324 | 78.7 |
| AS | 1,307 | 8.6 | 53.8 | 19,992 | 35.8 |
| AIH | 1,019 | 6.7 | 60.5 | 26,549 | 55.3 |
| AO | 918 | 6.0 | 66.5 | 10,818 | 51.9 |
| ASO | 732 | 4.8 | 71.3 | 16,853 | 71.5 |
Another way of examining PAC transitions is presented in Figures 3-2 and 3-3. Here we examine transfer patterns following acute hospital discharge. The majority of beneficiaries use only one or two post-acute services following discharge as we saw in the previous section, but some transfer multiple times between different types of settings or churn back and forth with acute hospital readmissions. The number of claims per episode varies depending on the beneficiary's first site of PAC.
Figure 3-2. PAC Transitions for Live Acute Hospital Discharges, Number and Percentage of Admissions, 2006
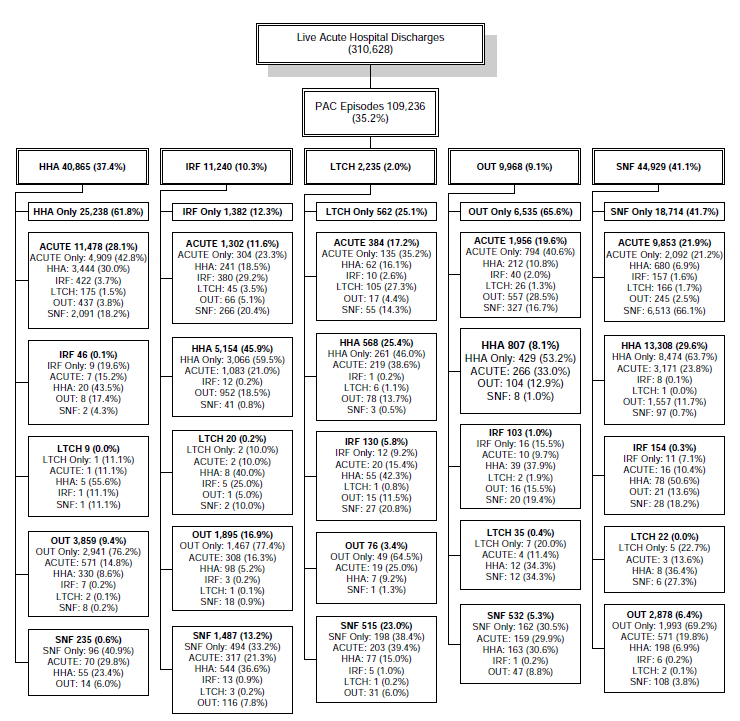
Figure 3-2 is titled "PAC Transitions for Live Acute Hospital Discharges, Number and Percent of Admissions, 2006." This figure shows the post-acute care transitions for live acute hospital discharges in the 2006 post-acute episode file (Medicare claims 5% sample). This transition table shows the number and percent of beneficiaries discharged to each site of post-acute care. In 2006, there were 310,628 live hospital discharges. Of these live hospital discharges, 109,236 (35.2 percent) of beneficiaries went on to use post-acute care. Of the beneficiaries going on to post-acute care, 40,865 (37.4 percent) were discharged to HHA; 11,240 (10.3 percent) were discharged to IRF; 2,235 (2.0 percent) were discharged to LTCH; 9,968 (9.1 percent) were discharged to hospital outpatient therapy; and 44,929 (41.1 percent) were discharged to SNF. This figure continues to track the number and percent of beneficiaries discharged to subsequent sites of post-acute care. The post-acute episodes presented here are truncated at the fourth post-acute claim following hospital discharge.
NOTE: Post-acute episodes presented here are truncated at the fourth post-acute claim following acute hospital discharge.
SOURCE: RTI analysis of 2006 Medicare claims 5% sample (MM2Y094).
Figure 3-3 PAC Transitions for Live Acute Hospital Discharges, Mean Utilization and Medicare Payments, 2006
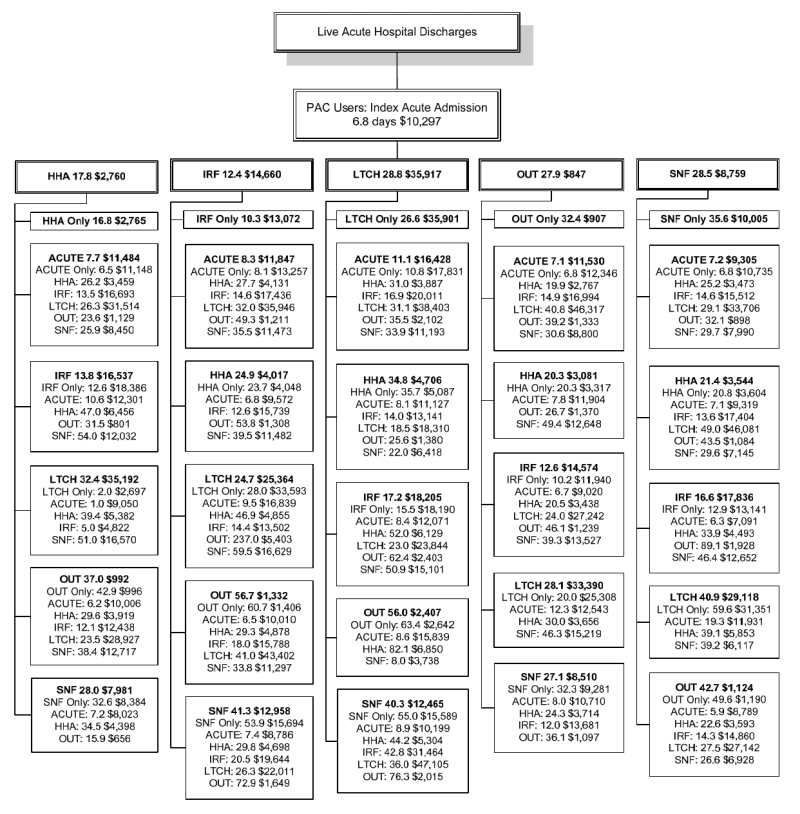
Figure 3-3 is titled "PAC Transitions for Live Acute Hospital Discharges, Mean Utilization and Medicare Payments, 2006." This figure shows the mean utilization and Medicare payments per setting for beneficiaries discharged to each post-acute care setting within their episode. The sample for this analysis was 109,236 beneficiaries using post-acute care in the 2006 (Medicare claims 5% sample). This transition table shows the mean utilization and payment per setting of care for beneficiaries discharged to each site of care. Utilization is measured in mean days for acute, IRF, SNF, and LTCH; mean visits for HHA, and mean units of service for hospital outpatient therapy. The mean length of stay and Medicare payments for index acute admissions was 6.8 days and $10,297. For beneficiaries discharged to HHA, mean HHA visits were 17.8 and mean Medicare payments for HHA were $2,760. For beneficiaries discharged to IRF, mean length of stay was 12.4 days and mean Medicare payment for the IRF stay was $14,660. For beneficiaries discharged to LTCH, mean length of stay was 28.8 days and mean Medicare payment for the LTCH stay was $35,917. For beneficiaries discharged to hospital outpatient therapy, mean use was 27.9 units of service and mean Medicare payment for hospital outpatient therapy was $847. For beneficiaries discharged to SNF, mean length of stay was 28.5 days and mean Medicare payment for the SNF stay was $8,759. This figure also shows the mean use and mean Medicare payment per site of care for beneficiaries discharged to subsequent sites of post-acute care during their episode. The post-acute episodes presented here are truncated at the fourth post-acute claim following hospital discharge.
NOTE: Post-acute episodes presented here are truncated at the fourth post acute claim following acute hospital discharge. The reported mean utilization and mean payment correspond to use at that level of care only, not to the entire episode. Utilization is measured as mean days for acute, IRF, LTCH, and SNF; mean visits for HHA; and mean units of service for outpatient therapy.
SOURCE: RTI analysis of 2006 Medicare claims 5% sample (MM2Y094).
The transition tables show the proportion of patients in each type of service and identify the percent using subsequent services of each type. As noted earlier, per our episode analysis 35.2 percent of live Medicare discharges from index acute hospital stays went on to use PAC in 2006. The largest proportion of beneficiaries was discharged to SNF (41.1 percent) or HHA (37.4 percent). Beneficiaries discharged to ambulatory settings, such as HHA or outpatient therapy are more likely to only use those PAC services. For example, 61.8 percent of beneficiaries discharged to HHAs and 65.6 percent of beneficiaries discharged to outpatient therapy use those services only. In contrast, beneficiaries using inpatient PAC are more likely to use at least one additional PAC service. According to our analysis of the 2006 episode data, 87.7 percent of beneficiaries discharged to IRFs and 74.9 percent of beneficiaries discharged to LTCHs go on to use other services during their post-acute episode.
PAC episodes appear to show a hierarchy in terms of service mix. Beneficiaries in institutional settings are most likely to use subsequent post-acute services. The most common discharge site for HHA, other than home or re-hospitalization is outpatient therapy (9.4 percent). Similarly, outpatient therapy cases are most likely to be discharged to HHA (8.1 percent) if not readmitted to an acute hospital (19.6 percent) or discharged home (using outpatient therapy only; 65.6 percent). SNF cases are most likely discharged to HHA (29.6 percent) or to outpatient therapy (6.4 percent) if not discharged home (41.7 percent) or readmitted to an acute hospital (21.9 percent). HHA is the most likely discharge destination for beneficiaries discharged from IRF (45.9 percent) and LTCH (25.4 percent) reflecting the ability of HHAs to provide follow-up therapy or nursing in the home following discharge.
Figure 3-3 presents the corresponding lengths of stay and payment for beneficiaries based on their patterns of PAC utilization. On average, beneficiaries discharged to post-acute care had acute index admissions of 6.8 days and Medicare payments of $10,297. Beneficiaries discharged to LTCH had LTCH stays averaging 28.8 days and Medicare payments of $35,917. Beneficiaries discharged to SNFs had similar length of stay in the SNFs as beneficiaries discharged to LTCHs (28.5 days), but had significantly lower payments for the stay ($8,759) reflecting the less intensive medical needs of patients discharged to this setting. Utilization for patients discharged to outpatient settings was measured in visits counts rather than days because these services occur with varying frequency over the course of a treatment period. Treatment in the outpatient setting was significantly less expensive in both outpatient therapy settings and HHAs compared to the inpatient settings.
Transition patterns differ by DRG. Figure 3-4 illustrates the transition patterns for beneficiaries who were hospitalized for DRG 089 Simple Pneumonia & Pleurisy Age > 17 with CC. Key differences between DRG 089 versus all DRGs generally are in the proportion of beneficiaries discharged to each of the subsequent discharge settings. Over 33.0 percent of beneficiaries in DRG 089 go on to use PAC services, but the majority of these beneficiaries go on to use HHAs (37.4 percent) or SNFs (47.3 percent). While over 10.0 percent of beneficiaries overall go on to use IRF services following discharge from the acute hospital, only 1.8 percent of beneficiaries in DRG 089 go on to use IRF following their index acute hospitalization. PAC episode lengths of stay and Medicare payments for beneficiaries in DRG 089 are less than for PAC episodes overall (Figure 3-5). The average pneumonia index acute admission was 6.2 days, and corresponding Medicare payments were $5,161 compared to 6.8 days and $10,297 dollars for beneficiaries overall.
Figure 3-4. PAC Transitions for Live Acute Hospital Discharges from DRG 089 Simple Pneumonia & Pleurisy Age > 17 with CC, Number and Percentage of Admissions, 2006
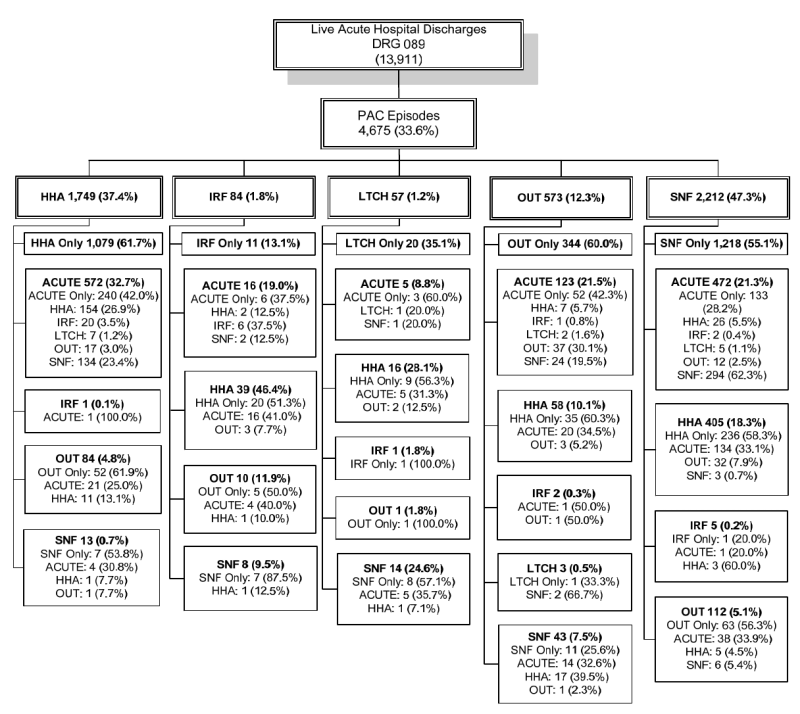
Figure 3-4 is titled "PAC Transitions for Live Acute Hospital Discharges from DRG 089 Simple Pneumonia and Pleurisy Age > 17 with CC, Number and Percentage of Admissions, 2006." This figure shows the post-acute care transitions for live acute hospital discharges in the 2006 post-acute episode file for beneficiaries in DRG 089 Simple Pneumonia & Pleurisy Age > 17 (Medicare claims 5% sample). This transition table shows the number and percent of beneficiaries discharged to each site of care. In 2006, there were 13,911 live hospital discharges in DRG 089. Of these live hospital discharges, 4,675 (33.6 percent) of beneficiaries went on to use post-acute care. Of the beneficiaries going on to post-acute care, 1,749 (37.4 percent) were discharged to HHA; 84 (1.8 percent) were discharged to IRF; 57 (1.2 percent) were discharged to LTCH; 573 (12.3 percent) were discharged to hospital outpatient therapy; and 2,212 (47.3 percent) were discharged to SNF. This figure continues to track the number and percent of beneficiaries discharged to subsequent sites of post-acute care. The post-acute episodes presented here are truncated at the fourth post-acute claim following hospital discharge.
NOTE: Post-acute episodes presented here are truncated at the fourth post acute claim following acute hospital discharge.
SOURCE: RTI analysis of 2006 Medicare claims 5% sample (MM2Y095).
Figure 3-5. PAC Transitions for Live Acute Hospital Discharges from DRG 089 Simple Pneumonia & Pleurisy Age > 17 with CC, Mean Utilization and Medicare Payment, 2006
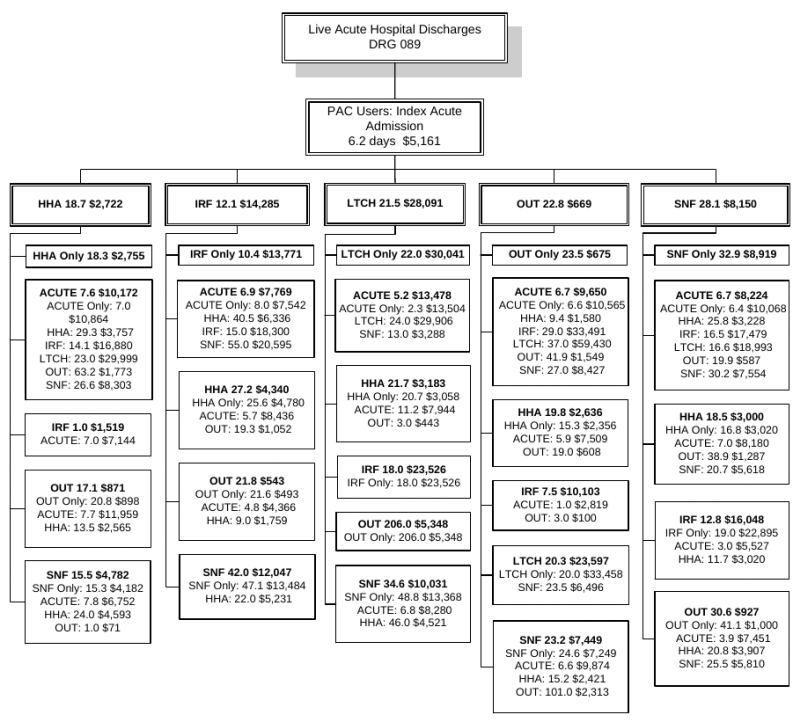
Figure 3-5 is titled "PAC Transitions for Live Acute Hospital Discharges from DRG 089 Simple Pneumonia and Pleurisy Age > 17 with CC, Mean Utilization and Medicare Payment, 2006." This figure shows the mean utilization and Medicare payments per setting for post-acute care transitions for beneficiaries in DRG 089 Simple Pneumonia & Pleurisy Age > 17. The sample for this analysis was 4,675 beneficiaries in DRG 089 using post-acute care in the 2006 (Medicare claims 5% sample). This transition table shows the mean utilization and payment per setting of care for beneficiaries discharged to each site of care. Utilization is measured in mean days for acute, IRF, SNF, and LTCH; mean visits for HHA, and mean units of service for hospital outpatient therapy. The mean length of stay and Medicare payment for index acute admissions was 6.2 days and $5,161. For beneficiaries discharged to HHA, mean HHA visits were 18.7 and mean Medicare payment for HHA was $2,722. For beneficiaries discharged to IRF, mean length of stay was 12.1 days and mean Medicare payment for the IRF stay was $14,285. For beneficiaries discharged to LTCH, mean length of stay was 21.5 days and mean Medicare payment for the LTCH stay was $28,091. For beneficiaries discharged to hospital outpatient therapy, mean use was 22.8 units of service and mean Medicare payment for hospital outpatient therapy was $669. For beneficiaries discharged to SNF, mean length of stay was 28.1 days and mean Medicare payment for the SNF stay was $8,150. This figure also shows the mean use and mean Medicare payment per site of care for beneficiaries discharged to subsequent sites of post-acute care during their episode. The post-acute episodes presented here are truncated at the fourth post-acute claim following hospital discharge.
NOTE: Post-acute episodes presented here are truncated at the fourth post acute claim following acute hospital discharge. The reported mean utilization and mean payment correspond to use at that level of care only, not to the entire episode. Utilization is measured as mean days for acute, IRF, LTCH, and SNF; mean visits for HHA; and mean units of service for outpatient therapy.
SOURCE: RTI analysis of 2006 Medicare claims 5% sample (MM2Y095).
Figure 3-6 shows transition patterns for the more rehabilitation-oriented hospital discharges in DRG 544 Major Joint Replacement or Reattachment of Lower Extremity. These cases are far more likely to be discharged to PAC in general. Over 87.0 percent of beneficiaries discharged from an index acute hospital admission in DRG 544 go on to use PAC services. Over 19.0 percent of these beneficiaries are discharged to an IRF setting compared with over 10.0 percent of beneficiaries across all DRGs. Beneficiaries discharged to IRFs had average IRF lengths of stay of 10.1 days and corresponding payments of $11,542 (Figure 3-7). Of the beneficiaries discharged to IRF, 88.0 percent go on to use other post-acute care services. The majority of these beneficiaries go on to use HHAs (52.2 percent) and hospital outpatient therapy (22.1 percent). Similar analyses were completed using the 2005 data and there was a notable decrease in the proportion discharged from index acute hospital to IRFs (25.7 percent in 2005 vs. 19.4 percent in 2006) and a corresponding increase in the proportion of beneficiaries discharged to HHAs (31.5 percent in 2005 vs. 35.7 percent in 2006), SNF (35.4 percent in 2005 vs. 37.2 percent in 2006), and outpatient therapy (6.9 percent in 2005 vs. 7.4 percent in 2006). As noted, this may be due to increased compliance with rules regarding the proportion of admissions to IRF settings required to fall within certain diagnoses.
Figure 3-6. PAC Transitions for Live Acute Hospital Discharges from DRG 544 Major Joint Replacement or Reattachment of Lower Extremity, Number and Percentage of Admissions, 2006
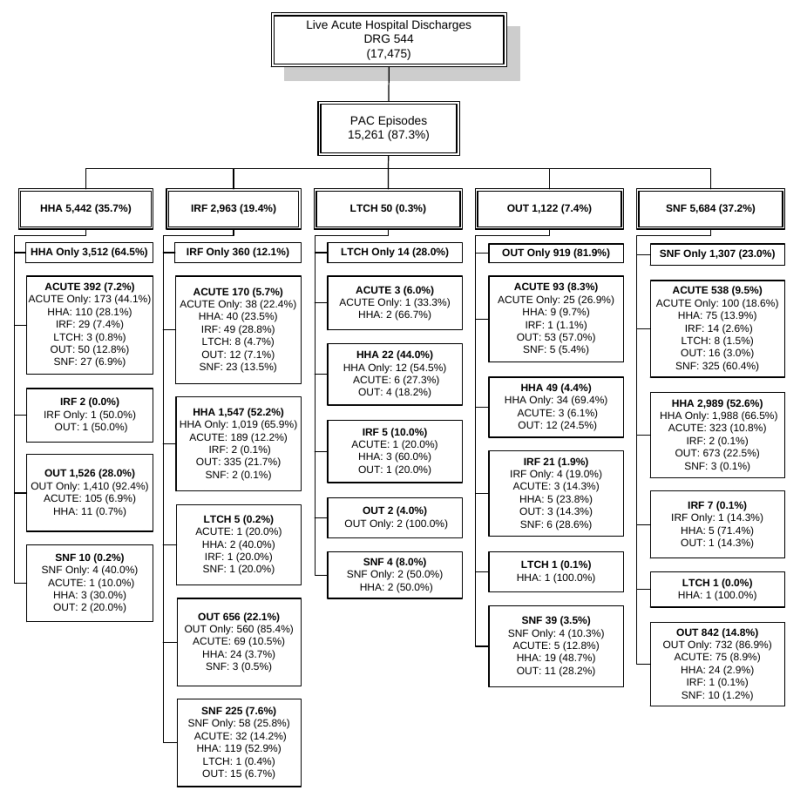
Figure 3-6 is titled "PAC Transitions for Live Acute Hospital Discharges from DRG 544 Major Joint Replacement or Reattachment of Lower Extremity, Number and Percentage of Admissions, 2006." This figure shows the post-acute care transitions for live acute hospital discharges in the 2006 post-acute episode file for beneficiaries in DRG 544 Major Joint Replacement or Reattachment of Lower Extremity (Medicare claims 5% sample). This transition table shows the number and percent of beneficiaries discharged to each site of care. In 2006, there were 17,475 live hospital discharges in DRG 544. Of these live hospital discharges, 15,261 (87.3 percent) of beneficiaries went on to use post-acute care. Of the beneficiaries going on to post-acute care, 5,442 (35.7 percent) were discharged to HHA; 2,963 (19.4 percent) were discharged to IRF; 50 (0.3 percent) were discharged to LTCH; 1,122 (7.4 percent) were discharged to hospital outpatient therapy; and 5,684 (37.2 percent) were discharged to SNF. This figure continues to track the number and percent of beneficiaries discharged to subsequent sites of post-acute care. The post-acute episodes presented here are truncated at the fourth post-acute claim following hospital discharge.
NOTE: Post-acute episodes presented here are truncated at the fourth post acute claim following acute hospital discharge.
SOURCE: RTI analysis of 2006 Medicare claims 5% sample (MM2Y095).
Figure 3-7. PAC Transitions for Live Acute Hospital Discharges from DRG 544 Major Joint Replacement or Reattachment of Lower Extremity, Mean Utilization and Medicare Payment, 2006
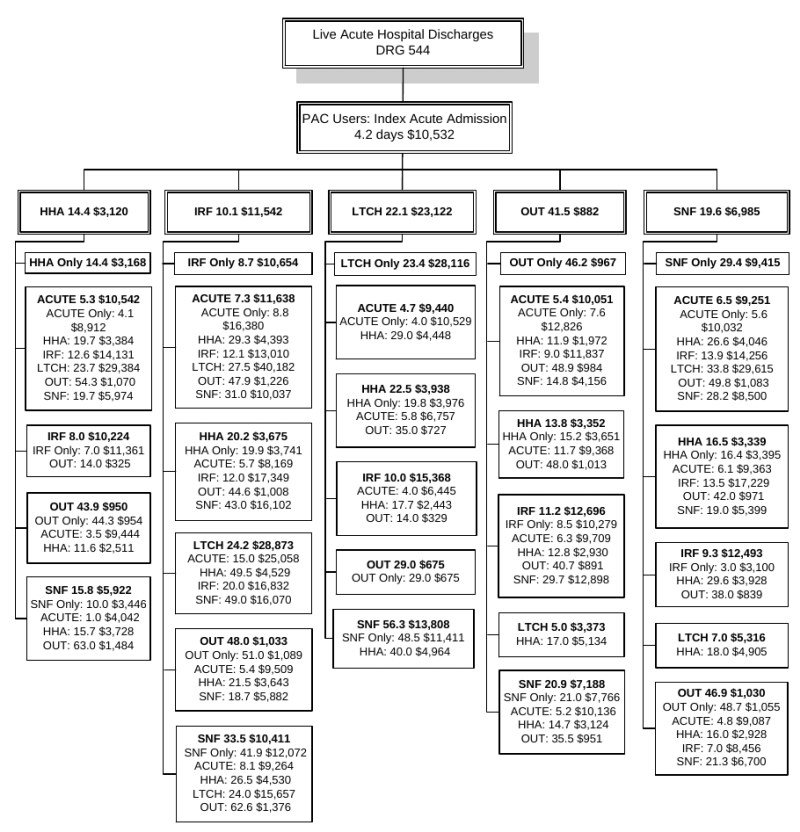
Figure 3-7 is titled "PAC Transitions for Live Acute Hospital Discharges from DRG 544 Major Joint Replacement or Reattachment of Lower Extremity, Mean Utilization and Medicare Payment, 2006." This figure shows the mean utilization and Medicare payments per setting for post-acute care transitions for beneficiaries in DRG 544 Major Joint Replacement or Reattachment of Lower Extremity. The sample for this analysis was 15,261 beneficiaries in DRG 544 using post-acute care in the 2006 (Medicare claims 5% sample). This transition table shows the mean utilization and payment per setting of care for beneficiaries discharged to each site of care. Utilization is measured in mean days for acute, IRF, SNF, and LTCH; mean visits for HHA, and mean units of service for hospital outpatient therapy. The mean length of stay and Medicare payment for index acute admissions was 4.2 days and $10,532. For beneficiaries discharged to HHA, mean HHA visits were 14.4 and mean Medicare payment for HHA were $3,120. For beneficiaries discharged to IRF, mean length of stay was 10.1 days and mean Medicare payment for the IRF stay was $11,542. For beneficiaries discharged to LTCH, mean length of stay was 22.1 days and mean Medicare payment for the LTCH stay was $23,122. For beneficiaries discharged to hospital outpatient therapy, mean use was 41.5 units of service and mean Medicare payment for hospital outpatient therapy was $882. For beneficiaries discharged to SNF, mean length of stay was 19.6 days and mean Medicare payment for the SNF stay was $6,985. This figure also shows the mean use and mean Medicare payment per site of care for beneficiaries discharged to subsequent sites of post-acute care during their episode. The post-acute episodes presented here are truncated at the fourth post-acute claim following hospital discharge.
NOTE: Post-acute episodes presented here are truncated at the fourth post acute claim following acute hospital discharge. The reported mean utilization and mean payment correspond to use at that level of care only, not to the entire episode. Utilization is measured as mean days for acute, IRF, LTCH, and SNF; mean visits for HHA; and mean units of service for outpatient therapy.
SOURCE: RTI analysis of 2006 Medicare claims 5% sample (MM2Y095).
3.8 Composition of Total Episode Payments
One of the main goals of the analyses of post-acute care episodes using the 2006 Medicare claims was to incorporate Medicare carrier claims (including Part B physician services, independent clinical labs, ambulance providers, and freestanding ambulatory surgery centers), DME, and hospice claims in order to learn more about complete composition of service use within an episode. Figures 3-8 through 3-16 graphically display the composition of post-acute care episode payments for all beneficiaries using PAC services, as well as beneficiaries in DRGs 089 Simple Pneumonia & Pleurisy and 544 Major Joint Replacement or Reattachment of Lower Extremity using PAC services. These charts demonstrate the proportion of total episode payments attributable to each type of service in a post-acute episode overall (Figures 3-8, 3-11 and 3-14), and by APR-DRG severity of illness level (Figures 3-9, 3-12, and 3-15), and by MS-DRG severity level (Figures 3-10, 3-13, and 3-16). These figures allow us to compare episode composition for medical versus rehabilitation DRGs, to compare episode composition across severity levels (within APR-DRGs, and within MS-DRGs), and to compare episode composition within DRGs using the APR-DRG severity measures versus the MS-DRG severity measures.
Figure 3-8 demonstrates the composition of Medicare payments for beneficiaries using post-acute care, across all diagnoses (N=109,236). Mean episode payments for all beneficiaries using PAC were $30,028. Medicare payments for index acute hospital admissions (34.3 percent) and SNF (17.9 percent) made up over half of Medicare payments for PAC episodes. Though per beneficiary payments are very high for beneficiaries using LTCH services, across all beneficiaries using PAC (including beneficiaries who use LTCH as well as beneficiaries who do not use LTCH), LTCH payments accounted for 3.7 percent of total Medicare payment for PAC services. In looking at the composition of payments for all PAC users by severity level as measured by APR-DRGs (Figure 3-9) and MS-DRGs (Figure 3-10) similar patterns in the distribution of payments emerge. Mean episode payments increase with increasing severity and the proportion of episode payments for LTCH services also increases with increasing severity. For example, in Figure 3-10, mean episode payments for MS-DRG No CCs were $26,609 and LTCH spending accounted for 3.7 percent of total spending for beneficiaries in this severity level. Mean episode payment for MS-DRG W/MCCs were $39,587 and LTCH payments accounted for 4.8 percent of total spending for beneficiaries in this severity level.
Figure 3-8. Medicare Payments by Service Type, All Post-Acute Users, 2006
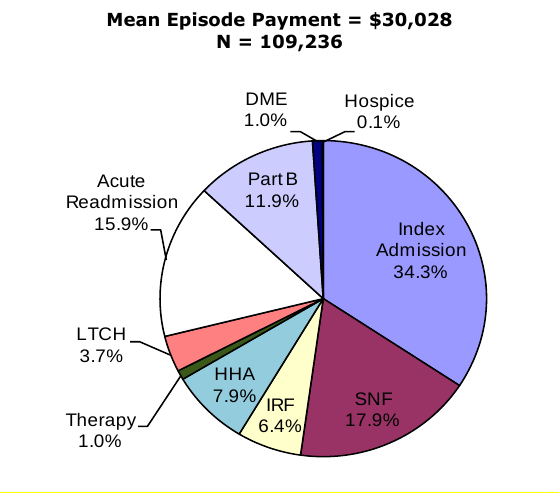
Figure 3-8 is titled "Medicare Payments by Service Type, All Post-Acute Users, 2006." This is a pie chart depicting the proportion of Medicare payments attributable to different service types. The mean episode payment for all post-acute users (N=109,236) is $30,028. The pie chart shows that 34.1 percent of Medicare payments are for Index Admissions; 17.9 percent of Medicare payments are for SNF; 6.4 percent of Medicare payments are for IRF; 7.9 percent of Medicare payments are for HHA; 1.0 percent of Medicare payments are for therapy; 3.7 percent of Medicare payments are for LTCH; 15.9 percent of Medicare payments are for acute readmissions; 11.9 percent of Medicare payments are for Part B services; 1.0 percent of Medicare payments are for DME; and 0.1 percent of Medicare payments are for Hospice. The data source for this analysis is RTI analysis of 2006 Medicare claims 5% sample.
SOURCE: RTI analysis of 2006 Medicare Claims 5% sample.
Figure 3-9. Medicare Payments by Service Type, All Post-Acute Users, by APR-DRG
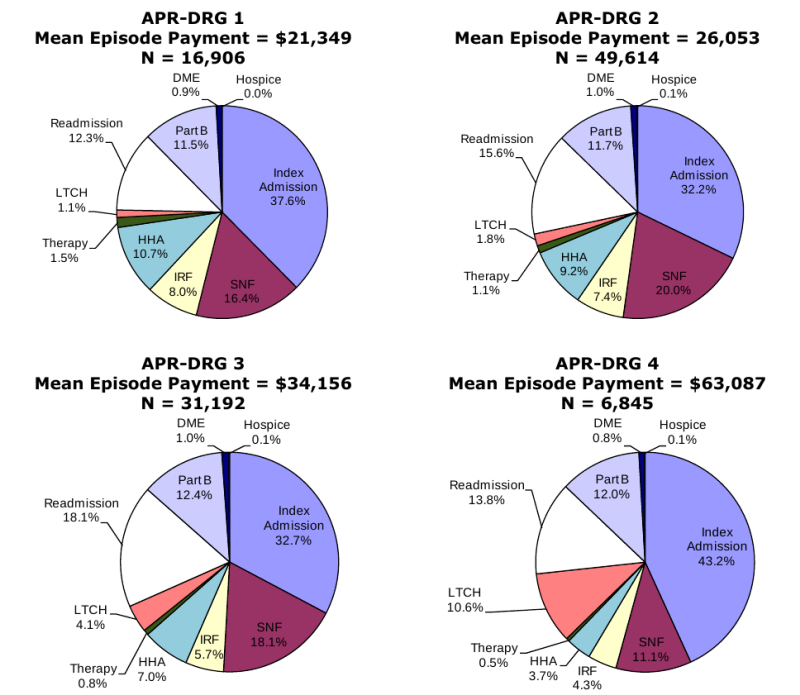
Figure 3-9 is titled "Medicare Payments by Service Type, All Post-Acute Users, by APR-DRG." This is a figure with four pie charts depicting the proportion of Medicare payments attributable to different service types for beneficiaries in APR-DRG Severity Index Level 1, APR-DRG Severity Index Level 2, APR-DRG Severity Index Level 3, and APR-DRG Severity Index Level 4. The data source for this analysis is RTI analysis of 2006 Medicare claims 5% sample.
The mean episode payment for post-acute users in APR-DRG Severity Index Level 1 (N=16,906) is $21,349. The pie chart for APR-DRG Severity Index Level 1 shows that 37.6 percent of Medicare payments are for Index Admissions; 16.4 percent of Medicare payments are for SNF; 8.0 percent of Medicare payments are for IRF; 10.7 percent of Medicare payments are for HHA; 1.5 percent of Medicare payments are for therapy; 1.1 percent of Medicare payments are for LTCH; 12.3 percent of Medicare payments are for acute readmissions; 11.5 percent of Medicare payments are for Part B services; 0.9 percent of Medicare payments are for DME; and 0 percent of Medicare payments are for Hospice. Note that the percent of payments for hospice are 0 due to rounding.
The mean episode payment for post-acute users in APR-DRG Severity Index Level 2 (N=49,614) is $26,053. The pie chart for APR-DRG Severity Index Level 2 shows that 32.2 percent of Medicare payments are for Index Admissions; 20.0 percent of Medicare payments are for SNF; 7.4 percent of Medicare payments are for IRF; 9.2 percent of Medicare payments are for HHA; 1.1 percent of Medicare payments are for therapy; 1.8 percent of Medicare payments are for LTCH; 15.6 percent of Medicare payments are for acute readmissions; 11.7 percent of Medicare payments are for Part B services; 1.0 percent of Medicare payments are for DME; and 0.1 percent of Medicare payments are for Hospice.
The mean episode payment for post-acute users in APR-DRG Severity Index Level 3 (N=31,192) is $34,156. The pie chart for APR-DRG Severity Index Level 3 shows that 32.7 percent of Medicare payments are for Index Admissions; 18.1 percent of Medicare payments are for SNF; 5.7 percent of Medicare payments are for IRF; 7.0 percent of Medicare payments are for HHA; 0.8 percent of Medicare payments are for therapy; 4.1 percent of Medicare payments are for LTCH; 18.1 percent of Medicare payments are for acute readmissions; 12.4 percent of Medicare payments are for Part B services; 1.0 percent of Medicare payments are for DME; and 0.1 percent of Medicare payments are for Hospice.
The mean episode payment for post-acute users in APR-DRG Severity Index Level 4 (N=6,845) is $63,087. The pie chart for APR-DRG Severity Index Level 4 shows that 43.2 percent of Medicare payments are for Index Admissions; 11.1 percent of Medicare payments are for SNF; 4.3 percent of Medicare payments are for IRF; 3.7 percent of Medicare payments are for HHA; 0.5 percent of Medicare payments are for therapy; 10.6 percent of Medicare payments are for LTCH; 13.8 percent of Medicare payments are for acute readmissions; 12.0 percent of Medicare payments are for Part B services; 0.8 percent of Medicare payments are for DME; and 0.1 percent of Medicare payments are for Hospice.
NOTE: Percent of episode payments for hospice appear as 0.0% due to rounding.
SOURCE: RTI analysis of 2006 Medicare Claims 5% sample.
Figure 3-10. Medicare Payments by Service Type, All Post Acute Users, by MS-DRG
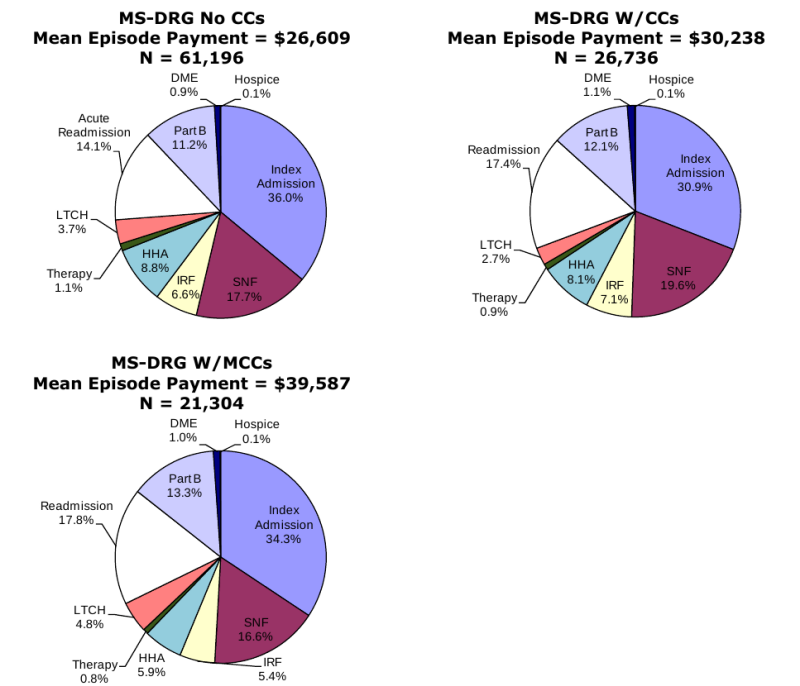
Figure 3-10 is titled "Medicare Payments by Service Type, All Post-Acute Users, by MS-DRG." This is a figure with three pie charts depicting the proportion of Medicare payments attributable to different service types for beneficiaries in MS-DRG Level No CCs, MS-DRG Level W/CCs, and MS-DRG Severity W/MCCs. The data source for this analysis is RTI analysis of 2006 Medicare claims 5% sample.
The mean episode payment for post-acute users in MS-DRG Level No CCs (N=61,196) is $26,609. The pie chart for MS-DRG Level No CCs shows that 36.0 percent of Medicare payments are for Index Admissions; 17.7 percent of Medicare payments are for SNF; 6.6 percent of Medicare payments are for IRF; 8.8 percent of Medicare payments are for HHA; 1.1 percent of Medicare payments are for therapy; 3.7 percent of Medicare payments are for LTCH; 14.1 percent of Medicare payments are for acute readmissions; 11.2 percent of Medicare payments are for Part B services; 0.9 percent of Medicare payments are for DME; and 0.1 percent of Medicare payments are for Hospice.
The mean episode payment for post-acute users in MS-DRG Level W/CCs (N=26,736) is $30,238. The pie chart for MS-DRG Level W/CCs shows that 30.9 percent of Medicare payments are for Index Admissions; 19.6 percent of Medicare payments are for SNF; 7.1 percent of Medicare payments are for IRF; 8.1 percent of Medicare payments are for HHA; 0.9 percent of Medicare payments are for therapy; 2.7 percent of Medicare payments are for LTCH; 17.4 percent of Medicare payments are for acute readmissions; 12.1 percent of Medicare payments are for Part B services; 1.1 percent of Medicare payments are for DME; and 0.1 percent of Medicare payments are for Hospice.
The mean episode payment for post-acute users in MS-DRG Level W/MCCs (N=21,304) is $39,587. The pie chart for MS-DRG Level W/MCCs shows that 34.3 percent of Medicare payments are for Index Admissions; 16.6 percent of Medicare payments are for SNF; 5.4 percent of Medicare payments are for IRF; 5.9 percent of Medicare payments are for HHA; 0.8 percent of Medicare payments are for therapy; 4.8 percent of Medicare payments are for LTCH; 17.8 percent of Medicare payments are for acute readmissions; 13.3 percent of Medicare payments are for Part B services; 1.0 percent of Medicare payments are for DME; and 0.1 percent of Medicare payments are for Hospice.
NOTE: Note that MS-DRG severity levels were assigned to 2006 DRGs. Results may differ in other years of data.
SOURCE: RTI analysis of 2006 Medicare Claims 5% sample.
For beneficiaries pneumonia using PAC services (Figure 3-11), the services that made up the largest proportion of total episode payments were the index acute admission (25.2 percent) and the SNF claims (26.3 percent). These results are consistent with the high rates of utilization of SNF services for beneficiaries with pneumonia where over half of beneficiaries with pneumonia had a SNF claim in their post-acute episode and the length of stay in the SNF setting averaged 35 days (Table 3-14). For beneficiaries in the lowest severity levels (both APR-DRG 1 and MS-DRG No CCs), index acute hospital and SNF services accounted for more than 50.0 percent of total episode payments (Figure 3-12 and Figure 3-13). The proportion of payments attributable to these services decreased with increasing severity as the use of other post-acute care services including Part B physician services and readmission to acute hospitals increased. Part B services increased as a proportion of total episode payments with increasing severity. For beneficiaries in APR-DRG severity levels 1 and 2, Part B services accounted for 11.0 percent of total episode payments compared with 13.0 percent for beneficiaries in APR-DRG severity levels 3 and 4. Similarly, the proportion of episode payments for Part B services increased from 10.1 percent to 13.9 percent from the lowest to highest MS-DRG severity levels. As expected, the proportion of payments attributable to HHA services decreased with increasing severity levels as these more medically complex beneficiaries are more likely to have treatment in inpatient settings. LTCH service use was very low for beneficiaries in DRG 089 (2.8 percent of payments overall), although for beneficiaries in this DRG with APR-DRG severity level 4, LTCH payments did account for 8.0 percent of Medicare payments. The proportion of payments for IRF services remained small across all levels of patient severity for beneficiaries in DRG 089 (2.4 percent of payments overall).
Figure 3-11. Medicare Payments by Service Type, DRG 089 Simple Pneumonia & Pleurisy Age > 17 w CC
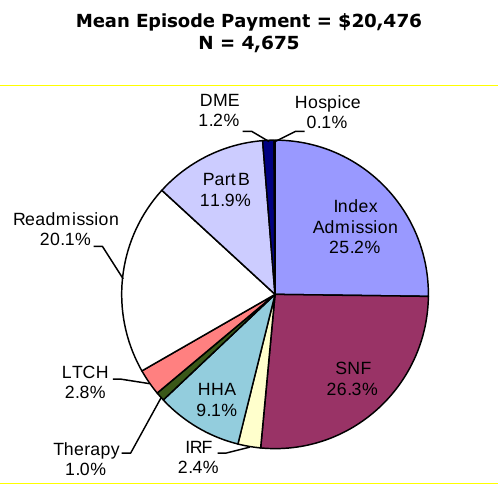
Figure 3-11 is titled "Medicare Payments by Service Type, DRG 089 Simple Pneumonia & Pleurisy Age > 17 with CC." This is a pie chart depicting the proportion of Medicare payments attributable to different service types for beneficiaries in DRG 089. The mean episode payment for all post-acute users in DRG 089 (N=4,675) is $20,476. The pie chart shows that 25.2 percent of Medicare payments are for Index Admissions; 26.3 percent of Medicare payments are for SNF; 2.4 percent of Medicare payments are for IRF; 9.1 percent of Medicare payments are for HHA; 1.0 percent of Medicare payments are for therapy; 2.8 percent of Medicare payments are for LTCH; 20.1 percent of Medicare payments are for acute readmissions; 11.9 percent of Medicare payments are for Part B services; 1.2 percent of Medicare payments are for DME; and 0.1 percent of Medicare payments are for Hospice. The data source for this analysis is RTI analysis of 2006 Medicare claims 5% sample.
SOURCE: RTI analysis of 2006 Medicare Claims 5% sample.
Figure 3-12. Medicare Payments by Service Type, DRG 089 Simple Pneumonia & Pleurisy Age > 17 w CC, by APR-DRG
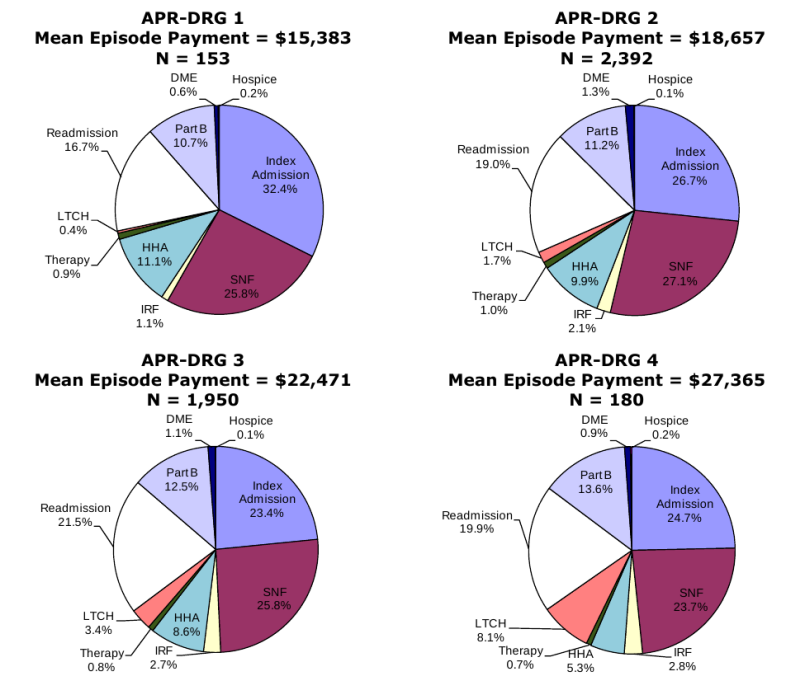
Figure 3-12 is titled "Medicare Payments by Service Type, DRG 089 Simple Pneumonia & Pleurisy Age > 17 w CC, by APR-DRG." This is a figure with four pie charts depicting the proportion of Medicare payments attributable to different service types for beneficiaries in DRG 089 in APR-DRG Severity Index Level 1, APR-DRG Severity Index Level 2, APR-DRG Severity Index Level 3, and APR-DRG Severity Index Level 4. The data source for this analysis is RTI analysis of 2006 Medicare claims 5% sample.
The mean episode payment for post-acute users in DRG 089 in APR-DRG Severity Index Level 1 (N=153) is $15,383. The pie chart for APR-DRG Severity Index Level 1 shows that 32.4 percent of Medicare payments are for Index Admissions; 25.8 percent of Medicare payments are for SNF; 1.1 percent of Medicare payments are for IRF; 11.1 percent of Medicare payments are for HHA; 0.9 percent of Medicare payments are for therapy; 0.4 percent of Medicare payments are for LTCH; 16.7 percent of Medicare payments are for acute readmissions; 10.7 percent of Medicare payments are for Part B services; 0.6 percent of Medicare payments are for DME; and 0.2 percent of Medicare payments are for Hospice.
The mean episode payment for post-acute users in DRG 089 in APR-DRG Severity Index Level 2 (N=2,392) is $18,657. The pie chart for APR-DRG Severity Index Level 2 shows that 26.7 percent of Medicare payments are for Index Admissions; 27.1 percent of Medicare payments are for SNF; 2.1 percent of Medicare payments are for IRF; 9.9 percent of Medicare payments are for HHA; 1.0 percent of Medicare payments are for therapy; 1.7 percent of Medicare payments are for LTCH; 19.0 percent of Medicare payments are for acute readmissions; 11.2 percent of Medicare payments are for Part B services; 1.3 percent of Medicare payments are for DME; and 0.1 percent of Medicare payments are for Hospice.
The mean episode payment for post-acute users in DRG 089 in APR-DRG Severity Index Level 3 (N=1,950) is $34,156. The pie chart for APR-DRG Severity Index Level 3 shows that 23.4 percent of Medicare payments are for Index Admissions; 25.8 percent of Medicare payments are for SNF; 2.7 percent of Medicare payments are for IRF; 8.6 percent of Medicare payments are for HHA; 0.8 percent of Medicare payments are for therapy; 3.4 percent of Medicare payments are for LTCH; 21.5 percent of Medicare payments are for acute readmissions; 12.5 percent of Medicare payments are for Part B services; 1.1 percent of Medicare payments are for DME; and 0.1 percent of Medicare payments are for Hospice.
The mean episode payment for post-acute users in DRG 089 in APR-DRG Severity Index Level 4 (N=180) is $27,365. The pie chart for APR-DRG Severity Index Level 4 shows that 24.7 percent of Medicare payments are for Index Admissions; 23.7 percent of Medicare payments are for SNF; 2.8 percent of Medicare payments are for IRF; 5.3 percent of Medicare payments are for HHA; 0.7 percent of Medicare payments are for therapy; 8.1 percent of Medicare payments are for LTCH; 19.9 percent of Medicare payments are for acute readmissions; 13.6 percent of Medicare payments are for Part B services; 0.9 percent of Medicare payments are for DME; and 0.2 percent of Medicare payments are for Hospice.
SOURCE: RTI analysis of 2006 Medicare Claims 5% sample.
Figure 3-13. Medicare Payments by Service Type, DRG 089 Simple Pneumonia & Pleurisy Age > 17 w CC, by MS-DRG
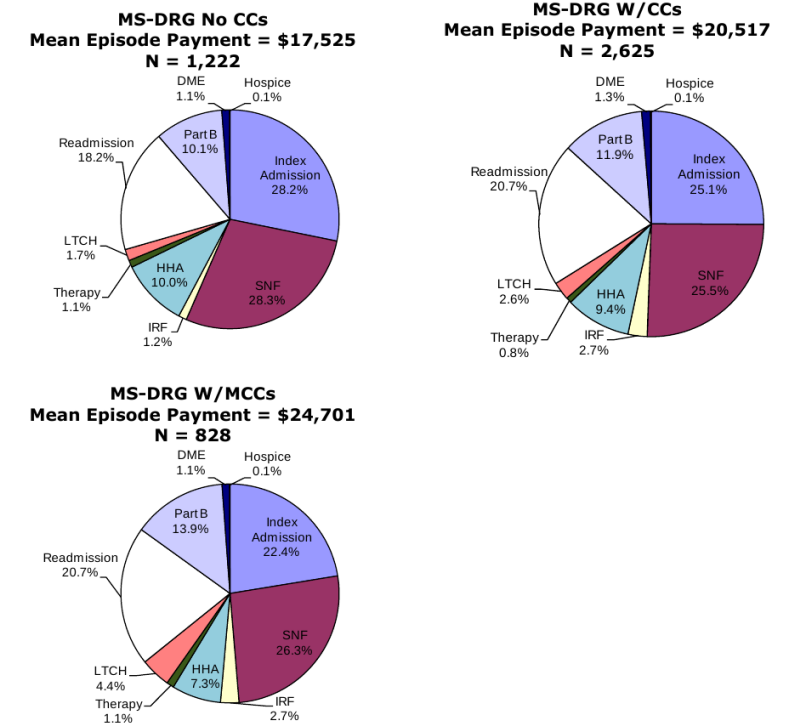
Figure 3-13 is titled "Medicare Payments by Service Type, DRG 089 Simple Pneumonia & Pleurisy Age > 17 w CC, by MS-DRG." This is a figure with three pie charts depicting the proportion of Medicare payments attributable to different service types for beneficiaries in DRG 089 in MS-DRG Level No CCs, MS-DRG Level W/CCs, and MS-DRG Severity W/MCCs. The data source for this analysis is RTI analysis of 2006 Medicare claims 5% sample.
The mean episode payment for post-acute users in DRG 089 in MS-DRG Level No CCs (N=1,222) is $17,525. The pie chart for MS-DRG Level No CCs shows that 28.2 percent of Medicare payments are for Index Admissions; 28.3 percent of Medicare payments are for SNF; 1.2 percent of Medicare payments are for IRF; 10.0 percent of Medicare payments are for HHA; 1.1 percent of Medicare payments are for therapy; 1.7 percent of Medicare payments are for LTCH; 18.2 percent of Medicare payments are for acute readmissions; 10.1 percent of Medicare payments are for Part B services; 1.1 percent of Medicare payments are for DME; and 0.1 percent of Medicare payments are for Hospice.
The mean episode payment for post-acute users in DRG 089 in MS-DRG Level W/CCs (N=2,625) is $20,517. The pie chart for MS-DRG Level W/CCs shows that 25.1 percent of Medicare payments are for Index Admissions; 25.5 percent of Medicare payments are for SNF; 2.7 percent of Medicare payments are for IRF; 9.4 percent of Medicare payments are for HHA; 0.8 percent of Medicare payments are for therapy; 2.6 percent of Medicare payments are for LTCH; 20.7 percent of Medicare payments are for acute readmissions; 11.9 percent of Medicare payments are for Part B services; 1.3 percent of Medicare payments are for DME; and 0.1 percent of Medicare payments are for Hospice.
The mean episode payment for post-acute users in DRG 089 in MS-DRG Level W/MCCs (N=828) is $24,701. The pie chart for MS-DRG Level W/MCCs shows that 22.4 percent of Medicare payments are for Index Admissions; 26.3 percent of Medicare payments are for SNF; 2.7 percent of Medicare payments are for IRF; 7.3 percent of Medicare payments are for HHA; 1.1 percent of Medicare payments are for therapy; 4.4 percent of Medicare payments are for LTCH; 20.7 percent of Medicare payments are for acute readmissions; 13.9 percent of Medicare payments are for Part B services; 1.1 percent of Medicare payments are for DME; and 0.1 percent of Medicare payments are for Hospice.
NOTE: Note that MS-DRG severity levels were assigned to 2006 DRGs. Results may differ in other years of data.
SOURCE: RTI analysis of 2006 Medicare Claims 5% sample.
Figure 3-14. Medicare Payments by Service Type, DRG 544 Major Joint Replacement or Reattachment of Lower Extremity
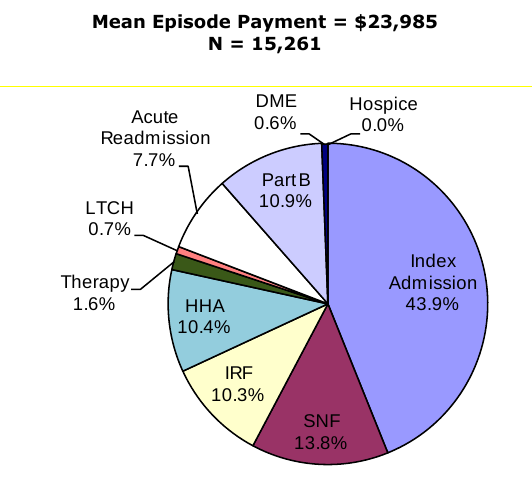
Figure 3-14 is titled "Medicare Payments by Service Type, DRG 544 Major Joint Replacement or Reattachment of Lower Extremity." This is a pie chart depicting the proportion of Medicare payments attributable to different service types for beneficiaries in DRG 544. The mean episode payment for all post-acute users in DRG 544 (N=15,261) is $23,985. The pie chart shows that 43.9 percent of Medicare payments are for Index Admissions; 13.8 percent of Medicare payments are for SNF; 10.3 percent of Medicare payments are for IRF; 10.4 percent of Medicare payments are for HHA; 1.6 percent of Medicare payments are for therapy; 0.7 percent of Medicare payments are for LTCH; 7.7 percent of Medicare payments are for acute readmissions; 10.9 percent of Medicare payments are for Part B services; 0.6 percent of Medicare payments are for DME; and 0 percent of Medicare payments are for Hospice. The data source for this analysis is RTI analysis of 2006 Medicare claims 5% sample. Note that the percent of payments for hospice are 0 due to rounding.
NOTE: Percent of episode payments for hospice appear as 0.0% due to rounding.
SOURCE: RTI analysis of 2006 Medicare Claims 5% sample.
Figure 3-15. Medicare Payments by Service Type, DRG 544 Major Joint Replacement or Reattachment of Lower Extremity, by APR-DRG
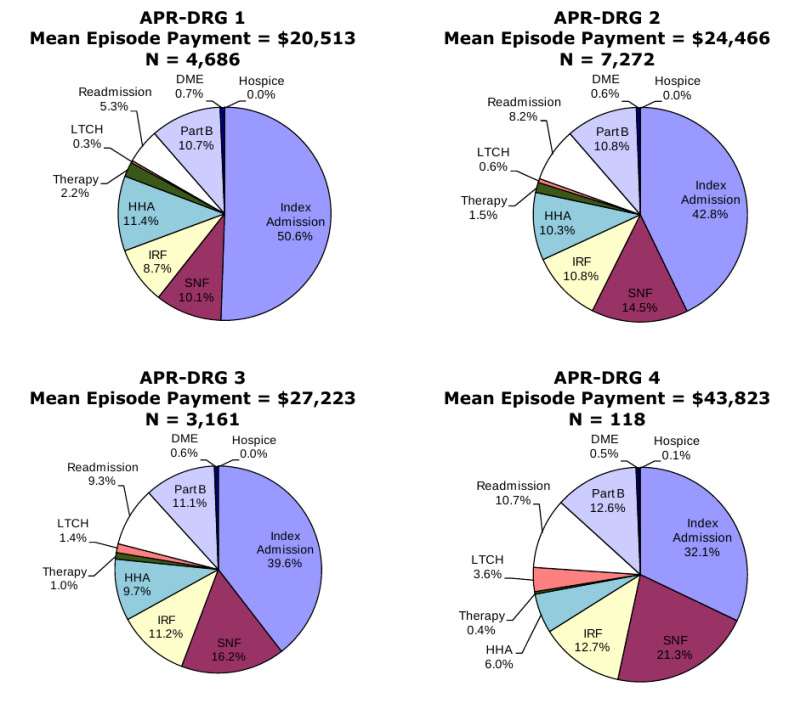
Figure 3-15 is titled "Medicare Payments by Service Type, DRG 544 Major Joint Replacement or Reattachment of Lower Extremity, by APR-DRG." This is a figure with four pie charts depicting the proportion of Medicare payments attributable to different service types for beneficiaries in DRG 544 in APR-DRG Severity Index Level 1, APR-DRG Severity Index Level 2, APR-DRG Severity Index Level 3, and APR-DRG Severity Index Level 4. The data source for this analysis is RTI analysis of 2006 Medicare claims 5% sample.
The mean episode payment for post-acute users in DRG 544 in APR-DRG Severity Index Level 1 (N=4,686) is $20,513. The pie chart for APR-DRG Severity Index Level 1 shows that 50.6 percent of Medicare payments are for Index Admissions; 10.1 percent of Medicare payments are for SNF; 8.7 percent of Medicare payments are for IRF; 11.4 percent of Medicare payments are for HHA; 2.2 percent of Medicare payments are for therapy; 0.3 percent of Medicare payments are for LTCH; 5.3 percent of Medicare payments are for acute readmissions; 10.7 percent of Medicare payments are for Part B services; 0.7 percent of Medicare payments are for DME; and 0 percent of Medicare payments are for Hospice. Note that the percent of payments for hospice are 0 due to rounding.
The mean episode payment for post-acute users in DRG 544 in APR-DRG Severity Index Level 2 (N=7,272) is $24,446. The pie chart for APR-DRG Severity Index Level 2 shows that 42.8 percent of Medicare payments are for Index Admissions; 14.5 percent of Medicare payments are for SNF; 10.8 percent of Medicare payments are for IRF; 10.3 percent of Medicare payments are for HHA; 1.5 percent of Medicare payments are for therapy; 0.6 percent of Medicare payments are for LTCH; 8.2 percent of Medicare payments are for acute readmissions; 10.8 percent of Medicare payments are for Part B services; 0.6 percent of Medicare payments are for DME; and 0 percent of Medicare payments are for Hospice. Note that the percent of payments for hospice are 0 due to rounding.
The mean episode payment for post-acute users in DRG 544 in APR-DRG Severity Index Level 3 (N=3,161) is $27,223. The pie chart for APR-DRG Severity Index Level 3 shows that 39.6 percent of Medicare payments are for Index Admissions; 16.2 percent of Medicare payments are for SNF; 11.2 percent of Medicare payments are for IRF; 9.7 percent of Medicare payments are for HHA; 1.0 percent of Medicare payments are for therapy; 1.4 percent of Medicare payments are for LTCH; 9.3 percent of Medicare payments are for acute readmissions; 11.1 percent of Medicare payments are for Part B services; 0.6 percent of Medicare payments are for DME; and 0 percent of Medicare payments are for Hospice. Note that the percent of payments for hospice are 0 due to rounding.
The mean episode payment for post-acute users in DRG 544 in APR-DRG Severity Index Level 4 (N=118) is $43,823. The pie chart for APR-DRG Severity Index Level 4 shows that 32.1 percent of Medicare payments are for Index Admissions; 21.3 percent of Medicare payments are for SNF; 12.7 percent of Medicare payments are for IRF; 6.0 percent of Medicare payments are for HHA; 0.4 percent of Medicare payments are for therapy; 3.6 percent of Medicare payments are for LTCH; 10.7 percent of Medicare payments are for acute readmissions; 12.6 percent of Medicare payments are for Part B services; 0.5 percent of Medicare payments are for DME; and 0.1 percent of Medicare payments are for Hospice.
NOTE: Percent of episode payments for hospice appear as 0.0% due to rounding.
SOURCE: RTI analysis of 2006 Medicare Claims 5% sample.
Figure 3-16. Composition of PAC Episode Payments, DRG 544 Major Joint Replacement or Reattachment of Lower Extremity, by MS-DRG
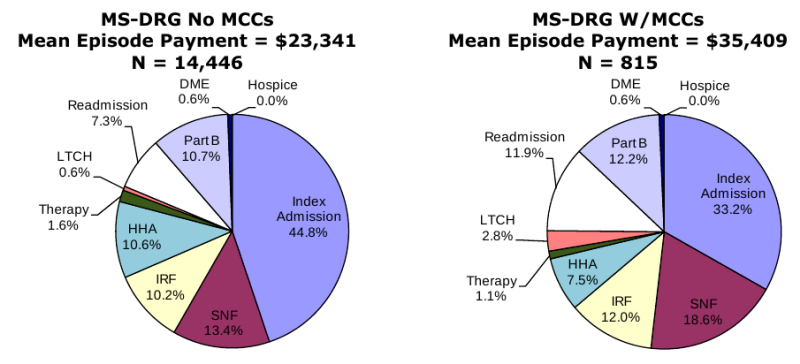
Figure 3-16 is titled "Composition of PAC Episode Payments, DRG 544 Major Joint Replacement or Reattachment of Lower Extremity, by MS-DRG." This is a figure with two pie charts depicting the proportion of Medicare payments attributable to different service types for beneficiaries in DRG 544 in MS-DRG Level No MCCs and MS-DRG Severity W/MCCs. The data source for this analysis is RTI analysis of 2006 Medicare claims 5% sample.
The mean episode payment for post-acute users in DRG 544 in MS-DRG Level No MCCs (N=14,446) is $23,441. The pie chart for MS-DRG Level No MCCs shows that 44.8 percent of Medicare payments are for Index Admissions; 13.4 percent of Medicare payments are for SNF; 10.2 percent of Medicare payments are for IRF; 10.6 percent of Medicare payments are for HHA; 1.6 percent of Medicare payments are for therapy; 0.6 percent of Medicare payments are for LTCH; 7.3 percent of Medicare payments are for acute readmissions; 10.7 percent of Medicare payments are for Part B services; 0.6 percent of Medicare payments are for DME; and 0 percent of Medicare payments are for Hospice. Note that the percent of payments for hospice are 0 due to rounding.
The mean episode payment for post-acute users in DRG 544 in MS-DRG Level W/MCCs (N=815) is $35,409. The pie chart for MS-DRG Level W/CCs shows that 33.2 percent of Medicare payments are for Index Admissions; 18.6 percent of Medicare payments are for SNF; 12.0 percent of Medicare payments are for IRF; 7.5 percent of Medicare payments are for HHA; 1.1 percent of Medicare payments are for therapy; 2.8 percent of Medicare payments are for LTCH; 11.9 percent of Medicare payments are for acute readmissions; 12.2 percent of Medicare payments are for Part B services; 0.6 percent of Medicare payments are for DME; and 0 percent of Medicare payments are for Hospice. Note that the percent of payments for hospice are 0 due to rounding.
NOTES:
Note that MS-DRG severity levels were assigned to 2006 DRGs. Results may differ in other years of data.
Percent of episode payments for hospice appear as 0.0% due to rounding.
SOURCE: RTI analysis of 2006 Medicare Claims 5% sample.
Several key differences between beneficiaries in DRG 089 Simple Pneumonia & Pleurisy and DRG 544 Major Joint Replacement or Reattachment of Lower Extremity emerged in the analysis of episode composition. The proportion of total episode payments attributable to the index admission was significantly higher for beneficiaries in DRG 544 (43.9 percent overall) compared to DRG 089 (25.2 percent overall). One explanation for this is simply the nature of the care for beneficiaries in this DRG. Beneficiaries admitted to acute hospitals for DRG 544 are likely to undergo surgical procedures and therefore incur higher costs during the initial hospital stay. The proportion of episode payments for IRF services was also significantly higher for beneficiaries in DRG 544 (10.3 percent of payments overall) compared to beneficiaries in DRG 089 (2.4 percent of payments overall). As presented in section 3.5, approximately 20.0 percent of beneficiaries in DRG 544 had a claim for IRF services compared to less than 3.0 percent of beneficiaries in DRG 089. The proportion of episode payments for readmissions during post-acute episodes was lower for beneficiaries in DRG 544 (7.7 percent of payments overall) compared with beneficiaries in DRG 089 (20.1 percent of payments overall). Over 31.0 percent of beneficiaries in DRG 089 had an acute readmission in their PAC episode compared to 14.0 percent of beneficiaries in DRG 544 (Section 3.5). The differences in service use between the medical and rehabilitation DRGs are reflected in the proportion of total payments attributable to each service type. Overall, DME, hospice, and Therapy (including hospital outpatient therapy and therapy) account for very small proportions of total episode payments in both DRGs due to the lower payments associated with these services during episodes of PAC in comparison to the payments associated with inpatient service use.
Examining episode payments across all beneficiaries in a DRG and severity level, rather than payments by user of the service, is a helpful step in understanding the overall distribution of payments among beneficiaries with similar diagnoses and complexity. While the payments per service type, per user of services, presented in Section 3.5 are also important to understand, the graphic representation of the proportions of total spending by service type in a DRG bring us a step closer to understanding the overall allocation of Medicare spending across services. These analyses may be helpful as we look to consider bundled payment options. The composition of episodes, the definition of episodes, and potential bundling options will be explored further in future work in 2008 and 2009.
3.8.1 Part B Physician Service Utilization within Post-Acute Care Episodes
The pie charts in the previous section showing the distribution of payments for service use within episodes by service type indicate the significant role of physician services within episodes of PAC. The proportion of total episode payments accounted for by physician services varied only slightly across the medical DRG (DRG 089: Simple Pneumonia & Pleurisy Age >17) and the rehabilitative DRG (DRG: Major Joint Replacement or Reattachment of Lower Extremity) and also varied only slightly by severity level. In order to better understand the nature of physician service use, we examined the place of service associated with Part B physician claims using the Berenson-Eggers Type of Service (BETOS) codes on each of the Part B claims. The BETOS codes group HCPCS procedure codes into clinically meaningful categories.
We selected several BETOS categories to answer our questions of where these Part B physician services take place during post-acute episodes. These categories included office visits, hospital visits, nursing home visits, emergency room visits, home visits, inpatient consultations, and outpatient consultations. Note that the consultations were identified using HCPCS codes rather than BETOS codes because BETOS group inpatient and outpatient consultations into one category. Table 3-23 shows the number and proportion of beneficiaries using PAC with each type of visit, the mean number of units and the mean payments associated with visits in each category. In our 2006 episode sample overall, 90.2 percent of beneficiaries had a physician visit in a hospital. Over 68.0 percent had an inpatient consultation, 60.0 percent had an emergency room visit, and 55.0 percent had an office visit sometime during the episode of PAC. The highest payments were associated with physician hospital visits (over $1,100). Though beneficiaries in our sample all had an index acute hospital stay initiating an episode of care, some physician visits related to the hospital service may not be in the counts in the table.14 Note that over half of all beneficiaries had an office visit during their PAC episode indicating ongoing physician care subsequent to an acute hospitalization.
| All 2006 Episodes | N | Percent With Claim | Mean Units of Service | Mean Medicare Payments |
|---|---|---|---|---|
| SOURCE: RTI analysis of 2006 Medicare Claims 5% sample (MM2Y068). | ||||
| Office Visits | 60,631 | 55.5 | 4.0 | $198 |
| Hospital Visits | 98,482 | 90.2 | 20.8 | $1,123 |
| Nursing Home Visits | 45,847 | 42.0 | 5.6 | $295 |
| Emergency Room Visits | 65,664 | 60.1 | 1.8 | $175 |
| Home Visits | 2,410 | 2.2 | 2.8 | $237 |
| Inpatient Consultations | 75,220 | 68.9 | 3.1 | $71 |
| Outpatient Consultations | 14,319 | 13.1 | 1.3 | $157 |
| 2006 Episodes-Index DRG 089 | ||||
| Office Visits | 2,355 | 50.4 | 3.7 | $189 |
| Hospital Visits | 4,570 | 97.8 | 16.4 | $906 |
| Nursing Home Visits | 2,136 | 45.7 | 4.8 | $248 |
| Emergency Room Visits | 3,458 | 74.0 | 1.9 | $171 |
| Home Visits | 94 | 2.0 | 2.8 | $241 |
| Inpatient Consultations | 2,520 | 53.9 | 2.8 | $49 |
| Outpatient Consultations | 486 | 10.4 | 1.3 | $153 |
| 2006 Episodes-Index DRG 544 | ||||
| Office Visits | 7,275 | 47.7 | 2.9 | $134 |
| Hospital Visits | 10,794 | 70.7 | 10.4 | $510 |
| Nursing Home Visits | 5,024 | 32.9 | 4.6 | $243 |
| Emergency Room Visits | 3,615 | 23.7 | 1.5 | $142 |
| Home Visits | 117 | 0.8 | 2.2 | $181 |
| Inpatient Consultations | 8,483 | 55.6 | 2.0 | $27 |
| Outpatient Consultations | 1,078 | 7.1 | 1.2 | $137 |
3.9 Multivariate analysis results
The regression models presented here provide more information on the factors that affect (1) 78 index admission length of stay; (2) use of any PAC services; (3) first site of PAC, (4) readmission to acute hospitals during PAC episodes; and (5) total episode payments. These five models were run using three sets of independent variables. The key differences between these sets of independent variables were the severity measures. In our previous ASPE analyses using the 2005 Medicare claims data, we used the APR-DRG severity measures and these variables were included in one of the sets of independent variables presented here (Set 1). In our work using the 2006 Medicare claims data, we moved to using the MS-DRG severity measures given that CMS policy has adopted the use of MS-DRGs as of FY 2008. The MS-DRGs were included in place of the APR-DRG severity of illness variables in the second set of independent variables (Set 2). MS-DRGs have fewer categories differentiating severity of illness, and for that reason, the third set of independent variables we used included both MS-DRG severity levels and HCCs (Set 3). The HCC variables indicate the presence of the 11 most common comorbid conditions that were present in at least 5.0 percent of the study sample. The adjusted R2, measuring the degree to which the independent variables predict the dependent variable, increased notably with the addition of the 11 HCC variables, indicating the usefulness of the HCCs in addition to the MS-DRGs in predicting the outcome variables. The adjusted R2 in the models predicting total episode payment was 0.1319 in the models using the APR-DRG severity measures, the adjusted R2 decreased to 0.0689 in the models using the MS-DRG, and the adjusted R2 increased to 0.2804 when using both the MS-DRG and the HCC indicator variables. The HCCs provide an opportunity to learn more about the effects of comorbid conditions on the dependent variables of interest.
The results of the regression models are presented in Table 3-24, Table 3-25, and Table 3-26. These three tables contain the regression models predicting index acute admission length of stay, any PAC use, and first site of PAC care for the three sets of independent variables (Sets 1, 2, and 3, respectively). Table 3-27 contains the results for the models predicting readmission during PAC episodes and episode payment for each of the three sets of independent variables.
The results of the binomial and multinomial logits are presented as odds ratios. Values < 1 indicate a negative association; values >1 indicate a positive association. Exponentiated coefficients from the multinomial logistic regression are relative risk ratios. They identify the proportional change in the risk (probability) of discharge to each PAC setting relative to the risk of discharge to hospital outpatient therapy, which is associated with a one-unit change in the explanatory variable. Values < 1 indicate an associated risk reduction. The binomial results represent the average effects across PAC sites while the multinomial model presents the odds of using a particular type of service relative to the odds of using hospital outpatient therapy. This is useful for examining the magnitude of the differences in the probability of admission to one site versus another compared to the average case with a particular beneficiary or market characteristic. The coefficients reported for the ordinary least squares (OLS) model predicting index admission length of stay and episode payments reflect the increase in index admission days and payments for a one-unit change in the independent variable. Positive coefficient values indicate an increase in length of stay or episode payment with increasing values of the independent variable.
| OLS Regression Predicting Index Acute Admission LOS |
Binomial Logit1 Predicting PAC/NoPAC |
Multinomial Logit: Predicting Discharge Destination2 | |||||
|---|---|---|---|---|---|---|---|
| Variable | Coefficient3 | Odds Ratio3 | Home Health Odds Ratio3 |
IRF Odds Ratio3 |
LTCH Odds Ratio3 |
SNF Odds Ratio3 |
|
|
1. Note that the reference group for the binomial logit is No PAC Use. SOURCE: RTI analysis of 2006 Medicare claims 5% sample. |
|||||||
| Intercept | 2.415*** | ||||||
| Demographics | Female | 0.028 | 1.314*** | 1.183*** | 1.282*** | 1.060 | 1.431*** |
| Any Medicaid in 2005 | 0.253*** | 1.415*** | 0.682*** | 0.602*** | 0.988 | 1.333*** | |
| Age 65-744 | 0.026 | 1.645*** | 1.160** | 1.093 | 0.799** | 1.410*** | |
| Age 75-84 | 0.177*** | 2.834*** | 1.449*** | 1.676*** | 1.078 | 3.248*** | |
| Ages 85 + | 0.083** | 5.052*** | 1.247*** | 1.317*** | 0.885 | 4.859*** | |
| Black5 | 0.368*** | 0.977 | 1.123** | 0.978 | 1.458*** | 0.924 | |
| Severity | APR-DRG Severity Index = moderate6 | 1.298*** | 1.776*** | 1.272*** | 1.515*** | 1.804*** | 1.869*** |
| APR-DRG Severity Index = major | 3.966*** | 3.282*** | 1.710*** | 2.376*** | 3.261*** | 3.226*** | |
| APR-DRG Severity Index = extreme | 12.061*** | 7.712*** | 1.691*** | 4.775*** | 5.223*** | 6.376*** | |
| Supply | IRF beds/1,000 beneficiaries/state | -0.050 | 1.021 | 0.752*** | 1.905*** | 0.795** | 0.718*** |
| SNF beds/1,000 beneficiaries/state | -0.001 | 1.000 | 0.975*** | 0.987*** | 0.998*** | 0.999 | |
| LTCH beds/1,000 beneficiaries/state | -0.022 | 1.045*** | 1.333*** | 1.057 | 1.162*** | 1.146*** | |
| Census Division7 | Middle Atlantic | 0.666*** | 0.826*** | 1.069 | 1.104 | 0.991 | 0.845* |
| East North Central | -0.318*** | 0.645*** | 0.629*** | 0.620*** | 1.000 | 0.619*** | |
| West North Central | -0.257*** | 0.544*** | 0.458*** | 0.364*** | 0.651* | 0.361*** | |
| South Atlantic | -0.053 | 0.623*** | 0.710*** | 0.738** | 0.676* | 0.634*** | |
| East South Central | -0.085 | 0.538*** | 0.603*** | 0.799* | 0.931 | 0.550*** | |
| West South Central | 0.009 | 0.462*** | 0.828* | 0.800* | 2.253*** | 0.306*** | |
| Mountain | -0.390*** | 0.548*** | 0.602*** | 0.821 | 1.378 | 0.648*** | |
| Pacific | -0.132* | 0.426*** | 0.720*** | 0.814 | 1.449* | 0.437*** | |
| Organizational Relationships of Discharging Acute Hospital8 | Any Colocated Provider | 0.014 | 1.009 | - | - | - | - |
| Any Subprovider | 0.137*** | 1.008 | - | - | - | - | |
| Any Subprovider IRF | - | - | 1.044 | 1.917*** | 0.874* | 0.815*** | |
| Any Subprovider SNF | - | - | 0.940* | 0.764*** | 0.780*** | 1.183*** | |
| Any Subprovider HHA | - | - | 1.001 | 0.945 | 0.812** | 1.052* | |
| Any Colocated IRF | - | - | 1.275** | 2.265*** | 0.845 | 0.895 | |
| Any Colocated SNF | - | - | 1.085* | 1.022 | 0.988 | 1.142** | |
| Any Colocated HHA | - | - | 0.884* | 0.797** | 0.927 | 0.848** | |
| Any Colocated LTCH | - | - | 0.885** | 0.934 | 1.512*** | 0.742*** | |
| Characteristics of Discharging Acute Hospital | Number of Beds | 0.000*** | 1.000 | - | - | - | - |
| Urban Location9 | 0.346*** | 1.166*** | - | - | - | - | |
| Not-for-profit10 | -0.031 | 1.006 | - | - | - | - | |
| Government run10 | 0.079* | 0.962* | - | - | - | - | |
| Acute DRG11 | DRG 209 Major Joint & Limb Reattachment Procedures of Lower Extremity | -0.239*** | 25.189*** | 1.277*** | 4.411*** | 0.401*** | 1.953*** |
| DRG 089 Simple Pneumonia & Pleurisy Age >17 w CC | -0.244*** | 0.959* | 0.711*** | 0.189*** | 0.375*** | 0.692*** | |
| DRG 014 Specific Cerebrovascular Disorders Except TIA | 0.051 | 4.008*** | 0.562*** | 6.086 | 1.211 | 1.002 | |
| DRG 127 Heart Failure & Shock | -0.199*** | 1.002 | 1.366*** | 0.297** | 0.582 | 0.849** | |
| DRG 210 Hip & Femur Procedures Except Major Joint Age >17 w CC | 0.814*** | 15.395*** | 0.644** | 13.204*** | 2.489*** | 5.155*** | |
| OLS Regression Predicting Index Acute Admission LOS |
Binomial Logit1 Predicting PAC/NoPAC |
Multinomial Logit: Predicting Discharge Destination2 | |||||
|---|---|---|---|---|---|---|---|
| Variable | Coefficient3 | Odds Ratio3 | Home Health Odds Ratio3 |
IRF Odds Ratio3 |
LTCH Odds Ratio3 |
SNF Odds Ratio3 |
|
|
1. Note that the reference group for the binomial logit is No PAC Use. SOURCE: RTI analysis of 2006 Medicare claims 5% sample. |
|||||||
| Intercept | 3.029*** | ||||||
| Demographics | Female | -0.071*** | 1.283*** | 1.161*** | 1.246*** | 0.903* | 1.375*** |
| Any Medicaid in 2005 | 0.374*** | 1.458*** | 0.684*** | 0.598*** | 0.988 | 1.340*** | |
| Age 65-744 | 0.069* | 1.636*** | 1.155** | 1.105 | 0.782** | 1.413*** | |
| Age 75-84 | 0.362*** | 2.916*** | 1.443*** | 1.692*** | 0.999 | 3.283*** | |
| Ages 85 + | 0.400*** | 5.351*** | 1.252*** | 1.313*** | 0.785** | 4.949*** | |
| Black5 | 0.314*** | 0.979 | 1.128** | 0.977 | 1.489*** | 0.923* | |
| Severity6 | MS-DRG Severity Index = CC | 1.828*** | 1.677*** | 1.437*** | 1.485*** | 1.236** | 1.610*** |
| MS-DRG Severity Index = MCC | 4.803*** | 2.659*** | 1.296*** | 1.942*** | 3.695*** | 2.212*** | |
| Supply | IRF beds/1,000 beneficiaries/state | -0.075 | 1.014 | 0.743*** | 1.883*** | 1.437** | 0.790*** |
| SNF beds/1,000 beneficiaries/state | -0.001 | 1.000 | 0.974*** | 0.987*** | 0.979*** | 0.998 | |
| LTCH beds/1,000 beneficiaries/state | -0.034 | 1.039*** | 1.331*** | 1.049 | 1.754*** | 1.151*** | |
| Census Division7 | Middle Atlantic | 0.651*** | 0.828*** | 1.069 | 1.111 | 0.977 | 0.841* |
| East North Central | -0.218*** | 0.670*** | 0.637*** | 0.644*** | 1.064 | 0.631*** | |
| West North Central | -0.237** | 0.560*** | 0.459*** | 0.370*** | 0.684 | 0.362*** | |
| South Atlantic | 0.040 | 0.645*** | 0.706*** | 0.742** | 0.712* | 0.638*** | |
| East South Central | -0.045 | 0.553*** | 0.609*** | 0.816* | 1.009 | 0.559*** | |
| West South Central | 0.095 | 0.480*** | 0.824* | 0.796* | 2.263*** | 0.302*** | |
| Mountain | -0.344*** | 0.567*** | 0.601*** | 0.828 | 1.432 | 0.654*** | |
| Pacific | -0.159* | 0.433*** | 0.714*** | 0.814 | 1.515* | 0.436*** | |
| Organizational Relationships of Discharging Acute Hospital8 | Any Colocated Provider | 0.004 | 1.008 | - | - | - | - |
| Any Subprovider | 0.144*** | 1.007 | - | - | - | - | |
| Any Subprovider IRF | - | - | 1.043 | 1.926*** | 0.909 | 0.824*** | |
| Any Subprovider SNF | - | - | 0.953 | 0.774*** | 0.800*** | 1.191*** | |
| Any Subprovider HHA | - | - | 0.996 | 0.937** | 0.779*** | 1.047 | |
| Any Colocated IRF | - | - | 1.264* | 2.339*** | 0.888 | 0.930 | |
| Any Colocated SNF | - | - | 1.071* | 1.003 | 0.977 | 1.128** | |
| Any Colocated HHA | - | - | 0.888* | 0.803** | 0.927 | 0.860** | |
| Any Colocated LTCH | - | - | 0.870** | 0.925 | 1.588*** | 0.743*** | |
| Characteristics of Discharging Acute Hospital | Number of Beds | 0.001*** | 1.000 | - | - | - | - |
| Urban Location9 | 0.468*** | 1.200*** | - | - | - | - | |
| Not-for-profit10 | 0.008 | 1.020 | - | - | - | - | |
| Government run10 | 0.096** | 0.965* | - | - | - | - | |
| Acute DRG11 | DRG 209 Major Joint & Limb Reattachment Procedures of Lower Extremity | 0.179*** | 25.909*** | 1.314*** | 4.340*** | 0.248*** | 1.955*** |
| DRG 089 Simple Pneumonia & Pleurisy Age >17 w CC | -0.464*** | 0.920*** | 0.675*** | 0.181*** | 0.361*** | 0.668*** | |
| DRG 014 Specific Cerebrovascular Disorders Except TIA | -0.290*** | 3.629*** | 0.519*** | 5.459 | 0.884 | 0.892* | |
| DRG 127 Heart Failure & Shock | -1.050*** | 0.836*** | 1.270*** | 0.257*** | 0.402 | 0.720*** | |
| DRG 210 Hip & Femur Procedures Except Major Joint Age >17 w CC | 0.365*** | 13.455*** | 0.570*** | 11.361** | 1.802*** | 4.382*** | |
| OLS Regression Predicting Index Acute Admission LOS |
Binomial Logit1 Predicting PAC/NoPAC |
Multinomial Logit: Predicting Discharge Destination2 | |||||
|---|---|---|---|---|---|---|---|
| Variable | Coefficient3 | Odds Ratio3 | Home Health Odds Ratio3 |
IRF Odds Ratio3 |
LTCH Odds Ratio3 |
SNF Odds Ratio3 |
|
|
1. Note that the reference group for the binomial logit is No PAC Use. SOURCE: RTI analysis of 2006 Medicare claims 5% sample. |
|||||||
| Intercept | 2.904*** | ||||||
| Demographics | Female | 0.020 | 1.329*** | 1.203*** | 1.27*** | 0.943 | 1.385*** |
| Any Medicaid in 2005 | 0.355*** | 1.301*** | 0.657*** | 0.535*** | 1.044 | 1.266*** | |
| Age 65-744 | -0.024 | 1.799*** | 1.143** | 1.221*** | 0.715*** | 1.46*** | |
| Age 75-84 | 0.126*** | 2.808*** | 1.383*** | 1.526*** | 0.917 | 3.087*** | |
| Ages 85 + | 0.041 | 4.559*** | 1.181*** | 0.989 | 0.719** | 4.248*** | |
| Black5 | 0.413*** | 0.96** | 1.156** | 0.975 | 1.643*** | 0.938 | |
| Severity6,7 | MS-DRG Severity Index = CC | 1.356*** | 1.251*** | 1.259*** | 1.088* | 1.235** | 1.39*** |
| MS-DRG Severity Index = MCC | 3.426*** | 1.698*** | 1.2*** | 1.267*** | 1.926*** | 1.835*** | |
| HCC80: Congestive Heart Failure | 0.553*** | 1.097*** | 1.139*** | 0.809*** | 1.236** | 1.071* | |
| HCC92: Specified Heart Arrhythmias | 0.735*** | 0.995 | 1.213*** | 1.111*** | 1.402*** | 1.159*** | |
| HCC108: Chronic Obstructive Pulmonary Disease | 0.260*** | 1.011 | 1.146*** | 0.815*** | 1.101 | 1.049 | |
| HCC19: Diabetes without Complication | -0.392*** | 1.003 | 1.113** | 1.024** | 0.74*** | 1.04 | |
| HCC131: Renal Failure | 0.752*** | 1.13*** | 0.869*** | 0.791*** | 1.399*** | 0.943 | |
| HCC79: Cardio-Respiratory Failure and Shock | 3.553*** | 1.811*** | 1.111* | 1.58* | 7.461*** | 1.368*** | |
| HCC158: Hip Fracture/Dislocation | 1.282*** | 12.175*** | 0.675*** | 9.939*** | 3.217*** | 4.318*** | |
| HCC105: Vascular Disease | 0.093** | 0.852*** | 1.127* | 0.869* | 1.043 | 0.981 | |
| HCC164: Major Complications of Medical Care and Trauma | 2.700*** | 1.974*** | 1.681*** | 2.326*** | 2.874*** | 1.528*** | |
| HCC96: Ischemic or Unspecified Stroke | 0.730 | 3.465*** | 0.538*** | 5.363*** | 1.983*** | 0.937 | |
| HCC83: Angina Pectoris/Old Myocardial Infarction | -0.802*** | 0.686*** | 1.051 | 0.874 | 0.358*** | 0.761*** | |
| Supply | IRF beds/1,000 beneficiaries/state | -0.137** | 1.002 | 0.739*** | 1.885*** | 1.45** | 0.768*** |
| SNF beds/1000 beneficiaries/state | -0.002 | 1 | 0.974*** | 0.987*** | 0.977*** | 0.998 | |
| LTCH beds/1000 beneficiaries/state | -0.002 | 1.003** | 1.338*** | 1.057 | 1.878*** | 1.162*** | |
| Census Division8 | Middle Atlantic | 0.720*** | 0.793*** | 1.078 | 1.073 | 1.075 | 0.841** |
| East North Central | -0.240*** | 0.673*** | 0.643*** | 0.665*** | 1.08 | 0.636*** | |
| West North Central | -0.233** | 0.582*** | 0.47*** | 0.385*** | 0.69 | 0.37*** | |
| South Atlantic | -0.027 | 0.646*** | 0.725*** | 0.76** | 0.697* | 0.645*** | |
| East South Central | -0.073 | 0.554*** | 0.62*** | 0.822* | 0.997 | 0.561*** | |
| West South Central | 0.102 | 0.489*** | 0.842* | 0.813* | 2.362*** | 0.304*** | |
| Mountain | -0.444*** | 0.588*** | 0.616*** | 0.859 | 1.279 | 0.663*** | |
| Pacific | -0.190** | 0.461*** | 0.741** | 0.862 | 1.541* | 0.443*** | |
| Organizational Relationships of Discharging Acute Hospital9 | Any Colocated Provider | 0.007 | 1.006 | - | - | - | - |
| Any Subprovider | 0.135*** | 0.996 | - | - | - | - | |
| Any Subprovider IRF | - | - | 1.042 | 1.968*** | 0.901* | 0.829*** | |
| Any Subprovider SNF | - | - | 0.953 | 0.769*** | 0.784*** | 1.185*** | |
| Any Subprovider HHA | - | - | 0.991 | 0.916** | 0.773*** | 1.036 | |
| Any Colocated IRF | - | - | 1.258* | 2.349*** | 0.829 | 0.928 | |
| Any Colocated SNF | - | - | 1.073* | 1.014 | 0.982 | 1.132** | |
| Any Colocated HHA | - | - | 0.885* | 0.802** | 0.947 | 0.862** | |
| Any Colocated LTCH | - | - | 0.863** | 0.935 | 1.556*** | 0.743*** | |
| Characteristics of Discharging Acute Hospital | Number of Beds | 0.001*** | 1.000** | ||||
| Urban Location10 | 0.415*** | 1.209*** | |||||
| Not-for-profit11 | -0.034 | 1.013 | |||||
| Government run11 | 0.072* | 0.933*** | |||||
| Binomial Logit Regressions Predicting Readmission |
OLS Regressions Predicting Episode Payments |
||||||
|---|---|---|---|---|---|---|---|
| Variable | Set 1 APR-DRG |
Set 2 MS-DRG |
Set 3 MS-DRGs and HCCs |
Set 1 APR-DRG |
Set 2 MS-DRG |
Set 3 MS-DRGs and HCCs |
|
|
1. Significance * p<0.05. ** p<0.01, *** p<0.0001. SOURCE: RTI analysis of 2006 Medicare claims 5% sample. |
|||||||
| Demographics | Female | 0.889*** | 0.878*** | 0.924*** | -688*** | -950*** | -411*** |
| Any Medicaid in 2005 | 1.071*** | 1.085*** | 1.152*** | 1,464*** | 1,902*** | 1,616*** | |
| Age 65-742 | 0.856*** | 0.861*** | 0.882*** | 2,131*** | 2,090*** | 1,907*** | |
| Age 75-84 | 0.962 | 0.973 | 1.025 | 3,138*** | 3,541*** | 2,563*** | |
| Ages 85 + | 0.967 | 0.992 | 1.12*** | 2,825*** | 3,689*** | 1,838*** | |
| Black3 | 1.159*** | 1.157*** | 1.127*** | 1,272*** | 1,273*** | 1,452*** | |
| Severity | APR-DRG Severity Index = moderate4 | 1.412*** | 3,896*** | ||||
| APR-DRG Severity Index = major | 1.872*** | 11,389*** | |||||
| APR-DRG Severity Index = extreme | 1.916*** | 36,537*** | |||||
| MS-DRG Severity index = CC5 | 1.212*** | 1.293*** | 4,632*** | 2,217*** | |||
| MS-DRG Severity index = MCC | 1.391*** | 1.387*** | 11,995*** | 6,313*** | |||
| Supply | IRF beds/1,000 beneficiaries/state | 0.961 | 0.972 | 0.968 | -1,555*** | -1,649*** | -1,862*** |
| SNF beds/1,000 beneficiaries/state | 0.998 | 0.999 | 1 | -26* | -26** | -32*** | |
| LTCH beds/1,000 beneficiaries/state | 1.040* | 1.033* | 1.021 | 1,044 | 979*** | 1,088*** | |
| Census Division6 | Middle Atlantic | 1.160** | 1.142* | 1.112* | 841** | 806* | 911** |
| East North Central | 1.163** | 1.162*** | 1.108* | -2,065*** | -1,727*** | -1,840*** | |
| West North Central | 1.075 | 1.069 | 1.076 | -3,619*** | -3,510*** | -3,494*** | |
| South Atlantic | 1.014 | 1.022 | 0.988 | -3,242*** | -2,907*** | -3,159*** | |
| East South Central | 1.172** | 1.181* | 1.073 | -3,388*** | -3,226*** | -3,388*** | |
| West South Central | 1.307** | 1.281*** | 1.145** | -1,453*** | -1,147*** | -1,229*** | |
| Mountain | 0.927 | 0.934 | 0.961 | -2,215*** | -1,995*** | -2,264*** | |
| Pacific | 0.911 | 0.911* | 0.9** | -1,645*** | -1,690*** | -1,736*** | |
| Organizational Relationships of Discharging Acute Hospital7 | Any Colocated Provider | 0.985 | 0.982 | 1.006 | 340** | 332** | 348** |
| Any Subprovider | 0.971 | 0.966* | 0.973* | 392*** | 412*** | 346** | |
| Characteristics of Discharging Acute Hospital | Number of Beds | 1.000 | 1.000* | 1.000* | 3*** | 4*** | 3*** |
| Urban Location8 | 1.066* | 1.075*** | 1.035* | 3,757*** | 4,221*** | 4,105*** | |
| Not-for-profit9 | 0.930** | 0.936* | 0.94** | -499*** | -344* | -497*** | |
| Government run9 | 0.961 | 0.961 | 0.988 | 208 | 262 | 75 | |
| IndexLOS | 1.026*** | 1.031*** | 1.033*** | ||||
| Acute DRG10 | DRG 209 Major Joint & Limb Reattachment Procedures of Lower Extremity | 0.421*** | 0.436*** | 8,022*** | 8,968*** | ||
| DRG 089 Simple Pneumonia & Pleurisy Age >17 w CC | 0.944 | 0.955 | -5,465*** | -5,827*** | |||
| DRG 014 Specific Cerebrovascular Disorders Except TIA | 1.015 | 0.992 | 7,726*** | 6,972*** | |||
| DRG 127 Heart Failure & Shock | 1.605*** | 1.525*** | -2,390*** | -4,495*** | |||
| DRG 210 Hip & Femur Procedures Except Major Joint Age >17 w CC | 0.931 | 0.902* | 17,130*** | 16,164*** | |||
| Comorbid Conditions11 | HCC80: Congestive Heart Failure | 1.287*** | 2,523*** | ||||
| HCC92: Specified Heart Arrhythmias | 1.16*** | 2,577*** | |||||
| HCC108: Chronic Obstructive Pulmonary Disease | 1.241*** | -614*** | |||||
| HCC19: Diabetes without Complication | 1.109*** | -126 | |||||
| HCC131: Renal Failure | 1.255*** | 2,784*** | |||||
| HCC79: Cardio-Respiratory Failure and Shock | 0.999 | 14,900*** | |||||
| HCC158: Hip Fracture/Dislocation | 1.003 | 16,707*** | |||||
| HCC105: Vascular Disease | 1.187*** | 1,544*** | |||||
| HCC164: Major Complications of Medical Care and Trauma | 0.98 | 12,604*** | |||||
| HCC96: Ischemic or Unspecified Stroke | 1.143*** | 10,675*** | |||||
| HCC83: Angina Pectoris/Old Myocardial Infarction | 1.998 | -1,026*** | |||||
| First PAC Setting12 | SNF | 1.214 | 1.232*** | 7.043*** | |||
| LTCH | 1.196** | 1.299*** | 7.917*** | ||||
| HHA | 1.227 | 1.234*** | 7.464*** | ||||
| IRF | 1.357 | 1.356*** | 7.557*** | ||||
3.9.1 Ordinary Least Squares Regression Predicting Index Admission Length of Stay
The results of the models predicting index admission length of stay highlight the importance of severity measures (Table 3-24, Table 3-25, and Table 3-26). The results using independent variable Set 1 with the APR-DRG severity measures (Table 3-24) indicate that beneficiaries in APR-DRG severity level 4 (extreme severity) have a mean length of stay that is 12.1 days longer than that of beneficiaries in the lowest APR-DRG severity level. Similarly, in looking at the regression model predicting index admission length of stay using the MS-DRG severity measures (Set 2, Table 3-25) beneficiaries in the MS-DRG MCC severity level had a length of stay 4.8 days longer than that of beneficiaries in the MS-DRG No CC level. When the HCCs were added to the multivariate models as severity measures (Set 3, Table 3-26), we see that after controlling for MS-DRG severity levels, beneficiaries with particular comorbid conditions are likely to have longer lengths of stay in the acute setting. For example, beneficiaries with HCC 79 Cardio-Respiratory Failure and Shock have an index admission length of stay 3.6 days longer than that of beneficiaries without this HCC.
Indicator variables for acute DRGs were included in independent variable Sets 1 and 2 (Note that these variables were not included in Set 3 because of the high degree of correlation between the DRG and HCC indicators). In Set 1, only beneficiaries with DRG 210 had significantly longer length of stay (Table 3-24). Beneficiaries admitted to acute hospitals for DRG 209, DRG 089, and DRG 127 had shorter lengths of stay compared to those of beneficiaries admitted for other diagnoses. The results from Set 2 showed that both beneficiaries in DRGs 209 and 210 had significantly longer index admission lengths of stay than those of beneficiaries in other DRGS (Table 3-25).
The impact of age on index admission length of stay varied across the sets of independent variables. When using the APR-DRG severity measures and the MS-DRG severity measures (Sets 1 and 2, Table 3-24 and Table 3-25), increasing age was associated with increasing index admission lengths of stay. However, when using the MS-DRG and HCCs (Set 3, Table 3-26), only the coefficient on the age 75 to 84 variable was significant indicating that beneficiaries in this age group had a length of stay 0.13 days longer than that of beneficiaries younger than 65.
Results of the impact of census region was similar across models; beneficiaries in the Middle Atlantic had slightly longer index admission lengths of stay compared with beneficiaries in New England. Beneficiaries from the East North Central, West North Central, Mountain, and Pacific census division had shorter index admission lengths of stay than did those in New England. Since the models controlled for patient differences, this seems to reflect local practice pattern differences.
Supply of services did not have a significant effect on index admission length of stay with the exception of the supply of IRF beds using independent variable Set 3 (Table 3-26). In this model, an increase in supply of IRF beds was associated with a shorter index admission length of stay. In looking at the characteristics of the acute hospitals, both urban location and government-run hospitals were associated with longer index admission length of stay.
Across all three sets of independent variables, the presence of any PAC subprovider was associated with an increase in index admission length of stay. For example, in the results using independent variable Set 3 (Table 3-26), beneficiaries discharged from an acute hospital with any PAC subprovider had index admission lengths of stay that were 0.135 days longer than those of beneficiaries discharged from acute hospitals without subproviders. The presence of any colocated post-acute provider was not significant in predicting index admission length of stay.
3.9.2 Binomial Logit Regression Predicting Use of Post-Acute Care
As in the model predicting index acute admission length stay, severity measures were important factors in predicting the use of any PAC services. The odds of using any post-acute care services increased with increasing severity level across each set of severity measures. In the case of APR-DRGs (Set 1, Table 3-24), for beneficiaries in APR-DRG level 4 (extreme severity), the odds of using any PAC were 7.7 times the odds for beneficiaries in the lowest severity level. The odds of using any PAC were also higher for beneficiaries with MS-DRG with MCC (OR=2.7) and with CC (OR=1.7) compared with beneficiaries without CCs (Set 2, Table 3-25).
In Set 3 (Table 3-27), the magnitude of the odds ratios were smaller on the MS-DRG variables compared to Set 2 (w MMC OR=1.7; w CC OR=1.3), but the direction was the same indicating increasing odds of PAC use with increasing severity. In this model, many of the HCC measures also increased the odds of using any PAC services. For example, beneficiaries with HCC96 Ischemic or Unspecified Stroke had 3.5 times the odds of using PAC compared beneficiaries without this HCC. In the models without the HCC indicators (Set 1, Table 3-25, and Set 2, Table 3-26), the DRG indicator variables demonstrated similar results. The odds of using any PAC service were significantly higher for beneficiaries with index acute hospital admission for DRGs 209, 210, and 014.
Age was another significant factor in these models. Increasing age was associated with higher odds of PAC use. For example, in the model run using APR-DRG severity measures (Set 1, Table 3-25), the odds of using any PAC for beneficiaries aged 75-84 were 2.8 times the odds for beneficiaries less than age 65 and the odds increased to 5.1 for beneficiaries aged 85 and older. Similar patterns were observed across the independent variable sets.
The census region variables were each significant across the models indicating that the odds of using any PAC services were lower in each region compared to odds of PAC use in New England. The only supply variable that was significant across the models was the supply of LTCH beds/1,000 beneficiaries. Higher numbers of LTCH beds per beneficiary was associated with a slight increase in the odds of any PAC use.
The odds of PAC use were approximately 20.0 percent higher for beneficiaries discharged from hospitals located in urban areas compared with nonurban areas (OR=1.21 in Set 3, Table 3-26). Beneficiaries discharged from government-run hospitals were slightly less likely to use PAC compared with other beneficiaries (OR=0.93 in Set 3, Table 3-26).
The organizational relationship variables in this model were not significant indicating that the presence of any colocated post-acute providers or post-acute subproviders does not affect the odds of using PAC.
3.9.3 Multinomial Logit Predicting First Site of Post-Acute Care
The effect of severity on first site of PAC demonstrates that the odds of discharge to IRFs, LTCHs, and SNFs are much higher compared to the odds of discharge to hospital outpatient therapy or home health for beneficiaries of higher severity. For example, in the multinomial model run using the APR-DRG severity measures (Set 1, Table 3-24), the odds of discharge to LTCH for beneficiaries in APR-DRG severity level 4 (extreme) were 5.2 times the odds of discharge to hospital outpatient therapy. Using the APR-DRG severity levels variables, it is clear that the odds of discharge to inpatient post-acute settings increases with increasing severity. While similar patterns are observed in using MS-DRG severity measures (Set 2, Table 3-25), and MS-DRG and HCCs as severity measures (Set 3, Table 3-26), the magnitude of the odds ratios in these models were not as large. The model using the MS-DRG and HCC severit measures (Table 3-26), does highlight the role of particular HCCs in predicting first site of PAC. For example, the odds of discharge to IRFs for beneficiaries with HCC 158 Hip Fracture/Dislocation are 9.9 times the odds of beneficiaries without this HCC due to the rehabilitative services that these patients often require. Beneficiaries with HCC 79 Cardio-Respiratory Failure and Shock had 7.5 times the odds of being discharged to LTCHs compared with beneficiaries without this HCC and this may reflect the medical complexity of these patients.
Patterns of the effect of age varied across models and by first site of PAC (Tables 3-24, 3-25, and 3-26). Across all models, the odds of being discharged to SNFs increased with increasing age. Also across all models, the odds of being discharged to HHAs were lower for beneficiaries aged 85 or older compared with the odds for beneficiaries aged 75-84, indicating that these oldest beneficiaries may be more likely to be discharged directly to inpatient PAC following an inpatient stay.
The findings from the organizational variables indicate that organizational relationships do have some effect on the first site of care for beneficiaries discharged to PAC. In the models using the APR-DRG severity measures (Set 1, Table 3-24), we found that for beneficiaries discharged from an acute hospital with an IRF subprovider, the odds of being discharged to an IRF were 1.9 times the odds of being discharged to outpatient therapy. Similarly, for beneficiaries discharged from an acute with a colocated IRF, the odds of discharge to IRF were 2.3 times the odds of discharge to outpatient therapy. Similar results were seen across the models (Table 3-25 and Table 3-26). The organizational relationship variables also indicated increases in the odds of discharge to SNF for beneficiaries discharged from providers with SNF subproviders or colocated SNFs and an increase in odds of discharge to LTCH for beneficiaries discharged from acute hospitals with colocated LTCHs. The presence of organizationally related home health agencies did not increase the likelihood of discharge to HHA.
3.9.4 Binomial Logit Regression Predicting Readmission During Post-Acute Care Episodes
As in the other models, severity is an important predictor of acute hospital readmission during PAC episodes. The odds of readmission increase with increasing severity. In the binomial logit model using both the MS-DRG severity measures and the HCCs (Set 3, Table 3-27), the odds of readmission for beneficiaries with MS-DRG w/MCC are 1.4 times the odds of readmission for beneficiaries without CCs. The odds of readmission are also higher for beneficiaries with particular HCCCs. The odds of readmission for beneficiaries with HCC80 Congestive Heart Failure are 1.3 times those for beneficiaries without this HCC.
The odds of readmission during a PAC episode also varied by demographic characteristics. The odds of readmission were higher for older beneficiaries, for beneficiaries enrolled in Medicaid, and for non-white beneficiaries. The post-acute care supply variables were not significant predictors of readmission. In looking at geography, there were very few significant differences compared to the New England region. In looking at the binomial model using the MS-DRG severity measure and the HCCs, the odds of readmission were significantly higher in the Middle Atlantic (OR=1.112) and the West South Central (OR=1.145) compared to New England. The beneficiary's index admission length of stay was also a significant predictor of readmission in this model (OR=1.033) (Set 3, Table 3-27).
Another interesting finding to note in this regression is related to the organizational relationship variables. The odds of readmission for beneficiaries discharged to colocated providers are not significantly different from those for other beneficiaries. Using the MS-DRG severity measure and the HCCs (Sets 2 and 3, Table 3-27), we found that the odds of being readmitted during a PAC episode was slightly lower than for other beneficiaries.
3.9.5 Ordinary Least Squares Regression Predicting Post-Acute Care Episode Payment
In the regression predicting PAC episode payments, increasing severity is associated with increases in episode payments. For example, in the model using MS-DRG severity measures and HCCs (Set 3, Table 3-27), beneficiaries with MS-DRG w/MCC have $6,313 higher episode payments compared to beneficiaries in the lowest severity level. The magnitude of the impact of particular comorbid conditions is also demonstrated in looking at the coefficients for the HCC variables in this model Beneficiaries with HCC 158 Hip Fracture/Dislocation and HCC 79 Cardio-Respiratory Failure and Shock were associated with the largest increases in episode payments. These conditions may be proxy measures for frailty or other unmeasured signs of general decline.
Increasing age was associated with increasing episode payments except for beneficiaries aged 85 or older. Female beneficiaries were associated with lower episode payments and beneficiaries on Medicaid had higher episode payments. Across the models, episode payments were lower for all census regions than for New England with the exception of the Middle Atlantic. Across all models the presence of a colocated post-acute provider or a post-acute subprovider was associated with increases in episode payments.
4. Discussion
4.1 Implications of the Findings
These analyses provide important information for understanding who uses PAC services, how their likelihood of using them differs by certain characteristics, and which factors are most important in predicting hospital length of stay, probability of PAC use, relative probability of PAC site of care choices, hospital readmission rates, and average episode payments. Age and severity of illness factors were important in all the models.
In this work, we tested several measures of severity, including the APR-DRGs which assign severity levels based on having certain comorbid conditions; MS-DRGs which match specific primary and secondary conditions to assign a severity level; and HCC indicators of comorbid conditions. These three methods varied in their explanatory power although the models that explained the most variation in payments (Table 3-27) included both the MS-DRG and the HCC flags (28.0 percent explained variance compared to 13.0 percent for the APR-DRG and 6.8 percent for the MS-DRG-based models). Individual HCC flags varied in their impact on length of stay. Certain comorbid conditions, such as cardio-respiratory failure and shock and major complication of medical care and trauma had much larger effects than other conditions such as vascular disease (Table 3-26).
Severity of illness was important for predicting expected length of stay in the acute hospital prior to PAC use. Greater severity was associated with longer length stay, as expected, regardless of measure used. The APR-DRG model (Table 3-24) had the greatest explanatory power in these models, explaining almost 22.0 percent of the variation in hospital LOS. The MS-DRG models (Table 3-24) explained 11.0 percent of the variation but this increased to 17.0 percent when the HCC flags were added. It was also important for explaining the probability of PAC use and the type of PAC service used. Patients with higher severity scores were more likely to use LTCHs, followed by SNFs, then IRFs, and last home health services relative to outpatient therapy services.
Organizational relationships were also important for predicting use. Having a subprovider was associated with having longer acute lengths of stay suggesting that PAC units are more commonly associated with hospitals treating sicker populations. We also found greater likelihoods of using a type of PAC if the hospital had a subprovider or co-located PAC provider of that type. For example, the model showed a greater likelihood of using IRFs if the hospital has a subprovider or co-located IRF. Having a particular type of subprovider appeared to be related to the use of that provider type, with the exception of home health. SNF effects were lower than IRF or LTCH and this may be due to the availability of these providers.
Severity and organizational relationships were important for predicting readmission rates and average episode payments. The probability of readmission increased as severity increased and having a subprovider was negatively associated with readmission rates. For example, the results of the binomial regressions predicting readmission using the MS-DRG severity measures and HCCs (Set 3, Table 3-27) indicated that the odds ratio on the MS-DRG severity CC variable was 1.293 and the odds ratio on the MS-DRG severity MCC variable was 1.387 demonstrating increasing odds of readmission with increasing severity compared to beneficiaries with MS-DRG severity w/o CC. In looking at the subprovider variable in the same model, beneficiaries discharged from an acute hospital with any subprovider had 0.973 times the odds of readmission compared to beneficiaries discharged from an acute hospital without any subprovider. The odds ratio on the variable indicating the presence of any colocated provider was not statistically significant. Both factors severity and organizational relationships were also significantly associated with episode payments; as severity increased, so did the average payment per episode. Similarly, average episode payments were higher for beneficiaries treated in hospitals with PAC providers. This may reflect different resource mixes of the hospitals or reflect higher likelihood of using subproviders where they exist, all else equal.
These analyses provide a useful insight into the role of comorbid conditions in PAC utilization, the impact of patient severity as measured by both the APR-DRG and the MS-DRG on patterns of PAC use, and a more complete view of a beneficiary's total cost of care within in an episode, given the addition of the Part B, DME, and hospice data to this year's analyses. Another important contribution of this effort is the examination of the role of organizational relationships beyond first site of PAC care. Although previous work focused exclusively on the relationship between acute settings and first site of PAC, this work also looked at the effect of the presence of organizational relationships between providers across multiple settings of PAC settings.
While this information is useful for predicting episode use and payment variation, this work has also been helpful in considering the patterns of care in the Medicare program and how the mix of services may vary depending on the patients' complexity and the resources available in their local market area. The pattern analysis discussed in Section 3.7 helps us understand the way services are combined to treat individual patients. Of the 35.2 percent of hospital discharges to PAC, 52.0 percent of them go on to use additional services after the first PAC site. The episode payments and length of stay vary extensively depending on the extent to which higher cost institutional services are part of the episode or longer lasting, ambulatory services, such as home health or outpatient therapy. As shown in Figure 3-3, among the most common PAC discharge group (SNFs which admitted 41.0 percent of PAC users), average payment per episode was $8,759 but ranged from additional amounts of $3,544 for discharge to home health to an additional $29,118 for cases discharged from the SNF to LTCHs. Further, seeing how these patterns varied for medical versus rehabilitation cases was also useful for considering expected care trajectories and costs.
Analysis of the physician's role will also be important. The physician is a key player in the Medicare program, yet often PAC populations have numerous physicians involved. First, the patient's primary care provider typically sent them to the hospital. Once there, they may be seen by an emergency room physician, a hospitalist, or a surgeon. If they are discharged to PAC, they will be seen by yet another set of physicians, and depending on the type of setting, possibly more than one physician, including physiatrists, pulmonologists, infectious disease specialists, internists, and many others. Information about their various treatments may or may not go back to their primary care physician.
The data presented in Section 3.8 helps us begin to understand the physician's role in an episode of care. More work is needed on this to explore the number of physicians and place and timing of interventions across an episode of care, and further, how these may vary by different types of patients (those with different conditions or at different levels of severity of illness).
The results of the analyses in this report demonstrate the importance of understanding case complexity, particularly the patient's medical complexity. Second, comorbidity plays an important role in understanding expected costs and use, since both the type of comorbidity (as measured using the HCCs) and the number of comorbidities affect PAC utilization. We observed that the episode payments and length of stay increased with increasing numbers of comorbidities. In looking at the presence of selected comorbidities by themselves, and then in combination, we also saw a noticeable increase in episode payments in beneficiaries with combinations of selected HCCs. These analyses provide a baseline understanding of how comorbidities may affect episodes of PAC. These issues will be explored further in future work as we consider the use of the Chronic Condition Warehouse data and alternative definitions of post-acute episodes in the coming year.
The use of the MS-DRG severity measures in this year's work provided an opportunity to learn more about the severity definitions in the MS-DRGs and provided good information on ways to improve its usefulness in stratifying patients based on severity. The addition of the HCC flags was helpful for considering a person's constellation of conditions which may be complicating the use of any one service. The analyses also compared the effects of the two condition-specific severity measures. While the MS-DRGs have fewer severity levels, the two methodologies are not directly comparable. The MS-DRG system bases complexity on a condition-specific number of complicating levels while the APR-DRG system assigns severity based on the presence of specific comorbid conditions. Despite these differences in measures, both systems showed the same basic patterns of longer length episodes and higher payments being associated with more complicated MS-DRG and APR-DRG levels. The inclusion of the HCC indicator variables in the multivariate models using the MS-DRG severity measure allowed for a more specific understanding of the role of comorbidity and severity on post-acute care utilization.
The inclusion of the Part B, DME, and hospice claims in this year's episode files was a major advancement in the post-acute care analysis. Previous analyses have focused solely on the inpatient post-acute, home health, and hospital outpatient therapy settings of care, but as the results of the analyses indicate, Part B physician services are an important component of overall post-acute care payments. Across DRGs and severity levels, Part B physician services accounted for over 11.9 percent of total episode payments (Figure 3-8). Again, this work serves as a base to further work looking into physician utilization during post-acute care episodes. Of particular interest is the point at which these services occur during the post-acute episode. Do they occur primarily during the index acute hospitalization or are they follow-up visits? What types of physician specialists are treating beneficiaries in the different DRGs? Are the visits related to the index DRG or are they unrelated? These questions will be the basis of future work in this area.
Last year's report on post-acute care episodes focused on the presence of organizational relationships and the effects of organizational relationships on discharge to first site of PAC, readmission to PAC, index admission length of stay, and any post-acute use. In recognition of the fact that episodes of post-acute care are complex and often involve more than one site of care, this year's work attempted to learn more about the relationships between providers within post-acute care episodes with multiple providers. The analysis of episode patterns including acute index hospitalization, SNF, and HHA claims (episode pattern=ASH); and episodes including acute index hospitalization, IRF, and HHA claims (episode pattern=AIH) demonstrated that episodes occurring within sets of related providers were more likely to have lower episode lengths of stay and payments, after controlling for beneficiary demographics and severity. This finding suggests that there are differences in patterns of utilization for beneficiaries receiving care within providers with formal and informal organizational relationships.
4.2 Next Steps
The results of the current work will feed directly in to work we will be completing as part of a contract modification. The additional work will include use of the CCW data to identify the presence of chronic conditions in beneficiaries in our 2006 episode file. Similar to some of the analyses presented in this report, we will look at the patterns of use and expenditures associated with beneficiaries with chronic conditions and with multiple chronic conditions. The CCW methodology includes flagging a beneficiary as ever having a chronic condition. This definition is more comprehensive than our limited application of the HCCs to the index acute admission claims.
Work under the contract modification will also include analyses of alternative episode definitions including fixed and variable length episodes and episodes initiating without an index acute admission. This work will serve as the basis of exploring potential episode-based payment or bundling options and will build on some of the episode composition work presented here.
5. References
Berenson, R. 2004. The Medicare Chronic Improvement Program. Retrieved August 2008 from http://www.urban.org/publications/900714.html
Buntin MB, AD Garten, S Paddock, D Saliba, M Totten, and JJ Escarce. 2005. How much is postacute care use affected by its availability? Health Serv. Res., 40(2): 413-34.
CDC (Centers for Disease Control and Prevention), 2008. NCHS Data Definitions.
CDC (Centers for Disease Control and Prevention), 1999. Chronic Disease Overview: Causes of Death in the United States. Retrieved August 2008 from: http://www.cdc.gov/nccdphp/
Gage B, N Pilkauskas, K Dalton, R Constantine, M Leung, S Hoover, J Green. 2007. Long-term care hospital (LTCH) payment system monitoring and evaluation. Phase II Report prepared for Centers for Medicare & Medicaid Services.
Hoffman C, D Rice, and HY Sung. 1996. Persons with chronic conditions: Their prevalence and costs. JAMA, 276(18): 1473-1479.
Mark TL, Ozminkowski RJ, Kirk A, Ettner SL, Drabek J. 2003. Risk adjustment for people with chronic conditions in private sector health plans. Medical Decision making, 23(5): 397-405.
Medicare Payment Advisory Commission. A Data Book: Healthcare Spending and the Medicare Program, June 2008. Retrieved November 2008 from http://medpac.gov/documents/Jun08DataBook_Entire_report.pdf
Noyes K, H Liu, and H Temkin-Greener. 2006. Cost of caring for Medicare beneficiaries with Parkinson's disease: impact of the CMS-HCC risk-adjustment model. Disease Management, 9(6): 339-348.
Pope GC, J Kautter, RP Ellis, et al. 2004. Risk adjustment of Medicare capitation payments using the CMS-HCC model. Health Care Financing and Review, 25(4): 119-141.
Thrall JH. 2005. Prevalence and costs of chronic disease in a health care system structured for treatment of acute illness. Radiology, 235(1): 9-12.
Wynn, B. 2007. Understanding Medicare Severity DRGs. Retrieved August 2008 from: http://www.fha.org/acrobat/FAMCPAMPresentations/UnderstandingMSDRGsBarbaraWynn.pdf
Wynn B and M. Scott. July 2007. Evaluation of Severity-Adjusted DRG Systems: Addendum to the Interim Report. http://www.rand.org/pubs/working_papers/2007/RAND_WR434.1.pdf
Appendix A
| HHC | Label |
|---|---|
| HCC1 | HIV/AIDS |
| HCC2 | Septicemia/Shock |
| HCC5 | Opportunistic Infections |
| HCC7 | Metastatic Cancer and Acute Leukemia |
| HCC8 | Lung, Upper Digestive Tract, and Other Severe Cancers |
| HCC9 | Lymphatic, Head and Neck, Brain, and Other Major Cancers |
| HCC10 | Breast, Prostate, Colorectal and Other Cancers and Tumors |
| HCC15 | Diabetes with Renal or Peripheral Circulatory Manifestation |
| HCC16 | Diabetes with Neurologic or Other Specified Manifestation |
| HCC17 | Diabetes with Acute Complications |
| HCC18 | Diabetes with Ophthalmologic or Unspecified Manifestation |
| HCC19 | Diabetes without Complication |
| HCC21 | Protein-Calorie Malnutrition |
| HCC25 | End-Stage Liver Disease |
| HCC26 | Cirrhosis of Liver |
| HCC27 | Chronic Hepatitis |
| HCC31 | Intestinal Obstruction/Perforation |
| HCC32 | Pancreatic Disease |
| HCC33 | Inflammatory Bowel Disease |
| HCC37 | Bone/Joint/Muscle Infections/Necrosis |
| HCC38 | Rheumatoid Arthritis and Inflammatory Connective Tissue Dise |
| HCC44 | Severe Hematological Disorders |
| HCC45 | Disorders of Immunity |
| HCC51 | Drug/Alcohol Psychosis |
| HCC52 | Drug/Alcohol Dependence |
| HCC54 | Schizophrenia |
| HCC55 | Major Depressive, Bipolar, and Paranoid Disorders |
| HCC67 | Quadriplegia, Other Extensive Paralysis |
| HCC68 | Paraplegia |
| HCC69 | Spinal Cord Disorders/Injuries |
| HCC70 | Muscular Dystrophy |
| HCC71 | Polyneuropathy |
| HCC72 | Multiple Sclerosis |
| HCC73 | Parkinson's and Huntington's Diseases |
| HCC74 | Seizure Disorders and Convulsions |
| HCC75 | Coma, Brain Compression/Anoxic Damage |
| HCC77 | Respirator Dependence/Tracheostomy Status |
| HCC78 | Respiratory Arrest |
| HCC79 | Cardio-Respiratory Failure and Shock |
| HCC80 | Congestive Heart Failure |
| HCC81 | Acute Myocardial Infarction |
| HCC82 | Unstable Angina and Other Acute Ischemic Heart Disease |
| HCC83 | Angina Pectoris/Old Myocardial Infarction |
| HCC92 | Specified Heart Arrhythmias |
| HCC95 | Cerebral Hemorrhage |
| HCC96 | Ischemic or Unspecified Stroke |
| HCC100 | Hemiplegia/Hemiparesis |
| HCC101 | Cerebral Palsy and Other Paralytic Syndromes |
| HCC104 | Vascular Disease with Complications |
| HCC105 | Vascular Disease |
| HCC107 | Cystic Fibrosis |
| HCC108 | Chronic Obstructive Pulmonary Disease |
| HCC111 | Aspiration and Specified Bacterial Pneumonias |
| HCC112 | Pneumococcal Pneumonia, Emphysema, Lung Abscess |
| HCC119 | Proliferative Diabetic Retinopathy and Vitreous Hemorrhage |
| HCC130 | Dialysis Status |
| HCC131 | Renal Failure |
| HCC132 | Nephritis |
| HCC148 | Decubitus Ulcer of Skin |
| HCC149 | Chronic Ulcer of Skin, Except Decubitus |
| HCC150 | Extensive Third-Degree Burns |
| HCC154 | Severe Head Injury |
| HCC155 | Major Head Injury |
| HCC157 | Vertebral Fractures without Spinal Cord Injury |
| HCC158 | Hip Fracture/Dislocation |
| HCC161 | Traumatic Amputation |
| HCC164 | Major Complications of Medical Care and Trauma |
| HCC174 | Major Organ Transplant Status |
| HCC176 | Artificial Openings for Feeding or Elimination |
| HCC177 | Amputation Status, Lower Limb/Amputation Complications |
Appendix B
| APR-DRG Severity of Illness Level | |||||||||||||||||
|---|---|---|---|---|---|---|---|---|---|---|---|---|---|---|---|---|---|
| DRG | N | % with Claim |
Mean Use |
Mean Payment |
N | % with Claim |
Mean Use |
Mean Payment |
N | % with Claim |
Mean Use |
Mean Payment |
N | % with Claim |
Mean Use |
Mean Payment |
|
| 544 | Major Joint and Limb Reattachment Procedures of Lower Extremity (N=12,970) | APR-DRG 1 N=4,133 |
APR-DRG 2 N=5,999 |
APR-DRG 3 N=2,726 |
APR-DRG 4 N=112 |
||||||||||||
| Total Episode Days (Index Admission Days + PAC days) | 4,133 | 31.9* | 59.0 | $18,288 | 5,999 | 46.3* | 64.9 | $21,428 | 2,726 | 21.0* | 70.0 | $23,925 | 112 | 0.9* | 95.4 | $36,628 | |
| Index Admission (Days) | 4,133 | 100.0 | 3.7 | $10,214 | 5,999 | 100.0 | 4.2 | $10,506 | 2,726 | 100.0 | 5.1 | $10,623 | 112 | 100.0 | 12.8 | $15,078 | |
| Home Health (Visits) | 2,724 | 65.9 | 16.6 | $3,341 | 4,046 | 67.4 | 17.7 | $3,442 | 1,914 | 70.2 | 20.0 | $3,648 | 62 | 55.4 | 29.0 | $4,945 | |
| IRF (Days) | 965 | 23.3 | 9.3 | $10,128 | 1,638 | 27.3 | 10.6 | $11,352 | 806 | 29.6 | 11.6 | $12,299 | 31 | 27.7 | 16.4 | $14,834 | |
| LTCH (Days) | 13 | 0.3 | 26.1 | $26,425 | 39 | 0.7 | 30.0 | $30,207 | 41 | 1.5 | 28.8 | $29,218 | 8 | 7.1 | 45.1 | $57,427 | |
| Hospital Outpatient Therapy (Services) | 1,827 | 44.2 | 49.9 | $1,074 | 2,151 | 35.9 | 50.6 | $1,123 | 709 | 26.0 | 46.0 | $1,131 | 29 | 25.9 | 52.0 | $1,381 | |
| SNF (Days) | 1,218 | 29.5 | 18.1 | $6,025 | 2,422 | 40.4 | 24.1 | $7,656 | 1,252 | 45.9 | 25.8 | $8,152 | 67 | 59.8 | 34.9 | $10,492 | |
| Acute Readmission (Days) | 426 | 10.3 | 6.4 | $11,386 | 971 | 16.2 | 7.3 | $11,193 | 538 | 19.7 | 9.7 | $13,308 | 39 | 34.8 | 10.7 | $11,406 | |
| 089 | Simple Pneumonia & Pleurisy Age >17 w CC (N=5,441) |
APR-DRG 1 N=83 |
APR-DRG 2 N=2,712 |
APR-DRG 3 N=2,467 |
APR-DRG 4 N=179 |
||||||||||||
|---|---|---|---|---|---|---|---|---|---|---|---|---|---|---|---|---|---|
|
1. Utilization is measured in days for acute, IRF, LTCH, and SNF; visits for HHA; and units of service for hospital outpatient therapy. NOTE: * This is a row percent. SOURCE: RTI analysis of 2005 Medicare Claims (mmor140). |
|||||||||||||||||
| Total Episode Days (Index Admission Days + PAC days) | 83 | 1.5* | 71.0 | $15,388 | 2,712 | 49.8* | 67.6 | $16,551 | 2,467 | 45.3* | 75.5 | $18,727 | 179 | 3.3* | 77.3 | $21,726 | |
| Index Admission (Days) | 83 | 100.0 | 5.3 | $4,927 | 2,712 | 100.0 | 5.5 | $4,886 | 2,467 | 100.0 | 7.1 | $5,139 | 179 | 100.0 | 10.3 | $5,462 | |
| Home Health (Visits) | 49 | 59.0 | 24.3 | $2,909 | 1,424 | 52.5 | 23.2 | $3,225 | 1,219 | 49.4 | 27.5 | $3,666 | 89 | 49.7 | 25.1 | $3,693 | |
| IRF (Days) | 2 | 2.4 | 25.0 | $22,838 | 99 | 3.7 | 15.1 | $15,824 | 79 | 3.2 | 14.8 | $16,785 | 8 | 4.5 | 14.1 | $19,031 | |
| LTCH (Days) | 0 | 0.0 | - | - | 44 | 1.6 | 26.0 | $30,721 | 57 | 2.3 | 28.9 | $36,796 | 11 | 6.1 | 27.2 | $28,852 | |
| Hospital Outpatient Therapy (Services) | 11 | 13.3 | 19.6 | $678 | 476 | 17.6 | 34.3 | $1,007 | 374 | 15.2 | 44.0 | $1,447 | 24 | 13.4 | 30.1 | $1,206 | |
| SNF (Days) | 45 | 54.2 | 34.2 | $9,186 | 1,412 | 52.1 | 34.7 | $9,376 | 1,459 | 59.1 | 35.9 | $9,688 | 102 | 57.0 | 33.0 | $9,190 | |
| Acute Readmission (Days) | 21 | 25.3 | 7.9 | $12,343 | 789 | 29.1 | 10.8 | $13,192 | 836 | 33.9 | 11.0 | $13,102 | 77 | 43.0 | 12.0 | $14,889 | |
Footnotes
1 Medicare Benefit Policy Manual, Chapter 3 Duration of Covered Inpatient Services.
2 Medicare Benefit Policy Manual, Chapter 7 Home Health Services.
3 An index hospitalization is an acute hospitalization with a prior 60-day clean period. In the prior 60 days, no acute or post-acute (IRF, LTCH, SNF, HHA, outpatient therapy) services were used.
4 Some episodes may end at hospital discharge. Only live hospital discharges are included in the analytic sample.
5 Past work by Gage and colleagues showed variations in per case margins for different types of cases (Gage, et al, 2007)
6 This 15.0 percent is based on the number of index acute admissions (310,628 discharged alive) using the 5.0 percent sample, multiplied by 20 to estimate the number of index acute admissions in the Medicare population, divided by the total number of Medicare beneficiaries with Hospital Insurance as reported in the 2007 Statistical Supplement of the Health Care Financing Review (42,975,000 beneficiaries with hospital insurance in 2006).
7 FY 2006 DRG titles were used in this analysis.
8 LTCHs are not allowed to open units within hospitals. They are subject to separateness and control policies for colocated providers for hospital-within-hospitals [42 CFR 412.22(e)] and satellites [42 CFR 412.22(h)]. LTCHs must meet the same conditions of participation as acute hospitals including establishing a board and having a separate chief executive officer and medical director.
9 Note that episodes continuing beyond the first 6 months of 2007 were truncated and in these cases all available claims were assigned to the episode.
10 Though the sample is limited to beneficiaries discharged alive from the index acute hospitalization, the sample does include beneficiaries who die during PAC episodes.
11 LTCHs are not allowed to open units within hospitals. They are subject to separateness and control policies for colocated providers for hospital-within-hospitals [42 CFR 412.22(e)] and satellites [42 CFR 412.22(h)]. LTCHs must meet the same conditions of participation as acute hospitals including establishing a board and having a separate chief executive officer and medical director.
12 This 15.0 percent is based on the number of index acute admissions (310,628 discharged alive) using the 5.0 percent sample, multiplied by 20 to estimate the number of index acute admissions in the Medicare population, divided by the total number of Medicare beneficiaries with Hospital Insurance as reported in the 2007 Statistical Supplement of the Health Care Financing Review (42,975,000 beneficiaries with hospital insurance in 2006).
13 Note that the 2006 claims data were run through the 2008 MS-DRG grouper.
14 There are many services, particularly surgeries, that have an associated global period in which follow-up visits are included in the physician service payment. The global period for major surgery is 90 days. When no-pay claims are not submitted for such visits, they do not appear in the counts.