
Long-Term Growth of Medical Expenditures Public and Private
May 2005
Printer Friendly Version in PDF Format
This Issue Brief is available on the Internet at:http://aspe.hhs.gov/health/medicalexpenditures/
Contents
- Historical Perspective
- The Significance of Public Funding of The Nations Health Care
- The Importance of Governmental Sources in Financing Medical Care for the Aged
- Future Perspective
As the population of the United States ages, it will consume more health care. Older people suffer diseases and other medical problems to a greater extent than younger people. And with health care prices continuing to rise much faster than other goods and services, the use and societal cost of health care is expected to soar in the future. Since public programs finance much of the ageds health care, over time there will be growing pressure on federal and state budgets, and long-term strains on public funds will put upward pressure on tax rates. That, in turn, could cause lawmakers to re-examine the coverage commitments they have made through federal and state health care programs.Whatever the outcome of those competing pressures, steps to moderate the growth of health care prices and increase efficiency and effectiveness of health care delivery are essential to moderating the economic burden that future health care costs are likely to impose.
Historical Perspective
| National Health Expenditures | |||
| 1960 | 1985 | 2003 | |
| (in billions of current dollars) | |||
| Aggregate spending | 27 | 427 | 1,679 |
| Per capita | 143 | 1,765 | 5,670 |
| (in billions of constant 2003 dollars)* | |||
| Aggregate spending | 166 | 730 | 1,679 |
| Per capita | 891 | 3,019 | 5,670 |
| Share of GDP | 5.1% | 10.1% | 15.3% |
| Source: National Health Expenditures, Centers for Medicare & Medicaid Services, Office of the Actuary, National Health Statistics Group; U.S. Department of Commerce, Bureau of Economic Analysis; and U.S. Bureau of the Census * Adjusted for changes in the Consumer Price Index for all-Urban Consumers, all items | |||
The nations spending on medical care has been on an unrelenting upward path for a number of decades. In 1960, aggregate health expenditures in the U.S. totaled $27 billion; in 2003, the figure stood at nearly $1.7 trillion a 63-fold rise. In contrast, the U.S. population grew by only 51 percent. Health expenditures per capita (or per person) rose from $143 in 1960 to $5,670 in 2003 a 40-fold rise. General inflation pushed up prices of goods and services in the economy by 5-fold. In contrast, the recorded rise in prices for medical care was 12-fold, driven mostly by increases in hospital charges and doctors fees.[1] The overall economic dimensions of the growth have been equally impressive, with the share of the economy devoted to health care tripling over the period, rising from approximately 5 percent of gross domestic product (GDP) in 1960 to over 15 percent in 2003.
| Inflation and the Rise in Health Care Prices | ||
| 1960-2003 | 1990-2003 | |
| (Percent increase in prices) | ||
| Inflation generally | 515% | 41% |
| Medical care overall | 1,232% | 82% |
| Medical care services | 1,469% | 88% |
| Source: Consumer Price Index for All-Urban Consumers, loc. cit. | ||
Consumption of health care by the elderly is larger than for the rest of the population. In 1999, per capita health care spending for the U.S. population as a whole, it was $3,834. For the population under age 65, it was $2,793. For the population age 65 or older, it was $11,089, or nearly four times as high. Even within the aged population, the divergence was significant. For those ages 65 to 74, it was only $8,167 compared to $20,001 for those persons age 85 or older. Medicare enrollees, 87 percent of whom were age 65 or older, comprised 14.5 percent of the total population that year, but they accounted for 37 percent of the nations personal health care expenditures.[2] For two million recipients residing in nursing homes full-time (three quarters of whom were age 75 and older), the per capita costs were $44,520. Among recipients age 85 and older, 22 percent resided in nursing homes.[3] Persons age 85 and older comprised 1.6 percent of the population in 1999, but they accounted for more than 8 percent of the nations personal health care spending.
| Per-Capita Health Care Spending by the Aged Compared to that of the Rest of the Population, 1999 | |
| Age grouping | Per Capita Personal Health Care Spending |
| All ages | $3,834 |
| Under 65 | 2,793 |
| 65 and older | 11,089 |
| 19-44 | 2,706 |
| 45-54 | 3,713 |
| 55-64 | 5,590 |
| 65-74 | 8,167 |
| 75-84 | 12,244 |
| 85 and older | 20,001 |
| Source: Age Estimates in the National Health Accounts, Sean P. Keehan, Helen C. Lazenby, Mark A. Zezza, and Aaron C. Catlin, Health Care Financing Review, December 2, 2004. | |
| Health Care Spending By Medicare Population Age 65 Or Older, By Level Of Expenditures, 1999 | ||
| Share of health care expenditures incurred by: | ||
| Top 1 percent of users | Top 5 percent of users | Top 10 percent of users |
| 12.8% | 35.9% | 53.8% |
| Source: Medicare Current Beneficiary Survey, loc. cit. | ||
While average expenditures by age group illustrate the effects of higher age on the consumption of health care, they dont show the concentration of use of health care within the elderly population. In any given year, the bulk of medical care expenses tend to be incurred by a relatively small group of people. In 1999, 1 percent of Medicare enrollees age 65 or older incurred 13 percent of that groups health care expenditures. The top 10 percent with the highest expenditures incurred 54 percent.
The significance of that concentration is not only that the nations health care costs will rise as the aged grow in numbers, those costs will be amplified as those in the population with the highest incidence of health care expenses grow as a share of the population. In the 8-year period alone, 1992 to 2000, the percent of the Medicare population made up of persons age 85 and older grew from 9.7 percent to 10.9 percent.[4]
The Significance of Public Funding of The Nations Health Care
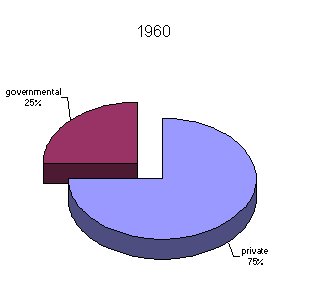
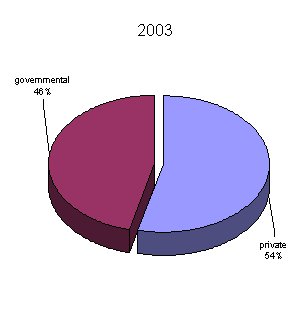
In 2003, public funding sources Federal and State and local governments combined directly financed nearly half of the nations health expenditures. This encompasses personal health care, research, construction, supplies and other related costs. They covered 44 percent of the spending done for personal health care including care of the active military and veterans. Over the past half century, government entities have assumed an increasingly greater role in meeting the nations health care needs. In 1960, they funded 25 percent of aggregate national health expenditures. With the advent of Medicare and Medicaid in 1965, the governmental share rose quickly to 38 percent in 1970, and continued to rise thereafter, reaching 46 percent in 2003.
| Changing Public (Federal And State) And Private Financing of National Health Expenditures | |||||
| 1960 | 1970 | 1980 | 1990 | 2003 | |
| (in percent) | |||||
| Public funds | 25 | 38 | 43 | 41 | 46 |
| Private funds | 75 | 62 | 57 | 59 | 54 |
| Source: National Health Expenditures, loc. cit. | |||||
|
|
|
The largest source of personal health care financing today comes from private insurance, which furnished 36 percent of the funding for those expenditures in 2003. Out-of-pocket spending accounted for 16 percent, making it the next largest private source. Medicare and the federal share of Medicaid comprise the bulk of the federal governments support. The States share of Medicaid is the largest component furnished by State and local governments.
| Sources of Financing of Personal Health Care, 1960 and 2003 | ||
| 1960 | 2003 | |
| Percent funded by: | ||
| Private insurance | 21 | 36 |
| Out of pocket | 55 | 16 |
| Medicare | --- | 19 |
| Medicaid* | --- | 17 |
| Other private | 2 | 4 |
| Other Federal | 9 | 4 |
| Other State and local | 13 | 3 |
| Source: National Health Expenditures, loc. cit * Consists of both federal and state funding. | ||
Among those sources, the federal component grew the most over the past four decades, rising from 9 percent of personal health care spending in 1960 to 33 percent in 2003. Although Medicaids emergence in 1966 significantly raised the federal governments spending on medical care for the poor, the share of personal health care spending on medical care for the poor financed by state and local governments (which includes their matching funds for Medicaid) actually slipped a little over the four-decade period, with their share dropping from 13 percent in 1960 to 11 percent in 2002.
| Federal and State Government Financing of Personal Health Care Spending, 1960 and 2003 | ||
| 1960 | 2003 | |
| Percent funded by: | ||
| Federal government | 9 | 33 |
| State and local governments | 13 | 11 |
| Source: National Health Expenditures, loc. cit. | ||
It is important to note that while private sources still appear to be financing the majority of the nations health expenditures at 54 percent in 2003 the figure masks the indirect support that the federal and state and local governments provide through tax preferences for health care. More than $100 billion in so-called tax expenditures for health care were incurred by the federal government alone in 2003. Those tax expenditures represent income taxes that are foregone because employers and individuals are allowed to exclude from taxable income that portion of their income used for health insurance premiums and/or related expenses. If those foregone tax receipts are taken into account, the majority of the nations health spending more than 60 percent was either directly financed by federal and state and local governments in 2003 or indirectly supported through the tax provisions.
With growth of public programs and private insurance during the past four decades, the role of direct payments between individuals and health care providers changed substantially. In 1960, individuals paid directly for more than half of all their personal health care needs paying 55 percent of their medical costs out-of-pocket. In 2003, only 16 percent of personal health care spending was covered out-of-pocket, making third parties the predominant means of financing medical care in the U.S. Although a large number of factors are thought to have contributed to the escalation of medical costs, the expansion of third-party payers (whether governmental or private) may have lessened incentives for individuals to be cost conscious about their consumption of medical services.[5]
The Importance of Governmental Sources in Financing Medical Care for the Aged
| Sources Of Personal Health Care Financing For Medicare And NonMedicare Populations, 2000 | ||
| Medicare Population | Non-Medicare Population | |
| Percent funded by: | ||
| Medicare | 52.3 | --- |
| Medicaid | 12.2 | 19.2 |
| Private insurance | 12.2 | 47.7 |
| Out-of-pocket | 19.4 | 15.8 |
| Other* | 3.9 | 17.3 |
| Source: Medicare Current Beneficiary Survey, loc. cit. * Consists of a mix of governmental and private sources | ||
Comparisons of the funding sources for medical care of the Medicare and non-Medicare populations reflect how important public funding has become for the aged. Public funds directly financed less than half of the nations health expenditures in 2000, but it was the aged who received the bulk of this support. Approximately two-thirds of their health care costs were financed by public programs, and more than half came from Medicare.
The reliance of the aged on public health care programs has changed very substantially over the past half century, notably because Medicare coverage didnt exist prior to 1966. But even since the advent of Medicare, the public role has grown. As described by the Medicare programs chief actuary
"For the population age 65 or over, Medicare paid for about 42 percent of total personal health care expenditures in fiscal year 1968. By calendar year 1997, this percentage had increased to 55 percent, with most of the balance covered by Medicaid, private health insurance, and the beneficiaries' own out-of-pocket payments Medicare's increased share is in part attributable to the Part B deductible, which was $50 in 1968 and has been increased only three times since then, to $100 currently. Because covered costs increased far more rapidly, a greater proportion of covered costs is in excess of the deductible and is therefore reimbursable by Medicare. In 1968, only 38 percent of beneficiaries had Part B costs in excess of the deductible, but by 1997, this proportion had risen to 87 percent Medicare's increasing share has also reflected rapid growth in the prices, utilization, and intensity of such covered services as physician, skilled nursing, and home health care. On the other hand, in some years, certain non-covered costssuch as for prescription drugs and long-term nursing home careincreased more rapidly than health costs generally, thereby adding to the portion funded by non-Medicare sources. Overall, the trend has been toward a greater Medicare share of the total personal health care costs of the aged"
The chief actuary also noted
"the relatively small decline in Medicaid outlays as a percentage of total personal health care expenditures for beneficiaries over age 65. The proportion of older persons with incomes below the poverty thresholds (who are the most likely to be eligible for Medicaid) fell from roughly 16 percent in 1966 to 11 percent in 1997 The impact of this trend on Medicaid expenditures was largely offset, however, by expansions in coverage, including the creation of Qualified Medicare Beneficiaries (QMBs) and Specified Low-Income Medicare Beneficiaries (SLMBs). (Medicaid pays the Medicare premium[s] on behalf of QMBs and SLMBs and also the beneficiary cost-sharing liabilities for QMBs.) In addition, during this period, Medicaid absorbed a substantial portion of the rapidly increasing expenditures for nursing home care.
The proportion of health care service costs paid directly by beneficiaries has declined significantly since the beginning of the program, from about 28 percent in 1968 to 20 percent currently. This change is attributable primarily to the increased shares covered by Medicare and private health insurance" [6]
| Sources of Funding for Personal Health Care Expenditures for Persons 65 or Over, 1968 and 1997 | ||
| Fiscal Year 1968 | Fiscal Year 1997 | |
| Percent from: | ||
| Medicare | 42% | 55% |
| Medicaid | 14% | 11% |
| Other | 11% | 3% |
| Out of Pocket | 28% | 20% |
| Private Health Insurance | 5% | 11% |
| Source: Trends in Medicare Expenditures and Financial Status, 1966-2000, Richard S. Foster, Health Care Financing Review, Fall 2000. | ||
In 2003, the Congressional Budget Office reported that the growth in national health expenditures over the 1970 to 2001 period exceeded the growth in gross domestic product by 2.5 percentage points annually. Medicare, however, grew at a rate that was 3 percentage points greater over a roughly comparable period. Medicaid grew at a rate 2.7 percentage points greater. [7]On an annual basis, these differences may seem small, but when compounded over decades, they help explain how Medicares and Medicaids combined share of the personal health care expenditures grew from 19 percent in 1970 to 37 percent in 2002. In effect, over a 32-year period, these two major public programs nearly doubled their role in financing the nations health care expenditures.
Future Perspective
The Social Security and Medicare trustees project a major rise in the ageds share of the population in the coming decades. Where people age 65 and older represent 12 percent of the overall population today, they will represent 18 percent in 2025. Moreover, the rise is not solely the result of the post-World War II baby boom generation reaching its advanced years. Major improvements in longevity and a decline in the nations birth rate over the past 30 years are projected to lead to further increases in the ageds share of the population after the passing of the baby boomers.
| Projected Rise in Aged Population | |||||
| 2005 | 2025 | 2045 | 2065 | 2080 | |
| Number of aged | 37 million | 62 million | 79 million | 89 million | 96 million |
| Share of total population | 12% | 18% | 21% | 22% | 23% |
| Source:The 2005 Annual Report of the Board of Trustees of the Federal Old-Age and Survivors Insurance and Disability Insurance Trust Funds, Washington, D.C., March 23, 2005 | |||||
For Medicare, these looming demographics mean a growing number of people will become eligible for coverage each year, and each successive group of new enrollees will receive benefits for a longer period of their lives. For Medicaid, they mean a growing number of people will need and become eligible for nursing home and related institutional care. For both programs and the federal government generally, they mean a declining proportion of the population will be in the primary working age band of 20 to 65, from which much of the governments tax base emanates.
Compounding the growth from demographic trends is the uncertain but still resilient rise in prices and use of medical care. To what extent they can continue to grow at these rates is uncertain.
| Drop in Birth Rates and Rising Life Expectancy, 1965-2080(actual and projected) | ||||
| 1965 | 2005 | 2045 | 2080 | |
| Births per woman in her lifetime | 2.88 | 2.02 | 1.95 | 1.95 |
| Life expectancy at age 65: | ||||
| --Average age of death for men | 78.5 | 82.0 | 84.4 | 86.1 |
| --Average age of death for women | 83.0 | 84.7 | 87.0 | 88.7 |
| Source: 2005 Social Security trustees report, loc. cit. | ||||
| Comparison of Per Person Growth of Medicare, Medicaid, and Gross Domestic Product, 1970-2003 | |||
| Average annual per person growth in percent | |||
| GDP | Medicare | Medicaid | |
| 1970-2003 | 6.3 | 9.4 | 8.8* |
| 1980-2003 | 5.0 | 7.4 | 7.1 |
| 1990-2003 | 3.8 | 5.6 | 6.0 |
| The Long Term Budget Outlook, CBO, loc. cit. *For the 1975-2003 period. | |||
The higher per person growth in national health expenditures and Medicare and Medicaid narrowed in the latter portion of the 1970-2003 period (Medicaid less so than Medicare), but nonetheless it still grew considerably faster than the overall economy. Recognizing this trend, the Medicare trustees in their central long-range forecast the so-called intermediate projections have assumed that per enrollee costs for Medicare will grow at an ultimate rate 1 percentage point faster than gross domestic product.[8] This is lower than experienced during the 1990-2003 period, but still greater than experienced by the economy generally.
| Narrowing Difference Between Growth of National Health Expenditures and Growth of Gross Domestic Product | |
| Amount by which national health expenditures exceeding growth in GDP (in percent) | |
| 1960-2001 | 2.5 |
| 1970-2001 | 2.3 |
| 1980-2001 | 2.3 |
| 1990-2001 | 1.5 |
| Source:The Long-Term budget Outlook, CBO, loc. cit. | |
Combining this assumption with their demographic outlook, the Medicare trustees project that Medicare expenditures could rise from 2.7 percent of gross domestic product today to 9.6 percent in 2050 and reach 13.9 percent in 2080. Under a scenario with similar assumptions, the Congressional Budget Office projects that Medicare and Medicaid combined could rise to 11.5 percent of gross domestic product in 2050.[9] Expenditures of that magnitude today would represent more than half of the entire federal budget. While recognizing the great uncertainty surrounding their forecast, the Medicare trustees state that their projections
"continue to demonstrate the need for timely and effective action to address Medicares financial challenges both the long range financial imbalance facing the HI [Hospital Insurance] trust fund and the heightened problem of rapid growth of expenditures. The sooner the solutions are enacted, the more flexible and gradual they can be"[10]
What can be said about future private expenditures is uncertain but equally problematic. Health insurance premiums have been rising rapidly. By one report, in 2002 health insurance premiums rose at a rate eight times faster than general inflation; experiencing the largest one-year surge in premiums in more than a decade.[11] A survey by the Kaiser Family Foundation found that "premiums charged for job-based health insurance rose by 11.2 percent in 2003, exceeding previous rates of growth. All types of health plans including HMOs, PPOs, and POSs demonstrated double-digit increases in cost." Kaiser reported that the premiums paid by employers for employees family coverage rose from an average of $6,438 in 2000 to $9,086 in 2003, and that the average amount workers paid toward those premiums rose nearly 50 percent, from an average of $1,619 in 2000 to $2,412 in 2003. [12]
As premiums rise, it is reasonable to assume that employers will attempt to constrain their costs.[13] Workers could be expected to shoulder more of their medical expenses directly either by being required to pay a greater share of the employers premiums or by having increased cost-sharing requirements. Premium hikes for Medicare benefits (i.e. now required for non-hospital services and drug coverage) and for health insurance policies supplementing Medicare (i.e., Medigap policies) would likely have a similar effect on the aged. Large premium increases may cause policymakers to impose higher medical deductibles or coinsurance and may cause recipients to seek less expensive supplemental coverage with higher cost-sharing requirements. When such out-of-pocket expenses would have a restraining impact on medical prices is uncertain. Moreover, as they emerge, policymakers could step in and require governments to assume an even greater share of the burden. The tension, however, between further governmental absorption of out-of-pocket costs and governmental budgets will only grow stronger as costs already imbedded in public programs rise.
The continuing rise in medical costs has promoted calls for fundamental change of the nations health care systems. Some advocate greater governmental intervention to directly or indirectly control prices and utilization. Others believe greater free market competition in insuring those costs offers the most promising route. Still others believe that medical technology and innovation, greater advocacy of healthier lifestyles, promoting increased case management practices, and making further applications of information technology to the dissemination of effective medical advances and the paperwork maze for treatment and services will make the health care system considerably less costly.
Thus far, there appears to be no consensus about what the best solution to the rising price tag for health care might be. Given that uncertainty, it is likely that some combination of the various major policy prescriptions will evolve and be implemented as the cost pressures, both public and private, magnify in the years to come.
Endnotes:
[1] As measured by the Consumer Price Index for All-Urban Consumers, Bureau of Labor Statistics, U.S. Department of Labor. [2]Trends in the MCBS, 1992-2000, Center for Medicare and Medicaid Services. [3]SeeMedicare Current Beneficiary Survey, Center for Medicare and Medicaid Services, and Older Americans 2000: Key Indicators of Well-being, Federal Interagency Forum on Aging-Related Statistics. [4]Trends in the MCBS, 1992-2000, loc. cit. [5]The Long Term Budget Outlook, Congressional Budget Office, December 2003. [6]Trends in Medicare Expenditures and Financial Status, loc. cit. It should be noted that recent legislation raised the Part B deductible to $110 in 2005, and larger premiums for high-income enrollees will be phased in over a five-year period beginning in 2007. [7] The Long Term Budget Outlook, CBO, loc. cit. [8] See The 2004 Annual Report of the Board of Trustees of the Federal Hospital Insurance and Federal Supplementary Medical Insurance Trust Funds, Washington, D.C., March 23, 2004. [9] The Long-Term Budget Outlook, loc. cit. [10]The 2004 Annual Report of the Board of Trustees of the Federal Hospital Insurance and Federal Supplementary Medical Insurance Trust Funds, loc. cit. Hospital Insurance (HI) is Part A of Medicare; Supplementary Medical Insurance (SMI) is made up of the traditional Part B and the new Part D prescription drug benefit. [11]Health Care Costs, National Coalition on Health Care, 2004. [12] Cost of Health Insurance, Employer Health Benefits: 2004 Annual Survey,Kaiser Family Foundation. [13] A study by the Washington Business Group on Health, representing nearly 200 major employers, found that 80 percent of employers offering employee health insurance planned to increase co-payments or cost sharing in 2003, compared with 65 percent who answered that way in 2001. In a more recent study, the group found that 57 percent planned to increase cost sharing for 2004. (Martinez, As Health Costs Increase, Workers Must Pay More," Wall Street Journal , June 16, 2003.) A New York Times article reported that "After corporate income taxes, employee benefits are the second largest structural cost for American manufacturers, adding 5.8 percent to costs." (Daniel Gross, Whose Problem is Health Care, The New York Times, February 8, 2004.)