
William G. Wesssert, Jennifer M. Elston, Gary G. Koch, Jane D. Darter and William D. Kalsbeek
University of North Carolina, Chapel Hill
School of Public Health
This report was prepared under grant #87ASPE181A between the U.S. Department of Health and Human Services (HHS), Office of Social Services Policy (now the Office of Disability, Aging and Long-Term Care Policy (DALTCP)) and the University of North Carolina. For additional information about the study, you may visit the DALTCP home page at http://aspe.hhs.gov/_/office_specific/daltcp.cfm or contact the office at HHS/ASPE/DALTCP, Room 424E, H.H. Humphrey Building, 200 Independence Avenue, SW, Washington, DC 20201. The e-mail address is: webmaster.DALTCP@hhs.gov. The DALTCP Project Officer was Floyd Brown.
The opinions and views expressed in this report are those of the authors. They do not necessarily reflect the views of the Department of Health and Human Services, the contractor or any other funding organization.
AUTHORS
Dr. William G. Weissert is Professor of Health Policy and Administration and Director of the Program on Aging in the School of Public Health at The University of North Carolina at Chapel Hill.
Jennifer M. Elston is a research associate with the Program on Aging in the School of Public Health at The University of North Carolina at Chapel Hill.
Dr. Gary G. Koch is Professor of Biostatistics in the School of Public Health at The University of North Carolina at Chapel Hill.
Jane D. Darter is a programmer with the Program on Aging in the School of Public Health at The University of North Carolina at Chapel Hill.
Dr. William D. Kalsbeek is Professor of Biostatistics in the School of Public Health at The University of North Carolina at Chapel Hill.
The authors gratefully acknowledge the programming support of Guoqing Chen, a doctoral student in the Department of Health Policy and Administration at The University of North Carolina, and the earlier development of the synthetic estimation literature review by Ali Barakat, a doctoral student in the Department of Biostatistics at The University of North Carolina.
ABSTRACT
Health planning efforts for the elderly have been hampered by the lack of reliable estimates of the noninstitutionalized long-term care population. Until recently national estimates were virtually nonexistent, and reliable local estimates remain unavailable. With the recent publication of several national surveys, however, synthetic estimates can be made for states and counties by using multivariate methods to model functional dependency at the national level, and then applying the predicted probability to corresponding state and county demographic and contextual data. Using the 1984 National Health Interview Survey's Supplement on Aging and the 1986 Area Health Resources File System, we produced log-linear regression models that included demographic and contextual variables as predictors of functional dependency among the noninstitutionalized elderly. We found race, sex, age, and the percent of the elderly population in the community who reside in poverty to be significant predictors of functional dependency. Applying these models to 1986 Medicare Enrollment Statistics we produced estimates of two levels of functional dependency for all states and a sample of counties.
*** *** *** *** ***
While a substantial portion of long-term care planning occurs at the state and local level, many of the rigorous and authoritative population surveys provide prevalence data on the community-based long-term care population which is reliable only for national estimates. Health planning efforts for the elderly have been hampered by the lack of reliable data for making population-based estimates at subnational levels.
This paper presents log-linear regression models that can be used to produce regression-adjusted synthetic estimates of the elderly community-based long-term care population. We present state estimates, as well as estimates for a sample of counties.
PREVIOUS RESEARCH
Defining the Community-Based Long-Term Care Population
A primary goal in defining the long-term care population is developing a definition that can easily be translated into service and manpower estimates. To the extent feasible, it also should be compatible with available data and measures. Such estimates can then be translated into expenditure estimates for purposes of budgeting and health planning.
One approach, counting the number of people with chronic conditions, provides an informative but not entirely satisfactory estimate of service needs because many conditions have few, if any, consequences for health care utilization behavior (Haber 1971 and 1973).
Inventories of the number of people who report limitations in their usual activity are also an informative measure for some epidemiological purposes. But "usual activity" varies with age, occupation, work-force participation, and self-perceived role. This variation raises some questions concerning validity and reliability of the concept when used as a survey item with a retired population.
Similarly, a National Health Interview Survey item that asks whether or not an individual stays in bed most days because of a chronic condition has somewhat limited consequence for manpower-need estimates. This is so because it is not clear that human intervention would alter those individuals' conditions. In addition, they are a very small group; in 1980, only 17,000 nondependent persons, or less than one-tenth of 1% of the aged population, reported staying in bed most days due to a chronic condition (Weissert 1985).
The notion of functional disability as the criterion for inclusion in the long-term care population comes closer to the mark by focusing on an individual's ability to perform basic functions. Need for human help in daily functioning has direct implications for manpower estimates and long-term care expenditure projections. Nonetheless, even this measure is not problem free. Definitions of functional disability vary in the nature of the functional disabilities included as well as the degree of impairment. Definitions also differ by the duration of the disability, although most people accept the 1957 distinction offered by the Commission on Chronic Illness that care is long-term when it lasts more than 90 days.
For purposes of this paper, we have chosen to estimate functional dependency as it is most commonly defined by long-term care researchers. That is, dependency in activities of daily living (ADL), mobility, and instrumental activities of daily living (IADL). These measures repeatedly have been shown to be reliable and valid in helping to identify problems that require treatment or care, and they are readily available in a number of comprehensive assessment and information systems (Katz 1983), including several national surveys.
This is not to say that they are the only measures of the need for long-term care that might have been used. Other reliable measures of an elderly person's ability to perform physical functions include the Barthel Index, which includes a measure of muscle strength among other subscales; the Kenney Self-Care Evaluation, which includes additional measures of personal hygiene not measured by the Katz scale; and many others (Kane and Kane 1981). Few of these scales and measures have been widely used in national surveys, however, despite their potential to yield considerable additional detail on the elderly population's need for care.
Prevalence of Functional Dependency
Using surveys conducted at both the national and local level, numerous estimates of the prevalence of functional dependency among the elderly population have been made. Nagi (1976), using a 1972 probability sample of the continental United States, found that almost 17% of the noninstitutionalized elderly population required assistance with mobility or personal care. Estimates from the 1979 and 1980 National Health Interview Surveys (NHIS) indicate that almost 12% of the noninstitutionalized elderly, or 2.8 million elderly, were dependent in personal care, mobility, household activities, or home administered health care services (Feller 1983; Weissert 1985). Using data from the 1982 National Long-term Care Survey (NLTCS), Macken (1986) reported that 19% or 5 million Medicare enrollees were functionally impaired. Similar estimates were reported by Manton and Soldo (1985) who found 4.6 million disabled elderly using data from the 1982 NLTCS. Dawson, Hendershot and Fulton (1987), using the 1984 NHIS's Supplement on Aging, found that 10% of the elderly population received help performing personal care activities, and almost 22% were receiving help with home management activities. The variations in prevalence estimates by these investigators reflects the wide, variety of definitions, samples and levels of aggregation used by them.
In addition to national estimates, surveys of functional dependency also have been conducted at the subnational level. Notable among these are the Duke Longitudinal Studies of Aging (1955-1976 and 1975-1984), the Manitoba Longitudinal Study on Aging (1970-1977), the Duke OARS Survey (1972-1974), the Massachusetts Health Care Panel Study (1974-1980), the Cleveland OARS General Accounting Office Study (1975-1986), and the Framingham Disability Study (1976-1978).
Correlates of Functional Dependency
In addition to prevalence estimates obtained from population based surveys, researchers have explored the demographic, health status and other factors which typically accompany functional decline. A number of specific correlates of dependency have been suggested in previous work. Among these, increases in physical disability have been significantly associated most often with advanced age (Shanas 1962 and 1968; Jette and Branch 1981; Feller 1983; Branch, Katz, Kniepmann and Papsidero 1984; Manton and Soldo 1985; Palmore, Nowlin and Wang 1985; Weissert 1985; Macken 1986; Dawson, Hendershot and Fulton 1987), and with being female (Shanas 1962 and 1968; Jette and Branch 1981; Branch et al. 1984; Palmore, Nowlin and Wang 1985; Manton and Soldo 1985; Weissert 1985; Manton 1988). However, Feller (1983) found no significant difference in rates of dependency by gender, and Dawson, Hendershot and Fulton (1987) found gender differences to disappear when age structure was taken into account.
Other correlates of decrement in functional ability which have been noted, include being nonwhite (Palmore, Nowlin and Wang 1985; Macken 1986), unmarried or residing with family members (Shanas 1962 and 1968; Palmore, Nowlin and Wang 1985), having a low income (Shanas 1968; Palmore, Nowlin and Wang 1985), and being at the low end of the social class continuum (Shanas 1968)
Most recently Jette and Branch (1985) found living alone to be the strongest correlate of physical disability. While they found advancing age to be related to disability among those who live alone, no relationship between advanced age and disability was found among those who lived with others. They also found men who live with others more likely to report physical disability compared to women, but found no significant gender differences among those who live alone. Among those who lived with others, level of income was inversely related to increasing disability.
In a study of active life expectancy (years free of physical disability), using data from a 1974 Massachusetts health care panel study of noninstitutionalized elderly, Katz et al. (1983) found active life expectancy to decrease with age, and to be shorter for the poor at all ages.
A few researchers have also investigated the relationship of functional dependency to other factors with the use of multivariate methods. Nagi (1976) found physical performance, age, number of conditions, sex, race, emotional performance and health status to explain over 74% of the variation in the dependent variable, independent living. In a longitudinal study using residual analysis Palmore, Nowlin and Wang (1985) found changes in ADL abilities to be predicted by prior ADL abilities, age and physical ratings. Using AID (Automatic Interaction Detection) analysis, Heinemann (1985) found the number of chronic conditions, age, social class, and income to be significant predictors of health decline. Pinsky, Leaverton and Stokes (1987) found younger age and higher education levels to be significant predictors of good functioning among both men and women. Using a split-halves test on a data file created by the merger of the 1977 National Nursing Home Survey and the 1977, 1979, and 1980 National Home Health Survey, Unger and Weissert (1988) found that a model with age and age-squared accurately produced regression-adjusted synthetic estimates of the prevalence of dependency among the noninstitutionalized elderly population.
Synthetic Estimation
Although several methods exist to produce synthetic estimates none has been found to be uniformly superior. One well suited method uses a fitted regression model to predict quantitative characteristics of the area of interest. The dependent variable in such a model is the characteristic for which the small area estimate is to be obtained (dependency) while the explanatory variables are predictors available externally to the estimation process (e.g, age, sex, race, income, marital status, or living arrangement).
This approach has been widely used. The first detailed conceptual and empirical basis for the use of regression models for estimating population size was presented by Erickson (1973, 1974). Methods developed by Kalsbeek (1973) and Cohen et al. (1977) extended this idea. Gonzalez and Hoza (1978) applied Ericksen's regression method to the estimation of unemployment for selected Standard Metropolitan Areas, while Nicholls (1977) followed the regression method in estimating population sizes for Statistical Divisions in Queensland, Australia. Levy (1979) evaluated a regression-adjusted synthetic estimator. Royall (1977) introduced the prediction approach to small area estimation based on an assumed regression model. Holt (1979) and Laake (1979) have subsequently extended this prediction approach under several basic population models. DiGaetano and associates (1980) used synthetic and regression procedures to produce estimates at local levels using NHIS data. Heeringa (1982) examined the roles that a model may play in small area estimation based on sample survey data sets and discussed current perceptions of the strength and weaknesses of model-based small area estimation methods. Diffendal and colleagues (1983) used the synthetic and regression methods for small area adjustment methodologies applied to the 1980 Census. Unger and Weissert (1988), as previously noted, developed a regression-based technique for estimating state-level estimates of functionally dependent elderly.
METHODOLOGY
Data Sources
In the current analysis, data were drawn from the 1984 National Health Interview Survey's Supplement on Aging (1984 NHIS-SOA), the 1986 Area Resource File System (ARF), and 1986 Medicare Enrollment Statistics.
The 1984 NHIS-SOA is a multistage area probability sample which provides self-reported characteristics for 11,497 civilian noninstitutionalized elderly (age 65 and over). It includes information on their family structure, living arrangement, social support, conditions and impairments, functional abilities (ADL and IADL), and other health-related and social information.
To develop the regression models, contextual variables from the ARF were attached to individuals on the NHIS-SOA using geographic markers. The ARF is a compilation of county and other geographic area statistics concerning a wide range of health planning related variables drawn from a multitude of survey sources. Using the geographic identifiers available on the 1984 NHIS-SOA, corresponding community data were attached at the Standard Metropolitan Statistical Area (SMSA) for individuals residing in one of 31 large self-representing SMSAs. Individuals on the data set who resided outside these 31 areas were assigned the corresponding regional (northeast, north central, south or west) and urbanity (SMSA or nonSMSA) average for their type of residence. The result was 39 distinct geographic areas: 31 self-representing SMSAs, and 4 urban and 4 nonurban regional areas.
To generate regression-adjusted synthetic estimates of the functionally dependent elderly population in an area, rates of dependency produced by the model on national data must be multiplied by population data from small areas. Any explanatory variable included in the national model must also be available in the small area population data. As intercensal age, sex and race specific population data for the elderly are not readily available in small age increments at the small area level, we used Medicare Enrollment data for our estimates. Necessary adjustments to the Medicare data to account for nonenrollment among the elderly, and for the proportion of the elderly residing in nursing homes are discussed later in the report.
MODEL SPECIFICATION
Unit of Analysis
The unit of analysis for this study was the individual elderly person who was a respondent to the 1984 NHIS-SOA. Although the weighted sample size of the 1984 NHIS-SOA is over 26 million, so as not to exaggerate significance levels in model evaluation, we normalized the provided survey weight variable to sum to the actual sample size of 11,497.
Dependent Variable
The dependent variable for our analysis was a three level hierarchical measure which differentiated those who were dependent in activities of daily living (ADL), those who were dependent in mobility or instrumental activities of daily living (IADL), and those who were not dependent in either. Individuals were classified into their highest level of dependency defined as follows:
-
ADL DEPENDENT: Elderly individuals residing in the community, who, because of a health or physical problem, reported that at the time of the survey they had difficulty with and received human assistance with eating, transferring, toileting, dressing or bathing.
-
MOBILITY/IADL DEPENDENT: Elderly individuals residing in the community, who at the time of the survey were not ADL dependent, but because of a health or physical problem reported difficulty with and received human assistance with inside mobility, outside mobility, meal preparation, grocery shopping, money management, housework (light and heavy) or telephone usage.
-
INDEPENDENT: Elderly individuals residing in the community who at the time of the survey were neither ADL nor IADL dependent.
Given the construction of the 1984 NHIS-SOA, it had to be assumed that an individual who received help or supervision with any ADL or Mobility/IADL item was actually in need of such assistance. In addition, incontinence, though not mentioned in the above definition, was captured by other ADL measures. That is, we elected to exclude from our definition of ADL dependency individuals who were suffering from stress incontinence only. These are individuals who, though incontinent, do not require human assistance, nor report the need for assistance, in any one of the other five ADLs. Such individuals have no bearing on manpower estimates. Those who were incontinent and did need help were included in the ADL definition by virtue of needing help in one or more of the remaining ADL functions, e.g. dressing.
Explanatory Variables
Based upon the literature review and previous work done by Weissert, the following variables were expected to influence the prevalence of dependency among the noninstitutionalized elderly population:
- Demographic characteristics of the aged individual--measured by age, gender, race, marital status and living arrangement;
- Socio-economic characteristics of the aged individual--measured by education and income;
- Contextual characteristics of the elderly individual's community--measured by the supply of physicians, hospital beds, and nursing home beds; Medicaid nursing home eligibility policies; area mortality rates; urbanity; and climate.
Of course, the choice of predictor variables was limited to variables available on the merged 1984 NHIS-SOA/ARF data set and for which population distributions could be obtained for states and counties. Coupling the constraints of the merged data set and Medicare data, the following variable definitions were available for use:
- Sex--male and female (coded 1 if female and 0 if male);
- Race--white and nonwhite (coded 1 if nonwhite and 0 if white);
- Age Group--age in 5 year intervals from 65 to 85 and over (coded as a zero-centered variable equal to the youngest age in the five year interval minus 75, divided by 5, i.e. -2, -1, 0, 1, or 2) ;
- Age-Squared--a quadratic of the "age group" variable (coded as the square of the "age group" variable, i.e. 4, 1, 0, 1 or 4); and
- Interactions--pairwise combinations of all of the above (coded as the product of the pair).
In addition to these variables a number of contextual variables were hypothesized to affect the rate of functional dependency among the noninstitutionalized elderly. For the functionally dependent, residency in the community versus residency in hospitals or nursing homes is determined in part by access to nursing home beds (Weissert and Cready in press), and perhaps also by the supply of hospital beds, which sometimes serve as a substitute for nursing home beds (Weissert and Cready 1988). Income also is believed to enhance access to nursing homes (Scanlon 1980a; Scanlon 1980b).
The supply of physicians and Medicaid eligibility policies, both of which may enhance an individual's access to nursing homes and hospitals, may further affect rates of institutionalization among the functionally dependent.
Mortality rates are reflective of the health status of the elderly population. Measures of urbanity also are reflective of health status in as much as dwellers of urban areas face different threats to mortality and morbidity than residents of rural areas. In addition, urbanity is also a proxy for available health care options--both acute and long-term care--as well as available social supports, and as such may affect rates of institutionalization. Contextual variables available for inclusion in our model after merging the ARF and the 1984 NHIS-SOA included:
- the number of nursing home beds per 1000 elderly;
- the number of unoccupied nursing home beds per 1000 elderly;
- the number of acute care hospital beds per 1000 elderly;
- the per capita income of the population;
- the percent of the elderly who reside in poverty;
- the number of primary care physicians per 1000 elderly;
- the percent of the poverty population that is covered by Medicaid;
- the age-adjusted mortality rate;
- the number of heating degree days;
- the population per square mile;
- the elderly population per square mile; and
- the percent of the population that resides in an urban area.
The contextual variables were entered into our models as both continuous and categorical variables. For the categorical analysis the variables were collapsed into three levels: high, medium and low. To collapse the community variables they first were arrayed in descending order by size. Then using the upper and lower quartiles as starting points, breaks were set at the point in the array where large differences between two consecutive values existed and where consistency with substantive meaning applied.
ANALYSIS
Statistical Package
The dependent variable necessitated the use of a statistical procedure that accounted for its three levels. As the variable is theoretically ordered, it seemed logical to consider using an ordered method. The use of ordered logistic regression, a method commonly used in such situations and one that corresponds to a proportional odds ratio model, therefore was evaluated. However, the structure such a model imposes on the data was found to be inappropriate. This was learned by estimating two logistic component equations: ADL or IADL dependent verses no dependency; and ADL dependent verses IADL or no dependency. While the parameter estimates for race, age, and age-squared were similar for each of the two component models and thereby compatible with the proportional odds model, the parameter estimates for sex contradicted it by differing by almost 19 fold. Thus, the proportional odds ratio model imposed by logistic regression was considered inappropriate for modelling our dependent variable.
Instead a multicategory extension of logistic regression which provides a more general structure was used. The log-linear model was fit using a SAS supported procedure designed for categorical data modeling, PROC CATMOD. For log-linear model analysis CATMOD uses maximum likelihood estimation. Given the three category dependent variable, two sets of parameter estimates were produced: one for the logged ratio of not dependent to ADL dependent, and one for the logged ratio of IADL dependent to ADL dependent. Working with these two equations simultaneously yielded a formula for each category of the dependent variable: (1) not dependent; (2) IADL dependent; and (3) ADL dependent. (See Appendix A.)
Design Effects
The CATMOD procedure, however, cannot be used with a statistical package that accounts for the complex sampling design of the 1984 NHIS-SOA. Without accounting for sampling design effects, inaccurate variance estimates and significance levels may result. Experience shows that without accounting for such complexity, the variances of the regression coefficients produced in general are likely to be underestimated on the order of 5-20%.
To gauge the magnitude of the sample design effects in this analysis, results from the SAS procedure PROC LOGIST were compared with the results from the PROC RTILOGIT procedure (Shah et al. 1984), a SAS supported logistic regression package developed specifically to account for complex sample designs when calculating variances and significance levels. Because RTILOGIT has the ability to account for only a two level dependent variable, for comparative purposes, a model for ADL dependent verses not dependent was fit. To calculate the design effects, the variances produced with the PROC RTILOGIT procedure were divided by the variances produced with the PROC LOGIST procedure. The results showed that design effects were relatively small (i.e. less than 1.2) for all the parameters of interest (i.e. age, sex, race, and age-squared). Since adjustment of the chi-square statistics produced from CATMOD by division by the design effects would not influence the clear significance of the parameters in our model, there was not a problem with the use of the CATMOD procedure; i.e., the slightly larger variance estimates likely to be produced by complex sample methods such as RTILOGIT would not alter results or conclusions.
For model testing, the database was randomly divided in half within each primary sampling unit. In the first half of the database candidate models were fit for the dependent variable. Once model development was completed, the goodness-of-fit of the model was validated in the other half of the database by three methods. First the model was run in the other half of the data set, and the goodness-of-fit of the model was evaluated with the chi-square statistics associated with the individual parameters and with the lack-of-fit statistic. As the parameter estimates remained significant (p<.001), and the lack of fit statistic remained nonsignificant (p>.25) the structure of the model appeared to fit the data quite well.
In addition, the model was run on the entire sample to test the fit of the estimated coefficients. This was done by including an indicator variable representing the half of the data set from which each observation came, as well as all of its pairwise interactions. As the parameter estimates for the indicator and each of its interactions, were non-significant (p>.25) in an overall test, goodness-of-fit of the model was supported.
Third, the goodness-of-fit of the model was evaluated by comparing the similarity of the model-predicted dependency rates with their observed counterparts in the other half of the data set. In so doing, the candidate models were used to determine the predicted values of the probability of dependence for individuals in the other half of the database. The differences between these predicted values and their true value gives a residual value for that individual. The closeness of the averages of the residuals to zero for various subgroups of individuals (e.g. males, females, different age groups, etc.) and their lack of correlation of the residuals with characteristics of individuals are indicative of goodness-of-fit. In almost all cases (28 out of 30) the t-statistic indicated that the mean value of the residuals for each of the subgroups was not significantly (p>.05) different from 0. In addition, Pearson correlations were evaluated for the residuals and each of the explanatory variables, and their low values supported the fit of the model.
RESULTS
Direct Estimates
Direct estimates from the 1984 NHIS-SOA indicate that approximately 2.0 million (or 7.3%) of the noninstitutionalized elderly Americans suffered from at least one ADL dependency, and an additional 4.2 million (or 16.4%) suffered from at least one IADL dependency. Prevalence and percentage estimates by race, sex and age are shown in Table 1 and Table 2, respectively.
| TABLE 1: Direct Point Estimate of Noninstitutionalized Americans Aged 65 and Over Who Were Functionally Dependent in 1984 by Age, Sex and Race | |||||||||||||
|---|---|---|---|---|---|---|---|---|---|---|---|---|---|
| Race | Sex | Personal Care Dependent1 | Mobility or Household Activity Dependent2 | ||||||||||
| 65-69 | 70-74 | 75-79 | 80-84 | 85 & Over | 65 & Over | 65-69 | 70-74 | 75-79 | 80-84 | 85 & Over | 65 & Over | ||
| White | Male | 164,644 | 143,520 | 147,240 | 87,750 | 111,319 | 654,473 | 255,589 | 238,009 | 185,456 | 121,775 | 114,223 | 915,052 |
| Female | 157,176 | 190,273 | 192,626 | 234,942 | 286,274 | 1,061,291 | 608,833 | 629,901 | 668,388 | 479,112 | 422,742 | 2,808,976 | |
| Both | 321,820 | 333,793 | 339,866 | 322,692 | 397,593 | 1,715,764 | 864,422 | 867,910 | 853,844 | 600,887 | 536,965 | 3,724,028 | |
| NonWhite | Male | 20,095 | 15,920 | 27,803 | 17,060 | 12,628 | 93,506 | 34,700 | 35,507 | 12,834 | 12,037 | 6,461 | 101,539 |
| Female | 27,466 | 29,173 | 32,021 | 24,656 | 30,263 | 143,579 | 88,035 | 129,402 | 93,806 | 60,226 | 33,796 | 405,265 | |
| Both | 47,561 | 45,093 | 59,824 | 41,716 | 42,891 | 237,085 | 122,735 | 164,909 | 106,640 | 72,263 | 40,257 | 506,804 | |
| All Races | Male | 184,739 | 159,440 | 175,043 | 104,810 | 123,947 | 747,979 | 290,289 | 273,516 | 198,290 | 133,812 | 120,684 | 1,016,591 |
| Female | 184,642 | 219,446 | 224,647 | 259,598 | 316,537 | 1,204,870 | 696,868 | 759,303 | 762,194 | 539,338 | 456,538 | 3,214,241 | |
| Both | 369,381 | 378,886 | 399,690 | 364,408 | 440,484 | 1,952,849 | 987,157 | 1,032,819 | 960,484 | 673,150 | 577,220 | 4,230,832 | |
SOURCE: 1984 National Health Interview Survey’s Supplement on Aging.
|
|||||||||||||
| TABLE 2: Direct Point Estimates of the Percent of Noninstitutionalized Americans Aged 65 and Over Who Were Functionally Dependent in 1984 by Age, Sex and Race | |||||||||||||
|---|---|---|---|---|---|---|---|---|---|---|---|---|---|
| Race | Sex | Personal Care Dependent1 | Mobility or Household Activity Dependent2 | ||||||||||
| 65-69 | 70-74 | 75-79 | 80-84 | 85 & Over | 65 & Over | 65-69 | 70-74 | 75-79 | 80-84 | 85 & Over | 65 & Over | ||
| White | Male | 4.45 | 5.29 | 7.70 | 9.68 | 20.49 | 6.70 | 7.1 | 9.0 | 9.9 | 13.8 | 21.6 | 9.6 |
| Female | 3.46 | 5.08 | 6.63 | 13.44 | 23.55 | 7.50 | 13.7 | 17.1 | 23.5 | 27.9 | 36.1 | 20.3 | |
| Both | 3.91 | 5.17 | 7.05 | 12.16 | 22.61 | 7.17 | 10.7 | 13.7 | 18.1 | 23.1 | 31.6 | 15.9 | |
| NonWhite | Male | 5.29 | 5.63 | 12.40 | 20.11 | 30.64 | 9.23 | 9.5 | 13.0 | 6.4 | 15.4 | 15.7 | 10.4 |
| Female | 5.87 | 6.39 | 11.51 | 13.00 | 31.38 | 9.65 | 19.7 | 29.5 | 34.3 | 32.3 | 38.1 | 28.3 | |
| Both | 5.61 | 6.10 | 11.91 | 15.20 | 31.16 | 9.48 | 15.1 | 23.2 | 21.9 | 27.3 | 31.0 | 21.1 | |
| All Races | Male | 4.53 | 5.32 | 8.19 | 10.58 | 21.20 | 6.93 | 7.3 | 9.3 | 9.5 | 13.9 | 21.2 | 9.7 |
| Female | 3.69 | 5.22 | 7.06 | 13.40 | 24.13 | 7.70 | 14.2 | 18.4 | 24.5 | 28.3 | 36.2 | 21.0 | |
| Both | 4.06 | 5.26 | 7.51 | 12.44 | 23.23 | 7.34 | 11.1 | 14.6 | 18.5 | 23.5 | 31.5 | 16.4 | |
SOURCE: 1984 National Health Interview Survey’s Supplement on Aging.
|
|||||||||||||
With the use of the primary sampling unit (PSU) and the primary strata used for sampling, we calculated standard errors using a statistical package (PROC SESUDAAN) which accounts for the complex sampling design of the 1984 NHIS-SOA (Shah 1981). The standard errors were computed using the first-order Taylor approximation of the deviations of estimates from their expected values and are presented in Table 3 and Table 4.
| TABLE 3: Standard Errors for Direct Point Estimates of Noninstitutionalized Americans Aged 65 and Over Who Were Functionally Dependent in 1984 by Age, Sex and Race | |||||||||||||
|---|---|---|---|---|---|---|---|---|---|---|---|---|---|
| Race | Sex | Personal Care Dependent1 | Mobility or Household Activity Dependent2 | ||||||||||
| 65-69 | 70-74 | 75-79 | 80-84 | 85 & Over | 65 & Over | 65-69 | 70-74 | 75-79 | 80-84 | 85 & Over | 65 & Over | ||
| White | Male | 22,089 | 17,716 | 19,053 | 16,788 | 15,575 | 44,178 | 28,512 | 35,599 | 19,739 | 16,863 | 15,080 | 51,398 |
| Female | 61,455 | 20,109 | 23,692 | 21,521 | 25,062 | 24,852 | 41,039 | 34,866 | 52,187 | 28,654 | 31,635 | 97,799 | |
| Both | 30,234 | 32,062 | 31,102 | 27,462 | 30,537 | 81,762 | 52,840 | 44,439 | 60,723 | 30,779 | 37,923 | 114,393 | |
| NonWhite | Male | 6,615 | 6,695 | 9,789 | 6,726 | 6,028 | 15,914 | 9,992 | 11,011 | 6,021 | 5,462 | 4,759 | 18,232 |
| Female | 19,032 | 8,025 | 8,729 | 9,101 | 7,743 | 8,847 | 14,699 | 18,944 | 16,384 | 13,098 | 9,883 | 38,966 | |
| Both | 9,418 | 11,479 | 12,331 | 10,894 | 11,248 | 26,045 | 19,473 | 24,630 | 16,333 | 15,095 | 10,408 | 50,672 | |
| All Races | Male | 23,550 | 19,188 | 22,393 | 18,136 | 16,076 | 47,292 | 29,841 | 26,794 | 21,340 | 18,231 | 15,813 | 53,851 |
| Female | 21,067 | 23,577 | 25,280 | 26,080 | 26,048 | 62,634 | 42,659 | 37,894 | 55,004 | 31,530 | 31,851 | 102,984 | |
| Both | 33,080 | 32,690 | 36,685 | 28,888 | 31,919 | 86,074 | 56,564 | 49,549 | 63,438 | 35,726 | 38,704 | 124,479 | |
SOURCE: 1984 National Health Interview Survey’s Supplement on Aging.
|
|||||||||||||
| TABLE 4: Standard Errors for Direct Point Estimates of the Percent of Noninstitutionized Americans Aged 65 and Over Who Were Functionally Dependent in 1982 by Age, Sex and Race | |||||||||||||
|---|---|---|---|---|---|---|---|---|---|---|---|---|---|
| Race | Sex | Personal Care Dependent1 | Mobility or Household Activity Dependent2 | ||||||||||
| 65-69 | 70-74 | 75-79 | 80-84 | 85 & Over | 65 & Over | 65-69 | 70-74 | 75-79 | 80-84 | 85 & Over | 65 & Over | ||
| White | Male | 0.60 | 0.61 | 0.94 | 1.97 | 2.73 | 0.45 | 0.71 | 0.91 | 0.10 | 0.19 | 2.70 | 0.47 |
| Female | 0.45 | 0.64 | 0.69 | 1.23 | 1.68 | 0.40 | 0.84 | 0.91 | 1.59 | 1.67 | 2.01 | 0.62 | |
| Both | 0.37 | 0.48 | 0.59 | 0.98 | 1.48 | 0.31 | 0.58 | 0.65 | 1.16 | 1.23 | 1.75 | 0.41 | |
| NonWhite | Male | 1.80 | 2.32 | 4.22 | 6.84 | 11.67 | 1.43 | 2.50 | 3.75 | 2.64 | 6.09 | 9.27 | 1.62 |
| Female | 1.81 | 2.02 | 3.26 | 3.78 | 8.08 | 1.16 | 2.68 | 3.04 | 4.27 | 5.12 | 8.24 | 1.90 | |
| Both | 1.23 | 1.61 | 2.23 | 3.48 | 7.06 | 0.91 | 2.09 | 2.69 | 2.70 | 4.32 | 6.48 | 1.52 | |
| All Races | Male | 0.58 | 0.60 | 0.98 | 1.96 | 2.66 | 0.43 | 0.67 | 0.87 | 0.97 | 1.79 | 2.62 | 0.45 |
| Female | 0.44 | 0.55 | 0.74 | 1.17 | 1.60 | 0.37 | 0.82 | 0.85 | 1.51 | 1.49 | 1.85 | 0.58 | |
| Both | 0.37 | 0.44 | 0.62 | 0.94 | 1.43 | 0.30 | 0.57 | 0.63 | 1.08 | 1.13 | 1.61 | 0.40 | |
SOURCE: 1984 National Health Interview Survey’s Supplement on Aging.
|
|||||||||||||
Regression-Adjusted Results
A model including demographic and contextual variables was fit to the dependent variable, functional dependency. Table 5 presents the survey-weighted results of the log-linear regression analysis. Race, sex, age, age-squared and the categorical variable reflecting the percent of the elderly (65 and older) population who reside in poverty were significant (p<.001) predictors of functional dependency in the overall model. Assuming a true log-linear relationship, the continuous form of the contextual variable (percent elderly population in poverty) statistically would be preferable. However, as we found negligible statistical differences between the continuous and the categorical use of the contextual variable, and as we felt results and examples could more easily be presented with the categorical variable, our results focus on the latter. (Survey-weighted results for the continuous variable are presented in Table 6.)
| TABLE 5: Regression Results: Demographic and Categorical Contextual Variables | |||||||
|---|---|---|---|---|---|---|---|
| Variable | Chi-Square | d.f. | p-value | ||||
| Race | 28.56 | 2 | 0.001 | ||||
| Sex | 217.76 | 2 | 0.001 | ||||
| Age Group | 654.65 | 2 | 0.001 | ||||
| Age Group-Squared | 29.23 | 2 | 0.001 | ||||
| Poverty | 36.66 | 2 | 0.001 | ||||
| Intercept | 1920.81 | 2 | 0.001 | ||||
| Lack of fit chi-square = 128.13, df = 108, p = 0.0906 Model chi-square = 959.14, df = 10, p = 0.001 |
|||||||
|
|||||||
| Variable | Coefficient | Standard Error | Chi-Square | d.f. | p-value | ||
| Race | -0.41 | 0.13 | 12.60 | 1 | 0.001 | ||
| Sex | -0.17 | 0.08 | 4.84 | 1 | 0.028 | ||
| Age Group | -0.59 | 0.03 | 478.96 | 1 | 0.001 | ||
| Age Group-Squared | -0.11 | 0.02 | 26.03 | 1 | 0.001 | ||
| Poverty | -0.35 | 0.07 | 25.57 | 1 | 0.001 | ||
| Intercept | 2.51 | 0.08 | 1030.29 | 1 | 0.001 | ||
|
|||||||
| Variable | Coefficient | Standard Error | Chi-Square | d.f. | p-value | ||
| Race | -0.02 | 0.13 | 0.02 | 1 | 0.877 | ||
| Sex | 0.71 | 0.09 | 62.80 | 1 | 0.001 | ||
| Age Group | -0.20 | 0.03 | 44.47 | 1 | 0.001 | ||
| Age Group-Squared | -0.07 | 0.02 | 7.23 | 1 | 0.007 | ||
| Poverty | -0.15 | 0.08 | 3.51 | 1 | 0.061 | ||
| Intercept | 0.44 | 0.09 | 22.15 | 1 | 0.001 | ||
| TABLE 6: Regression Results: Demographic and Continuous Contextual Variables | |||||||
|---|---|---|---|---|---|---|---|
| Variable | Chi-Square | d.f. | p-value | ||||
| Race | 31.94 | 2 | 0.001 | ||||
| Sex | 219.28 | 2 | 0.001 | ||||
| Age Group | 652.69 | 2 | 0.001 | ||||
| Age Group-Squared | 28.79 | 2 | 0.001 | ||||
| Poverty | 32.19 | 2 | 0.001 | ||||
| Intercept | 998.66 | 2 | 0.001 | ||||
| Lack of fit chi-square = 1232.45, df = 1176, p = 0.1231 Model chi-square = 956.07, df = 10, p = 0.001 |
|||||||
|
|||||||
| Variable | Coefficient | Standard Error | Chi-Square | d.f. | p-value | ||
| Race | -0.46 | 0.12 | 15.78 | 1 | 0.001 | ||
| Sex | -0.17 | 0.08 | 4.96 | 1 | 0.026 | ||
| Age Group | -0.59 | 0.03 | 476.88 | 1 | 0.001 | ||
| Age Group-Squared | -0.11 | 0.02 | 25.59 | 1 | 0.001 | ||
| Poverty | -0.02 | 0.01 | 12.50 | 1 | 0.001 | ||
| Intercept | 2.75 | 0.12 | 492.68 | 1 | 0.001 | ||
|
|||||||
| Variable | Coefficient | Standard Error | Chi-Square | d.f. | p-value | ||
| Race | -0.06 | 0.13 | 0.21 | 1 | 0.650 | ||
| Sex | 0.71 | 0.09 | 63.09 | 1 | 0.001 | ||
| Age Group | -0.20 | 0.03 | 43.73 | 1 | 0.001 | ||
| Age Group-Squared | -0.07 | 0.02 | 7.04 | 1 | 0.008 | ||
| Poverty | 0.00 | 0.01 | 0.00 | 1 | 0.971 | ||
| Intercept | 0.39 | 0.14 | 7.40 | 1 | 0.007 | ||
In our analysis we found that three additional contextual variables (both in their continuous and categorical forms) were significant predictors of functional dependency: the number of heating degree days (a variable reflective of climate and a proxy for geographic region); the ratio of Medicaid recipients to the population below poverty (a measure of access to health care services); and the number of unoccupied nursing home beds per 1000 elderly (a measure of the supply of beds relative to the demand for them). When each of these variables was added to the model with race, sex, age, and age-squared each was significant (p<.02). However, when more than one of the community variables was included in the model, only the poverty variable remained significant (p<.10).
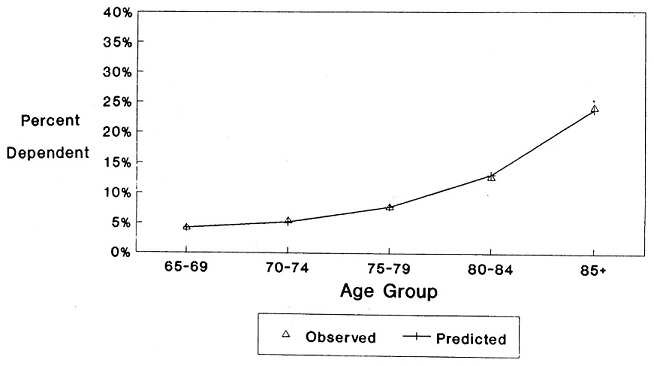
The fit of the model which included the categorical poverty variable as the only contextual variable was evaluated with the log-likelihood ratio chi-square statistic. Since the statistic was nonsignificant, the use of the model was supported. The need for pairwise interactions of the variables was evaluated and determined to be unnecessary.
Further evaluation of the fit of the model was done by plotting the observed age-specific rates of dependency and the regression-predicted rates of dependency. As can be seen from Figure 1 and Figure 2, the predicted rate of both ADL (Figure 1) and IADL (Figure 2) dependency closely approximate the observed rates. However, when the population is divided into smaller subgroups, such as nonwhite females, the model fits somewhat less well (Figure 3).
| FIGURE 1: ADL Dependent Population |
 |
| FIGURE 2: IADL Dependent Population |
 |
| FIGURE 3: ADL Dependent Nonwhite Female Population |
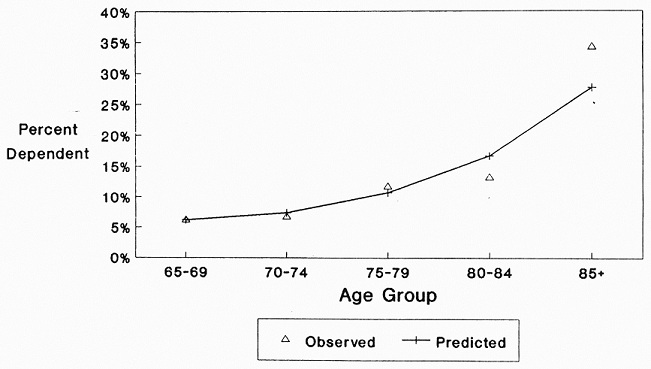 |
Table 7 presents the regression-adjusted estimates of the prevalence of ADL dependency and Table 8 of IADL dependency. As the poverty variable has 3 values (less than 8%, between 8 and 15%, and over 15% of the elderly population residing in poverty), 3 sets of estimates are produced--one for communities with low rates of poverty, one for communities with moderate rates, and one for communities with high rates of poverty among the elderly. As can be seen in the tables, results showed the likelihood of ADL and IADL dependency increases quadratically with age, and also increases with being nonwhite, and with an increasing percent of the elderly population residing in poverty. The likelihood of IADL dependency also increases with being female, but the likelihood of being ADL dependent does not increase uniformly with being female. Although the likelihood of being ADL dependent is in general higher for females than males until age 80 in communities of low and moderate levels of poverty, and until age 75 for those in high poverty communities, after these ages the percent of noninstitutionalized males with an ADL impairment is either equal to or greater than that of females.
| TABLE 7: Regression-Adjusted Estimates of the Percentage of ADL Dependent Elderly Americans Living in the Community by Age, Sex and Race | |||||||
|---|---|---|---|---|---|---|---|
| Race | Sex | 65-69 | 70-74 | 75-79 | 80-84 | 85 & Over | 65 & Over |
| LOW POVERTY COMMUNITY | |||||||
| White | Male | 2.5 | 3.2 | 4.9 | 9.1 | 18.8 | 4.3 |
| Female | 2.8 | 3.4 | 5.1 | 9.0 | 17.4 | 5.6 | |
| Both | 2.7 | 3.4 | 5.1 | 9.0 | 17.7 | 5.1 | |
| NonWhite | Male | 3.7 | 4.6 | 7.0 | 12.4 | 24.1 | 6.5 |
| Female | 3.9 | 4.8 | 7.0 | 11.7 | 21.1 | 6.1 | |
| Both | 3.8 | 4.8 | 7.0 | 11.8 | 23.0 | 6.2 | |
| All Races | Male | 2.7 | 3.3 | 5.1 | 9.3 | 19.9 | 4.5 |
| Female | 2.9 | 3.6 | 5.3 | 9.3 | 17.5 | 5.6 | |
| Both | 2.8 | 3.5 | 5.2 | 9.3 | 18.1 | 5.2 | |
| MODERATE POVERTY COMMUNITY | |||||||
| White | Male | 3.5 | 4.4 | 6.7 | 12.1 | 23.9 | 6.4 |
| Female | 3.8 | 4.7 | 6.9 | 11.7 | 21.5 | 7.2 | |
| Both | 3.7 | 4.6 | 6.8 | 11.8 | 22.2 | 6.9 | |
| NonWhite | Male | 5.1 | 6.3 | 9.4 | 16.2 | 29.7 | 7.9 |
| Female | 5.3 | 6.4 | 9.1 | 14.8 | 25.5 | 9.0 | |
| Both | 5.2 | 6.4 | 9.3 | 15.3 | 26.4 | 8.5 | |
| All Races | Male | 3.7 | 4.6 | 6.9 | 12.4 | 24.0 | 6.5 |
| Female | 3.9 | 4.8 | 7.0 | 11.9 | 21.7 | 7.3 | |
| Both | 3.8 | 4.7 | 6.9 | 12.0 | 22.4 | 7.0 | |
| HIGH POVERTY COMMUNITY | |||||||
| White | Male | 4.9 | 6.1 | 9.1 | 15.9 | 29.7 | 8.4 |
| Female | 5.2 | 6.3 | 9.1 | 14.9 | 26.2 | 9.0 | |
| Both | 5.1 | 6.2 | 9.1 | 15.3 | 27.3 | 8.8 | |
| NonWhite | Male | 7.0 | 8.5 | 12.5 | 20.7 | 35.9 | 11.4 |
| Female | 7.1 | 8.4 | 11.8 | 18.4 | 30.2 | 11.3 | |
| Both | 7.1 | 8.5 | 12.0 | 19.0 | 32.3 | 11.3 | |
| All Races | Male | 5.2 | 6.4 | 9.7 | 16.4 | 30.6 | 8.9 |
| Female | 55 | 6.7 | 9.5 | 15.5 | 26.7 | 9.4 | |
| Both | 5.3 | 6.6 | 9.6 | 15.8 | 28.0 | 9.2 | |
| TABLE 8: Regression-Adjusted Estimates of the Percentage of IADL Dependent Elderly Americans Living in the Community by Age, Sex and Race | |||||||
|---|---|---|---|---|---|---|---|
| Race | Sex | 65-69 | 70-74 | 75-79 | 80-84 | 85 & Over | 65 & Over |
| LOW POVERTY COMMUNITY | |||||||
| White | Male | 5.2 | 6.6 | 8.9 | 12.5 | 17.3 | 7.3 |
| Female | 11.7 | 14.4 | 18.8 | 25.2 | 32.5 | 17.5 | |
| Both | 8.7 | 11.5 | 14.5 | 22.0 | 29.4 | 13.5 | |
| NonWhite | Male | 7.5 | 9.3 | 12.3 | 16.7 | 21.7 | 10.3 |
| Female | 16.2 | 19.7 | 25.0 | 32.0 | 38.7 | 21.1 | |
| Both | 12.0 | 17.0 | 17.7 | 29.3 | 27.7 | 16.7 | |
| All Races | Male | 5.5 | 6.8 | 9.2 | 12.7 | 18.2 | 7.6 |
| Female | 12.2 | 15.2 | 19.2 | 25.9 | 32.8 | 17.9 | |
| Both | 9.1 | 12.2 | 14.7 | 22.7 | 29.2 | 13.8 | |
| MODERATE POVERTY COMMUNITY | |||||||
| White | Male | 6.3 | 7.8 | 10.4 | 14.4 | 18.9 | 9.0 |
| Female | 13.8 | 16.9 | 21.7 | 28.2 | 34.8 | 19.9 | |
| Both | 10.4 | 13.1 | 17.3 | 23.5 | 29.9 | 15.5 | |
| NonWhite | Male | 8.9 | 11.0 | 14.3 | 18.8 | 23.1 | 11.8 |
| Female | 18.9 | 22.7 | 28.2 | 35.0 | 40.4 | 25.2 | |
| Both | 13.8 | 17.6 | 21.4 | 28.9 | 36.6 | 19.1 | |
| All Races | Male | 6.5 | 8.1 | 10.7 | 14.6 | 19.1 | 9.2 |
| Female | 14.1 | 17.3 | 22.0 | 28.6 | 35.1 | 20.2 | |
| Both | 10.6 | 13.4 | 17.5 | 23.8 | 30.2 | 15.7 | |
| HIGH POVERTY COMMUNITY | |||||||
| White | Male | 7.5 | 9.3 | 12.2 | 16.3 | 20.3 | 10.5 |
| Female | 16.2 | 19.6 | 24.7 | 31.1 | 36.5 | 22.1 | |
| Both | 12.4 | 15.2 | 19.7 | 25.9 | 31.1 | 17.3 | |
| NonWhite | Male | 10.5 | 12.8 | 16.3 | 20.8 | 24.1 | 14.1 |
| Female | 21.7 | 25.8 | 31.4 | 37.6 | 41.3 | 28.3 | |
| Both | 17.3 | 21.1 | 25.5 | 33.5 | 35.0 | 23.1 | |
| All Races | Male | 7.9 | 9.8 | 12.9 | 16.8 | 20.9 | 11.0 |
| Female | 17.0 | 20.8 | 25.9 | 32.3 | 37.1 | 23.2 | |
| Both | 13.1 | 16.2 | 20.7 | 27.1 | 31.6 | 18.3 | |
Regression-Adjusted Synthetic Estimates
Percentages generated with the regression models can be multiplied by corresponding population estimates for specific geographic areas of interest to generate estimates of the number of noninstitutionalized functionally dependent elderly in a given community. Population subgroups, of course, are defined by the explanatory variables included in the model.
As mentioned earlier, as intercensal data are not readily available for the elderly population in small age intervals by race and sex for small areas, we elected to use Medicare Enrollment data for the production of our estimates. Although Medicare data, given its level of detail and recency, are the best available data for our purposes, two adjustments had to be made to it prior to estimation.
First, only 95% of elderly Americans are enrolled in Medicare, thus requiring that we inflate the numbers to be reflective of the total elderly population. As the percent enrolled varies little across sex or family income groups, but does differ across race groups (Ries 1987) adjustments were made which accounted for the race difference. Specifically, the number of white elderly Medicare enrollees was inflated by 4.4%, and the number of nonwhite elderly enrollees was inflated by 13.5%.
Second, because Medicare Enrollment data includes both the noninstitutionalized and institutionalized elderly population, and rates produced with the combined data set (1984 NHIS-SOA and ARF) are applicable for the noninstitutionalized population only, an adjustment had to be made to the data prior to producing the synthetic estimates. The adjustment entailed subtracting the estimated number of institutionalized elderly from the total population in a community. Using the 1985 National Nursing Home Survey and the 1985 National Health Interview Survey, a logistic regression equation was produced to estimate rates of institutionalization among the elderly population at the national level. Candidate explanatory variables for inclusion in the model included those variables available on the merged data set for which corresponding population data existed. Given this constraint, age (in five year intervals from 65 to 85 and over), sex, race (white and nonwhite), and geographic region (northeast, north central, south, and west), as well as their pairwise interactions and transformations were available for use. Region was included in the model as the supply of nursing home beds, and thus rates of institutionalization, are known to vary geographically. The model found to best fit the data included age, age-squared, sex and an indicator variable reflecting whether or not the individual resided in the north central region of the country. Appendix B presents results of the logistic model. Estimates produced from this model were used to deflate the state and county population data to be representative of the noninstitutionalized elderly population.
By applying the rates of dependency generated by the log-linear regression model (which included race, sex, age, age-squared, and the percent of the elderly who reside in poverty) to the adjusted Medicare data, we produced estimates for each state, and the largest county in each state (Table 9 and Table 10).
| TABLE 9: 1986 Dependent Noninstitutionalized Elderly Population by State: Regression-Adjusted Synthetic Estimates | |||||||
|---|---|---|---|---|---|---|---|
| State | Elderly Populations |
Number Dependent | Percent Dependent | ||||
| Total | ADL | IADL | Total | ADL | IADL | ||
| California | 2,685,304 | 521,891 | 147,505 | 374,386 | 19.4 | 5.5 | 13.9 |
| New York | 2,169,180 | 521,526 | 162,389 | 359,137 | 24.0 | 7.5 | 16.6 |
| Florida | 1,880,487 | 426,861 | 133,050 | 293,811 | 22..7 | 7.1 | 15.6 |
| Texas | 1,475,817 | 409,903 | 139,822 | 270,081 | 27.38 | 9.5 | 18.3 |
| Pennsylvania | 1,634,088 | 376,538 | 115,873 | 260,665 | 23.0 | 7.1 | 16.0 |
| Illinois | 1,278,849 | 300,132 | 92,840 | 207,292 | 23.5 | 7.3 | 16.2 |
| Ohio | 1,239,037 | 284,862 | 87,738 | 197,124 | 23.0 | 7.1 | 15.9 |
| Michigan | 1,001,901 | 229,029 | 70,624 | 158,405 | 22.9 | 7.0 | 15.8 |
| New Jersey | 935,069 | 215,410 | 66,269 | 149,141 | 23.0 | 7.1 | 15.9 |
| North Carolina | 699,501 | 195,934 | 65,655 | 130,279 | 28.0 | 9.4 | 18.6 |
| Missouri | 640,658 | 180,495 | 61,902 | 118,593 | 28.2 | 9.7 | 18.5 |
| Massachusetts | 749,017 | 177,057 | 55,050 | 122,007 | 23.6 | 7.3 | 16.3 |
| Georgia | 570,835 | 163,071 | 54,646 | 108,425 | 28.6 | 9.6 | 19.0 |
| Virginia | 564,433 | 158,247 | 53,509 | 104,738 | 28.0 | 9.5 | 18.6 |
| Tennessee | 551,947 | 154,822 | 52,591 | 102,231 | 28.1 | 9.5 | 18.5 |
| Indiana | 614,558 | 141,704 | 43,800 | 97,904 | 23.1 | 7.1 | 15.9 |
| Wisconsin | 593,261 | 136,679 | 42,885 | 93,794 | 23.0 | 7.2 | 15.8 |
| Alabama | 470,932 | 136,220 | 46,280 | 89,940 | 28.9 | 9.8 | 19.1 |
| Louisiana | 426,880 | 125,130 | 42,983 | 82,147 | 29.3 | 10.1 | 19.2 |
| Kentucky | 418,922 | 115,895 | 39,612 | 76,283 | 27.7 | 9.5 | 18.2 |
| Minnesota | 487,274 | 114,774 | 36,478 | 78,296 | 23.6 | 7.5 | 16.1 |
| Washington | 492,373 | 111,303 | 34,826 | 76,477 | 22.6 | 7.1 | 15.5 |
| Oklahoma | 383,233 | 107,760 | 37,049 | 70,711 | 28.1 | 9.7 | 18.5 |
| Maryland | 439,074 | 103,331 | 31,767 | 71,564 | 23.5 | 7.2 | 16.3 |
| South Carolina | 339,007 | 95,562 | 31,845 | 63,717 | 28.2 | 9.4 | 18.8 |
| Connecticut | 403,889 | 92,857 | 28,771 | 64,086 | 23.0 | 7.1 | 15.9 |
| Iowa | 387,728 | 91,976 | 29,141 | 62,835 | 23.7 | 7.5 | 16.2 |
| Arkansas | 321,450 | 90,470 | 31,139 | 59,331 | 28.1 | 9.7 | 18.5 |
| Mississippi | 299,024 | 89,953 | 31,064 | 58,889 | 30.1 | 10.4 | 19.7 |
| Arizona | 379,578 | 82,697 | 25,501 | 57,196 | 21.8 | 6.7 | 15.1 |
| Oregon | 341,834 | 77,330 | 24,273 | 53,057 | 22.6 | 7.1 | 15.5 |
| Kansas | 302,189 | 72,273 | 22,868 | 49,405 | 23.9 | 7.6 | 16.3 |
| West Virginia | 240,253 | 65,472 | 22,317 | 43,155 | 27.3 | 9.3 | 18.0 |
| Colorado | 276,104 | 63,173 | 19,751 | 43,422 | 22.9 | 7.2 | 15.7 |
| Nebraska | 199,665 | 47,939 | 15,291 | 32,648 | 24.0 | 7.7 | 16.4 |
| Maine | 150,401 | 41,482 | 14,291 | 27,191 | 27.6 | 9.5 | 18.1 |
| New Mexico | 135,274 | 36,127 | 12,405 | 23,722 | 26.7 | 9.2 | 17.5 |
| Rhode Island | 135,224 | 31,443 | 9,707 | 21,736 | 23.3 | 7.2 | 16.1 |
| Idaho | 106,134 | 27,933 | 9,641 | 18,292 | 26.3 | 9.1 | 17.2 |
| Utah | 123,388 | 27,495 | 8,577 | 18,918 | 22.3 | 7.0 | 15.3 |
| Hawaii | 104,726 | 27,006 | 8,674 | 18,332 | 25.8 | 8.3 | 17.5 |
| New Hampshire | 114,532 | 26,237 | 8,155 | 18,082 | 22.9 | 7.1 | 15.8 |
| South Dakota | 93,402 | 26,148 | 9,186 | 16,962 | 28.0 | 9.8 | 18.2 |
| District of Co | 71,493 | 23,805 | 8,134 | 15,671 | 33.3 | 11.4 | 21.9 |
| North Dakota | 82,782 | 22,777 | 7,993 | 14,784 | 27.5 | 9.7 | 17.9 |
| Montana | 92,485 | 20,813 | 6,567 | 14,246 | 22.5 | 7.1 | 15.4 |
| Nevada | 94,468 | 19,249 | 5,845 | 13,404 | 20.4 | 6.2 | 14.2 |
| Delaware | 69,335 | 15,969 | 4,920 | 11,049 | 23.0 | 7.1 | 15.9 |
| Vermont | 61,306 | 14,244 | 4,470 | 9,774 | 23.2 | 7.3 | 15.9 |
| Wyoming | 39,492 | 8,928 | 2,814 | 6,114 | 22..6 | 7.1 | 15.5 |
| Alaska | 17,124 | 3,676 | 1,138 | 2,538 | 21.5 | 6.6 | 14.8 |
| TABLE 10: 1986 Dependent Noninstitutionalized Elderly Population by County: Regression-Adjusted Synthetic Estimates | |||||||
|---|---|---|---|---|---|---|---|
| State | Elderly Populations |
Number Dependent | Percent Dependent | ||||
| Total | ADL | IADL | Total | ADL | IADL | ||
| Los Angeles, CA | 770,182 | 184,822 | 57,601 | 127,221 | 24.0 | 7.5 | 16.5 |
| Cook, IL | 566,715 | 135,009 | 41,486 | 93,523 | 23.8 | 7.3 | 16.5 |
| Philadelphia, PA | 240,807 | 71,559 | 24,182 | 47,377 | 29.7 | 10.0 | 19.7 |
| Dade, FL | 231,893 | 66,997 | 23,245 | 43,752 | 28.9 | 10.0 | 18.9 |
| Queens, NY | 253,293 | 61,693 | 19,097 | 42,596 | 24.4 | 7.5 | 16.8 |
| Wayne, MI | 247,654 | 59,915 | 18,469 | 41,446 | 24.2 | 7.5 | 16.7 |
| Cuyahoga, OH | 203,551 | 47,719 | 14,604 | 33,115 | 23.4 | 7.2 | 16.3 |
| Maricopa, AZ | 213,577 | 46,918 | 14,419 | 32,499 | 22.0 | 6.8 | 15.2 |
| Harris, TX | 164,488 | 38,936 | 11,922 | 27,014 | 23.7 | 7.2 | 16.4 |
| King, WA | 148,252 | 34,343 | 10,715 | 23,628 | 23.2 | 7.2 | 15.9 |
| Middlesex, MA | 160,087 | 32,144 | 9,062 | 23,082 | 20.1 | 5.7 | 14.4 |
| Balt. City, MD | 103,576 | 31,189 | 10,547 | 20,642 | 30.1 | 10.2 | 19.9 |
| Jefferson, AL | 85,278 | 25,716 | 8,756 | 16,960 | 30.2 | 10.3 | 19.9 |
| Hennepin, MN | 106,475 | 25,701 | 8,071 | 17,630 | 24.1 | 7.6 | 16.6 |
| New Haven, CT | 106,378 | 24,590 | 7,607 | 16,983 | 23.1 | 7.2 | 16.0 |
| Milwaukee, WI | 122,379 | 24,335 | 6,812 | 17,523 | 19.9 | 5.6 | 14.3 |
| Shelby, TN | 78,581 | 23,878 | 8,138 | 15,740 | 30.4 | 10.4 | 20.0 |
| St. Louis, MO | 112,770 | 21,853 | 6,088 | 15,765 | 19.4 | 5.4 | 14.0 |
| Bergen, NJ | 114,975 | 21,774 | 6,080 | 15,694 | 18.9 | 5.3 | 13.6 |
| Providence, RI | 86,172 | 20,369 | 6,300 | 14,069 | 23.6 | 7.3 | 16.3 |
| Honolulu, HI | 76,008 | 19,656 | 6,263 | 13,393 | 25.9 | 8..2 | 17.6 |
| Orleans, LA | 61,464 | 19,335 | 6,630 | 12,705 | 31.5 | 10.8 | 20.7 |
| Multnomah, OR | 79,847 | 19,274 | 6,069 | 13,205 | 24.1 | 7.6 | 16.5 |
| Jefferson, KY | 79,520 | 19,164 | 5,889 | 13,275 | 24.1 | 7.4 | 16.7 |
| Fulton, GA | 60,972 | 18,991 | 6,416 | 12,575 | 31.1 | 10.5 | 20.6 |
| Oklahoma, OK | 65,010 | 18,351 | 6,231 | 12,120 | 28.2 | 9.6 | 18.6 |
| Marion, IN | 61,372 | 16,774 | 4,757 | 12,017 | 27.3 | 7.8 | 19.6 |
| Denver, CO | 62,887 | 15,395 | 4,838 | 10,557 | 24.5 | 7.7 | 16.8 |
| Salt Lake, UT | 51,619 | 11,630 | 3,613 | 8,017 | 22.5 | 7.0 | 15.5 |
| Clark, NV | 54,643 | 11,017 | 3,321 | 7,696 | 20.2 | 6.1 | 14.1 |
| Pulaski, AR | 35,744 | 10,363 | 3,520 | 6,843 | 29.0 | 9.8 | 19.1 |
| New Castle, DE | 43,351 | 10,037 | 3,083 | 6,954 | 23.2 | 7.1 | 16.0 |
| Mecklenburg, NC | 41,666 | 10,008 | 3,041 | 6,967 | 24.0 | 7.3 | 16.7 |
| Douglas, NE | 41,539 | 9,993 | 3,109 | 6,884 | 24.1 | 7.5 | 16.6 |
| Greenville, SC | 34,633 | 9,490 | 3,144 | 6,346 | 27.4 | 9.1 | 18.3 |
| Sedgwick, KS | 40,088 | 9,250 | 2,848 | 6,402 | 23.1 | 7.1 | 16.0 |
| Bernalillo, NM | 41,124 | 9,109 | 2,800 | 6,309 | 22.2 | 6.8 | 15.3 |
| Hinds, MS | 26,593 | 8,150 | 2,787 | 5,363 | 30.6 | 10.5 | 20.2 |
| Polk, IA | 33,580 | 7,964 | 2,464 | 5,500 | 23.7 | 7.3 | 16.4 |
| Hillsborough, NH | 31,881 | 7,336 | 2,259 | 5,077 | 23.0 | 7.1 | 15.9 |
| Cumberland, ME | 29,557 | 6,954 | 2,171 | 4,783 | 23.5 | 7.3 | 16.2 |
| Kanawha, WV | 30,412 | 6,925 | 2,121 | 4,804 | 22.8 | 7.0 | 15.8 |
| Ada, OD | 18,190 | 4,059 | 1,261 | 2,798 | 22.3 | 6.9 | 15.4 |
| Minnehaha, SD | 12,809 | 3,007 | 947 | 2,060 | 23.5 | 7.4 | 16.1 |
| Henrico, VA | 12,621 | 2,813 | 949 | 1,965 | 22.3 | 6.7 | 15.6 |
| Yellowstone, MT | 11,424 | 2,552 | 794 | 1,758 | 22.3 | 7.0 | 15.4 |
| Chittenden, VT | 9,685 | 2,276 | 704 | 1,572 | 23.5 | 7.3 | 16.2 |
| Cass, ND | 8,645 | 2,056 | 655 | 1,401 | 23.8 | 7.6 | 16.2 |
| Laramie, WY | 5,667 | 1,303 | 411 | 892 | 23.0 | 7.3 | 15.7 |
| Anchorage, AK | 5,786 | 1,168 | 346 | 822 | 20.2 | 6.0 | 14.2 |
These estimates are based upon three assumptions. First that the race, sex, age, and poverty-specific disability rates from the 1984 NHIS-SOA did not change between 1984 and 1986. Second, that the relationship between dependency and race, sex, age, and the percent of the elderly residing in poverty is the same for a small area as it is for national averages. And third, that race, sex, age, and the percent of the elderly residing in poverty are the only important predictors of functional dependency. Thus, the estimates will err to the extent that the relationship between dependency and race, sex, age, and poverty in a community have changed over time; to the extent that the relationships vary from national averages; and to the extent to which other known or unknown factors which are not in the model strongly influence functional dependency. The latter two reflect phenomena which could occur due to variations in the health of the local aged population from national norms. For example, estimates produced would likely underestimate the prevalence of functional dependency in a community where some disabling disease was highly prevalent, but overestimate the prevalence in a community such as Miami, where there is a large concentration of well elderly.
DISCUSSION
The variables found to be significant correlates of functional dependency suggest some interesting implications. They confirm the strong relationship reported by other researchers between dependency and age, as well as the variation in age-specific rates of dependency between men and women, and whites and nonwhites. Explication of the underlying determinants of these variations are beyond the scope of this paper but reconfirming their importance suggests the need for policies and research agendas sensitive to these relationships and variations. Of particular importance is the quadratic relationship between age and dependency, meaning that with each passing five year interval rates of dependency increase at an increasing rate--a sobering prospect given the rapid expansion of the oldest old population.
Introduction of a contextual variable into the multivariate regression model may be unique in this analysis but appears overdue. The results here, which are consistent with other researchers' work, suggest that just as poverty is a strong correlate of many unwanted problems in youth and adulthood, so, too, its sequela are present in old age, manifesting themselves as higher dependency rates. Poverty rates among the elderly are known to correlate with a number of important health care system variables including the nursing home bed supply and use rates, Medicaid generosity, and the poor population's life styles, educational levels and occupational experiences.
The estimates produced here are likely to be most useful as initial building blocks for estimating long-term care service demand. A major barrier to cost-effective home and community care has been poor estimates of the rates of enrollment in such programs. Often, the result has been lower-than-expected attendance and, consequently, higher unit costs associated with operating below capacity. While functional dependency estimates at the small area level will not translate directly to demand for service, previous research has shown that utilization of health care services is closely related to need (Andersen et al. 1983; Hulka and Wheat 1985). They may also enhance understanding of some of the variation in the supply of long-term institutional care settings from region to region, state to state, and county to county. While many of the determinants of variation in both demand and supply are likely to defy measurement, either because they are stochastic (e.g. disease onset) or they are difficult to measure (e.g. political preferences of legislators and regulators in the case of supply), "need" estimates provide a useful starting point for planning.
Finally, it should be noted that while the data support the use of these equations to produce estimates of functional dependency among the noninstitutionalized elderly population, the quality of the small area estimates produced by them still needs to be evaluated in future research.
LITERATURE CITED
Andersen RM, McCutcheon A, Aday LA, Chiu CY and Bell R: Exploring Dimensions of Access to Medical Care. Health Services Research 1983; 18:49-74.
Australian Bureau of Statistics, Nicholls A: A Regression Approach to Small Area: Canbarra, Australia, 1977, mimeograph.
Branch LG, Katz S, Kniepmann K and Papsidero J: A Prospective Study of Functional Status Among Community Elders. American Journal of Public Health 1984; 74(3):266-268.
Cohen SB, Kalsbeek WD, and Koch GG: An Alternative Strategy for Estimating the Parameters of Local Areas. Proceedings of the Social Statistics Section. American Statistical Association 1977; 781-785.
Dawson D, Hendershot G and Fulton J: Aging in the Eighties Functional Limitations of Individuals Age 65 Years and Over. National Center for Health Statistics Advanced Data, No 133. Department of HHS, June 10, 1987.
Diffendal GJ, Isaki CT and Malec D: Some Small Area Adjustment Methodologies Applied to the 1980 Census. Proceeding of the Section on Survey Research Methods. American Statistical Association 1983; 164-167.
DiGaetano R, Waksberg J, Mackenzie E and Yaffe R: Synthetic Estimators for Small Areas from the Health Interview Survey. Proceedings of the Section on Survey Research Methods. American Statistical Association 1980; 46-55.
Ericksen EP: A Method for Combining Sample Survey Data and Symptomatic Indicator to Obtain Population Estimates for Local Areas. Demography 1973; 10:137-160.
Ericksen EP: A Regression Method for Estimating Population Changes of small Areas. Journal of the American Statistical Association 1974; 69:867-875.
Feller BA: Americans Needing Help to Function at Home. NCHS Advanced Data, No. 92. Department of Health and Humans Services, September 14, 1983.
Gonzalez ME and Hoza C: Small Area Estimation with Application to Unemployment and Housing Estimates. Journal of the American Statistical Association 1978; 73:7-15.
Haber LD: Disabling Effects of Chronic Disease and Impairment. Journal Chronic Disease 1971; 24(7/8):469-487.
Haber LD: Disabling Effects of Chronic Disease and Impairment--II Functional Capacity Limitations. Journal of Chronic Disease 1973; 26(3):127-151.
Heeringa SG: Statistical Models for Small Area Estimation. Proceedings of the Social Statistics Section. American Statistical Association 1982; 126-132.
Holt D: A Model-Based Approach to Estimation for Small Subgroups of a Population. Journal of the American Statistical Association 1979; 74:405-410.
Hulka BS and Wheat JR: Patterns of Utilization: the Patients Perspective. Medical Care 1985; 23:438-459.
Jacobs B: The National Potential of Home Equity Conversion. The Gerontologist 1986; 26(5):496-504.
Jacobs B and Weissert WG: Helping Protect the Elderly and the Public Against the Catastrophic Costs of Long-Term Care. Journal of Policy Analysis and Management 1986; 5(2):378-383.
Jette AM and Branch LG: The Framingham Disability Study: II Physical Disability among the Aging. American Journal of Public Health 1981; 71(11):1211-1216.
Jette AM and Branch LG: Impairment and Disability in the Aged. Journal of Chronic Disease 1985; 38(1):59-65.
Kalsbeek WD: A Method for Obtaining Small Postcensal Estimates for Several Types of Variables. Unpublished doctoral dissertation, University of Michigan, 1973.
Kane RA and Kane RL: Assessing the Elderly. Lexington Books: Lexington, 1981.
Katz S: Assessing Self-maintenance: Activities of Daily Living, Mobility, and Instrumental Activities of Daily Living. Journal of the American Geriatrics Society 1983; 31(12):721-727.
Katz S, Branch LG, Branson MH, Papsidero JA, Beck JC and Greer DS: Active Life Expectancy. New England Journal of Medicine 1983; 309(20):1218-1224.
Laake P: A Prediction Approach to Subdomain Estimation in Finite Populations. Journal of the American Statistical Association 1979; 74: 355-358.
Levy PS: Small Area Estimation--Synthetic and Other Procedures 1968-1978. In: Steinberg J (ed): Synthetic Estimates for Small Areas. NIDA Research Monograph 24. Rockville, MD: National Institute on Drug Abuse, 1979.
Manton KG: A Longitudinal Study of Functional Change and Mortality in the United States. Journal of Gerontology 1988; 43(5):S153-161.
Manton KG and Soldo B: Dynamics of Health Changes in the Oldest Old: New Perspectives and Evidence. Milbank Memorial Fund Quarterly/Health and Society 1985; 63(2):206-285.
Naji SZ: An Epidemiology of Disability Among Adults in the United States. Milbank Memorial Fund Quarterly/Health and Society 1976; 54(4):439-468.
Newman SJ: Housing and Long-Term Care--The Suitability of the Elderly's Housing to the Provision of In-Home Services. The Gerontologist 1985; 25(1):35-40.
Palmore EB, Nowlin JB and Wang HS: Predictors of Function Among the Old-Old: A 10-Year Follow-Up. Journal of Gerontology 1985; 40(2):244-250.
Pinsky JL, Leaverton PE and Stokes J: Predictors of Good Function: The Framingham Study. Journal of Chronic Disease 1987; 40(Suppl.1):159S-167S.
Ries P: Health Care Coverage by Age, Sex, Race, and Family Income: United States, 1986. National Center for Health Statistics Advanced Data, No. 139. Dept. HHS, September 18, 1987.
Royall RM: Statistical theory of small area estimation--use of predictor models. Unpublished technical report prepared under contract from the National Center for Health Statistics, 1977.
Scanlon WJ: Nursing Home Utilization Patterns: Implications for Policy. Journal of Health Politics Policy and Law 1980; 4(4):619-641.
Scanlon WJ: A Theory of the Nursing Home Market. Inquiry 1980; 17(spring):25-41.
Shah BV, Folsom RE, Harrell FE, and Dillard CN: Survey Data Analysis Software for Logistic Regression. Research Triangle Institute, Nov. 29, 1984.
Shah BV: SESUDAAN: Standard Errors Program for Computing of Standardized Rates from Sample Survey Data. Research Triangle Institute, April 1981.
Shanas E: The Health of Older People: A Social Survey. Harvard University Press: Cambridge, 1962.
Shanas E, Townsend P, Wedderburn D, Friis H, Milhoj P and Stenower J: Old People in Three Industrial Societies. Atherton Press: New York, 1968.
Somers A: Insurance for Long-Term Care: Some Definitions, Problems, and Guidelines for Action. New England Journal of Medicine 1987; 317(1):23-29.
Unger A and Weissert WG: Data for Long-Term Care Planning: Application of a Synthetic Estimation Technique. Research on Aging 1988; 10(2):194-219.
Weissert WG: Estimating the Long-term Care Population: Prevalence Rates and Selected Characteristics. Health Care Financing Review 1985; 6:83-91.
Weissert WG: Hard Choices: Targeting Long-Term Care to the 'At Risk' Aged. Journal of Health Politics Policy and Law 1986; 11(3) :463-481.
Weissert WG and Cready CM: Determinants of Hospital-to-Nursing Home Placement Delays: A Pilot Study. Health Services Research 1988; 23(5):619-647.
Weissert WG and Cready CM: A Prospective Budgeting Model for Home- and Community-Based Long-Term Care. Inquiry 1989; 26(1):in press.
APPENDIX A
The log-linear model used in the analysis produces two sets of parameter estimates: one for the logged ratio of not dependent to ADL dependent, and one for the logged ratio of IADL dependent to ADL dependent. These equations produced from our analysis can be written as:
log (P1/P3) = 2.51 - 0.178 - 0.41R - 0.59A - 0.11A2 - 0.35P
log (P2/P3) = 0.44 + 0.718 - 0.02R - 0.20A - 0.07A2 - 0.15P
where
P2 = the probability of being independent;
P2 = the probability of being IADL dependent;
P3 = the probability of being ADL dependent;
S = sex (coded 1 if female and 0 if male);
R = race (coded 1 if nonwhite and 0 if white);
A = age group (coded -2 if 65-69, -1 if 7074, 0 if 75-79, 1 if 80-84, and 2 if 85 or over);
A2 = the square of the variable “A”; and
P = the percent of elderly in poverty (coded -1 if <8%, 0 if between 8-15% and 1 if >15%).
For ease of illustration, let
E1 = log (P1/P3) and E2 = log (P2/P3).
Taking the exponent of both sides of both equations yields
eE1 = P1/P3 and eE2 = P2/P3
As, by definition P1+P2+P3 = 1, the three equations can be solved simultaneously for P1, P2 and P3. The result is:
P1 = eE1/(1+eE1+eE2)
P2 = eE2/(1+eE1+eE2) and
P3 = 1/(1+eE1+eE2).
APPENDIX B
| Logistic Regression Results: Rate of Nursing Home Institutionalization | |||||
|---|---|---|---|---|---|
| Variable | Coefficient | Standard Error |
Chi-Square | d.f. | p-value |
| Female1 | 0.50 | 0.09 | 30.08 | 1 | 0.001 |
| Age Group2 | 0.85 | 0.04 | 580.17 | 1 | 0.001 |
| Age Group-Square3 | 0.07 | 0.03 | 7.62 | 1 | 0.006 |
| North Central4 | 0.31 | 0.09 | 12.56 | 1 | 0.001 |
| Intercept | -3.67 | 0.10 | 1425.73 | 1 | 0.001 |
Model chi-square = 1013.17, df = 4, p<0.001
|
|||||
ATTACHMENT: Software to Produce Small Area Regression-Adjusted Synthetic Estimates of Functional Dependency Among the Elderly
Prepared by
Jane D. Darter1
Jennifer M. Elston2
William G. Weisssert3
of the
Program on Aging
School of Public Health
The University of North Carolina at Chapel Hill
Under ASPE Grant No. 87ASPE181A,
Assistant Secretary for Planning and Evaluation
United States Department of Health and Human Services
Floyd Brown, Project Office
| SMALL AREA REGRESSION-ADJUSTED SYNTHETIC ESTIMATES OF FUNCTIONAL DEPENDENCY Produced by Program on Aging School of Public Health The University of North Carolina Under ASPE Grant No. 87ASPE181A Press any key to continue … |
|
INTRO 1 OF 6
Press any key to continue … |
|
INTRO 2 OF 6
Press I for future information, or any other key to go to MAINMENU: |
|
INTRO 3 OF 6
Press I for future information, or any other key to go to MAINMENU: |
|
INTRO 4 OF 6
Press I for future information, or any other key to go to MAINMENU: |
|
INTRO 5 OF 6
Press I for future information, or any other key to go to MAINMENU: |
|||||||||||||||||||||||||||||||||||||||||||||||
|
INTRO 6 OF 6
Press any key to go to MAINMENU |
|
MAIN MENU 
Please enter the number corresponding to your choice: _____ |
|
ENTRY MENU
Please enter the number corresponding to your choice: _____ |
|
Please enter the following information about your community:
Press any key to continue ... |
|||||||||||||||||||||||||||||||||||||||||||||||


 keys to move cursor around screen.
|
Select already existing community data
Please enter the number corresponding to your choice: _____ |
|
DISPLAY/PRINT MENU
Please enter the number or letter corresponding to your choice: _____ |
|
ADL DEPENDENT POINT ESTIMATES
Press any key to continue ... |
||||||||||||||||||||||||||||||||||||||||||||||||||||||||||||||||||||||||||||||||||
NOTES
-
Ms. Darter is a programmer with the Program on Aging in the School of Public Health at The University of North Carolina at Chapel Hill.
-
Ms. Elston is a research associate with the Program on Aging in the School of Public Health at The University of North Carolina at Chapel Hill.
-
Dr. Weissert is Professor of Health Policy and Administration and Director of the Program on Aging in School of Public Health at The University of North Carolina at Chapel Hill.