
Ronald J. Ozminkowski, Ph.D., Mark W. Smith, Ph.D., Rosanna M. Coffey, Ph.D., Tami L. Mark, Ph.D., Cheryl A. Neslusan, Ph.D., and John Drabek, Ph.D.
The MEDSTAT Group
"This report was prepared under contract #HHS-100-95-0044 between the U.S. Department of Health and Human Services (HHS), Office of Disability, Aging and Long-Term Care Policy (DALTCP) and the MEDSTAT Group. For additional information about this subject, you can visit the DALTCP home page at http://aspe.hhs.gov/office_specific/daltcp.cfm or contact the ASPE Project Officer, John Drabek, at HHS/ASPE/DALTCP, Room 424E, H.H. Humphrey Building, 200 Independence Avenue, S.W., Washington, D.C. 20201. His e-mail address is: John.Drabek@hhs.gov.
The opinions and views expressed in this report are those of the authors. They do not necessarily reflect the views of the Department of Health and Human Services, the contractor or any other funding organization.
I. INTRODUCTION
A. Background
This report describes research conducted by The MEDSTAT Group for the Department of Health and Human Services, Office of the Assistant Secretary for Planning and Evaluation (hereafter referred to as ASPE). The primary aim of this study has been to explore and document the experience of persons with potentially disabling health conditions in private-sector indemnity and managed care plans. Other than general descriptive information from population-based surveys, little is currently known about this subject. This report fills a major gap in our research knowledge by presenting descriptive findings from a study of the insured populations of two large employers. Both descriptive and multivariate analyses were used to estimate the impact of managed care on health care use by privately insured populations with potentially disabling chronic conditions.
The use of managed health care by private and public payers of health care continues to grow in the United States. For example, enrollment in health maintenance organizations (HMOs) increased by about 85 percent from 1990 to 1996. By 1996 an estimated 67.5 million people (about one in four Americans) were enrolled in HMOs (American Association of Health Plans, 1998).
In the private sector today, more than 70 percent of workers in small and large firms choose a managed care plan (KPMG Peat Marwick, 1997; Jensen, 1997). Among firms with more than 200 employees it is now more common for a firm to offer various types of managed care plans than it is to offer traditional indemnity health insurance. Between 1992 and 1997 the percentage of enrollees covered by indemnity plans offered by large firms declined significantly from 45 percent to less than 20 percent. Conversely, U.S. employers saw substantial increases in enrollment in all types of managed care plans (Figure 1-1).
The growth of managed care has not been without concerns and complaints in recent years. Much of the shift to managed care for employees has not been optional (Center for Studying Health System Change, 1997), and some research has indicated that managed care may not be appropriate for those with special needs, such as the frail elderly and the disabled (Luft, 1991).
Despite concerns about the ability of managed care plans to meet the needs of special populations, certain aspects of managed care can offer better treatment to those with special needs. A single case manager or gatekeeper, for example, may help coordinate the myriad of patient services that is often required by persons with chronic illness or disability, and provide a better match between patient needs and service use (Batten et al., 1994). Managed care may also result in closer monitoring of the patients disease, and more appropriate use of preventive and disease management services that limit complications of disease. If successful, closer patient management may also limit the cost of care while enhancing its quality.
| FIGURE 1-1: Employees in Large Firms Covered by Managed Care and Indemnity Plans |
|---|
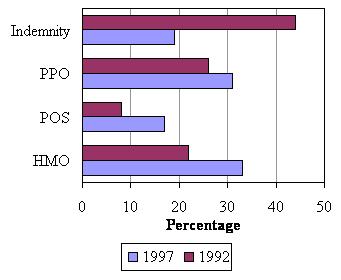 |
| SOURCE: KPMG Peat Marwick (1997). |
B. Why This Study Was Conducted
According to the 1989 National Health Interview Survey, about 48 percent of those with disabling conditions were treated in private-sector indemnity and managed care plans. However, very little is known about how persons with potentially disabling conditions fare in private-sector plans. Information on their demographics, case mix, service use, and outcomes is scarce in the health services literature. The ASPE Private Payers Study was conducted to learn more about how chronically ill, potentially disabled people fare in managed care plans in comparison to indemnity plans offered by large employers.
Using data from the two employers health plans, this report first illustrates similarities and differences between those covered by indemnity and managed care plans. Second, we present findings on the impact of managed care on health care utilization and expenditures for those with potentially disabling chronic conditions. Third, we illustrate the impact of various methods of risk-adjustment, in order to make inferences about the financial incentives that managed care plans faced to attract or avoid persons with chronic illness.
It is our hope that the information produced by the Private Payers Study will contribute important empirical findings to a small but growing knowledge base, so that policy makers and employers will better understand the characteristics and service needs of those with potentially disabling chronic illness. Policy makers and employers will also better understand the financial incentives and likely impact of managed care for persons with disabilities. This information will provide clues about the potential consequences of expanding managed care options in a variety of both private-sector and public-sector settings.
C. How The Study Was Conducted
Two large employers contributed data for the Private Payers Study. Employer A specializes in communications and electronics, and has offices in 30 cities around the country. Employer B is a large northeastern state government. The data used for this study included (1) health plan enrollment information for members of both employers indemnity and managed care plans, and (2) claims-based information on inpatient, outpatient and pharmacy services used in 1995 by persons covered in these managed care and indemnity plans. More information about the employers and their health plans can be found in the next chapter of this report.
One of the challenges addressed by this study was the difficulty of using only health insurance claims or encounter data to identify chronically ill persons who may be disabled. No survey data were available to identify those with functional limitations in our sample. To address this issue, a physician and clinical coding specialist identified ICD-9-CM diagnosis codes that may be associated with chronic, potentially disabling illness. After subsequent review by ASPE staff and some reconsideration of a first draft, over 320 chronic physical and mental health conditions were identified as potentially leading to serious disability. About 30 additional illnesses were identified as potentially disabling if coupled with high service use. Chapter 3 describes in more detail the process used to identify persons with these conditions.
After we identified chronically ill and potentially disabled persons in the inpatient and outpatient data bases provided by the two employers for this study, we compared the demographic characteristics, case mix, and service use of this group according to their type of coverage. For purposes of this study, managed care refers to health maintenance organizations (HMOs), point of service (POS) plans, and preferred provider organizations (PPOs). The characteristics of these plans are described in Chapter 2. Potentially disabled persons with chronic illnesses who were covered by these plan types were compared to similar persons in the indemnity plans offered by each employer. Chapter 5 presents the descriptive results of these comparisons.
Simple comparisons of demographics, case mix, and service use were supplemented with multiple regression analyses designed to estimate the impact of managed care coverage on service use and health care expenditures, controlling for other factors that may also affect utilization and expenditures. We present the managed care impact estimates in Chapter 6.
Finally, we investigated the application of risk adjustment methods for persons with potentially disabling chronic illnesses. These regression analyses were designed to estimate how much more of the variation in health care expenditures could be accounted for by different methods of measuring the case mix of the group of potentially disabled persons. We conducted separate risk adjustment analyses for physical health problems and mental health problems. The results of these analyses are described in Chapter 7 and Chapter 8, respectively.
D. How This Report is Organized
The rest of this report is divided into seven chapters.
-
Chapter 2 provides information about the indemnity and managed care plans offered by the two employers who contributed data for this study. Chapter 2 also describes earlier research on the impact of managed care for persons with disabilities.
-
Chapter 3 provides the details of the methods used to identify chronically ill, potentially disabled persons with claims and encounter data. The implications of using those methods instead of survey-based approaches are also noted.
-
Chapter 4 describes the research plan for all four analyses conducted in the Private Payers Study. These include the descriptive study noted above, along with the managed care impact study and the two risk-adjustment studies.
-
Chapter 5, Chapter 6, Chapter 7 and Chapter 8 describe the four studies in detail, offering information about rationale, data sources, methods, results, and implications.
In addition to these chapters, several appendices and a detailed reference section are included as supplementary material to the main report.
II. INDEMNITY INSURANCE AND MANAGED CARE FOR PEOPLE WITH DISABILITIES
This chapter provides background information on indemnity and managed care plans. It describes characteristics of managed care in general, provides detail on the plans offered by the two employers who contributed data for the study, and illustrates the relative costs of indemnity insurance and managed care for a hypothetical employee situation.
A. Characteristics of Managed Care
The term managed care means different things to different people. Because of this, its definition may seem somewhat vague and its operational features in one site may be quite different than its operational features in another site. The Managed Health Care Dictionary (Rognehaugh, 1996) defines managed care as "any method of health care delivery designed to reduce unnecessary utilization of services, contain costs, and measure performance, while providing accessible, quality, effective health care" (page 109). Rognehaughgoes on to note that managed health care plans do the following:
- "integrate the financing and management with the delivery of health care services to an enrolled population;
- employ or contract with an organized provider network which delivers services and which either shares financial risk or has some incentive to deliver quality, cost-effective services; and
- use an information system capable of monitoring and evaluating patterns of members' use of medical services and the cost of those services" (p. 110).
Because the methods used to produce managed care vary widely and are limited only by fairly broadly written statutes or regulations, the term 'managed care' should not be viewed as a binary (yes or no) construct. Peter Fox (1997) notes that, in reality, very little care offered in the United States is unmanaged. Today, even traditional indemnity plans typically use some care management techniques, such as precertification for hospital use, second opinion programs for surgical treatment, or other utilization review methods.
The lack of a binary distinction between various forms of managed care and indemnity plans can be seen in Table 2-1. The table notes important characteristics of the managed care and indemnity plans offered by the two employers who contributed data for the Private Payers Study. The information presented here reflects the continuum of managed care; certain types of plans fall closer to one end of the spectrum or another. For example, HMOs and POS plans tend to offer the highest degree of integration of financing and delivery, with less integration in the PPO plan and less still in the indemnity plans. Similarly, risk sharing between health plans and providers tends to be more prominent in the HMOs, less prominent in the POS and PPO plans, and nonexistent in the indemnity plans. For other measures there are more distinct differences between the managed care and indemnity plans. For example, the managed care plans use established networks of providers and either disallow or penalize out-of-network use; this is not the case for the indemnity plans. Because of the variety of methods used to integrate administrative, financial, and delivery aspects of treatment, it is often more appropriate to treat each plan type separately when analyses are completed. This is the approach we adopted in many of the analyses completed for the Private Payers Study.
| TABLE 2-1: Features of the Managed Care and Indemnity Plans in this Study | ||||
|---|---|---|---|---|
| Feature | Health Maintenance Organization (HMO) | Point-of-Service (POS) Plan | Preferred Provider Organization (PPO) | Indemnity Plan |
| Degree of organization/integration of financing and care delivery | High | High | Medium | Low |
| Plan shares financial risk with providers | Yes | With some but not all providers | With some but not all providers | No |
| Capitation is used to pay providers | Some (e.g., primary care) | Some | None | None |
| Fee-schedules or volume discounts are arranged with providers | In some but not all HMOs | In some but not all POS plans | Yes | No |
| A formal network of providers exists | Yes | Yes | Yes | No |
| Out-of-network care is paid for | No | Yes, but with penalty | Yes, but with penalty | Not applicable |
| A primary care gatekeeper is assigned | Yes | Yes | No | No |
| Specialists can be seen without gatekeeper approval | No | No | Yes | Yes |
| Pre-certification or other utilization review is applied | Yes | Yes | Yes | Yes |
| Strong emphasis on disease management programs and/or use of clinical practice guidelines | Yes | Yes | No | No |
| Strong emphasis on preventive services and wellness programs | Yes | Yes | No | No |
B. Features of the Plans Offered by the Two Employers
Two employers contributed inpatient and outpatient data for this study. Employer A is a large firm specializing in various forms of electronic products, media and communications equipment. Although it has offices in more than 30 cities across the U.S., the structure of health insurance benefits is very similar across locations. Each location offered an indemnity plan and a POS plan. The benefits offered in these plans were the same, but the POS plan required lower co-payments and deductibles and offered a wider array of preventive services than does the indemnity plan. Over 403,000 people were covered by Employer A's health plans in 1995.
| TABLE 2-2: Employer A's Medical Benefit Options, 19951 | ||
|---|---|---|
| Feature | Plan Type | |
| Point of Service (POS) | Indemnity | |
| Deductible | ||
| Individual | $0 in network $250-$850 out of network1 | $125-300 |
| Family | $0 in network $500-$1,700 out of network1 | $300-$600 |
| Copayment/Coinsurance | ||
| Individual | $15 in network 20% out of network | 20% |
| Family | $15 in network 20% out of network | 20% |
| Prescription Drug Copayment/Coinsurance | ||
| Retail Pharmacy | In network: $12 for generic, $12 plus price difference between generic and brand name Out of network: 100% | In network: 20% Lower prescription prices Out of network: 20% Higher prescription prices |
| Mail order | $4 for generic $11 for brand name | $4 for generic $11 for brand name |
| Annual Employee Out-of-Pocket Limit2 | ||
| Individual | $1,250-$2,750 out of network1 | $1,100-$2,3501 |
| Family | $2,500-$5,500 out of network1 | $1,100-$2,3501 |
| Lifetime Maximum Benefit | $1.2 million | $1.2 million |
| Yearly employee contributions | ||
| Individual | $147.76-$461.76 employees1 $0-$312 COLA and retirees1 | $174.20-$486.20 employees1 $0-$312 COLA and retirees1 |
| Family | $249.08-$548.08 employees1 $249.08 COLA and retirees | $299.08-$598.00 employees1 $249.08 COLA and retirees |
| ||
Employer B is a large state government in the northern United States. It offered an indemnity plan, a PPO plan, and ten HMO plans. Seven of the ten HMOs were available to every employee. About 205,000 people were covered by this employer's health plans in 1995. Since relatively few potentially disabled persons were found in the PPO plan in 1995, most analyses reported in subsequent chapters excluded the PPO plan members.
| TABLE 2-3: Employer B's Medical Benefit Options, 1995 | ||
|---|---|---|
| Feature | Plan Type | |
| HMOs | Indemnity | |
| Deductible | ||
| Individual | $0 | $75 $150 per admission |
| Family | $0 | $150 $150 per admission |
| Copayment/Coinsurance | ||
| Individual or Family | $10 | $5 visits 1-15 , $0 visits 16+$0 |
| Prescription Drug Copayment/Coinsurance | ||
| Retail Pharmacy | $3-$10 for generic, $10-$15 brand name | In network $5 generic $10 brand name Out of network 20% after $75 or $150 drug deductible is met for individual or family, respectively. |
| Mail order | $6 for generic $12 for brand name | |
| Annual Employee Out-of-Pocket Limit | ||
| Individual or Family | $250 | N.A. |
| Lifetime Maximum Benefit | None | Unknown |
| Yearly employee contributions | ||
| Individual | $289.92-$377.28 employees1 $193.20-$251.40 COLA and retirees1 | $495.12-$668.40 employees1 $329.28-$502.56 COLA and retirees1 |
| Family | $700.20-$885.36 employees1 $466.60-$590.28 COLA and retirees | $1115.64-$1516.80 employees1 $741.84-$1143.00 COLA and retirees |
| ||
Medical benefit options for each employer's health plans are described in more detail in Table 2-2 and Table 2-3. The annual contributions (premiums) were quite similar for Employer A's two plans. Deductibles and coinsurance rates for Employer A's out-of-network POS plan were higher than the indemnity plan but the in-network rates were substantially less than those of the indemnity plan. Employer B's indemnity plan was more costly than its HMOs, charging higher deductibles, copayments, and premiums. The HMOs did not cover out-of-network care, however, so someone seeking care outside the HMO network would be responsible for the entire payment.
A few notable plan features do not appear in Table 2-2 and Table 2-3. Employer A used the same carve-out program for mental health services in 1995 for everyone, regardless of whether the indemnity or the POS plan was chosen. In contrast, Employer B offered two mental health plans, one for the indemnity and PPO plan members, and a second plan for all HMO members. Both employers used physician gatekeepers to monitor and approve service utilization in the managed care plans. However, pre-admission approval for hospital services was required in all plans. Finally, neither Employer A's nor Employer B's indemnity plans put providers at financial risk for the services they provide to plan members. Risk assumption by providers was minimal in Employer A's POS plan, but in some of the HMOs offered by Employer B providers assumed greater financial risk.
C. Indemnity Plan versus POS Plan: An Example
There is a common misperception that enrollees will necessarily have lower out-of-pocket expenditures in managed care plans than in indemnity plans. In general, managed care plans will cost less only to the extent that the enrollee receives care from providers within the plan's network. The following example uses data on Employer A's plans to illustrate how the decision to seek care outside a provider network can substantially raise out-of-pocket expenses.
Employer A's indemnity plan had a 20 percent coinsurance rate, meaning that the employee paid 20 percent of covered health care expenses beyond the deductible. The 20 percent coinsurance rate applied to pharmacy expenses as well. The deductible ranged from $125-$300 for individual coverage to $300-$600 for family coverage, depending on the employee's salary. The annual contribution (or premium) ranged from $175-$487 for individuals and $300-$599 for families, again scaled to income.
Employer A's POS plan had a $15 copayment for care received within its network. Outside the network, there was a 20 percent coinsurance rate beyond a deductible of $250-$850 for individual coverage and $500-$1700 for family coverage, scaled to the employee's salary. That is, an employee seeking care outside the POS network had to pay the entire deductible before the POS plan contributed anything; beyond the deductible, the employee paid 20 percent of remaining out-of-network costs. The annual premium varied from $148-$462 for employees with individual coverage to $249-$548 for those with family coverage, based on salary.
Consider the hypothetical situation illustrated in Table 2-4. A chronically ill, female employee has family coverage and $1650 of eligible expenses. These include $250 for four 90-day prescriptions purchased at a pharmacy, five visits to specialists and five visits to general practitioners or other providers. Assume she has an average salary and thus has midpoint values for the deductible and premium that she faces. Under the indemnity plan, her annual expenses would be the sum of the premium ($449), the deductible ($450) and the copayment ($240), a total of $1139. Now suppose that the woman belongs to the POS plan and receives all of her care within its network. Then her annual expenses would be the sum of the premium ($399), the deductible ($0) and the copayments (which are the sum of $150 for ten in-network visits and $48 for four prescriptions), a total of $597. This is little more than one-half the cost for care under the indemnity plan.
Suppose instead that the woman prefers to receive care by a specialist who does not belong to the POS plan list of preferred providers. Let the five visits to the specialist account for $1000 of the $1400 in non-prescription expenses. What will the total yearly cost be now? Assume that her deductible for out-of-network providers is $1100, the midpoint between $500 and $1700. The $1100 deductible exceeds the $1000 in actual out-of-network specialist costs, so she will pay the entire $1000 out of her own pocket. Her total yearly expenditures will be the sum of that deductible ($1000), copayments for the five remaining in-network visits ($75) and copayments for the four prescriptions ($48), a total of $1522. This exceeds the cost of care under the indemnity plan by 34 percent. Thus we see that the cost difference between POS and indemnity plans depends on the employee's willingness to visit only those providers in the POS network.
| TABLE 2-4: Expenditures under Indemnity and POS Plans: An Example | |||
|---|---|---|---|
Hypothetical Situation
| |||
| INDEMNITY | Premium: Deductible: Coinsurance: Total | $449 $450 $240 $1139 | [ = 0.20 * ($1650 - 450)] |
| POS IN-NETWORK ONLY | Premium: Deductible: Coinsurance: Total | $399 $0 $198 $597 | [ = (10 * $15) + (4 * $12)] |
| POS SOME CARE OUT-OF-NETWORK | Premium: Deductible: Coinsurance: Total | $399 $1000 $123 $1522 | [ = (5 * $15) + (4 * $12)] |
D. Conclusion
Both employers' health plans used a variety of requirements and case management procedures to manage care. Since all persons covered by any given plan were subject to the same requirements, one cannot determine from the data used in this study which particular feature had the most influence on service utilization or expenditures. Data from many more plans would be required for such a study. Moreover, in order to determine which plan features have the most influence on service use and costs, such plans would have to share some common features but differ with regard to other important features. In the same vein, without such a rich data source we are unable to determine which specific plan features may be most useful and appropriate for a chronically ill population.
The analyses conducted under the Private Payers Study will show the impact of managed care at an aggregate plan-type level, combining the influence of all of the managed care features of a given plan type under the same 'managed care' rubric. This procedure is typical of the indemnity versus managed care plan comparisons reported in the health services literature.
III. OPERATIONAL MEASUREMENT OF CHRONIC ILLNESS AND POTENTIAL DISABILITY FOR THE PRIVATE PAYERS STUDY
The Private Payers Study was undertaken to compare the characteristics, health service utilization patterns, and expenditures of people with potentially disabling chronic conditions in managed care and indemnity insurance plans. An important issue is the appropriate definition of potential disability that underlies all empirical analyses conducted for this project. The health services literature offers a variety of definitions of the term disability, and this chapter begins with a description of those definitions. We then relate those definitions to methods chosen for this project to define people with potentially disabling chronic conditions using claims data. In concluding this chapter, we describe several additional options for defining potentially disabled people, and note our reasons for not using these options for this study.
A. Defining Disability
LaPlante (1989) and others (Haber, 1967; Nagi, 1976) define disability as a limitation, caused by one or more chronic physical or mental health conditions, in performing activities that people of a particular age are generally expected to be able to perform. For children, these activities might include playing and going to school. For adults, these activities might include employment or running a household.
LaPlante (1989) notes that chronic conditions are the antecedents of disability, yet there are many chronic conditions that differ in terms of functional limitations, prognosis, care management, and rehabilitative potential--factors that relate to or describe the nature of a disability. Because of differences in age, other physical and socioeconomic factors, motivation levels, environmental factors, treatment resources, duration of the underlying illness, and care management patterns, two people with the same chronic condition of equal severity may not have equal levels of disability. For example, severe arthritis may be devastating for a surgeon, but not as much of a limitation for a writer who has a computer and voice recognition software. Thus, the mere existence of a chronic condition is not sufficient to specify the degree of disability that people face in their own situations.
Because of the range of factors that influence perceptions of disability, disability research frequently relies on surveys. Some examples, cited by Irvin et al. (1994), include the Current Population Survey, the Survey of Income and Program Participation, and the National Medical Expenditure Survey. LaPlante (1989) describes the usefulness of the National Health Interview Survey for disability studies. As Irvin et al. (1994) note, disability research relies on self-reports of health-related limitations in activities and work based on these surveys, and on participation in government programs for disabled people that require certain medical or functional status criteria to be met (see, for example, Burkhauser,Haveman, and Wolfe, 1992; Haveman, Wolfe, Buron, and Hill, 1992; Wolfe and Haveman, 1990; Haveman and Wolfe, 1983; and Colvez and Blanchet, 1981). With the exception of the National Health Interview Survey, the surveys that support this body of research often do not provide information about the pathology or impairment underlying the self-report, or they do not link functional limitations to specific conditions (Irvin, et al., 1994).
While survey data are necessary for assessing the degree of disability that individuals face, one formidable obstacle to the use of survey data should be noted--survey respondents may not always respond accurately or in the expected manner. This may be due to confusing wording of survey questions, lack of complete response categories, a respondent's unwillingness to divulge information, or other problems. In their own study and in many other studies which they reviewed, Fowles et al. (1998) note that the accuracy of self-reported data on the existence of chronic diseases varies substantially with the type of disease. Although the Fowleset al. study does not deal specifically with disabling conditions, the tendency of respondents to underreport chronic conditions is likely to translate into an underestimate of disabling conditions as well.
Using medical records data as a gold standard, Fowles et al. found that low sensitivity (i.e., underidentification of those with a disease) was particularly problematic, usually more often for self-reported data than for data coming from insurance claims. However, some conditions are not well defined in that article (e.g., alcohol abuse, digestive problems, joint problems) and most conditions had a low frequency of occurrence.
Irvin et al. (1994) note that research incorporating both self-reported limitations and specific medical conditions has broadened operational definitions of disability. These broader definitions attempt to capture the multi-dimensional nature of disability. Nagi(1969, 1979) argues that this multi-dimensional nature should include the elements of "pathology" (the presence of a physical or mental malfunction), "impairment" (physiological, anatomical, or mental losses or abnormalities that limit a person's capacities and level of functioning), and "disability" (inability or limitations in performing roles and tasks that are socially expected). Haveman, de Jong, and Wolfe (1991) consider the multi-dimensional nature of disability using a disability index.
Irvin, et al. (1994) used data from the National Medical Expenditure Survey to identify four different groups of disabled people. These groups were not mutually exclusive. The first group included those with chronic conditions and impairments reported during a medical visit. A second group included those who self-reported one or more limitations in activities of daily living (e.g., bathing, toileting) and those who reported that their health limited moderate or vigorous physical activity. A third group of disabled people was defined as those respondents who reported that their health limited the kind or amount of work they could perform. A fourth group included respondents who reported that their health prevented them from working at all. When all four groups were combined, Irvin et al. (1994) found that they represented approximately 40 percent of the 1987 National Medical Expenditure Survey sample of working age individuals. Irvin et al. (1994) note that definitions of disability range from broad constructs reflecting social and economic conditions and self-perceptions to tightly defined physical and mental conditions entailing the application of strict medical criteria. However, all of these measures are based on subjective measures of pathologies or impairments.
LaPlante (1989) cites research showing that about one-half of the U.S. population aged 18-64 has at least one chronic physical or mental health condition, but only about 15 percent of that group have one or more activity limitations. Thus, LaPlante notes: It is a simple fact that most people with chronic conditions are not limited in activity, nor do most conditions cause disability (page 20).
B. Using Claims Data to Define Potentially Disabling Chronic Conditions
Survey data were not available for the Private Payers Study, so the identification of potentially disabled people was based primarily on information available in the insurance claims databases contributed by the two participating large employers. Claims data contain a wealth of information on individual utilization of health care services, expenditures, diagnosis codes, and procedure codes that can be used as indicators of potential disability status. Although there is much literature focusing on the health care utilization and expenditures of Medicaid and Medicare beneficiaries, the use of claims data to study the health care utilization of people who may be disabled is much more limited.
Previous studies of the health care utilization of Medicaid and Medicare beneficiaries with disabilities have generally focused on program eligibility status (e.g., Medicare enrollees under age 65 or Supplemental Security Income (SSI) beneficiaries) as the indicator of disability. Recently, however, studies using Medicaid claims data have attempted to identify disabled people using criteria beyond program status alone (e.g., Crown et al., 1998a, 1998b; Kronick, et al., 1995). These studies focused on diagnosis codes and utilization criteria for identifying people with disabilities. Diagnosis code and utilization criteria are particularly appropriate for the Private Payers Study because these criteria can be used to identify people with potentially disabling chronic conditions from private health insurance claims, where program eligibility criteria, such as SSI or Social Security Disability Insurance (SSDI) status, are lacking.
The use of claims data for studying the health care utilization of potentially disabled people has several advantages. First, it enables researchers to study very large samples, and sometimes even entire populations, rather than relatively small samples of populations. This can be important when focusing upon certain types of disability which may be very rare. Second, health care claims data are not subject to self-reporting biases on the part of individuals (although they may be subject to other reliability problems). Third, and most importantly, claims data provide the opportunity of studying the total pattern of health services and expenditures of people who may be disabled.
The use of claims data for studying the health care utilization of disabled people does have limitations. For example, diagnosis codes may not always indicate the nature of a person's disability (e.g., an individual with severe mental retardation might have an office visit for an inner ear infection, with the former not noted as a diagnosis on the claim). In some situations, it is possible to address this problem by linking with other data sets. For example, by linking Medicaid data for SSI recipients with Social Security data on impairment codes, it is often possible to identify type of disability for many individuals even though it is not indicated in the claims. On the other hand, this linkage solution may not be feasible for employer health insurance data due to confidentiality restrictions and because very few enrollees are covered by SSI or SSDI. Even so, one would expect to see severe disabilities reflected in diagnosis codes over a longer period of time, such as a year.
A second limitation of claims data is that they generally contain very limited socioeconomic or demographic information on the individuals represented in the claims. This can place limits on the range of policy questions that can be addressed. For example, information on race is not available in the two employer data sets used for the Private Payers Study. Studies of race-related differences in access to care or treatment patterns among disabled people are therefore precluded.
A third limitation relates to reporting practices used by diagnosis coders. Like survey respondents, clinicians may hesitate to report the existence of sensitive conditions, such as mental or emotional problems.
Finally, as noted earlier, insurance claims which denote the existence of a chronic condition generally cannot be used to estimate the degree of disability associated with that condition. Thus, for the Private Payers Study, we refer to the samples included in the empirical analyses as those having potentially disabling chronic conditions, rather than using the more definitive-sounding term, disabled.
C. Overview of Approach with Claims Data
Because the data source for the Private Payers Study includes health insurance claims from employers, the criteria used to define those with potentially disabling chronic conditions rely heavily on diagnosis codes available from the claims data. In an earlier paper for the Private Payers Study, Crown et al. (1998a) developed criteria to identify disability using both physical and mental health criteria. Many diagnosis codes for physical and mental conditions indicate a potentially disabling chronic condition by themselves. Others indicate disability only in the presence of corroborating patterns of utilization. Although there are broad areas of overlap in the criteria for children and adults, some conditions are specific to each group.
To develop the lists of particular diagnoses that indicate potentially disabling chronic conditions we used the following process. First, a clinical coding specialist selected conditions thought to potentially result in partial or total disability. Any conditions known to be invariably terminal within six months were excluded from consideration because the focus of this research was on chronic conditions expected to last for a long time, and because the managed care literature rarely focuses on plan type comparisons for those with terminal illnesses. The rationale for the selections made by the clinical coding specialist was her clinical knowledge as well as data gleaned from leading medical reference texts. Her preliminary list of conditions was forwarded to a consulting physician for review of the appropriateness of inclusion. The physician was an internist in clinical practice with experience in making disability determinations on a regular basis. Together, the clinical coding expert and the internist attempted to identify all conditions that may, in and of themselves or as a result of their complications, lead to permanent or temporary disability and inability to perform regular gainful employment. For children, the conditions are those that restrict their usual daily activities, such as play and school attendance.
As they make disability determinations for their patients, most primary care physicians make these same types of judgments about restriction of activity on a daily basis. After review by ASPE staff and subsequent review by the MEDSTAT clinical coding specialist and internist, a few modifications to the list of qualifying diagnoses were made.
According to this approach, potential disability may be on the basis of either mental or physical problems that result in loss of normal functioning. Considerations taken into account when making disability determinations for patients with mental disorders typically include whether the patient is capable of conducting work independent of supervision or direction, of making sound judgments, and of being sufficiently independent to take care of one's own grooming and daily needs. Potential physical disability is a physical problem that meaningfully interferes with the patient's ability to conduct his/her usual work, and often is based on changes in endurance, coordination, strength, flexibility, or because of chronic pain or severe chronic illness. Severity of illness and disability varies among the coded disability conditions and cannot be assessed by the code alone. For some conditions, other factors such as health service utilization patterns are noted to help increase the likelihood that the existence of the condition is disabling.
1. People with Potentially Disabling Chronic Physical Illness in This Study
Table 3-1 (from Crown et al., 1998a) provides a summary of the diagnoses and utilization criteria used to identify children and adults with potentially physically disabling chronic conditions. The diagnostic summary in Table 3-1 refers to the detailed list of ICD-9-CM codes in Appendix A that indicated the presence of severe and potentially disabling chronic physical conditions.1 These diagnoses are presented for children and adults separately. The set of per se disabling diagnoses is noted by a Yes in the third column of Appendices A-1 through A-4.
| TABLE 3-1. Physical Disability Criteria |
|---|
| Diagnoses Alone (Per Se Disabling Conditions) Has at least one of 328 diagnosis codes for severe and chronic conditions, as either primary or secondary diagnoses. The composition of these diagnosis codes differs for children and adults. (See Appendix A-1 and Appendix A-2) |
| Diagnoses with Utilization Criteria Has a primary diagnosis of asthma in combination with 2 or more hospitalizations, or 3 or more emergency room visits with a primary diagnosis of asthma; or Has a primary diagnosis of epilepsy in combination with 1 or more hospitalizations, or has 3 or more emergency room visits with a primary diagnosis of epilepsy; or Has any of selected adult primary diagnoses (noted in Appendix A-1) in combination with 1 or more hospitalizations or 3 or more emergency room visits. |
The second set of criteria in Table 3-1 refers to diagnoses of asthma and epilepsy in conjunction with utilization criteria. Children or adults with asthma were considered as potentially disabled only if they had at least two hospitalizations or at least three emergency room visits with a primary diagnosis of asthma. Similarly, adults and children with epilepsy were considered disabled only if they had one or more hospitalizations or three or more emergency room visits with a primary diagnosis of epilepsy.
2. Potentially Disabling Chronic Mental Illness in This Study
Exhibit 3-2 outlines diagnosis code and utilization criteria that were used to identify children and adults with potentially disabling chronic mental illness. As with physical disabilities, certain mental diagnoses such as schizophrenia or moderate, severe, or profound mental retardation are nearly always disabling. Other diagnoses such as depression or panic disorders are generally only disabling if they occur in conjunction with comorbidconditions or if the severity of the diagnosis is indicated by utilization criteria. Thus, Table 3-2 includes two mental health disability screens based on a broader set of mental health diagnoses in conjunction with utilization criteria. The specific ICD-9-CM mental illness diagnoses used for these criteria are listed in Appendix A-3 and Appendix A-4.
| TABLE 3-2. Mental Disability Criteria |
|---|
| Diagnoses Alone (Per Se Disabling Conditions) Schizophrenic or schizoaffective disorder Manic depression or bipolar disorder Psychoses with origin specific to childhood Mental retardation: moderate, severe, profound Anorexia nervosa |
| Diagnoses With Comorbid Conditions Depression with anxiety disorder Substance abuse with secondary psychiatric disorder Panic disorders with substance abuse |
Diagnoses With Utilization Criteria Depression with any of these:
|
D. Taking Advantage of Survey-Based Information
In addition to the method above based on clinical judgment, we also used a method based on survey responses to identify activity-limiting conditions. A subset of potentially disabling chronic conditions highly correlated with disability was identified in LaPlante's (1989) analysis of the National Health Interview Survey. In LaPlante'sanalyses, disability was based upon limitations in daily activities or work, or the inability to work. He determined the most common chronic conditions, in terms of disability risk, for children and adults in 1983-1986. Those conditions are noted in the fourth column of Appendices A-1 through A-4 of this report. In the Private Payers Study, people with these activity-limiting conditions were identified on the basis of their ICD-9-CM diagnosis or condition codes. Chapter 5 notes that, depending upon the plan type considered, about 30-60 percent of the analytic sample members used in the empirical analyses for the Private Payers Study had one or more of the activity-limiting conditions.
LaPlante's conditions for children and adults differ from each other for the most part, as may be seen in Appendices A-1 through A-4. Only four conditions appear among the top 20 for both children and adults: mental retardation, cerebral palsy, epilepsy, and other heart conditions. For both age groups, mental retardation was the condition most likely to lead to disability. Musculoskeletal impairments appeared to be more common among adults, while asthma and impediments of speech and hearing appeared to be more problematic for children. Because of these differences, analyses of children and adults were conducted separately in the Private Payers Study.
E. Alternative Approaches Not Used
Three other options were considered but not adopted to identify people with potentially disabling chronic conditions for the Private Payers Study. These included the method used by the Social Security Administration (SSA) to define disability, the International Classification of Impairments, Disabilities, and Handicaps (World Health Organization, 1980), and a method used in earlier research by Altman and Barnett (1996). These methods were not used either because ICD-9-CM mappings could not be made or because the method could not be applied to all ICD-9-CM codes. These methods might be relevant in the future for other studies, however, so we describe them briefly below.
1. The Social Security Administration Approach
Another option which does not rely on survey data is the list of medical problems used by the SSA to identify those with disabling conditions (SSA, 1995). This condition list--approximately 150 pages long--is divided into separate sections for each body system--patients with any of these conditions meet SSA requirements regarding the disabling nature of their medical problems. One problem with this list is that SSA has not assigned ICD-9-CM diagnosis codes to the condition on the list. Furthermore, many of the SSA criteria are much more specific than the ICD-9-CM coding system, making a one-to-one translation impossible. Therefore it is not possible to replicate the SSA approach with the data contributed by the two employers who took part in the Private Payers Study.
2. The International Classification of Impairments, Disabilities, and Handicaps
The International Classification of Impairments, Disabilities, and Handicaps (ICIDH) was developed in the 1970s and released by the World Health Organization in 1980. The ICIDH was developed to classify patients according to the consequences of their diseases or conditions (World Health Organization, 1980). Clinicians who use the ICIDH must ask probing questions about the nature of patients' problems and how those problems limit social and functional status. Thus, the ICIDH holds some potential as a means of bridging the gap between the type of information available from ICD-9-CM diagnosis codes and the information requested on many disability surveys.
Unfortunately for the Private Payers Study, the ICIDH is still considered a work in progress. It is in the process of being updated to better address the potential for negative consequences associated with the use of the term handicap, and it is not in widespread use by clinicians in the United States. Because it was not used by providers affiliated with the employers who contributed data for the Private Payers Study, the ICICH could not be used to identify potentially disabled people for this study.
3. The Altman and Barnett (1996) Approach
Another example of methods that may be used to identify those with potentially disabling chronic conditions was described recently by Altman and Barnett (1996). Altman and Barnett developed a list of life-threatening conditions, chronic conditions, mental health conditions, impairments, and conditions with severe pain, and then related these conditions to variations in employment status. Altman and Barnett provided a list of ICD-9-CM diagnosis codes to define these types of disabling conditions. They also defined other types of disabling conditions that require the use of survey data. Their work showed a high degree of variation in employment history according to the definition of disability chosen. Altman and Barnett did not recommend a single best way to define disability status, and implicit in their work is the message that a variety of ways should be tested to determine the sensitivity of results according to the definitions chosen.
The Altman and Barnett approach is attractive because of its recognition that the various types of disabilities they define are likely to influence health care service use differently. Their approach is also helpful in that they found a useful way to group a wide variety of chronic conditions for analysis. Applying the Altman and Barnett approach for the Private Payers Study would require additional work, however, because their approach was based only on the diagnoses found in the National Medical Expenditure Survey; other diagnoses not defined by the National Medical Expenditure Survey respondents were not covered. Depending upon the scope of diagnoses identifiable in the National Medical Expenditure Survey, a substantial amount of clinical input may be required to make their approach more comprehensive. For our study, however, we considered the added value of that effort to be limited, since MEDSTAT clinical staff had already reviewed the entire ICD-9-CM manual to identify disabling conditions.
F. Diagnoses with Utilization Criteria and Disability Status
The claims-based disability indicators described earlier for some conditions included combinations of diagnosis codes and utilization measures to define potential disability status. However, circularity may be problematic in cross-sectional analyses of utilization or expenditures that compare fee-for-service versus managed care samples if many of those sample members were selected for the study mainly on the basis of utilization criteria. Circularity would be problematic if utilization-based factors drove the plan choice, if subsequent utilization were not controlled well by the plan, and if utilization indicators were used to cast judgments about plan efficiency or outcomes. Inferences about the impact of utilization on plan choice can be made by disaggregating the sample into those identified as potentially disabled solely on the basis of diagnosis and those identified on the basis of diagnosis and utilization criteria. Separate analyses can be conducted for these groups and comparisons across groups can be made to see if the impact of managed care on utilization and expenditures differs for people who were potentially disabled solely because of their diagnoses versus people whose potential disabilities depended upon utilization criteria. In Chapter 6, Chapter 7 and Chapter 8 we study a range of conditions, some identified as potentially disabling on the basis of a diagnosis alone, and others on the basis of both diagnosis and utilization. An alternative approach would be to exclude those whose potential disabilities were defined according to diagnosis and utilization factors (as was done in Chapter 6), but this approach would not have allowed useful comparisons to be made.
G. Summary
The Private Payers Study analyzed the health care utilization and expenditures of people with potentially disabling chronic conditions in private health plans. We chose two alternative methods to define this group. Both used medical claims data to identify utilization and illness. One method relied on the clinical judgment of health care experts to identify diagnosis codes and utilization patterns that indicate probable future disability. The second method drew on a national survey to determine diagnosis codes corresponding to ability-limiting conditions--that is, those conditions often accompanied by limitations in activities of daily living. By comparing results from these two sources, the Private Payers Study presented a reliable picture of the experiences of people with potentially disabling chronic illness and illustrated how the choice of definition altered the estimated prevalence in the privately insured populations we studied.
IV. RESEARCH OVERVIEW: FOUR STUDIES OF MANAGED CARE FOR PEOPLE WITH POTENTIALLY DISABLING CHRONIC CONDITIONS
A. Introduction
Chapter 1 noted that nearly half of those with disabilities are enrolled in private sector health care plans, yet little research has been conducted on their experiences in those plans. Managed care has been touted as having great potential for those who have disabling chronic illness, since one case manager or gatekeeper can take responsibility for guiding patients through the maze of services and providers that may be necessary to treat chronic conditions. Managed care has also been equated with managed cost, however, implying that more consideration is given to reducing the cost of providing care than to the needs of the patient. Both goals--reducing inefficiencies to control costs and managing care to promote quality--are laudable and not necessarily conflicting. To judge whether managed care is beneficial for people with chronic illness, it is important to have a clear understanding of their experiences in private sector health plans.
There are relatively few studies of the experience of people with disabilities in private sector indemnity and managed care plans, and thus we start by addressing basic issues. The insights gained will lead to more focused questions to be examined in subsequent research. The next four chapters of this report describe studies we conducted with data provided by two large employers. A brief overview of these studies is offered below.
B. The Four Studies
The four studies we conducted were designed to illustrate how people with potentially disabling chronic conditions fare in private sector indemnity and managed care plans. Specifically, we sought to determine how such people in these plans differed in terms of:
- prevalence,
- demographic characteristics,
- the types of chronic conditions they have,
- health care utilization and expenditures, and
- their incentives to enroll in indemnity or managed care plans.
Finally, we analyze the usefulness of risk-adjustment systems as methods to evaluate competing health plans and to help plans estimate the costs of treating people who may be high service users.
Study No. 1: Characteristics of People WithPotentially Disabling Chronic Conditions in Indemnity and Managed Care Plans
This study (reported in Chapter 5) provides information on the demographic, employment, case mix, service use, and expenditure characteristics of people with potentially disabling chronic illness in the health plans offered by two large employers. The study does not try to assess causality and does not estimate a managed care impact on service use or expenditures. It simply provides a first look at the data in order to outline the characteristics of a large group of chronically ill people.
Chapter 5 provides information separately for children, adults under the age of 65, and early retirees. We find that rates of potentially disabling chronic illness vary by age group and retiree status and that the major conditions were similar across the two employers. While the results suggest that people with chronic conditions tend to favor the indemnity plans, these plans are not necessarily associated with greater service use.
As a purely descriptive study, Chapter 5 may raise more questions than it answers. This is entirely appropriate, however, since one may not know which questions are important without conducting a detailed first look at the data as illustrated in that chapter. Three of the more important questions raisedby the descriptive study are those addressed in the remaining studies.
Study No. 2: The Impact of Managed Care on Utilization and Expenditures of People with Potentially Disabling Chronic Conditions
Chapter 6 examines whether people with potentially disabling chronic conditions selectively enrolled into more generous forms of health insurance. Specifically, we examine plan switching behavior among people with potentially disabling conditions and determine whether those who switch to more generous plans have higher utilization. This chapter also assesses the impact of membership in managed care versus indemnity-type coverage on service use and payments levels. To isolate the managed care impact, the approach that we used adjusted the overall differences in use and payments across the plans for confounding factors. In particular, variation in patient characteristics that were available in the data (such as age), as well as variation in factors that were unobservable but correlated with the patient's choice of plan (such as the propensity to seek care), were removed from the overall estimates of differences in the levels of utilization and payments.
The descriptive evidence on plan switching suggests that, as a group, switchers to managed care were relatively healthier and generally used fewer services than the individuals that stayed in the indemnity plans. The full analysis shows that enrollment in managed care as opposed to indemnity-type insurance generally reduced service utilization and expenditures. Based on the distribution of patients across the plan types, we found some evidence from one employer that there may be increasing pressure on the indemnity option to raise premiums or reduce services through time. For the other employer, our results suggest that some of the patients who were inherently higher users of health care services may have viewed the indemnity plan as too expensive compared to the managed care plan.
One important finding from this study is that managed care did not have a uniform influence on utilization and expenditures. More research is warranted into why managed care influences some types of health care use and payments but not others. At the least, the findings suggest that a blanket policy of favoring managed care over indemnity coverage is not the best approach for providing health care for people with potentially disabling chronic conditions.
Study No. 3: Risk Adjustment for People with Potentially Disabling Chronic Conditions
Chapter 7 investigates the ability of leading risk-adjustment systems to predict the expenditures of those having selected chronic conditions. Better payment methods can mitigate the incentives faced by patients and health plans to engage in strategic behavior. Risk-adjustment has been proposed as a method to accomplish this objective. Risk-adjustment refers to more precise methods of payment to health plans--methods that account for the above-average cost of treating people who are expected to use unusually high levels of services. Comparisons were made to simple adjustments for age, gender and wage rates, since these are commonly used by insurance plans to predict expenses and by major employers to set payments to insurance plans.
The risk-adjustment systems that we compared were Hierarchical Coexisting Conditions (HCCs), Adjusted Diagnosis Groups (ADGs), and Adjusted Clinical Groups (ACGs). We used these systems to study ten types of potentially disabling chronic conditions: rheumatoid arthritis, asthma, cancer, chronic obstructive pulmonary disease, diabetes, heart failure, psychiatric disorders, seizure disorders, stroke, and ulcerative colitis. The results suggest that health plans and employers should use risk-adjustment methods in addition to traditional age, gender and wage adjustments, especially if they cover services used often by people with potentially disabling chronic conditions. Yet while risk-adjustment would improve payment methods for those with chronic illness, inequities would still remain.
Study No. 4: Risk-Adjustment of Capitation Payments to Behavioral Health Care Carve-Outs: How Well Do Existing Methodologies Account for Psychiatric Disability?
Chapter 8 focuses on risk adjustment for people with psychiatric conditions. It uses 1994 and 1995 data from Employer B to examine the viability of Diagnostic Cost Groups (DCGs--a precursor to HCCs) and ACGs for setting capitation payments to the behavioral health care carve-out plan used by that employer. The carve-out plan was responsible for all of the psychiatric care delivered by the indemnity and PPO plans used by Employer B.
As in Chapter 7, using variants of DCGs or ACGs to risk-adjust expenses resulted in projected payments that were much closer to actual mental health and substance abuse expenditures than were projected payments derived from simpler adjustments. In addition, the study investigated alternative rules for setting risk-adjusted payments. Three alternatives were included:
- full capitation, in which plans receive a set payment for each enrollee, regardless of actual expenses incurred;
- mixed systems, which combine capitation with reimbursement based on actual expenses; and
- soft capitation, in which profits or losses from full capitation are shared by the plan and the employer.
The results showed that full capitation may still lead to substantial profits or losses, even after risk-adjustment. Mixed models and soft capitation performed much better but also diminished some of the incentives for cost containment.
These four studies show that people with potentially disabling chronic conditions use more health care services than the total population, have higher expenditures, and thus are more difficult to insure. The potential for improving their insurability exists with risk-adjustment systems available today and these systems have potential for further improvements. At the same time, while people with potentially disabling chronic conditions are more likely to choose indemnity health insurance, they also enroll in managed care in large numbers. When this differential enrollment is taken into account, the result is that managed care does not necessarily result in less cost and lower utilization. Sometimes it does, sometimes it does not. Purchasers of group health insurance who have substantial populations with disabling conditions would do well to investigate the incentives and results of specific plans to be sure they are getting the best value and highest quality from their health insurers.
V. CHARACTERISTICS OF PEOPLE WITH POTENTIALLY DISABLING CHRONIC CONDITIONS IN INDEMNITY AND MANAGED CARE PLANS
A. Introduction
Chronic illness and associated disability are common among working Americans and their dependents. While researchers have extensively studied the impact of managed care systems on the use and cost of health services in general, they have focused little attention on the impact on chronically ill individuals. These individuals are more likely to use services, and their health care needs may differ from those of the general population due to access difficulties caused by limited physical mobility or mental functioning. Corporate leaders and policymakers need information about the health care experiences of chronically ill people to judge whether current health systems perform adequately for this group. Furthermore, they need simple, straightforward statistics to serve as benchmarks for comparison to their own disabled or chronically ill employees.
This chapter meets these needs by presenting descriptive analyses of the demographics, employment status, case mix and service use of chronically ill people with private insurance. This information serves two purposes. First, it serves as a point of comparison for corporate and public officials assessing the availability and quality of care for the chronically ill in the systems they control. Second, it frames and guides the more advanced statistical analyses presented in later chapters.
Subsequent chapters of this report examine in greater detail the issues raised here. Chapter 6 investigates the impact of health plan type on utilization and expenditures, controlling for differences among those enrolled in different types of plans. Its findings should facilitate discussions of policies designed to enhance access to high-quality health care services for chronically ill individuals.
The second and third studies are natural extensions of the first. Chapter 7 analyzes whether risk-adjustment systems for individuals with diverse chronic health problems will enable employers and health plans to predict expenditures for those with chronic illness. Chapter 8 assesses whether risk-adjustment methods for people with chronic mental illness will allow health plans to predict accurately expenditures for that population. The results of these two studies will assist public and private policymakers to improve access to all types of health plans. The results will also help health plan administrators who want to learn about better methods for assessing the financial risks of enrolling chronically ill people.
In this chapter, we provide some relevant background information on managed care for people with potentially disabling chronic illnesses. Next we describe the methods used to create the descriptive profile. Then, we present results of the descriptive analyses. We conclude by comparing our results to those of other studies and by offering suggestions for additional research.
B. Background
Although estimates vary depending on how disability is defined, roughly 14 percent of adults between the ages of 18 and 65 experience a disability that limits their functional activities (Adler, 1995). Estimates of the percentage American children having special health care needs due to chronic illness or functional limitations vary widely, from 7 percent (Adler, 1995) to nearly 31 percent (Harris-Wehling and Ireys, 1995). Children and adults under the age of 65 constitute about 60 percent of the population of Americans with disabilities (Adler, 1995).
Chronically ill and disabled individuals often require a broad range of health and social services to maximize functional well-being, improve health status and avoid institutionalization. The range of services needed varies depending on the physical or cognitive condition that causes the disability. These specialized needs are often met through multiple programs that have different funding sources and routes to eligibility. As a result, the system from which people with disabilities receive health and social support services is often fragmented.
Managed care health plans cover about 48 percent of disabled people in the U.S. (Fama, Fox, and White, 1994). Policymakers and researchers have argued both that the net effect of managed health care on people with disabilities is positive and that it is negative.
On the positive side, managed care models have been proposed as one way to improve the efficiency and effectiveness of health care services delivered to individuals with disabilities (Batten and Bachman, 1994). They rely on the gatekeeping role of a primary health care professional as the key to regulating costs and ensuring access to coordinated care. Because services delivered through managed care have the potential to be more efficient and of equal or higher quality than traditional fee-for-service medicine, it also holds the potential to improve health services delivery and financing for people with disabilities. Health outcomes for a disabled individual may improve if all services and supports are provided through a single case manager.
On the negative side, the usefulness of managed care models in providing services to people with disabilities has been questioned because these individuals have complex needs for health care and social support--needs that may not be met in a financing and delivery model which has strong financial incentives to reduce costs (Luft, 1991). This concern is particularly important for the increasing number of state Medicaid programs which are turning to managed care in order to control expenditures and increase quality of care for disabled populations.
Private and public payers have implemented many changes in service delivery and financing changes based on a broad range of managed care models. Despite the growing interest of public and private payers in expanding managed care enrollment to include chronically ill people, there are little data available on their needs or experiences in either public or private managed care plans. At a time of rapidly rising enrollment of Medicaid and Medicare enrollees in managed care, federal and state policymakers must learn more about the impact of managed care on chronically ill individuals in order to make informed public policy decisions.
Although about half of disabled individuals are covered by managed care plans in the United States and most of those are employer based, we know of no studies that quantify the impact of managed care on chronically ill people covered by private employer-based insurance. Thus, this chapter is the first to analyze private insurance databases with respect to the chronically disabled population. We address important policy questions including these:
-
Are chronically ill people more likely to enroll in one type of plan or another?
-
Do those in managed care plans and those in indemnity plans have similar types of chronic illnesses and disabilities?
-
How does health care utilization vary by type of managed care plan?
-
Do those in managed care plans have lower health care expenditures than those in indemnity plans?
C. Methods Overview
In this chapter, we address the questions above through a descriptive profile of chronically ill people in the indemnity and managed care plans offered by two large employers. The profiles include:
- disability prevalence estimates for the employee population,
- demographic characteristics of those who used services,
- inpatient case mix,
- outpatient case mix, and
- expenditures of those who used services.
These measures were calculated separately for each plan type to facilitate comparisons between those in indemnity plans and those in managed care plans. We also study individuals in each plan type separately from those who switched plan types from 1994 to 1995 because switching may denote dissatisfaction with premiums, out-of-pocket costs, coverage, perceived access to care, quality of care, or other plan features that cannot be measured directly. Those who remain in the same plan type over time may be less concerned about these issues, or they may be more savvyabout using managed care services to obtain the care they want. In some instances, managed care may involve a tradeoff between access to particular providers versus much lower out-of-pocket costs or better benefits.2 We put all people who switch plans into a single category, not because they are a uniform group but because doing so allows us to define a clean group of stayers--people who stayed with the same plan over both years--versus those who did not. The characteristics and types of plan switchers are discussed in Chapter 6.
We also present data separately for three groups of insured people: children under age 18, active employees, and early retirees. Stratifying by age group is important because, as shown below, the groups have different rates of potentially disabling chronic illness. Moreover, some of these conditions are defined for children only, and the frequency of the remaining conditions varies across age groups.
For these analyses, the data come from two employers. Employer A is a large firm with offices in over 30 cities across the United States. Each location offers an indemnity plan and a POS managed care plan. The benefits offered in these plans are the same across locations, although the POS plan requires lower copayments and deductibles and offers a wider array of preventive services than does the indemnity plan. Employer B is a large state government that offers an indemnity plan, a PPO plan, and seven HMO plans. Like Employer A, its indemnity plan charges higher copayments and deductibles than the managed care plans but makes no restrictions on out-of-network coverage. Chapter 2 describes the features of the plans offered by Employer A and Employer B.
Our statistical analyses used chi-squared tests of independence for comparing variables measured as percentages. We used analysis of variance (ANOVA) to compare means of continuous measures. No other adjustments were made in comparisons, since the purpose of this chapter is to present a global view of descriptive characteristics of those who have potentially disabling chronic conditions. As a result, we do not draw inferences about causality in this chapter. Readers should not assume that differences between those in the indemnity and managed care plans are due to plan design or to treatment practice patterns. Rather, the descriptive statistics constitute a first look at the data, providing an overview of the data and suggesting areas for detailed examination. More sophisticated analyses are presented in Chapter 6, which addresses whether managed care influences health care utilization and expenditure patterns.
D. Results
1. Prevalence Estimates
Employers A and B had 403,700 and 204,724 health plan enrollees in 1995, respectively. The prevalence of potentially disabling chronic conditions varied considerably by employer.The 1995 prevalence rate for Employer A was estimated as 174 per 1,000 covered lives. The prevalence rate for Employer B was higher, 216 per 1,000 covered lives.
Potential Disability AmongService Users. The numerator for the prevalence numbers noted includes service users with potentially disabling chronic conditions. It does not include chronically ill people who used no services in 1995. The denominator includes all plan enrollees, regardless of whether any utilization occurred. The prevalence numbers noted above are based upon all employees and dependents, not just on users of medical care services. In a given year it is natural for many people not to use any health care services (Duanet al., 1983). Non-users pose few difficulties for health plan managers and clinicians. The more difficult group to manage includes those who do use services; this group includes about 75 percent of the enrollees in the health plans offered by Employers A and B.
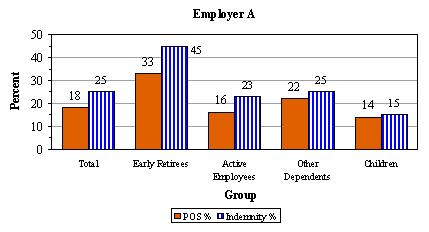
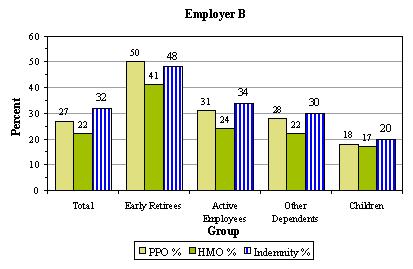
Figure 5-1 limits the denominator to service users in 1995. This figure depicts differences in the percentages of 1995 service users who have potentially disabling chronic conditions, shown separately by plan type and user group (early retirees, active employees, other dependents, and children); all differences shown are statistically significant. We find that people with potentially disabling chronic conditions are more likely to have indemnity coverage than to be enrolled in a managed care plan, with one exception. The exception is that early retirees appear to favor Employer B's PPO plan over its indemnity and HMO plans. In all other cases, however, those with chronic, potentially disabling conditions appear to favor the indemnity plans. Among service users, the prevalence of potentially disabled chronically ill people is substantially higher for early retirees, as one might expect (i.e., many may retire early due to health problems). All of the differences in percentages between indemnity plans and other plans which are shown in the figures are statistically significant, which is not surprising given the large sample sizes overall used in the analysis.
Potentially Disabling Chronic Conditions. While Figure 5-1 considered the entire population of plan service users, Tables 5-1 through 5-4 look only at those with potentially disabling chronic conditions. The tables assess how the enrollee groups (active employees, retirees, dependents) differ in terms of their populations of enrollees with disabling conditions.
Tables 5-1 through 5-3 list the most frequent potentially disabling chronic disease diagnoses for adults (Table 5-1 and Table 5-2) and children (Table 5-3) for both employers. Table 5-4 shows the five most frequent potentially disabling chronic mental health diagnoses for Employer A. (Employer B's mental health data are available upon request.) In general, these tables show that the same types of conditions affect active employees, dependents, and early retirees, but there are some differences in rankings.
| FIGURE 5-1: Percentages of 1995 Service Users Who Have Potentially Disabling Chronic Conditions by Plan Type, Employer, and Employee Group |
|---|
 |
 |
| NOTE: Values have been rounded to nearest percent. All differences are statistically significant (chi-square test of independence, p<.05). |
Table 5-3, compared to Table 5-1 and Table 5-2, shows that the potentially disabling diseases among children are often different from the diseases observed for adults. For example, children are affected most often by asthma and other illnesses concerning nutrition, metabolism and development, congenital anomalies, and cerebral palsy; adults are more often affected by heart problems, arthritis, and cancer.
All of these tables show a high degree of overlap in the top ten lists of potentially disabling chronic conditions in the two employer populations. The differences in the mission of these two employers do not appear to result in major differences in the nature of their most frequently observed potentially disabling chronic conditions.
| TABLE 5-1. Ten Most Frequent Potentially Disabling Chronic Disease Diagnoses For People Age 18-64, Employer A, 1995 | |||
|---|---|---|---|
| Active Employees | Dependents | Early Retirees | |
| 1 | Chronic Ischemic Heart Disease | Asthma | Chronic Ischemic Heart Disease |
| 2 | Asthma | Chronic Ischemic Heart Disease | Cardiac Dysrhythmias |
| 3 | Cardiac Dysrhythmias | Cardiac Dysrhythmias | Chronic Obstructive Pulmonary Disease |
| 4 | Complications of Heart Disease | Breast Cancer | Complications of Heart Disease |
| 5 | Angina Pectoris | Endocarditis | Angina Pectoris |
| 6 | Chronic Obstructive Pulmonary Disease | Chronic Obstructive Pulmonary Disease | Asthma |
| 7 | Endocarditis | Complications of Heart Disease | Heart Failure |
| 8 | Other Acute/Subacute Heart Disease | Seizure Disorders | Other Acute/Subacute Heart Disease |
| 9 | Heart Attack | Rheumatoid Arthritis | Endocarditis |
| 10 | Seizure Disorders | Angina Pectoris | Prostate Cancer |
| TABLE 5-2. Ten Most Frequent Potentially Disabling Chronic Disease Diagnoses For People Age 18-64, Employer B, 1995 | |||
|---|---|---|---|
| Active Employees | Dependents | Early Retirees | |
| 1 | Asthma | Asthma | Chronic Ischemic Heart Disease |
| 2 | Chronic Ischemic Heart Disease | Chronic Ischemic Heart Disease | Cardiac Dysrhythmias |
| 3 | Cardiac Dysrhythmias | Cardiac Dysrhythmias | Chronic Obstructive Pulmonary Disease |
| 4 | Chronic Obstructive Pulmonary Disease | Chronic Obstructive Pulmonary Disease | Asthma |
| 5 | Endocarditis | Endocarditis | Angina Pectoris |
| 6 | Complications of Heart Disease | Breast Cancer | Complications of Heart Disease |
| 7 | Angina Pectoris | Seizure Disorders | Heart Failure |
| 8 | Seizure Disorders | Complications of Heart Disease | Endocarditis |
| 9 | Breast Cancer | Angina Pectoris | Breast Cancer |
| 10 | Rheumatoid Arthritis | Rheumatoid Arthritis | Heart Attack |
| TABLE 5-3. Ten Most Frequent Potentially Disabling Chronic Disease Diagnoses For Children Age 0-18, by Employer, 1995 | ||
|---|---|---|
| Employer A | Employer B | |
| 1 | Asthma | Asthma |
| 2 | Symptoms Concerning Nutrition, Metabolism, Development | Symptoms Concerning Nutrition, Metabolism, Development |
| 3 | Congenital Anomalies of Limbs | Congenital Anomalies of Limbs |
| 4 | Heart Anomalies (Bulbous Cardia, Cardiac Septal Closure) | Hypercholesterolemia |
| 5 | Nervous and Musculoskeletal Symptoms | Other Conditions of Brain |
| 6 | Hypercholesterolemia | Heart Anomalies (Bulbous Cardia, Cardiac Septal Closure) |
| 7 | Congenital Musculoskeletal Anomalies | Nervous and Musculoskeletal Symptoms |
| 8 | Cerebral Palsy | Congenital Musculoskeletal Anomalies |
| 9 | Congenital Heart Anomalies | Congenital Heart Anomalies |
| 10 | Other Conditions of Brain | Cerebral Palsy |
| TABLE 5-4. Five Most Frequent Potentially Disabling Chronic Mental health Diagnoses For Adults Age 18-64, Employer A, 1995 | |||
|---|---|---|---|
| Active Employees | Dependents | Early Retirees | |
| 1 | Neurotic Disorders | Neurotic Disorders | Neurotic Disorders |
| 2 | Affective Psychoses/ Depressive Disorders | Affective Psychoses/ Depressive Disorders | Affective Psychoses/ Depressive Disorders |
| 3 | Other Nonorganic Psychoses | Other Nonorganic Psychoses | Other Nonorganic Psychoses |
| 4 | Adjustment Reaction | Adjustment Reaction | Schizophrenic Disorders |
| 5 | Disturbance of Conduct | Schizophrenic Disorders | Other Organic Psychotic Conditions |
2. Demographic Characteristics
We found some differences in the age and case mix and almost no differences in gender distributions of patients with potentially disabling chronic conditions between people in indemnity plans and those who switched plans. Most of the significant differences in average age reflect comparisons between the indemnity and managed care plans of both employers. Some small differences are statistically significant due to the large sample sizes used in the analysis.
There are large and small differences in average age by plan type, as seen in Table 5-5.3 Average ages for children and early retirees were slightly lower in managed care plans compared to the same groups in indemnity plans. Among the adult groups there were substantial differences in average age across plan types. Adults enrolled in managed care plans (either the POS plans offered by Employer A or the HMOs offered by Employer B) tended to be about five years younger on average than their counterparts in indemnity plans, and the differences were statistically significant.
Table 5-6 shows that there are few differences in the gender distribution according to plan type. The only notable difference appears for early retirees covered by Employer B. Among this group there are, in percentage terms, significantly fewer women in the indemnity plan, compared to those in the HMO.
| TABLE 5-5. Mean Age By Employer, Sample, and Plan Type, 1995 | ||||
|---|---|---|---|---|
| Plan Type | Total | Adults | Children | Early Retirees |
| Employer A | ||||
| Indemnity | 47.84 | 50.76 | 10.04 | 60.28 |
| POS Plan | 41.37* | 46.59* | 9.57* | 59.04* |
| Switched Plan Type | 49.38 | 48.18 | 9.65 | 59.80 |
| Employer B | ||||
| Indemnity | 44.37 | 48.32 | 9.61 | 58.79 |
| HMO | 35.56* | 42.60* | 8.80* | 58.70 |
| Switched Plan Type | 37.25 | 43.07 | 8.95 | 56.25* |
| * Mean is significantly different from indemnity plan mean (p<0.05, analysis of variance) | ||||
| TABLE 5-6. Percent Female By Employer, Sample and Plan Type, 1995 | ||||
|---|---|---|---|---|
| Plan Type | Total | Adults | Children | Early Retirees |
| Employer A | ||||
| Indemnity | 50.84 | 55.84 | 41.05 | 27.99 |
| POS Plan | 48.42 | 52.68* | 40.46 | 27.14 |
| Switched Plan Type | 43.17 | 54.19 | 39.84 | 29.22 |
| Employer B | ||||
| Indemnity | 44.07 | 56.08 | 43.81 | 37.29 |
| HMO | 53.90 | 57.82* | 41.91 | 42.58* |
| Switched Plan Type | 56.89 | 60.37* | 43.30 | 49.32 |
| * Mean is significantly different from indemnity plan mean (p<0.05, analysis of variance) | ||||
Plan Switchers. We also distinguish between those who stayed in the plan for the entire study period and those who switched between plans. Individuals have incentives to switch plans in order to obtain better, more convenient, or less costly care. The impetus to switch may be the onset of an illness like the chronic disabling conditions under consideration. Alternatively, it may take time to learn about the benefits and costs of all plans. The POS plan offered by Employer A was relatively new at the time of this study, and some individuals who switched to it in 1995 might have done so earlier had they known about it sooner.
People who switch plans are likely to be different from those who do not switch. Consider two plans, one with high benefits and a high premium and one with low benefits and a low premium. Individuals know their own health states and so can choose between plans based on expected costs. It would be natural for healthy individuals to enroll in the low-cost, low-benefit plan since they expect not to need much care. Individuals with chronic illnesses would be more likely to enroll in the high-cost, high-benefit plan, however, figuring that their gain from the greater benefits (say, more coverage and lower out-of-pocket expenses) would outweigh the higher premium. People in the low-cost plan who develop chronic illnesses may switch to the high-cost plan, for example, while relatively healthy individuals will be more likely to move away from the high-cost plan into the low-cost plan.
For Employer A the low-cost plan is the POS, so we expect that individuals switching into the POS from the high-cost indemnity plan will be healthier than those who stay in the indemnity plan. The data, shown in Appendix C-1, reveal that individuals switching into the POS plan are indeed less likely to have physical or mental disabilities than those who stay in the indemnity plan. We find a similar result for Employer B: those who switch from the high-cost indemnity plan to the low-cost HMO are less likely to have physical disabilities, although they are just as likely to have mental disabilities.4
3. Case Mix Differences by Plan Type
Now we present a summary of the case mix analysis. More detailed results are provided in Appendix B.
Figure 5-2 depicts differences in the average number of major diagnostic categories (MDCs) represented by the chronic conditions of people in the analytic sample. For Employer A differences were small for adults. However, there were slightly larger differences by plan type in average MDC counts for children and for early retirees. Children and early retirees covered by the POS plan had more MDCs on average than those in the indemnity plan. For Employer B, the average number of MDCs tended to be smaller for those adults in the HMO plan than in the indemnity plan. The average number was slightly higher for children in the HMO than in the indemnity plan.
Figure 5-3 shows differences in the average number of psychiatric diagnostic groups for people with mental health problems, by plan type. For Employer A, the averages were similar for those in the indemnity and POS plans. The larger difference was between those who switched plan type sometime in the 1994-95 period and those who were always in the indemnity plan during that period. Switchers tended to have lower average numbers of psychiatric diagnostic groups, though the only significant difference was among early retirees.
Data for Employer B show a different pattern. The average number of psychiatric diagnostic groups is higher for those who switched plans during the 1994-95 period than for those who were always in the indemnity plan. This difference was statistically significant only among adults, however. Among those covered by Employer B (data not shown), roughly 2.5 times as many people moved from an HMO to indemnity coverage as moved from indemnity coverage to an HMO plan. The data presented here cannot tell us whether plan switching is due to the existence of any particular mental health problem, however.
| FIGURE 5-2: Mean Number of Unique Major Diagnostic Categories (MDCs), by Employer, Plan Type and Age Group, 1995 |
|---|
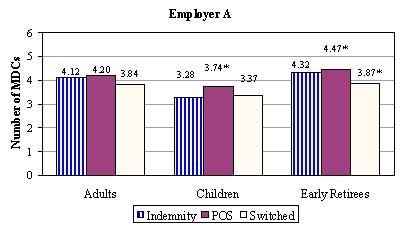 |
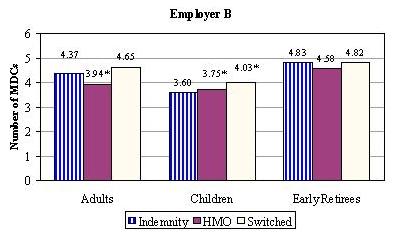 |
| * Mean is significantly different from indemnity plan mean (p < 0.05, analysis of variance) |
| FIGURE 5-3: Mean Number of Unique Psychiatric Diagnostic Groups, by Employer, Plan Type and Age Group, 1995 |
|---|
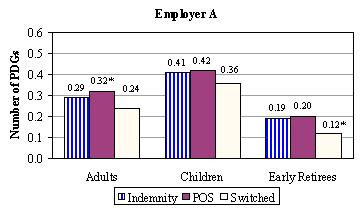 |
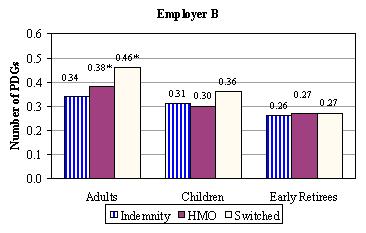 |
| * Mean is significantly different from indemnity plan mean (p < 0.05, analysis of variance) |
| FIGURE 5-4: Percent of People with Activity-Limiting Conditions by Employer, Plan Type and Age Group, 1995 |
|---|
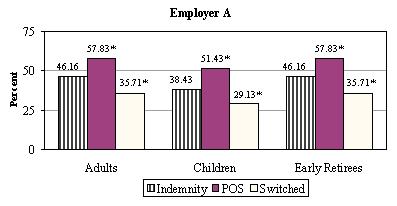 |
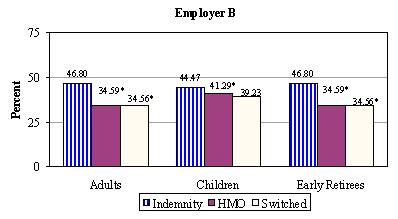 |
| * Mean is significantly different from indemnity plan mean (p < 0.05, analysis of variance) |
Now we present an alternative measure of disability--the presence in the study data of conditions which individuals indicate in national surveys as causing limitations in their life activities (LaPlante, 1989). Figure 5-4 shows the percentages of people who had these activity-limiting conditions. The patterns differ substantially by employer. Among those covered by Employer A's health plans, significantly higher percentages of those with the activity-limiting conditions can be found in the POS plan, compared to the indemnity plan. In contrast, among those covered by Employer B, significantly higher percentages of those with the activity-limiting conditions can be found in the indemnity plan. The observed patterns for both Employers do not differ according to whether the focus is on children, adults, or early retirees.
4. Service Use and Expenditure Differences by Employer and Plan Type
Inpatient Service Use
Hospitalization rates in 1995 for those with potentially disabling chronic conditions were higher for Employer A than for Employer B in all plan types (see Figure 5-5). Among those covered by Employer A, few differences in hospitalization rates are noted for those in the indemnity and POS plans. Those who switched plan type sometime during the 1994-95 period were substantially less likely to be hospitalized relative to people who stayed in either indemnity or managed care plans for the whole period. The differences between switchers and those in the indemnity plan were statistically significant in the analyses pertaining to adults and early retirees. Switchers who were covered by Employer B also tended to have lower hospitalization rates compared to those in the indemnity plan, but the difference was statistically significant only for adults.
| FIGURE 5-5: Percent Hospitalized During Year, by Employer, Plan Type and Age Group, 1995 |
|---|
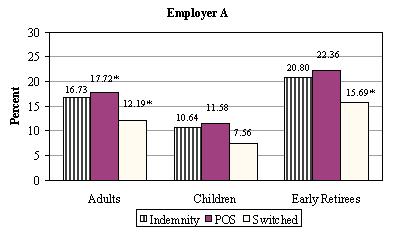 |
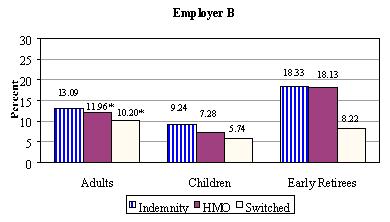 |
| * Mean is significantly different from indemnity plan mean (p < 0.05, analysis of variance) |
The rate of readmission to the hospital within 30 days of a previous hospital discharge is considered a rough indicator of the quality of hospital care when patient characteristics are comparable across plans and facilities. All else equal, one would expect no differences by plan type in readmission rates, if quality were constant across plans. Although not adjusted here for plan population differences, in Figure 5-6 we present the simple differences as a baseline measure. Readmission rates between indemnity and POS plans were very similar for all three samples (adults, children, and early retirees) for Employer A. However, among adults covered by Employer B's plans, those in the HMO plan had significantly lower readmission rates than those in the indemnity plan.
| FIGURE 5-6: Percent of People Readmitted within 30 Days of Hospital Discharge, by Employer, Plan Type and Age Group, 1995 |
|---|
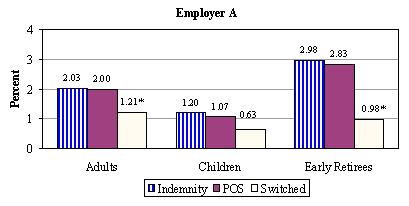 |
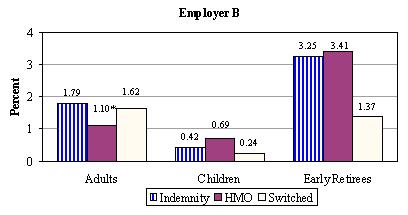 |
| * Mean is significantly different from indemnity plan mean (p < 0.05, analysis of variance) |
Outpatient Service Use
Figure 5-7 shows the number of outpatient claim days for each group, an indicator of the number of outpatient visits made on separate days. For Employer A, estimated visits were significantly higher for those in the POS plan compared to those in the indemnity plan. These differences were statistically significant in all three samples (adults, children, and early retirees). For Employer B the opposite occurred; the average number of outpatient claims days was higher among indemnity plan members than among HMO members.
Home health care use (Figure 5-8) was substantially higher under managed care (POS or HMO) plans than indemnity plans for both employers. As with home health care, the use of therapy services (physical, occupational, or speech) was significantly higher in Employer A's POS plan than in the indemnity plan (Figure 5-9). A different pattern emerged for Employer B, however, where therapy use rates tended to be lower in the managed care plan.
| FIGURE 5-7: Mean Number of Outpatient Claim-Days during Year, by Employer, Plan Type and Age Group, 1995 |
|---|
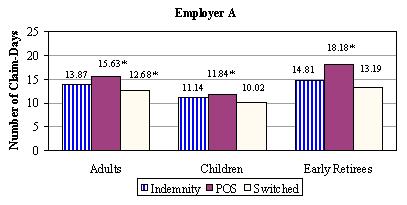 |
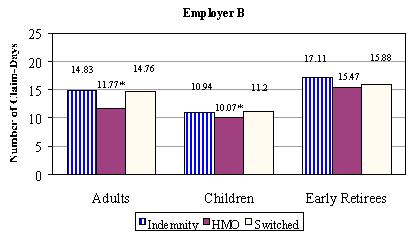 |
| * Mean is significantly different from indemnity plan mean (p < 0.05, analysis of variance) |
| FIGURE 5-8: Percent Using Home Health Care, by Employer, Plan Type and Age Group, 19951 |
|---|
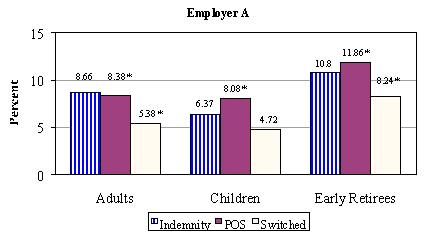 |
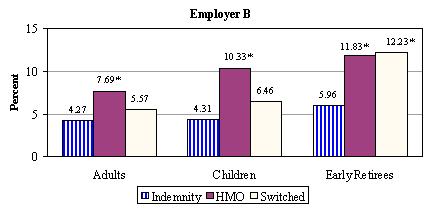 |
| * Mean is significantly different from indemnity plan mean (p < 0.05, analysis of variance) |
| FIGURE 5-9: Percent Any Therapies, by Employer, Plan Type and Age Group, 19951 |
|---|
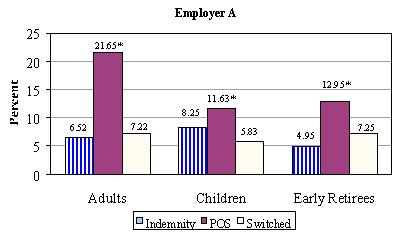 |
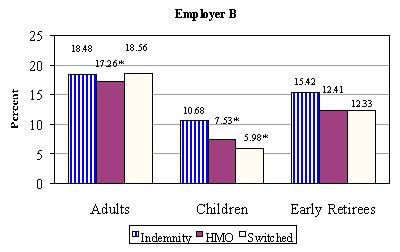 |
* Mean is significantly different from indemnity plan mean (p < 0.05, analysis of variance)
|
Average Expenditures by Employer and Plan Type
Among those who used any inpatient services in 1995, there was no significant difference in inpatient expenditures across plan types for Employer A (not shown). For Employer B, however, mean inpatient expenditures were significantly lower for adults in the HMO plan ($11,095) than for those in the indemnity plan ($19,908).
A similar pattern emerges for outpatient care (not shown). Average outpatient expenditures were similar across plan type for Employer A, with one exception. Among children, the average outpatient expenditures were significantly higher for those in the POS plan ($1,759) than for those in the indemnity plan ($1,487). For Employer B, average outpatient expenditures were significantly lower for HMO members, for all three samples (adults, children, and early retirees).
E. Summary and Discussion
In this chapter, we analyzed enrollment and claims data from the indemnity and managed care plans offered by two large employers to describe the demographic, case mix, and utilization characteristics of people with potentially disabling chronic diseases. We provide comparisons across employers, but focused within employers on differences between those in the indemnity versus the managed care plans. The reader should place more weight on the within-employer comparisons, because the two employers used in this study were not chosen on the basis of similarities in size, mission, location, or employee characteristics. Rather, they were chosen because they have large workforces, a variety of managed care plans, and the ability to link enrollment and medical claims data.
Our descriptive analysis yields several notable results. First, the prevalence of potentially disabling chronic conditions varied between the two employers. The reasons for the prevalence differences are unknown. One may speculate that prevalence estimates reflect the differing nature of employment and the differences in medical benefits covered. For example, compared to Employer B there may be a larger proportion of physically demanding jobs at Employer A that are more difficult to perform for those with potentially disabling chronic conditions. Employer A may therefore attract and retain fewer chronically ill or disabled employees. Alternatively, as a government employer, Employer B may offer better benefits (e.g., health benefits, sick leave, disability earnings coverage, and disability retirement benefits) than other employers in the same locale.5 As a result, Employer B may attract a larger percentage of people with chronic conditions.
Second, despite the differences in prevalence rates between the two employers, the employers' chronically ill populations had roughly the same proportions of many potentially disabling chronic conditions. Heart disease, asthma, cancer, and arthritis were frequent problems for both employers' adult health plan members, while asthma, congenital problems, and cerebral palsy affected both employers' covered children. Moreover, depending upon plan type, 29-57 percent of the sample members had one or more of the most common activity-limiting conditions identified by LaPlante(1989). Thus, in these populations a relatively small set of problems seems to account for a relatively large proportion of those with potentially disabling chronic conditions. If the same kinds of conditions are problematic for many different employers and health plans, disease management companies are likely to respond by offering programs for these frequent problems. At the same time, employers may work together to identify more efficient purchasing or care management strategies to accommodate the needs of their chronically ill health plan enrollees.
Third, analyses of service users showed that those with potentially disabling chronic conditions are more likely to enroll in the indemnity plans than in the managed care plans offered by these two employers. This finding is similar to those based upon data from the Medical Outcomes Study (Kravitz, et al., 1992). It seems in contrast, however, to work by Fama, Fox, and White (1995), who analyzed National Health Interview Survey data from 1992 to compare characteristics of people enrolled in HMOs to those with private indemnity coverage. The Fama, Fox, and White study was limited to a smaller number of chronic conditions than our study, but it was based on nationally representative survey data; neither the Medical Outcomes Study nor our study is nationally representative. Fama, Fox, and White found similar prevalence of chronic conditions across plan types but few differences by plan type in functioning, health status, and the likelihood of having chronic disease.
Other than noting obvious differences in study samples and the lists of chronic conditions studied by us and Fama, Fox, and White, the data we analyzed cannot be used to infer why our results differ from theirs. For example, it is unknown whether those with chronic conditions in our study were more likely to choose indemnity plans because of the desire to maintain existing relationships, or whether their choice was motivated by specific aspects of the managed care benefits. Moreover, the two employers we studied may offer different plan choices than faced by the typical National Health Interview Survey respondent that Fama, Fox, and White studied. These issues cannot be addressed easily without surveying large samples about their enrollment decisions.
Fourth, average age differed across plan types in this study. Indemnity plans had an older patient population. Other studies (such as Kravitz et al., 1992) also found that older people tended toward indemnity plan enrollment.
Fifth, differences in case mix were inconsistent across the managed care and indemnity plan comparisons. This suggestthat controlling for casemix differences across plans is essential before comparing utilization, expenditures or outcomes. Sixth, some inpatient and outpatient utilization measures differed substantially by employer. For example, hospitalization rates were usually higher for Employer A, and the pattern of outpatient claim days and outpatient therapy usage by plan type differed across the employers. Expenditure patterns also differed by employer. Analyses of inpatient expenditures showed no significant differences by plan type for Employer A. However, for Employer B, both inpatient and outpatient expenditures were significantly lower for adults in the HMO plans compared to the indemnity plans. These differences could be due to differences in patient samples, geographic differences in health care use, or other factors.
F. Conclusions
Our descriptive analyses highlighted several facts about chronic illness among the two large employers we studied. Despite substantial differences in size and the nature of their work and some differences in prevalence rates for chronic conditions, the types of chronic conditions most prevalent in each employer heavily overlapped.
We found some notable differences across plan types, although frequently the patterns differed by employer. Active employees and early retirees enrolled in managed care plans were younger on average than those in indemnity plans for both employers. As expected, people in HMOs tended to have fewer physical conditions than those in indemnity plans. The results were reversed for psychiatric conditions, however. We found a higher number of psychiatric diagnostic groups among managed care service users than among service users in indemnity plans. Expenditure patterns were also mixed. Expenses were highest among Employer A's adults in the managed care (POS) plan, while they were highest in the indemnity plan for Employer B. Utilization differed across plan types but inconsistently by employer.
The comparisons generated here should be viewed in the context of the way data were collected. Some studies have been conducted in the past to identify disabled people using survey data that included information on functional limitations and perceived health status. In this study it was not feasible to conduct surveys of the two employers' insured populations to obtain information on health and functional status. Our use of health claims and encounter information to identify those with potentially disabling chronic conditions meant that many comparisons relied on the population who used services within the study period. This limitation precludes comparisons to healthy nonusers of services as well as to people with chronic illnesses who did not use any services in the study year.
In the health plans studied here, approximately 25 percent of those with potentially disabling chronic conditions used no health care services in 1995. (These people were identified as potentially disabled based on their 1994 service use and continued enrollment in the health plans.) It may be useful in subsequent studies to identify and survey service users and nonusers among those who have potentially disabling chronic conditions, to obtain more information about the changing need for medical care. Learning when services are most needed during the course of a chronic condition and learning more about the reasons people choose to use health care services may help providers and administrators plan efforts to better meet the needs of those with chronic conditions. The results of such studies may also help educate those with chronic conditions to better manage their own care.
Descriptive studies often raise more questions than they answer. The findings presented in this chapter raise a number of questions:
-
Why do some people with chronic conditions seek or use care while others do not? Is this pattern due to the natural course of illness, cultural factors, socioeconomic characteristics, or plan policies that either facilitate or impinge upon access to services?
-
What characteristics of plan design are most favorable to people with potentially disabling chronic conditions? Are these factors major determinants of the prevalence differences noted here?
-
How would estimates of the prevalence of people with potentially disabling chronic conditions vary if survey data were used to enhance the claims-based data used here for identifying such people?
-
Why do people switch health plans? Is the switching rate similar for those with and without chronic conditions?
-
Managed care is often viewed as a binary (yes or no) occurrence, but in reality there are degrees of management in virtually all plan types. Which particular features of managed care are more appropriate and beneficial for those with potentially disabling chronic conditions? How may providers manage care and manage the cost of treating patients at the same time?
-
Do utilization and expenditure differences between managed care and indemnity plans remain once controls are made for the likelihood of choosing each plan type?
-
What financial incentives exist for plans to avoid or accept people with potentially disabling chronic conditions? Can these be ameliorated by appropriate payment or rate-setting mechanisms.
Answers to these questions will contribute to our understanding of how well managed care serves the needs of people with potentially disabling chronic conditions. In subsequent chapters of this report, we address the last two questions. In Chapter 6 we analyze people with chronic illness who switch plans. Our goal is to determine how personal and plan characteristics determined their move and whether the evidence is consistent with well-known forms of strategic behavior on the part of individuals and insurance firms. In later chapters we apply competing risk-adjustment methods to these data, to determine how well such models predict expenditures by people with selected chronic conditions. Answers to the other questions would require survey data that were not available for this study.
Although not exhaustive, our findings constitute a significant contribution to publicly available information on health care for people with potentially disabling chronic conditions. They also suggest what additional information, from surveys or medical claims, will be necessary in order to learn more about how managed care can best serve people with potentially disabling chronic conditions.
VI. THE IMPACT OF MANAGED CARE ON UTILIZATION AND EXPENDITURES OF PEOPLE WITH POTENTIALLY DISABLING CHRONIC CONDITIONS
A. Overview
This chapter examines the effects of indemnity and managed care insurance on health care utilization and expenditures among people with potentially disabling chronic conditions. First, we explore whether people with disabilities selectively enroll into more generous forms of health insurance. Specifically, we examined plan switching behavior among people with potentially disabling conditions and determined whether those who switch to more generous plans have higher utilization. In addition, we tested for and quantified the effect of enrollment into managed care plans as opposed to indemnity insurance on utilization and payments among people with potentially disabling chronic conditions.
In this study, the multivariate statistical methods used to estimate the effect of managed care on utilization and payments accounted for two categories of confounding influences: patient characteristics available in our data and unmeasured factors systematically related to insurance choice. Differences in patient characteristics across insurance plans may result in differences in utilization and payments. For example, if those who were older joined the indemnity plan rather than managed care, it is likely that average levels of utilization and payments would have been higher in the indemnity plan merely because of this difference. Without accounting for the different age mix across the two plans, a finding higher average utilization and payments in the indemnity plan can not be ascribed to a greater efficiency of providing services by managed care. The second type of confounding influence is also important to consider since a patient's true health is not completely observable to insurers. "Adverse selection" occurs if people whose poor health is unknown to insurers who choose more generous plans (Cutler and Reber, 1998; Royalty and Solomon, 1999). In this case, premiums will not accurately reflect costs in the population. In response, insurance plans will have an incentive to raise premiums, which may price some individuals out of the market.
The descriptive evidence on plan switching suggests that, as a group, switchers to managed care were relatively healthier and generally used fewer services than the individuals that stayed in the indemnity plans. We found that being male and younger increased the likelihood of managed care as opposed to indemnity coverage. In addition, early retirees and those having both a mental and physical chronic condition had a lower likelihood of choosing managed care.
The multivariate results indicate that enrollment in managed care as opposed to indemnity-type insurance generally reduced service utilization and expenditures. For one Employer, we found some evidence consistent with adverse selection--a situation that may result in premium increases or service cutbacks in the most generous plans through time. For the other Employer, our results suggest that some of the patients that were inherently higher users of health care services may have viewed the indemnity plan as too expensive compared to the managed care plan.
This analysis will be of interest to government policymakers who would like to set rate structures that preserve the widest choice of plans. Public and private officials can gain a better understanding of the forces that drive insurers to exit a market, thereby reducing choice and potentially hindering price competition. The results suggest that policymakers should not automatically favor managed care over indemnity plans as a way to reduce utilization or save money for chronically ill people. Likewise, businesses should not assume that they would save money by giving chronically ill employees an incentive to join managed care plans. Rather, employers and policymakers must investigate the relationship between health plan choice and potential cost savings in plan types.
Following some background on the choice of health insurance and health care utilization and expenditures under different plan types, the remainder of this chapter is organized into five sections. Section C provides an overview of the database used in this study, along with a discussion of the statistical methods used to estimate the effects of managed care on utilization and expenditures. Section D presents evidence on the extent of switching between the managed care and the indemnity insurance options, and investigates whether there were systematic differences in the characteristics of those who did and did not switch plan types. Section E describes the specific samples that are used in the multivariate analyses. Section F discusses the determinants of the choice between managed care and indemnity insurance and the effects of managed care on utilization and expenditures. The final section of this chapter summarizes the main findings. The appendices provide more detail on the conditions used to define those patients with potentially disabling chronic conditions and also contain the full set of empirical estimates discussed in the report.
B. Background on Health Plan Choice and Utilization and Expenditures
When employees are offered two or more plans, adverse selection may result. Adverse selection occurs if people, whose poor health is unknown to insurers, choose more generous plans (Cutler and Reber, 1998; Royalty and Solomon, 1999). In this case, premiums will not cover the costs of the enrolled population. Over time, plans will be forced to raise premiums or cut services.
Plans can take actions to increase the proportion of healthy enrollees, but with uncertain results. They may attempt to avoid sicker individuals through mechanisms like pre-existing condition clauses and limitations on coverage. Conversely, they may attempt to enroll healthier individuals (known as 'cream skimming') through marketing strategies. Royalty and Solomon (1999) found that older and sicker employees at one university were less likely to switch plans due to price than were younger and healthier employees. The authors note that this is consistent with cream skimming but also with greater costs to plan switching among people with high levels of utilization. While raising out-of-pocket expenditures could drive sicker individuals out of high-cost plans, Cutler and Reber(1998) demonstrate that it will also induce healthier individuals to switch to lower-cost plans, making the overall impact of raising the portion of the cost that the patient is responsible for unclear.
Many previous studies have found evidence of differences in patients' health across different forms of insurance. A recent literature review by Hellinger (1995) determined that group- and staff-model HMOs generally attract healthier enrollees among the non-elderly population. Hellinger also reports that HMOs and PPOs that restrict an enrollee's choice of provider enjoy favorable selection among both the non-elderly and elderly populations. The RAND Health Insurance Experiment data supports a mixed conclusion. Relatively sicker and poorer HMO enrollees had both more bed days than did those in indemnity plans. Conversely, in another study, the wealthier population enrolled in HMOs had better general health than their counterparts in indemnity plans (Mark and Mueller, 1996).
A number of studies have specifically focused on the role of mental health in plan choice and how this choice influences utilization and expenditures. Deb et al. (1996) used data from the NMES to examine whether poor mental health status or poor general health status influenced the choice of insurance. Their results suggest that adverse selection may arise when individuals have the opportunity to choose between health insurance policies with different degrees of coverage for mental health care. This impact was found to be significantly more pronounced for patients who considered themselves at risk for mental illness as compared to physical illness. Perneger et al. (1995) also concluded that mental health status and utilization affected the choice of insurance.
Sturm et al. (1995) compared mental health care utilization in HMO and indemnity plans among depressed patients in the Medical Outcomes Study (MOS). They found that the average number of mental health visits was 35-40 percent lower in the HMO system. There was also evidence of adverse selection: patients switching out of HMOs used more services than predicted whereas patients switching out of indemnity plans used fewer services than predicted. In addition, patients of mental health specialists in indemnity plans were found to have lower rates of plan switching than general medical patients in indemnity plans or than HMO patients seeing either type of provider (Sturm et al., 1994). Wells et al. (1991) examined mental health and the selection of PPO providers. Results suggested that the intent to use PPO or non-PPO practitioners for general medical care was not significantly associated with mental health status. Among patients who used mental health services once a PPO became available, those who visited providers who later joined the PPO panel tended to remain with them, while those who visited providers who did not enter the PPO panel subsequently selected away from the PPO for mental health care. Patient-provider relationships appear to be an integral part of the selection of insurance.
C. Data and Methods
1. Database Description
Data about inpatient and outpatient services were obtained for these analyses from the indemnity and managed care plans offered by two large employers. Employer A is a large Employer specializing in various forms of electronic products, media and communications equipment. This Employer has offices in over 30 cities across the United States, but the structure of the health insurance benefits offered is very similar across locations. Each location offers an indemnity plan and a POS managed care plan. The benefits offered in these plans are the same across locations, but the POS plan requires lower co-payments and deductibles and offers a wider array of preventive services than does the indemnity plan. Employer B is a large state government employer. This employer offers an indemnity plan, two PPO plans, and seven HMO plans to all employees. Like Employer A, Employer B's indemnity plan charges higher co-payments and deductibles, but makes no restrictions on out-of-network coverage. Summary features of these options were described in Chapter 2 of this report.
2. Defining Disability
A critical issue in understanding the experience of people with disabilities in managed care plans is identifying the population of interest. As part of the Private Payers Study, new methods for identifying and defining disabled populations have been developed that are based on diagnoses and utilization patterns reported in medical records. The method is described in detail in Chapter 3. The resulting list of potentially disabling chronic per se conditions appear in Appendix B.
For both the switching analysis and the utilization and expenditure analysis work, individuals identified with potentially disabling per se conditions from patient claims were used to form the basic samples. For these patients, we extracted all available health service use and expenditure information during 1994 and 1995. These data were compiled into yearly per-patient summary measures. In addition, we also collected information on patient demographics, health insurance type and enrollment duration, as well as the employment status of the primary beneficiary. Descriptive statistics and details of the analytical samples precede the discussion of each set of results.
3. Multivariate Statistical Methods
Differences in enrollee characteristics among plans need to be accounted for in order to identify the effect of managed care on health care utilization and expenditures. Higher utilization and expenditures in one insurance type as opposed to another may not reflect differences in the plan themselves, but rather underlying differences in enrollees. For example, if older individuals tend to choose indemnity plans over managed care plans and are also less healthy, then a finding of higher utilization and payments in indemnity insurance may be solely attributable to the age variation among the plan types, not to the plan itself.
We estimated the effect of plan type on utilization and expenditures controlling for two categories of confounding influences: patient characteristics available in our data and unmeasured factors systematically related to insurance choice. This second category is important to consider since a patient's true health is not completely observable to insurers, or for that matter, researchers interested in quantifying the effect of different insurance types on health care use and expenditures. As with observable factors, if these unobserved characteristics are also correlated with the outcome variable of interest (e.g. measures of utilization and expenditures), biased estimates of the insurance effect will result. This problem is termed sample selection bias. It can result in erroneous conclusions about the impact of managed care for people with potentially disabling chronic conditions, and ultimately lead to inappropriate policy recommendations.
Heckman (1976, 1979) proposed a two-step statistical method to test for the presence of this type of bias, and correct for it if present. The first step involves estimating the probability of choosing managed care as opposed to indemnity insurance. The probability of choosing managed care is mathematically transformed and used in the second step. In particular, the regression in the second step posits that the outcome of interest (e.g. outpatient expenditures) is potentially dependent upon patient characteristics observed in the data (e.g. age), the transformed probability variable, and the plan by which the individual is covered--managed care or indemnity insurance.
The test-statistic associated with the transformed probability or "selection" variable determines whether sample selection bias is present. If the coefficient associated with this term is statistically significant, one may conclude that unobserved factors related to insurance choice do affect the outcome. The sign of this coefficient indicates the direction in which these unobserved factors influence the outcome variable. In our case, a positive coefficient implies that those who have a higher likelihood of enrolling in managed care will also tend to have higher levels of the use and expenses, based on these unobservable factors. On the other hand, a statistically significant negative coefficient--those with higher likelihood of managed care enrollment tend to have lower utilization levels--is consistent with adverse selection.
Since the selection variable captures the effect of unobserved variables systematically related to insurance choice, the parameter estimate on the insurance indicator variable will be void of these influences (as well as void of any influences of the other observable factors entered in the regression equation). The test-statistic associated with the estimated coefficient of the insurance choice variable tests the null hypothesis of no difference between managed care and indemnity insurance enrollees in terms of their levels of health care utilization and expenditures. An insignificant coefficient indicates that there is no difference between those covered under managed care and indemnity insurance in level of the outcome under study. A significant coefficient rejects the null, indicating a managed care effect--levels of the outcome are different under managed care coverage as opposed to indemnity insurance.
The specific sample selection algorithm (Terza1997, 1998) that we used is an extension of Heckman's two-step procedure. Unlike Heckman's method, this method yields consistent parameter estimates for outcomes that are counts (e.g., number of doctor visits), whose distributions may contain a large frequency of zero-valued observations (e.g., the number of hospitalizations). It is also appropriate for variables that are binary (e.g., whether or not the patient used any rehabilitation services during the year).
D. Evidence of Systematic Selection of Plan Types
We examined the extent to which individuals with potentially disabling chronic conditions switched to and from managed care. Our goal was to determine whether there were differences between the observable characteristics of those who switched plan types ("switchers") and those who stayed with an insurance option ("stayers"). A finding of no differences across the groups in terms of observable patient characteristics may suggest that any differences in utilization and expenditures might be attributable to differences in the plans, rather than to differences in the enrollees themselves.
1. Employer A
The analytic sample used to examine switching behavior in Employer A was comprised of people having potentially disabling conditions in either 1994 or 1995. Only individuals who were members of the indemnity plan in 1994 were analyzed, because data for the POS option was substantially under-reported in this year. These individuals were categorized on the basis of whether they remained in the indemnity option in 1995 or switched to POS insurance. All sample members were required to have continuous enrollment over the period. The sample was further limited to employees only, since enrollment data was not available for spouses or dependents. The final sample consisted of 21,615 individuals:
- 19,424 indemnity stayers(indemnity plan in 1994 and 1995), and
- 2,191 indemnity switchers (indemnity plan in 1994, POS in 1995).
Table C-1 in Appendix C compares the demographic and health characteristics of individuals who switched from an indemnity health plan to a POS plan between 1994 and 1995 to those who stayed in the indemnity plan in both years. Switchers tended to be slightly younger, were more likely to be full-time employees, and were less likely to be early retirees. In addition, switchers were less likely to have a potentially disabling chronic condition in both 1994 and 1995. While 49 percent of the switcher group had a per se disabling physical condition in 1994, the corresponding figure for the stayer group was 54 percent. In 1995 the rates were somewhat higher but the differential remained: 53 percent for switchers and 62 percent for stayers. In 1994 a lower proportion of switchers than stayershad a potentially disabling mental condition or a combination of mentally and physically disabling conditions, although no differences in these measures were found in 1995. Despite their lower rates of disabling illness, switchers were more likely than stayers to use rehabilitation services in 1995.
As expected, healthier employees were more likely than others to switch to managed care insurance. The percentage of individuals with an activity-limiting condition (LaPlante, 1989) was lower among switchers, as were the mean number of MDCs for which enrollees were treated, in both years. Inpatient use and expenditure differences were found as well. A lower proportion of switchers than stayershad a hospitalization in both years, and among those who were hospitalized, median inpatient payments were lower for switchers.6 Mean outpatient visits, as measured by the number of separate days on which an outpatient claim was recorded, were slightly lower for switchers in 1994, as were median outpatient payments in both years. Among users of the prescription drug benefit, average use was lower in the switcher group in 1995.
Appendix C-2 compares these measures within each group across the two years. In both the stayer and switcher groups, physical health appears to have deteriorated through time. Figure 6-1 graphically depicts this decline in terms of the incidence of per se disabling physical conditions. Approximately 54 percent of stayers were diagnosed with such a condition in 1994. By 1995 this number had increased to approximately 62 percent. Although the incidence also increased among switchers, the difference between the two years was smaller (approximately 4 percentage points).
| FIGURE 6-1: Proportion of People Having a Per se Physically Disabled Condition, by Plan Status and Year, Employer A |
|---|
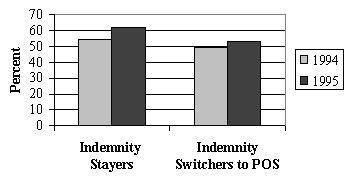 |
The data show that switchers to the POS had lower service use and payments in the year before they switched, with one exception--the likelihood of using rehabilitation services. Stayers, but not switchers, were more likely to be hospitalized in 1995 than in 1994. Among switchers who had an admission, the mean number of admissions and mean length of stay per admission was slightly lower in the year before they switched plans than afterward. No differences in these inpatient measures were found across the years for stayers who were hospitalized.
Outpatient utilization and payments for both groups also increased from 1994 to 1995. Outpatient use and payments increased by a larger percentage over the two years for those that joined the POS plan. Switchers experienced a 29 percent increase in median payments, while stayers'payments rose 11 percent.
Figure 6-2 shows the relative rise in outpatient visits among indemnity plan switchers andstayers. Individuals who moved from indemnity insurance to managed care had an average of 10 outpatient visits in 1994. After the switch, they averaged 14 visits per year. In contrast, the increased visits for stayers over this period wasless than one visit per year.
| FIGURE 6-2: Mean Number of Outpatient Visits, by Plan Status and Year, Employer A |
|---|
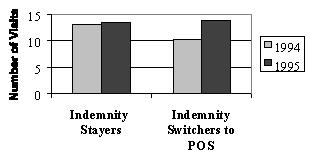 |
In sum, these statistics on plan switching suggest that those employees who chose to switch to the managed care option were healthier and consumed fewer health care services overall than those who remained in the indemnity plan. As expected, delivery of care in the outpatient setting was more heavily emphasized in the POS plan. Although switchers had lower outpatient payments than stayers in both years, they had a greater percentage increase in outpatient payments over the two years.
2. Employer B
The analytic file for Employer B was broader than that for Employer A. It contained employees, spouses and dependents continuously enrolled in some form of health insurance in 1994 and 1995. The 45,044 people in the final file were classified as follows:
- 22,784 indemnity stayers(indemnity in both 1994 and 1995),
- 332 indemnity switchers (indemnity 1994 and HMO 1995),
- 21,618 HMO stayers(HMO in both 1994 and 1995), and
- 310 HMO switchers (HMO 1994 and indemnity 1995).
Very few switchers to an HMO or to an indemnity plan had a hospitalization in either year. For this reason, inpatient utilization and payment information was not examined.
The demographic data displayed in Table C-3a of Appendix C shows that the people who switched from the indemnity plan to the HMO were younger on average and more likely to be employed full-time. Those families that switched plans were also more likely to have a dependent with a per se condition, rather than a spouse or an employee with such a condition.
In both years, the percentage of adults with a per se physical or an activity-limiting condition was higher among those who remained in the indemnity plan. This suggests that those who switched to the HMO option were relatively healthier. Outpatient measures support this contention. In particular, those who switched to the HMO had fewer outpatient visits and lower median outpatient payments in both years.
Table C-3b of Appendix C compares those who stay in the HMO to those who switched from the HMO to the indemnity plan. By several measures we find that people switching to the indemnity plan were less healthy and had higher expenditures than were those who stayed in the HMO. A greater percentage of switchers had a per sephysical or mental condition in 1995. While only 28 percent of the people who stayed in the HMO had an activity-limiting condition in 1995, 38 percent of the switchers were classified with such a condition. The mean number of outpatient visits was higher in 1995 for the switchers than for the stayers. The likelihood of rehabilitation service use was also higher for this group in 1995, although no significant differences in outpatient visits or rehabilitation service use were found for 1994. These higher utilization patterns translated into higher payments. Median total payments in 1995 were over $500 higher for the switchers than they were for those that stayed in the HMO.
Table C-4a in Appendix C compares these measures within each group across the two years. As with Employer A, the incidence of potentially disabling physical conditions increased slightly for both groups from 1994 to 1995. Among those switching to an HMO, median total payments were approximately $1,000 lower in 1995 than in 1994. It may be that this reduction reflects lower inpatient use, since the difference in median outpatient payments across the two years was statistically insignificant. No difference in median total payments across the two years was found for those that remained in the indemnity plan. However, mean total payments and median outpatient payments were lower by approximately $40.
Table C-4b in Appendix C reports differences between these measures in 1994 and 1995 for the group that stayed in the HMO and the group that switched to the indemnity plan. Consistent with our other findings, the percentage of individuals with a per se condition increased in both groups through time.
The mean number of outpatient visits and median outpatient payments also increased significantly in both groups across the years. However, the magnitudes of these increases were greater for those that switched to the indemnity plan. Figure 6-3 depicts the differences in median outpatient payments across years. These results suggest that individuals choose more generous health plans when they know they will need more care.
| FIGURE 6-3: Median Outpatient Payments, by Plan Status and Year, Employer B |
|---|
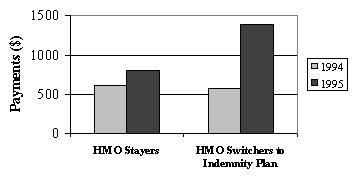 |
As with Employer A, we found that plan switching behavior in Employer B supports the notion that healthier people are more likely to belong to managed care plans. Among those belonging to the indemnity plan in 1994, people who switched to an HMO were healthier than those that stayed. Switchers also had lower median total payments in 1995 than in 1994. Of those who belonged to an HMO in 1994, stayers were healthier than switchers. Those who switched to the indemnity plan experienced much higher median total payments in 1995 than in 1994, suggesting that higher expected payments may be associated with indemnity enrollment rather than HMO enrollment.
While those moving to an HMO had lower expected expenditures than those who stayed in the indemnity plan, the difference in expenditures could have been caused by greater efficiency in the HMO. In order to disentangle these two possibilities--efficiency in providing care versus healthier members--one would need to compare use and payments through time controlling for changes in individual characteristics and plan enrollment. The small number of switchers in both employers precluded an analysis of this type. The next best approach is to compare use and payments across those in the different plan types, controlling for differences in enrollee characteristics that may systematically influence these health care outcomes. The remainder of this chapter takes this approach using the method described in the previous section.
E. Multivariate Analytical Files: Description and Comparison across Insurance Types
1. Employer A
For Employer A, the analytic file for this analysis was restricted to those employees that had an insurance claim in 1995 with a per se disabling condition. Of these employees, 25,044 had complete enrollment data for the year. Those individuals who switched from one plan type to anotherduring 1995 or who had inconsistent or missing data were deleted from the file. After these exclusions 23,270 employees remained,11,061 POS enrollees and 12,209 indemnity plan enrollees. Note that the analysis of prescription drug use and expenditures was only done for a subset of this file since Employer A's drug data was underreported in 1995. This subset contained the 17,232 patients with at least one valid prescription claim.
For these two samples, characteristics of POS enrollees were compared to those of indemnity plan enrollees. These descriptive statistics are presented in Appendix C, Table C-5. Because claims data for individuals enrolled in the POS option was underreported in 1994, a comparison of past utilization levels and expenditures between plan types was precluded.
The POS plan had a slightly higher percentage of male enrollees than the indemnity plan in 1995. Enrollees in the POS plan were also more likely to live in a metropolitan statistical area (91.9 percent versus 80.8 percent). The distribution of individuals across the job categories (active full-time, early retirees, other) differs between those in the POS plan and those in the indemnity plan. Although the majority of members in each of the plans were active full-time employees, a greater percentage of those in the POS plan (75.4 percent) were in this category as opposed to the indemnity plan (58 percent). The indemnity plan had a greater percentage of early retirees and employees that were classified in the "other" category.
The two subsamples appear to be quite similar in terms of the types of potentially disabling chronic conditions they had in 1995. Although there was a statistically significant difference between the plan types in the percentage of people in each per se disability group, the magnitude of the differences is small. Most plan members, regardless of plan type, had a physical per se condition only (91.4 percent for the POS plan and 92.2 for the indemnity option) rather than a mental per secondition or both types of conditions. A somewhat larger difference was found in the percentages of members that had an activity-limiting condition in 1995: 64.9 percent of POS enrollees and 69.5 percent of indemnity enrollees.
Small differences were also found between these two groups in terms of health care use in 1995. POS enrollees were more likely to use rehabilitation services than were those in the indemnity plan (9.7 percent and 6.6 percent, respectively). They also had more outpatient visits (16.4 versus 15.2). The mean number of hospital admissions was lower for POS enrollees (0.261) than for indemnity enrollees (0.301), as was the mean length of stay (1.5 versus 1.8 days). That POS enrollees had more outpatient visits and shorter lengths of inpatient stays is consistent with the widely held view that managed care emphasizes outpatient over inpatient care.
Larger differences in 1995 yearly payments were found between the two groups than were found for the utilization measures. Indemnity plan enrollees had significantly higher inpatient, outpatient and total expenditures than POS enrollees. A comparison across the groups in terms of prescription drug use and payments also yielded differences. POS enrollees who used the drug benefit had significantly fewer prescriptions filled (15.1 versus 20.1) and lower drug expenditures ($758 versus $911) than did indemnity enrollees who used the drug benefit. Total payments (including drug expenditures) were also lower for these POS enrollees than for indemnity enrollees ($6,870 and $9,138, respectively).
These descriptive findings on payments are consistent with two very different hypotheses: (1) the POS plan constrained costs compared to indemnity coverage or (2) enrollees of the POS plan were inherently healthier than their indemnity plan counterparts. The multivariate analysis presented in the next section attempts to disentangle these two determinants of expenditures by simultaneously controlling for differences in individual patient characteristics and plan choice.
2. Employer B
The analytic file for Employer B for the multivariate analysis included insurance claims for health care services used in 1994 and 1995 by employees, spouses and dependents with at least one chronic disabling condition. Only those patients who had continuous enrollment for both years were retained, thereby eliminating those who might have lost insurance coverage over the period. Those who switched from one plan type to another during 1995 were also excluded. After eliminating records with inconsistent or missing data on key analytical variables, the final sample contained information on 22,801 individuals: 9,686 in HMOs and 13,115 in the indemnity plan in 1995.
Characteristics of HMO enrollees were compared to those of indemnity plan enrollees. Statistics for these comparisons are presented in Appendix C, Table C-6. In 1995, HMO enrollees were 8 years younger on average than were enrollees in the indemnity plan. More than 98 percent of all individuals lived in an MSA. Roughly half of enrollees with a per se disabling condition in both groups were employees rather than dependents or spouses. A greater percentage of people in HMOs were classified as dependents (25.2 percent) than in the indemnity group (15.1 percent), while many more indemnity enrollees than HMO enrollees were in the early retiree category (18.6 percent versus 6.7 percent).
The distribution of the three disability categories was also significantly different across the two groups, although the percentages were similar. As was found in Employer A's data, most members with any disability have a physical disability alone (83 percent of HMO members and 85 percent for indemnity members). HMO members were less likely than indemnity plan members to have an activity limiting condition in 1995 (58.3 percent and 62.4 percent, respectively) and have this type of condition in both 1994 and 1995 (27.1 percent and 33.7 percent, respectively). In addition, the percent of patients having a per se potentially disabling condition in both years was much lower for HMO members than for indemnity enrollees (52.0 percent versus 60.3 percent). As for Employer A, less healthy individuals may have opted for the more generous indemnity insurance instead of HMO coverage.
Health care use and expenditure measures followed the expected pattern, with greater use and higher expenditures among indemnity enrollees. All of the health care use measures, except for rehabilitation use in 1995, were found to be statistically different between the two groups of patients. In both 1994 and 1995, HMO enrollees had fewer outpatient visits than did indemnity enrollees. The mean number of hospital admissions and mean length of stay was also higher for indemnity enrollees in both years, although the differences were quite small. Mean outpatient payments were lower by $1,700 in 1994 and $1,600 in 1995 for HMO enrollees. Mean inpatient payments and mean total payments were also much lower for HMO members than for indemnity enrollees. Note that the differences in expenditures were relatively large, especially in light of the small differences in utilization. As such, it is unlikely that the lower expenditures in the HMO were simply the result of lower utilization levels in this type of plan.
These results mirror the findings for Employer A in terms of cost and inpatient use. Managed care enrollees appear to use fewer inpatient services and have lower costs than their indemnity plan counterparts. However, in terms of outpatient service use the results for the two Employers differ. For Employer A, patients in the managed care option had higher levels of use on average, whereas for Employer B average outpatient use was actually lower than that found in the indemnity plan. In addition, no difference in the likelihood of rehabilitation use was found for Employer B across the insurance options, but for Employer A, those in managed care were more likely to use these types of services.
In sum, these results suggest that both Employers may be subject to not only a managed care effect on utilization and expenditures but also differential selection of insurance by patients. Simple descriptive statistics such as these cannot separate the impact of these two influences on utilization and expenditures, however, since other factors may be influencing these trends. For example, the finding that indemnity plan members in both Employers have higher payments is consistent with both an insurance effect and adverse selection. More generous insurance not only reduces the cost of care from the patient's perspective, but also attracts relatively sicker patients. The remainder of the chapter presents results from the multivariate framework described in Section VI.C.3 in an attempt to separate these factors. The next section presents the results from this exercise.
F. Determinants of Insurance Choice
For each Employer, we estimated the probability of enrollment in a managed care plan, as opposed to indemnity insurance, controlling for individual patient characteristics. The choice was posited as depending upon the following factors: patient demographics; the per se and activity-limiting condition status of the patient; whether the patient with theper se disabling condition was an employee, spouse or dependent (for Employer B only); the employment status of the primary beneficiary; and measures of past health care use (for Employer B only).
While the results of this analysis are interesting in their own right, the estimates are primarily used to formulate a proxy for unobservable individual factors (such as disease severity) that are correlated with insurance choice and may also influence use and payments. This proxy then enters into the second stage of the algorithm, in which we model utilization or expenditures. Before turning to the results of the two-stage models, we briefly discuss the determinants of the choice between managed care and indemnity insurance in the two employers.
1. Insurance Choice Results
Employer A
For Employer A, the (first-stage) probability models assessed the impact of beneficiary characteristics on the probability of enrolling in the POS plan. Two models were constructed: the first included all employees with a per se disabling condition in 1995 and the second included the subsample of these employees for whom prescription drug data were available. In these models, an incremental effect (or marginal effect) of a variable is the impact of a small change in that variable on the probability of selecting the POS plan rather than the indemnity plan.
The results of the first model on insurance choice for Employer A appear in Appendix D, Table D-1. There were five statistically significant variables: gender, age, metropolitan statistical area (MSA), early retiree, and physical and mental chronic condition. The variable having the largest incremental effect was MSA: living in an MSA increased the likelihood of choosing the POS by 23.7 percentage points. The next two most important variables were early retiree and physical and mental chronic condition. Being an early retiree reduced the likelihood of enrolling in the POS plan by 11.8 percentage points, while having a physical and mental condition as opposed to just a physical condition reduced the likelihood of POS enrollment by 9.5 percentage points. Being male increased the likelihood of POS enrollment by 6.5 percentage points. Older individuals were also more likely to join the indemnity plan.
Applying the parameter estimates to the sample data to predict insurance choices yields some information on how well the model fits the data. Overall, the model correctly predicted 61.1 percent of insurance choices: 62.5 percent of POS and 60.1 percent of indemnity plan enrollees are correctly classified by this model specification.
The results from the second model, for prescription drug users for Employer A, are presented in Appendix D, Table D-9. With the exception of the variable representing the presence of a disabling mental condition only, the same variables are significant here as were for the full sample. In addition, the incremental effects have the same signs and are of similar magnitudes. Relative to having no disabling conditions, having a disabling mental condition reduced the likelihood of choosing managed care by approximately 3 percent. The model predicted the choice of indemnity insurance quite well (91.44 percent were correctly classified). However, its ability to predict the choice of the POS plan in this subsample of prescription drug users appeared to be limited: only 12.3 percent of that group were correctly classified.
Employer B
For Employer B, models were run that assessed the importance of beneficiary characteristics on the probability of enrolling in the HMO plan rather than the indemnity plan. Two models were constructed: the first included data on past health care usage (which has been shown to be a good predictor of health insurance selection) and the second excluded data on past health care usage. These two specifications are presented because the second-stage results are sensitive to the inclusion or exclusion of these variables. As the results presented in Appendix D show, models without past use revealed no managed care effect.
Including past use in the first stage is somewhat methodologically controversial because one might argue that it is jointly determined with insurance choice through time. If so, parameter estimates might be biased. Alternatively, one could view past use as pre-determined (rather than jointly determined) at the time that the patient makes the decision about what plan to join in 1995. In this case, bias is not a problem. Given the non-findings for models that excluded past use, the models that include past use are our preferred specifications. For completeness, both sets of results are presented in the appendices.
Results of these two specifications for Employer B appear in Table D-13 of Appendix D. In Model 1--which included past utilization--there were six statistically significant variables: male gender, age, dependent status, early retiree status, number of outpatient visits in 1994, and the presence of both a physical and mental per se condition. The variable with the greatest impact was dependent status, followed by early retiree status. The likelihood of HMO enrollment was reduced by 24.0 percentage points for a family that had a dependent (rather than an employee) with a per se disabling condition in 1995. Being an early retiree reduced the likelihood of HMO enrollment by 14.3 percentage points. The next most important effect on this probability was for patients with both physical and mental chronic conditions. Having both conditions reduced the probability of HMO enrollment by 4.0 percentage points. The other three statistically significant variables--gender, age, and number of outpatient claim-days in 1994--produced smaller incremental effects.
In Model 2, which excluded any measure of past use, many of the incremental effects were of similar sign and magnitude. In particular, similar effects were found for gender, age, dependent status, early retiree status, and having per se disabling physical and mental conditions. Unlike Model 1, HMO membership was somewhat more likely if the family had a spouse who had a per se condition in 1995 as opposed to an employee with a per se condition.
The two models correctly predicted the same proportion of insurance choices, approximately 63 percent. Both models were better at predicting indemnity insurance choices (75 percent correctly predicted) than HMO choices (45-47 percent). In terms of this measure and the incremental effects, the models seem to be very similar. However, as previously mentioned, they led to very different results in the second stage of the model.
In sum, we found that being male and younger increased the likelihood of managed care at both Employers. In addition, early retirees and those with both mental and physical disabling conditions had a lower likelihood of managed care coverage. In Employer A, living in an MSA increased the probability of enrollment in the POS option, while in Employer B, having higher 1994 outpatient use or having the person with a disabling condition as a dependent on the insurance policy lowered the probability of HMO enrollment.
2. Utilization and Expenditure Results
A number of variables were posited to influence utilization and expenditures: demographics, insurance status (Employer B only), employment status, the number of unique MDCs in 1995, and disability status. In addition, there may be unobservable factors that affect both the first-stage (insurance choice) equations and the second-stage (use or expenditures) equations. For each Employer, we used the parameter estimates from the insurance choice equations to calculate a proxy variable for unobservable factors that may affect use and expenditures and are also correlated with insurance choice. This variable was then used in the estimations of use and expenditures in the calculation of a term that corrects the parameter estimates on the observable factors for these unobservable influences. One component of this term is a parameter that captures the correlation between unobserved factors that influence insurance selection and the outcome of interest. The estimate of this parameter, (referred to as theta in the Tables), reflects the existence (or non-existence) of the influence of these types of unobservable factors.
If the estimate of theta is statistically significant, we may reject the hypothesis that unobserved factors correlated with insurance choice do not affect the use or expenditure measure under study. In this case, unbiased parameter estimates of the determinants of use and expenditures are obtained from the two-stage technique we have outlined above. However, if theta is statistically insignificant then unbiased results on these determinants are obtained from a different algorithm, one that considers insurance choice and the determination of utilization levels and expenditures as unrelated (non-endogenous) decisions from the patient's perspective. Correct parameter estimates are obtained in this case by running simple regression models that disregard unobservable factors correlated with insurance choices. For completeness, both types of models were run for all measures and for both Employers.
Detailed results for Employer A for each utilization and expenditure measure are presented in Appendix D, Tables D-2 through D-8 and D-10 through D-12. For Employer B, results are also listed in Appendix D, in Tables D-14 through D-20. These last seven tables contain an extra column of results compared to the Tables for Employer A. As noted above, two different specifications of the insurance choice equation for Employer B were run. Model 1 includes past utilization measures in the first-stage insurance choice equation, while Model 2 excludes past utilization.
Table 6-1 and Table 6-2 below summarize the main results of these models. Specifically, they show the direction of managed care's effect on utilization and expenditures, and whether there was any evidence that unobservable factors correlated with insurance choice influenced the use and expenditure outcomes. The tables also display summary results from the simple descriptive analysis for comparison purposes. More detail about the incremental effects for each of the models is presented in Appendix D, in Table D-21 and Table D-22. The following discussion focuses on the information contained in these four tables.
Employer A
In the models of rehabilitation service use and outpatient payments, the estimate of theta was statistically significant. This implies that there were unobservable factors correlated with the choice of insurance that influenced the likelihood of rehabilitation service use and the level of outpatient payments. The sign on the parameter estimate was negative. This indicates that those who were less likely to join the POS plan were also more likely (due to unobserved factors) to have used rehabilitation services and to have had higher outpatient payments. Factors such as uncontrolled-for severity of illness might have led to this result. This is consistent with the idea that sicker individuals join more generous plans. If the true health status of the population is not fully reflected in premiums, then premiums will most likely rise through time.
Controlling for the influence of such factors (as well as observable patient characteristics) yields a positive effect of POS membership on these two measures. In particular, the incremental effect of membership in the POS plan on rehabilitation service use is 33 percentage points. The effect of POS plan membership on median outpatient payments is approximately an additional $2,700 per year.
These effects are quite large. This may be an artifact of how the observable data we have interact with some of the technical features of the estimation algorithm. Note that the simple model that ignored unobservables and treated insurance choice and the level of these measures as unrelated also resulted in a positive incremental effect of POS membership. The estimate of the likelihood of rehabilitation service use from this model was much smaller--only 3.4 percent (see column 4 in Table D-21). It is likely that the true impact is somewhere between these values. For outpatient payments, the simple model produced a negative effect of POS plan membership. Ascertaining the correct sign of this effect is impossible without more comprehensive data.
Although no other models yielded evidence of unobservable factors influencing use and expenditures, there were additional statistically significant managed care effects for the number of outpatient visits, the number of prescriptions, and prescription payments. POS plan coverage decreased the levels of these measures. For a patient with the average number of visits in the sample (approximately 16), enrollment in the POS plan would have had decreased the number by slightly more than 1 visit per year, relative to having indemnity insurance. Prescription use for the mean prescription user (approximately 18 prescriptions) would fall by 3.6 prescriptions per year with POS plan membership. In terms of prescription payments, a person having the median payment ($552.63) would be expected to have $75 lower payments than her counterpart in the indemnity plan.
A comparison of columns 1 and 2 in Table 6-1 reveals that some of the differences found in the descriptive analysis were eliminated once individual patient characteristics are accounted for. In fact, controlling for differences in POS and indemnity plan enrollee characteristics actually changed the sign of the effect of POS membership on the number of outpatient visits. Once these differences are accounted for, POS membership reduces rather than increases outpatient visits.
| TABLE 6-1: The Effect of POS Versus Indemnity Insurance on Health Care Utilization and Payments, Employer A | |||
|---|---|---|---|
| Outcome Measure | Sign of Descriptive Result | Sign of Multivariate Result | Evidence of Unobservables Influencing Outcome? |
| Number of hospital admissions | - | n.s. | no |
| Number of hospital days | - | n.s. | no |
| Number of outpatient visits | + | - | no |
| Any use of rehabilitation services | + | + | yes |
| Inpatient payments | - | n.s. | no |
| Outpatient payments | - | ? | yes |
| Total payments | - | n.s. | no |
| Number of prescriptions among users | - | - | no |
| Prescription drug payments among users | - | - | no |
| NOTES: A minus sign indicates that utilization or payments were lower in POS than in the indemnity plan. A plus sign indicates that utilization or payments were higher in POS than in the indemnity plan. n.s. = not statistically significant. | |||
Employer B
For Employer B, models of the number of hospital admissions, number of outpatient visits, the use of any rehabilitation services, as well as for outpatient and total payments, yielded evidence that unobservable factors correlated with insurance choice were an important factor for these outcomes. For these measures, theta was positive and statistically significant. This implies that individuals who are more likely to join the HMO plan rather than an indemnity plan (based on unmeasured factors) are also more likely to have higher levels of use and expenditures. It may be that those that were inherently sicker (and higher users of health care) were effectively screened-out of the market for indemnity insurance by price. Although Employer B does not overtly refuse coverage to employees and their dependents, in order to maintain the financial viability of the indemnity option they raised premiums significantly. The price differential between the indemnity plan and the HMO option was quite substantial (see Chapter 2 of this report).
After controlling for patient characteristics and this type of unobservable influence, the effect of HMO enrollment on these measures was negative. (Column 2 in Table D-22 in Appendix D displays these incremental effects evaluated at the mean or median levels in the sample.) HMOs would be expected to have 192 fewer admissions per year per 1000 patients than the indemnity plan. For a patient with the mean number of outpatient claim days, HMO membership would decrease use substantially--approximately 14 visits per year. The likelihood of any use of rehabilitation services during the year is expected to be lower by 35.5 percentage points with HMO membership. For the patient with median outpatient and total payments, the estimated incremental effects of HMO coverage are quite large ($1,414 and $1,425, respectively).
| TABLE 6-2: The Effect of HMO Versus Indemnity Insurance on Health Care Utilization and Payments, Employer B | |||
|---|---|---|---|
| Outcome Measure | Sign of Descriptive Result | Sign of Multivariate Result | Evidence of Unobservables Influencing Outcome? |
| Number of hospital admissions | - | - | yes |
| Number of hospital days | - | + | no |
| Number of outpatient visits | - | - | yes |
| Any use of rehabilitation services | n.s. | ? | yes |
| Inpatient payments | - | n.s. | no |
| Outpatient payments | - | - | yes |
| Total payments | - | - | yes |
| NOTES: A minus sign indicates that utilization or payments were lower in HMO than in the indemnity plan. A plus sign indicates that utilization or payments were higher in HMO than in the indemnity plan. n.s. = not statistically significant. | |||
As for Employer A, using the simple model that ignores unobservables generally yielded similar results in terms of sign. An exception was found for the likelihood of any rehabilitation use. Based on the simpler model, HMO membership increased the likelihood of the use of these services slightly. For the other measures, the simple model resulted in smaller HMO effects. It is likely that the true impact of membership in the HMO as opposed to the indemnity plan is somewhere between these values (see columns 2 and 5 in Table D-22).
Also similar to Employer A, a comparison of columns 1 and 2 in Table 6-2 reveals the importance of considering differences in enrollee characteristics when making inferences regarding the effect of plan type on the levels of use and expenditures. Controlling for differences in patient characteristics changed the sign of the effect of HMO membership on the number of hospital days and eliminated the effect on inpatient payments. While the other effects were consistent in sign in the descriptive and multivariate approaches, the magnitudes did differ.
G. Summary and Conclusions
Four major conclusions can be drawn from this chapter. First, it appears that individuals with potentially disabling chronic conditions are not homogeneous with respect to the type of insurance they choose. We found that enrollment into different insurance types was systematically related to patient characteristics. Being male and younger increased the likelihood of choosing managed care as opposed to indemnity coverage in both firms. Early retirees and persons having both mental and physical disabling conditions, rather than just a physical condition, were less likely to choose managed care. Living in a MSA increased the probability of enrollment in the POS option in Employer A, while using more outpatient services in the past or having a child with a potentially disabling chronic condition in the family lowered the probability of HMO enrollment.
Second, differences in enrollee characteristics among plans need to be accounted for in order to identify the effect of managed care on health care utilization and expenditures. Higher utilization and expenditures in one insurance type or another may not reflect differences in the plans themselves, but rather underlying differences in enrollees. Statistical methods should be used when possible to control for two categories of confounding influences: patient characteristics available in databases of enrollees and unmeasured factors systematically related to insurance choice (e.g., causes of adverse selection). For Employer A, we found that utilization and expenditures were generally lower, on average, in the POS plan without controlling for any confounders. After adjusting for population characteristics, fewer differences emerge, and those that remain are generally smaller. For example, on average POS enrollees had 15 prescriptions filled in 1995, whereas indemnity plan enrollees filled 20. After controlling for confounders, this difference of five prescriptions was reduced to 3.6.
For Employer B we also found that simple descriptive comparisons resulted in mean utilization and expenditures in 1995 that were generally lower in the HMO plan than in the indemnity plan. In contrast to Employer A, after controlling for confounders, more differences remain (hospital admissions, outpatient visits, outpatient expenditures and total expenditures). However, as with Employer A, those that do remain are generally smaller in magnitude.
Third, managed care does not have a uniform effect. Rather, its impact varied with the type of health care services and payments being studies. Choosing managed care insurance instead of indemnity insurance did not result in different levels for some outcomes (such as inpatient payments), but did for others (outpatient visits). The effect of managed care also differed across the employers. Overall, the difference in use and expenditures between managed care and indemnity plans was greater for Employer B than for Employer A. This result is not surprising since the coverage levels and costs of the alternative options were more similar in Employer A than in Employer B.
Fourth, there is some evidence consistent with adverse selection among members of Employee A's health plans but not among those in Employer B's plans. In Employer B's plans, contrary to expectations, we found some evidence that those having higher expenditures based upon unobservable confounders were also more likely to have joined the HMO plan. This is probably due to the relatively high price of the indemnity plan. People with potentially disabling chronic conditions may have viewed the indemnity plan as too expensive compared to the HMO options.
VII. RISK-ADJUSTMENT FOR PEOPLE WITH POTENTIALLY DISABLING CHRONIC CONDITIONS
A. Introduction
The analyses presented in Chapter 7 and Chapter 8 address the ability of leading risk-adjustment systems to predict expenditures for individuals with potentially disabling chronic conditions. The first study (Chapter 7) includes a wide range of physical conditions and a composite measure of psychological illness. The second study (Chapter 8) focuses on psychological conditions alone in order to test whether common risk-adjustment methods will successfully predict expenditures in behavioral care carve-out arrangements. While the first study focuses on the prediction of total expenditures, the second study focuses on the prediction of expenditures for treatment of psychiatric disorders, since only psychiatric-related expenditures would be covered by a behavioral care carve-out arrangement.
The studies follow a similar pattern. We use 1994 and 1995 data from large employers to identify a sample of privately insured people with chronic and potentially disabling conditions. We describe the expenditure characteristics of a sample of people with chronic and potentially disabling conditions in this population. We estimate the predicted expenditures of this population using leading risk-adjustment systems and evaluate their predictive ability by comparing predicted to actual expenditures. Finally, we simulate the impact of risk-adjustment on health plans' financial gains or losses.
The following section provides a general introduction to leading risk-adjustment systems, including their purpose and details of their construction.
B. Risk-Adjustment
Although the problem of adverse selection into more generous health insurance plans has been the focus of decades of work, risk-adjustment systems have only recently begun to be implemented to blunt its effect. The Health Care Financing Administration (HCFA) is employing Diagnostic Care Groups (DCGs) in the Medicare program. Maryland Medicaid is implementing Adjusted Clinical Groups (Wiener et al., 1998), and a number of case studies have recently been published describing the experiences of private sector employers with various risk-adjustment systems (Wilson et al., 1998; Bertkoet al., 1998; Dunn et al., 1998; Knutson et al., 1998; Tollenet al., 1998).
Risk-adjustment systems attempt to predict enrollees' expected future health care expenditures given their current characteristics, most notably their current health status. The predictions are then used to adjust payments to health plans. The intended result is that plans offering generous benefits or services that attract sicker enrollees will not be penalized financially for doing so. Thus, a plan's incentive to avoid high-cost patients will be minimized.
Risk-adjustment is most important for conditions that can be identified and avoided by health plans, especially those associated with a high probability of future service use and costly health care. People with potentially disabling chronic conditions are particularly vulnerable. Health plans may seek to avoid enrollees with chronic conditions through a number of methods. They can gear their marketing materials toward healthier populations, they can limit access to certain types of specialists, they can offer less generous insurance benefits (e.g., they can offer limited prescription drug coverage, high copayments, or minimal coverage for services like psychiatric care), and they can explicitly exclude such people by disallowing payment for specified treatments.
Because of the particular vulnerability of people with chronic illness, it is critical that we understand the ability of different types of risk-adjustment systems to predict their health care expenditures. Risk-adjustment may be better at predicting expenditures of people with certain conditions than others. Furthermore, some types of risk-adjusters may work better for some conditions (e.g., asthma) than for others (e.g., psychiatric disorders).
1. Risk-Adjustment Grouper Systems
Two of the leading risk-adjustment systems for predicting inpatient and outpatient expenditures are Adjusted Clinical Groups (ACGs, formerly called Ambulatory Care Groups) (Wiener et al., 1991) and DCGs (Ellis et al., 1996). These risk-adjustment systems group people into distinct categories based on their diagnoses and secondarily on their age and gender. These categories can then be used to explain why some people have higher health care expenditures than other people.
Adjusted Clinical Groups
The version of ACGs used in this study, Release 4.1, groups people into categories through several steps. First, the ACG software assigns each person's inpatient and outpatient claims to one of 32 Adjusted Diagnosis Groups (ADGs) based on the ICD-9-CM diagnosis code on the claim and five clinical/resource consumption dimensions of that diagnosis code. These clinical/resource consumption dimensions include the following:
-
"Duration (acute, recurrent or chronic): How long will health care resources be required for the management of this condition?
-
Severity (minor/stable versus major/unstable: How intensely must health care resources be applied to manage the condition?
-
Diagnostic Certainty (symptoms versus diseases): Will a diagnostic evaluation be needed (symptoms) or will services for treatment be the primary focus (diseases/diagnoses)?
-
Etiology (infectious, injury or other): What types of health care services will be used?
-
Specialty Care (medical, surgical, obstetric, hematology, etc.): To what degree will specialty care services be required?" (Johns Hopkins University, 1998).
Next, based on age, sex, and ADGs, people are classified into one of 93 mutually exclusive ACGs.8 The process of creating ACGs is summarized in Figure 7-1.
| FIGURE 7-1. Creation of ACGs |
|---|
![Diagram: Box (13,000 ICD-9-CM Codes); [right pointing arrow (over arrow Clinical and resource construction criteri)]; Box (32 ADGs); [right pointing arrrow (over arrow Patient age, gender and ADG combinations)]; Box (93 ACGs).](/sites/default/files/private/images-reports/private-payers-serving-individuals-disabilities-and-chronic-conditions/privpay-fig7-1.JPG) |
| SOURCE: Johns Hopkins University (1999). |
Diagnostic Cost Groups
DCGs use ICD-9-CM diagnostic codes to classify patients based on the clinical similarity of the conditions that are being treated. Patients with similar medical problems are assigned to similar groups. In this study we use a particular version of DCGs (release version 3.0) called Hierarchical Coexisting Conditions (HCCs). The HCC models use ICD-9-CM codes from all clinical encounters except laboratory and other ancillary tests and services provided by non-clinically trained personnel.9 The HCC grouper software first assigns claims to one of 543 DxGroups based on the person's ICD-9-CM diagnosis code, and in a few cases, on the person's age. Each ICD-9-CM code maps to one and only one of 543 DxGroups, although one person can be assigned to several DxGroups. The 543 DxGroups are then organized into 118 Condition Categories (CCs) on the basis of clinical similarity and resource use. Each person may have multiple CCs depending on the variety of his or her diagnoses. For example, there are 8 Neoplasm CCs, ranging from the most serious and costly, Neoplasm 1 (metastatic cancers), to the least, Neoplasm 8 (benign neoplasms). Other CC clusters include, among others, infections, diabetes, heart, and mental conditions. CCs are then organized hierarchically in terms of costliness. A CC designation for a person after this hierarchical pruning process has been applied is called an HCC. The process of creating the HCCs is summarized in Figure 7-2.
The HCCs reflect the clinical relationship between specific diseases as well as expected resource use. Hierarchies are imposed so that credit is given (in terms of predicted expenses) for only the most costly of clinically related conditions. For example, within the cancer hierarchy, each person is assigned only to the single highest cost category that applies. The cost category that remains after this hierarchical pruning process is called an HCC. The set of HCCs for a person forms the basis for predicting his or her resource use.
| FIGURE 7-2. Creation of HCCs |
|---|
![Diagram: Box (13,000 ICD-9-CM Codes); [right pointing arrow (over arrow Clinical homogeneity (and rarely age) criteria)]; Box (545 DxGroups); [right pointing arrrow (over arrow Clinical similarity and resource-use criteria)]; Box (118 Condition Categories); [right pointing arrrow (over arrow Highest-cost CC)]; Box (136 HCCs).](/sites/default/files/private/images-reports/private-payers-serving-individuals-disabilities-and-chronic-conditions/privpay-fig7-2.JPG) |
| SOURCE: DxCG, Inc (1999). |
In contrast to the ACG software, the DCG software also provides weights for each HCC. The weights indicate the relative expected spending (or costliness) of patients across the HCCs. These weights are derived by calculating the expenditures for each group compared to the average for the developmental sample. The developmental sample used to generate the weights included privately insured, Medicare, and Medicaid data. Weights were calculated separately for each of these three populations. The privately insured population weights were developed using 1992 and 1993 data on 27 "clients" and about 1.7 million covered lives obtained from Mercer, Inc. (Ash et al., 1997). Clients were mainly large employers. Weights for the Medicare and Medicaid populations were derived from medical claims of the respective programs. In this study, we compare the predictive ability of the HCC weights included in the DCG software with the weights that we calculated based on data from each employer in our sample.
2. Previous Research on Predictive Power
Previous studies have used varied techniques to compare health risk-adjustment to simple age-and-sex adjustment. The studies conclude that health risk-adjustment significantly improves predictive ability (Dunn et al., 1996; Wiener et al., 1998). Few papers have examined the predictive ability of health risk adjustors for specific chronic conditions. Wiener and colleagues (1996) examined the predictive ratios of two types of models based on ADGs for the Medicare population in comparison to the Average Annual Per Capita Cost model. The ADG models performed better for 15 of 17 chronic conditions. For 9 of the 15 conditions, the predicted expenditures were within 10 percent of actual expenditures.
Ash and colleagues (1997) examined the predictive ratios of DCGs models for 26 different chronic conditions using data from a large private employer. They found that the predictive ratios for 13 disorders were within 10 percent of the actual costs. Seven chronic disorders had predicted costs that were more than 25 percent lower than the actual costs: breast cancer, hip fracture, rheumatoid arthritis, HIV/AIDS, cystic fibrosis, sexually transmitted diseases, and lymphoma.
C. Methods for this Study
Samples
The data for this study come from claims and enrollment files from two large employers for years 1994 and 1995. To remind the reader, Employer A is a private sector employer with over 30 locations across the United States, where each location offers the same indemnity plan and a POS managed care plan. Employer B is a large state government employer which offers an indemnity plan, a preferred provider organization (PPO) plan, and seven health maintenance organization (HMO) plans. A description of the features and costs of each plan is given in Chapter 2.
For this risk-adjustment study, the sample from Employer A was limited to employees age 18 to 65; data on dependents were not available. The POS plan was not offered in 1994, so the data for Employer A come from the indemnity plan only. The total sample included 68,904 employees. The sample used to estimate the models for Employer B consisted of 171,644 employees, dependents, and retirees under age 65.
D. Defining Disability
As described earlier, patients with chronic and potentially disabling conditions were identified on the basis of the ICD-9-CM diagnosis codes and utilization indicators reported in their medical claims and encounter data. This resulting list of over 320 diagnoses will be referred to as per se diagnoses, because the occurrence of any of these is expected to be associated with chronic illness or disability. More than 30 additional diagnoses were identified as indicators of chronic diseases and potential disabilities if they occurred with substantial inpatient or outpatient utilization or very high expenditures during a study year. We use both methods for defining potentially disabling chronic illness in this analysis.
In addition, researchers at Harvard University developed a method for identifying people with psychiatric disabilities (Ettner et al., 1998). People were defined as having a chronic and potentially disabling psychiatric condition if they have the following diagnoses: schizophrenia or schizoaffective disorder; manic depression/bipolar disorder; autism; recurrent major depression; major depression with anxiety disorders; or substance abuse with a secondary psychiatric disorder. We will refer to this group of conditions as "psychiatric disorders" in our analyses.
Finally, we examine a set of conditions which are expected to be most highly associated with disability among adults. They were identified by LaPlante based on an analysis of the 1983-1986 National Health Interview Survey (Laplante, 1989). In this analysis, diagnoses that were most likely to be associated with reports of limitations in daily activities or work, or the inability to work, were identified; see Appendix A-1 and Appendix A-3 for a detailed list. We will refer to these as "activity-limiting conditions."
Table 7-1 illustrates the prevalence of the potentially disabling chronic conditions examined in this study for 1994 and 1995, broken down by employer. They represent diagnoses taken from Appendix A, grouped by illness. These conditions were selected because they were among the most prevalent in the populations examined and because they represent a range of disease types. Conditions defined on the basis of both diagnosis and utilization information are noted.
| TABLE 7-1. Sample Size for Selected Potentially Disabling Chronic Disease Diagnoses, by Employer, years 1994-1995 | ||
|---|---|---|
| Employer A | Employer B | |
| All Employees | 68,904 | 171,644 |
| Asthma1 | 1,194 | 3,797 |
| Cancer1 | 1,138 | 2,284 |
| Psychiatric disorders | 973 | 3,129 |
| Chronic Obstructive Pulmonary Disease | 828 | 1,372 |
| Heart Failure1 | 418 | 613 |
| Diabetes1 | 229 | 543 |
| Rheumatoid Arthritis1 | 332 | 725 |
| Seizure Disorders | 310 | 921 |
| Ulcerative Colitis | 138 | 315 |
| Ability-Limiting Conditions | 9,505 | 17,117 |
| ||
E. Developing Risk-Adjustment Models
After everyone in the sample had been grouped into each of HCC, ADG and ACG categories using the DCG and ACG software, we estimated multiple regression models on part of the sample. In the models the dependent variable is total payments for inpatient and outpatient treatment in 1995. Total payments were based on submitted claims, including both the portion of costs paid for by the health plan and the portion paid for by the individual (e.g., cost-sharing and deductibles). Total payments excluded pharmaceutical expenditures because pharmacy data were not available for all observations.
The estimated coefficients from these models are then applied to each person in the sample to predict their future costs relative to a base average expenditures. In effect, this applies relative weights across the groups. The four regression models used to predict expenditures included the following independent variables:
- Baseline: age, sex, hospital wage index
- Baseline+HCC: age, sex, hospital wage index, HCCs
- Baseline+ACG: age, sex, hospital wage index, ACGs
- Baseline+ADG: age, sex, hospital wage index, ADGs
We also predicted expenditures by a fifth method, termed HCC-SW (for HCC-Supplied Weights). These weights are provided with the DCG software and reflect a regression model performed by the authors of the DCG system. Our method for using them is described below.
The unit of observation in each model was the individual. Each variable was defined over the course of a year based on an individual's claims and enrollment data. The models were estimated on people who were continuously enrolled for two years, 1994 and 1995.
The independent variables in the first model were the person's age and sex, and the hospital area wage index for the patient's locale. The hospital wage index was created by the Health Care Financing Administration to measure hospital labor costs. Each MSA (metropolitan statistical area) in the country is assigned a hospital wage index. Areas outside an MSA are assigned a state wage index. Because labor expenditures make up the majority of hospital expenditures and hospital expenditures make up a large portion of total expenditures, the hospital wage index is often used to control for differences in the price of health care across different areas of the country.
The independent variables in the second model were the person's age, sex, hospital wage index, and HCC. The HCCs are entered as binary variables in the model (excluding one reference HCC). The third model consisted of the person's age, sex, hospital wage index, and ACG. As with the HCC model, the ACGs entered the model as binary variables. The fourth model included the person's age, sex, hospital wage index, and binary indicators for the ADG categories.
We estimated the models through an iterative method. We first drew a random 70 percent sample and used it to estimate weights for the independent variables. These weights were used to predict total expenditures for the remaining 30 percent of people. Because predictive accuracy can vary across random samples, we estimated each model 50 times, each time drawing a different 70 percent random sample. This yielded 50 estimates of total expenditures for each person using the remaining 30 percent sample. The predicted expenditures we report are the averages of the 50 predictions.
The models were estimated using ordinary least squares (OLS) regression, a linear model. Although, the average annual total expenditures are highly skewed by the presence of very high expenditures for a few cases, OLS is quite robust to asymmetric and highly skewed errors. Second, we expected that in our sample of people with chronic conditions, few individuals would have zero values for health care expenditures in the following year. Third, the most common nonlinear alternatives to OLS (such as the two-part model of Duan (1983)) have been found to be sensitive to the transformation problem. In these models the dependent variable is not expenditures but rather a nonlinear transformation of expenditures such as the natural logarithm or the square root. The factor used to convert the transformed expenditure estimates back to dollars may depend on the levels of the independent variables, a complicated problem that many researchers have ignored (Mullahy, 1998; Manning, 1998). Finally, we chose the linear model over common nonlinear models because we anticipate that this approach will be most widely used due to its relative ease of implementation.
In addition to estimating new risk-adjustment weights, in the fifth model we tested the predictive ability of the HCC weights which accompany the DCG software. We did this by normalizing the weights to have a mean value of 1.0 across our sample and then multiplying the weight for each condition by the average expenditures for all people in the plan having that condition. For example, suppose the normalized weight for rheumatoid arthritis is 1.5. This would indicate that people with arthritis are expected to have expenditures 50 percent higher than the average person in the population. We then compared the resulting predicted expenditures for each condition against the actual expenditures.
To measure how well the models predict for individuals with potentially disabling chronic conditions, we calculated the average predicted costs for the 30 percent samples of people with chronic conditions and compared the predictions to the actual costs. We also simulated how much money the plans would have lost or gained by providing care to people with various chronic and potentially disabling conditions under various systems. We did this by subtracting the mean predicted expenditures from the mean actual expenditures across the sample and then multiplied the difference by the number of people in the selected plans.
F. Findings
1. Examining the Need for Risk-Adjustment
In this section we describe the 1995 utilization and expenditures of people having selected chronic and potentially disabling conditions in 1994, by type of condition. This highlights the importance of risk-adjustment for people with chronic conditions. The analyses presented are based on the full sample of data from Employer A. The results from Employer B are very similar, and thus are not presented.
Utilization and Expenditure Comparisons
Total Payments. Figure 7-3 describes the average 1995 total payments per person, including out-of-pocket payments, for people with selected chronic conditions and for all employees with any type of utilization ("all service users"). The numbers are adjusted for differences in the age and sex distribution of the disease groups. For all conditions, the average total payments for people with the chronic conditions are statistically significant and substantially higher than the average for all employees. However, there is also a significant degree of variation across the chronic conditions. The most expensive of the ten prevalent conditions is heart failure, which is on average almost 15 times as expensive as the average for the population. The least expensive is asthma, which is 2.8 times as expensive as the average.
| FIGURE 7-3. Mean Total Payments in 1995 by Chronic Condition, Adjusted by Age and Sex, Employer A |
|---|
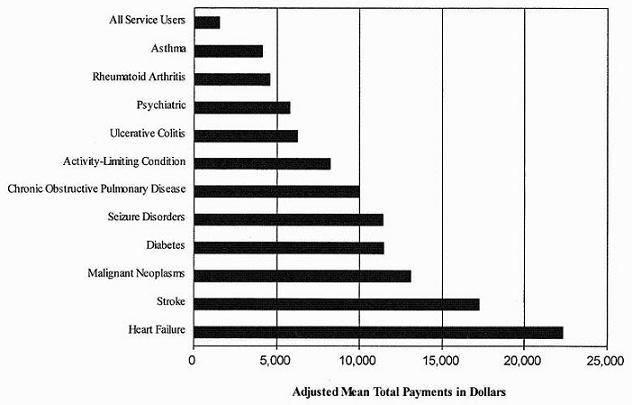 |
Inpatient differences. The average length of stay was significantly higher for the chronic conditions than for all employees who were hospitalized (Figure 7-4). For example, the average length of stay for people a cancer diagnosis (malignant neoplasms) was 11 days while the average length of all hospitalizations was about 7 days. Average inpatient payments among people with hospitalizations were also significantly greater for all chronic conditions except asthma and psychiatric conditions (Figure 7-5).
| FIGURE 7-4. Mean Length of Stay by Chronic Condition for Those Hospitalized in 1995, Adjusted for Age and Sex, Employer A |
|---|
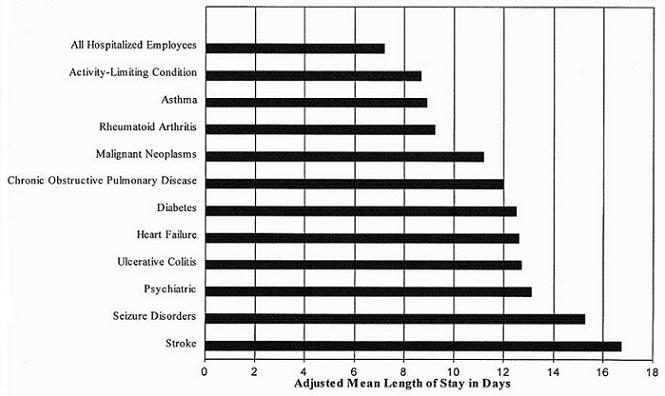 |
| FIGURE 7-5. Mean Inpatient Payments by Chronic Condition for Those Hospitalized in 1995, Adjusted for Age and Sex, Employer A |
|---|
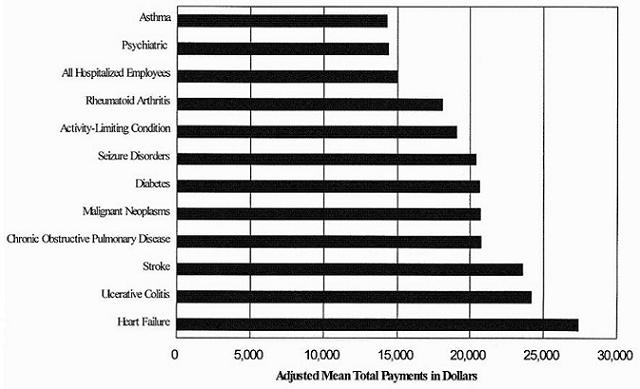 |
Outpatient differences. Outpatient expenditures were significantly higher for all ten of the chronic condition categories (Figure 7-6). For example, the average outpatient expenditures for people with rheumatoid arthritis who used outpatient care was$2,312 versus $946 for the average employee.
| FIGURE 7-6. Mean Outpatient Payments in 1995 for People with Any Outpatient Payments, Adjusted for Age and Sex, Employer A |
|---|
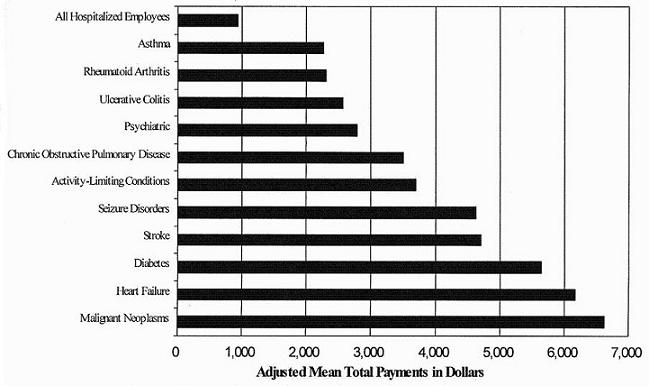 |
Coefficient of Variation. The preceding figures compared expenditures and hospitalizations across chronic conditions. Figure 7-7 addresses a broader issue: can we predict 1995 expenditures for people with these chronic illnesses better than for all employees as a group? If so, we may conclude that adverse selection is likely to be a problem, but also that accurate risk-adjustment systems can be successful at insulating health plans from the effects of adverse selection by chronically ill enrollees.
| FIGURE 7-7. Coefficient of Variation (x100) by Condition, 1994-1995, Employer A |
|---|
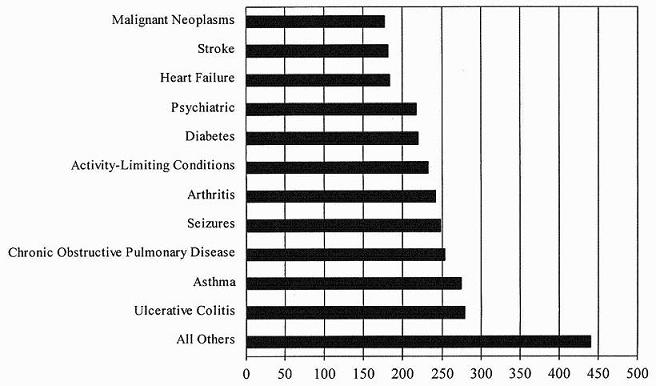 |
Figure 7-7 describes the coefficient of variation for total payments for people with potentially disabling chronic conditions as compared to the average employee. The coefficient is measured as the ratio of the standard error to the mean and is an indication of how much variation there is in the total payments. As shown, the coefficient of variation is much smaller for people with chronic conditions than for the entire population. The smaller coefficient of variation indicates that costs for people with chronic conditions are more predictable than for people without these conditions.
R-Squared
Another measure of the need for risk-adjustment is the variation of expenditures over time. Figure 7-8 presents the R2 statistic from regressing 1995 expenditures on 1994 expenditures for people having chronic conditions in 1994. For some conditions, the R2 is much higher than for the whole population. Specifically, the R2 for diabetes is nearly 14 percent and the R2 for psychiatric conditions is 12 percent, much above the R2 of 6 percent for all service users. However, other conditions, such as ulcerative colitis, chronic obstructive pulmonary disease, and heart failure, the predictability of expenditures from one year to the next isrelatively low using this measure.
| FIGURE 7-8. R2 for Regression of Total Payments in 1995 on Total Payments in 1994, by Condition, Employer A |
|---|
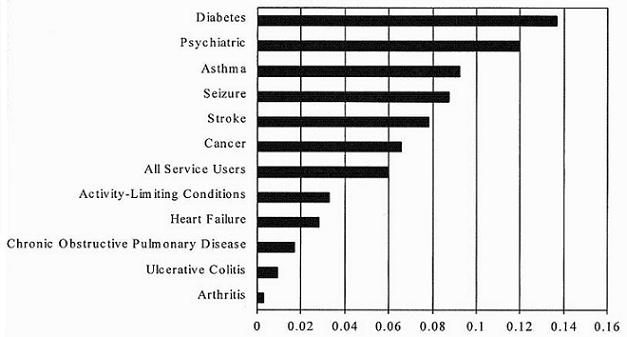 |
Summary
The results presented in this section indicate that people with the chronic conditions examined had higher and more predictable expenditures than the average employee. These findings have two important implications. The first is that there is greater risk that persons with these conditions will self-select into certain plans, as well as greater risk that health plans will try to discourage them from selecting certain plans. The second implication is that risk-adjustment may be possible because the fluctuations in costs are smaller within these condition categories and therefore it makes sense to group these people together for payment purposes.
2. Predictive Ability of Risk-Adjustment Methods
Table 7-3 summarizes the prediction errors from the 30 percent samples across the various models tested using data from Employer A and Employer B. The prediction error shows the percent difference in the predicted and actual expenditures in 1995. A perfect prediction would yield a value of 0 for the prediction error. A prediction error greater than 0 indicates that the model is overestimating expenditures, and a prediction error less than 0 indicates that the model is underestimating expenditures.
These results might be evaluated in a number of ways to determine which model is most likely to reduce incentives for adverse selection based on common chronic conditions. We argue that the most important criterion is that the model minimizes the incentives for large monetary gains that result from avoiding the enrollment or treatment of people with a given condition. Thus, the evaluation criteria we select is the model with the fewest prediction errors greater than or equal to 15 percent. The 15 percent figure was arbitrarily chosen because there is no accepted benchmark for the predictive accuracy of risk-adjustment models. Ideally we would like to know the level of prediction error that eliminates incentives to avoid high cost/need patients. The shaded values in Table 7-3 indicate that the prediction error was greater than 15 percent.
According to this criterion, the model that performed the worst across all of the chronic conditions and both employers was the baseline model. The Baseline+ACG model performed significantly better, although it performed worse than the other remaining models and had prediction errors in the 40-50 percent range for some conditions. The best performing model was the HCC model. Across both employers, the HCC model only had one prediction error that was greater than 15 percent (it over predicted the cost of treating people with a stroke by 21 percent for Employer A).
The HCC-SW model performed slightly worse than the HCC model. For example, for Employer B it underestimated the costs of people with diabetes, heart failure, and stroke and overestimated the costs of people with ulcerative colitis by more than 15 percent. The HCC-SW model, developed by Ash and colleagues (1989), was based on over one million claims, allowing it to capture relatively rare high cost conditions. On the other hand, it was estimated with data from 1992 and 1993 and on a population that may differ significantly from the one being examined here. For example, technological innovations may have increased the cost of treating some diseases, such as cardiac-related illnesses, and decreased the cost of treating others, such as psychological illnesses.
| TABLE 7-3. Mean Prediction Error1 by Type of Condition, Model, and Employer, 1995 (%)2 | ||||||||||||
|---|---|---|---|---|---|---|---|---|---|---|---|---|
| Employer | Model | Rheumatoid Arthritis | Asthma | Cancer | Chronic Pulmonary | Diabetes | Heart Failure | Activity- Limiting | Psychiatric | Seizures | Stroke | Ulcerative Colitiz |
| A | Baseline3 | -44 | -46 | -67 | -65 | -78 | -72 | -53 | -54 | -61 | -64 | -41 |
| A | +HCCs | -3 | 1 | 8 | -9 | 1 | 8 | -3 | 3 | 12 | 21 | 14 |
| A | +HCC-SW4 | -2 | 1 | 11 | -5 | 5 | 27 | 0 | 6 | 12 | 22 | 45 |
| A | +ACG | -13 | -14 | -40 | -41 | -56 | -44 | -21 | -17 | -34 | -22 | -1 |
| A | +ADG | 3 | 1 | -2 | -27 | -43 | -28 | -6 | 0 | -9 | 13 | 20 |
| B | Baseline3 | -50 | -50 | -68 | -65 | -80 | -83 | -57 | -64 | -72 | -76 | -57 |
| B | +HCCs | 5 | -3 | 5 | -4 | -4 | -11 | -3 | -1 | -2 | -10 | 7 |
| B | +HCC-SW4 | 13 | 3 | -9 | -9 | -21 | -18 | -8 | -1 | -14 | -18 | 29 |
| B | +ACG | -7 | -15 | -43 | -38 | -64 | -66 | -24 | -32 | -50 | -52 | -26 |
| B | +ADG | 5 | -9 | -9 | -22 | -52 | -55 | -9 | -5 | -28 | -23 | -6 |
| ||||||||||||
| TABLE 7-4. Plan's Financial Gain/Loss by Type of Condition, Model, and Employer, 19951 | ||||||||||||
|---|---|---|---|---|---|---|---|---|---|---|---|---|
| Employer | Model | Rheumatoid Arthritis | Asthma | Cancer | Chronic Pulmonary | Diabetes | Heart Failure | Activity- Limiting | Psychiatric | Seizures | Stroke | Ulcerative Colitiz |
| A | Baseline2 | -1.595 | -5.843 | -19.505 | -12.992 | -8.182 | -15.136 | -84.721 | -7.798 | -4.570 | -6.181 | -.933 |
| A | +HCCs | -.118 | .120 | 2.300 | -1.889 | .138 | 1.645 | -.367 | .405 | .931 | 1.985 | .319 |
| A | +HCC-SW3 | -.056 | .131 | 3.152 | -.996 | .494 | 5.712 | -.132 | .812 | .907 | 2.129 | 1.018 |
| A | +ACG | -.462 | -1.726 | -11.747 | -8.215 | -5.893 | -9.269 | -33.777 | -2.499 | -2.514 | -2.107 | -.030 |
| A | +ADG | .117 | .102 | -.628 | -5.393 | -4.467 | -5.917 | -9.097 | -.055 | -.694 | 1.262 | .460 |
| B | Baseline2 | -2.284 | -5.316 | -18.294 | -13.245 | -8.248 | -22.529 | -83.410 | -8.500 | -5.636 | -13.105 | -1.495 |
| B | +HCCs | .204 | -.343 | 1.414 | -.814 | -.364 | -3.022 | -4.518 | -.126 | -.153 | -1.786 | .178 |
| B | +HCC-SW3 | .752 | .295 | -2.419 | -1.868 | -2.203 | -4.917 | -11.591 | -.074 | -1.065 | -3.068 | .759 |
| B | +ACG | -.316 | -1.600 | -11.388 | -7.770 | -6.591 | -17.837 | -35.760 | -4.214 | -3.969 | -8.875 | -.687 |
| B | +ADG | .226 | -.923 | -2.318 | -4.591 | -5.355 | -15.018 | -13.081 | -.703 | -2.230 | -4.018 | -.163 |
| ||||||||||||
The same criterion that was applied to compare models can be applied across the conditions to see whether there are certain conditions for which all the models tend to perform relatively poorly. Using this criterion, the models performed worst for heart failure and stroke. Three out of the four models underestimated or overestimated costs for heart failure and stroke for each of the two employers by more than 15 percent. It is interesting to note that heart failure and stroke had the highest average costs across the conditions examined but also had lower coefficients of variation and a higher R2 than other conditions with lower prediction error. Based on the lower coefficient of variation and higher R2, one might have guessed that heart failure and stroke expenditures would be more predictable.
Although the models tended to have large prediction errors for heart failure and stroke, the prediction errors were not always in the same direction. The HCC-SW model underestimated the cost of heart failure by 18 percent in the case of Employer B, but overestimated the cost of heart failure by 27 percent in the case of Employer A. The only condition that was consistently underestimated by all the models was chronic obstructive pulmonary disorder, although in some cases the underestimation was only 4 percent.
As described above, the ability-limiting conditions are chronic conditions identified by LaPlante (1989) as being highly associated with limitations in ability to perform activities of daily living. As shown in Table 7-3, the HCC, HCC-SW, ADG models all performed fairly well for these conditions, with an average prediction error of less than 10 percent.
In the next set of results, we simulated the impact of enrolling patients with chronic conditions with and without risk-adjusted payments. This was achieved by subtracting the mean of the actual expenditures for treating the chronic conditions from the mean predicted expenditures and multiplying the difference by the number of people with those conditions. Thus, the size of the loss is directly related to the accuracy of the risk-adjustment model, the cost of the illness, and the number of people with the condition. Table 7-4 shows the result of this exercise for employees of Employers A and B by model and type of chronic condition. Under the demographics and wage-index risk-adjustment, the losses are in the millions. For example, Employer A's indemnity plan would have lost approximately $84.7 million from treating its approximately 9,505 continuously enrolled beneficiaries who had ability-limiting conditions as defined by LaPlante (1989). Under the HCC risk model, the loss would have been reduced to only a $2 million benefit from screening out people with cancer, which would hardly be worth the financial cost of identifying the beneficiaries.
G. Conclusions
In this study we tested the ability of the leading risk-adjustment systems to predict expenditures for people enrolled in private sector health plans with potentially disabling chronic conditions. The chronic conditions examined included asthma, cancer, psychiatric disorders, chronic obstructive pulmonary disorders, heart failure, diabetes, rheumatoid arthritis, seizure disorders, stroke, and ulcerative colitis. We also examined the ability of the models to predict costs for a group of chronic conditions defined by LaPlante (1989) as disabling on the basis of reported difficulties with activities of daily living.
Five different types of prospective risk-adjustment systems were examined: HCCs using weights (i.e., parameter estimates) that we created, HCCs using the weights provided with the DCG software, ACGs, ADGs, and a baseline model that included demographics, gender, and a wage index. Consistent with previous research, all four of the models that included health indicators were able to predict expenditures more closely than the baseline model. The best model was able to reduce the prediction error to less than 15 percent for all but one disabling chronic condition in one employer population. The largest loss incurred under the best model would have been for patients with heart failure, totaling $3 million for all patients with heart conditions treated by the employers' health plans.
The results from this study compare favorably with previous studies of the ability of risk-adjustment to predict expenditures for people with chronic conditions. Ash and colleagues (1997) found prediction errors of less than 10 percent for 13 of 26 conditions examined with DCGs. Wiener and colleagues (1996) found that ADGs lead to prediction errors of less than 10 percent for 9 out of the 15 conditions examined. In this paper, we found average prediction errors of less than 10 percent for 6-8 of 11 conditions examined for Employer A, depending on the system, and 6-9 of 11 for Employer B. There was no consistent pattern across the three studies in the types of conditions having the largest prediction errors, suggesting that prediction errors for particular conditions may vary depending on enrollee population characteristics and insurance benefits.
The absence of consistently large prediction errors for particular conditions argues against automatically carving out particular chronic conditions from capitated plans offered by private employers. A better strategy, given the difficulty of identifying consistently overestimated or underestimated expenditures for a particular condition, is for employers to monitor the performance of their risk-adjustment systems and the incentives they may create to avoid vulnerable populations.
This study finds that while risk-adjustment significantly reduces the incentives for adverse selection, it does not eliminate them. Ideally risk-adjustment would diminish the financial benefits of screening enough that it would not be cost-effective for firms to avoid people with high-cost conditions. For example, suppose that risk-adjustment would lead Medicaid to award a certain plan $2 million more than it would otherwise receive due to the plan's high proportion of cancer patients. Without risk-adjustment, the plan might attempt to avoid enrolling cancer patients through various means; with risk-adjustment, such actions would not be beneficial and presumably would not occur. Risk-adjustment systems are imperfect, however, and the cost of screening out potentially high-cost patients is unknown. It is difficult to determine, therefore, whether a given risk-adjustment system's performance is sufficient to discourage risk-avoidance behavior on the part of health plans.
If employers remain concerned about the potential for selection, then they may want to consider alternatives to full capitation. Under full capitation, health plans are paid 100 percent of the risk-adjusted capitation amount for each enrollee, regardless of what actual expenditures were. Two possible alternatives are sole source contracting and mixed payment. Under sole source contracting only one plan type is offered. This will eliminate adverse selection as long as the employee has no other option (such as coverage under a spouse's plan). The obvious disadvantage of sole source contracting is that employees cannot choose among competing plans in order to best fit their tastes, needs, and financial constraints. Under a mixed capitatedsystem, health plans are paid in part based on a risk-adjusted capitated rate and in part based on their actual expenditures. The advantage of this system is that it reduces the risk to plans and thus the incentives to avoid high-cost patients. The disadvantage is that basing reimbursement partly on actual expenditures lessens a plan's incentive to provide care efficiently.
In conclusion, this study indicates that the leading risk-adjustment models are a substantial improvement over simple age-sex adjustment that is now the norm. Additional simulation studies are needed using data from other employers. Moreover, the experiences of third party payers in using risk-adjustment systems under "real world" conditions will be an essential part of determining their future viability and value.
VIII. RISK-ADJUSTMENT OF CAPITATION PAYMENTS TO BEHAVIORAL HEALTH CARE CARVE-OUTS: HOW WELL DO EXISTING METHODOLOGIES ACCOUNT FOR PSYCHIATRIC DISABILITY?
A. Introduction
With the growing need to develop appropriate mechanisms for reimbursing managed care plans in an equitable and efficient manner, the use of risk-adjustment to set capitation payments has been extensively studied. Researchers have found that risk-adjustment methodologies based on claims diagnoses, such as the Ambulatory Care Groups (ACGs) and Diagnostic Cost Groups (DCGs), are better at prospectively predicting total expenditures than simple age-sex adjustments (Anderson, Steinberg, Powe et al., 1990; Dunn et al., 1995; Newhouse, 1994; Newhouse et al., 1989). However, less is known about whether risk-adjustment methodologies that work in a particular context may successfully be used in other applications. One such question is the applicability of commercial risk-adjustment systems, which were developed to set capitation rates for integrated health plans (i.e., capitated plans that cover both medical and psychiatric care), to efforts to adjust payments for behavioral health care "carve-out" vendors.
Under a risk-based carve-out arrangement, the vendor receives a capitated payment per covered life in exchange for financing and managing all services within a given category, in this case mental health and substance abuse (MH/SA) services. A separate health plan is responsible for the medical services used by the same enrollees. Behavioral health care "carve-outs" have become increasingly common. The proportion of privately insured U.S. citizens whose behavioral health benefits were managed in some form or another is estimated to have increased from 44 percent in 1992 to 75 percent in 1997 (Oss et al., 1997); this figure includes risk-based network programs, utilization review programs, employee assistance programs, nonrisk-based network programs, integrated programs and internal management of behavioral health care services within health maintenance organizations (Oss et al., 1997). Health maintenance organizations (HMOs) are entities that provide and manage the coverage of health services provided to plan members in return for a fixed premium (Rognehaugh, 1996). Risk-based network programs, which are capitated plans responsible for behavioral health care only, increased from 16 percent of the population in 1993 to 22 percent in 1997 (Oss et al., 1997). Thus one potentially important use of risk-adjustment is to determine the appropriate capitation amount to pay behavioral health care carve-out vendors.
Risk-adjustment can be useful both when a single carve-out vendor serves the entire patient population and when multiple vendors compete to enroll patients. When purchasers (employers or government programs) contract with a single carve-out vendor, risk-adjustment is useful for modifying payments as the behavioral health care needs of the population change over time. For example, Medicaid, which is the primary U.S. insurance program for the indigent and is jointly financed through Federal and state funds, is a major purchaser of managed care services, including those provided by behavioral health care carve-out vendors. The typical duration of a Medicaid contract with a carve-out vendor is three years. The behavioral health care needs of the population could change substantially over such a long period, so the purchaser needs a methodology for purchaserscontract with multiple, competing carve-out vendors, risk-adjustment is critical, for adjusting payments over time so that the carve-out vendor is neither under nor overpaid. The same reasons exist with integrated health plans: unless capitation payments are adequately adjusted for the health care needs of individuals, plans have an incentive to try to attract healthy, low-cost patients ("cream-skimming") and avoid enrolling sick, high-cost patients ("dumping").
Despite the need to develop viable risk-adjustment methodologies for behavioral health care, most existing systems were designed only to predict total medical expenditures. Earlier research suggests that these systems tend not to perform particularly well in predicting expenditures on behavioral health care (Ettner et al., 1998; Ettner and Notman, 1997). This study focuses on the use of risk adjustment to set capitation payments for behavioral health care carve-out vendors serving populations that include people with psychiatric disabilities. We use data on privately insured adult employees and dependents to examine whether existing risk-adjustment models sufficiently adjust capitation payments to behavioral health care carve-outs for psychiatric disability.
In particular, the study addresses a number of related questions.
-
How well do the best-known commercial risk adjustment systems, the ACG models and the DCG models, account for psychiatric disability in prospectively predicting behavioral health care expenditures?
-
Can the performance of these methodologies be improved by taking psychiatric disability explicitly into account?
-
What is the potential for competing behavioral health care carve-outs to experience profits or losses under each risk-adjustment system, in the presence of patient self-selection into health plans?
-
In comparison with pure capitation, do systems that mix capitation and fee-for-service methods reduce the potential for behavioral health care carve-out vendors to be "winners" or "losers," depending on whether they enroll mentally healthy or sick patients?
1. Methods and Data
The analyses were based on 1994-1995 medical and behavioral health care claims from Employer B, a large employer in the northern United States. Claims for pharmaceutical services were not available. Employees chose between several types of health plans, including 11 HMOs, an indemnity plan, and a preferred provider organization (PPO).
All of the HMOs were similar in that enrollees were required to choose primary care physicians to manage their care and to choose providers from closed panels. Furthermore, all of the HMOs fully covered inpatient services after pre-certification. However, the HMOs differed slightly in their coverage of outpatient MH/SA benefits. Most of the HMOs charged $10 per visit up to a maximum of either 20 visits or $500 per year. Several HMOs increased cost-sharing requirements depending on the number of visits, (e.g. charged $10 for visits 1-8 and $35 for visits 9-20). Among the most generous HMOs was one that covered up to 30 visits per year with the first 10 visits free, and another that fully covered the first $500 per year and then imposed 50 percent cost-sharing for costs up to $800 or 20 visits per year, whichever came first. Nonetheless, none of the variations in mental health benefits among HMOs appeared to be substantial. Similarly, differences in substance abuse coverage were modest, with the exception of one HMO that offered unlimited visits at its health centers at a constant $10 per visit.
Employees who did not choose to enroll in an HMO received their MH/SA services through a single behavioral health care carve-out vendor. Carve-out enrollees were allowed a choice between in-network and out-of-network providers, with lower cost-sharing requirements for care received from in-network providers. Carve-out enrollees also had access to care managers and an Employee Assistance Program offering assistance with problems of daily living. Carve-out enrollees were not required to meet any deductibles and also had out-of-pocket maximum payments ($1,000 for in-network and $3,000 for out-of-network). The carve-out vendor completely reimbursed inpatient services for MH/SA problems and intermediate care provided by in-network hospitals (including general, psychiatric and substance abuse). Hospitalizations in out-of-network facilities were reimbursed at 80 percent, with deductibles and some limits. Copayments for outpatient visits to in-network providers were $0 for visits 1-4, $20 per visit for visits 5-25, and $40 per visit for visits 26 or higher; outpatient visits to out-of-network providers were reimbursed at 50 percent for up to 15 visits per year. To be reimbursed, services had to be authorized as medically necessary.
2. Definition of the Sample
The population on which the analyses were based included all non-elderly adult employees, early retirees (less than 2 percent of the population) and dependents who obtained insurance coverage through employees. Sixty-one percent of Americans receive their coverage through an employment-based plan (Custer, 1999), so our sample is representative of a large segment of the population. We excluded beneficiaries who were not continuously enrolled in one of the health plans for the two-year period or who were enrolled in one of four HMOs for which data could not be obtained. Analyses were performed separately for beneficiaries who obtained MH/SA services through an HMO vs. those in the behavioral health care carve-out (indemnity and PPO enrollees). Final sample sizes were 56,174 and 52,990, respectively.
3. Variables
The dependent variable in the analyses is 1995 MH/SA expenditures. MH/SA claims were identified as those having major diagnostic category (MDC) 19 or 20. MDC 19 corresponds to "mental diseases and disorders"; MDC 20 corresponds to "alcohol/drug use and alcohol/drug induced mental disorders." Charges from all claims meeting this criterion were aggregated to construct the expenditure measure.
Explanatory variables are based on 1994 data in order to test the ability of risk-adjusters to prospectively predict 1995 MH/SA expenditures. Each risk-adjustment model controlled for basic demographic characteristics (sex, age, and age squared) and an adjustment for the overall level of medical prices in the geographic location, proxiedby the Health Care Financing Administration (HCFA) wage index. All metropolitan statistical areas (MSAs), defined as core areas containing a large population nucleus in conjunction with adjacent communities having a high degree of economic and social integration with that core, were assigned a hospital wage index. Areas outside MSAs were assigned a state index. Labor expenditures make up the majority of hospital expenditures, which in turn make up a large portion of total health care expenditures, so the HCFA hospital wage index is often used to control for geographic variation in health care prices. Finally, sensitivity analyses that controlled separately for benefit design in the analyses based on HMO enrollees yielded estimates that were almost identical to the baseline estimates; these results are available from the authors upon request.
The baseline model controls for the demographic factors only. Seven alternative specifications adjust for the same demographics as well as the following sets of diagnostic measures, examined in turn:
- an indicator for whether the enrollee has any psychiatric disability;
- indicators for the type of psychiatric disability;
- ACGs;
- Ambulatory Diagnostic Groups (ADGs);
- Hierarchical Coexisting Conditions (HCCs);
- ADGs plus indicators for the type of psychiatric disability; and
- HCCs plus indicators for the type of psychiatric disability.
To develop criteria to identify individuals likely to have a psychiatric disability, we studied the National Institute of Mental Health (NIMH) and Substance Abuse and Mental Health Services Administration (SAMHSA) definitions of severe mental illness, examined Centers for Disease Control (CDC) reports of disability days by ICD-9-CM diagnosis (Work-Loss Data Institute, 1996), and reviewed the literature on labor market impacts of specific mental disorders (Bartel and Taubman, 1986; Benham and Benham, 1982; Ettner et al., 1997; Miller and Kelman, 1992). NIMH and SAMHSA are Federal agencies that fund U.S. research and demonstration projects in mental health. Finally, we examined National ComorbiditySurvey data to identify combinations of psychiatric conditions leading to reduced activity levels (Kessler and Frank, 1997). In order to identify psychiatric disability using administrative data, we created a two part definition of severe mental illness, including a per se diagnosis component and a qualified diagnosis component. Virtually all of the sources of information we studied suggested that the following conditions are associated with very high rates of impairment in daily functioning and loss of productivity: schizophrenic or schizoaffective disorders, manic depression/bipolar illness, autism, and recurrent major depression. Thus people who had any inpatient or outpatient claims with these diagnoses were considered to be psychiatrically disabled per se.
Diagnoses of major depression (without chronicity specified) and other psychiatric conditions could not automatically be used to assess disability without further information on severity. We therefore focused on the presence of comorbid conditions to determine whether the patient's psychiatric diagnoses were likely to lead to impairment. Comorbidity combinations likely to have strong adverse effects on productivity (and which were therefore used to identify additional cases of psychiatric disability) included (1) major depression in conjunction with anxiety disorder, and (2) drug or alcohol abuse in conjunction with any other psychiatric disorder. We also explored the use of historical patterns of illness and utilization patterns as markers of severity; however, historical measures could not be constructed, due to data limitations. The use of treatment patterns suggesting severe illness resulted in the identification of very few additional cases of psychiatric disability.11 Furthermore, risk-adjustment based on the type of services received offers perverse incentives to health plans. Thus we did not use treatment patterns as markers for severity in the final analyses.
The model controlling separately for the type of psychiatric disability aggregates all diagnoses and diagnostic combinations defining disability into the following three categories:
- psychosis, including schizophrenic/schizoaffective disorders and manic depression/bipolar illness;
- recurrent major depression or depression in conjunction with anxiety disorder; and
- substance abuse in conjunction with any other psychiatric condition.
4. Analyses and Descriptive Statistics
We first calculated descriptive statistics. MH/SA expenditures were then estimated as a function of each set of risk-adjusters described above. Split-sample estimation was used to avoid overstating the predictive ability of the models. Regression coefficients were estimated with 70 percent of the sample and the measures of predictive ability were calculated with the remaining 30 percent of the sample. Split-sample methods are particularly advisable when overfitting is a potential problem, that is, when the sample sizes within particular cells defined by patient characteristics are relatively small. In the extreme case, a regression estimate might be based on a single observation, leading to a zero residual error for that individual and artificially inflating the measured predictive ability of the regression model when the same sample is used for both estimation and prediction (Duan et al., 1983; Gujarati, 1988; Manning et al., 1987).
5. Two Part Models for Estimating Expenditures
Expenditure measures are generally characterized by a disproportionate number of zero values in conjunction with a highly skewed distribution of expenditures among people using services. This arises because upwards of 20 percent of those in a typical insurance plan use no services during any given year, while many fewer will have extremely high expenditures. We therefore estimated MH/SA expenditures using the "two part model" (Duan et al., 1983). The expected level of total expenditures for an individual is modeled as the product of two parts: the probability of any expenditures, and the level of expenditures given that some expenditure occurred.
The probability of having any expenditure was estimated using logistic regression. The level of expenditures was estimated with linear regression, using the subsample of beneficiaries who had any expenditures. To reduce skewness in this subsample, we used the square root of expenditures in place of actual expenditures. In order to interpret the estimated coefficients in terms of dollars, we then retransformed them using a "smearing" procedure (Duan, 1983).12 We judged the goodness of fit for each risk-adjustment model using a synthetic R2 (Efron, 1978). Like the usual R2, it measures the proportion of variation in the dependent variable (expenditures) that is explained by variation in the independent variables (demographic measures and risk-adjustment variables like HCCs).
6. Prediction Errors for Assessing Payment Methods
The mean and standard deviation of the absolute values of the individual prediction errors (actual minus predicted MH/SA expenditures) are also presented. Due to the nonlinearity of the two part model, these measures (synthetic R2 and mean absolute prediction error) do not necessarily yield the same rank ordering of the models. Where these measures differed in their assessment of the relative performance of the risk-adjustment models, we tended to favor the mean absolute prediction errors as the standard rather than the proportion of variance explained. Because the purpose of risk-adjustment is to tailor payments to expected costs, minimizing prediction errors seems to be the most relevant performance criterion when choosing a risk-adjustment system.
The prediction errors are calculated based on the entire sample, including adults both with and without psychiatric disability. To examine the incentives to "dump" psychiatric patients that remain after risk-adjustment, we calculated predictive ratios (sum of predicted MH/SA expenditures divided by the sum of actual MH/SA expenditures) for two groups: adults with psychiatric disability and those with no psychiatric disability.
7. Profit and Loss by Payment Method
Finally, we compared the ability of full capitation, soft capitation and mixed payment methodologies (defined below) to account for natural selection into health plans. We used actual enrollment in the seven HMOs in the study to provide an example of the range of profits and losses that competing behavioral health care carve-outs experiencing similar selection might incur. For each of the seven health plans, we calculated the average per enrollee profit or loss, based on the plan's patient population. The range in profits/losses across all of the health plans under each of the three payment schemes is given for each risk-adjustment model.
Definitions of Payment Systems
In the full capitation model, health plans are paid 100 percent of the risk-adjusted capitation amount for each enrollee, regardless of what actual expenditures were. In the mixed payment system used for the simulations, the health plan would be paid 50 percent of the risk-adjusted capitation payment and 50 percent of actual costs. The soft capitation payments were calculated two ways: using plan averages and using individual-level data. Soft capitation contracts are generally based on plan averages. The risk-adjusted average payment for all health plan enrollees is specified as the target amount and payments are based on how far away the actual average spending per enrollee is from this target. For comparison purposes, however, we also examined soft capitation applied at the individual level. In that system the payment for each individual enrollee was based on that enrollee's expenditures, relative to the enrollee's target amount and the risk corridor around the target amount.
Two soft capitation models are studied. In the first, the risk corridor is defined to be between 90 and 110 percent of the target amount. Within this corridor, the purchaser and the plans share the risk equally. In other words, plans retain only $0.50 for every dollar saved by reducing expenditures below the target amount; conversely, plans incur only $0.50 of the cost of every dollar spent above the target amount. Outside of the risk corridor (i.e., below 90 percent or above 110 percent of the target amount), the purchaser (not the plan) bears all of the risk: it retains all of the profits or incurs all of the losses. The second soft capitation model is similar, except that the risk corridor is between 75 and 125 percent of the target amount, while the sharing of profits or losses within this corridor is 60 percent by the purchaser and 40 percent by the plan.
Budget Neutrality
Payment based on full capitation is typically adjusted so that the purchaser achieves budget neutrality, meaning that total payments to the health plan by the purchaser equal the total expenditures for services by the health plan. Thus the full capitation amounts were adjusted to be budget neutral in this study. The capitated portion of the mixed payment was also adjusted to be budget neutral, although the overall payment was not necessarily budget neutral because of the actual cost portion. It was assumed that payers would be less likely to impose budget neutrality with a mixed payment system or when using soft capitation, because it would diminish the risk sharing function of these payment methodologies. Thus neither the mixed payment nor the soft capitation amounts were constrained to be budget neutral.
B. Results
1. Descriptive Statistics
Table 8-1 presents descriptive statistics for the 1995 MH/SA expenditure outcome and selected regressors (for brevity, not all risk-adjusters are shown in the table), based on the 70 percent sample used for estimation. As one might predict, given the past literature showing selection of healthier patients into HMOs, the HMO population has lower MH/SA expenditures and lower rates of almost every type of health condition than is seen in the fee-for-service population enrolled in the behavioral health care carve-out. (The exceptions were that the HMO enrollees had higher rates of preventive/administrative care, pregnancy, and dental care.) Eleven percent of the HMO enrollees had any MH/SA expenditures in 1995, compared with 13 percent of the carve-out enrollees, and the average levels of 1995 MH/SA expenditures among users were $669 vs. $1,072 respectively. Average 1995 MH/SA expenditures among the entire sample (users and non-users) were $75 for HMO enrollees and $141 for carve-out enrollees. A relatively low proportion of the sample met the claims-based criteria for psychiatric disability we developed, probably because almost two-thirds of the population was employed (rather than dependents) and hence by definition unlikely to be severely disabled. Respectively, 2.5 percent of the HMO enrollees and 3.1 percent of the carve-out enrollees had conditions meeting the study criteria for severe psychiatric disability.
| TABLE 8-1. Descriptive Statistics by Plan Type, for the 70% Sample, 1995 | ||
|---|---|---|
| Variable | HMO (N=39,013) | Carve-Out (N=36,959) |
| Has any MH/SA expenditures | 11% | 13% |
| MH/SA expenditures (everybody) | $75 (SD=$741) | $141 (SD=1,060) |
| MH/SA expenditures (users only) | $669 (SD=$2,123) | $1,072 (SD=$2,750) |
| HCFA wage index | 1.17 (SD=0.03) | 1.15 (SD=0.06) |
| Age | 40 (SD=11) | 40 (SD=19) |
| Female | 47% | 45% |
| Psychiatric disability | 2.5% | 3.1% |
| Ambulatory Diagnostic Groups: | ||
| Time Limited: Minor | 16.9% | 22.3% |
| Time Limited: Minor-Primary Infections | 22.6% | 25.2% |
| Time-Limited: Major | 4.5% | 6.3% |
| Time Limited: Major-Primary Infections | 4.9% | 6.1% |
| Allergies | 4.8% | 5.0% |
| Asthma | 3.1% | 3.9% |
| Likely to Recur: Discrete | 14.2% | 17.8% |
| Likely to Recur: Discrete-Infections | 16.5% | 18.2% |
| Likely to Recur: Progressive | 1.4% | 2.4% |
| Chronic Medical: Stable | 28.5% | 39.4% |
| Chronic Medical: Unstable | 10.7% | 18.3% |
| Chronic Specialty: Stable-Orthopedic | 2.7% | 3.8% |
| Chronic Specialty: Stable-Ear, Nose, Throat | 0.8% | 1.2% |
| Chronic Specialty: Stable-Eye | 1.5% | 4.2% |
| Chronic Specialty: Unstable-Orthopedic | 1.5% | 2.4% |
| Chronic Specialty: Unstable-Ear, Nose, Throat | 0.1% | 0.2% |
| Chronic Specialty: Unstable-Eye | 1.5% | 5.1% |
| Dermatologic | 8.4% | 13.2% |
| Injuries/Adverse Effects: Minor | 11.2% | 11.9% |
| Injuries/Adverse Effects: Major | 8.3% | 9.0% |
| Psychosocial: Time Limited, Minor | 4.5% | 4.5% |
| Psychosocial: Recurrent/Persistent, Stable | 7.4% | 8.5% |
| Psychosocial: Recurrent/Persistent, Unstable | 1.8% | 2.6% |
| Signs/Symptoms: Minor | 18.8% | 23.5% |
| Signs/Symptoms: Uncertain | 29.4% | 37.8% |
| Signs/Symptoms: Major | 17.9% | 23.9% |
| Discretionary | 10.5% | 13.5% |
| See and Reassure | 3.6% | 5.5% |
| Prevention/Administrative | 35.4% | 11.5% |
| Malignancy | 2.5% | 4.9% |
| Pregnancy | 3.5% | 2.3% |
| Dental | 0.5% | 0.1% |
2. Comparison of Predictive Ability of Risk-Adjustment Models
Table 8-2 and Table 8-3 respectively present the synthetic R2 and mean absolute prediction errors for each risk-adjustment model, based on the entire sample. The simple demographic model performs the worst among both the HMO and carve-out populations. ACGs alone and the model controlling only for whether the enrollee has any psychiatric disability also perform relatively poorly. The model controlling for HCCs in conjunction with the type of psychiatric disability performs the best, although the performance of ADGs in conjunction with psychiatric disability is virtually the same. HCCs and ADGs alone perform substantially worse. Thus in both cases, adding separate controls for the type of psychiatric disability improves performance.
To a certain extent, these comparisons depend on the performance measures used. The "value-added" of controlling separately for the type of psychiatric disability appears to be greater when using R2 values as the criterion for measuring performance rather than prediction errors. The same holds true in comparing the predictive abilities of the ADGs and HCCs; the difference between these methodologies appears large when comparing the proportion of variance explained but negligible when comparing mean absolute prediction errors.
| TABLE 8-2. Comparison of R2 Values across Risk-Adjustment Models, for the 30% Sample, 1995 | ||
|---|---|---|
| Risk Adjustment Model | HMO (N=39,013) | Carve-Out (N=36,959) |
| Demographics | 0.00007 | 0.002 |
| Demographics, any psychiatric disability | 0.040 | 0.51 |
| Demographics, type of psychiatric disability | 0.153 | 0.082 |
| Demographics, Ambulatory Care Groups (ACGs) | 0.010 | 0.013 |
| Demographics, Ambulatory Diagnostic Groups (ADGs) | 0.069 | 0.080 |
| Demographics, Hierarchical Coexisting Conditions (HCCs) | 0.097 | 0.119 |
| Demographics, ADGs, type of psychiatric disability | 0.167 | 0.108 |
| Demographics, HCCs, type of psychiatric disability | 0.193 | 0.141 |
| TABLE 8-3. Comparison of Absolute Prediction Errors across Risk-Adjustment Models, for the 30% Sample, 1995 | ||
|---|---|---|
| Risk Adjustment Model | HMO (N=17,134) | Carve-Out (N=16,031) |
| Demographics | $133 ($629) | $256 ($1,253) |
| Demographics, any psychiatric disability | $125 ($618) | $232 ($1,225) |
| Demographics, type of psychiatric disability | $116 ($581) | $223 ($1,205) |
| Demographics, Ambulatory Care Groups (ACGs) | $129 ($627) | $243 ($1,248) |
| Demographics, Ambulatory Diagnostic Groups (ADGs) | $116 ($610) | $199 ($1,211) |
| Demographics, Hierarchical Coexisting Conditions (HCCs) | $115 ($610) | $199 ($1,184) |
| Demographics, ADGs, type of psychiatric disability | $108 ($577) | $192 ($1,193) |
| Demographics, HCCs, type of psychiatric disability | $108 ($568) | $190 ($1,169) |
| NOTE: Means and (in parentheses) standard deviations shown. | ||
3. Predictive Ratios for People with and without Psychiatric Disabilities
For each risk-adjustment model, Table 8-4 gives the ratios of payments to actual expenditures for the subsamples of enrollees with and without psychiatric disability. These figures illustrate the point that incentives for competing carve-outs to avoid the psychiatrically disabled remain even after risk-adjustment, although they are attenuated. The predictive ratios below one for the enrollees with psychiatric disability imply that health plans will be paid less than the actual expenditures of this population as a group. The predictive ratios above one for the enrollees without psychiatric disability imply that on average, health plans will be overpaid for the non-psychiatrically disabled.
The relative performance of the different risk-adjustment systems in tailoring MH/SA payments to the expected costs of the disabled vs. non-disabled populations is similar to the rankings derived from Table 8-2 and Table 8-3. (Although the model controlling for the presence of psychiatric disability now appears to do better than the one controlling for the type of psychiatric disability, this phenomenon is probably an artifact arising from the use of the psychiatric disability indicator to stratify the sample.) The simple demographic model performs very poorly, while the model controlling for both HCCs and the type of psychiatric disability performs quite well. However, even using the latter methodology, carve-outs would be paid only 83-85 percent of what it would actually cost them to care for people with psychiatric disability.
| TABLE 8-4. Comparison of Predictive Ratios for People with and without Psychiatric Disability, for the 30% Sample, 1995 | ||||
|---|---|---|---|---|
| HMO | Carve-Out | |||
| Psychiatric Disability (N=325) | No Disability (16,809) | Psychiatric Disability (N=466) | No Disability (N=15,65) | |
| Demographics | 0.07 | 1.33 | 0.09 | 1.51 |
| Demographics, any psychiatric disability | 0.80 | 1.07 | 0.76 | 1.13 |
| Demographics, type of psychiatric disability | 0.73 | 1.10 | 0.75 | 1.14 |
| Demographics, Ambulatory Care Groups (ACGs) | 0.16 | 1.30 | 0.17 | 1.47 |
| Demographics, Ambulatory Diagnostic Groups (ADGs) | 0.74 | 1.09 | 0.72 | 1.16 |
| Demographics, Hierarchical Coexisting Conditions (HCCs) | 0.78 | 1.08 | 0.75 | 1.14 |
| Demographics, ADGs, type of psychiatric disability | 0.85 | 1.05 | 0.82 | 1.10 |
| Demographics, HCCs, type of psychiatric disability | 0.85 | 1.05 | 0.83 | 1.09 |
| NOTES: Predictive ratio = total payments/total actual expenditure. Calculations are based on 30% sample. | ||||
4. Comparison of Payment Methodologies
Table 8-5 summarizes the profits and losses on MH/SA services that would be incurred by the seven HMOs in the study under each payment methodology. The table shows the per-enrollee profits of the health plans with the greatest and least financial gains under each system. These figures provide an example of what the financial implications of each type of contractual arrangement might be for competing behavioral health care carve-outs experiencing similar natural selection.
Because the full capitation system is constrained to be budget neutral, the emergence of plans that are financial "winners" is necessarily accompanied by plans that are "losers." Full capitation leads to the largest variation in financial performance among the plans. Similarly, mixed payment results in substantial profits and losses, although by design, these are only half as large as under full capitation. Soft capitation contracts implemented using plan averages also result in some plans earning profits and other plans suffering losses, although the magnitudes of the financial gains and losses are not as large as with systems relying entirely or partially on pure capitation.
| TABLE 8-5. Range of HMO Per Enrollee Profits under Full Capitation, Soft Capitation and Mixed Payment, for the 30% Sample, 1995 | ||||||
|---|---|---|---|---|---|---|
| Risk Adjustment Model | Full Capitation | Mixed Payment | 50-50 Soft Capitation (Plan Average) | 60-40 Soft Capitation (Plan Average) | 50-50 Soft Capitation (Individual) | 60-40 Soft Capitation (Individual) |
| Demographics | max: +$26.86 min: -$27.47 | max: +$13.43 min: -$13.74 | max: +$4.07 min: -$3.74 | max: +$7.60 min: -$7.49 | max: +$3.31 min: +$2.88 | max: +$6.63 min: +$5.76 |
| Demographics, any psychiatric disability | max: +$30.99 min: -$25.41 | max: +$15.50 min: -$12.71 | max: +$4.29 min: -$3.89 | max: +$8.59 min: -$7.69 | max: +$3.39 min: +$2.65 | max: +$6.84 min: +$5.30 |
| Demographics, type of psychiatric disability | max: +$35.18 min: -$25.51 | max: +$17.59 min: -$12.76 | max: +$4.32 min: -$3.84 | max: +$8.64 min: -$6.14 | max: +$3.01 min: +$2.20 | max: +$6.00 min: +$4.46 |
| Demographics, ACGs | max: +$26.38 min: -$26.96 | max: +$13.19 min: -$13.48 | max: +$4.04 min: -$3.77 | max: +$7.40 min: -$7.54 | max: +$3.27 min: +$2.78 | max: +$6.54 min: +$5.55 |
| Demographics, ADGs | max: +$34.84 min: -$16.70 | max: +$17.42 min: -$8.35 | max: +$4.11 min: -$4.28 | max: +$8.23 min: -$6.68 | max: +$3.14 min: +$1.72 | max: +$6.25 min: +$3.44 |
| Demographics, HCCs | max: +$30.79 min: -$19.17 | max: +$15.40 min: -$9.59 | max: +$4.25 min: -$4.16 | max: +$8.50 min: -$7.67 | max: +$3.00 min: +$1.83 | max: +$6.00 min: +$3.64 |
| Demographics, ADGs, type of psychiatric disability | max: +$35.89 min: -$17.78 | max: +$17.94 min: -$8.89 | max: +$4.35 min: -$4.23 | max: +$8.71 min: -$7.11 | max: +$3.52 min: +$1.65 | max: +$7.00 min: +$3.30 |
| Demographics, HCCs, type of psychiatric disability | max: +$37.82 min: -$19.17 | max: +$18.91 min: -$9.59 | max: +$4.45 min: -$4.16 | max: +$8.90 min: -$7.67 | max: +$3.26 min: +$1.74 | max: +$6.57 min: +$3.62 |
| NOTE: Enrollees of seven HMOs are included in the population. 50-50 capitation has limits set at +10 percent of the target amount, while 60-40 capitation has limits set at +25 percent of the target amount. | ||||||
The phenomenon that all of the plans would make a small per enrollee profit under individual soft capitation supports previous findings and makes sense in light of the risk-sharing arrangements. Individuals with psychiatric disability tend to have target amounts far below actual expenditures, so the purchaser will end up financing most of the care for this small but costly population. Individuals without psychiatric disability tend to have target amounts above actual expenditures; however, because this population is much larger than the population with psychiatric disability and the capitation payments are budget neutral, target amounts are not that much above actual expenditures. Thus a relatively high proportion of the cost savings of the non-disabled population falls within the risk corridors and is retained in part by the health plans; a relatively low proportion of the excess costs of the disabled population falls within the risk corridors and is shared by the plan. In other words, it is likely that individuals exceed the upper bound more frequently than they fall below the lower bound. Thus, the purchasers absorb much of the risk of insuring potentially high-cost enrollees.
As a numerical example, suppose that a plan enrolls 20 patients with psychiatric disability, each of whom costs $140, and 80 patients without disability, each of whom costs $90. The risk-adjustment is imperfect, so the target amounts are only $120 for each patient with disability, but $95 for each patient without disability. With risk corridors defined as plus or minus 10 percent of the target amount, the plan retains half of all savings on the 80 patients without disability, since their actual expenditures are $90, which is still above the lower risk corridor of $85.50. However, the plan only incurs part of the losses on the 20 patients with disability, since their actual expenditures are $140, above their upper risk corridor of $132. Thus the profits (80 x $2.50 = $200) are greater than the losses (20 x $6 = $120).
Although it cannot be seen from the results presented in the table, the health plan experiencing the greatest profits or losses was not always the same. Certain plans clearly appeared to attract disproportionate shares of enrollees with heavy MH/SA needs, while others appeared to enroll large numbers of healthy patients. Yet even the relative financial performance of each plan depended to some extent on both the reimbursement and risk-adjustment methodologies chosen. These choices are therefore a powerful policy instrument, with serious implications for the viability of competing carve-out vendors.
C. Discussion
"Carving out" the financial risk and management of behavioral health care has become popular among both employers and state Medicaid programs. One of the important decisions facing purchasers of behavioral health care "carve-out" services is whether to contract with more than one vendor. For example, a number of states, including Arizona, Texas and New York, are considering contracting with several "carve-out" vendors to provide behavioral health services to Medicaid beneficiaries. The concern with having multiple capitated vendors competing with each other is that in the absence of a high-performing risk-adjustment methodology, the competition is likely to be on the basis of which vendor can enroll the healthiest patients, rather than which vendor can provide high quality in a cost-efficient manner. Unlike cost-based reimbursement, capitation payment allows vendors to profit by reducing the provision of services to clients. This study examined the degree to which risk-adjustment methodologies attenuate incentives for behavioral health care carve-out vendors to dump costly patients, with our particular concern being people with psychiatric disability.
Using mean absolute prediction errors as the basis of comparison, we found that two of the commercial risk-adjustment systems, the ADGs and HCCs, worked about equally well for risk-adjusting capitation payments to behavioral health care carve-out vendors. Interestingly, the more commonly used variant of the ACG methodology, the Ambulatory Care Groups, performed much more poorly than the ADGs and also performed worse than any of the other risk-adjustment models, with the exception of simple demographic adjustment. The difference in performance between ACGs and ADGs probably arises because the ADGs control for the exact types of diagnoses for people with multiple diagnoses, while the ACGs are more aggregated.
Both the ADG and HCC methodologies were clearly superior to simple demographic adjustments. However, adding separate controls for psychiatric disabilities further improved their performance, and even the best risk-adjustment models did not fully account for the higher behavioral health care expenditures of patients with psychiatric disability. Payments for patients with psychiatric disability would have covered only about 85 percent of actual expenditures, while MH/SA payments for patients without psychiatric disability would have exceeded actual expenditures by about 5 percent. The underprediction of expenditures for patients with psychiatric disability is similar to previous findings for patients with chronic medical conditions (Dunn et al., 1995) and probably arises because to some extent, risk-adjustment systems aggregate people with more and less severe disorders and pay the average cost of the entire group. Thus a risk-adjustment system might pay the same additional amount for a person with anxiety disorder as for a person with schizophrenia, even though only the latter might be truly disabled and expensive to care for. Although one could "over-adjust" payments for psychiatric disability in order to reduce the underpredictionproblem, taken to an extreme, this strategy reverts back to simple cost-based reimbursement.
One might expect the proportion of variance explained to have been higher within the carve-out population than the HMO population, due to the homogeneity of benefits and utilization review within carve-outs and their potentially greater ability to reduce the expenditures of high-cost patients (for example, through the use of specialty provider networks offering discounted rates and by using care management techniques tailored for behavioral health). However, our data showed no clear cut pattern to suggest that risk-adjustment worked better for patients with one type of coverage vs. another, perhaps because the HMO enrollees were more homogeneous in terms of their health status. The carve-out population appeared to be sicker on average and was likely to include more high-cost outliers than the HMO enrollees, which would make it more difficult to predict expenditures among this population. The results based on the HMO population are probably more relevant from a policy perspective, since most behavioral health care carve-outs involve management of care, regardless of whether behavioral health is carved out internally within the HMO or involves a carve-out vendor.
Comparisons with earlier research should be interpreted with caution, since the relative ranking of risk-adjustment methodologies found in this study may not necessarily generalize to populations with different characteristics and insurance benefits. Bearing this caveat in mind, our findings for privately insured adults support the conclusion of an earlier study of a limited number of risk-adjustment methodologies, based on data from the New Hampshire Medicaid program. ACGs were found to be worse at predicting MH/SA expenditures than relatively simple adjustments for classes of psychiatric diagnoses (Ettner and Notman, 1997).
Our results differed slightly from those of another study byEttner et al. (1998) using 1992-1993 data on privately insured employees and dependents to compare the performance of several risk-adjustment models in predicting MH/SA expenditures. The models compared were a basic demographic model, ACGs, ADGs, HCCs and a "comorbidity" model controlling for seven classes of MH/SA diagnoses and four interactions between psychiatric comorbidities. Among adults, the "comorbidity model" performed the best, with the ADGs a close second in terms of mean absolute prediction error. HCCs ranked third in terms of predictive ability but were clearly outperformed by the ADGs. The "value-added" of controlling for additional psychiatric diagnoses in the ADG and HCC specifications was not examined.
The R2 values in the Ettneret al. (1998) study were somewhat lower than those found here, perhaps because the data in this study were from an employer located in a single geographic region. In particular, the model controlling only for three types of severe psychiatric disability did as well in this study as the full-fledged "comorbidity" model did in the earlier study. As seen in this study as well, Ettner et al. showed that natural selection into health plans gives rise to the potential for large profits or losses to be made under full capitation, regardless of which risk-adjustment model is used. However, the earlier study did not look at predictive ability separately for people with and without psychiatric disabilities or examine alternatives to full capitation for paying carve-outs.
Previous research has looked at whether risk-adjustment of capitation payments to HMOs adjusts adequately for the higher costs of enrollees with particular medical conditions, concluding that all of the existing methodologies substantially underpredicttotal expenditures for these groups (Dunn et al., 1995). This finding has a counterpart in our study, which demonstrates that people with psychiatric disability may become targets of "dumping" by competing behavioral health care carve-outs under full capitation unless risk-adjustment systems can be substantially improved. In the absence of better data and given the need for any risk-adjustment system to be easily implemented, it seems unlikely that such improvements will be forthcoming. The likelihood that carve-outs will compete on the basis of patient selection depends on the administrative costs of avoiding sick patients and whether the insurer is concerned about the possibility of negative publicity and subsequent loss of patient goodwill that might result from overt "cream-skimming" and "dumping" behavior.
Given the financial incentives to engage in such behavior, if the deterrents are weak, then purchasers may want to consider alternatives to competition and full capitation, such as sole source contracting, "soft" capitation or "mixed" payment systems. With sole source contracting, "dumping" of patients with psychiatric disability would not be a source of concern, because a single behavioral health care carve-out vendor would be responsible for financing the MH/SA care of the entire beneficiary population. Furthermore, given the current trend towards consolidation in the behavioral health care carve-out market through mergers and takeovers (Oss et al., 1997), practical considerations may sometimes dictate that purchasers rely on a single vendor. The disadvantage of this approach is that the purchaser must rely on the rebidding process to provide incentives for the carve-out vendor to provide high-quality care. Furthermore, carve-outs observed in the real world typically exclude HMO enrollees, applying only to beneficiaries who remain in a fee-for-service system. Thus selection remains a potential problem unless MH/SA services are carved out of the HMOs as well, so that all beneficiaries have the same insurer for these services, regardless of their medical plan.
In order to examine alternative payment methodologies, we calculated the per-enrollee profits or losses that would be incurred by behavioral health care carve-outs experiencing selection corresponding to the empirical patterns of patient enrollment among the seven HMOs in our sample. In our example, use of a mixed payment methodology would have reduced (but not eliminated) the variability in financial performance of the models, relative to full capitation.
Soft capitation based on plan averages would also lead to greater equality of financial performance across carve-out vendors. However, it does less to attenuate incentives for selective enrollment of healthy patients by vendors than soft capitation implemented at the individual level. Contracts using individualized target amounts and risk corridors would substantially reduce the risk to vendors associated with enrolling high-cost patients with psychiatric disabilities. The downside is that if purchasers do not impose budget neutrality under soft capitation contracts, the purchaser ends up incurring a higher proportion of excess costs when payments are calculated separately for each individual.
Even if post hoc budget neutrality is written into the soft capitation contract, the disadvantage still remains that plans have less incentive to do a good job of managing the care of high-cost patients. Soft capitation is similar to mixed payment, except that under soft capitation, the purchaser tends to retain 100 percent of the risk of expenditures falling outside of the risk corridors. Thus, depending on how the contract is written, patient-level soft capitation is closer to cost-based reimbursement than any of the other payment methodologies, including mixed payment. The tradeoff between giving carve-out vendors incentives to be cost-efficient while limiting their incentives to "dump" patients with psychiatric disabilities should be considered by purchasers in choosing the most appropriate methodology for paying behavioral health care carve-out vendors.
REFERENCES
Adler M. Population Estimates of Disability and Long-Term Care. ASPE Research Notes. February 1995. [http://aspe.hhs.gov/daltcp/reports/1995/rn11.htm]
Altman BM, Barnett S. Implications of Variations in Definitions of Disability Used in Policy Analysis: The Case of Labor Force Outcomes. Paper prepared for the Society for Disability Studies Conference. June 1996.
Altman BM. Definitions of Disability and Their Measurement and Operationalization in Survey Data. Paper presented at the Public Health Conference on Records and Statistics. 1993.
Anderson GE, Steinberg N, Powe S, et al. Setting Payment Rates forCapitated Systems: A Comparison of Various Alternatives. Inquiry 27:225-233. 1993.
Ash A, Porell F, Gruenberg L, et al. Adjusting Medicare Capitation Payments Using Prior Hospitalization Data.Health Care Financing Review 10(4):17-29. Summer 1989.
Ash A, Ellis R, Yu W, et al. Risk Adjustment for the Non-Elderly. Report submitted to the Health Care Financing Administration (contract no. 18-C-90462/1-02).
Ashcraft ML, Fries BE, Nerenz D, et al. A Psychiatric Patient Classification System: An Alternative to Diagnosis-Related Groups. Medical Care 27(5):543-558. 1989.
Averill RF. Development. In Fetter RB, Brand DA, GamacheD (eds.), DRGs: Their Design and Development, pp.28-56. Ann Arbor, MI: Health Administration Press. 1991.
Barnow B, Cain S, Goldberger, AS. Issues in the Analysis of Selectivity Bias. In Stromsdorfer WE, Farkas G (eds.), Evaluation Studies Review Annual, vol.5. Beverly Hills, CA: Sage. 1981.
Bartel A, Taubman P. Some Economic and Demographic Consequences of Mental Illness.Journal of Labor Economics 4(2):243-256. 1986.
Batten H, Bachman SS, Drainoni M, et al. Final Report on Medicaid Managed Care for the SSI Disabled Population. Report submitted to HCFA (contract number 18-90096). Waltham, MA: Institute for Health Policy, The Heller School, Brandeis University. 1995.
Benham L, Benham A. Employment, Earnings, and Psychiatric Diagnoses.In Fuchs V (ed.), Economic Aspects of Health.Chicago: University of Chicago Press. 1982.
Bertko J, Hunt S. Case Study: The Health Insurance Plan of California. Inquiry 32(2):148-153. 1998.
Burkhauser RV, Haveman RH, Wolfe BL. How People with Disabilities Fare When Public Policies Change. Institute for Research on Poverty, University of Wisconsin. Discussion Paper no.974-992. 1992.
Center for Studying Health System Change. Charting Change: A Longitudinal Look at the American Health System. Washington, DC: Center for Studying Health System Change. 1997.
Clark DO, Von Korff M, Saunders K, et al. A Chronic Disease Score with Empirically Derived Weights. Medical Care 33(8):783-795. 1995.
Colvez A, Blanchet M. Disability Trends in the United States Population 1966-76: Analysis of Reported Causes. American Journal of Public Health 71(5):464-471. 1981.
Crown W, Mayer-Oakes A, Burwell B, et al. Health Care Utilization and Expenditure Patterns of Children with Disabilities under Private Insurance and Medicaid. Report submitted by The MEDSTAT Group to the U.S. Department of Health and Human Services (contract no.HHS-100-92-0012). 1996.
Crown W, Mayer-Oakes A, Burwell B, et al. Methodologies for Identifying Disabled Persons from Private Employer Health Claims. Report submitted by The MEDSTAT Group to the U.S. Department of Health and Human Services (contract no.HHS-100-95-0044). 1998.
Custer W. Health Insurance Coverage and the Uninsured. Washington, DC: Health Insurance Association of America. 1999.
Cutler DM, Reber SJ. Paying for Health Insurance: The Trade-off between Competition and Adverse Selection. Quarterly Journal of Economics 113(2):433-466.
Cutler DM, Zeckhauser RJ. Adverse Selection in Health Insurance. NBER Working Paper no.6017.1997.
Cutler DM, Zeckhauser RJ. Adverse Selection in Health Insurance. In Garber AM (ed.) Frontiers in Health Policy Research, vol.1. Cambridge, MA: MIT Press. 1999.
Deb P, Wilcox-Gok V, Holmes A, et al. Choice of Health Insurance by Families of the Mentally Ill. Health Economics 5:61-76. 1996.
The Diabetes Control and Complications Trial Research Group.Lifetime Benefits and Costs of Intensive Therapy as Practiced in the Diabetes Control and Complications Trial. Journal of the American Medical Association 276:1409-1415. 1996.
Duan N. Smearing Estimate: A Nonparametric Retransformation Method. Journal of the American Statistical Association 78(383).1983.
Duan N, Manning WG, Morris CN, et al. A Comparison of Alternative Models for the Demand for Medical Care. Journal of Business and Economic Statistics 1:115-125. 1983.
Dunn DL. Applications of Health Risk Adjustment: What Can Be Learned From Experience to Date? Inquiry 32(2):132-147. 1998.
Dunn D, Rosenblatt A, Taira D, et al. A Comparative Analysis of Methods of Health Risk Assessment: Final Report. SOA Monograph M-HB91-a. Schaumberg, IL: Society of Actuaries. 1995.
DxCG, Inc. DxCG Software. http://www.dxcg.com. June 29, 1999.
EBRI (Employee Benefit Research Institute). Facts on Job-Based Health Care Benefits and Self-Funded Health Plans. September 1998.
Efron B. Regression and ANOVA with Zero-One Data: Measures of Residual Variation. Journal of the American Statistical Association 73(361):113-121. 1978.
Ellis RP, Ash A. Refinements to the Diagnostic Cost Group (DCG) Model. Inquiry 32:418-429. 1995.
Ellis RP, Pope G, Iezzoni LI, et al. Diagnosis-Based Risk Adjustment for Medicare Capitation Payments. Health Care Financing Review 17(3):101-128. 1996.
Epstein AM, Cumella E. Capitation Payment: Using Predictors of Medical Utilization to Adjust Rates. Health Care Financing Review10(1):51-70. 1988.
Ettner S, Frank R, Kessler R. The Impact of Psychiatric Disorders on Labor Market Outcomes. Industrial and Labor Relations Review 51(1):64-81. 1997.
Ettner S, Frank R, Mark T, et al. Risk Adjustment of Capitation Payments to Behavioral Health Care Carve-Outs: How Well Do Existing Methodologies Account for Psychiatric Disability? Health Care Management Science. Forthcoming.
Ettner S, Frank R, McGuire T, et al. Risk Adjustment of Mental Health and Substance Abuse Payments. Inquiry 35(2):223-239. 1998.
Ettner S, Notman E. How Well Do Ambulatory Care Groups Predict Expenditures of Mental Health and Substance Abuse Patients? Administration and Policy in Mental Health 24(4):339-357. 1997.
Fama T, Fox PD, White LA. Do HMOs Care for the Chronically Ill? Health Affairs 14(1):234-243. 1995.
Fowles JB, Fowler EJ, Craft C. Validation of Claims Diagnoses and Self-Reported Conditions Compared with Medical Records for Selected Chronic Conditions. Journal of Ambulatory Care Management 21(1):24-3. 1998.
Fowles J, Wiener J, Knutson D, et al. Taking Health Status into Account When Setting Capitation Rates: A Comparison Of Risk Adjustment Methods. Journal of the American Medical Association 276(16):1316-1321. 1996.
Fox P. An Overview of Managed Care. In KongstvedtPR (ed.), Essentials of Managed Health Care. Gaithersburg, MD: Aspen Publishers, Inc. 1997.
Gonnella, JS, Hornbrook MC, Louis DZ. Staging of Disease: A Case-Mix Measurement. Journal of the American Medical Association 251(5):637-644. 1984.
Greene WH. Econometric Analysis, 2nd ed. New York: MacMillan. 1993.
Greenwald LM, Esposito A, Ingber MJ, et al. Risk Adjustment for the Medicare Program: Lessons Learned from Research and Demonstrations. Inquiry 35(2):193-209. 1998.
Gujarati D. Basic Econometrics. New York: McGraw-Hill. 1988.
Haber LD. Identifying the Disabled. Social Security Bulletin 12:17-34. 1967.
Harris-Wehling J, Heagarty M, Irey HT (eds.). Strategies for Assuring the Provision of Quality Services through Managed Care Delivery Systems to Children with Special Health Care Needs. Washington, DC: Institute of Medicine. 1995.
Haveman R, de Jong P, Wolfe B. Disability Transfers and the Work Decision of Older Men. Quarterly Journal of Economics 106(3):939-949. 1991.
Haveman R, Wolfe B. Disability Transfers and Early Retirement: A Causal Relationship? Institute for Research on Poverty, University of Wisconsin. Discussion Paper no.723-83.1983.
Haveman R, Wolfe B, Buron L, et al. Productivity Losses from Health/Disability in the United States from 1973 to 1988: An Earnings Capacity Approach. University of Wisconsin. 1992.
Heaney CA, Goetzel RZ. A Review of Health-Related Outcomes of Multi-component Worksite Health Promotion Programs. American Journal of Health Promotion 11:290-308. 1997.
Heckman JJ. The Common Structure of Statistical Models of Truncation, Sample Selection, and Limited Dependent Variables and a Simple Estimator for Such Models. Annals of Economic and Social Measurement 5:475-492. 1976.
Heckman JJ. Sample Selection as a Specification Error. Econometrica 47(1):153-161. 1979.
Hellinger FJ. Selection Bias in HMOs and PPOs: A Review of the Evidence. Inquiry 32:135-142. 1995.
Hornbrook MC, Goodman MJ. Assessing Relative Health Plan Risk with the Rand-36 Health Survey. Inquiry 32:56-74. 1995.
Irvin CV, Marder WD, Ozminkowski RJ. The Medical Expenditures of the Disabled: Implications for Risk Adjustment under Community Rating. Presented at the Association for Health Services Research Annual Conference. June 1994.
Jensen GA, Morrisey MA, Gaffney S, et al. The New Dominance of Managed Care: Insurance Trends in the 1990s. Health Affairs 16(1):125-36. 1997.
Johns Hopkins University. ACG Case-Mix System. http://acg.jhsph.edu/index.html. May 1, 1999.
Kessler R, Frank R. The Impact of Psychiatric Disorders on Work Loss Days. Psychological Medicine 27:861-873. 1997.
Knutson D. Case Study: The Minneapolis Buyers Health Care Action Group. Inquiry 35(2):171-177. 1998.
KPMG Peat Marwick. Survey of Employer-Sponsored Health Benefits. 1997.
Kravitz RL, Greenfield S, Rogers W, et al. Differences in the Mix of Patients among Medical Specialties and Systems of Care: Results From the Medical Outcomes Study. Journal of the American Medical Association 267(12):1617-1623. 1992.
Kronick R, Dreyfus A, ZhauZ, et al. Risk-Adjusted Reimbursement for People with Disabilities: A Diagnostic Approach Prepared for Missouri. Boston, MA: Medicaid Working Group. 1995.
LaPlante M. Disability Risks of Chronic Illnesses and Impairments. Washington, DC: U.S. Department of Health and Human Services. 1989.
LaPlante M. Disability, Health Insurance Coverage, and Utilization of Acute Health Services in the United States. Washington, DC: U.S. Department of Health and Human Services. 1993. [http://aspe.hhs.gov/daltcp/reports/dhicues.htm]
Long SH, Marquis MS. How Widespread is Managed Competition? Health System Change Data Bulletin 12. Washington, DC: Center for Studying Health System Change. 1998.
Luft H. Translating the U.S. HMO Experience to Other Health System. Health Affairs 10:172-186. 1991.
Manning WG. The Logged Dependent Variable,Heteroscedasticity, and the RetranformationProblem. Journal of Health Economics 17(3):283-296. 1998.
Manning WG, Newhouse JP, Duan N, et al. Health Insurance and the Demand for Medical Care: Results from a Randomized Experiment. American Economic Review 77(3):251-277.
Mark T, Mueller C. Access to Care in HMOs and Traditional Insurance Plans. Health Affairs 15(4):81-87. 1996.
Medicare Payment Advisory Commission (MedPAC), Chapter 2: Risk Adjustment. In Report to Congress: Medical Payment Policy, vol.2. March 1998.
Miller L, Kelman S. Estimates of the Loss of Individual Productivity from Alcohol and Drug Abuse and from Mental Illness. In Frank R, Manning W (eds.), Economics and Mental Health. Baltimore, MD: John Hopkins University Press. 1992.
Mullahy J. Instrumental Variable Estimation of Count Data Models: Applications to Models of Cigarette Smoking Behavior. Review of Economics and Statistics 79(4):586-593. 1997.
Mullahy J.Much Ado about Two: Reconsidering Retransformation and the Two-Part Model in Health Economics. Journal of Health Economics 17(3):247-382. 1988.
Nagi SZ. Disability and Rehabilitation: Legal, Clinical, and Self-Concepts and Measurement. Columbus, OH: Ohio State University Press. 1969.
Nagi SZ. The Concept and Measurement of Disability. In Berkowitz ED (ed.), Disability Policies and Government Programs. New York, NY: Praeger. 1979.
Nagi SZ. An Epidemiology of Disability among Adults in the United States. Milbank Quarterly 54(4):439-467. 1976.
Newhouse JP. Rate Adjustors for Medicare under Capitation. Health Care Financing Review Annual Supplement 8:45-56. 1986.
Newhouse JP. Patients at Risk: Health Reform and Risk Adjustment. Health Affairs 13(1):132-146. 1994.
Newhouse JP. Reimbursing Health Plans and Health Providers: Efficiency in Production Versus Selection. Journal of Economic Literature 34(3):1236-63. 1996.
Newhouse J, Manning W, Keeler E, et al. Adjusting Capitation Rates Using Objective Health Measures and Prior Utilization. Health Care Financing Review10(3):41-54. 1989.
Neslusan C, Terza J. Exponential Regression with Endogenous Polychotomous Treatment Effects: GMM vs. Two-Stage Estimation. Department of Economics, Pennsylvania State University. 1997.
Oss M, Drissel A, Clary J. Managed Behavioral Health Market Share in the United States, 1997-1998. Gettysburg, PA: OPEN MINDS (Behavioral Health Industry News, Inc.). 1997.
Ozminkowski RJ, Burwell B, Albers LA. Private Payers Serving Disabled Individuals: Expanded Employer Summaries. Report submitted by The MEDSTAT Group to the U.S. Department of Health and Human Services (contract no.HHS-100-95-0044). 1997.
Ozminkowski RJ, Burwell B, Albers LA. Operationalizing the Identification of Chronically Ill and Disabled Persons for the Private Payers Study. Report submitted by The MEDSTAT Group to the U.S. Department of Health and Human Services (contract no.HHS-100-95-0044). 1998.
Perneger TV, Allaz A, Etter J, et al. Mental Health and Choice between Managed Care and Indemnity Health Insurance. American Journal of Psychiatry 152(7):1020-1025. 1995.
Powe N, Wiener J, StarfieldB, et al. Systemwide Performance in a Medicaid Program: Profiling the Care of Patients with Chronic Illnesses. Medical Care 34(8):798-810. 1996.
Riley GF, Feuer EJ, Lubitz JD. Disenrollment of Medicare Patients from Health Maintenance Organizations. Medical Care 34:826-836. 1996.
Rognehaugh R. The Managed Health Care Dictionary. Gaithersburg, MD: Aspen Publishers, Inc. 1996.
Royalty AB, Solomon N. Health Plan Choice: Price Elasticities in a Managed Competition Setting. Journal of Human Resources 34(1):1-41.
Schauffler H, Howland J, Cobb J. Using Chronic Disease Risk Factors to Adjust Medicare Capitation Payments. Health Care Financing Review14(1):79-90. 1992.
Smith N, Wiener J. Applying Population-Based Case-Mix Adjustment in Managed Care: The Johns Hopkins Ambulatory Care Group System. Managed Care Quarterly 2(3):21-34.1994.
Social Security Administration. Disability Evaluation under Social Security. Washington, DC: Social Security Administration. 1995.
Starfield B, Wiener J, Mumford L, et al. Ambulatory Care Groups: A Categorization of Diagnoses for Research and Management. Health Services Research 25(7):53-74. 1991.
Sturm R, Jackson CA, Meredith LS, et al. Mental Health Care Utilization in Prepaid and Fee-for-Service Plans among Depressed Patients in the Medical Outcomes Study. Health Services Research 30(2):319-340. 1995.
Sturm R, McGlynn EA, Meredith LS, et al. Switches between Prepaid and Fee-for-Service Health Systems among Depressed Outpatients: Results from the Medical Outcomes Study. Medical Care 32(9):917-929. 1994.
Terza J. Estimating Count Data Models with Endogenous Switching: Sample Selection and Endogenous Treatment Effects. Journal of Econometrics 84(1998):129-154. 1998.
Terza J. Two-Stage Methods of Moments Estimation of Single-Index Non-Linear Regression Models with Endogenous Switching. Department of Economics, Pennsylvania State University. 1998.
Terza J. A Common Structure for Multiple-Index Nonlinear Regression Models with Endogenous Switching. Department of Economics, Pennsylvania State University.1997.
Tollen L, Rothman M. Case Study: Colorado Medicaid HMO Risk Adjustment. Inquiry 35(2). 1998.
U.S. General Accounting Office. Medicare: Fewer and Lower Cost Beneficiaries With Chronic Conditions Enroll in HMOs. Report to the Chairman, Subcommittee on Health, Committee on Ways and Means, House of Representatives. 1997.
Wiener JP, Dobson A, Maxwell SL, et al. Risk-Adjusted Medicare Capitation Rates Using Ambulatory and Inpatient Diagnoses. Health Care Financing Review 17(3):77-99. 1996.
Wiener JP, Parente ST, Garnick DW, et al. Variation in Office-Based Quality: A Claims-Based Profile of Care Provided to Medicare Patients with Diabetes. Journal of the American Medical Association 273(19):1503-1508. 1995.
Wiener J, Starfield B, Steinwachs D, et al. Development and Application of a Population-Oriented Measure of Ambulatory Care Case-Mix. Medical Care 29(5):452-472. 1991.
Wiener J, Tucker AM, Collins M, et al. The Development of a Risk-Adjusted Capitated Payment System: The Maryland Medicaid Model. Ambulatory Care Management 21(4):29-52. 1998.
Wells KB, Marquis S, Hosek SD. Mental Health and Selection of Preferred Providers. Medical Care 29(9):911-924. 1991.
West DW, Stuart ME, Duggan AK, et al. Evidence for Selective Health Maintenance Organization Enrollment among Children and Adolescents Covered by Medicaid. Archives of Pediatric and Adolescent Medicine 150:503-507. 1996.
Wilson VM, Smith CA, Hamilton JM, et al. Case Study: The Washington State Health Care Authority. Inquiry 35(2):178-92. 1998.
Wolfe B, Haveman R. Trends in the Prevalence of Disability, 1962-1984. Milbank Quarterly 68(1):53-80. 1990.
Work-Loss Data Institute. Official Disability Guidelines: Length of Disability Data by ICD-9-CM from CDC and OSHA Plus NHDS Hospital Length of Stay. Riverside, CA: Work-Loss Data Institute. 1996.
World Health Organization. International Classification of Impairment, Disabilities, and Handicaps.Geneva, Switzerland: World Health Organization. 1980.
NOTES
-
ICD-9-CM is the International Classification of Diseases, 9th Revision, Clinical Modification. It is required for reported diagnoses and diseases to all Health Care Financing Administration programs.
-
More information about the potential tradeoffs can be found in Chapter 2 of this report, which notes the benefits offered and various coverage provisions and rules of conduct for those in the indemnity and managed care plans.
-
This table and all of the following tables and figures exclude information about Employer B's PPO plan. The PPO samples were often very small, resulting in estimates that were not robust. Detailed data about PPO members can be found in Appendix B.
-
Readers interested in learning more about plan switching have at least two sources for further reading. Chapter 6 of this report provides an in-depth analysis of switching among the plans of Employers A and B. Cutler and Zeckhauser(1998) also present a discussion of plan switching, using the experiences of two plans to illustrate how switching, if ignored, can lead to a “death spiral” in which high-cost plans lose so many healthy enrollees that they become unprofitable and eventually cease operation altogether.
-
Note that Employer A has no offices in the areas where Employer B is located. Thus, the issue raised here about benefit coverage is not meant in the spirit of comparing benefits between Employers A and B. Our hypothesis is merely that Employer B may offer better coverage than competing employers in the same state, thereby attracting a higher percentage of people with potentially disabling chronic conditions than those other employers, and perhaps a higher percentage than Employer A as well.
-
Median expenditures (versus mean or average expenditures) are probably more indicative of the middle of teh expenditure distributions because the median is less sensitive to unusually high values. Since in this section of the Chapter we do not adjust the means for differences in patient characteristics, we focus on a comparison of median expenditures across the plans.
-
The authors are affiliated with The MEDSTAT Group (Mark, Ozminkowski), UCLA Department of Medicine (Ettner), and the Office of the Assistant Secretary for Planning and Evaluation, HHS (Drabek).
-
For technical details on the creation of ACGs and ADGs, see Johns Hopkins University (1999).
-
In contrast, the Principal In-Patient DCG model (PIP-DCG), being implemented by the Health Care Financing Administration in the Medicare Plus Choice program, uses only inpatient data to classify patients.
-
The authors are affiliated with UCLA Department of Medicine (Ettner), Harvard Medical School (Frank), and The MEDSTAT Group (Mark, Smith).
-
These treatment patterns included inpatient episodes or use of therapies reserved for severe and refractory illness, such as electroconvulsive therapy for depression.
-
For technical details of the estimation methods, see Ettneret al. (forthcoming).
REPORT LIST
To obtain a printed copy of this report, send the full report title and your mailing information to:
U.S. Department of Health and Human Services
Office of Disability, Aging and Long-Term Care Policy
Room 424E, H.H. Humphrey Building
200 Independence Avenue, S.W.
Washington, D.C. 20201
FAX: 202-401-7733
Email: webmaster.DALTCP@hhs.gov
APPENDIX A: Diagnosis Codes Associated with Potentially Disabling Conditions
| TABLE A-1. Diagnosis Codes Associated with Potentially Disabling Physical Conditions among Adults | |||
|---|---|---|---|
| ICD-9-CM Diagnosis Codes |
Condition | Per Se Disabling? |
Activity-Limiting Condition? (LaPlante, 1989) |
| 010-018.96 | Tuberculosis | Yes | |
| 42 | AIDS | Yes | |
| 094.0-094.2 | Severe neurosyphilis | Yes | |
| 100-102 | Mental retardation | Yes | |
| 114.4 | Chronic Pulmonary coccidioidomycosis | Yes | |
| 135 | Sarcoidosis | Yes | |
| 138 | Post-polio syndrome | Yes | |
| 164.0 | Malignant neoplasm of thymus | Yes | |
| 164.2-164.9 | Malignant neoplasm of mediastinum | Yes | |
| 174-174.9 | Malignant neoplasm of breast | ||
| 179 | Malignant neoplasm of uterus, part unspecified | Yes | |
| 181 | Malignant neoplasm of placenta | Yes | |
| 182.0-182.8 | Malignant neoplasm of body of uterus | Yes | |
| 183.0 | Malignant neoplasm of ovary | Yes | |
| 183.2-183.9 | Malignant neoplasm of uterine adnexa | Yes | |
| 184.0-184.9 | Malignant neoplasm of other and unspecified female genital organs | Yes | |
| 185 | Malignant neoplasm of prostate | Yes | |
| 186.0-186.9 | Malignant neoplasm of testis | Yes | |
| 187.0-187.9 | Malignant neoplasm of penis and other male genital organs | Yes | |
| 189.0 | Malignant neoplasm of kidney | Yes | |
| 191.0 | Malignant neoplasm of brain (cerebrum) | Yes | |
| 191.5 | Malignant neoplasm of brain (ventricles) | Yes | |
| 191.6 | Malignant neoplasm of brain (cerebellum) | Yes | |
| 191.7 | Malignant neoplasm of brain (stem) | Yes | |
| 192.1 | Malignant neoplasm of cerebral meninges | Yes | |
| 194.0 | Malignant neoplasm of arenal gland | Yes | |
| 196.0-196.9 | Lymph node metastases | Yes | |
| 197.8 | Respiratory/Digestive metastases | Yes | Yes |
| 198.0-198.2, 1984-198.89 | Metastases to other specific sites | Yes | |
| 199.0 | Carcinomatosis (sites unspecified) | Yes | |
| 200.0-200.8 | Lymphosarcoma/Burkitt/Other variants | Yes | |
| 201.0-201.9 | Hodgkin's disease | Yes | |
| 202.3 | Malignant histiocytosis | Yes | |
| 202.5 | Letterer-Swine disease | Yes | |
| 202.8 | Other Lymphomas | Yes | |
| 203.0 | Multiple Myeloma | Yes | |
| 203.1 | Plasma Cell Leukemia | Yes | |
| 204.0-204.9 | Lymphoid leukemia (with 5th digit "0") | Yes | |
| 205.0-205.9 | Myeloid leukemia (with 5th digit "0") | Yes | |
| 206.0-206.9 | Monocytic leukemia (with 5th digit "0") | Yes | |
| 207.0-207.8 | Other specific leukemia (with 5th digit "0") | Yes | |
| 208.0-208.9 | Leukemia, unspecified cell type (with 5th digit "0") | Yes | |
| 237.7 | Neurofibromatosis | Yes | |
| 243 | Congestive hypothyroidism | Yes | |
| 245.2 | Chronic lymphocytic thyroiditis | Yes | |
| 250.40-250.43 | Diabetes with renal manifestations | ||
| 250.50-250.53 | Diabetes with ophthalmic manifestations | ||
| 250.60-250.63 | Diabetes with neurological manifestations | ||
| 250.70-250.73 | Diabetes with peripheral circulatory disorders | ||
| 250.80-250.83 | Diabetes with other specified manifestations | ||
| 250.8+259.8 | Diabetic glycogenosis | ||
| 253.2 | Panhypopituitarism | Yes | |
| 253.3 | Pituitary dwarfism | Yes | |
| 253.5 | Diabetes insipidus | Yes | |
| 255.2 | Adrenogenital disorder | Yes | |
| 259.2 | Carcinoid syndrome | Yes | |
| 265.1 | Wernicke's disease and Korsadoff's psychosis | Yes | |
| 265.2 | Pellagra | Yes | |
| 266.2 | Folic acid deficiency | Yes | |
| 266.2+336.2 | Subacute combined degeneration of the spinal cord (vitamin B12 deficiency) | Yes | |
| 268 | Rickets, active | Yes | |
| 268.1 | Rickets, late effect | Yes | |
| 269.1 | Vitamin E deficiency | Yes | |
| 269.9+357.4 | Nutritional polyneuropathy - Strachan's syndrome (amblyoopia, painful neuropathy and orogenital dermatitis) | Yes | |
| 270.0-270.8 | Disorders of amino-acid transport and metabolism | Yes | |
| 271.0 | Pompe's disease | Yes | |
| 271.2 | Hereditary fructose intolerance | Yes | |
| 272.7 | Lipidoses: Gaucher's, Niemann-Pick, Ceroid Lipofuscinosis | Yes | |
| 273-273.9 | Disorders of plasma protein metabolism | Yes | |
| 274.0 | Gouty arthropathy | Yes | |
| 275.0 | Disorders of iron metabolism (Hemochromatosis) | Yes | |
| 275.1 | Disorders of copper metabolism (Wilson's Disease) | Yes | |
| 277.0 | Cystic Fibrosis | Yes | |
| 277.2 | Other disorders of Purine and Pyrimidine | Yes | |
| 277.3 | Amyloidosis | Yes | |
| 277.4 | Disorders of Bilirubin Excretion | Yes | |
| 277.5 | Mucopolysaccharidosis (Hurler, Hunter, Morquio, Scheie, Maroteaux-Lamy) | Yes | |
| 277.6 | Other deficiencies of circulating enzymes (Alpha 1 - antitrypsin deficiency) | Yes | |
| 277.8 | Other specified disorders of metabolism (Histiocytosis [acute/chronic]) | Yes | |
| 282.0-282.9 | Hereditary hemolytic anemias | Yes | |
| 283.0-283.9 | Acquired hemolytic anemias | Yes | |
| 286.0-286.4 | Hemophilia/Von Willebrand's disease | Yes | |
| 290.1-290.13 | Senile dementia of the Alzheimer type | Yes | |
| 290.4-290.43 | Multi-infarct dementia | Yes | |
| 290.8 | Dementia (senile psychosis) | Yes | |
| 290.9 | Dementia (degenerative, idiopathic) | Yes | |
| 291.1-291.2 | Wernicke's disease and Korsakoff's psychosis (alcoholic) | Yes | |
| 294.0 | Wernicke's disease and Korsakoff's psychosis (nonalcoholic) | Yes | |
| 294.8 | Dialysis encephalopathy | Yes | |
| 307.23 | Gilles de la Tourette Syndrome | Yes | |
| 309.81 | Posttraumatic stress disorder | ? | |
| 310.0-310.9 | Specific nonpsychotic mental disorders due to organic brain damage | ? | |
| 318.0 | Moderate mental retardation | Yes | |
| 318.1 | Severe mental retardation | Yes | |
| 318.2 | Profound mental retardation | Yes | |
| 330.0 | Metachromatic Leukodystrophy (MLD) | Yes | |
| 330.1 | Adult lipid storage disease (gangliosidosis) | Yes | |
| 330.2 | Cerebral degeneration in generalized lipidoses | Yes | |
| 330.3 | Cerebral degeneration of childhood in other diseases | Yes | |
| 330.8 | Subacute necrotizing encephalomyelopathy (Leigh's disease) | Yes | |
| 331.0 | Alzheimer's disease | Yes | |
| 331.1 | Pick's disease | Yes | |
| 331.7 | Alcoholic cerebellar degeneration | Yes | |
| 331.81 | Reye's Syndrome | Yes | |
| 332 | Parkinson's disease | Yes | |
| 333.0 | Degenerative diseases of the basal ganglia | Yes | |
| 333.2 | Progressive familiar myoclonic epilepsy | Yes | |
| 333.4 | Huntington's disease | Yes | |
| 333.6 | Idiopathic torsion Dystonia | Yes | |
| 333.7 | Symptomatic torsion Dystonia | Yes | |
| 333.83 | Spasmodic torticollis | Yes | |
| 333.89 | Torsion Dystonia, not otherwise specified | Yes | |
| 334.0-334.9 | Spinocerebellar disease | Yes | |
| 335.11 | Juvenile spinal muscular atrophy (Wohlfart-Kugelberg-Welander) | Yes | |
| 335.19 | Spinal muscular atrophy | Yes | |
| 335.2 | Amyotrophic lateral sclerosis | Yes | |
| 335.24 | Primary lateral sclerosis | Yes | |
| 336.0 | Syringomyelia | Yes | |
| 336.1 | Spinal cord infarction | Yes | |
| 336.2-336.3, 336.8-336.9 | Diseases of the spinal cord classified elsewhere | ? | |
| 337-337.9 | Autonomic peripheral neuropathy | Yes | |
| 340 | Multiple sclerosis | Yes | Yes |
| 341.0 | Neuromyelitis optica | Yes | |
| 341.1 | Schilder's disease | Yes | |
| 343-343.9 | Cerebral Palsy | Yes | Yes |
| 344.0-344.09 | Quadriplegia | Yes | Yes |
| 344.1 | Paraplegia | Yes | Yes |
| 344.3-344.32 | Partial paralysis in lower extremity | Yes | |
| 344.4-344.42 | Partial paralysis in upper extremity | Yes | |
| 344.8, 344.81, 344.89 | Paralysis in other sites (complete/partial) | Yes | |
| 344.9 | Complete paralysis in extremity | Yes | |
| 345.0-345.9 | Epilepsy | Yes | |
| 348.1 | Anoxic encephalopathy | Yes | |
| 348.3 | Encephalopathy, unspecified | Yes | |
| 356.0-356.8 | Hereditary and idiopathic peripheral neuropathy | Yes | |
| 356.8 | Progressive supranuclear palsy | Yes | |
| 356.9 | Hypertrophic interstitial polyneuropathy | Yes | |
| 357.0-357.9 | Inflammatory and toxic peripheral neuropathy | Yes | |
| 359.0 | Congenital hereditary muscular dystrophy | Yes | |
| 359.1-359.2 | Other Muscular Dystrophies and Myopathies | Yes | |
| 359.3 | Hypokalemic periodic paralysis | Yes | |
| 361-361.9 | Retinal detachment | Yes | |
| 369.00-369.9 | Blindness | Yes | Yes |
| 377.33 | Deficiency amblyopia (nutritional optic neuropathy) | Yes | |
| 386.00-386.03 | Meniere's disease | Yes | |
| 393 | Chronic rheumatic pericarditis | ||
| 394.0-394.9 | Rheumatic mitral valve disease | ||
| 395.0-395.9 | Rheumatic aortic valve disease | ||
| 396.0-396.9 | Mitral and Aortic valve disease | ||
| 397.0-397.9 | Diseases of other Endocardial structures | ||
| 398.0-398.99 | Other rheumatic heart disease | ||
| 402.01 | Hypertensive heart disease, malignant, with congestive heart failure | ||
| 402.11 | Hypertensive heart disease, benign, with congestive heart failure | ||
| 402.91 | Hypertensive heart disease, unspecified, with congestive heart failure | ||
| 403.01 | Hypertensive renal disease, malignant, with renal failure | Yes | |
| 403.11 | Hypertensive renal disease, benign, with renal failure | Yes | |
| 403.91 | Hypertensive renal disease, unspecified, with renal failure | Yes | |
| 404.01 | Hypertensive hear/renal disease, malignant, with congestive heart failure. | ||
| 404.02 | Hypertensive heart/renal disease, malignant, with renal failure | Yes | |
| 404.03 | Hypertensive heart/renal disease, malignant, with congestive heart failure and renal failure | Yes | |
| 404.11 | Hypertensive heart/renal disease, benign, with congestive heart failure | ||
| 404.12 | Hypertensive heart/renal disease, benign, with renal failure | Yes | |
| 404.13 | Hypertensive heart/renal disease, benign, with congestive heart failure and renal failure | ||
| 404.91 | Hypertensive heart/renal disease, unspecified, with congestive heart failure | ||
| 404.92 | Hypertensive heart/renal disease, unspecified, with renal failure | Yes | |
| 404.93 | Hypertensive heart/renal disease, unspecified, with congestive heart failure and renal failure | Yes | |
| 410.0-410.9x | Myocardial infarction | Yes | |
| 411.0-411.89 | Other acute and subacute forms of heart disease | Yes | |
| 412 | Old myocardial infarction | Yes | |
| 413.0-413.9 | Angina pectoris | Yes | |
| 414.0-414.9 | Other forms of chronic ischemic heart disease | Yes | |
| 415.0-415.19 | Acute pulmonary heart disease | Yes | |
| 416.0 | Primary pulmonary hypertension | Yes | |
| 416.1-416.9 | Kyphoscoliotic heart disease/chronic pulmonary heart disease | Yes | |
| 421.0-421.9 | Subacute endocarditis | Yes | |
| 423.1-423.8 | Chronic pericarditis | Yes | Yes |
| 424.0-424.99 | Endocarditis (non-rheumatic) | Yes | Yes |
| 425.0-425.9 | Cardiomyopathy | Yes | |
| 426.0 | Third degree atrioventricular block | Yes | |
| 426.10, 426.12-426.13 | Unspecified or second degree atrioventricular block | Yes | |
| 426.6-426.9 | Other conduction disorders | Yes | |
| 427.0-427.5, 427.8-427.9 | Cardiac dysrhythmias | Yes | |
| 427.1 | Ventricular tachycardia | Yes | |
| 428-428.9 | Heart failure | Yes | |
| 429-429.9 | Ill-defined descriptions and complications of heart disease | Yes | |
| 429.1 | Degenerative myocardial disease | Yes | |
| 430 | Subarachnoid hemorrhage | Yes | |
| 431 | Intracerebral hemorrhage | Yes | |
| 432-432.9 | Epidural hemorrhage and Hematoma | Yes | Yes |
| 433-433.9 | Occlusion/stenosis of precerebral arteries (with 5th digit "1") | Yes | |
| 434-434.9 | Occlusion of cerebral arteries (with 5th digit "1") | Yes | |
| 436 | Stroke | Yes | Yes |
| 437.1 | Chronic cerebral ischemia | Yes | |
| 437.2 | Hypertensive encephalopathy | Yes | |
| 437.3 | Cerebral aneurysm, nonruptured | Yes | |
| 437.4 | Cerebral arteritis | Yes | |
| 437.5 | Moyamoya disease | Yes | |
| 437.6 | Nonpyogenic thrombosis of intracranial venous sinus | Yes | |
| 437.7 | Transient global amnesia | Yes | |
| 437.8 | Other cerebrovascular disease | Yes | |
| 438 | Late effects of cerebrovascular disease | Yes | |
| 443.1 | Thromboangiitis obliterans | Yes | |
| 447.6 | Vasculitis syndromes | Yes | |
| 492.8 | Emphysema | Yes | |
| 493.10-493.91 | Asthma | ||
| 496 | Chronic obstructive pulmonary disease | ||
| Inhalation fevers | Yes | ||
| 500-505 | Pneumoconioses | Yes | Yes |
| 506.4 | Chronic respiratory conditions (e.g., emphysema, fibrosis) due to fumes and vapors | Yes | |
| 508.1 | Chronic Pulmonary manifestations (e.g., fibrosis) due to radiation | Yes | |
| 510-510.9 | Lung abscess | Yes | |
| 515.0 | Interstitial lung disease | ||
| 555.0-555.9 | Regional enteritis | Yes | |
| 557.1 | Chronic ischemic colitis | Yes | |
| 571.2 | Alcoholic cirrhosis of liver | Yes | |
| 571.4-571.49 | Chronic hepatitis | Yes | |
| 571.5 | Cirrhosis of liver w/o mention of alcohol | Yes | |
| 571.6 | Biliary cirrhosis | Yes | |
| 572.2 | Acute and chronic hepatic encephalopathy, acquired hepatocerebral degeneration | Yes | |
| 576.1 | Sclerosing cholangitis | Yes | |
| 577.1 | Chronic pancreatitis | Yes | |
| 579.0, 579.9 | Nontropical sprue; chronic malabsorption syndrome | Yes | |
| 580.4 | Acute glomerulonephritis with lesion of rapidly progressive glomerulonephritis | Yes | |
| 581.0 | Nephrotic syndrome with lesion of proliferative glomerulonephritis | Yes | |
| 581.1 | Nephrotic syndrome with lesion of membranous glomerulonephritis | Yes | |
| 581.2 | Nephrotic syndrome with lesion of membranoproliferative glomerulonephritis | Yes | |
| 581.3 | Nephrotic syndrome with lesion of minimal change glomerulonephritis | Yes | |
| 581.9 | Nephrotic syndrome with unspecified pathological lesion in kidney | Yes | |
| 582.0 | Chronic glomerulonephritis with lesion of proliferative glomerulonephritis | Yes | |
| 582.1 | Chronic glomerulonephritis with lesion of membranous glomerulonephritis | Yes | |
| 582.2 | Chronic glomerulonephritis with lesion of membranoproliferative glomerulonephritis | Yes | |
| 582.4 | Chronic glomerulonephritis with lesion of rapidly progressive glomerulonephritis | Yes | |
| 582.9 | Chronic glomerulonephritis with unspecified pathological lesion in kidney | Yes | |
| 583.0 | Nephritis and nephropathy, not specified as acute or chronic, with lesion of proliferative glomerulonephritis | Yes | |
| 583.1 | Nephritis and nephropathy, not specified as acute or chronic, with lesion of membranous glomerulonephritis | Yes | |
| 583.2 | Nephritis and nephropathy, not specified as acute or chronic, with lesion of membranoproliferative glomerulonephritis | Yes | |
| 583.4 | Nephritis and nephropathy, not specified as acute or chronic, with lesion of rapidly progressive glomerulonephritis | Yes | |
| 585 | End stage renal disease/Uremic encephalopathy | Yes | |
| 588-588.9 | Disorders resulting from impaired renal function | Yes | |
| 695.4 | Lupus erythematosus (discoid) | ||
| 710.0 | Systemic lupus erythematosus | Yes | |
| 710.1 | Scleroderma, systemic sclerosis | Yes | |
| 710.3 | Dermatomyositis | Yes | |
| 710.4 | Polymyositis | Yes | |
| 710.5 | Eosinophilia-myalgia syndrome | Yes | |
| 714.0 | Rheumatoid arthritis | Yes | |
| 719.20-719.29 | Villonodular Synovitis | Yes | |
| 720.0 | Ankylosing spondylitis | Yes | |
| 728.11 | Progressive Myositis ossificans | Yes | |
| 732.1 | Juvenile osteochondrosis of hip and pelvis (of Legg-Calve- Perthes) | Yes | |
| 740.1 | Craniorachischisis | Yes | |
| 740.2 | Iniencephaly | Yes | |
| 741.0 | Spina bifida with hydrocephalus | Yes | |
| 741.9 | Spina bifida without mention of hydrocephalus | Yes | |
| 742.0 | Other congenital anomalies of nervous system/Encephalocele | Yes | |
| 742.1 | Microcephalus Hydromicrocephaly Micrencephaly | Yes | |
| 742.3 | Congenital hydrocephalus | Yes | |
| 742.4 | Other specified anomalies of brain | Yes | |
| 742.8 | Other specified anomalies of nervous system Familial dysautonomia | Yes | |
| 745.0 | Bulbus cordia anomalies and anomalies of cardiac septal closure/ Common truncus | Yes | |
| 745.10-745.19 | Transposition of great vessels | Yes | |
| 745.2 | Tetralogy of Fallot | Yes | |
| 745.3 | Common ventricle Single ventricle | Yes | |
| 745.4 | Ventricular septal defect | Yes | |
| 745.5 | Ostium secundum type artrial septal defect | Yes | |
| 745.6 | Endocardiial cushion defect, unspecified type | Yes | |
| 746.00 | Pulmonary valve anomaly, unspecified | Yes | |
| 746.01 | Atresia, congenital | Yes | |
| 746.02 | Stenosis, congenital | Yes | |
| 746.1 | Tricuspid atresia and stenosis, congenital | Yes | |
| 746.2 | Ebstein's anomaly | Yes | |
| 746.3 | Congenital stenosis or aortic valve | Yes | |
| 746.4 | Congenital insufficiency of aortic valve | Yes | |
| 746.5 | Congenital mitral stenosis | Yes | |
| 746.6 | Congenital mitral insufficiency | Yes | |
| 746.7 | Hypoplastic left heart syndrome | Yes | |
| 746.8 | Other specified anomalies of heart | Yes | |
| 747.0 | Patent ductus arteriosus | Yes | |
| 747.1 | Coarctation of aorta (preductal) (postductal) | Yes | |
| 747.21 | Anomalies of aortic arch | Yes | |
| 747.3 | Anomalies of pulmonary artery Stenosis | Yes | |
| 747.4 | Anomalies of great veins | Yes | |
| 747.82 | Vascular malformation of the spinal cord | Yes | |
| 749.00 | Cleft plate with cleft lip, cleft palate unspecified | Yes | |
| 749.20 | Cleft plate with cleft lip, unspecified | Yes | |
| 749.21 | Cleft plate with cleft lip, unilateral, complete | Yes | |
| 749.22 | Cleft plate with cleft lip, unilateral, incomplete | Yes | |
| 750.3 | Tracheoesophageal fistula, esophageal atresia and stenosis | Yes | |
| 753.0 | Renal agenesis and dysgenesis | Yes | |
| 756.0- 756.9+A269 | Other congenital musculoskeletal | Yes | |
| 757.39 | Pseudoxanthoma elasticum | Yes | |
| 758.80-758.89 | Other conditions due to sex chromosome anomalies | Yes | |
| 759.0-759.9 | Other and unspecified congenital anomalies | Yes | |
| 771.0 | Congenital rubella | Yes | |
| 771.1 | Congenital cytomegalovirus infection | Yes | |
| 780.3 | Seizure disorders | Yes | |
| 887.0-887.7 | Traumatic amputation of arm(s) and hand(s) | Yes | |
| 897.0-897.7 | Traumatic amputation of leg(s) | Yes | |
| V42.0 | Renal Transplant | Yes | |
| V42.1 | Heart Transplant | Yes | |
| V42.7 | Liver Transplant | Yes | |
| V49.63-V49.67 | Upper limb amputation status | Yes | |
| V49.73-V49.77 | Lower limb amputation status | Yes | |
| TABLE A-2. Diagnosis Codes Associated with Potentially Disabling Physical Conditions among Children | |||
|---|---|---|---|
| ICD-9-CM Diagnosis Codes |
Category Label | Per Se Disabling? |
Activity-Limiting Condition? (LaPlante, 1989) |
| 135 | Sarcoidosis | ||
| 189 | Malignant neoplasm of kidney and other and unspecified urinary organs | ||
| 194 | Malignant neoplasm of other endocrine glands and related structures | ||
| 204 | Lymphoid Leukemia | ||
| 206 | Monocytic leukemia | ||
| 243 | Congestive hypothyroidism | ||
| 579 | Intestinal malabsorption | ||
| 585 | Chronic renal failure | ||
| 586 | Renal failure, unspecified | ||
| 710 | Diffuse diseases of connective tissue | ||
| 159, 159.1 | Malignant neoplasm of other and ill-defined sites within the digestive organs and peritoneum | ||
| 164, 164.2, 164.3, 164.8, 164.9 | Malignant neoplasm of thymus, heart, and mediastinum | ||
| 191, 191.5, 191.6, 191.7 | Malignant neoplasm of brain | ||
| 192, 192.1 | Malignant neoplasm of other and unspecified parts of nervous system | ||
| 200, 200.1, 200.2, 200.8 | Lymphosarcoma and reticulosarcoma | ||
| 201, 201.1, 201.4, 201.5, 201.6, 201.7, 201.9 | Hodgkin's Disease | ||
| 202, 202.3, 202.5, 202.8 | Other malignant neoplasms of lymphoid and histiocytic tissue | ||
| 205 | Myeloid leukemia | ||
| 237, 237.7 | Neoplasm of uncertain behavior of endocrine glands and nervous system | ||
| 245, 245.2 | Thyroiditis | ||
| 250-250.93 | Diabetes mellitus | Yes | |
| 253, 253.2 | Disorders of the pituitary gland and its hypothalamic control | ||
| 255, 255.2 | Disorders of adrenal glands | ||
| 268, 268.1 | Vitamin D deficiency | ||
| 270, 270.1, 270.2, 270.3 | Disorders of amino-acid transport and metabolism | ||
| 271, 271.1, 271.3, 271.8 | Disorders of carbohydrate transport and metabolism | ||
| 272, 272.5, 272.6 | Pure hypercholesterolemia | ||
| 275, 275.1 | Disorders of mineral metabolism | ||
| 277, 277.4, 277.5, 277.6, 277.8 | Other and unspecified disorders of metabolism | ||
| 282, 282.1, 282.3, 282.4, 282.6, 282.7 | Hereditary hemolytic anemias | ||
| 283, 283.1 | Acquired hemolytic anemias | ||
| 284, 284.8, 284.9 | Aplastic anemia | ||
| 286, 286.1, 286.2, 286.4 | Coagulation defects | ||
| 330, 330.1, 330.2, 330.3, 330.8 | Cerebral degenerations usually manifest in childhood | ||
| 331, 331.8, 331.81 | Other cerebral degenerations | ||
| 341, 341.1 | Other demyelinating diseases of central nervous system | ||
| 343, 343.1, 343.2, 343.3, 343.4, 343.8, 343.9 | Infantile cerebral palsy | Yes | |
| 345-345.9 | Epilepsy | Yes | Yes |
| 348, 348.3 | Other conditions of brain | ||
| 359, 359.1 | Muscular dystrophies and other myopathies | ||
| 369-369.9 | Other visual impairment/eye disorders | Yes | |
| 389.9-389.9 | Deafness in both ears | Yes | |
| 398, 398.9, 398.90 | Other rheumatic heart disease | ||
| 401-405.99, 437.2, 440.1, 642-642.7, 760.0, 348.2, 365.04, 416.0, 572.3, 416.8, 415.0, 796.2 | Hypertension | Yes | |
| 410-414.99 | Ischemic heart disease | Yes | |
| 424, 424.1, 424.3 | Other diseases of endocardium | Yes | Yes |
| 425, 425.1, 425.3 | Cardiomyopathy | Yes | Yes |
| 446, 446.1 | Polyarteritis nodosa and allied conditions | ||
| 493, 493.1, 493.2, 493.9 | Asthma | Yes | |
| 571, 571.4, 571.6 | Chronic liver disease and cirrhosis | ||
| 572, 572.2 | Liver Abscess and sequelae of chronic liver disease | ||
| 577, 577.1 | Diseases of pancreas | ||
| 580, 580.4 | Acute glomerulonephritis | ||
| 581, 581.1, 581.2, 581.3, 581.9 | Nephrotic syndrome | ||
| 582, 582.1, 582.2, 582.4, 582.9 | Chronic glomerulonephritis | ||
| 583, 583.1, 583.2, 583.4, 583.8, 583.9 | Nephritis and nephropathy, not specified as acute or chronic | ||
| 588, 588.1 | Renal osteodystrophy | ||
| 588.8, 588.9, 593.9 | Kidney disorders | Yes | |
| 686, 686.1 | Other local infections of skin and subcutaneous tissue | ||
| 695 | Erythematous conditions | ||
| 714, 714.3 | Rheumatoid arthritis and other inflammatory polyarthropathies | ||
| 715.9-715.99, 716.0 | Osteoarthritis/Other arthropathies | Yes | |
| 728, 728.3 | Disorders of muscle, ligament, and fascia | ||
| 730.2, 733.90, 733.99 | Osteomyelitis/Bone disorders | Yes | |
| 732, 732.1, 732.2 | Osteochondropathies | ||
| 715-719.9, 723-723.9, 724-724.9, 725-725.9, 730-730.9, 755-756.3, V48-V49.67, V53.7, V53.8, V54-V54.9 | Other orthopedic impairments of back and other orthopedic impairments | Yes | |
| 740, 740.1, 740.2 | Anencephalus and similar anomalies | ||
| 741, 741.9 | Spina bifida | ||
| 742, 742.1, 742.3, 742.4, 742.8 | Other congenital anomalies of nervous system | ||
| 745 | Bulbus cordia anomalies and anomalies of cardiac | ||
| 746, 746.01, 746.02, 746.1, 746.2, 746.3, 746.4, 746.5, 746.6, 746.7, 746.8, 746.83 | Other congenital anomalies of heart | check | |
| 747, 747.1, 747.21, 747.3, 747.4, 747.41, 747.42 | Other congenital anomalies of circulatory system | ||
| 749, 749.00, 749.2, 749.20, 749.21, 749.22 | Cleft palate and cleft lip | ||
| 750, 750.3 | Other congenital anomalies of upper alimentary tract | ||
| 753 | Congenital anomalies of urinary system | ||
| 755, 755.01, 755.02, 755.2, 755.21, 755.22, 755.23, 755.24, 755.25, 755.26, 755.27, 755.28, 755.29, 755.3, 755.31, 755.32, 755.33, 755.34, 755.35, 755.36, 755.37, 755.38, 755.39, 755.4, 755.5, 755.51, 755.52, 755.53, 755.54, 755.55 | Other congenital anomalies of limbs | Yes | |
| TABLE A-3. Diagnosis Codes Associated with Potentially Disabling Psychiatric Conditions among Adults | |||
|---|---|---|---|
| ICD-9-CM Diagnosis Codes |
Category Label | Per Se Disabling? |
Activity-Limiting Condition? (LaPlante, 1989) |
| 294, 294.8- 294.9 | Other Organic Psychotic Conditions | ||
| 295, 295.02, 295.12, 295.22, 295.32, 295.42, 295.52, 295.62, 295.72, 295.82, 295.92 | Schizophrenic Disorders | ||
| 296, 296.03- 296.04, 296.13-296.14, 296.23-296.24, 296.33-296.34, 296.43-296.44, 296.53-296.54, 296.63-296.64 | Affective Psychoses/Depressive Disorder | ||
| 298-298.9 | Other Nonorganic Psychoses | ||
| 300.01-300.15, 300.21-300.22, 300.3, 300.6- 300.81 | Neurotic Disorders | ||
| 307.1 | Anorexia Nervosa | ||
| 309.81 | Adjustment Reaction | ||
| 312-312.39 | Disturbance of Conduct | ||
| TABLE A-4. Diagnosis Codes Associated with Potentially Disabling Psychiatric Conditions among Children | |||
|---|---|---|---|
| ICD-9-CM Diagnosis Codes |
Category Label | Per Se Disabling? |
Activity-Limiting Condition? (LaPlante, 1989) |
| 294, 294.8- 294.9 | Other Organic Psychotic Conditions | Yes | |
| 295, 295.02, 295.12, 295.22, 295.32, 295.42, 295.52, 295.62, 295.72, 295.82, 295.92 | Schizophrenic Disorders | Yes | |
| 296, 296.03- 296.04, 296.13-296.14, 296.23-296.24, 296.33-296.34, 296.43-296.44, 296.53-296.54, 296.63-296.64 | Affective Psychoses/Depressive Disorder | Yes | |
| 298-298.9 | Other Nonorganic Psychoses | Yes | |
| 299-299.91 | Psychoses w/Origin Spec to Childhood | ||
| 300.01-300.15, 300.21-300.22, 300.3, 300.6- 300.81 | Neurotic Disorders | Yes | |
| 307.1 | Anorexia Nervosa | Yes | |
| 309 | Adjustment Reaction (excluding 309.81) | Yes | |
| 309.81 | Adjustment Reaction | ||
| 312.8-312.9 | Disturbance of Conduct | Yes | |
| 313-313.89 | Disturbance of Emotions Spec to Childhood | ||
| 314-314.01 | Hyperkinetic Syndrome of Childhood | ||
| 317-319, V62.89 | Mental Retardation | Yes | |
APPENDIX B: Characteristics and Service Utilization By Plan Type
| TABLE B-1a. Demographic, Employment, and Case Mix Characteristics of Disabled People Age 18-64, by Employer and Plan Type, 1995 | |||||||
|---|---|---|---|---|---|---|---|
| Measure | Employer A | Employer B | |||||
| Indemnity N=40676 |
POS N=29526 |
Switched Plan Type N=3811 |
Indemnity N=25060 |
PPO N=209 |
HMO N=23135 |
Switched Plan Type N=1794 |
|
| Mean age | 50.76 | 46.59 | 48.18* | 48.32 | 48.55 | 42.60* | 43.07 |
| % Female | 55.84 | 52.68* | 54.19 | 56.08 | 53.59 | 57.82* | 60.37* |
| % Male | 44.16 | 47.32* | 45.81 | 43.92 | 46.41 | 42.18* | 39.63* |
| % of disabled who are employed | 54.60 | 60.32* | 58.36* | 64.89 | 71.77 | 64.50 | 68.00* |
| % of disabled who are spouses | 40.25 | 33.91* | 36.63* | 29.73 | 17.70* | 30.31 | 26.98 |
| % of disabled who are children or other dependents | 5.15 | 5.77* | 5.01 | 5.38 | 10.53* | 5.19 | 5.02 |
| * Significantly different from indemnity plan at p=0.05 level (Bonferroni t-test). | |||||||
| TABLE B-1b. Case Mix of Disabled People Age 18-64, by Employer and Plan Type, 1995 | |||||||
|---|---|---|---|---|---|---|---|
| Measure | Employer A | Employer B | |||||
| Indemnity N=40676 |
POS N=29526 |
Switched Plan Type N=3811 |
Indemnity N=25060 |
PPO N=209 |
HMO N=23135 |
Switched Plan Type N=1794 |
|
| Mean number of unique diagnoses on inpatient & outpatient claims submitted during the year | 9.10 | 9.54* | 8.46* | 8.33 | 8.09 | 8.49* | 9.07* |
| % of disabled persons who had complications identified on inpatient claims | 0.98 | 1.05 | 0.71 | 0.56 | 0.00 | 0.65 | 0.33 |
| Mean number of unique major diagnostic categories on inpatient & outpatient claims during the year | 4.12 | 4.20 | 3.84 | 4.37 | 4.22 | 3.94* | 4.65 |
| % of disabled with a condition in: | |||||||
| MDC 1: Diseases and disorders of the nervous system | 24.10 | 21.73* | 18.60* | 22.18 | 24.40 | 17.73* | 20.29 |
| MDC 2: Diseases and disorders of the eye | 16.34 | 12.50* | 12.67* | 19.47 | 16.27 | 8.56* | 15.27* |
| MDC 3: Diseases and disorders of the ear, nose, mouth, and throat | 32.69 | 34.26* | 34.48 | 33.92 | 38.76 | 33.24 | 42.14* |
| MDC 4: Diseases and disorders of the respiratory system | 27.96 | 31.70* | 24.72* | 32.54 | 31.58 | 29.11* | 31.61 |
| MDC 5: Diseases and disorders of the circulatory system | 44.54 | 43.67 | 38.57* | 42.81 | 39.71 | 31.80* | 35.12* |
| MDC 6: Diseases and disorders of the digestive system | 25.47 | 25.78 | 25.19 | 27.12 | 19.14* | 22.26* | 26.98 |
| MDC 7: Diseases and disorders of the hepatobiliary system and pancreas | 4.03 | 4.14 | 3.73 | 5.11 | 2.39 | 3.98* | 4.96 |
| MDC 8: Diseases and disorders of the musculoskeletal system and connective tissue | 45.90 | 48.62* | 42.14* | 50.61 | 48.33 | 41.44* | 50.33 |
| MDC 9: Diseases and disorders of the skin, subctaneous tissue, and breast | 39.61 | 35.07* | 35.24* | 45.31 | 39.23 | 36.54* | 42.47 |
| MDC 10: Endocrine, nutritional and metabolic diseases and disorders | 26.21 | 24.13* | 24.38* | 32.24 | 25.84 | 22.84* | 29.26* |
| MDC 11: Diseases and disorders of the kidney and urinary tract | 12.87 | 12.11* | 11.76 | 15.08 | 13.88 | 11.48* | 14.38 |
| MDC 12: Diseases and disorders of the male reproductive system | 6.83 | 6.47 | 5.69* | 7.23 | 6.22 | 4.82* | 5.46* |
| MDC 13: Diseases and disorders of the female reproductive system | 17.85 | 14.99* | 15.32* | 21.26 | 11.96* | 19.01* | 24.69* |
| MDC 14: Pregnancy, childbirth, and the puerperium | 1.35 | 2.68* | 1.73 | 2.09 | 0.96 | 4.21* | 3.29* |
| MDC 15: Newborns and other neonates with conditions originating in the perinatal period | 0.41 | 0.53* | 0.29 | 0.40 | 0.00 | 0.65* | 0.78 |
| MDC 16: Diseases and disorders of the blood, blood forming organs, and immunological disorders | 6.31 | 6.56 | 5.30* | 12.26 | 7.18 | 8.29* | 11.98 |
| MDC 17: Myeloproliferative diseases and disorders, poorly differentiated neoplasm | 5.34 | 4.95 | 3.91* | 3.77 | 3.35 | 3.25* | 3.51 |
| MDC 23: Factors influencing health status and other contacts with health services | 45.50 | 58.73* | 53.82* | 23.73 | 56.94* | 55.49* | 53.01* |
| MDC 24: Multiple significant trauma | 0.04 | 0.04 | 0.03 | 0.03 | 0.00 | 0.07 | 0.00 |
| Mean number of unique Psychiatric Diagnostic Categories (PDGs) during the year | 0.29 | 0.32* | 0.24 | 0.34 | 0.23 | 0.38* | 0.46* |
| % of disabled with a condition in: | |||||||
| PDG 1: Organic mental disorders | 1.11 | 1.15 | 0.81 | 1.35 | 0.48 | 0.87* | 0.95 |
| PDG 2: Alcohol use disorders | 1.18 | 1.54* | 1.00 | 1.21 | 0.48 | 2.06* | 1.67 |
| PDG 3: Opioid and other substance use disorders | 1.22 | 1.84* | 1.29 | 0.86 | 1.44 | 2.33* | 1.34* |
| PDG 4: Schizophrenia disorders | 0.42 | 0.27* | 0.21 | 0.37 | 0.00 | 0.26* | 0.22 |
| PDG 5: Other psychotic disorders (NEC) (NOS) | 0.83 | 0.62* | 0.50 | 0.69 | 0.48 | 0.67 | 0.61 |
| PDG 6: Bipolar disorders | 0.90 | 0.73* | 0.87 | 1.00 | 0.48 | 0.82 | 1.00 |
| PDG 7: Major depressions | 4.85 | 5.25* | 4.62 | 4.95 | 3.83 | 4.86 | 7.30* |
| PDG 8: Other specific and atypical affective disorders | 2.76 | 2.97 | 2.34 | 4.27 | 3.83 | 3.48* | 5.96 |
| PDG 9: Post traumatic stress disorders | 0.38 | 0.51* | 0.26 | 0.91 | 0.00 | 0.85 | 1.23 |
| PDG 10: Anxiety disorders | 7.15 | 7.39 | 5.06* | 6.25 | 3.83 | 7.67* | 8.36* |
| PDG 11: Personality disorders | 0.54 | 0.39* | 0.13* | 0.35 | 0.48 | 0.49* | 0.45 |
| PDG 12: Impulse control, adjustment disorders, and other mental disorders | 7.26 | 8.84* | 7.27* | 8.18 | 6.22 | 10.06* | 12.82* |
| % with adult activity-limiting condition | 46.16 | 57.83* | 35.71* | 46.80 | 42.11 | 34.59* | 34.56* |
| * Significantly different from indemnity plan at p=0.05 level (Bonferroni t-test). | |||||||
| TABLE B-1c. Utilization of Health Care Services Among People Age 18-64 with Disabilities, by Employer and Plan Type, 1995 | |||||||
|---|---|---|---|---|---|---|---|
| Measure | Employer A | Employer B | |||||
| Indemnity N=40676 |
POS N=29526 |
Switched Plan Type N=3811 |
Indemnity N=25060 |
PPO N=209 |
HMO N=23135 |
Switched Plan Type N=1794 |
|
| INPATIENT HOSPITAL CARE | |||||||
| % hospital during year | 16.73 | 17.72* | 12.91* | 13.09 | 9.57 | 11.96* | 10.20* |
| % hospitalized more than once during the year | 4.50 | 4.74 | 2.99* | 3.91 | 2.87 | 2.69* | 3.51 |
| % readmitted to hospital within 30 days of discharge from previous admission | 2.03 | 2.00 | 1.21* | 1.79 | 1.91 | 1.10* | 1.62 |
| Mean number of hospital admissions during the year, for hospital users | 1.43 | 1.43 | 1.40 | 1.59 | 1.40 | 1.39* | 1.72 |
| % discharged dead, among total admissions (Employer A: Indemnity N=9743, POS N=7453, Switcher N=684, Employer B: Indemnity N=5188, PPO N=28, HMO N=3837, Switcher N=313) | 2.19 | 1.05* | 0.88* | 1.04 | 3.57 | 1.20 | 0.96 |
| % discharged to another facility, among total admissions | 2.89 | 1.53* | 2.19 | 2.24 | 7.14 | 2.79 | 4.79* |
| Mean LOSSCALE, among total admissions | 117.36 | 110.49* | 103.93* | 113.96 | 138.93 | 106.90* | 105.69 |
| Mean RDSCALE, among total admissions | 129.76 | 124.13 | 106.87* | 113.62 | 147.93 | 111.37 | 99.89 |
| Mean inpatient payments for the year, among inpatient (Employer A: Indemnity N=6804, POS N=5232, Switcher N=492, Employer B: Indemnity N=3281, PPO N=20, HMO N=2766, Switcher N=183) | $18,031.21 | $14,588.23* | $14,930.62* | $19,108.47 | $32,418.10 | $11,095.31* | $14,184.83 |
| Median outpatient expenditures during year | $1,288.00 | $1,303.00 | $934.00 | $1,600.00 | $900.00 | $859.00 | $1,157.00 |
| % using any therapies | 6.52 | 21.65* | 7.22 | 18.48 | 30.14* | 17.26* | 18.56 |
| % using any home health care | 8.66 | 8.38* | 5.38* | 4.27 | 8.13 | 7.69* | 5.57 |
| PRESCRIPTION DRUGS | |||||||
| Mean number of prescription drug claims in year among users | 18.54 | 13.94* | 12.20* | ||||
| Median number of prescription drug claims in year among users | 13.00 | 9.00* | 9.00* | ||||
| Mean drug expenditures during year among drug users | 776.85 | 667.93* | 683.54* | ||||
| Median drug expenditures during year among users | 432.67 | 377.14- | 389.68* | ||||
| * Significantly different from indemnity plan at p=0.05 level (Bonferroni t-test). | |||||||
| TABLE B-2a. Demographic, Employment, and Case Mix Characteristics of Disabled People Under Age 18, by Employer and Plan Type, 1995 | |||||||
|---|---|---|---|---|---|---|---|
| Measure | Employer A | Employer B | |||||
| Indemnity N=5321 |
POS N=6730 |
Switched Plan Type N=635 |
Indemnity N=4036 |
PPO N=46 |
HMO N=6796 |
Switched Plan Type N=418 |
|
| Mean age | 10.04 | 9.57* | 9.65 | 9.61 | 9.24 | 8.80* | 8.95 |
| % Female | 41.05 | 40.46 | 39.84 | 43.81 | 43.48 | 41.91 | 43.30 |
| % Male | 58.95 | 59.54 | 60.16 | 56.19 | 56.52 | 58.09 | 56.70 |
| * Significantly different from indemnity plan at p=0.05 level (Bonferroni t-test). | |||||||
| TABLE B-2b. Case Mix of Disabled People Under Age 18, by Employer and Plan Type, 1995 | |||||||
|---|---|---|---|---|---|---|---|
| Measure | Employer A | Employer B | |||||
| Indemnity N=5321 |
POS N=6730 |
Switched Plan Type N=635 |
Indemnity N=4036 |
PPO N=46 |
HMO N=6796 |
Switched Plan Type N=418 |
|
| Mean number of unique diagnoses on inpatient & outpatient claims submitted during the year | 6.68 | 7.41* | 6.68* | 6.26 | 6.07 | 7.02* | 7.23* |
| % of disabled persons who had complications identified on inpatient claims | 0.41 | 0.24 | 0.16* | 0.10 | 0.00 | 0.25 | 0.00 |
| Mean number of unique major diagnostic categories on inpatient & outpatient claims during the year | 3.28 | 3.74* | 3.37 | 3.60 | 3.52 | 3.75* | 4.03* |
| % of disabled with a condition in: | |||||||
| MDC 1: Diseases and disorders of the nervous system | 16.73 | 12.72* | 10.08* | 16.23 | 17.39 | 11.30* | 14.11 |
| MDC 2: Diseases and disorders of the eye | 10.92 | 10.24 | 11.50 | 12.93 | 4.35 | 9.73* | 17.22* |
| MDC 3: Diseases and disorders of the ear, nose, mouth, and throat | 64.41 | 64.78 | 67.56 | 66.67 | 58.70 | 63.68* | 71.77 |
| MDC 4: Diseases and disorders of the respiratory system | 35.22 | 43.31* | 34.65 | 41.11 | 28.26 | 39.61 | 40.19 |
| MDC 5: Diseases and disorders of the circulatory system | 8.18 | 7.83 | 8.19 | 7.83 | 13.04 | 6.33* | 7.18 |
| MDC 6: Diseases and disorders of the digestive system | 14.64 | 15.54 | 14.02 | 16.03 | 10.87 | 14.96 | 17.46 |
| MDC 7: Diseases and disorders of the hepatobiliary system and pancreas | 1.18 | 1.22 | 0.47 | 1.26 | 0.00 | 1.19 | 1.44 |
| MDC 8: Diseases and disorders of the musculoskeletal system and connective tissue | 29.88 | 29.20 | 23.46* | 33.08 | 28.26 | 26.72* | 26.56* |
| MDC 9: Diseases and disorders of the skin, subctaneous tissue, and breast | 32.96 | 31.81 | 31.18 | 35.78 | 32.61 | 34.03 | 34.45 |
| MDC 10: Endocrine, nutritional and metabolic diseases and disorders | 8.10 | 9.63* | 5.35 | 12.56 | 17.39 | 11.09 | 7.42* |
| MDC 11: Diseases and disorders of the kidney and urinary tract | 7.18 | 7.13 | 6.61 | 7.85 | 17.39 | 7.00 | 9.57 |
| MDC 12: Diseases and disorders of the male reproductive system | 1.45 | 1.47 | 1.26 | 1.44 | 2.17 | 1.94 | 1.91 |
| MDC 13: Diseases and disorders of the female reproductive system | 3.21 | 3.06 | 2.99 | 3.17 | 2.17 | 2.46 | 4.07 |
| MDC 14: Pregnancy, childbirth, and the puerperium | 0.71 | 0.80 | 0.31 | 0.22 | 0.00 | 0.50 | 0.48 |
| MDC 15: Newborns and other neonates with conditions originating in the perinatal period | 4.12 | 5.63* | 2.99 | 5.13 | 10.87 | 4.87 | 3.35 |
| MDC 16: Diseases and disorders of the blood, blood forming organs, and immunological disorders | 4.77 | 4.78 | 4.88 | 7.23 | 10.87 | 6.52 | 8.85 |
| MDC 17: Myeloproliferative diseases and disorders, poorly differentiated neoplasm | 0.90 | 1.25 | 0.94 | 0.84 | 0.00 | 0.85 | 0.48 |
| MDC 18: Infections and parasitic diseases, systemic or unspecified sites | 14.38 | 16.15* | 13.07 | 20.54 | 17.39 | 18.07* | 24.40 |
| MDC 19: Mental diseases and disorders | 29.98 | 32.63* | 28.03 | 26.49 | 15.22 | 23.69* | 28.47 |
| MDC 20: Alcohol/drug use and alcohol/drug induced organic mental disorders | 1.15 | 1.29 | 0.79 | 0.87 | 0.00 | 1.06 | 1.20 |
| MDC 21: Injuries, poisonings, and toxic effects of drugs | 12.44 | 14.47* | 13.23 | 15.71 | 13.04 | 15.66 | 16.27 |
| MDC 22: Burns | 0.62 | 0.55 | 0.31 | 0.47 | 0.00 | 0.74 | 0.96 |
| MDC 23: Factors influencing health status and other contacts with health services | 24.81 | 58.89* | 54.59* | 26.36 | 52.17* | 72.57* | 64.83* |
| MDC 24: Multiple significant trauma | 0.06 | 0.07 | 0.16 | 0.00 | 0.00 | 0.07 | 0.00 |
| Mean number of unique Psychiatric Diagnostic Categories (PDGs) during the year | 0.41 | 0.42 | 0.36 | 0.31 | 0.20 | 0.30 | 0.36 |
| % of disabled with a condition in: | |||||||
| PDG 1: Organic mental disorders | 0.92 | 0.56 | 0.63 | 0.69 | 0.00 | 0.53 | 0.72 |
| PDG 2: Alcohol use disorders | 0.75 | 0.76 | 0.16 | 0.37 | 0.00 | 0.57 | 0.24 |
| PDG 3: Opioid and other substance use disorders | 1.22 | 1.23 | 0.94 | 0.52 | 0.00 | 0.97 | 0.96 |
| PDG 4: Schizophrenia disorders | 0.11 | 0.03 | 0.00 | 0.05 | 0.00 | 0.04 | 0.00 |
| PDG 5: Other psychotic disorders (NEC) (NOS) | 0.92 | 0.73 | 1.10 | 0.67 | 0.00 | 0.53 | 1.20 |
| PDG 6: Bipolar disorders | 0.73 | 0.40* | 0.79 | 0.50 | 0.00 | 0.19 | 0.24 |
| PDG 7: Major depressions | 3.63 | 4.06 | 2.36 | 2.16 | 2.17 | 1.75 | 2.39 |
| PDG 8: Other specific and atypical affective disorders | 2.57 | 2.01 | 3.31 | 2.30 | 0.00 | 1.72 | 3.11 |
| PDG 9: Post traumatic stress disorders | 0.71 | 0.76 | 0.00 | 0.37 | 0.00 | 0.72* | 0.96 |
| PDG 10: Anxiety disorders | 4.40 | 3.25* | 1.73* | 2.85 | 6.52 | 2.78 | 1.20 |
| PDG 11: Personality disorders | 0.21 | 0.27 | 0.00 | 0.20 | 0.00 | 0.19 | 0.00 |
| PDG 12: Impulse control, adjustment disorders, and other mental disorders | 24.86 | 27.83* | 25.04 | 19.40 | 10.87 | 18.81 | 22.01 |
| % with adult activity-limiting condition | 38.43 | 51.43* | 29.13* | 44.47 | 34.78 | 41.29* | 39.23 |
| * Significantly different from indemnity plan at p=0.05 level (Bonferroni t-test). | |||||||
| TABLE B-2c. Utilization of Health Care Services Among People Under Age 18 with Disabilities, by Employer and Plan Type, 1995 | |||||||
|---|---|---|---|---|---|---|---|
| Measure | Employer A | Employer B | |||||
| Indemnity N=5321 |
POS N=6730 |
Switched Plan Type N=635 |
Indemnity N=4036 |
PPO N=46 |
HMO N=6796 |
Switched Plan Type N=418 |
|
| INPATIENT HOSPITAL CARE | |||||||
| % hospital during year | 10.64 | 11.58 | 7.56 | 9.24 | 13.04 | 7.28 | 5.74 |
| % hospitalized more than once during the year | 2.42 | 2.41 | 2.20 | 1.96 | 4.35 | 1.47 | 1.20 |
| % readmitted to hospital within 30 days of discharge from previous admission | 1.20 | 1.07 | 0.63 | 0.42 | 0.00 | 0.68 | 0.24 |
| Mean number of hospital admissions during the year, for hospital users (Employer A: Indemnity N=566, POS N=779, Switcher N=48, Employer B: Indemnity N=373, PPO N=6, HMO N=495, Switcher N=24) | 1.41 | 1.36 | 1.31 | 1.33 | 1.50 | 1.38 | 1.50 |
| % discharged dead, among total admissions (Employer A: Indemnity N=796, POS N=1055, Switcher N=63, Employer B: Indemnity N=496, PPO N=9, HMO N=672, Switcher N=36) | 0.00 | 0.38 | 1.59 | 0.00 | 0.00 | 0.30 | 0.00 |
| % discharged to another facility, among total admissions (Employer A: Indemnity N=796, POS N=1055, Switcher N=63, Employer B: Indemnity N=496, PPO N=9, HMO N=672, Switcher N=36) | 1.76 | 1.04 | 0.00 | 0.20 | 11.11* | 0.74 | 0.00 |
| Mean LOSCALE, among total admissions (Employer A: Indemnity N=796, POS N=1055, Switcher N=63, Employer B: Indemnity N=496, PPO N=9, HMO N=672, Switcher N=36) | 136.64 | 143.32 | 192.86 | 132.35 | 108.00 | 137.24 | 124.44* |
| Mean RDSCALE, among total admissions (Employer A: Indemnity N=796, POS N=1055, Switcher N=63, Employer B: Indemnity N=496, PPO N=9, HMO N=672, Switcher N=36) | 102.34 | 102.22 | 112.62 | 94.37 | 79.00 | 125.56 | 65.00 |
| Mean inpatient payments for the year, among inpatient users (Employer A: Indemnity N=566, POS N=779, Switcher N=48, Employer B: Indemnity N=373, PPO N=6, HMO N=495, Switcher N=24) | $14,447.90 | $13,472.62 | $18,203.75 | $11,649.93 | $9,386.50 | $16,435.92 | $6,346.42 |
| Median inpatient payments for the year, among inpatient users (Employer A: Indemnity N=566, POS N=779, Switcher N=48, Employer B: Indemnity N=373, PPO N=6, HMO N=495, Switcher N=24) | $5,031.50 | $4,460.00 | $5,911.50 | $4,315.00 | $7,075.50 | $4,436.00 | $4,015.00 |
| OUTPATIENT CARE | |||||||
| Mean number of outpatient claims during year | 19.41 | 23.79* | 19.17 | 21.03 | 15.24 | 22.05 | 21.57 |
| Mean number of outpatient claim-days during year | 11.14 | 11.84* | 10.02 | 10.94 | 6.91* | 10.07* | 11.20 |
| Mean outpatient expenditures during year | $1,759.05 | $1,486.92* | $1,446.13 | $1,695.74 | $909.89 | $1,132.06 | $1,344.20 |
| Median outpatient expenditures during year | %645.00 | $649.00 | $529.00 | $774.50 | $549.50 | $586.00 | $707.50 |
| % using any therapies | 8.25 | 11.63* | 5.83 | 10.68 | 6.52 | 7.53* | 5.98* |
| % using any home health care | 6.37 | 8.08* | 4.72 | 4.31 | 6.52 | 10.33* | 6.46 |
| PRESCRIPTION DRUGS | |||||||
| Mean number of prescription drug claims in year among users | 8.31 | 5.73* | 5.55* | ||||
| Median number of prescription drug claims in year among users | 6.00 | 4.00* | 3.00* | ||||
| Mean drug expenditures during year among drug users | $270.42 | $233.53 | $298.96 | ||||
| Median drug expenditures during year among users | $104.60 | $95.38* | $81.15 | ||||
| * Significantly different from indemnity plan at p=0.05 level (Bonferroni t-test). | |||||||
| TABLE B-3a. Demographic, Employment, and Case Mix Characteristics of Disabled Early Retirees, by Employer and Plan Type, 1995 | |||||||
|---|---|---|---|---|---|---|---|
| Measure | Employer A | Employer B | |||||
| Indemnity N=6621 |
POS N=3390 |
Switched Plan Type N=510 |
Indemnity N=2859 |
PPO N=62 |
HMO N=822 |
Switched Plan Type N=73 |
|
| Mean age | 60.28 | 59.04* | 59.80 | 58.79 | 62.94* | 58.70 | 56.25* |
| % Female | 27.99 | 27.14 | 29.22 | 37.29 | 38.71 | 42.58* | 49.32 |
| % Male | 72.01 | 72.86 | 70.78 | 62.71 | 61.29 | 57.42 | 50.68 |
| * Significantly different from indemnity plan at p=0.05 level (Bonferroni t-test). | |||||||
| TABLE B-3b. Case Mix of Disabled Early Retirees, by Employer and Plan Type, 1995 | |||||||
|---|---|---|---|---|---|---|---|
| Measure | Employer A | Employer B | |||||
| Indemnity N=6621 |
POS N=3390 |
Switched Plan Type N=510 |
Indemnity N=2859 |
PPO N=62 |
HMO N=822 |
Switched Plan Type N=73 |
|
| Mean number of unique diagnoses on inpatient & outpatient claims submitted during the year | 9.85 | 10.77* | 90.5* | 9.68 | 10.16 | 10.37* | 9.84 |
| % of disabled persons who had complications identified on inpatient claims | 1.19 | 1.30 | 0.78 | 0.66 | 0.00 | 1.09 | 0.00 |
| Mean number of unique major diagnostic categories on inpatient & outpatient claims during the year | 4.32 | 4.47* | 3.87* | 4.83 | 4.65 | 4.58 | 4.82 |
| % of disabled with a condition in: | |||||||
| MDC 1: Diseases and disorders of the nervous system | 24.88 | 21.86* | 18.43* | 25.18 | 16.13 | 21.05 | 24.66 |
| MDC 2: Diseases and disorders of the eye | 22.53 | 18.41* | 17.06* | 28.26 | 32.26 | 16.30* | 21.92 |
| MDC 3: Diseases and disorders of the ear, nose, mouth, and throat | 27.87 | 28.11 | 26.67 | 29.45 | 35.48 | 25.06 | 45.21* |
| MDC 4: Diseases and disorders of the respiratory system | 30.95 | 34.34* | 25.49* | 36.76 | 38.71 | 32.97 | 34.25 |
| MDC 5: Diseases and disorders of the circulatory system | 62.57 | 65.46* | 56.86* | 64.85 | 61.29 | 58.03* | 65.75 |
| MDC 6: Diseases and disorders of the digestive system | 28.61 | 29.59 | 26.27 | 31.69 | 20.97 | 27.98 | 39.73 |
| MDC 7: Diseases and disorders of the hepatobiliary system and pancreas | 4.91 | 4.84 | 4.51 | 6.51 | 1.61 | 4.87 | 2.74 |
| MDC 8: Diseases and disorders of the musculoskeletal system and connective tissue | 42.94 | 45.07 | 41.18 | 50.75 | 48.39 | 44.53* | 47.95 |
| MDC 9: Diseases and disorders of the skin, subctaneous tissue, and breast | 35.83 | 34.04 | 31.76 | 47.18 | 33.87 | 41.61* | 41.10 |
| MDC 10: Endocrine, nutritional and metabolic diseases and disorders | 33.20 | 34.93 | 34.51 | 44.67 | 40.32 | 41.61 | 32.88 |
| MDC 11: Diseases and disorders of the kidney and urinary tract | 13.90 | 13.07 | 12.16 | 17.91 | 14.52 | 15.69 | 12.33 |
| MDC 12: Diseases and disorders of the male reproductive system | 16.37 | 17.40 | 14.31 | 15.88 | 12.90 | 13.26 | 10.96 |
| MDC 13: Diseases and disorders of the female reproductive system | 7.60 | 5.10* | 4.71* | 11.79 | 3.23 | 7.66* | 12.33 |
| MDC 14: Pregnancy, childbirth, and the puerperium | 0.17 | 0.29 | 0.00 | 0.24 | 0.00 | 0.12 | 0.00 |
| MDC 15: Newborns and other neonates with conditions originating in the perinatal period | 0.29 | 0.24 | 0.20 | 0.35 | 0.00 | 0.61 | 0.00 |
| MDC 16: Diseases and disorders of the blood, blood forming organs, and immunological disorders | 7.69 | 7.96 | 5.69 | 15.36 | 11.29 | 12.77 | 9.59 |
| MDC 17: Myeloproliferative diseases and disorders, poorly differentiated neoplasm | 7.16 | 7.08 | 3.53* | 4.93 | 4.84 | 6.57 | 4.11 |
| MDC 18: Infections and parasitic diseases, systemic or unspecified sites | 3.66 | 3.07 | 2.16 | 5.67 | 4.84 | 6.57 | 4.11 |
| MDC 19: Mental diseases and disorders | 10.81 | 10.18 | 7.65 | 16.51 | 8.06 | 14.96 | 16.44 |
| MDC 20: Alcohol/drug use and alcohol/drug induced organic mental disorders | 0.66 | 1.00 | 0.20 | 1.50 | 0.00 | 1.58 | 2.74 |
| MDC 21: Injuries, poisonings, and toxic effects of drugs | 6.33 | 7.88* | 5.49 | 9.16 | 4.84 | 8.64 | 12.33 |
| MDC 22: Burns | 0.20 | 0.15 | 0.20 | 0.24 | 1.61 | 0.36 | 0.00 |
| MDC 23: Factors influencing health status and other contacts with health services | 43.04 | 57.32* | 48.24 | 17.80 | 69.35* | 56.20* | 42.47* |
| MDC 24: Multiple significant trauma | 0.03 | 0.06 | 0.00 | 0.00 | 0.00 | 0.12 | 0.00 |
| Mean number of unique Psychiatric Diagnostic Categories (PDGs) during the year | 0.19 | 0.20 | 0.12* | 0.26 | 0.13 | 0.27 | 0.27 |
| % of disabled with a condition in: | |||||||
| PDG 1: Organic mental disorders | 1.28 | 1.45 | 1.18 | 2.27 | 0.00 | 1.34 | 0.00 |
| PDG 2: Alcohol use disorders | 0.83 | 1.30 | 0.20 | 1.12 | 0.00 | 1.82 | 2.74 |
| PDG 3: Opioid and other substance use disorders | 0.85 | 1.50* | 0.00 | 0.56 | 0.00 | 2.19* | 1.37 |
| PDG 4: Schizophrenia disorders | 0.50 | 0.32 | 0.59 | 0.59 | 0.00 | 0.36 | 0.00 |
| PDG 5: Other psychotic disorders (NEC) (NOS) | 0.86 | 0.50 | 0.98 | 1.33 | 0.00 | 0.73 | 0.00 |
| PDG 6: Bipolar disorders | 0.59 | 0.53 | 0.59 | 1.36 | 0.00 | 1.22 | 1.37 |
| PDG 7: Major depressions | 2.79 | 3.24 | 2.16 | 5.35 | 3.23 | 3.89 | 5.48 |
| PDG 8: Other specific and atypical affective disorders | 1.51 | 1.42 | 0.59 | 2.80 | 3.23 | 2.19 | 5.48 |
| PDG 9: Post traumatic stress disorders | 0.14 | 0.12 | 0.00 | 0.42 | 0.00 | 0.49 | 0.00 |
| PDG 10: Anxiety disorders | 4.55 | 3.54* | 1.76* | 3.92 | 4.84 | 5.60 | 5.48 |
| PDG 11: Personality disorders | 0.36 | 0.24 | 0.20 | 0.38 | 0.00 | 0.24 | 0.00 |
| PDG 12: Impulse control, adjustment disorders, and other mental disorders | 4.47 | 5.66* | 3.73 | 6.05 | 1.61 | 7.06 | 5.48 |
| % with childhood activity-limiting condition | 62.00 | 74.22* | 53.53* | 64.32 | 53.23 | 53.65* | 47.95* |
| * Significantly different from indemnity plan at p=0.05 level (Bonferroni t-test). | |||||||
| TABLE B-3c. Utilization of Health Care Services Among Early Retirees with Disabilities, by Employer and Plan Type, 1995 | |||||||
|---|---|---|---|---|---|---|---|
| Measure | Employer A | Employer B | |||||
| Indemnity N=6621 |
POS N=3390 |
Switched Plan Type N=510 |
Indemnity N=2859 |
PPO N=62 |
HMO N=822 |
Switched Plan Type N=73 |
|
| INPATIENT HOSPITAL CARE | |||||||
| % hospital during year | 20.80 | 22.36 | 15.69* | 18.33 | 9.68 | 18.13 | 8.22 |
| % hospitalized more than once during the year | 6.33 | 6.67 | 2.55* | 6.02 | 4.84 | 6.33 | 4.11 |
| % readmitted to hospital within 30 days of discharge from previous admission | 2.98 | 2.83 | 0.98* | 3.25 | 3.23 | 3.41 | 1.37 |
| Mean number of hospital admissions during the year, for hospital users (Employer A: Indemnity N=1377, POS N=758, Switcher N=80; Employer B: Indemnity N=524, PPO N=6, HMO N=149, Switcher N=6) | 1.48 | 1.47 | 1.18* | 1.70 | 1.67 | 1.75 | 1.83 |
| % discharged dead, among total admissions | 3.06 | 1.62* | 1.06 | 1.59 | 10.00 | 1.92 | 0.00 |
| % discharged to another facility, among total admissions | 3.70 | 1.89* | 1.06 | 3.64 | 10.00 | 2.30 | 18.18 |
| Mean LOSCALE, among total admissions (Employer A: Indemnity N=2026, POS N=1110, Switcher N=94, Employer B: Indemnity N=880, PPO N=10, HMO N=261, Switcher N=11) | 118.48 | 119.16 | 106.96 | 114.68 | 183.50* | 128.45 | 98.45 |
| Mean RDSCALE, among total admissions | 144.59 | 152.82 | 122.16 | 123.27 | 235.10 | 144.06 | 92.45 |
| Mean inpatient payments for the year, among inpatient users | $20,650.33 | $17,502.53 | $13,245.58 | $22,633.04 | $88,107.00 | $17,657.91 | $12,812.17 |
| Median inpatient payments for the year, among inpatient users | $11,536.00 | $9,681.50* | $6,428.50* | $12,667.50 | $18,585.50 | $8,869.00* | $10,874.00 |
| OUTPATIENT CARE | |||||||
| Mean number of outpatient claims during year | 33.38 | 46.81* | 33.69 | 41.75 | 36.32 | 41.94 | 37.62 |
| Mean number of outpatient claim-days during year | 14.81 | 18.18* | 13.91 | 17.11 | 16.68 | 15.47 | 15.88 |
| Mean outpatient expenditures during year | $3,568.53 | $3,365.35 | $2,870.81 | $4,798.66 | $2,846.56 | $2,798.60* | $2,987.36 |
| Median outpatient expenditures during year | $1,494.50 | $1,601.00* | $1,064.00* | $2,268.00 | $1,036.00* | $1,177.00* | $1,573.00* |
| % using any therapies | 4.95 | 12.95* | 7.25 | 15.42 | 25.81 | 12.41 | 12.33 |
| % using any home health care | 10.8 | 11.86* | 8.24 | 5.96 | 12.50 | 11.83* | 12.23* |
| PRESCRIPTION DRUGS | |||||||
| Mean number of prescription drug claims in year among users | 22.16 | 17.73* | 14.70* | ||||
| Median number of prescription drug claims in year among users | 16.00 | 12.00* | 11.00* | ||||
| Mean drug expenditures during year among drug users | $936.70 | $858.51* | $803.97* | ||||
| Median drug expenditures during year among users | $594.36 | $552.90* | $531.84* | ||||
| * Significantly different from indemnity plan at p=0.05 level (Bonferroni t-test). | |||||||
APPENDIX C: Statistical Analyses
| TABLE C-1. Characteristics of Indemnity Plan Stayers and Switchers: Employer A | ||
|---|---|---|
| Measure | Stayers in Indemnity N=19424 |
Switchers from Indemnity to POS N=2191 |
| DEMOGRAPHIC CHARACTERISTICS | ||
| Mean age | 52.91 | 49.56* |
| % female | 30.68 | 28.80 |
| EMPLOYMENT STATUS | ||
| % employed full time | 64.19 | 79.55* |
| % early retirees | 36.57 | 20.77* |
| PER SE DISABILITY CATEGORY--1995 | ||
| % adults with any physical disability | 62.01 | 52.85* |
| % adults with any mental disability | 4.87 | 4.56 |
| % adults with physical and mental disabilities | 1.84 | 1.41 |
| PER SE DISABILITY CATEGORY--1994 | ||
| % adults with any physical disability | 54.39 | 48.97* |
| % adults with any mental disability | 4.68 | 3.74* |
| % adults with physical and mental disabilities | 1.54 | 0.91* |
| ACTIVITY-LIMITING CONDITION | ||
| % with condition in 1995 | 50.07 | 44.87* |
| % with condition in 1994 | 57.20 | 56.18 |
| HEALTH CONDITIONS | ||
| Mean number of MDCs in 1995 | 3.97 | 3.79* |
| Mean number of unique MDCs in 1994 | 3.72 | 3.34* |
| INPATIENT CARE | ||
| % hospitalized during 1995 | 16.87 | 13.42* |
| % hospitalized during 1994 | 15.76 | 13.01* |
| INPATIENT CARE AMONG INPATIENT USERS--1995 | Stayers N=3276 |
Switchers N=294 |
| Mean number of hospital admissions | 1.42 | 1.44 |
| Mean length of stay per admission | 5.79 | 4.93 |
| Mean total length of stay | 8.72 | 7.44 |
| Median inpatient payment | 10,382.00 | 8,209.50* |
| INPATIENT CARE AMONG INPATIENT USERS--1994 | Stayers N=3062 |
Switchers N=285 |
| Mean number of hospital admissions | 1.43 | 1.26* |
| Mean length of stay per admission | 5.84 | 4.32* |
| Mean total length of stay | 8.92 | 5.59* |
| Median inpatient payment | 10,863.50 | 7,670.00* |
| OUTPATIENT CARE--1995 | ||
| Mean number of outpatient claim-days | 13.57 | 13.82 |
| Median outpatient payments | 1,312.00 | 1,152.00* |
| OUTPATIENT CARE--1994 | ||
| Mean number of outpatient claim-days | 13.07 | 10.36* |
| Median outpatient payments | 1,179.00 | 894.00* |
| REHABILITATION SERVICE USE | ||
| % using rehabilitation services--1995 | 8.20 | 12.92* |
| % using rehabilitation services--1994 | 17.60 | 17.75 |
| TOTAL PAYMENTS--1995 | ||
| Mean total inpatient and outpatient payments | 6,323.63 | 4,793.64* |
| Median total inpatient and outpatient payments | 1,485.50 | 1,248.00* |
| TOTAL PAYMENTS--1994 | ||
| Mean total inpatient and outpatient payments | 5,965.76 | 3,938.54* |
| Median total inpatient and outpatient payments | 1,317.50 | 1,012.00* |
| PRESCRIPTION DRUGS FOR USERS 1995** | Stayers N=16183 |
Switchers N=1099 |
| Mean number of prescription drug claims | 17.86 | 11.19* |
| Median number of prescription drug claims | 13.00 | 8.00* |
| Mean total prescription drug payments | 784.33 | 717.13 |
| Median total prescription drug payments | 455.16 | 441.82 |
| Mean total payments Inpatient + Outpatient + Prescription drugs | 7,494.71 | 5,390.94* |
| Median total payment Inpatient + Outpatient + Prescription drugs | 2,463.94 | 2,179.46* |
| * Significance at the p=0.05 level. Chi-squared statistics and unequal-variance t-tests were used to test for differences in percentages and means, respectively. ** Due to data limitations, prescription drug measures are calculated only for users of these services. |
||
| TABLE C-2. Characteristics of Indemnity Plan Stayers and Switchers: Employer A | ||||
|---|---|---|---|---|
| Measure | Stayers in Indemnity N=19424 |
Switchers from Indemnity to POS N=2191 |
||
| 1994 | 1995 | 1994 | 1995 | |
| CHARACTERISTICS | ||||
| Any physical disability | 54.39 | 62.01* | 48.97 | 52.85* |
| Any mental disability | 4.68 | 4.87 | 3.74 | 4.56 |
| Both physical and mental disabilities | 1.54 | 1.84* | 0.91 | 1.41 |
| % employed full time | 57.20 | 50.07* | 56.18 | 44.87* |
| Mean number of unique MDCs | 3.72 | 3.97* | 3.34 | 3.79* |
| INPATIENT CARE | ||||
| % hospitalized | 15.76 | 16.87* | 13.01 | 13.42 |
| OUTPATIENT CARE | ||||
| Mean number of outpatient claim-days | 13.07 | 13.57* | 10.36 | 13.82* |
| Median total outpatient payments | 1,179.00 | 1,312.00* | 894.00 | 1,152.00* |
| REHABILITATION SERVICE USE | ||||
| % using rehabilitation services | 17.60 | 8.19* | 17.75 | 12.92* |
| ACTIVITY-LIMITING CONDITION | ||||
| Mean total inpatient + outpatient payments | 5,965.76 | 6,323.63* | 3,938.54 | 4,793.64* |
| INPATIENT CARE AMONG INPATIENT USERS | 1994 Stayers N=3062 |
1995 Stayers N=3276 |
1994 Switchers N=285 |
1995 Switchers N=294 |
| Mean number of hospital admissions | 1.43 | 1.42 | 1.26 | 1.44* |
| Mean length of stay per admission | 5.84 | 5.79 | 4.32 | 4.93 |
| Mean total length of stay | 8.92 | 8.72 | 5.59 | 7.44* |
| Median total inpatient payments | 10,863.50 | 10,382.00 | 7,670.00 | 8,209.50 |
| * Significance at the p = 0.05 level. Chi-squared statistics and unequal-variance t-tests were used to test for differences in percentages and means, respectively. | ||||
| TABLE C-3a. Characteristics of Indemnity Plan Stayers and Switchers: Employer B | ||
|---|---|---|
| Measure | Stayers in Indemnity N=22784 |
Switchers from Indemnity to HMO N=332 |
| DEMOGRAPHIC CHARACTERISTICS | ||
| Mean age | 44.15 | 37.08* |
| Gender (% female) | 55.00 | 53.92 |
| EMPLOYMENT STATUS | ||
| % employed full time | 82.04 | 94.28* |
| % early retirees | 16.28 | 5.428 |
| % other employment status | 1.69 | 0.30 |
| INSURANCE STATUS | ||
| % Employee | 57.11 | 55.12* |
| % Spouse | 26.63 | 19.28 |
| % Dependent | 16.27 | 25.60 |
| PER SE DISABILITY CATEGORY--1995 | ||
| % adults with any physical disability | 47.36 | 37.95* |
| % adults with any mental disability | 6.75 | 7.23 |
| % adults with physical and mental disabilities | 2.82 | 2.41 |
| PER SE DISABILITY CATEGORY--1994 | ||
| % adults with any physical disability | 45.66 | 33.13* |
| % adults with any mental disability | 6.57 | 5.42 |
| % adults with physical and mental disabilities | 2.35 | 1.51 |
| ACTIVITY-LIMITING CONDITION | ||
| % with condition in 1995 | 40.87 | 30.12* |
| % with condition in 1994 | 45.92 | 34.94* |
| HEALTH CONDITIONS | ||
| Inpatient Care among Inpatient Users--1995 | 4.38 | 4.67* |
| Mean number of unique MDCs in 1994 | 4.29 | 3.89* |
| INPATIENT CARE | ||
| % hospitalized during 1995 | 11.44 | 8.73 |
| % hospitalized during 1994 | 11.69 | 12.05 |
| OUTPATIENT CARE--1995 | ||
| Mean number of outpatient claim-days | 14.71 | 12.63* |
| Median outpatient payments | 1,500.00 | 1,053.00* |
| OUTPATIENT CARE--1994 | ||
| Mean number of outpatient claim-days | 14.56 | 11.99* |
| Median outpatient payments | 1,540.00 | 1,138.50* |
| REHABILITATION SERVICE USE | ||
| % using rehabilitation services--1995 | 22.52 | 20.48 |
| % using rehabilitation services--1994 | 21.97 | 21.39 |
| TOTAL PAYMENTS--1995 | ||
| Mean total inpatient and outpatient payments | 5,267.08 | 2,530.67* |
| Median total inpatient and outpatient payments | 1,587.50 | 1,067.50* |
| TOTAL PAYMENTS--1994 | ||
| Mean total inpatient and outpatient payments | 5,146.18 | 3,537.13* |
| Median total inpatient and outpatient payments | 1,630.00 | 1,206.50* |
| SOURCE: 1995 MarketScan® data, The Medstat Group, Inc. * Significance at p = 0.05 level. Chi-squared statistics and unequal-variance t-tests were used to test for differences in percentages and means, respectively. |
||
| TABLE C-3b. Characteristics of Indemnity Plan Stayers and Switchers: Employer B | ||
|---|---|---|
| Measure | Stayers in Indemnity N=21618 |
Switchers from Indemnity to HMO N=310 |
| DEMOGRAPHIC CHARACTERISTICS | ||
| Mean age | 36.28 | 37.68 |
| Gender (% female) | 54.55 | 57.10 |
| EMPLOYMENT STATUS | ||
| % employed full time | 94.30 | 89.35 |
| %early retirees | 5.14 | 9.35 |
| % other employment status | 0.56 | 1.29 |
| INSURANCE STATUS | ||
| % Employee | 51.55 | 58.06* |
| %Spouse | 24.04 | 18.06 |
| % Dependent | 24.41 | 23.87 |
| PER SE DISABILITY CATEGORY--1995 | ||
| % adults with any physical disability | 34.32 | 40.97* |
| % adults with any mental disability | 5.07 | 8.06* |
| % adults with physical and mental disabilities | 1.67 | 0.65 |
| PER SE DISABILITY CATEGORY--1994 | ||
| % adults with any physical disability | 30.14 | 26.77 |
| % adults with any mental disability | 4.42 | 3.87 |
| % adults with physical and mental disabilities | 1.39 | 1.94 |
| ACTIVITY-LIMITING CONDITION | ||
| % with condition in 1995 | 28.17 | 37.74* |
| % with condition in 1994 | 30.60 | 31.94 |
| HEALTH CONDITIONS | ||
| Inpatient Care among Inpatient Users--1995 | 4.38 | 4.67* |
| Mean number of unique MDCs in 1994 | 3.58 | 3.89 |
| OUTPATIENT CARE--1995 | ||
| Mean Number of outpatient claim-days | 11.72 | 14.93* |
| Median outpatient payments | 799.00 | 1,387.50* |
| OUTPATIENT CARE--1994 | ||
| Mean Number of outpatient claim-days | 11.17 | 10.42 |
| Median outpatient payments | 608.00 | 569.50 |
| REHABILITATION SERVICE USE | ||
| % using rehabilitation services--1995 | 22.52 | 30.97* |
| % using rehabilitation services--1994 | 27.55 | 23.23 |
| TOTAL PAYMENTS--1995 | ||
| Mean total inpatient and outpatient payments | 2,860.55 | 4,347.44* |
| Median total inpatient and outpatient payments | 845.00 | 1,387.50* |
| TOTAL PAYMENTS--1994 | ||
| Mean total inpatient and outpatient payments | 2,391.47 | 2,254.82 |
| Median total inpatient and outpatient payments | 647.00 | 591.00 |
| * Significance at p = 0.05 level. Chi-squared statistics and unequal-variance t-tests were used to test for differences in percentages and means, respectively. | ||
| TABLE C-4a. Characteristics of Indemnity Plan Stayers and Switchers: Employer B | ||||
|---|---|---|---|---|
| Measure | Stayers in Indemnity N=22784 |
Switchers from Indemnity to POS N=332 |
||
| 1994 | 1995 | 1994 | 1995 | |
| CHARACTERISTICS | ||||
| Any physical disability | 45.66 | 47.36* | 33.13 | 37.95* |
| Any mental disability | 6.57 | 6.75 | 5.42 | 7.23 |
| Both physical and mental disabilities | 2.35 | 2.82* | 1.51 | 2.41 |
| % employed full time | 45.92 | 40.87 | 34.94 | 30.12 |
| Mean number of unique MDCs | 4.29 | 4.38* | 3.89 | 4.67* |
| OUTPATIENT CARE | ||||
| Mean number of outpatient claim-days | 14.56 | 14.71 | 11.99 | 12.63 |
| Median total outpatient payments | 1,540.00 | 1,500.00* | 1,138.50 | 1,053.00 |
| REHABILITATION SERVICE USE | ||||
| % using rehabilitation services | 21.97 | 22.52 | 21.39 | 20.48 |
| TOTAL PAYMENTS | ||||
| Mean total inpatient + outpatient payments | 1,630.00 | 1,587.50* | 1,206.50 | 1,067.50* |
| Median total inpatient + outpatient payments | 5,164.18 | 5,267.08 | 3,537.13 | 2,530.67* |
| SOURCE: 1995 MarketScan® data, The MEDSTAT Group, Inc. * Significance at the p = 0.05 level. Chi-squared statistics and unequal-variance t-tests were used to test for differences in percentages and means, respectively. |
||||
| TABLE C-4b. Characteristics of Indemnity Plan Stayers and Switchers: Employer B | ||||
|---|---|---|---|---|
| Measure | Stayers in HMO N=21618 |
Switchers from HMO to Indemnity N=310 |
||
| 1994 | 1995 | 1994 | 1995 | |
| CHARACTERISTICS | ||||
| Any physical disability | 30.14 | 34.32* | 26.77 | 40.97* |
| Any mental disability | 4.42 | 5.07* | 3.87 | 80.6* |
| Both physical and mental disabilities | 1.39 | 1.67* | 1.94 | 0.65 |
| % employed full time | 30.60 | 28.17 | 31.94 | 37.74 |
| Mean number of unique MDCs | 3.59 | 3.99* | 3.58 | 4.38* |
| OUTPATIENT CARE | ||||
| Mean number of outpatient claim-days | 11.17 | 11.72* | 10.42 | 14.93* |
| Median total outpatient payments | 608.00 | 799.00* | 569.50 | 1,387.50* |
| REHABILITATION SERVICE USE | ||||
| % using rehabilitation services | 27.55 | 22.52* | 23.23 | 30.97 |
| TOTAL PAYMENTS | ||||
| Mean total inpatient + outpatient payments | 2,391.47 | 2,860.55 | 2,254.82 | 4,347.77 |
| Median total inpatient + outpatient payments | 647.00 | 845.00 | 591.00 | 1,387.50* |
| SOURCE: 1995 MarketScan® data, The MEDSTAT Group, Inc. * denotes p <= 0.05. Chi-squared statistics and unequal variance t-tests were used to test for differences in percentages and means, respectively. |
||||
| TABLE C-5a. Characteristics of Indemnity Plan Stayers and Switchers: Employer A | |||
|---|---|---|---|
| Measure | Total (N=23270) Percentage |
POS 1995 (N=11061) Percentage |
Indemnity 1995 (N=12209) Percentage |
| CHARACTERISTICS | |||
| Metropolitan statistical area | 86.1 | 91.93 | 80.83* |
| EMPLOYMENT STATUS | |||
| Active full-time | 66.09 | 75.4 | 57.65* |
| Early retiree | 31.22 | 22.81 | 38.85 |
| Other | 2.69 | 1.79 | 3.5 |
| PER SE DISABILITY CATEGORY--1995 | |||
| Physical disability only | 91.8 | 91.42 | 92.15* |
| Mental disability only | 5.69 | 6.44 | 5.02 |
| Physical and mental disability | 2.51 | 2.14 | 2.83 |
| Activity limiting condition | 67.32 | 64.87 | 69.54* |
| Health Care Usage 1995 Activity- Limiting Condition | 8.04 | 9.65 | 6.59* |
| TABLE C-5b. Characteristics of Indemnity Plan Stayers and Switchers: Employer A | ||||||
|---|---|---|---|---|---|---|
| Measure | Total (N=23270) |
POS 1995 (N=11061) |
Indemnity 1995 (N=12209) |
|||
| Mean | Standard Deviation |
Mean | Standard Deviation |
Mean | Standard Deviation |
|
| CHARACTERISTICS | ||||||
| Age | 52.053 | (9.832) | 50.242 | (9.943) | 53.694 | (9.436) |
| Number of unique MDC categories | 4.252 | (2.190) | 4.188 | (2.092) | 4.31 | (2.273)** |
| HEALTH CARE USE--1995 | ||||||
| Number of outpatient claim-days | 15.75 | (14.270) | 16.37 | (13.150) | 15.18 | (15.180)** |
| Number of hospital admissions | 0.282 | (0.699) | 0.261 | (0.661) | 0.301 | (0.731)** |
| Length of stay | 1.652 | (7.063) | 1.466 | (6.762) | 1.821 | (7.322)** |
| EXPENDITURES--1995 | ||||||
| Total inpatient payments | 3579.78 | (14790.910) | 2940.85 | (14168.050) | 4158.63 | (15310.950)** |
| Total outpatient payments | 3315.01 | (6132.790) | 2861.28 | (5298.540) | 3726.08 | (6774.850)** |
| Total payments | 6894.79 | (17478.820) | 5802.13 | (16099.080) | 7884.71 | (18586.140)** |
| ACTIVITY-LIMITING CONDITION | ||||||
| Number of prescriptions | 18.15 | (18.420) | 15.1 | (15.500) | 20.1 | (19.810)** |
| Total drug expenditures | 851.47 | (1184.870) | 757.88 | (978.870) | 911.25 | (1295.980)** |
| Total payments including drug expenditures | 8254.03 | (18189.790) | 6870.14 | (16289.740) | 9137.94 | (19254.530)** |
| SOURCE: 1995 MarketScan® data, The MEDSTAT Group, Inc. NOTES: *, ** denote p <= 0.05 and 0.01, respectively. Chi-squared statistics and unequal variance t-tests were used to test for differences between the POS and Indemnity subgroups.
|
||||||
| TABLE C-6a. Characteristics of Indemnity Plan Stayers and Switchers: Employer B | ||||||
|---|---|---|---|---|---|---|
| Measure | Total (N=22801) |
HMO 1995 (N=9686) |
Indemnity 1995 (N=13115) |
|||
| Number | Percentage | Number | Percentage | Number | Percentage | |
| CHARACTERISTICS | ||||||
| Metropolitan statistical area | 22517 | 98.75 | 96.39 | 99.51 | 12878 | 98.19** |
| INSURANCE STATUS | ||||||
| Employee | 12658 | 55.52 | 4907 | 50.66 | 7751 | 59.1** |
| Spouse | 5729 | 25.13 | 2340 | 24.16 | 3389 | 25.84 |
| Dependent | 4414 | 19.36 | 2439 | 25.18 | 1975 | 15.06 |
| EMPLOYMENT STATUS | ||||||
| Active full-time | 19404 | 85.1 | 8981 | 92.72 | 10423 | 79.47** |
| Early retiree | 3086 | 13.53 | 648 | 6.69 | 2438 | 18.59 |
| Other | 311 | 1.36 | 57 | 0.59 | 254 | 1.94 |
| PER SE DISABILITY CATEGORY--1995 | ||||||
| Physical disability only | 19229 | 84.33 | 8046 | 83.07 | 11183 | 85.27** |
| Mental disability only | 2439 | 10.7 | 1192 | 12.31 | 1247 | 9.51 |
| Physical and mental disability | 1133 | 4.97 | 448 | 4.63 | 685 | 5.22 |
| Activity limiting condition | 13824 | 60.63 | 5645 | 58.28 | 8179 | 62.36** |
| Activity limiting condition both years | 7046 | 30.9 | 2629 | 27.14 | 4417 | 33.67** |
| Per se disability condition both years | 12945 | 56.77 | 50.35 | 51.98 | 7910 | 60.31** |
| HEALTH CARE USE--1995 | ||||||
| Any rehabilitation services | 3588 | 15.74 | 1527 | 15.77 | 2061 | 15.71 |
| TABLE C-6b. Characteristics of Indemnity Plan Stayers and Switchers: Employer B | ||||||
|---|---|---|---|---|---|---|
| Measure | Total (N=22801) |
HMO 1995 (N=9686) |
Indemnity 1995 (N=13115) |
|||
| Mean | Standard Deviation |
Mean | Standard Deviation |
Mean | Standard Deviation |
|
| CHARACTERISTICS | ||||||
| Age | 41.837 | (18.003) | 37.145 | (18.243) | 45.300 | (17.013)** |
| Number of unique MDC categories | 4.721 | (2.230) | 4.721 | (2.228) | 4.808 | (2.380)** |
| HEALTH CONDITIONS 1994 | ||||||
| Number of unique MDC categories | 4.123 | (2.232) | 4.123 | (2.232) | 4.351 | (2.369)** |
| HEALTH CARE USE--1995 | ||||||
| Number of outpatient claim-days | 15.290 | (14.310) | 13.990 | (13.310) | 16.240) | (14.930)** |
| Number of hospital admissions | 0.218 | (0.752) | 0.200 | (0.697) | 0.231 | (0.790)** |
| Length of stay | 1.311 | (7.204) | 1.125 | (6.880) | 1.451 | (7.438)** |
| HEALTH CARE USE--1994 | ||||||
| Number of outpatient claim-days | 13.57 | (13.540) | 12.02 | (12.010) | 14.72 | (14.460)** |
| Number of hospital admissions | 0.175 | (0.652) | 0.147 | (0.565) | 0.196 | (0.708)** |
| Length of stay | 1.137 | (8.562) | 0.889 | (7.028) | 1.32 | (9.534)** |
| EXPENDITURES--1995 | ||||||
| Total inpatient payments | 2464.87 | (12307.510) | 1816.21 | (10284.190) | 2943.94 | (13590.580)** |
| Total outpatient payments | 3228.8 | (6987.740) | 2308.9 | (5127.030) | 3908.19 | (8024.550)** |
| Total payments | 5693.68 | (15800.610) | 4125.11 | (12960.580) | 6852.13 | (17516.950)** |
| EXPENDITURES--1994 (1995 dollars) | ||||||
| Total inpatient payments | 2030.29 | (10968.270) | 1375.38 | (9034.590) | 2513.97 | (12178.960)** |
| Total outpatient payments | 2761.06 | (6213.520) | 1807.98 | (4054.040) | 3464.96 | (7336.160)** |
| Total payments | 4791.36 | (14326.030) | 3183.36 | (10917.670) | 5978.93 | (16293.340)** |
| SOURCE: 1995 MarketScan® data, The MEDSTAT Group, Inc. NOTES: Unequal variance t-tests were used to determine statistically significant differences between the HMO and Indemnity subgroups. |
||||||
APPENDIX D: Least-Squares Regressions
| TABLE D-1. POS versus Indemnity Insurance Choice (Employer A - Full Sample) Probit Regression Results | |||
|---|---|---|---|
| Independent Variables | Parameter Estimates |
Standard Errors |
Incremental Effects1,2 |
| Constant | .0238 | (0.058)** | 0.095 |
| DEMOGRAPHIC CHARACTERISTICS | |||
| Gender | 0.164 | (0.019)** | 0.065 |
| Age | -0.016 | (0.001)** | -0.006 |
| Metropolitan statistical area | 0.595 | (0.025)** | 0.237 |
| EMPLOYMENT STATUS | |||
| Early retiree | -0.297 | (0.022)** | -0.118 |
| DISABILITY STATUS | |||
| Activity limiting condition | -0.030 | (0.019) | -0.012 |
| Mental per se disability only | -0.050 | (0.038) | -0.020 |
| Physical and mental per se disability | -0.238 | (0.054)** | -0.095 |
| Percent correctly predicted (overall)3 | 61.124 | ||
| POS | 62.472 | ||
| Indemnity | 60.128 | ||
*, ** denote p< = 0.05 and 0.01, respectively. Results for Employer A are based on 1995 data only.
|
|||
| TABLE D-2. Number of Admissions (Employer A) Non-Linear | ||||
|---|---|---|---|---|
| Independent Variables | Selection Model1 | Non-Endogenous Model2 | ||
| Parameter Estimates |
Standard Errors |
Parameter Estimates |
Standard Errors |
|
| Constant | -4.305 | (1.051)** | -4.058 | (0.535)** |
| INSURANCE CHOICE | ||||
| POS 1995 | 0.374 | (1.296) | 0.001 | (0.042) |
| DEMOGRAPHIC CHARACTERISTICS | ||||
| Gender | 0.332 | (0.103)** | 0.355 | (0.057)** |
| Age | 0.056 | (0.024)** | 0.053 | (0.022)** |
| Age squared | -0.564 | (0.227)** | -0.561 | (0.227)** |
| Metropolitan statistical area | -0.427 | (0.282) | -0.351 | (0.057)** |
| EMPLOYMENT STATUS | ||||
| Early retiree | 0.186 | (0.150) | 0.146 | (0.055)** |
| HEALTH CONDITIONS | ||||
| Number of unique MDCs 1995 | 0.227 | (0.008)** | 0.227 | (0.008)** |
| DISABILITY STATUS | ||||
| Activity limiting condition | 0.609 | (0.057)** | 0.605 | (0.055)** |
| Mental per se disability only | -0.117 | (0.117) | -0.123 | (0.114) |
| Physical and mental per se disability | 0.482 | (0.154)** | 0.452 | (0.092)** |
| SELECTION PARAMETER | ||||
| Theta1 | -0.228 | (0.785) | --- | --- |
| SUM OF SQUARED RESIDUALS3 | 10024.672 | 10025.089 | ||
* significant at the p = .05 level. ** significant at the p = .01 level. Results for Employer A are based on 1995 data only.
|
||||
| TABLE D-3. Number of Hospital Days (Employer A) Non-Linear Least-Squares Regressions | ||||
|---|---|---|---|---|
| Independent Variables | Selection Model1 | Non-Endogenous Model2 | ||
| Parameter Estimates |
Standard Errors |
Parameter Estimates |
Standard Errors |
|
| Constant | -5.237 | (1.728)** | -4.549 | (1.689)** |
| INSURANCE CHOICE | ||||
| POS 1995 | 0.998 | (1.638) | 0.090 | (0.115) |
| DEMOGRAPHIC CHARACTERISTICS | ||||
| Gender | 0.031 | (0.223) | 0.081 | (0.184) |
| Age | 0.113 | (0.065)* | 0.106 | (0.072) |
| Age squared | -1.006 | (0.719) | -0.986 | (0.761) |
| Metropolitan statistical area | -0.258 | (0.230) | -0.112 | (0.123) |
| EMPLOYMENT STATUS | ||||
| Early retiree | 0.503 | (0.223)** | 0.411 | (0.146)** |
| HEALTH CONDITIONS | ||||
| Number of unique MDCs 1995 | 0.292 | (0.022)** | 0.292 | (0.022)** |
| DISABILITY STATUS | ||||
| Activity limiting condition | 0.655 | (0.108)** | 0.643 | (0.105)** |
| Mental per se disability only | -0.122 | (0.177) | -0.134 | (0.173) |
| Physical and mental per se disability | 1.004 | (0.229)** | 0.938 | (0.172)** |
| SELECTION PARAMETER | ||||
| Theta1 | -0.542 | (0.958) | — | --- |
| SUM OF SQUARED RESIDUALS3 | 1059482.700 | 1059571.500 | ||
* significant at the p = .05 level. ** significant at the p = .01 level. Results for Employer A are based on 1995 data only.
|
||||
| TABLE D-4. Number of Outpatient Visits (Employer A) Non-Linear Least-Squares Regressions | ||||
|---|---|---|---|---|
| Independent Variables | Selection Model1 | Non-Endogenous Model2 | ||
| Parameter Estimates |
Standard Errors |
Parameter Estimates |
Standard Errors |
|
| Constant | 1.208 | (0.332)** | 1.174 | (0.139)** |
| INSURANCE CHOICE | ||||
| POS 1995 | 0.027 | (0.525) | 0.083 | (0.013)** |
| DEMOGRAPHIC CHARACTERISTICS | ||||
| Gender | 0.028 | (0.035) | 0.025 | (0.014)* |
| Age | 0.030 | (0.006)** | 0.030 | (0.006)** |
| Age squared | -0.342 | (0.062)** | -0.342 | (0.062)** |
| Metropolitan statistical area | -0.009 | (0.119) | -0.021 | (0.017) |
| EMPLOYMENT STATUS | ||||
| Early retiree | 0.083 | (0.062) | 0.090 | (0.017)** |
| HEALTH CONDITIONS | ||||
| Number of unique MDCs 1995 | 0.179 | (0.003)** | 0.179 | (0.003)** |
| DISABILITY STATUS | ||||
| Activity limiting condition | 0.091 | (0.015)** | 0.092 | (0.014)** |
| Mental per se disability only | 0.170 | (0.026)** | 0.171 | (0.024)** |
| Physical and mental per se disability | 0.187 | (0.055)** | 0.192 | (0.030)** |
| SELECTION PARAMETER | ||||
| Theta1 | 0.035 | (0.325) | — | --- |
| SUM OF SQUARED RESIDUALS3 | 3085123.200 | 3085131.000 | ||
* significant at the p = .05 level. ** significant at the p = .01 level. Results for Employer A are based on 1995 data only.
|
||||
| TABLE D-5. Any Rehabilitation Services (Employer A) Non-Linear Least-Squares and Probit Regression | ||||
|---|---|---|---|---|
| Independent Variables | Selection Model1 | Non-Endogenous Model2 | ||
| Parameter Estimates |
Standard Errors |
Parameter Estimates |
Standard Errors |
|
| Constant | -5.440 | (0.689)** | -2.475 | (0.286)** |
| INSURANCE CHOICE | ||||
| POS 1995 | 3.001 | (0.439)** | 0.241 | (0.026)** |
| DEMOGRAPHIC CHARACTERISTICS | ||||
| Gender | -0.137 | (0.052)** | -0.022 | (0.029) |
| Age | 0.058 | (0.200)** | -0.301 | (0.012) |
| Age squared | -0.589 | (0.200)** | -0.301 | (0.127)** |
| Metropolitan statistical area | -0.681 | (0.105)** | -0.114 | (0.036)** |
| EMPLOYMENT STATUS | ||||
| Early retiree | 0.420 | (0.078)** | 0.083 | (0.036)** |
| HEALTH CONDITIONS | ||||
| Number of unique MDCs 1995 | 0.169 | (0.014)** | 0.133 | (0.006)** |
| DISABILITY STATUS | ||||
| Activity limiting condition | 0.598 | (0.065)** | 0.361 | (0.031)** |
| Mental per se disability only | 0.017 | (0.110) | -0.200 | (0.066)** |
| Physical and mental per se disability | 0.236 | (0.127)* | -0.038 | (0.073) |
| SELECTION PARAMETER | ||||
| Theta1 | -1.523 | (0.221)** | — | --- |
| SUM OF SQUARED RESIDUALS3 | 1638.004 | |||
| LIKELIHOOD FUNCTION4 | -6029.884 | |||
* significant at the p = .05 level. ** significant at the p = .01 level. Results for Employer A are based on 1995 data only.
|
||||
| TABLE D-6. Inpatient Payments (Employer A) Non-Linear Least-Squares Regressions | ||||
|---|---|---|---|---|
| Independent Variables | Selection Model1 | Non-Endogenous Model2 | ||
| Parameter Estimates |
Standard Errors |
Parameter Estimates |
Standard Errors |
|
| Constant | -6.462 | (2.830)** | -5.775 | (2.079)** |
| INSURANCE CHOICE | ||||
| POS 1995 | 0.913 | (1.431) | -0.007 | (0.171) |
| DEMOGRAPHIC CHARACTERISTICS | ||||
| Gender | 0.505 | (0.125)** | 0.558 | (0.117)** |
| Age | 0.152 | (0.091)* | 0.144 | (0.082)* |
| Age squared | -1.625 | (0.990)* | -1.597 | (0.943)* |
| Metropolitan statistical area | -0.390 | (0.227)* | -0.217 | (0.094)** |
| EMPLOYMENT STATUS | ||||
| Early retiree | 0.550 | (0.389) | 0.444 | (0.293) |
| HEALTH CONDITIONS | ||||
| Number of unique MDCs 1995 | 0.265 | (0.032)** | 0.264 | (0.031)** |
| DISABILITY STATUS | ||||
| Activity limiting condition | 0.907 | (0.134)** | 0.899 | (0.130)** |
| Mental per se disability only | -1.068 | (0.167)** | -1.085 | (0.169)** |
| Physical and mental per se disability | 0.295 | (0.210) | 0.226 | (0.215) |
| SELECTION PARAMETER | ||||
| Theta1 | -0.551 | (0.768) | — | --- |
| SUM OF SQUARED RESIDUALS3 | 190562.730 | 190584.18 | ||
* significant at the p = .05 level. ** significant at the p = .01 level. Results for Employer A are based on 1995 data only.
|
||||
| TABLE D-7. Outpatient Payments (Employer A) Non-Linear Least-Squares Regressions | ||||
|---|---|---|---|---|
| Independent Variables | Selection Model1 | Non-Endogenous Model2 | ||
| Parameter Estimates |
Standard Errors |
Parameter Estimates |
Standard Errors |
|
| Constant | -3.056 | (0.763)** | -2.171 | (0.440)** |
| INSURANCE CHOICE | ||||
| POS 1995 | 1.017 | (0.620)* | -0.148 | (0.043)** |
| DEMOGRAPHIC CHARACTERISTICS | ||||
| Gender | 0.171 | (0.051)** | 0.230 | (0.048)** |
| Age | 0.045 | (0.021)** | 0.035 | (0.019)* |
| Age squared | -0.503 | (0.219)** | -0.470 | (0.208)** |
| Metropolitan statistical area | -0.421 | (0.126)** | -0.204 | (0.058)** |
| EMPLOYMENT STATUS | ||||
| Early retiree | 0.264 | (0.085)** | 0.148 | (0.063)** |
| HEALTH CONDITIONS | ||||
| Number of unique MDCs 1995 | 0.247 | (0.010)** | 0.246 | (0.009)** |
| DISABILITY STATUS | ||||
| Activity limiting condition | 0.150 | (0.066)** | 0.140 | (0.065)** |
| Mental per se disability only | -0.413 | (0.057)** | -0.430 | (0.056)** |
| Physical and mental per se disability | -0.011 | (0.119) | -0.096 | (0.105) |
| SELECTION PARAMETER | ||||
| Theta1 | -0.699 | (0.349)** | — | --- |
| SUM OF SQUARED RESIDUALS3 | 28345.365 | 28360.222 | ||
* significant at the p = .05 level. ** significant at the p = .01 level. Results for Employer A are based on 1995 data only.
|
||||
| TABLE D-8. Total Payments (Employer A) Non-Linear Least-Squares Regressions | ||||
|---|---|---|---|---|
| Independent Variables | Selection Model1 | Non-Endogenous Model2 | ||
| Parameter Estimates |
Standard Errors |
Parameter Estimates |
Standard Errors |
|
| Constant | -3.637 | (1.337)** | -2.948 | (1.049)** |
| INSURANCE CHOICE | ||||
| POS 1995 | 0.832 | (0.750) | -0.098 | (0.084) |
| DEMOGRAPHIC CHARACTERISTICS | ||||
| Gender | 0.358 | (0.071)** | 0.409 | (0.065)** |
| Age | 0.087 | (0.045)* | 0.079 | (0.042)* |
| Age squared | -0.950 | (0.487)* | -0.925 | (0.474)* |
| Metropolitan statistical area | -0.404 | (0.140)** | -0.227 | (0.059)** |
| EMPLOYMENT STATUS | ||||
| Early retiree | 0.389 | (0.177)** | 0.290 | (0.143)** |
| HEALTH CONDITIONS | ||||
| Number of unique MDCs 1995 | 0.253 | (0.016)** | 0.253 | (0.016)** |
| DISABILITY STATUS | ||||
| Activity limiting condition | 0.494 | (0.071)** | 0.486 | (0.070)** |
| Mental per se disability only | -0.592 | (0.077)** | -0.606 | (0.075)** |
| Physical and mental per se disability | 0.185 | (0.126) | 0.115 | (0.116) |
| SELECTION PARAMETER | ||||
| Theta1 | -0.560 | (0.419) | — | --- |
| SUM OF SQUARED RESIDUALS3 | 247929.590 | 247988.620 | ||
* significant at the p = .05 level. ** significant at the p = .01 level. Results for Employer A are based on 1995 data only.
|
||||
| TABLE D-9. Insurance Choice (Employer A - Prescription Drug Subsample) Probit Regression Results | |||
|---|---|---|---|
| Independent Variables | Parameter Estimates |
Standard Errors |
Incremental Effects1,2 |
| Constant | -0.299 | (0.071)** | -0.114 |
| DEMOGRAPHIC CHARACTERISTICS | |||
| Gender | 0.193 | (0.023)** | 0.074 |
| Age | -0.008 | (0.001)** | -0.003 |
| Metropolitan statistical area | 0.486 | (0.029)** | 0.186 |
| EMPLOYMENT STATUS | |||
| Early retiree | -0.268 | (0.025)** | -0.102 |
| DISABILITY STATUS | |||
| Activity limiting condition | -0.029 | (0.022) | -0.011 |
| Mental per se disability only | -0.076 | (0.046)* | -0.029 |
| Physical and mental per se disability | -0.247 | (0.064)** | -0.095 |
| PERCENT CORRECTLY PREDICTED (overall)3 | 30.637 | ||
| POS | 12.261 | ||
| Indemnity | 91.442 | ||
*, ** denote p <= .05 and 0.01, respectively. Results for Employer A are based on 1995 data only. Drug subsample includes prescription users only.
|
|||
| TABLE D-10. Number of Prescription (Employer A) Non-Linear Least-Squares Regressions | ||||
|---|---|---|---|---|
| Independent Variables | Selection Model1 | Non-Endogenous Model2 | ||
| Parameter Estimates |
Standard Errors |
Parameter Estimates |
Standard Errors |
|
| Constant | 0.011 | (0.388) | -0.061 | (0.254) |
| INSURANCE CHOICE | ||||
| POS 1995 | -0.400 | (0.789) | -0.222 | (0.017)** |
| DEMOGRAPHIC CHARACTERISTICS | ||||
| Gender | -0.080 | (0.059) | -0.092 | (0.019)** |
| Age | 0.099 | (0.011)** | 0.100 | (0.010)** |
| Age squared | -0.959 | (0.105)** | -0.960 | (0.106)** |
| Metropolitan statistical area | -0.101 | (0.139) | -0.130 | (0.022)** |
| EMPLOYMENT STATUS | ||||
| Early retiree | 0.294 | (0.082)** | 0.311 | (0.023)** |
| HEALTH CONDITIONS | ||||
| Number of unique MDCs 1995 | 0.103 | (0.004)** | 0.103 | (0.004)** |
| DISABILITY STATUS | ||||
| Activity limiting condition | 0.096 | (0.021)** | 0.097 | (0.019)** |
| Mental per se disability only | 0.006 | (0.044) | 0.011 | (0.037) |
| Physical and mental per se disability | 0.169 | (0.090)* | 0.184 | (0.049)** |
| SELECTION PARAMETER | ||||
| Theta1 | 0.110 | (0.488) | — | --- |
| SUM OF SQUARED RESIDUALS3 | 5042909.900 | 5042984.100 | ||
* significant at the p = .05 level. ** significant at the p = .01 level. Results for Employer A are based on 1995 data only. Drug subsample includes prescription users only.
|
||||
| TABLE D-11. Prescription Payments (Employer A) Non-Linear Least-Squares Regressions | ||||
|---|---|---|---|---|
| Independent Variables | Selection Model1 | Non-Endogenous Model2 | ||
| Parameter Estimates |
Standard Errors |
Parameter Estimates |
Standard Errors |
|
| Constant | -3.277 | (0.517)** | -3.095 | (0.459)** |
| INSURANCE CHOICE | ||||
| POS 1995 | 0.257 | (0.545) | -0.145 | (0.026)** |
| DEMOGRAPHIC CHARACTERISTICS | ||||
| Gender | 0.095 | (0.044)** | 0.119 | (0.032)** |
| Age | 0.102 | (0.018)** | 0.101 | (0.018)** |
| Age squared | -1.108 | (0.180)** | -1.104 | (0.180)** |
| Metropolitan statistical area | -0.153 | (0.096) | -0.091 | (0.037)** |
| EMPLOYMENT STATUS | ||||
| Early retiree | 0.513 | (0.068)** | 0.476 | (0.041)** |
| HEALTH CONDITIONS | ||||
| Number of unique MDCs 1995 | 0.119 | (0.007)** | 0.119 | (0.007)** |
| DISABILITY STATUS | ||||
| Activity limiting condition | 0.088 | (0.031)** | 0.084 | (0.031)** |
| Mental per se disability only | -0.125 | (0.050)** | -0.135 | (0.048)** |
| Physical and mental per se disability | 0.143 | (0.077)* | 0.111 | (0.062)* |
| SELECTION PARAMETER | ||||
| Theta1 | -0.243 | (0.324) | — | --- |
| SUM OF SQUARED RESIDUALS3 | 22302.240 | 22303.277 | ||
* significant at the p = .05 level. ** significant at the p = .01 level. Results for Employer A are based on 1995 data only. Drug subsample includes prescription users only.
|
||||
| TABLE D-12. Total Payments Including Prescription Payments (Employer A) Non-Linear Least-Squares Regressions | ||||
|---|---|---|---|---|
| Independent Variables | Selection Model1 | Non-Endogenous Model2 | ||
| Parameter Estimates |
Standard Errors |
Parameter Estimates |
Standard Errors |
|
| Constant | -3.058 | (1.278)** | -3.308 | (1.128)** |
| INSURANCE CHOICE | ||||
| POS 1995 | -0.911 | (1.434) | -0.099 | (0.102) |
| DEMOGRAPHIC CHARACTERISTICS | ||||
| Gender | 0.433 | (0.094)** | 0.377 | (0.068)** |
| Age | 0.100 | (0.045)** | 0.102 | (0.045)** |
| Age squared | -1.180 | (0.482)** | -1.178 | (0.495)** |
| Metropolitan statistical area | -0.056 | (0.251) | -0.202 | (0.060)** |
| EMPLOYMENT STATUS | ||||
| Early retiree | 0.256 | (0.257) | 0.343 | (0.145)** |
| HEALTH CONDITIONS | ||||
| Number of unique MDCs 1995 | 0.242 | (0.017)** | 0.243 | (0.016)** |
| DISABILITY STATUS | ||||
| Activity limiting condition | 0.487 | (0.072)** | 0.495 | (0.068)** |
| Mental per se disability only | -0.649 | (0.076)** | -0.632 | (0.074)** |
| Physical and mental per se disability | — | — | — | --- |
| SELECTION PARAMETER | ||||
| Theta1 | 0.502 | (0.850) | — | --- |
| SUM OF SQUARED RESIDUALS3 | 1904084.230 | 194096.570 | ||
* significant at the p = .05 level. ** significant at the p = .01 level. Results for Employer A are based on 1995 data only. Drug subsample includes prescription users only.
|
||||
| TABLE D-13. HMO versus Indemnity Insurance Choice (Employer B) Results from Probit Regressions | ||||||
|---|---|---|---|---|---|---|
| Independent Variables | Model 1 | Model 2 | ||||
| Parameter Estimates |
Standard Errors |
Incremental Effects1,2 |
Parameter Estimates |
Standard Errors |
Incremental Effects1,2 |
|
| Constant | 1.089 | (0.049)** | 0.425 | 1.000 | (0.048)** | 0.391 |
| DEMOGRAPHIC CHARACTERISTICS | ||||||
| Gender | 0.030 | (0.018)* | 0.012 | 0.052 | (0.017)** | 0.020 |
| Age | -0.025 | (0.001)** | -0.010 | -0.025 | (0.001)** | -0.010 |
| Child | 0.035 | (0.038) | 0.014 | -0.015 | (0.038) | -0.006 |
| INSURANCE STATUS | ||||||
| Spouse | 0.031 | (0.021) | 0.012 | 0.035 | (0.021)* | 0.014 |
| Dependent | -0.615 | (0.046)** | -0.240 | -0.576 | (0.046)** | -0.225 |
| EMPLOYMENT STATUS | ||||||
| Early Retiree | -0.366 | (0.029)** | -0.143 | -0.373 | (0.029)** | -0.146 |
| PAST HEALTH CARE USAGE | ||||||
| Number of outpatient claim-days 1994 | -0.008 | (0.001)** | -0.003 | — | — | --- |
| Number of admissions 1994 | 0.023 | (0.015) | 0.009 | — | — | --- |
| DISABILITY STATUS | ||||||
| Activity limiting condition | -0.002 | (0.019) | -0.001 | -0.020 | (0.019) | -0.008 |
| Mental per se disability only | -0.020 | (0.029) | -0.008 | -0.039 | (0.029) | -0.015 |
| Physical and mental per se disability | -0.103 | (0.040)** | -0.040 | -0.164 | (0.040)** | -0.064 |
| Percent Correctly Predicted3 | 63.160 | 62.484 | ||||
| HMO | 47.016 | 44.972 | ||||
| Indemnity | 75.082 | 75.418 | ||||
* significant at the p = .05 level. ** significant at the p = .01 level. Model 1 (columns 1-3) used 1994 utilization measures as predictors of insurance choice, while Model 2 (columns 4-6) excluded these 1994 variables.
|
||||||
| TABLE D-14. Number of Admissions (Employer B) Non-Linear Least-Squares Regressions | ||||||
|---|---|---|---|---|---|---|
| Independent Variables | Selection Model 11 | Selection Model 21 | Non-Endogenous Model 12 | |||
| Parameter Estimates |
Standard Errors |
Parameter Estimates |
Standard Errors |
Parameter Estimates |
Standard Errors |
|
| Constant | -2.367 | (0.652)** | -3.532 | (1.850)* | -4.358 | (0.668)** |
| INSURANCE CHOICE | ||||||
| HMO 1995 | -2.111 | (0.717)** | -0.906 | (2.704) | 0.094 | (0.071) |
| DEMOGRAPHIC CHARACTERISTICS | ||||||
| Gender | 0.340 | (0.069)** | 0.351 | (0.075)** | 0.330 | (0.070)** |
| Age | -0.007 | (0.024) | 0.013 | (0.032) | 0.023 | (0.026) |
| Age Squared | 0.000 | (0.000) | 0.000 | (0.000) | 0.000 | (0.000) |
| Child | 0.017 | (0.368) | -0.086 | (0.392) | -0.086 | (0.393) |
| INSURANCE STATUS | ||||||
| Spouse | 0.252 | (0.083)** | 0.227 | (0.100)** | 0.215 | (0.083)** |
| Dependent | -0.885 | (0.580) | -0.344 | (0.791) | -0.109 | (0.642) |
| EMPLOYMENT STATUS | ||||||
| Early Retiree | -0.155 | (0.158) | 0.002 | (0.427) | 0.135 | (0.101) |
| HEALTH CONDITIONS | ||||||
| Number of unique MDCs 1995 | 0.237 | (0.015)** | 0.261 | (0.016)** | 0.260 | (0.016)** |
| DISABILITY STATUS | ||||||
| Activity limiting condition | 0.639 | (0.089)** | 0.648 | (0.087)** | 0.655 | (0.086)** |
| Mental per se disability only | -0.752 | (0.136)** | -0.733 | (0.138)** | -0.718 | (0.137)** |
| Physical and mental per se disability | 0.234 | (0.108)** | 0.267 | (0.174) | 0.327 | (0.107)** |
| SELECTION PARAMETER | ||||||
| Theta | 1.319 | (0.395)** | 0.616 | (1.644) | — | --- |
| SUM OF SQUARED RESIDUALS3 | 11338.523 | 11375.722 | 11377.612 | |||
* significant at the p = .05 level. ** significant at the p = .001 level. Model 1 (columns 1-3) used 1994 utilization measures as predictors of insurance choice, while Model 2 (columns 4-6) excluded these 1994 variables.
|
||||||
| TABLE D-15. Number of Hospital Days (Employer B) Non-Linear Least-Squares Regressions | ||||||
|---|---|---|---|---|---|---|
| Independent Variables | Selection Model 11 | Selection Model 21 | Non-Endogenous Model 12 | |||
| Parameter Estimates |
Standard Errors |
Parameter Estimates |
Standard Errors |
Parameter Estimates |
Standard Errors |
|
| Constant | -5.731 | (3.288)* | -3.850 | (7.109) | -4.243 | (1.154)** |
| INSURANCE CHOICE | ||||||
| HMO 1995 | 1.481 | (2.245) | -0.102 | (8.121) | 0.344 | (0.167)** |
| DEMOGRAPHIC CHARACTERISTICS | ||||||
| Gender | 0.629 | (0.171)** | 0.585 | (0.206)** | 0.575 | (0.140)** |
| Age | 0.092 | (0.061) | 0.069 | (0.101) | 0.073 | (0.042)* |
| Age Squared | -0.001 | (0.000) | -0.001 | (0.000) | -0.001 | (0.000) |
| Child | -1.011 | (0.724) | -0.817 | (0.710) | -0.823 | (0.721) |
| INSURANCE STATUS | ||||||
| Spouse | -0.045 | (0.116) | -0.026 | (0.140) | -0.030 | (0.111) |
| Dependent | 1.475 | (1.440) | 0.878 | (2.482) | 0.989 | (1.061) |
| EMPLOYMENT STATUS | ||||||
| Early Retiree | 0.443 | (0.221)** | 0.311 | (1.102) | 0.369 | (0.156)** |
| HEALTH CONDITIONS | ||||||
| Number of unique MDCs 1995 | 0.314 | (0.033)** | 0.295 | (0.022)** | 0.295 | (0.023)** |
| DISABILITY STATUS | ||||||
| Activity limiting condition | 0.822 | (0.130)** | 0.779 | (0.153)** | 0.784 | (0.136)** |
| Mental per se disability only | -0.752 | (0.276)** | -0.722 | (0.271)** | -0.717 | (0.266)** |
| Physical and mental per se disability | 0.318 | (0.204) | 0.311 | (0.504) | 0.336 | (0.196)* |
| SELECTION PARAMETER | ||||||
| Theta | -0.604 | (1.123) | 0.271 | (4.981) | — | --- |
| SUM OF SQUARED RESIDUALS3 | 1090223.900 | 1090503.600 | 1090536.300 | |||
* significant at the p = .05 level. ** significant at the p = .001 level. Model 1 (columns 1-3) used 1994 utilization measures as predictors of insurance choice, while Model 2 (columns 4-6) excluded these 1994 variables.
|
||||||
| TABLE D-16. Number of Outpatient (Employer B) Non-Linear Least-Squares Regressions | ||||||
|---|---|---|---|---|---|---|
| Independent Variables | Selection Model 11 | Selection Model 21 | Non-Endogenous Model 12 | |||
| Parameter Estimates |
Standard Errors |
Parameter Estimates |
Standard Errors |
Parameter Estimates |
Standard Errors |
|
| Constant | 3.300 | (0.098)** | ||||
| INSURANCE CHOICE | ||||||
| HMO 1995 | -2.597 | (0.134)** | -0.687 | (0.654) | -0.093 | (0.013)** |
| DEMOGRAPHIC CHARACTERISTICS | ||||||
| Gender | 0.044 | (0.020)** | 0.022 | (0.018) | 0.011 | (0.013) |
| Age | -0.010 | (0.003)** | -0.004 | (0.007) | 0.002 | (0.004) |
| Age Squared | 0.000 | (0.000)** | 0.000 | (0.000) | 0.000 | (0.000) |
| Child | 0.212 | (0.041)** | 0.190 | (0.031)** | 0.194 | (0.029)** |
| INSURANCE STATUS | ||||||
| Spouse | 0.008 | (0.024)* | -0.006 | (0.017) | -0.013 | (0.015) |
| Dependent | -0.643 | (0.067)** | -0.348 | (0.155)** | -0.212 | (0.060)** |
| EMPLOYMENT STATUS | ||||||
| Early Retiree | -0.329 | (0.039)** | -0.058 | (0.093) | 0.018 | (0.018) |
| HEALTH CONDITIONS | ||||||
| Number of unique MDCs 1995 | 0.148 | (0.003)** | 0.170 | (0.003)** | 0.170 | (0.003)** |
| DISABILITY STATUS | ||||||
| Activity limiting condition | 0.131 | (0.020)** | 0.140 | (0.014)** | 0.144 | (0.013)** |
| Mental per se disability only | 0.137 | (0.030)** | 0.170 | (0.022)** | 0.178 | (0.018)** |
| Physical and mental per se disability | 0.061 | (0.043)* | 0.169 | (0.047**) | 0.204 | (0.025)** |
| SELECTION PARAMETER | ||||||
| Theta | 1.499 | (0.060)** | 0.366 | (0.402) | — | --- |
| SUM OF SQUARED RESIDUALS3 | 2696310.200 | 2979464.400 | 2981116.400 | |||
* significant at the p = .05 level. ** significant at the p = .001 level. Model 1 (columns 1-3) used 1994 utilization measures as predictors of insurance choice, while Model 2 (columns 4-6) excluded these 1994 variables.
|
||||||
| TABLE D-17. Any Rehabilitation Services (Employer B) Non-Linear Least-Squares and Probit Regressions | ||||||
|---|---|---|---|---|---|---|
| Independent Variables | Selection Model 11 | Selection Model 21 | Non-Endogenous Model 12 | |||
| Parameter Estimates |
Standard Errors |
Parameter Estimates |
Standard Errors |
Parameter Estimates |
Standard Errors |
|
| Constant | -0.305 | (0.261) | -1.443 | (0.571)** | -1.877 | (0.125)** |
| INSURANCE CHOICE | ||||||
| HMO 1995 | -2.891 | (0.361)** | -0.681 | (0.812) | 0.049 | (0.022)** |
| DEMOGRAPHIC CHARACTERISTICS | ||||||
| Gender | 0.002 | (0.042) | -0.019 | (0.029) | -0.046 | (0.022)** |
| Age | -0.019 | (0.009)** | -0.002 | (0.009) | -0.001 | (0.005) |
| Age Squared | 0.000 | (0.000) | 0.000 | (0.000) | 0.000 | (0.000) |
| Child | 0.220 | (0.098)** | 0.134 | (0.059)** | 0.157 | (0.051)** |
| INSURANCE STATUS | ||||||
| Spouse | 0.057 | (0.048) | 0.017 | (0.031) | 0.010 | (0.025) |
| Dependent | -0.918 | (0.180)** | -0.313 | (0.215) | -0.227 | (0.084)** |
| EMPLOYMENT STATUS | ||||||
| Early Retiree | -0.366 | (0.083)** | -0.045 | (0.119) | 0.029 | (0.033) |
| HEALTH CONDITIONS | ||||||
| Number of unique MDCs 1995 | 0.158 | (0.012)** | 0.123 | (0.011)** | 0.118 | (0.005)** |
| DISABILITY STATUS | ||||||
| Activity limiting condition | 0.762 | (0.067)** | 0.529 | (0.047)** | 0.500 | (0.024)** |
| Mental per se disability only | -0.120 | (0.081) | -0.056 | (0.052) | -0.105 | (0.041)** |
| Physical and mental per se disability | -0.207 | (0.093)** | -0.062 | (0.075) | -0.023 | (0.046) |
| SELECTION PARAMETER | ||||||
| Theta | 1.916 | (0.235)** | 0.456 | (0.511) | — | --- |
| SUM OF SQUARED RESIDUALS3 | 2780.254 | 2814.017 | ||||
| LIKELIHOOD FUNCTION4 | -9158.997 | |||||
* significant at the p = .05 level. ** significant at the p = .001 level. Model 1 (columns 1-3) used 1994 utilization measures as predictors of insurance choice, while Model 2 (columns 4-6) excluded these 1994 variables.
|
||||||
| TABLE D-18. Inpatient Payments (Employer B) Non-Linear Least-Squares Regressions | ||||||
|---|---|---|---|---|---|---|
| Independent Variables | Selection Model 11 | Selection Model 21 | Non-Endogenous Model 12 | |||
| Parameter Estimates |
Standard Errors |
Parameter Estimates |
Standard Errors |
Parameter Estimates |
Standard Errors |
|
| Constant | -4.719 | (1.928)** | -3.416 | (2.059)* | -4.536 | (1.077)** |
| INSURANCE CHOICE | ||||||
| HMO 1995 | 0.035 | (1.423) | -1.503 | (2.576) | -0.140 | (0.125) |
| DEMOGRAPHIC CHARACTERISTICS | ||||||
| Gender | 0.552 | (0.121)** | 0.580 | (0.139)** | 0.551 | (0.120)** |
| Age | 0.051 | (0.050) | 0.034 | (0.050) | 0.049 | (0.043) |
| Age Squared | 0.000 | (0.000) | 0.000 | (0.000) | 0.000 | (0.000) |
| Child | -0.444 | (0.627) | -0.451 | (0.633) | -0.437 | (0.637) |
| INSURANCE STATUS | ||||||
| Spouse | 0.009 | (0.092) | 0.025 | (0.098) | 0.010 | (0.093) |
| Dependent | 0.367 | (0.998) | -0.006 | (0.965) | 0.315 | (0.825) |
| EMPLOYMENT STATUS | ||||||
| Early Retiree | 0.214 | (0.221) | 0.009 | (0.383) | 0.196 | (0.166) |
| HEALTH CONDITIONS | ||||||
| Number of unique MDCs 1995 | 0.298 | (0.024)** | 0.296 | (0.023)** | 0.296 | (0.023)** |
| DISABILITY STATUS | ||||||
| Activity limiting condition | 0.993 | (0.107)** | 0.981 | (0.109)** | 0.991 | (0.107)** |
| Mental per se disability only | -1.360 | (0.190)** | -1.383 | (0.195)** | -1.361 | (0.190)** |
| Physical and mental per se disability | -0.285 | (0.186) | -0.376 | (0.254) | -0.291 | (0.170)* |
| SELECTION PARAMETER | ||||||
| Theta | -0.103 | (0.846) | 0.835 | (1.523) | — | --- |
| SUM OF SQUARED RESIDUALS3 | 127052.140 | 127033.910 | 127053.160 | |||
* significant at the p = .05 level. ** significant at the p = .001 level. Model 1 (columns 1-3) used 1994 utilization measures as predictors of insurance choice, while Model 2 (columns 4-6) excluded these 1994 variables.
|
||||||
| TABLE D-19. Outpatient Payments (Employer B) Non-Linear Least-Squares Regressions | ||||||
|---|---|---|---|---|---|---|
| Independent Variables | Selection Model 11 | Selection Model 21 | Non-Endogenous Model 12 | |||
| Parameter Estimates |
Standard Errors |
Parameter Estimates |
Standard Errors |
Parameter Estimates |
Standard Errors |
|
| Constant | 0.473 | (0.337) | -1.261 | (1.601) | -1.877 | (0.285)** |
| INSURANCE CHOICE | ||||||
| HMO 1995 | -3.713 | (0.553)** | -1.061 | (2.051) | -0.349 | (0.047)** |
| DEMOGRAPHIC CHARACTERISTICS | ||||||
| Gender | 0.295 | (0.059)** | 0.244 | (0.062)** | 0.230 | (0.047)** |
| Age | 0.007 | (0.010) | 0.027 | (0.021) | 0.035 | (0.012)** |
| Age Squared | 0.000 | (0.000)** | 0.000 | (0.000)** | 0.000 | (0.000)** |
| Child | 0.449 | (0.132)** | 0.382 | (0.128)** | 0.389 | (0.129)** |
| INSURANCE STATUS | ||||||
| Spouse | 0.043 | (0.059) | 0.017 | (0.058) | 0.008 | (0.052) |
| Dependent | -0.918 | (0.187)** | -0.338 | (0.501) | -0.171 | (0.199) |
| EMPLOYMENT STATUS | ||||||
| Early Retiree | -0.410 | (0.097)** | -0.042 | (0.277) | 0.049 | (0.062) |
| HEALTH CONDITIONS | ||||||
| Number of unique MDCs 1995 | 0.193 | (0.012)** | 0.228 | (0.011)** | 0.228 | (0.011)** |
| DISABILITY STATUS | ||||||
| Activity limiting condition | 0.205 | (0.050)** | 0.226 | (0.048)** | 0.231 | (0.042)** |
| Mental per se disability only | -0.501 | (0.060)** | -0.445 | (0.059)** | -0.435 | (0.047)** |
| Physical and mental per se disability | -0.280 | (0.098)** | -0.159 | (0.152) | -0.118 | (0.089) |
| SELECTION PARAMETER | ||||||
| Theta | 1.910 | (0.252)** | 0.439 | (1.250) | — | --- |
| SUM OF SQUARED RESIDUALS3 | 146241.980 | 149576.720 | 149593.530 | |||
* significant at the p = .05 level. ** significant at the p = .001 level. Model 1 (columns 1-3) used 1994 utilization measures as predictors of insurance choice, while Model 2 (columns 4-6) excluded these 1994 variables.
|
||||||
| TABLE D-20. Total Expenditures (Employer B) Non-Linear Least-Squares Regressions | ||||||
|---|---|---|---|---|---|---|
| Independent Variables | Selection Model 11 | Selection Model 21 | Non-Endogenous Model 12 | |||
| Parameter Estimates |
Standard Errors |
Parameter Estimates |
Standard Errors |
Parameter Estimates |
Standard Errors |
|
| Constant | -0.839 | (0.596) | -2.017 | (1.899) | -2.788 | (0.541)** |
| INSURANCE CHOICE | ||||||
| HMO 1995 | -2.483 | (0.582)** | -1.150 | (2.378) | -0.244 | (0.067)** |
| DEMOGRAPHIC CHARACTERISTICS | ||||||
| Gender | 0.412 | (0.067)** | 0.405 | (0.080)** | 0.386 | (0.061)** |
| Age | 0.015 | (0.020) | 0.033 | (0.032) | 0.043 | (0.022)** |
| Age Squared | 0.000 | (0.000)* | 0.000 | (0.000)* | 0.000 | (0.000)* |
| Child | 0.131 | (0.292) | 0.084 | (0.322) | 0.092 | (0.324) |
| INSURANCE STATUS | ||||||
| Spouse | 0.039 | (0.057) | 0.030 | (0.061) | 0.019 | (0.054) |
| Dependent | -0.574 | (0.425) | -0.164 | (0.733) | 0.049 | (0.481) |
| EMPLOYMENT STATUS | ||||||
| Early Retiree | -0.189 | (0.122) | -0.002 | (0.324) | 0.116 | (0.086) |
| HEALTH CONDITIONS | ||||||
| Number of unique MDCs 1995 | 0.234 | (0.013)** | 0.260 | (0.011)** | 0.259 | (0.011)** |
| DISABILITY STATUS | ||||||
| Activity limiting condition | 0.503 | (0.051)** | 0.522 | (0.054)** | 0.529 | (0.049)** |
| Mental per se disability only | -0.733 | (0.067)** | -0.718 | (0.077)** | -0.705 | (0.067)** |
| Physical and mental per se disability | -0.303 | (0.105)** | -0.243 | (0.108 | -0.189 | (0.090)** |
| SELECTION PARAMETER | ||||||
| Theta | 1.344 | (0.322)** | 0.558 | (1.444) | — | --- |
| SUM OF SQUARED RESIDUALS3 | 191982.670 | 193014.760 | 193048.310 | |||
* significant at the p = .05 level. ** significant at the p = .001 level. Model 1 (columns 1-3) used 1994 utilization measures as predictors of insurance choice, while Model 2 (columns 4-6) excluded these 1994 variables.
|
||||||
| TABLE D-21. Estimated Incremental Effects1 of POS Choice on Utilization and Expenditure Measures (Employer A) | ||||
|---|---|---|---|---|
| Mean/Median Value |
Selection Model2 |
Selection Parameter3 |
Non-Endogeneous Model4 |
|
| HEALTH CARE USAGE | ||||
| Number of Hospital Admissions | n.s. | n.s. | n.s. | |
| Number of Hospital Days | n.s. | n.s. | n.s. | |
| Number of Outpatient Visits | 15.745 | n.s. | n.s. | -1.254 |
| Any Rehabilitation Services | 0.330 | — | 0.034 | |
| EXPENDITURES | ||||
| Inpatient Payments | n.s. | n.s. | n.s. | |
| Outpatient Payments | 1529.000 (median) |
2698.513 | — | -210.343 |
| Total Payments | n.s. | n.s. | n.s. | |
| PRESCRIPTION DRUG MEASUREMENTS5 | ||||
| Number of Prescriptions | 18.146 | n.s. | n.s. | -3.627 |
| Prescription Payments | 552.625 (median) |
n.s. | n.s. | -74.592 |
| Total Payments Including Prescriptions | n.s. | n.s. | n.s. | |
n.s. indicates parameter estimate insignificant at conventional levels.
|
||||
| TABLE D-22. Estimated Incremental Effects1 of HMO Choice on Utilization and Expenditure Measures (Employer A) | |||||
|---|---|---|---|---|---|
| Mean/Median Value |
Selection Model2 |
Selection Parameter |
Selection Model2 |
Non-Endogeneous Model3 |
|
| HEALTH CARE USAGE | |||||
| Number of Hospital Admissions | 0.218 | -0.192 | + | n.s. | n.s. |
| Number of Hospital Days | 1.311 | n.s. | n.s. | n.s. | 0.538 |
| Number of Outpatient Visits | 15.287 | -14.152 | + | n.s. | -1.358 |
| Any Rehabilitation Services | 0.157 | -0.355 | + | n.s. | 0.011 |
| EXPENDITURES | |||||
| Inpatient Payments | n.s. | n.s. | n.s. | n.s. | |
| Outpatient Payments | 1499.000 (median) |
-1413.638 | + | n.s. | -426.885 |
| Total Payments | 1555.000 (median) |
-1425.169 | + | n.s. | -336.677 |
n.s. = Indicates parameter estimates insignificant at conventional levels.
|
|||||