
U.S. Department of Health and Human Services
Disability Among Women on AFDC: An Issue Revisited
Michele Adler
Office of the Assistant Secretary for Planning and Evaluation, U.S. Department of Health and Human Services
1993
PDF Version (12 PDF pages)
This article appeared in the American Statistical Association Proceedings 1993 "Government Statistics Section". For additional information, you may visit the DALTCP home page at http://aspe.hhs.gov/daltcp/home.htm or contact the office at HHS/ASPE/DALTCP, Room 424E, H.H Humphrey Building, 200 Independence Avenue, SW, Washington, DC 20201. The e-mail address is: webmaster.DALTCP@hhs.gov. The DALTCP Project Officer was Michele Adler.
The opinions and views expressed in this report are those of the author. They do not necessarily reflect the views of the Department of Health and Human Services.
I. PURPOSE AND BACKGROUND
Aid to Families with Dependent Children (AFDC) is the major government program which provides cash assistance for low-income children and their parents. Eligibility is based on income and family characteristics, not disability. Supplemental Security Income (SSI) is a Federal program, which provides cash assistance to low-income persons with disabilities. Yet, according to the 1984 Survey of Income and Program Participation (SIPP), 22.3% of all women on AFDC between the ages of 15-45 has a disability. In 1990, the proportion remained significantly high at 19%.
Since 1984, a number of welfare reform proposals intended to lessen dependence on AFDC have been enacted. The current Administration is continuing to address welfare dependency. The purpose of this paper is to update results on the disability status of women of AFDC based on the 1990 SIPP with welfare reform in mind.
Two sets of comparisons are made: (1) between women aged 15-45 according to their disability and AFDC status (on AFDC, never on AFDC and formerly on); and (2) between women on AFDC with and without disabilities.
The current welfare reform effort is still evolving and specifics cannot be given here. Past welfare reform efforts have focused on work and job training. Disability is of special concern, because it often limits or prevents the ability to work. Disability among other family members is also examined, as caregiving obligations could interfere with work efforts.
II. SOURCE AND METHODS
Data are from the Wave 2 Topical Modules on Welfare History and Employment History and the Wave 3 Topical Module on Disability and Health from the 1990 SIPP, a nationally representative survey of adults aged 15+ in the civilian non-institutionalized population. The 1990 SIPP consisted of 22,000 households: 19,000 from a national probability sample and 3,000 from a low-income oversample, including about 1,200 women on AFDC.
Functional disabilities (commonly accepted measures) served as the basis for analysis. Adults reported having a functional disability if they had difficulty performing activities (walking, climbing stairs, bathing, dressing) or reported sensory difficulties (hearing, seeing, speaking), because of a mental or physical impairment. Children's functional disabilities were also included. Work disability (limitations in the ability to work due to medical impairments) was also examined, but not chosen as the basis of analysis, as perceptions of ability to work include many unmeasurable factors besides disability (i.e. motivation to work). Analyses were limited to women under 45.
III. THE AFDC AND SSI PROGRAMS
The AFDC program is targeted on low-income children and their parents. Most families are headed by women. AFDC is administered by the States and jointly funded by both the Federal and State governments. In order to qualify for AFDC, a child must be deprived of parental care and support due to the death, incapacity, continued absence from the home, or unemployment of at least one parent. AFDC recipients automatically receive Medicaid and most receive Food Stamps.
The SSI program is targeted on low-income persons who are blind, disabled, or aged (past 65 years). SSI disability criteria are strict: adults must be unable to engage in substantial gainful activity (earn more than $500/month), due to a medically determined physical or mental impairment expected to last at least 12 months or end in death. Typically, the younger an adult, the harder it is to qualify for SSI.
Benefits from both AFDC and SSI can be received by people in the same family, but not by the same person (i.e. disabled parents can receive SSI for themselves and AFDC on behalf of their dependent children). In families where a disabled child receives, SSI, AFDC can be received by that child's parent and siblings: 13.7% of disabled women and 3.9% of all women on AFDC receive SSI. SIPP does not collect data on SSI receipt for children, so these figures are underestimates. Many SSI children live in AFDC families according to a 1979 study in which 42% of disabled children on SSI lived in households receiving either AFDC or State or local general assistance. (Ellwood)
Monthly AFDC checks are typically much lower than SSI payments (and unlike AFDC) are indexed to inflation. SSI comes from Federal revenues, while AFDC comes from both Federal and State revenues (each contributes about 50%). Thus, an incentive exists for the both the individual and the State to enroll AFDC recipients on SSI. Since about 1990, the number of children on SSI has nearly doubled (largely due to the Sullivan v. Zebley Supreme Court decision). The number of people on AFDC and the number of disabled adults on SSI and AFDC roles has also grown during that time.
IV. COMPARISONS OF DISABILITY
Prevalence of disability is relatively low among women aged 15-45. Less than 1 in 10 (9.6%) report a disability. Disability rates for the 2.4 million women who reported AFDC (19%) and the 2.5 million who reported formerly receiving AFDC (16.2%) are more than double and significantly higher than rates for the 22.4 million women who reported never getting AFDC (7.9%). Only about 1 in 6 (17.6%) of all women aged 15-45 either receive or used to receive AFDC, but their disability rates are so high that 1 in 3 (31.2%) of all women this age with disabilities are on or were on AFDC.
Age is associated with increasing disability rates. But women on AFDC are so much younger than the general population, that their higher disability rates are surprising. Of women aged 15-45, 47.2% never on AFDC are aged 35-45 compared to 38.4% formerly on AFDC, and 22.6% on AFDC. Disability rates vary by AFDC status for this age group: 9.3% of those never on AFDC and a significantly higher 31% of those on AFDC and 23.8% formerly on AFDC have disabilities.
Besides age, disabilities is associated with poverty and low educational attainment, two major factors linked to AFDC. High frequencies of these factors among women who are on or were on AFDC explain some of the high proportion of disability, but even after controlling for these factors, significant differences remain. Overall disability rates are more than twice as high for women aged 15-45 who live in poverty (17.1%) than for those who live above poverty (8%). Among poor women, a significantly higher proportion of those on AFDC (21.1%) had disabilities compared to those never on AFDC (12.4%). When looking at women who are not poor, the same patterns persist. A significantly higher proportion of women who formerly received AFDC were disabled (14.1%) compared to 7.5% of women never on AFDC.
Disability rates are over twice as high for those who did not finish high school (16.5%) as for those who graduated (8.1%). Rates for those who did not graduate are significantly higher for women on AFDC (23.7%) and higher (but not significant) for formerly on (18.6%) compared to women never on AFDC (13.5%). Disability rates for high school graduates on (15%) or formerly on AFDC (15.4%) are significantly higher than for women never on AFDC (7.1%).
Disability rates also vary by race, with Blacks and American Indians having the highest disability rates and White non-Hispanics, Hispanics, and Asian-Americans the lowest. Among women aged 15-45, 9.1% of White non-Hispanics and 13.8% of Blacks are disabled. AFDC status has an effect: for those on AFDC, disability rates are significantly higher for both White non-Hispanics (20.1%) and Blacks (22.6%). Among women never on AFDC, no racial differences in disability rates exist. Only 8% of both Blacks and Whites never on AFDC reported a disability. For those formerly on AFDC, disability rates for both White non-Hispanics (14.9%) and Blacks (19.4%) were significantly higher.
Typically, more severe disabilities have a greater impact on work. A severe level of disability can be defined as difficulty in performing basic activities commonly referred to the activities of daily living (ADLs), which include bathing, dressing, eating, getting around inside the home, getting into or out of a bed or chair, and using the toilet (including getting to the toilet) and the Instrumental Activities of Daily Living (IADLs), which include using the telephone, getting around outside the house, keeping track of money and bills, preparing meals, and doing light housework. Only 2.5% of women between the ages of 15-45 report having difficulty with an ADL or an IADL activity, but there are profound differences by AFDC status. A significantly higher proportion of women on AFDC (6.2%) and those formerly on AFDC (4.9%) have ADL or IADL difficulties compared to those never on AFDC (1.8%).
Up to 3 of 24 specific physical and mental impairments responsible for disability were obtained (including primary condition) from SIPP respondents. Disabling conditions do not differ much by AFDC status. "Bad backs" were the leading reason for disability for all groups. The 2nd, 3rd, and 4th leading conditions consisted of various combinations of arthritis, respiratory trouble, and "other, not specified".
IV. WOMEN ON AFDC BY DISABILITY
Age: Women with disabilities on AFDC are 3.6 years older than those with no disabilities: 32.6 versus 29 years. Only 19% of women without disabilities on AFDC are aged 35-45 compared to 38.7% of those with disabilities. Women with ADL or IADL difficulties are older than those with more moderate and milder disabilities: a median age of 35.7 versus 32.6 years. (See Table 1)
Race: Fewer racial differences in disability are found among the AFDC population than elsewhere. Only slight differences can be seen and they are not statistically significant: 42.4% of those with disabilities and 39.2% of those with no disabilities are White non-Hispanics. About 48.1% of those with disabilities and 38.8% of those without disabilities are Black.
Marital Status: Women on AFDC who have never married outnumber those who have by 54% to 46%. About 9.6% of AFDC women are married, 3% widowed, and 35.9% are separated/divorced. The share of women who never married does not differ significantly between women with (50.4%) and those with no disabilities (51.1%).
Education: Nearly half (46.3%) of women on AFDC did not finish high school. A significantly higher proportion of those with disabilities did not graduate (57.6%) compared to those not disabled (43.7%).
Employment Factors: Nearly 1 in 4 (24.4%) reported never having been employed. No significant differences were found between women with disabilities and those without disabilities: 24% of those with a disability and 24.5% of those with no disability reported having never been employed. A significantly higher proportion of women with disabilities (59.8%) reported that they were limited in their ability to work due to a health condition compared to only 6.7% of those without disabilities. Women who report a work limitation, but no disability may have conditions such as mental illness, mental retardation, or episodic conditions, such as cancer.
Poverty: Since low income is a factor in AFDC eligibility, many women on AFDC are poor (78.9%). Although a slightly higher proportion of women with disabilities (87%) than those without disabilities (77%) are poor, differences are not significant.
Other Programs: Most women on AFDC also report getting Food Stamps (84.6%). The proportion of women who receive Food Stamps is higher (but not significant) for those with (87.3%) compared to those without disabilities (83.9%). Overall, 13.7% of those with disabilities and 3.9% of all women on AFDC get SSI. About 31.1% of women with disabilities reported ever applying for SSI and 21.8% for Social Security Disability Insurance (SSDI).
Time on AFDC: Although slightly more (27.8%) women with disabilities report having been on AFDC for at least 10 years than women without disabilities (19.4%), the difference is not statistically significant. Typically, the longer a woman has reported receiving AFDC, the higher her chances of reporting a disability: 18% of those who have been on AFDC less than 2 years, 17.1% of those between 2 and 10 years and 25.2% of those who have been on AFDC for more than 10 years reported having a disability.
Health Status: Self-reported fair or poor health status is a measure of overall well-being not just the absence of infirmity, disease, or disability. Respondents were asked to rate their health status as excellent, very good, good, fair, or poor. Only 7.7% of women aged 15-45 considered themselves to be in fair or poor health compared to 10.5% of women on AFDC with no disabilities and (a significantly higher) 54.1% of those with disabilities. Disability days (in which more than half of the day was spent in bed due to illness of injury) are another measure of overall health status and a possible indicator of ability to work. A significantly higher proportion of women with disabilities (48.4%) reported at least 1 disability day in the last 4 months than women without disabilities (23.6%).
Medical Utilization: No significant differences were found in the proportion of women with and without disabilities who reported a hospital stay in the past year: 21.7% and 19.5%, respectively. The median number of doctor visits reported during the past year were 2½ times higher for women with disabilities (3.2) than for those without disabilities (1.3).
Other Family Members: Even if a woman on AFDC is not disabled, caretaking responsibilities for other disabled family members may interfere with work. The disability rate of children whose mothers are aged 15-45 is 6.3% for those whose mothers were never on AFDC, higher (but not significantly so) at 8.5% for those whose mothers are on AFDC, and significantly higher (9.9%) for those whose mothers were formerly on AFDC. Among AFDC mothers, a significantly higher share of women with disabilities also have a disabled child (22.6%) compared to only 10.4% of AFDC mothers with no disabilities. Many women on AFDC, both with and without disabilities, also have a disabled adult residing in the household: 21.4% of those with disabilities and 10.1% of those without disabilities. In the AFDC population, 37.6% of disabled women and 19% of women without disabilities have another disabled adult or child in the house.
V. IMPLICATIONS FOR WORK
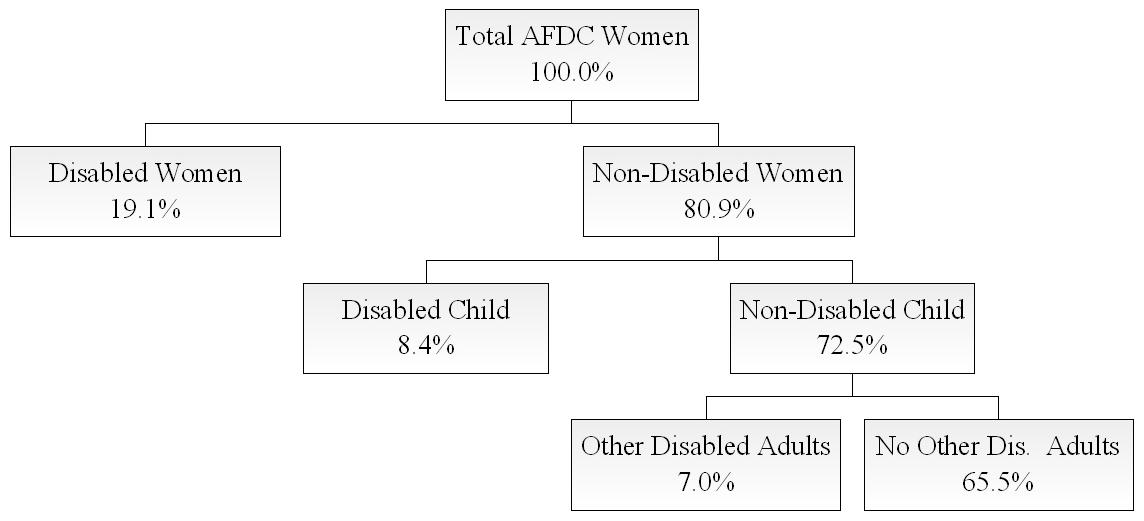
The presence of a disability often limits ability to work, yet, many people with disabilities are employed. Similarly, while the presence of another disabled person in the house may limit a woman's ability to work, if does not automatically preclude her from employment. Finally, not all disabilities are severe enough to substantially limit work. Still, it is useful to map out how many women on AFDC could be eligible for employment. Breakdowns of the percentage of women on AFDC who may be eligible to register for work if all those with disabilities are exempted are shown in Chart 1. (Note percentages on Chart 1 differ slightly from overall prevalence rates due to data matching procedures.)
- Step 1: 19.1% may be exempt because of their own disability, leaving 80.9% with no disabilities.
- Step 2: Another 8.4% could be exempt, because although they themselves are not disabled, they have a disabled child.
- Step 3: An additional 7% could be exempt, because even though they are not disabled and do not have a disabled child, they have a disabled adult residing in their home.
- Step 4: After all exemptions are taken, 65.5% of women on AFDC are not disabled, do not have a disabled child, and do not live with another disabled adult, remain.
VI. CONCLUSIONS
The reasons why disability rates are so high among the AFDC population and those who used to be on AFDC even after poverty, education, and race are considered are unclear. While we know that changes in disability status (including improvement) occur over time, we know little about the extent of these changes nor how they relate to the AFDC population. It will be useful to examine Wave 6 of the 1990 SIPP, which contains data for the first time on changes in both AFDC and disability.
Disability does not automatically interfere with work for the AFDC population or for anyone else. Times have changed and disabled people are no longer automatically written off as prospects for employment. The 1989 passage of the Americans with Disabilities Act (ADA) prohibits discrimination against people with disabilities, including in the workplace. Knowledge gained from the work incentive provisions of the SSI and SSDI programs may prove useful to the AFDC population. Finally, disability is a complication not a dead end. The identification of a disability in a woman on AFDC does not necessarily preclude her from employment and leaving welfare. Nor may the presence of disabled child, who may be attending school during the workday, necessarily exclude her from employment.
VII. SOURCES
-
Adler, Michele C.; "Health and Disability of the AFDC Families"; Proceedings of the American Statistical Association; Social Statistics Section; 1988. [http://aspe.hhs.gov/daltcp/reports/afdc.htm]
-
Ellwood, Marilyn R., Reither, M., Goldman, R., and VandeVanter, M.; Survey of Blind and Disabled Children Receiving SSI Benefits, SSA Pub. No. 13-11728, Social Security Administration, Washington DC, 1980.
-
U.S. Bureau of the Census, SIPP Public-Use Data Tapes (Waves 2 and 3) and Accompanying Documentation, 1993.
-
U.S. House Committee on Ways and Means; 1993 Green Book; Committee Print WMCP 103-18; July 7, 1993.
ACKNOWLEDGEMENTS
This paper could not have been written without the superb SIPP knowledge and programming skills of Ruth Fu and Don Chontos. Thanks also go to Bill Prosser for his encouragement and many helpful suggestions, to Steve Bartolomei-Hill for his review and advice, and Brenda Veazey for tables and charts.
| TABLE 1. Characteristics of Women on AFDC | |||
| Disabled | Not Disabled | Total | |
| Number | 465,672 | 1,977,915 | 2,443,587 |
| Rate | 19.0%* | 81.2% | 100.0% |
| Median Age | 32.6 years | 29.0 years | 29.8 years |
| RACE | |||
| % White | 42.0 | 39.2 | 39.8 |
| % Black | 48.1 | 38.8 | 40.5 |
| % Hispanic | --- | 18.1 | 15.9 |
| MARITAL STAUS | |||
| % Never Married | 51.7 | 54.7 | 54.1 |
| EDUCATION | |||
| % Did Not Finish High School | 57.6* | 43.7 | 46.3 |
| EMPLOYMENT | |||
| % Never Employed | 24.0 | 24.5 | 24.4 |
| % Work Limited | 59.8* | 6.7 | 16.2 |
| ECONOMIC STATUS | |||
| % Poor | 87.0 | 77.0 | 78.9 |
| % 10+ Years on AFDC | 27.8 | 19.4 | 21.0 |
| % on Food Stamps | 87.3 | 83.9 | 84.6 |
| % on SSI | 13.7** | --- | 3.9** |
| % Applied for SSI | 31.1** | --- | 9.6 |
| % Applied for SSDI | 21.8** | --- | 6.1** |
| HEALTH STATUS | |||
| % in Fair/Poor Health | 54.1* | 10.5 | 18.8 |
| % with Disability Days in Past Year | 48.4* | 23.6 | 28.3 |
| % with Hospital Stays in Past Year | 21.7 | 19.5 | 19.9 |
| Median # of Doctor Visits in Past Year | 3.2* visits | 1.3 visits | 1.6 visits |
| STATUS OF FAMILY MEMBERS | |||
| % with Disabled Children | 22.6* | 10.4 | 12.7 |
| % with Other Disabled Children or Adults | 37.6* | 19.0 | 22.5 |
| * Statistically significant at 95% level. Comparisons were made between women with and those without disabilities.** Small sample size.SOURCE: 1990 SIPP. | |||
| CHART 1. AFDC Disability Chart |
 |