
Hospital and Emergency Department Use by People with Alzheimers Disease and Related Disorders: Final Report
Zhanlian Feng, PhD, Laurie Coots, MS, MA, Yevgeniya Kaganova, PhD, and Joshua Wiener, PhD
RTI International
August 2013
This report was prepared undercontract #HHSP23320100021WI between the U.S. Department of Health and Human Services (HHS), Office of Disability, Aging and Long-Term Care Policy (DALTCP) and RTI International. For additional information about this subject, you can visit the DALTCP home page at http://aspe.hhs.gov/office_specific/daltcp.cfm or contact the ASPE Project Officer, Hakan Aykan, at HHS/ASPE/DALTCP, Room 424E, H.H. Humphrey Building, 200 Independence Avenue, S.W., Washington, D.C. 20201. His e-mail address is: Hakan.Aykan@hhs.gov.
The opinions and views expressed in this report are those of the authors. They do not necessarily reflect the views of the Department of Health and Human Services, the contractor or any other funding organization.
TABLE OF CONTENTS
- 1. INTRODUCTION
- 3. METHODS
- 3.1. Data Sources
- 3.2. Study Population
- 3.3. Definition of Cognitive Impairment
- 3.4. Dependent Variables
- 3.5. Other Independent and Control Variables
- 3.6. Analytic Approach
- 4. RESULTS: HOSPITAL AND EMERGENCY DEPARTMENT USE, BY COGNITIVE IMPAIRMENT
- 4.1. Prevalence of Cognitive Impairment
- 4.2. Hospital and Emergency Department Users, by Cognitive Impairment and Residential Setting
- 4.3. Utilization Patterns among Medicare Beneficiaries: Overall Health and Retirement Study Sample
- 4.4. Utilization Patterns among Health and Retirement Study Decedents: Last Year of Life
- 4.5. Utilization Patterns in the Last 5 Years of Life
- 4.6. Utilization Patterns in the Last 12 Months of Life
- 5. RESULTS: MEDICARE EXPENDITURES FOR HOSPITAL AND EMERGENCY DEPARTMENT USE, BY COGNITIVE IMPAIRMENT
- 5.1. Expenditures for Medicare Beneficiaries: Overall Health and Retirement Study Sample
- 5.2. Expenditures for Health and Retirement Study Decedents: Last Year of Life
- 6. SUMMARY AND CONCLUSIONS
- 6.1. Findings and Policy Implications
- 6.2. Limitations
- 6.3. Future Research
- 6.4. Conclusions
- 7. REFERENCES
- TECHNICAL APPENDIX
- APPENDIX A1: Illustration of Analytic Sample Inclusion and Exclusion Criteria
- APPENDIX A2: Comparison of Alternative Measures of Cognitive Impairment
- APPENDIX A3: Conditions Defined as Potentially Avoidable Hospitalizations According to Setting
- APPENDIX A4: Description of Analytic Samples: Medicare Beneficiaries in the HRS, 2000-2008
- APPENDIX A5: Description of Analytic Samples: HRS Decedents, 2000-2008
- APPENDIX A6: Medicare Beneficiaries in the HRS with Hospital and ED Use, 2008, by CI and Residential Setting
- APPENDIX A7: Medicare Decedents in the HRS with Hospital and ED Use in the Last Year of Life, 2008, by CI and Residential Setting
- APPENDIX A8: Effect of CI on Hospital and ED Use by Medicare Beneficiaries in the Community: XTGEE Logistic Regression Model Results
- APPENDIX A9: Effect of CI on Hospital and ED Use by Medicare Beneficiaries in Nursing Homes: XTGEE Logistic Regression Model Results
- APPENDIX A10: Hospital and ED Use among Medicare Beneficiaries in the HRS, 2000-2008, by CI
- APPENDIX A11: Annualized Rates of Hospital and ED Visits among Medicare Beneficiaries in the HRS, 2000-2008
- APPENDIX A12: Effect of CI on Hospital and ED Use in the Last Year of Life among Community Decedents: Logistic Regression Model Results
- APPENDIX A13: Effect of CI on Hospital and ED Use in the Last Year of Life among Nursing Home Decedents: Logistic Regression Model Results
- APPENDIX A14: Hospital and ED Use in the Last Year of Life among HRS Decedents, 2000-2008, by CI
- APPENDIX A15: Annualized Rates of Hospital and ED Visits among Medicare Beneficiaries in the Last Year of Life among HRS Decedents, 2000-2008
- APPENDIX A16: Two-Part Model Results on Medicare Expenditures: Medicare Beneficiaries in the Community
- APPENDIX A17: Two-Part Model Results on Medicare Expenditures: Medicare Beneficiaries in Nursing Homes
- APPENDIX A18: Medicare Expenditures for Hospital and ED Visits among Medicare Beneficiaries in the HRS, 2000-2008, by CI
- APPENDIX A19: Two-Part Model Results on Medicare Expenditures in the Last Year of Life: Community Decedents
- APPENDIX A20: Two-Part Model Results on Medicare Expenditures in the Last Year of Life: Nursing Home Decedents
- APPENDIX A21: Medicare Expenditures for Hospital and ED Visits in the Last Year of Life Among HRS Decedents, 2000-2008, by CI
- LIST OF FIGURES
- FIGURE 4-1: Prevalence of Cognitive Impairment among Medicare Beneficiaries in the HRS
- FIGURE 4-2: Medicare Beneficiaries in the HRS with Hospital and ED Use, 2008, by CI and Residential Setting
- FIGURE 4-3: Medicare Decedents in the HRS with Hospital and ED Use in the Last Year of Life, 2008, by CI and Residential Setting
- FIGURE 4-4: Percent of HRS Decedents from the Community with any Hospitalization Each Year in the Last 5 Years of Life, by CI
- FIGURE 4-5: Percent of HRS Decedents from the Community with any ED Visit Each Year in the Last 5 Years of Life, by CI
- FIGURE 4-6: Percent of HRS Decedents from Nursing Homes with Any Hospitalization Each Year in the Last 5 Years of Life, by CI
- FIGURE 4-7: Percent of HRS Decedents from Nursing Homes with any ED Visit Each Year in the Last 5 Years of Life, by CI
- FIGURE 4-8: Percent of HRS Decedents from the Community with Any Hospitalization Each Month in the Last 12 Months of Life, by CI
- FIGURE 4-9: Percent of HRS Decedents from the Community with Any ED Visit Each Month in the Last 12 Months of Life, by CI
- FIGURE 4-10: Percent of HRS Decedents from Nursing Homes with Any Hospitalization Each Month in the Last 12 Months of Life, by CI
- FIGURE 4-11: Percent of HRS Decedents from Nursing Homes with Any ED Visit Each Month in the Last 12 Months of Life, by CI
- FIGURE A2-1: Trend in the Prevalence of CI, according to the Hybrid Definition of CI, 2000-2008
- LIST OF TABLES
- TABLE 4-1: Effects of CI on Hospital and ED Use among Medicare Beneficiaries in the HRS, 2000-2008
- TABLE 4-2: Hospital and ED Use among Medicare Beneficiaries in the HRS, 2000-2008, by CI
- TABLE 4-3: Effects of CI on Hospital and ED Use in the Last Year of Life among HRS Decedents, 2000-2008
- TABLE 4-4: Hospital and ED Use in the Last Year of Life among HRS Decedents, 2000-2008, by CI
- TABLE 5-1: Medicare Expenditures for Hospital and ED Visits among Medicare Beneficiaries in the HRS, 2000-2008, by CI
- TABLE 5-2: Medicare Expenditures for Hospital and ED Visits in the Last Year of Life among HRS Decedents, 2000-2008, by CI
- TABLE A2-1: Definition 1--CI among HRS Respondents Age 65 and Older
- TABLE A2-2: Definition 2--CI among HRS Respondents Age 65 and Older
- TABLE A2-3: Comparison of Definition 1 and Definition
- TABLE A2-4: CCW ADRD Indicator for HRS Respondents Age 65 and Older
- TABLE A2-5: Comparison of the CCW ADRD Indicator and Definition 1, 2008
- TABLE A2-6: Comparison of the CCW ADRD Indicator and Definition 2, 2008
- TABLE A2-7: Hybrid Definition of CI among HRS Respondents Age 65 and Older
- TABLE A2-8: Distribution of Respondents with CI according to the Hybrid Measure of CI, 2008
- TABLE A3-1: Excerpt of Table 1 from Walsh et al., 2012
- TABLE A16-1: Part 1--Predicting the Probability of Having Any Positive Expenditures: XTGEE Logistic Regression Model Results
- TABLE A16-2: Part 2--Predicting the Amount of Positive Expenditures: Generalized Linear Model Results
- TABLE A17-1: Part 1--Predicting the Probability of Having Any Positive Expenditures: XTGEE Logistic Regression Model Results
- TABLE A17-2: Part 2--Predicting the Amount of Positive Expenditures: Generalized Linear Model Results
- TABLE A19-1: Part 1--Predicting the Probability of Having Any Positive Expenditures: Logistic Regression Model Results
- TABLE A19-2: Part 2--Predicting the Amount of Positive Expenditures: Generalized Linear Model Results
- TABLE A20-1: Part 1--Predicting the Probability of Having Any Positive Expenditures: Logistic Regression Model Results
- TABLE A20-2: Part 2--Predicting the Amount of Positive Expenditures: Generalized Linear Model Results
ACKNOWLEDGMENTS
The authors appreciate the advice and support from Hakan Aykan, PhD, in the Department of Health and Human Services Office of the Assistant Secretary for Planning and Evaluation (ASPE), who served as the Project Officer for this study. Peter Kemper, PhD, Deputy Assistant Secretary of Disability, Aging and Long-Term Care Policy at ASPE, provided guidance in many aspects of the design and implementation of this study. This project has also benefited from input from members of a Technical Advisory Group consisting of the following individuals: Jessica Faul, PhD, MPH(University of Michigan), David C. Grabowski, PhD (Harvard University), Katie Maslow, MSW (Institute of Medicine, National Academy of Sciences), Joseph G. Ouslander, MD (Florida Atlantic University), Joan Teno, MD, MS (Brown University), Colin S. Baker, PhD (National Institute on Aging), Helen Lamont, PhD (ASPE), Evan Shulman (Centers for Medicare and Medicaid Services), and William D. Spector, PhD (Agency for Healthcare Research and Quality).
ACRONYMS
Most of these acronyms are used throughout this report; some are only used within Figures and Tables.
| Acronyms | |
| ACS | ambulatory care sensitive |
| ADAMS | Aging, Demographics, and Memory Study |
| ADL | activity of daily living |
| ADRD | Alzheimer's disease and related dementia |
| ASPE | Office of the Assistant Secretary for Planning and Evaluation |
| BASF | beneficiary annual summary file |
| CCW | Chronic Condition Data Warehouse |
| CHF | congestive heart failure |
| CI | cognitive impairment |
| CIND | cognitive impairment, no dementia |
| CMS | Centers for Medicare and Medicaid Services |
| COPD | chronic obstructive pulmonary disease |
| ED | emergency department |
| FFS | fee-for-service |
| HMO | health maintenance organization |
| HRS | Health and Retirement Study |
| IADL | instrumental activity of daily living |
| N | no |
| NF | nursing facility |
| NH | nursing home |
| OR | odds ratios |
| SD | standard deviation |
| TAG | Technical Advisory Group |
| TEP | Technical Expert Panel |
| TICS | Telephone Interview for Cognitive Status |
| UTI | urinary tract infection |
| XTGEE | cross-sectional time series generalized estimating equation |
| Y | yes |
EXECUTIVE SUMMARY
Introduction
Alzheimer's disease and related disorders (ADRD) affected approximately 4.7 million Americans age 65 or older in 2010. As the United States population ages, the number of people with ADRD is projected to increase dramatically in the coming decades, placing substantial emotional, physical, and financial burdens on patients, families, and society. One significant burden results from frequent, and often potentially avoidable, hospitalizations and emergency department (ED) visits, which have important implications for the quality of care and quality of life for people with ADRD or cognitive impairments. Understanding the patterns of hospital and ED use by people with ADRD or cognitive impairments relative to others without these conditions is crucial for developing appropriate policies to better address the care needs of this vulnerable population.
Methods
Using longitudinal, nationally representative data from the Health and Retirement Study (HRS) linked with Medicare claims over the 2000-2008 period, this study examined the effect of ADRD and cognitive impairment on hospitalizations and ED visits, both overall and potentially avoidable, and associated Medicare expenditures among fee-for-service (FFS) Medicare beneficiaries age 65 or older. Analyses compared utilization patterns across care settings (community vs. nursing home) and at different stages of the life course (several years before death vs. last year of life). Detailed utilization data are not available on Medicare beneficiaries enrolled in managed care organizations; therefore, beneficiaries enrolled in those health plans were excluded from the analysis. We developed a measure of severe cognitive impairment consistent with dementia by combining ADRD diagnoses from Medicare claims and a validated cognitive impairment measure from HRS, which incorporates information on cognitive functioning from both self and proxy reports.
We defined three broad categories of outcome variables: (1) hospitalizations, overall and whether potentially avoidable; (2) ED visits, overall and whether potentially avoidable; and (3) Medicare expenditures for each type of service use. Potentially avoidable hospitalizations or ED visits generally refer to hospital admissions or ED visits that may have been prevented with better primary care in community settings or treatment in a nursing home (for nursing home residents). We defined potentially avoidable hospitalizations and ED visits using a conservative set of conditions that experts deemed potentially preventable or manageable in community settings.
Results
Prevalence of cognitive impairment differs substantially by residential setting and proximity to death. Approximately 11% of community-dwelling Medicare beneficiaries age 65 or older were cognitively impaired, in contrast with 62% of those in nursing homes. The prevalence of cognitive impairments rose sharply at the time of death: 32% among community decedents, and 76% among nursing home decedents.
The impact of cognitive impairment on hospital and ED use varies by residential setting. Specifically, among community-dwelling beneficiaries, individuals with cognitive impairment are significantly more likely than those without cognitive impairment to be hospitalized and to have ED visits annually, both overall and for potentially avoidable conditions, after adjusting for demographic, socioeconomic, and health-related risk factors. For example, controlling for various factors, 25.6% of Medicare FFS beneficiaries with cognitive impairment had a hospitalization annually, compared with 17.5% of Medicare FFS beneficiaries without cognitive impairment. Moreover, controlling for various factors, 7.3% of beneficiaries with cognitive impairment had a potentially avoidable hospitalization, compared with 4.2% of people without cognitive impairment. In terms of ED visits, adjusting for various factors, 34.0% of beneficiaries with cognitive impairment had ED visits, compared with 24.4% of beneficiaries without cognitive impairment.
In contrast, among nursing home residents, there is no significant difference in hospitalization by cognitive impairment status, either overall or potentially avoidable. Although people with cognitive impairment in nursing homes do not have higher rates of hospitalizations and potentially avoidable hospitalizations than people without cognitive impairment, the absolute rates are quite high (nearly 50%). Moreover, more than 40% of nursing home residents with hospitalizations (both those with and without cognitive impairment) have potentially avoidable hospitalizations.
Hospital and ED use by people with and without cognitive impairment converge during the last few years of life. Among community decedents, there is no significant difference by cognitive impairment status in hospitalization in the last year of life, either overall (78.3% with cognitive impairment vs. 78.9% without cognitive impairment) or potentially avoidable (37.7% with cognitive impairment vs. 36.7% without cognitive impairment). Community decedents with cognitive impairments were more likely than those with no cognitive impairment to have an outpatient ED visit without admission in the last year of life (50.5% vs. 43.9%). A comparison of hospital and ED use patterns in the last 5 years of life between community-living beneficiaries with and without cognitive impairment showed a convergence in utilization as time to death becomes shorter. In addition, during the last year of life, hospital and ED use rose sharply relative to previous years, regardless of cognitive impairment status, and the utilization gap by cognitive impairment diminished.
Nursing home residents who died with cognitive impairment were significantly less likely than those without cognitive impairment to be hospitalized during the last year of life. Among nursing home decedents, individuals with cognitive impairment were significantly less likely than those without cognitive impairment to be hospitalized in their last year of life (67.9% vs. 77.9%). Other utilization outcomes during the last year of life did not vary by cognitive status.
Medicare expenditures associated with hospital and ED use for people with cognitive impairment and people without cognitive impairment differ by residential setting and proximity to death. In the overall analysis, average Medicare expenditures for people with cognitive impairment are higher than for people without cognitive impairment, regardless of setting. In contrast, we found lower average expenditures associated with hospitalizations in the last year of life for beneficiaries with cognitive impairment than those without cognitive impairment, both in the community and in nursing homes.
Conclusions
High rates of hospitalization and ED use among community-based people with cognitive impairments, both overall and for potentially avoidable conditions, may be attributable to multiple factors, such as challenges in providing adequate ambulatory care for people with cognitive impairments in community settings. In comparison, most nursing homes are equipped to provide medical and nursing care for many conditions that would be difficult to manage in community settings. Moreover, given the high prevalence of dementia in nursing homes, these facilities may be more used to treating people with ADRD than are community-based physicians. Although people with cognitive impairment in nursing homes do not have higher rates of hospitalizations and potentially avoidable hospitalizations than people without cognitive impairment, the high nominal rates for both groups suggests the importance of reducing unnecessary hospitalizations of nursing home residents.
In light of recent estimates indicating that the number of people age 65 or older with Alzheimer's disease will nearly triple by 2050, our results of hospital and ED use and associated Medicare expenditures underscore the importance of addressing issues specific to people with cognitive impairment. From the perspective of people with dementia and their caregivers, the high rates of hospitalizations and ED visits, especially those that are potentially avoidable, have clear implications for quality of life. Similarly, from the perspective of Medicare, the fact that a substantial portion of hospitalizations and ED use is potentially avoidable is of great policy significance because reducing inappropriate utilization in those settings provides a potential opportunity to achieve cost savings while improving quality; however, these savings may be offset by the cost of the initiatives to prevent potentially avoidable utilization. The findings from this study point to the continued need for planning and developing appropriate services and supports for older people with cognitive impairments in both community and institutional settings.
1. INTRODUCTION
Alzheimer's disease is an irreversible, progressive brain disease affecting an estimated 4.7 million Americans age 65 and over in 2010, and this number is projected to nearly triple in the next 40 years, to reach 13.8 million in 2050 (Hebert et al. 2013). Because of perceived stigmas associated with dementia and limited progress in effective screening, diagnosis and treatment, the actual prevalence of Alzheimer's disease and related disorders (ADRD) may be higher than currently estimated. With ADRD increasingly recognized as a major public health issue, the Congress enacted the National Alzheimer's Project Act in 2011 to establish the National Alzheimer's Project, under which a national plan is created and updated to address the disease on an ongoing basis (U.S. Department of Health & Human Services 2013).
ADRD, and more broadly, severe cognitive impairments place substantial emotional, physical, and financial burdens on individuals suffering the disease and their family caregivers as well as on the health and long-term care systems that support and care for them. Potentially avoidable hospitalizations and emergency department (ED) visits are one potentially important source of this burden. These encounters are disruptive, costly, and particularly challenging for individuals with ADRD, who are vulnerable to a host of adverse health outcomes, including delirium (Inouye 2006), falls (Mecocci et al. 2005), functional decline (Pedone et al. 2005), physical restraints Sullivan-Marx 2001), and agitation and related behavioral symptoms (Kovach & Wells 2002; McCloskey 2004). These problems are aggravated by poor communication due to cognitive impairments and multiple co-existing medical conditions (Boustani et al. 2010; Cohen & Pushkar 1999; Hastings et al. 2008; Naylor et al. 2012; Ouslander & Maslow 2012; Reuben et al. 2010). Older adults with dementia not only tend to use more Medicare and Medicaid nursing facility, hospital, and home health care than their counterparts without dementia, but they also have more burdensome transitions across care settings (Callahan et al. 2012; Cohen & Pushkar 1999; Gozalo et al. 2011). Hence, unnecessary or potentially avoidable hospitalizations and ED visits have important implications for the quality of care and quality of life for older people with ADRD (Maslow & Heck 2005; Nikmat, Hawthorne, & Al-Mashoor 2011), especially during their last years of life (Gozalo et al. 2011; Teno et al. 2013).
In addition, since most people with ADRD and cognitive impairments are Medicare beneficiaries because they are age 65 or older and many are Medicaid beneficiaries, the public payer cost implications of hospital and ED use by these people are substantial. Due to their complex medical and long-term care needs, older people with ADRD generally use health care and cost Medicare and Medicaid programs significantly more than those without the condition (Bynum et al. 2004; Kaiser Commission on Medicaid & the Uninsured 2010). Yet, current understanding of the patterns of hospital and ED use by people with ADRD relative to people without the condition remains limited, and results from existing studies are mixed. Potentially avoidable hospitalizations and ED visits, in particular, are not well documented for older people with ADRD and cognitive impairments. Further, there is a paucity of comprehensive analysis of the impact of ADRD and cognitive impairments on hospital and ED use in both community and institutionalized settings. Much less is known about whether hospital and ED use patterns might vary at different stages of ADRD progression, especially during the last years of life.
This study addresses the knowledge gap regarding the patterns of hospital and ED use by Medicare beneficiaries with ADRD and cognitive impairments. Using longitudinal and nationally representative data from the Health and Retirement Study (HRS) linked with Medicare claims over the period 2000-2008, we examined the effect of ADRD and cognitive impairments on hospitalizations and ED visits and associated Medicare expenditures--both overall and potentially avoidable--among fee-for-service (FFS) Medicare beneficiaries age 65 and older. The analyses portray a more complete picture than available in previous studies of hospital and ED use patterns among Medicare beneficiaries with ADRD and cognitive impairment by comparing utilization patterns across care settings (community vs. nursing home) and at different stages of the life course (years long before death vs. last years of life).
The remainder of this report is organized as follows: Section 2 provides a brief literature review on issues pertinent to hospital and ED use by older people with ADRD and cognitive impairments. Section 3 describes the methodology used to address the question of the effect of ADRD and cognitive impairments on hospitalizations and ED visits and associated Medicare expenditures, including data sources, study measures, analytic approach, and potential limitations. Section 4 and Section 5 summarize results from both descriptive and multivariate regression analyses on utilization patterns and associated Medicare expenditures, respectively. In Section 6, we highlight principal findings, discuss policy implications, note study limitations, and outline potential areas for future research. Finally, a Technical Appendix is included which provides further details on inclusion and exclusion criteria for our analytic samples, alternative definitions of cognitive impairments based on survey measures in the HRS as well as Medicare claims data, characteristics of individuals included in the final analytic samples, and complete results from multivariate regression models.
2. LITERATURE REVIEW
Dementia, which includes Alzheimer's disease and a variety of other related diseases and disorders, develops when nerve cells in the brain die or no longer function normally, affecting an individual's cognitive and physical functioning and behavior (Alzheimer's Association 2012). Besides memory loss, these diseases also cause loss of executive function, judgment, orientation as well as the ability to understand and communicate effectively, to speak or understand spoken or written language, to recognize or identify objects, to think abstractly, to make sound judgments, and plan and carry out complex tasks (American Psychiatric Association 1994). Persons with dementia can become combative and aggressive or withdrawn and distressed; they can also experience agitation and depression and wander away from home unsupervised. These symptoms can worsen as the disease progresses, and those with late-stage dementia need round-the-clock care and supervision. Care of a growing number of patients with ADRD poses a serious challenge to the existing United States health care and long-term services and supports infrastructure (Tilly et al. 2011).
Many people with dementia do not have a formal diagnosis of the condition, so it is difficult to develop an accurate figure for the number of people with the condition. As a result, prevalence estimates vary widely (Lin et al. 2010; Taylor, Fillenbaum, & Ezell 2002; Wilson et al. 2011). One recent study estimates that 4.7 million (approximately one out of every eight) Americans age 65 and over had Alzheimer's disease in 2010, and this number is projected to nearly triple in the next 40 years, to reach 13.8 million in 2050 (Hebert et al. 2013). Alzheimer's disease prevalence rises sharply with advancing age and is estimated to double for every 5-year age group beyond age 65 (National Institutes on Aging 2005). As the United States population ages, the number of older people with Alzheimer's disease is projected to increase substantially (Hebert et al. 2013; Okie 2011).
People with ADRD tend to have multiple co-existing medical conditions, such as coronary artery disease, diabetes, congestive heart failure (CHF), and chronic obstructive pulmonary disease (COPD) (Bynum et al. 2004). Thus, they tend to have higher rates of health care use than others without the disease. For example, hospital stays are more frequent among Medicare beneficiaries with ADRD than among those without the condition, both in the aggregate and by most of the aforementioned conditions (Bynum et al. 2004; Phelan et al. 2012; Rudolph et al. 2010). Other studies find that potentially avoidable hospitalizations are more common among Medicare beneficiaries with ADRD for diabetes (short-term and long-term complications of diabetes) and hypertension, and less common for COPD or asthma and heart failure (Lin et al. 2013). These results suggest that ADRD creates additional challenges in managing certain comorbidities, resulting in higher costs.
Many of the existing studies did not adequately control for risk factors, so less is known about the impact of ADRD on services use net of other factors. Existing studies on this topic mostly relied on cross-sectional designs and did not track individuals with ADRD over time to measure the progression of these disorders on health care utilization (Bynum et al. 2004; Lin et al. 2013). Some studies did use a longitudinal design but the data analyzed were not nationally representative or had limited sample size (Phelan et al. 2012; Rudolph et al. 2010). A recent study by Clark et al. (2012) used the longitudinal HRS data to examine hospital and nursing home use in relation to cognitive impairment, but focused only on respondents age 71 years and older with cognitive impairment, no dementia. Another limitation of this study is that it relied on self or proxy reported information on hospital use, which tends to be less objective or accurate than Medicare claims data.
In addition to hospitalization, ED use is also of particular concern for people with ADRD and cognitive impairments, because experiences in the ED are often disorienting and traumatic for this vulnerable population (Jones et al. 2009; Naylor et al. 2005; Smith et al. 2012). In 2008, there were a total of 123.8 million ED visits (or 41.4 visits per 100 persons) in the United States, of which 11.8 million were by people ages 75 and older, or 67.9 per 100 persons in that age group, a rate higher than in any other age group (U.S. Census Bureau 2012). However, few studies exist on ED use by older people with ADRD and cognitive impairments, especially from the community. A high proportion of older adults who present to the ED, ranging from 21% to 40%, have cognitive impairments (Clevenger et al. 2012). More than half of Medicare decedents visited the ED in the last month of life, and most were hospitalized or died (Smith et al. 2012). The prevalence rates of any ED visit and any ambulatory care-sensitive ED visit increase significantly with levels of cognitive impairment (Stephens et al. 2012).
Because of the high costs and undesirable impact on quality of life of older people, there has been extensive research on so-called "potentially avoidable hospitalizations" (Intrator, Zinn, & Mor 2004; Ouslander et al. 2010; Ouslander & Maslow 2012; Polniaszek, Walsh, & Wiener 2011; Walsh et al. 2012). While definitions vary, potentially avoidable hospitalizations generally refer to conditions that are preventable but require hospitalization once they occur; preventable, but discretionary hospitalization once they occur; and futile care. Almost all studies define potentially avoidable hospitalizations based on medical diagnoses. Several studies used a list of "ambulatory care sensitive" (ACS) conditions for which good community primary care can potentially prevent the need for hospitalization. The Agency for Healthcare Research and Quality developed the ACS list for the general population, not necessarily for the frail elderly (Agency for Healthcare Research & Quality 2007). Other studies of potentially avoidable hospitalizations identify certain conditions common among nursing home residents (Bishop et al. 2010; Carter 2003; Kramer et al. 2007; Spector et al. 2013; Walsh et al. 2010). It should be noted, however, that all of these definitions are based on expert opinion and are not based on empirical studies of which hospitalizations are actually "potentially avoidable" (Polniaszek et al. 2011).
Much of the literature on hospital admissions, ED visits, and potentially avoidable hospitalizations and ED visits has focused on nursing home residents and the general older population (Grabowski et al. 2008; Gruneir et al. 2008; Ouslander et al. 2010; Walsh et al. 2012). Few studies have investigated how service use and potentially avoidable use vary by whether people have ADRD or by levels of cognitive impairment (Lin et al. 2013). While some studies found no significant difference in hospital use by older people with ADRD or cognitive impairments (Leibson et al. 1999; Walsh et al. 2003) or lower use (O'Malley, Caudry, & Grabowski 2011) as compared to others, most studies document more frequent hospitalizations among people with ADRD or cognitive impairments, partly due to the fact that people with these conditions also have multiple co-existing medical conditions that complicate their care (Bynum et al. 2004; Fillit, Hill, & Futterman 2002; Phelan et al. 2012; Rudolph et al. 2010; Zhao et al. 2008). For example, one study based on a 5% sample of claims data for Medicare beneficiaries in 1999 reported a difference of more than three and twofold in the adjusted rates of all-cause and potentially avoidable hospitalizations, respectively, between beneficiaries with and without dementia (Bynum et al. 2004).
On average, older people with ADRD cost Medicare and Medicaid programs significantly more than those without these conditions. According to estimates based on a sample of enrollees in both Medicare and Medicaid in the 2003 Medicare Current Beneficiary Survey, Medicare and Medicaid per-person spending is substantially higher for dually eligible beneficiaries with multiple chronic conditions, particularly when cognitive or mental conditions are present (Kaiser Commission on Medicaid & the Uninsured 2010). Specifically, in 2003 annual average per-person spending for dually eligible persons with more than one cognitive or mental condition (including ADRD and intellectual disabilities) was $38,500 ($23,200 by Medicaid and $15,300 by Medicare), almost double that for all dually eligible persons at $19,400 ($10,800 by Medicaid and $8,600 by Medicare). Those with more than one cognitive or mental conditions also had the highest total annual per-person spending among dually eligible beneficiaries who had a hospital stay ($46,300, including $20,200 by Medicaid and $26,100 by Medicare), who used institutional long-term care ($56,000, including $41,000 by Medicaid and $15,000 by Medicare), or who used home or community-based long-term care ($54,400, including $37,300 by Medicaid and $17,100 by Medicare).
Estimating health care costs associated with dementia among the Aging, Demographics, and Memory Study (ADAMS) subsample of the HRS, a recent study found that the annual costs per-person due to dementia range between $41,689 and $56,290 depending on approaches to estimating informal care (Hurd et al. 2013). This study extrapolated these results to estimate that the costs of dementia in 2010 totaled between $157 billion and $215 billion, for which Medicare paid approximately $11 billion (no Medicaid cost estimates were provided due to the current unavailability of linkages between the HRS and Medicaid claims data).
In short, despite the potentially distinct pattern, and disproportionate use, of health care resources by people with ADRD and cognitive impairments, research on these patterns remains scant. Potentially avoidable hospitalizations and ED visits, in particular, are important indicators of the quality of care provided to people with ADRD and cognitive impairments and have considerable ramifications for their quality of life. As noted earlier, much of the prior work on hospital and ED use has focused on nursing home residents, and results are mixed regarding the relationship between levels of cognitive impairments and hospital use (Grabowski et al. 2008; O'Malley et al. 2011). Little is known about whether persons with ADRD and cognitive impairments have relatively higher rates of potentially avoidable hospitalizations and ED visits than people without those conditions.
Furthermore, most prior studies on these issues relied on cross-sectional data; among them, only a few have simultaneously assessed service use for individuals living in the community and those residing in nursing homes (Walsh et al. 2012). The evidence base is particularly thin on the risk of hospital and ED use among Medicare and Medicaid beneficiaries with ADRD and cognitive impairments over the trajectory of ADRD progression, which can be addressed only through analyzing the longitudinal experience of a cohort of individuals.
3. METHODS
This section describes the data sources, study population, creation of analytic files and study variables, and statistical methods. In the course of this study, RTI convened a Technical Advisory Group (TAG) consisting of experts in the subject matter, who provided input on study design and analytic issues.
3.1. Data Sources
This study analyzed data from five waves (2000-2008) of the HRS merged with Medicare claims.1 At each wave, the survey covers a nationally representative sample of older adults age 50 years and older, who are interviewed every 2 years. The major strengths of the HRS data include its longitudinal design, the availability of measures of cognitive impairment, and a rich set of socio-demographic, economic, and health characteristics as risk adjusters of health services use. Further, the merged Medicare claims provide the most reliable data on hospital stays, ED use, and their associated costs. One limitation, though, is that the claims are available only for FFS beneficiaries, not covering Medicare managed care enrollees. In the HRS, specifically, the claims are only available for Medicare-eligible respondents who consented to provide claims. They are not available for the non-Medicare population or for individuals who did not provide their consent to have their Medicare claims files used for research purposes.
The initial HRS sample was drawn from community-dwelling individuals and did not include people living in institutions, such as nursing homes, but information is gathered about subsequent nursing home use. By the 2000 wave, the HRS has cumulated a large enough sample of institutionalized individuals that is fairly representative of the nursing home population (Institute for Social Research 2011).
We relied primarily on the RAND HRS public data file to construct study variables and merge with Medicare claims. The RAND HRS data file is a cleaned, easy-to-use, and streamlined version of the HRS with derived variables that cover a broad range of measures using standardized naming conventions (St. Clair et al. 2011). HRS core data were used as a supplement to obtain additional variables not included in the RAND HRS file.
The Medicare claims linked to HRS included data from the Centers for Medicare and Medicaid Services' (CMS') Beneficiary Annual and Quarterly Summary Files, which also contains information on enrollment in Medicare managed care or Health Maintenance Organizations (HMOs). Documented diagnosis codes from the claims data, in conjunction with survey-based cognitive functioning measures from the HRS, were used to identify beneficiaries with ADRD and cognitive impairment. The claims data also provide detailed information on hospital stays (from inpatient claims) and ED visits (from hospital outpatient claims).
3.2. Study Population
The study population includes respondents who are aged 65 years or older because Alzheimer's disease primarily affects older people and relatively few people below age 65 are Medicare eligible. Nursing home residents were assigned a weight of zero; for these individuals, we used their previous weights obtained from the last available wave when they still lived in the community. Our final analytic sample was further limited to respondents who were linked to Medicare claims and who were enrolled in FFS Medicare for at least 1 month during the year in which the beneficiary's hospital and ED utilization outcomes were measured. Managed care enrollees were excluded because health plans do not report hospital and ED use to CMS; thus, these data are not available.
Using the 2008 wave of the HRS as example, we illustrated our sample inclusion and exclusion criteria in a flow chart (see Appendix A1). The total HRS sample in 2008 included 17,217 respondents. From this total, a sequential exclusion process was carried out to remove respondents who: (1) were not age-eligible for HRS interview, mostly spouses younger than 50 (N = 1,127); (2) were below age 65 at the time of interview (N = 4,851); (3) were not linked to Medicare data either because the person was not yet a beneficiary or did not provide consent (N = 1,774); or (4) were Medicare-eligible, but enrolled in HMO for all of 2008 (N = 2,497). This led to the final sample in 2008 of 6,998 eligible Medicare beneficiaries who made up 62.3% of all HRS respondents age 65 and older at the time of interview. We repeated this process by applying the same exclusion criteria to all other waves (2000, 2002, 2004, and 2006) of the HRS data to yield the final analytic sample, which consisted of a combined total of 12,428 unique persons and 39,231 person-observations.
3.3. Definition of Cognitive Impairment
The key independent or explanatory variable in this study is ADRD and cognitive impairments. Defining and measuring these conditions is challenging because ADRD may be underdiagnosed, and there is uncertainty in how to use the HRS cognitive measures to identify dementia. This section briefly describes our approach to defining severe cognitive impairment that is consistent with dementia and the rationale for using this approach. Further details from our exploratory analyses comparing alternative measures that contributed to the final definition are provided in Appendix A2.
We assessed several definitions and combinations of definitions based on HRS data as used in a number of published studies (Clark et al. 2012; Crimmins et al. 2011; Langa et al. 2001; Langa, Kabeto, & Weir 2009; Langa et al. 2008). We also explored a Medicare claims-based measure of ADRD from the CMS Chronic Conditions Data Warehouse (CCW) and combinations of this measure with HRS-based measures of cognitive impairment. We chose a hybrid definition by combining the CCW ADRD indicator and one validated HRS definition which incorporates information on cognitive functioning from both self and proxy reports. The advantage of this combination approach is that it cast a wider net to identify possible dementia cases, some of which could have been missed using any single data source.
The HRS-based definition was developed and validated by Langa et al. (2009) with diagnostic data from ADAMS, a subsample of HRS respondents age 70 and older who received a neuropsychological assessment for dementia and cognitive impairment. This definition has also been applied in recent studies by Crimmins et al. (2011) and Clark et al. (2012). Cognitive status for self-respondents was based on a modified Telephone Interview for Cognitive Status (TICS), a 27-point index based on items for short-term memory, working memory, and speed of processing. Scores on the index of 12 or above are considered as normal cognitive function, scores of 7-11 are considered cognitive impairment, no dementia and scores less than 6 are considered dementia.
This HRS-based definition also classifies respondents with proxy assessments based on the memory item, performance in five instrumental activities of daily living (IADLs), and an interviewer assessment. The proxy respondent data is much less detailed than is available for self-respondents. The assessment of cognitive impairment based on proxy information is scored from 0-2, with values of 0, 1 and 2 indicating no cognitive impairment, possible cognitive impairment, and cognitive impairment, respectively. This score is added to the number of proxy-reported IADLs limitations for a total range of 0-11. Final proxy scores are coded as 0-2 for no cognitive impairment, 3-5 as cognitive impairment, no dementia, and 6-11 as dementia.
Next, we used the merged Medicare claims data to the HRS to identify beneficiaries with ADRD from a CCW variable indicating, on the basis of diagnostic codes, whether they ever had ADRD or senile dementia. Then, a dichotomous, hybrid measure of cognitive impairment was created, where individuals who were classified in the dementia category according to whether they met the HRS definition above or had an ADRD diagnosis based on the CCW indicator. Beneficiaries meeting either of these two measures are considered having severe cognitive impairment consistent with dementia.
It should be noted that Medicare claims data may be inadequate for identifying ADRD cases due to inaccuracy (Taylor et al. 2002; Taylor et al. 2009) and underdiagnosis (Lin et al. 2010). Given that there is no gold standard and relying on any single source would probably underestimate the prevalence of dementia, our approach for a hybrid definition with a focus on severe cognitive impairment consistent with dementia is preferable, as it incorporates the strengths of the validated HRS-based cognitive measure and the advantage of a diagnosis-based indicator of ADRD.
3.4. Dependent Variables
We defined three broad categories of outcome variables: (1) hospitalizations, overall and whether potentially avoidable; (2) ED visits, overall and whether potentially avoidable; and (3) Medicare expenditures for each type of service use. As a general note, for beneficiaries in the overall HRS sample, service use was defined over a calendar-year period during the year of each HRS survey; for decedents, service use was captured for the 1-year period prior to the date of death. Because the unit of analysis is the beneficiary, all outcome measures are defined and summarized at the beneficiary level.
We measured utilization outcomes in two ways, as dichotomous indicators (e.g., whether a person was ever hospitalized) or counts (e.g., total number of hospitalizations). Thus, a person who used a given type of service (e.g., hospitalization) multiple times within the outcome measurement period would be counted only once in a dichotomous measure, but possibly several times in the count measure. In this report, we focus on the dichotomous utilization measures which are straightforward for both descriptive and multivariate regression analyses; using the count measures of utilization yielded similar results.2 The operational definition of each dependent variable is described below.
3.4.1. Hospitalizations
We identified hospitalizations from the Medicare inpatient claims, and defined two dichotomous dependent variables to indicate whether a beneficiary had: (1) any hospitalization, and (2) any potentially avoidable hospitalization.
3.4.2. Potentially Avoidable Hospitalizations
We used a method recently developed by RTI to define potentially avoidable hospitalizations in a disabled elderly population (Walsh et al. 2010; Walsh et al. 2012). This method defines potentially avoidable hospitalizations on the basis of expert input to identify a list of conditions and diagnosis-related groups deemed as either preventable or manageable outside of the acute care setting. We favor this approach over other alternatives because it builds upon a comprehensive list of ACS conditions as identified in previous studies and refines them to be appropriate for severely disabled Medicare and Medicaid beneficiaries in the community setting or in nursing facilities. A detailed list of conditions considered for potentially avoidable hospitalizations (from Walsh et al. 2012) specific to setting (community vs. nursing facilities), along with the clinical rationale for each category of condition included in this definition, is provided in Appendix A2.
This approach has several advantages. First, the conditions included in the definition are detailed and specific, and for each condition category a specific list of ICD-9 codes were identified. Second, this definition was based on detailed review by a technical expert panel of lists of conditions frequently considered as potentially avoidable or preventable, and the final subset takes into account a lower level of services for home and community-based services waiver enrollees than those generally available in nursing homes. Under this definition, five conditions accounted for 75% of hospitalizations classified as avoidable, including pneumonia, CHF, urinary tract infection (UTI), dehydration, and COPD or asthma (Walsh et al. 2012). These conditions are identified as sensitive to care interventions and are common to several definitions of avoidable hospitalizations.
Our definition of potentially avoidable hospitalizations includes only those conditions that are deemed potentially preventable or manageable in community settings, including: CHF; hyper and hypotension: separate conditions; hyper and hypoglycemia: diabetes mellitus with ketoacidosis or hyperosmolar coma; dehydration acute renal failure hypokalemia hyponatremia; constipation or fecal impaction obstipation; skin ulcers including pressure ulcers; UTI; COPD, asthma, chronic bronchitis; weight loss, nutritional deficiencies, adult failure to thrive; and seizures. Following expert input from the TAG, we also added "lower respiratory: pneumonia bronchitis" to this list of potentially avoidable conditions, consistent with most previous studies indicating this condition being among the most frequent ones for potentially avoidable hospitalizations.
We excluded from the potentially avoidable list the following conditions that are considered as less amenable to management in community settings (i.e., asterisked items in Appendix A2) because there are generally fewer medical resources for managing acute changes in such conditions in the community than there are in institutional settings: anemia; diarrhea; clostridium difficile; gastroenteritis with nausea and vomiting; cellulitis; falls and trauma; altered mental status, acute confusion, or delirium; and psychosis, severe agitation, or organic brain syndrome. Some studies have included these conditions as part of the definition of potentially avoidable hospitalizations for nursing home residents (Walsh et al. 2010; Walsh et al. 2012).
In short, we used one set of hospital admission diagnoses in our definition of potentially avoidable hospitalizationsacross community and institutional settings. Since the list of potentially avoidable conditions in the community is a subset of the conditions that Walsh et al. (2010; 2012) considered potentially avoidable for nursing home residents, our prevalence estimates of potentially avoidable hospitalizations for nursing home residents are conservative.
3.4.3. ED Visits
Analyzing ED visits is more complicated than hospital admissions because there are different types of ED visits and because there is less research on potentially avoidable ED visits. We used the Revenue Center Code (045X or 0981) or Healthcare Common Procedure Coding System classification code (99281-99285) in hospital outpatient claims to identify ED visits that did not result in inpatient admission. ED visits that led to inpatient admissions are identified from hospital inpatient claims. A patient could have both types of ED encounters at different points in time during the year, but there is no overlapping in classification for the same encounter. We defined three dichotomous measures of ED use to indicate whether a beneficiary had had: (1) any outpatient ED visit, not resulting in inpatient admission; (2) any ED visit, resulting in inpatient admission; and (3) any ED visit of either type.
3.4.4. Potentially Avoidable ED Visits
There are relatively few published studies that provide guidance on how to identify potentially avoidable ED visits. Some studies define potentially preventable or avoidable ED visits on the basis of a set of commonly used ACS conditions such as injuries from falls, pneumonia, fever, mental status changes, UTIs, metabolic disturbances, and diseases of the skin (Caffrey 2010; Stephens et al. 2012), in a way similar to how potentially avoidable hospitalizations are defined. Others use alternative methods to gauge the acuity of ED visits based on ICD-9 diagnoses from administrative claims such as those using the New York University Emergency Department Algorithm (Ballard et al. 2010; Wharam et al. 2007), the Current Procedural Terminology codes (Wolinsky et al. 2008), or ED triage systems (Liu, Sayre, & Carleton 1999). All these various methods attempt to identify ED visits that have resulted from certain primary care sensitive conditions that could have been potentially avoided or prevented had adequate ambulatory care been provided to the patient. However, none of them have been rigorously validated.
Given limitations of existing methods to define potentially avoidable ED visits, TAG experts on this project did not recommend a specific definition. Instead, we used the same set of principal diagnosis ICD-9 codes to define potentially avoidable ED visits as were used to define potentially avoidable hospitalizations. Furthermore, we defined potentially avoidable ED use only among outpatient ED visits that did not lead to inpatient admission. ED visits that resulted in inpatient admissions are, arguably, unavoidable, even though the resulting hospitalization may be considered potentially avoidable; in each case, a physician made the determination that the patient should be admitted to the hospital.
3.4.5. Expenditures
From the merged Medicare claims, we calculated Medicare payments per beneficiary per year for hospital services associated with each of the following events: (1) all hospitalizations; (2) all potentially avoidable hospitalizations; (3) all ED visits, not resulting in inpatient admission; and (4) all potentially avoidable outpatient ED visits. We annualized each of these expenditures measures by adjusting a beneficiary's time at risk for service use during the year, that is, the total number of months in which the beneficiary was alive and enrolled in FFS Medicare as a fraction of the year. Further, all expenditures were inflation adjusted to constant 2008 dollars using the Bureau of Labor Statistics Consumer Price Index for medical care services. Note that for ED associated expenditures, we calculated amounts only for outpatient ED visits without inpatient admission. For ED visits that led to inpatient admissions, all payments are combined with the inpatient claims by CMS, so it was not possible to separate out the portion of payment that is for ED services.
3.5. Other Independent and Control Variables
In multivariate regression analyses we controlled for additional variables as risk factors or potential confounders. These included beneficiary age, gender, race/ethnicity, education, marital status, types of insurance coverage (Medicare only; dual eligibility in Medicare and Medicaid, based on either self-reported HRS data or the state Medicaid buy-in indicator from the linked claims; and supplemental insurance), number of activities of daily living (ADLs) limitations, chronic conditions (including a count of eight chronic conditions and the following seven individual conditions:3 diabetes, cancer, lung disease, heart problems, stroke, psychiatric problems, arthritis or rheumatism), self-reported health status, household income, urban residence, and geographic regions (nine regions as defined by the U.S. Census Bureau). All of these variables are obtained from the ongoing HRS survey, many of which are time-varying. We also controlled for the HRS wave to account for time trends.
3.6. Analytic Approach
3.6.1. Sample Stratification
From the final analytic sample identified above, we constructed four separate analytic files that are best suited to address the research questions:
- Community residents (N = 11,879 unique persons and 36,357 person-observations).
- Nursing home residents (N = 2,009 unique persons and 2,874 person-observations).
- Community decedents (N = 2,408 persons).
- Nursing home decedents (N = 890 persons).
First, we took the overall HRS sample of Medicare beneficiaries who responded to the HRS survey at any given wave over 2000-2008, and stratified it into two subsamples: beneficiaries who resided in the community and those who resided in nursing homes at the time of the interview, respectively. At each wave, these two subsamples provide a cross-sectional snapshot of the FFS Medicare beneficiaries age 65 and older who are in the community or institutionalized.4 Next, we identified all Medicare beneficiaries in the overall HRS sample who subsequently died during 2000-2008, to analyze hospital and ED use in their last years of life. Similarly, the decedents were stratified into two subsamples: those who resided in the community and those in nursing homes prior to death.
The rationale for conducting stratified analyses is that there are significant differences in both the case-mix and utilization profiles between beneficiaries living in the community and those residing in nursing homes, as well as between surviving beneficiaries in the overall HRS and decedents (as reported in study results below).
3.6.2. Descriptive Analyses
The beneficiary was the unit of analysis in both descriptive and multivariate analyses. For each of the dichotomous hospital and ED utilization outcomes, we calculated the unadjusted (i.e., observed) percentage of beneficiaries with the outcome, by cognitive impairment. For the count outcomes, we computed the annualized average rates of utilization per 1,000 beneficiary-years in each group. For expenditures, we calculated the unadjusted (i.e., observed) average amount per beneficiary. Then, bivariate comparison of the differences in each of these descriptive measures between beneficiaries with and without cognitive impairment was conducted in each of the four analytic subsamples. Within each subsample, all descriptive analyses were conducted using the pooled HRS data over all waves. Statistical significance in between-group differences was assessed using Chi-square tests (for categorical variables) or T-tests (for continuous variables).
3.6.3. Multivariate Regression Analyses of Service Utilization
We employed a cross-sectional time series generalized estimating equation (XTGEE) model (Burton, Gurrin, & Sly 1998; Liang & Zeger 1986) that has been widely applied in analyses of panel data like the HRS. This modeling approach accounts for correlation between repeated measures within individuals, with the Huber-White robust variance estimator applied to adjust for within-panel (i.e., person) clustering. These procedures produce unbiased model results in both the parameter estimates and standard errors. Using hospitalization as an example of the outcome variable, a XTGEE model takes the following general form:
 (3-1)
(3-1)
where Pit denotes the probability that individual i was hospitalized at time t; α is the intercept; ß is the coefficient for individual i with cognitive impairment at t;  is a vector of parameter estimates for Xit, which represents all other covariates in the model as potential confounders measured at t, and
  it is the error term. Given a dichotomous dependent variable, the binomial distribution and logit link function were specified, with parameter estimates reported as adjusted odds ratios. For count outcomes, the negative binomial distribution and log link function were specified, with parameter estimates reported as incident rate ratios, which are interpreted in a similar way to odds ratios. We fit separate XTGEE models for the two subsamples of community residents and nursing home residents, respectively.
For the two subsamples of community decedents and nursing home decedents, we used multivariate logistic regression models to estimate the effect of cognitive impairment on hospital and ED use during the last year of life. In these models, each decedent contributed one observation to the data. For descriptive analyses, however, we extended the look-back window up to 5 years before death to assess changes in utilization patterns for the same individuals during years substantially before death as compared to their last year of life.
3.6.4. Two-Part Multivariate Regression Models of Expenditures
Because Medicare expenditures have a skewed distribution and many beneficiaries have no expenditure (if they did not have a hospital stay or ED visit), the conventional ordinary least squares regression model would yield biased results. To overcome this problem, we employed a two-part generalized linear model, an established, standard approach that has been widely used in studies on health care expenditures (Anderson et al. 2011; Frytak et al. 2008; Manning, Basu, & Mullahy 2005; Manning & Mullahy 2001).
The two-part model of expenditures adjusts for the same set of covariates as included in the multivariate models of service utilization. In the part-one model, the probability of having any positive expenditure (equivalent to the model of a dichotomous utilization measure) was estimated using XTGEE logistic regression for the subsamples of community and nursing home residents in the overall HRS and regular logistic regression for the subsamples of community and nursing home decedents. The part-two model (with the log link function and Gamma distribution specified to best fit expenditures data) predicts the level of expenditures conditional on having any positive expenditure, with model estimates extrapolated to the entire sample included in the first stage of the model. Then, using predicted values from these models, the predicted expenditures for each person were calculated by multiplying the probability of having any positive expenditure (from the part-one model) by the expected level of expenditures (from the part-two model).
Next, we recalculated the predicted expenditures post estimation of the two-part models above by recoding the dummy variable for cognitive impairment to zero for all persons while holding constant the observed values of all other covariates, such that those with actual cognitive impairment were treated as if they were free of cognitive impairment. This essentially removes the cognitive impairment related effect on expenditures in a counterfactual manner. As a final step, the differential between the two sets of predicted expenditures for each person was calculated, which is the estimated net or marginal amount of expenditures that is attributable to cognitive impairment over and above the effects of all other risk factors included in the models.
Unless otherwise noted, all descriptive and multivariate analyses were conducted by adjusting for each person's sampling weight.5 In multivariate regression, we further adjusted model estimates by each person's exposure time, that is, number of months survived and enrolled in FFS Medicare during the outcome measurement period. Also of note, we conducted sensitivity analyses by excluding from XTGEE models those in the overall HRS sample who subsequently died during the study period, and found that the results (not reported) remain consistent and robust.
4. RESULTS: HOSPITAL AND ED USE, BY COGNITIVE IMPAIRMENT
In this section, we first report on the prevalence of cognitive impairment and present study results on differences in hospital and ED use patterns by cognitive impairment among Medicare beneficiaries included in the four analytic subsamples: community vs. nursing home residents (overall HRS sample), and community vs. nursing home decedents (last year of life). We focus on multivariate regression adjusted results. Descriptive analysis results on yearly utilization patterns in the last 5 years of life and monthly utilization patterns in the last 12 months of life, by cognitive impairment, are also summarized.
4.1. Prevalence of Cognitive Impairment
In the final analytic sample of FFS Medicare beneficiaries in the HRS (2000-2008), about 11% of community-dwelling residents were cognitively impaired at the time of interview, in contrast to 62% of those residing in nursing homes (Figure 4-1). The prevalence of cognitive impairment rose sharply among decedents, regardless of residence: 32% of community decedents and 76% of nursing home decedents died with cognitive impairment (Figure 4-1).
FIGURE 4-1. Prevalence of Cognitive Impairment among Medicare Beneficiaries in the HRS
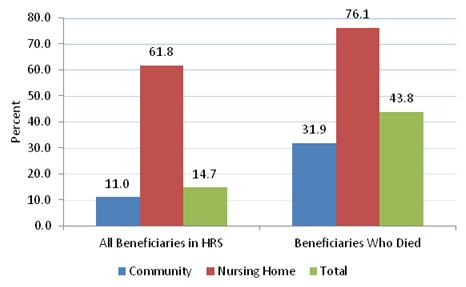
SOURCE: RTI analysis of HRS data linked with Medicare claims, 2000-2008.
NOTE: Reported here are weighted percentages pooled over five waves of HRS data. HRS = Health and Retirement Study.
The prevalence of cognitive impairment over the study period remained relatively stable in the total HRS sample of Medicare beneficiaries and among those living in the community, accompanied by a downward trend among nursing home residents, from 65% in 2000 to 58% in 2008 (see Appendix Figure A2-1). Because these are weighted numbers and the sampling weights of nursing home residents were much smaller relative to that of community residents, the decline in cognitive impairment among nursing home residents did not have a noticeable impact on the overall prevalence of cognitive impairment in the total sample.
Additional beneficiary characteristics (which were included in multivariate regression models for respondents in the overall HRS sample), stratified by residence, are provided in Appendix A4. Relative to their community counterparts, nursing home residents were older, and more likely to be female, unmarried, low income, dually eligible for Medicare and Medicaid, and less educated. Compared to beneficiaries in the community, residents in nursing homes also had a greater number of ADL limitations (2.4 vs. 0.3) and chronic conditions (3.2 vs. 2.3), on average, and poorer self-reported health (60.9% vs. 30.2%) (Appendix A4).
Detailed characteristics of HRS decedents (as included in multivariate regression models for the last year of life analyses) are summarized in Appendix A5. Overall, differences between community decedents and nursing home decedents in demographics, socioeconomic characteristics and health conditions persist, following a similar pattern to those observed in the overall HRS sample of FFS Medicare beneficiaries. Nursing home decedents died with a greater number of ADL limitations, on average, than community decedents (3.2 vs. 1.0), although the number of chronic conditions was about the same (3.4 vs. 3.0) in both groups (Appendix A5).
4.2. Hospital and Emergency Department Users, by Cognitive Impairment and Residential Setting
Using one cross-section of the HRS sample in 2008, we estimated the total numbers of FFS Medicare beneficiaries nationwide who had at least one hospitalization or ED visit, for any cause and for a potentially avoidable condition, split further by cognitive impairment and residential setting. The results are shown in Figure 4-2 (detailed numbers are reported in Appendix A6). In 2008, about five million people in the FFS Medicare population age 65 and older had at least one hospitalization, of whom, nearly 1.4 million, or 27%, had at least one potentially avoidable hospitalization. Among those with any hospitalization, over 1.4 million, or 28%, are people with cognitive impairment (16% in the community and 12% in nursing homes). Among beneficiaries with at least one potentially avoidable hospitalization, more than 538,000 people, or 40%, are cognitively impaired (21% in the community and 19% in nursing homes). Given the overall prevalence of cognitive impairment among all beneficiaries is just under 15% (see Figure 4-1), these findings suggest that people with cognitive impairment are disproportionately represented among all beneficiaries ever hospitalized, especially among those with potentially avoidable hospitalizations.
FIGURE 4-2. Medicare Beneficiaries in the HRS with Hospital and ED Use, 2008, by CI and Residential Setting
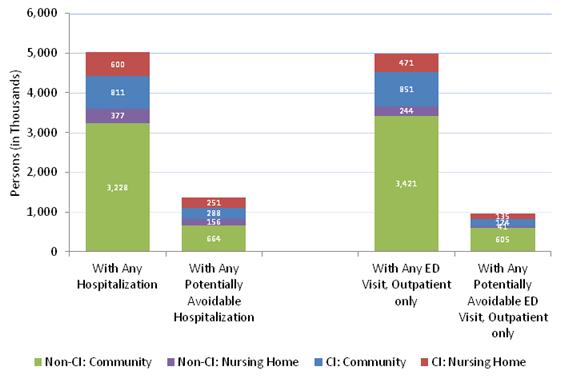
SOURCE: RTI analysis of HRS data linked with Medicare claims, 2008.
NOTE: Reported are weighted estimates based on 2008 HRS data. CI = Cognitive impairment; ED = Emergency department; HRS = Health and Retirement Study.
In 2008, just under five million beneficiaries had at least one outpatient ED visit (without admission), of whom, about 955,000, or 19%, had at least one potentially avoidable ED visit (Figure 4-2; also see Appendix A6). Of those with any outpatient ED visit (without admission), more than 1.3 million, or 27%, were people with cognitive impairment (17% in the community and 10% in nursing homes). Of those with at least one potentially avoidable ED visits, nearly 309,000 people, or 32%, had cognitive impairment (18% in the community and 14% in nursing homes). Again, people with cognitive impairment are overrepresented in all beneficiaries who experienced any ED visit or any potentially avoidable ED visit.
A parallel set of estimates are presented for HRS decedents who died in 2008 and had a hospitalization or ED visit in the last year of life, as shown in Figure 4-3 (with more details provided in Appendix A7). Among all beneficiaries who died in 2008, more than one million were hospitalized at least once in their last year of life, of whom, nearly half had at least one potentially avoidable hospitalization. Of those decedents who were ever hospitalized in the last year of life, more than 43% were cognitively impaired (27% in the community and 16% in nursing homes). Of those with at least one potentially avoidable hospitalization in the last year of life, almost 47% were cognitively impaired (28% in the community and 19% in nursing homes). Among those who visited the ED (without admission) at least once in the last year of life, 47% had cognitive impairment (31% in the community and 16% in nursing homes). Among those with at least one potentially avoidable ED visit in the last year of life, over 44% were cognitively impaired (25% in the community and 19% in nursing homes). Thus, the percentage share of individuals with cognitive impairment among all decedents who were hospitalized or had an ED visits (all-cause or potentially avoidable) in the last year of life is largely comparable to the overall prevalence of cognitive impairment among all decedents in the HRS, about 44% (see Figure 4-1).
FIGURE 4-3. Medicare Decedents in the HRS with Hospital and ED Use in the Last Year of Life, 2008, by CI and Residential Setting
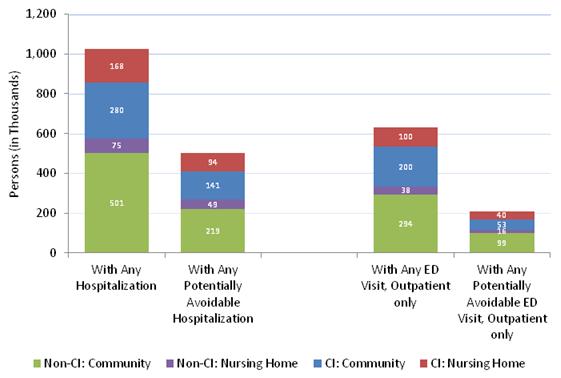
SOURCE: RTI analysis of HRS data linked with Medicare claims, 2008.
NOTE: Reported are weighted estimates based on HRS decedents who died in 2008. CI = Cognitive impairment; ED = Emergency department; HRS = Health and Retirement Study.
4.3. Utilization Patterns among Medicare Beneficiaries: Overall Health and Retirement Study Sample
Table 4-1 reports odds ratios from the XTGEE multivariate regression models, which estimated the effect of cognitive impairment on each utilization outcome. Full model results are provided in Appendix A8 (for community residents) and Appendix A9 (for nursing home residents). Among community-living beneficiaries, cognitive impairment was associated with significantly greater odds of use across all outcomes, after controlling for patient demographic, socioeconomic, and health status factors. The odds of any utilization were 52%-92% higher among beneficiaries with cognitive impairment relative to those without cognitive impairment. Notably, the odds of any potentially avoidable hospitalization and potentially avoidable ED visit were 84% and 56% higher, respectively, for beneficiaries with cognitive impairment than for those with no cognitive impairment. By way of comparison, there were no significant differences in utilization between nursing home residents by cognitive impairment, with only one exception: we found significantly increased odds (OR = 1.278, p 0.05) of having any outpatient ED visit (not resulting in inpatient admission) among nursing home residents with cognitive impairment relative to residents with no cognitive impairment.
| Utilization Outcome, Annually | CommunityAdjusted OR (CI vs. Non-CI) | Nursing HomeAdjusted OR (CI vs. Non-CI) |
| SOURCE: RTI analysis of HRS data linked with Medicare claims, 2000-2008. NOTE: Reported in table are OR from multivariate XTGEE logistic regression models adjusting for CI, age, gender, race/ethnicity, education, marital status, types of health insurance coverage, activities of daily living limitations, chronic conditions (total count and specific conditions), self-rated health status, income, urban location, census region, and survey year. Full model results are reported in Appendix A8 (community residents) and Appendix A9 (nursing home residents). CI = Cognitive impairment; ED = Emergency department; HRS = Health and Retirement Study; OR = Odds ratios; XTGEE = Cross-sectional time series generalized estimating equation.Statistical significance: * p 0.05; ** p 0.01; *** p 0.001. | ||
| Any hospitalization | 1.680*** | 1.040 |
| Any potentially avoidable hospitalization | 1.844*** | 1.161 |
| Any ED visit, outpatient only | 1.515*** | 1.278* |
| Any ED visit, leading to hospitalization | 1.923*** | 1.066 |
| Any ED visit, either type | 1.656*** | 1.138 |
| Any potentially avoidable ED visit, outpatient only | 1.557*** | 1.159 |
Based on predicted probabilities from the XTGEE models above, we calculated adjusted percentages of beneficiaries having each of the utilization outcomes, by cognitive impairment, with results summarized in Table 4-2. Among community-living beneficiaries, the adjusted prevalence of hospitalizations is significantly higher among those with cognitive impairment, as compared to those without cognitive impairment: 25.6% vs. 17.5% for overall hospitalization, and 7.3% vs. 4.2% for potentially avoidable hospitalization. A similar pattern of differences in ED utilization was observed, with prevalence being significantly higher for beneficiaries with cognitive impairment than those without the condition, regardless of the types of ED visit or whether they are potentially avoidable. For example, annually 34.0% of community residents with cognitive impairment had an ED visit (with or without subsequent inpatient admission), in contrast to 24.4% of those without cognitive impairment; the percentage of having any potentially avoidable ED visit is 4.5% vs. 3.0%, respectively. Among nursing home residents, the adjusted percentage difference by cognitive impairment is statistically significant (p 0.05) in only one of the utilization outcomes, with regard to having any outpatient ED visit (not resulting in hospitalization): 35.4% vs. 30.0%.
| Utilization Outcome, Annually | Community CI | Community Non-CI | Nursing Home CI | Nursing Home Non-CI |
| N (Person-observations, unweighted) | 4,172 | 31,752 | 1,776 | 1,007 |
| SOURCE: RTI analysis of HRS data linked with Medicare claims, 2000-2008. NOTE: Reported in table are adjusted percentages by multivariate XTGEE logistic regression models adjusting for CI, age, gender, race/ethnicity, education, marital status, types of health insurance coverage, activities of daily living limitations, chronic conditions (total count and specific conditions), self-rated health status, income, urban location, census region, and survey year. Full model results are reported in Appendix A8 (community residents) and Appendix A9 (nursing home residents). CI = Cognitive impairment; ED = Emergency department; HRS = Health and Retirement Study; XTGEE = Cross-sectional time series generalized estimating equation.Statistical significance: * p 0.05; ** p 0.01; *** p 0.001. | ||||
| Any hospitalization | 25.6 | 17.5*** | 49.5 | 48.6 |
| Any potentially avoidable hospitalization | 7.3 | 4.2*** | 22.4 | 20.0 |
| Any ED visit, outpatient only | 23.9 | 17.5*** | 35.4 | 30.2* |
| Any ED visit, leading to hospitalization | 17.8 | 10.6*** | 39.7 | 38.3 |
| Any ED visit, either type | 34.0 | 24.4*** | 56.1 | 53.1 |
| Any potentially avoidable ED visit, outpatient only | 4.5 | 3.0*** | 7.4 | 6.5 |
Results in Table 4-2 also indicate that in general, the prevalence of hospital and ED use is substantially higher among nursing home residents than among their community counterparts, regardless of cognitive impairment status. Furthermore, among nursing home residents, the adjusted percentage differences in hospital and ED use between those with and without cognitive impairment are much smaller than was the case among community residents in virtually all the utilization outcomes.
The adjusted percentages are generally consistent with the unadjusted percentages (shown in Appendix A10), although the magnitudes of the differences or utilization gaps between those with and without cognitive impairment were moderated after multivariate adjustment. It is also notable that, among nursing home residents, for three utilization outcomes, regarding any potentially avoidable hospitalization, any ED visit (resulting in hospitalization) and any ED visit (regardless of admission), the unadjusted percentage differences were statistically significant (Appendix A10), but all these differences were washed away after multivariate regression adjustment (Table 4-2). In addition, in Appendix A11 we reported the unadjusted, annualized rates of utilization per 1,000 person-years, which revealed a similar pattern of utilization differences by cognitive impairment to that observed in unadjusted percentage differences (Appendix A10).
4.4. Utilization Patterns among Health and Retirement Study Decedents: Last Year of Life
Odds ratios from multivariate logistic regression models of each of the utilization outcomes among decedents in their last year of life are presented in Table 4-3. Full model results are provided in Appendix A12 (for community decedents) and Appendix A13 (for nursing home decedents). There were no significant differences in the odds of hospitalizations associated with cognitive impairment among community decedents during their last year of life. However, there were significantly greater odds of outpatient ED visits (OR = 1.32, p 0.05) among community decedents with cognitive impairment compared to those without cognitive impairment. Among nursing home decedents, in contrast, persons with cognitive impairment were about 43% (OR = 0.572, p 0.05) less likely than those without cognitive impairment to be hospitalized during their last year of life. No other difference in utilization outcomes remains by cognitive impairment among nursing home decedents.
| Utilization Outcome, Annually | CommunityAdjusted OR (CI vs. Non-CI) | Nursing HomeAdjusted OR (CI vs. Non-CI) |
| SOURCE: RTI analysis of HRS data linked with Medicare claims, 2000-2008. NOTE: Reported in table are OR from multivariate logistic regression models adjusting for CI, age, gender, race/ethnicity, education, marital status, types of health insurance coverage, activities of daily living limitations, chronic conditions (total count and specific conditions), self-rated health status, income, urban location, census region, and survey year. Full model results are reported in Appendix A12 (community decedents) and Appendix A13 (nursing home decedents). CI = Cognitive impairment; ED = Emergency department; HRS = Health and Retirement Study; OR = Odds ratios.Statistical significance: * p 0.05; ** p 0.01; *** p 0.001. | ||
| Any hospitalization | 0.964 | 0.572* |
| Any potentially avoidable hospitalization | 1.044 | 1.087 |
| Any ED visit, outpatient only | 1.318* | 1.070 |
| Any ED visit, leading to hospitalization | 1.166 | 0.780 |
| Any ED visit, either type | 1.090 | 0.708 |
| Any potentially avoidable ED visit, outpatient only | 1.103 | 1.574 |
In Table 4-4, we report the multivariate adjusted percentages of decedents with each utilization outcome, by cognitive impairment. Several observations stand out. First, the overall prevalence of hospital and ED use in the last year of life became much similar, or almost equalized, for community decedents and nursing home decedents, regardless of cognitive impairment. Second, within each subsample of community decedents or nursing home decedents, there were few differences by cognitive impairment across the utilization outcomes. It is notable that among nursing home decedents, fewer residents with cognitive impairment (67.9%) were hospitalized in their last year of life than those with no cognitive impairment (77.9%); no significant difference was observed in any other outcomes. Furthermore, comparing the adjusted percentages in Table 4-4 (for decedents) with those reported in Table 4-2 (for beneficiaries in overall HRS), hospital and ED use increased sharply in the last year of life among decedents, regardless of cognitive impairment or where they lived before death.
| Utilization Outcome, Annually | Community CI | Community Non-CI | Nursing Home CI | Nursing Home Non-CI |
| N (Decedents, unweighted) | 790 | 1,590 | 669 | 191 |
| SOURCE: RTI analysis of HRS data linked with Medicare claims, 2000-2008. NOTE: Reported in table are adjusted percentages as predicted by multivariate logistic regression models adjusting for CI, age, gender, race/ethnicity, education, marital status, types of health insurance coverage, activities of daily living limitations, chronic conditions (total count and specific conditions), self-rated health status, income, urban location, census region, and survey year. Full model results are reported in Appendix A12 (community decedents) and Appendix A13 (nursing home decedents). CI = Cognitive impairment; ED = Emergency department; HRS = Health and Retirement Study.Statistical significance: * p 0.05; ** p 0.01; *** p 0.001. | ||||
| Any hospitalization | 78.3 | 78.9 | 67.9 | 77.9* |
| Any potentially avoidable hospitalization | 37.7 | 36.7 | 43.9 | 42.0 |
| Any ED visit, outpatient only | 50.5 | 43.9* | 43.0 | 41.5 |
| Any ED visit, leading to hospitalization | 69.4 | 66.1 | 59.7 | 64.8 |
| Any ED visit, either type | 81.0 | 79.7 | 72.1 | 77.9 |
| Any potentially avoidable ED visit, outpatient only | 13.0 | 12.0 | 13.9 | 9.7 |
Alternatively, we ran multivariate negative binomial regression models with count outcomes with the same set of covariates as included in multivariate analyses summarized above. Results with regard to the effect of cognitive impairment on utilization counts (not reported but available upon request) were consistent with those from models of dichotomous utilization outcomes. In addition, unadjusted percentages of decedents with each utilization outcome are summarized in Appendix A14, and the annualized, unadjusted rates of utilization per 1,000 person-years in Appendix A15. For the most part, these two sets of unadjusted measures show a similar pattern of differences by cognitive impairment. After multivariate regression adjustments, differences in several of the unadjusted measures by cognitive impairment lost statistical significance.
4.5. Utilization Patterns in the Last 5 Years of Life
In this section, descriptive analysis results on hospital and ED use patterns in the last 5 years of life among HRS decedents who died during the period 2000-2008 are presented. Within each subsample (community vs. nursing home), we calculated and compared the yearly percentage of decedents with any hospitalization or ED visit by cognitive impairment status during the last 5 years of life.
As described earlier in this report (see Section 4.2), among community-dwelling residents the prevalence of hospital and ED use is significantly higher for individuals with cognitive impairment than for those without cognitive impairment. However, there appears to be a convergence in utilization over time such that during the last year of life the utilization gap between the two groups diminished. This pattern is illustrated by the percentage of decedents from community who were hospitalized (Figure 4-4) or had any ED visit regardless of hospitalization (Figure 4-5) during each of the 5 years prior to death.
FIGURE 4-4. Percent of HRS Decedents from the Community with any Hospitalization Each Year in the Last 5 Years of Life, by CI
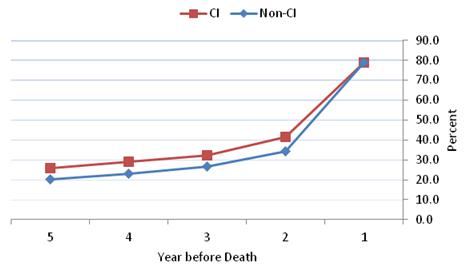
SOURCE: RTI analysis of HRS data linked with Medicare claims, 2000-2008.
NOTE: Numbers shown are unadjusted percentages. CI = Cognitive impairment; HRS = Health and Retirement Study.
FIGURE 4-4. Percent of HRS Decedents from the Community with any Hospitalization Each Year in the Last 5 Years of Life, by CI
SOURCE: RTI analysis of HRS data linked with Medicare claims, 2000-2008.
NOTE: Numbers shown are unadjusted percentages. CI = Cognitive impairment; HRS = Health and Retirement Study.
FIGURE 4-5. Percent of HRS Decedents from the Community with any ED Visit Each Year in the Last 5 Years of Life, by CI
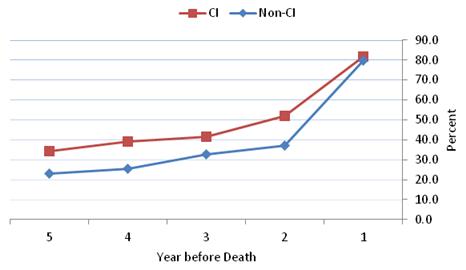
SOURCE: RTI analysis of HRS data linked with Medicare claims, 2000-2008.
NOTE: Numbers shown are unadjusted percentages. CI = Cognitive impairment; ED = Emergency department; HRS = Health and Retirement Study.
Results presented earlier (Section 4.2) also indicate that at any given point in time, nursing home residents with cognitive impairment generally have similar rates of hospitalization and ED use relative to those without cognitive impairment. However, in their last year of life, nursing home decedents with cognitive impairment were hospitalized significantly less often than those without cognitive impairment (Figure 4-6); the prevalence of any ED use remains similar between the two groups (Figure 4-7).
FIGURE 4-6. Percent of HRS Decedents from Nursing Homes with Any Hospitalization Each Year in the Last 5 Years of Life, by CI
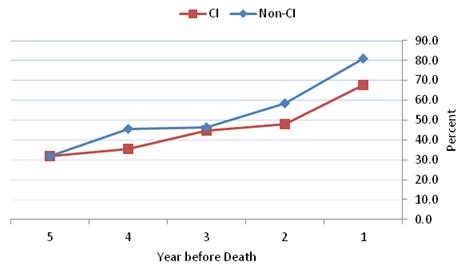
SOURCE: RTI analysis of HRS data linked with Medicare claims, 2000-2008.
NOTE: Numbers shown are unadjusted percentages. CI = Cognitive impairment; HRS = Health and Retirement Study.
FIGURE 4-7. Percent of HRS Decedents from Nursing Homes with any ED Visit Each Year in the Last 5 Years of Life, by CI
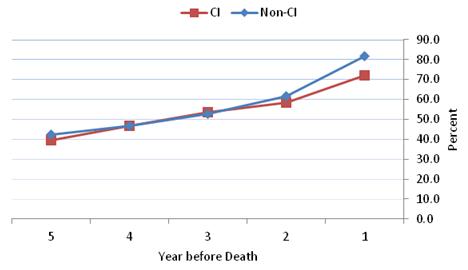
SOURCE: RTI analysis of HRS data linked with Medicare claims, 2000-2008.
NOTE: Numbers shown are unadjusted percentages. CI = Cognitive impairment; ED = Emergency department; HRS = Health and Retirement Study.
4.6. Utilization Patterns in the Last 12 Months of Life
We also examined monthly utilization patterns in the last 12 months of life to see whether they were different between decedents with and without cognitive impairment. Among decedents from the community, there was no significant difference in the monthly percentage with any hospitalization until the last month of life, in which individuals with cognitive impairment were significantly less likely to be hospitalized than those without cognitive impairment (Figure 4-8). The monthly percentage of community decedents with any ED visit (regardless of admission) did not differ by cognitive impairment throughout the last 12 months of life (Figure 4-9).
Among nursing home decedents, the monthly percentage with any hospitalization was significantly lower for those with cognitive impairment in most of the last 12 months before death (Figure 4-10). No significant difference was observed in the monthly prevalence of any ED visit (Figure 4-11).
Finally, a common pattern is noted of these descriptive analysis results: regardless of cognitiveimpairment status and residential setting prior to death, hospital and ED use rose more rapidly in the last year of life than in previous years and in the last 1-2 months than in earlier months before death.
FIGURE 4-8. Percent of HRS Decedents from the Community with Any Hospitalization Each Month in the Last 12 Months of Life, by CI
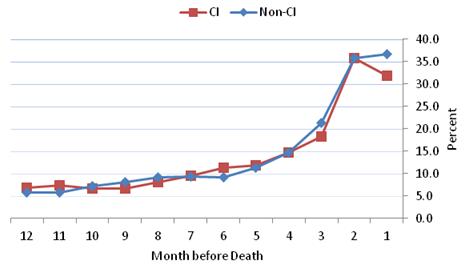
SOURCE: RTI analysis of HRS data linked with Medicare claims, 2000-2008.
NOTE: Numbers shown are unadjusted percentages. CI = Cognitive impairment; HRS = Health and Retirement Study.
FIGURE 4-9. Percent of HRS Decedents from the Community with Any ED Visit Each Month in the Last 12 Months of Life, by CI
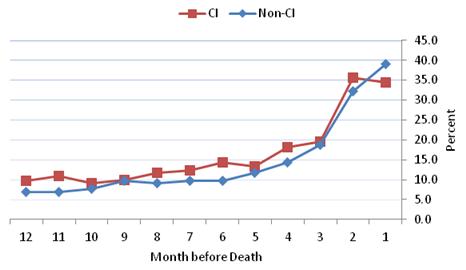
SOURCE: RTI analysis of HRS data linked with Medicare claims, 2000-2008.
NOTE: Numbers shown are unadjusted percentages. CI = Cognitive impairment; ED = Emergency department; HRS = Health and Retirement Study.
FIGURE 4-10. Percent of HRS Decedents from Nursing Homes with Any Hospitalization Each Month in the Last 12 Months of Life, by CI
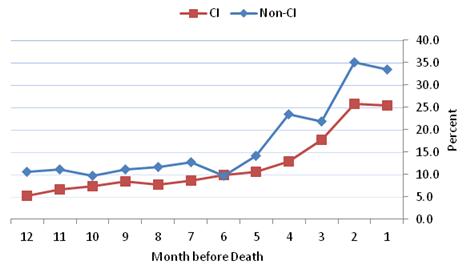
SOURCE: RTI analysis of HRS data linked with Medicare claims, 2000-2008.
NOTE: Numbers shown are unadjusted percentages. CI = Cognitive impairment; HRS = Health and Retirement Study.
FIGURE 4-11. Percent of HRS Decedents from Nursing Homes with Any ED Visit Each Month in the Last 12 Months of Life, by CI
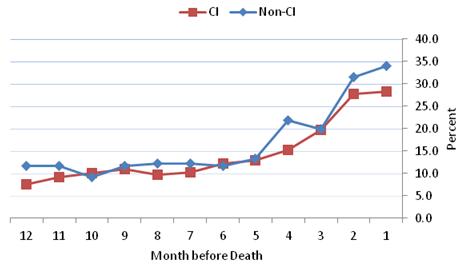
SOURCE: RTI analysis of HRS data linked with Medicare claims, 2000-2008.
NOTE: Numbers shown are unadjusted percentages. CI = Cognitive impairment; ED = Emergency department; HRS = Health and Retirement Study.
5. RESULTS: MEDICARE EXPENDITURES FOR HOSPITAL AND EMERGENCY DEPARTMENT USE, BY COGNITIVE IMPAIRMENT
In this section, we report results on the adjusted (i.e., predicted from multivariate two-part models) average annualized expenditures per beneficiary by cognitive impairment status in each subsample.
5.1. Expenditures for Medicare Beneficiaries: Overall Health and Retirement Study Sample
The two-part model adjusted expenditures by cognitive impairment among Medicare beneficiaries in the overall HRS sample are summarized in Table 5-1. Detailed results from the two-part models are provided in Appendix A16 (community residents) and Appendix A17 (nursing home residents). Table 5-1 shows that among community residents, beneficiaries with cognitive impairment had adjusted expenditures that were $1,811 higher, on average, than those without cognitive impairment for all hospitalizations ($5,837 vs. $4,027); for potentially avoidable hospitalizations, the marginal difference is estimated at $549 ($1,281 vs. $731).
Community residents with cognitive impairment also had higher adjusted expenditures associated with outpatient ED visit, both overall and potentially avoidable, than those without cognitive impairment, although both the absolute amounts and marginal differences in these expenditures were lower, relative to hospitalization associated expenditures.
Differences in adjusted expenditures by cognitive impairment among nursing home residents are also reported in Table 5-1, which are considerably higher than among community residents. For example, adjusted total hospitalization associated expenditures for nursing home residents with cognitive impairment more than doubled that for community residents ($12,437 vs. $5,837); among those with no cognitive impairment, this difference nearly tripled ($11,550 vs. $4,027). This is consistent with greater utilization in general among nursing home residents than among community residents, regardless of cognitive impairment (see Table 4-2).
Also of note, the marginal difference in adjusted expenditures associated with total hospitalizations between nursing home residents with and without cognitive impairment ($887) was less than half of the marginal difference among community residents ($1,811). However, the marginal cost to Medicare for potentially avoidable hospitalizations for nursing home residents with cognitive impairment relative to those without cognitive impairment ($737) was higher than that among community-living residents ($549).
| Hospitalization/ED Visits | CI Mean | (SD) | Non-CIa Mean | (SD) | Marginal Differenceb |
| SOURCE: RTI analysis of HRS data linked with Medicare claims, 2000-2008. NOTE: Reported in table are adjusted amounts, in constant 2008 dollars, estimated from multivariate two-part models adjusting for CI, age, gender, race/ethnicity, education, marital status, types of health insurance coverage, activities of daily living limitations, chronic conditions (total count and specific conditions), self-rated health status, income, urban location, census region, and survey year. Full model results are reported in Appendix A16 (community residents) and Appendix A17 (nursing home residents). CI = Cognitive impairment; ED = Emergency department; HRS = Health and Retirement Study; SD = Standard deviation.Statistical significance: * p 0.05; ** p 0.01; *** p 0.001.
| |||||
| Community | |||||
| Hospitalizations, total | $5,837 | (3,823) | $4,027 | (2,961) | $1,811*** |
| Hospitalizations, potentially avoidable | $1,281 | (1,458) | $731 | (922) | $549*** |
| Outpatient ED visits, total | $166 | (109) | $111 | (79) | $55*** |
| Outpatient ED visits, potentially avoidable | $28 | (29) | $17 | (19) | $10*** |
| N (Person-observations, unweighted) | 4,172 | --- | 4,172 | --- | --- |
| Nursing Home | |||||
| Hospitalizations, total | $12,437 | (6,836) | $11,550 | (6,408) | $887** |
| Hospitalizations, potentially avoidable | $3,390 | (2,923) | $2,653 | (2,339) | $737*** |
| Outpatient ED visits, total | $264 | (136) | $193 | (106) | $71*** |
| Outpatient ED visits, potentially avoidable | $51 | (57) | $40 | (47) | $11*** |
| N (Person-observations, unweighted) | 1,207 | --- | 1,207 | --- | --- |
Overall, the pattern of differences by cognitive impairment in the adjusted expenditures is consistent with that seen in the unadjusted expenditures, as reported in Appendix A18. To varying degrees the adjusted per beneficiary expenditures turned higher, on average, than the unadjusted expenditures for all utilization cost categories regardless of cognitive impairment status. In addition, the marginal difference in adjusted expenditures between those with and without cognitive impairment was reduced, relative to that in unadjusted expenditures, but remains substantial for hospitalization related expenditures.
5.2. Expenditures for Health and Retirement Study Decedents: Last Year of Life
The two-part model adjusted Medicare expenditures among HRS decedents during their last year of life are reported in Table 5-2, with full model results provided in Appendix A19 (community decedents) and Appendix A20 (nursing home decedents).
| Hospitalization/ ED Visits | CI Mean | (SD) | Non-CIa Mean | (SD) | Marginal Differenceb |
| SOURCE: RTI analysis of HRS data linked with Medicare claims, 2000-2008. NOTE: Reported in table are adjusted amounts, in constant 2008 dollars, estimated from multivariate two-part models adjusting for CI, age, gender, race/ethnicity, education, marital status, types of health insurance coverage, activities of daily living limitations, chronic conditions (total count and specific conditions), self-rated health status, income, urban location, census region, and survey year. Full model results are reported in Appendix A19 (community decedents) and Appendix A20 (nursing home decedents). CI = Cognitive impairment; ED = Emergency department; HRS = Health and Retirement Study; SD = Standard deviation.Statistical significance: * p 0.05; ** p 0.01; *** p 0.001.
| |||||
| Community | |||||
| Hospitalizations, total | $19,287 | (6,984) | $22,258 | (8,055) | -$2,971*** |
| Hospitalizations, potentially avoidable | $5,135 | (2,357) | $5,436 | (2,516) | -$301* |
| Outpatient ED visits, total | $319 | (131) | $288 | (126) | $31*** |
| Outpatient ED visits, potentially avoidable | $66 | (52) | $67 | (54) | -$0.3 |
| N (Person-observations, unweighted) | 790 | --- | 790 | --- | --- |
| Nursing Home | |||||
| Hospitalizations, total | $15,208 | (7,935) | $24,074 | (11,616) | -$8,866*** |
| Hospitalizations, potentially avoidable | $5,788 | (3,788) | $7,055 | (4,655) | -$1,267*** |
| Outpatient ED visits, total | $284 | (209) | $268 | (197) | $16 |
| Outpatient ED visits, potentially avoidable | $79 | (139) | $39 | (72) | $40*** |
| N (Person-observations, unweighted) | 669 | --- | 669 | --- | --- |
Results from Table 5-2 show that among community decedents, the marginal or adjusted difference in hospitalization associated expenditures in the last year of life were $2,971 lower for decedents with cognitive impairment ($19,287) than for those without cognitive impairment ($22,258). Among nursing home decedents, total adjusted hospital expenditures were $8,866 lower, on average, for individuals with cognitive impairment ($15,208) than for those without cognitive impairment ($24,074). Similarly, the adjusted expenditures for potentially avoidable hospitalizations were lower for decedents with cognitive impairment than those without cognitive impairment, by $301 for community residents and $1,267 for nursing home decedents.
It is also noted that regardless of residential setting or cognitive impairment status, average adjusted hospital and ED expenditures were substantially higher among HRS decedents during their last year of life (Table 5-2), as compared to beneficiaries in the overall HRS (Table 5-1), most of whom are presumably many years away from death.
The unadjusted average expenditures for decedents in their last year of life are provided in Appendix A21, which show larger differences in unadjusted expenditures associated with hospitalizations by cognitive impairment status, as compared to adjusted differences between the two groups.
6. SUMMARY AND CONCLUSIONS
ADRD places substantial emotional, physical, and financial burdens on individuals suffering the disease and their family caregivers as well as on the health and long-term care systems that support and care for them. Potentially avoidable hospitalizations and ED visits often reduce the quality of life of the people involved and are costly to Medicare. In order to investigate patterns of hospital and ED use (both overall and potentially avoidable) and Medicare expenditures among FFS Medicare beneficiaries age 65 and older with ADRD or severe cognitive impairment compared to beneficiaries without these conditions, this study analyzed data from the 2000-2008 waves of the HRS linked with Medicare claims. We conducted both longitudinal analyses for beneficiaries included in the overall HRS sample as well as analyses of the last years of life for those who died during the study period, each stratified by residential setting (community vs. nursing home). These results provide a more comprehensive and up-to-date picture of hospital and ED utilization by people with ADRD or cognitive impairments than previously available. This final section of the report highlights the study's principal findings, discusses policy implications, notes study limitations and outlines potential areas for additional research.
6.1. Findings and Policy Implications
First, the impact of cognitive impairment on hospital and ED use varies by residential setting. Specifically, among community-dwelling beneficiaries, individuals with cognitive impairment are significantly more likely than those without cognitive impairment to be hospitalized and to have ED visits annually, both overall and for potentially avoidable conditions, after adjusting for demographic, socioeconomic and health-related risk factors. In contrast, among nursing home residents, our results suggest there is no significant difference in hospitalization by cognitive impairment status, either overall or potentially avoidable. The only difference observed is that nursing home residents with cognitive impairment are somewhat more likely to have an ED visit without inpatient admission than those without cognitive impairment. The results of previous studies (Bynum et al. 2004; Lin et al. 2013) are not directly comparable because they did not analyze community residents separately from nursing home residents. However, their findings of higher overall hospitalization and potentially avoidable hospitalization rates among people with cognitive impairment are consistent with this study's findings regarding community residents, who account for a large majority of people with cognitive impairment.
High rates of hospitalization and ED use among community-based people with cognitive impairments, both overall and for potentially avoidable conditions, may be attributable to multiple factors, such as deficiencies in primary care and challenges in providing adequate ambulatory care for people with cognitive impairments in community settings. Furthermore, few programs are specifically designed to reduce hospitalizations among community-based people with Alzheimer's disease or dementia. As a result, when the medical conditions of community-based individuals with cognitive impairment change, family members and other caregivers may have few options other than immediately sending the patients to the hospital. In comparison, most nursing homes are equipped to provide medical and nursing care for many conditions that would be difficult to manage in community settings. Institutional capacity intreating and managing complex conditions has grown in nursing homes as part of the shift to post-acute care over the last decade (Tyler et al. 2013). Moreover, given the high prevalence of dementia in nursing homes, facilities may be more used to treating people with ADRD than are community-based physicians. Notably, in one study the risk of hospitalization for nursing home residents with dementia was lower in facilities with a specialized dementia care unit or a high prevalence of dementia residents (Gruneir et al. 2007).
Although people with cognitive impairment in nursing homes do not have higher rates of hospitalizations and potentially avoidable hospitalizations than do people without cognitive impairment, the absolute rates are quite high (nearly 50%). Moreover, over 40% of nursing home residents with hospitalizations (both those with and without cognitive impairment) have potentially avoidable hospitalizations. A number of initiatives are underway to address the overall issue of potentially avoidable hospitalizations, including the CMS' Initiative to Reduce Avoidable Hospitalizations among Nursing Facility Residents and the Nursing Home Value Based Purchasing demonstration, but few programs are specifically targeted at people with cognitive impairment.
Second, hospital and ED use by people with and without cognitive impairment converge during the last few years of life. Specifically, at 1 year before death, there were few utilization differences by cognitive impairment status for community-living Medicare FFS beneficiaries. However, when the look-back window was extended to 5 years before death, substantial differences in utilization emerged whereby people with cognitive impairment had significantly higher rates of hospitalization and ED use than those without cognitive impairment (consistent with patterns described above in the community-dwelling Medicare population). Thus, cognitively impaired individuals are hospitalized and visit the ED more frequently than others several years before death, with these utilization differences diminishing as death approaches. One possible explanation of this pattern is that dying is difficult and complex for all community-living people, and that approaching death overwhelms any differences in cognitive status, resulting in similar rates of hospitalization and ED visits. Thus, dying would appear to be the ultimate "equalizer" for hospital and ED use for Medicare FFS beneficiaries living in the community, regardless of cognitive impairment. Although the Bynum et al. (2004) study stratified their 1-year sample of Medicare beneficiaries by survivors and those who died within the year, their analyses and window before death were more limited and not designed to detect these trends.
The sharp rise in hospitalizations in the last year of life for beneficiaries in the community is particularly striking, with about 80% of people (regardless of cognitive impairment) having at least one inpatient admission and as many having at least one ED visit (regardless of whether it was associated with an inpatient hospital admission). Further, nearly half of those hospitalized in the last year of life had a potentially avoidable hospitalization. Again, these findings point to the challenges in providing adequate community-based medical care and long-term services and supports to older people that may reduce admissions to the hospital in their last year of life, whether or not they have dementia or cognitive impairments.
Third, nursing home residents who died with cognitive impairment were significantly less likely than those without cognitive impairment to be hospitalized during the last year of life. This finding may be related to the fact that many nursing homes possess the on-site capacity to manage changes in the medical conditions of residents. It may also be that nursing homes, physicians and family are inclined to provide less aggressive end-of-life care to cognitively impaired nursing home residents than to residents without cognitive impairment (Cadigan et al. 2012; Gessert et al. 2006; Li, Zheng, & Temkin-Grenner 2013). Further, aggressive treatments that require hospitalization of nursing home residents with advanced dementia may produce little improvement in quality of life (Goldfeld, Hamel, & Mitchell 2013) and may be futile care. Our analyses indicate that nursing home residents with cognitive impairments used hospice more frequently than those without cognitive impairments (results not reported), which could also have contributed to their lower rates of hospitalization in the last year of life. This finding is consistent with the rising use and duration of Medicare-covered hospice care for nursing home residents (Miller, Lima, & Mitchell 2010).
Nonetheless, among nursing home residents who were hospitalized in their last year of life, a high proportion of them--almost two-thirds of decedents with cognitive impairment and more than half of those without cognitive impairment--had at least one potentially avoidable hospitalization. Thus, there is much room for reducing unnecessary hospitalizations for nursing home residents toward the end of life--hospitalizations that are burdensome and often have negative impacts on the quality of care and quality of life for individuals affected (Gozalo et al. 2011; Teno et al. 2013).
Fourth, Medicare expenditures associated with hospital and ED use for people with cognitive impairment and people without cognitive impairment differs by residential setting and proximity to death. In the overall analysis, average Medicare expenditures for people with cognitive impairment are higher than for people without cognitive impairment, regardless of setting. During any given year over the study period, community-living people with cognitive impairment incurred greater, multivariate adjusted Medicare costs associated with all-cause hospitalizations and with potentially avoidable hospitalizations than those without cognitive impairment. This is consistent with the utilization patterns by cognitive impairment in community settings, as reported earlier. In nursing homes, the net difference in average Medicare expenditures between residents with and without cognitive impairment is also positive for all-cause hospitalizations, and for potentially avoidable hospitalizations, although no significant difference by cognitive impairment was found in the likelihood of having any hospitalization or any potentially avoidable hospitalization among nursing home residents. It is possible that among those nursing home residents who were ever hospitalized, individuals with cognitive impairment may have longer lengths of stay, are admitted with higher cost diagnosis-related groups, or have a greater number of hospitalizations, thereby increasing their total hospitalization associated expenditures, relative to those without cognitive impairment. The results indicating higher Medicare expenditures among beneficiaries with cognitive impairment is consistent with a study by Bynum et al. (2004) that found that the annual adjusted expenditures for hospitalizations among Medicare beneficiaries with dementia were substantially higher than among beneficiaries without dementia, although the study did not distinguish residential settings. Thus, the rising number of Medicare beneficiaries with Alzheimer's disease is likely to increase hospital expenditures more than if they were not cognitively impaired.
In contrast, we found lower average expenditures associated with hospitalizations in the last year of life for beneficiaries with cognitive impairment than those without cognitive impairment, both in the community and in nursing homes. This is consistent with the finding that nursing home residents with cognitive impairment were about a third less likely to be hospitalized than those without cognitive impairment in the last year of life. Among decedents in the community, the lower expenditures for all-cause hospitalizations and for potentially avoidable hospitalizations due to cognitive impairment are seemingly at odds with our finding that community-based people with and without cognitive impairment are just equally as likely to have a hospitalization or a potentially avoidable hospitalization in the last year of life. Again, possible explanations are that toward the end of life people with cognitive impairment may have received less aggressive care than others without cognitive impairment while in the hospital, may have been admitted with lower cost diagnosis-related groups, or may have fewer hospitalizations per-person, thereby lowering Medicare costs. These findings suggest that policy makers need to consider analyses at both the beneficiary level and the service or expenditure level in order to fully understand the impact of cognitive impairment on service use and to develop policies that ensure appropriate access to care while controlling program costs.
6.2. Limitations
Like all studies, this research has limitations. First, our analyses are based on data for elderly FFS Medicare beneficiaries in the HRS. Beneficiaries enrolled in managed care organizations are excluded because detailed claims data are not available. Thus, our results are not necessarily generalizable to the general elderly population. The results are representative of the FFS Medicare population only.
Second, although using a hybrid definition of cognitive impairment in our analyses is a strength, as it combines Medicare claims-based ADRD diagnosis and HRS survey-based data to identify severe cognitive impairment that is consistent with dementia, the possibility of under or overdiagnosis or misclassifications remains given data limitations. Nevertheless, preliminary sensitivity analyses suggested that our results are robust to alternative definitions of cognitive impairment. However, our dichotomous measure of cognitive impairment is somewhat limited in that it is not sensitive to disease severity or progression. Thus, this study is not able to answer questions about how the disease trajectory for people with ADRD or cognitive impairment changes over time and relative to death, and whether changes in severity such as gradual cognitive decline versus more rapid decline have implications on health care utilization.
Third, another potential limitation concerns our definition of potentially avoidable hospitalization and ED visits, which, like virtually all other studies of potentially avoidable hospitalization, is the product of expert opinion rather than an assessment of whether specific hospitalizations actually are avoidable (Ouslander & Maslow 2012; Polniaszek et al. 2011; Spector et al. 2013; Walsh et al. 2012). In addition, much less research has been conducted on potentially avoidable ED visits and standard definitions, especially for older people and nursing home residents, have not been developed and empirically tested. This study operated on the assumption that conditions which were potentially avoidable for hospitalizations are the same conditions that are potentially avoidable for ED use, which may not be the case. It is also unclear whether some of the conditions on our potentially avoidable list are appropriate for cognitively impaired individuals who may communicate their medical problems poorly.
Fourth, our analytic sample does not include Medicare data on non-respondents to a given HRS wave or to people who did not give permission to the HRS to obtain their Medicare records. To the extent that sample attrition is disproportionately among cognitively impaired individuals, our prevalence estimate of cognitive impairment and its impact would be conservative. Nevertheless, research suggests that use of proxy interviews for impaired respondents in the HRS substantially eliminates attrition bias in measured cognition (Weir, Faul, & Langa 2011).
6.3. Future Research
These study results raise several possible venues for further research. Hospitalizations, including readmissions and potentially avoidable hospitalizations, are a topic with increasing policy attention. Given high readmission rates among Medicare beneficiaries (Jencks, Williams, & Coleman 2009; Mor et al. 2010), several health reform initiatives have focused on developing or evaluating initiatives designed to reduce readmissions or potentially avoidable hospitalizations. Assessing the impacts of these initiatives on community and nursing home residents with cognitive impairment is an important next step in light of the projections indicating that the burden associated with Alzheimer's disease will be much greater in the future. For example, future research could focus on whether integrating acute and long-term services and supports of beneficiaries dually eligible in Medicare and Medicaid are effective in improving rates of potentially avoidable utilization for this population. Other research could assess whether patient-centered medical homes or home and community-based services are associated with lower hospital and ED use for people with dementia. With about a quarter of elderly Medicare beneficiaries enrolled in managed care organizations (Centers for Medicare & Medicaid Services 2013), a major policy question is how Medicare Advantage plans treat people with ADRD or cognitive impairment. Given the high prevalence of ADRD among residential care facility residents (Caffrey et al. 2012), additional research could also assess the utilization and expenditure patterns among people living in residential care facilities, and how they compare to nursing home and community residents.
Another area of potential further investigation relates to the effect of cognitive impairment at the end of life. Although we conducted some analyses of hospice utilization, we did not fully address this topic due to data limitations. Future research could address research questions pertaining to the impact of hospice enrollment on hospital and ED use among people with cognitive impairment.
6.4. Conclusions
The aging of the population makes it likely that the number of people with ADRD will increase dramatically in coming years, even if the underlying prevalence rates decline (Matthews et al. 2013). Given that recent estimates indicate that the number of people over 65 with Alzheimer's disease is projected to nearly triple by 2050 (Hebert et al. 2013), our results of hospital and ED use and associated Medicare expenditures underscores the importance of addressing issues specific to this population. From the perspective of people with dementia as well as their caregivers, hospitalizations and ED visits are disorienting, highly stressful, and often lead to adverse outcomes. Thus, the high rates of hospitalizations and ED visits, especially those that are potentially avoidable, have clear implications for quality of life. Similarly, from the perspective of Medicare and other payers, the fact that a substantial portion of hospitalizations and ED use is potentially avoidable is of great policy significance since reducing inappropriate utilization in those settings provides a potential opportunity to achieve cost savings; however, these savings may be offset by the cost of the initiatives to prevent potentially avoidable utilization. The findings in this study point to the continued need for planning and developing appropriate services and supports for older people with cognitive impairments in both community and institutional settings.
7. REFERENCES
Agency for Healthcare Research and Quality. 2007. "Guide to Prevention Quality Indicators: Hospital Admission for Ambulatory Care Sensitive Conditions, Version 3.1." Available at: http://www.qualityindicators.ahrq.gov/Downloads/Modules/PQI/V31/pqi_guide_v31.pdf.
Alzheimer's Association. 2012. "Alzheimer's Disease Facts and Figures." Alzheimer's & Dementia Volume 8 (Issue 2).
American Psychiatric Association. 1994. Diagnostic and Statistical Manual of Mental Disorders. Washington, DC: American Psychiatric Press.
Anderson, W.L., J.M. Wiener, E.A. Finkelstein, and B.S. Armour. 2011. "Estimates of national health care expenditures associated with disability." Journal of Disability Policy Studies 21(4): 230-40.
Ballard, D.W., M. Price, V. Fung, R. Brand, M.E. Reed, B. Fireman, J.P. Newhouse, J.V. Selby, and J. Hsu. 2010. "Validation of an algorithm for categorizing the severity of hospital emergency department visits." Med Care 48(1): 58-63.
Bishop, C., J. Meagher, J. Perloff, and G. Zolotutsky. 2010. "Event analysis of all-cause and ambulatory care sensitive hospitalization of long-stay nursing home residents." Baltimore, MD: Centers for Medicare and Medicaid Services (CMS Contract Number HHSM-500-2005-000201).
Boustani, M., M.S. Baker, N. Campbell, S. Munger, S.L. Hui, P. Castelluccio, M. Farber, O. Guzman, A. Ademuyiwa, D. Miller, and C. Callahan. 2010. "Impact and recognition of cognitive impairment among hospitalized elders." J Hosp Med 5(2): 69-75.
Burton, P., L. Gurrin, and P. Sly. 1998. "Extending the simple linear regression model to account for correlated responses: An introduction to generalized estimating equations and multi-level mixed modelling." Stat Med 17(11): 1261-91.
Bynum, J.P., P.V. Rabins, W. Weller, M. Niefeld, G.F. Anderson, and A.W. Wu. 2004. "The relationship between a dementia diagnosis, chronic illness, Medicare expenditures, and hospital use." J Am Geriatr Soc 52(2): 187-94.
Cadigan, R.O., D.C. Grabowski, J.L. Givens, and S.L. Mitchell. 2012. "The quality of advanced dementia care in the nursing home: The role of special care units." Med Care 50(10): 856-62.
Caffrey, C. 2010. "Potentially preventable emergency department visits by nursing home residents: United States, 2004." NCHS data brief, no 33. Hyattsville, MD: National Center for Health Statistics.
Caffrey, C., M. Sengupta, E. Park-Lee, A. Moss, E. Rosenoff, and L. Harris-Kojetin. 2012. "Residents living in residential care facilities: United States, 2010." Hyattsville, MD: National Center for Health Statistics (NCHS data brief, no 91).
Callahan, C.M., G. Arling, W. Tu, M.B. Rosenman, S.R. Counsell, T.E. Stump, and H.C. Hendrie. 2012. "Transitions in care for older adults with and without dementia." J Am Geriatr Soc 60(5): 813-20.
Carter, M.W. 2003. "Variations in hospitalization rates among nursing home residents: The role of discretionary hospitalizations." Health Serv Res 38(4): 1177-206.
Centers for Medicare and Medicaid Services. 2013. "Table 2.2. Medicare enrollment: Hospital Insurance and/or Supplementary Medical Insurance programs for total, fee-for-service and managed care enrollees, by demographic characteristics as of July 1, 2012" [accessed on August 25, 2013]. Available at: http://www.cms.gov/Research-Statistics-Data-and-Systems/Statistics-Trends-and-Reports/MedicareMedicaidStatSupp/2013.html.
Clark, D.O., T.E. Stump, W. Tu, D.K. Miller, K.M. Langa, F.W. Unverzagt, and C.M. Callahan. 2012. "Hospital and Nursing Home Use From 2002 to 2008 Among US Older Adults With Cognitive Impairment, Not Dementia in 2002." Alzheimer Dis Assoc Disord.
Clevenger, C.K., T.A. Chu, Z. Yang, and K.W. Hepburn. 2012. "Clinical care of persons with dementia in the emergency department: A review of the literature and agenda for research." J Am Geriatr Soc 60(9): 1742-8.
Cohen, C.A. and D. Pushkar. 1999. "Lessons learned from a longitudinal study of dementia care." Am J Geriatr Psychiatry 7(2): 139-46.
Crimmins, E.M., J.K. Kim, K.M. Langa, and D.R. Weir. 2011. "Assessment of cognition using surveys and neuropsychological assessment: The Health and Retirement Study and the Aging, Demographics, and Memory Study." J Gerontol B Psychol Sci Soc Sci 66 Suppl 1: i162-71.
Fillit, H., J.W. Hill, and R. Futterman. 2002. "Health care utilization and costs of Alzheimer's disease: The role of co-morbid conditions, disease stage, and pharmacotherapy." Fam Med 34(7): 528-35.
Frytak, J.R., H.J. Henk, Y. Zhao, L. Bowman, J.A. Flynn, and M. Nelson. 2008. "Health service utilization among Alzheimer's disease patients: Evidence from managed care." Alzheimers Dement 4(5): 361-7.
Gessert, C.E., I.V. Haller, R.L. Kane, and H. Degenholtz. 2006. "Rural-urban differences in medical care for nursing home residents with severe dementia at the end of life." J Am Geriatr Soc 54(8): 1199-205.
Goldfeld, K.S., M.B. Hamel, and S.L. Mitchell. 2013. "The Cost-Effectiveness of the Decision to Hospitalize Nursing Home Residents With Advanced Dementia." J Pain Symptom Manage.
Gozalo, P., J.M. Teno, S.L. Mitchell, J. Skinner, J. Bynum, D. Tyler, and V. Mor. 2011. "End-of-life transitions among nursing home residents with cognitive issues." N Engl J Med 365(13): 1212-21.
Grabowski, D.C., K.A. Stewart, S.M. Broderick, and L.A. Coots. 2008. "Predictors of nursing home hospitalization: A review of the literature." Med Care Res Rev65(1): 3-39.
Gruneir, A., S.C. Miller, Z. Feng, O. Intrator, and V. Mor. 2008. "Relationship between state Medicaid policies, nursing home racial composition, and the risk of hospitalization for Black and White residents." Health Serv Res 43(3): 869-81.
Gruneir, A., S.C. Miller, O. Intrator, and V. Mor. 2007. "Hospitalization of nursing home residents with cognitive impairments: The influence of organizational features and state policies."Gerontologist 47(4): 447-56.
Hastings, S.N., E.Z. Oddone, G. Fillenbaum, R.J. Sloane, and K.E. Schmader. 2008. "Frequency and predictors of adverse health outcomes in older Medicare beneficiaries discharged from the emergency department." Med Care 46(8): 771-7.
Hebert, L.E., J. Weuve, P.A. Scherr, and D.A. Evans. 2013. "Alzheimer disease in the United States (2010-2050) estimated using the 2010 census." Neurology80(19): 1778-83.
Hurd, M.D., P. Martorell, A. Delavande, K.J. Mullen, and K.M. Langa. 2013. "Monetary costs of dementia in the United States."N Engl J Med 368(14): 1326-34.
Inouye, S.K. 2006. "Delirium in older persons."N Engl J Med 354(11): 1157-65.
Institute for Social Research. 2011. "Health and Retirement Study: Sample Sizes and Response Rates" [accessed on July 12, 2013, 2011]. Available at: http://hrsonline.isr.umich.edu/sitedocs/sampleresponse.pdf.
Intrator, O., J. Zinn, and V. Mor. 2004. "Nursing home characteristics and potentially preventable hospitalizations of long-stay residents." J Am Geriatr Soc 52(10): 1730-6.
Jencks, S.F., M.V. Williams, and E.A. Coleman. 2009. "Rehospitalizations among patients in the Medicare fee-for-service program." N Engl J Med 360(14): 1418-28.
Jones, A.L., L.L. Dwyer, A.R. Bercovitz, and G.W. Strahan. 2009. "The National Nursing Home Survey: 2004 Overview". National Center for Health Statistics.
Kaiser Comission on Medicaid and the Uninsured. 2010. "Chronic Disease and Co-Morbidity Among Dual Eligibles: Implications for Patterns of Medicaid and Medicare Service Use and Spending."
Kovach, C.R. and T. Wells. 2002. "Pacing of activity as a predictor of agitation for persons with dementia in acute care." J Gerontol Nurs 28(1): 28-35.
Kramer, A., T. Eilertsen, G. Goodrich, and S. Min. 2007. "Understanding temporal changes in and factors associated with SNF rates of community discharge and rehospitalization." Washington, DC: Medicare Payment Advisory Commission.
Langa, K.M., M.E. Chernew, M.U. Kabeto, A.R. Herzog, M.B. Ofstedal, R.J. Willis, R.B. Wallace, L.M. Mucha, W.L. Straus, and A.M. Fendrick. 2001. "National estimates of the quantity and cost of informal caregiving for the elderly with dementia." J Gen Intern Med 16(11): 770-8.
Langa, K.M., M. Kabeto, and D. Weir. 2009. "Report on race and cognitive impairment using HRS." 2010 Alzheimer's Disease Facts and Figures. Available at: http://www.alz.org/documents_custom/report_alzfactsfigures2010.pdf.
Langa, K.M., E.B. Larson, J.H. Karlawish, D.M. Cutler, M.U. Kabeto, S.Y. Kim, and A.B. Rosen. 2008. "Trends in the prevalence and mortality of cognitive impairment in the United States: Is there evidence of a compression of cognitive morbidity?" Alzheimers Dement 4(2): 134-44.
Leibson, C., T. Owens, P. O'Brien, S. Waring, E. Tangalos, V. Hanson, M. Plevak, and E. Kokmen. 1999. "Use of physician and acute care services by persons with and without Alzheimer's disease: A population-based comparison." J Am Geriatr Soc 47(7): 864-9.
Li, Q., N.T. Zheng, and H. Temkin-Greener. 2013. "Quality of end-of-life care of long-term nursing home residents with and without dementia." J Am Geriatr Soc 61(7): 1066-73.
Liang, K.Y., and S.L. Zeger. 1986. "Longitudinal data analysis using generalized linear models." Biometrika 73: 13-22.
Lin, P.J., H.M. Fillit, J.T. Cohen, and P.J. Neumann. 2013. "Potentially avoidable hospitalizations among Medicare beneficiaries with Alzheimer's disease and related disorders." Alzheimers Dement 9(1): 30-8.
Lin, P.J., D.I. Kaufer, M.L. Maciejewski, R. Ganguly, J.E. Paul, and A.K. Biddle. 2010. "An examination of Alzheimer's disease case definitions using Medicare claims and survey data." Alzheimers Dement 6(4): 334-41.
Liu, T., M.R. Sayre, and S.C. Carleton. 1999. "Emergency medical care: Types, trends, and factors related to nonurgent visits." Acad Emerg Med 6(11): 1147-52.
Manning, W.G., A. Basu, and J. Mullahy. 2005. "Generalized modeling approaches to risk adjustment of skewed outcomes data." J Health Econ 24(3): 465-88.
Manning, W.G., and J. Mullahy. 2001. "Estimating log models: To transform or not to transform?" J Health Econ 20(4): 461-94.
Maslow, K., and E. Heck. 2005. "Dementia care and quality of life in assisted living and nursing homes: Perspectives of the Alzheimer's Association." Gerontologist 45 Spec No 1(1): 8-10.
Matthews, F.E., A. Arthur, L.E. Barnes, J. Bond, C. Jagger, L. Robinson, and C. Brayne. 2013. "A two-decade comparison of prevalence of dementia in individuals aged 65 years and older from three geographical areas of England: Results of the Cognitive Function and Ageing Study I and II." Lancet (Online Early).
McCloskey, R.M. 2004. "Caring for patients with dementia in an acute care environment." Geriatr Nurs 25(3): 139-44.
Mecocci, P., E. von Strauss, A. Cherubini, S. Ercolani, E. Mariani, U. Senin, B. Winblad, and L. Fratiglioni. 2005. "Cognitive impairment is the major risk factor for development of geriatric syndromes during hospitalization: Results from the GIFA study." Dement Geriatr Cogn Disord 20(4): 262-9.
Miller, S.C., J.C. Lima, and S.L. Mitchell. 2010. "Hospice care for persons with dementia: The growth of access in US nursing homes." Am J Alzheimers Dis Other Demen 25(8): 666-73.
Mor, V., O. Intrator, Z. Feng, and D.C. Grabowski. 2010. "The revolving door of rehospitalization from skilled nursing facilities." Health Aff (Millwood) 29(1): 57-64.
National Institutes on Aging. 2005. "Progress Report on Alzheimer's Disease 2004-2005: New Discoveries, New Insights." (NIH Publication No. 05-5724.)
Naylor, M.D., J.H. Karlawish, S.E. Arnold, A.S. Khachaturian, Z.S. Khachaturian, V.M. Lee, M. Baumgart, S. Banerjee, C. Beck, K. Blennow, R. Brookmeyer, K.R. Brunden, K.C. Buckwalter, M. Comer, K. Covinsky, L.F. Feinberg, G. Frisoni, C. Green, R.M. Guimaraes, L.P. Gwyther, F.F. Hefti, M. Hutton, C. Kawas, D.M. Kent, L. Kuller, K.M. Langa, R.W. Mahley, K. Maslow, C.L. Masters, D.E. Meier, P.J. Neumann, S.M. Paul, R.C. Petersen, M.A. Sager, M. Sano, D. Schenk, H. Soares, R.A. Sperling, S.M. Stahl, V. van Deerlin, Y. Stern, D. Weir, D.A. Wolk, and J.Q. Trojanowski. 2012. "Advancing Alzheimer's disease diagnosis, treatment, and care: Recommendations from the Ware Invitational Summit." Alzheimers Dement 8(5): 445-52.
Naylor, M.D., C. Stephens, K.H. Bowles, and M.B. Bixby. 2005. "Cognitively impaired older Adults: From hospital to home." American Journal of Nursing 105(2): 52-61.
Nikmat, A.W., G. Hawthorne, and S.H. Al-Mashoor. 2011. "Quality of life in dementia patients: Nursing home versus home care." Int Psychogeriatr 23(10): 1692-700.
O'Malley, A.J., D.J. Caudry, and D.C. Grabowski. 2011. "Predictors of nursing home residents' time to hospitalization." Health Serv Res 46(1 Pt 1): 82-104.
Okie, S. 2011. "Confronting Alzheimer's disease." N Engl J Med 365(12): 1069-72.
Ouslander, J.G., G. Lamb, M. Perloe, J.H. Givens, L. Kluge, T. Rutland, A. Atherly, and D. Saliba. 2010. "Potentially avoidable hospitalizations of nursing home residents: Frequency, causes, and costs." [See editorial comments by Drs. Jean F. Wyman and William R. Hazzard, pp 760-761]. J Am Geriatr Soc 58(4): 627-35.
Ouslander, J.G., and K. Maslow. 2012. "Geriatrics and the triple aim: Defining preventable hospitalizations in the long-term care population." J Am Geriatr Soc 60(12): 2313-8.
Pedone, C., S. Ercolani, M. Catani, D. Maggio, C. Ruggiero, R. Quartesan, U. Senin, P. Mecocci, and A. Cherubini. 2005. "Elderly patients with cognitive impairment have a high risk for functional decline during hospitalization: The GIFA Study." J Gerontol A Biol Sci Med Sci 60(12): 1576-80.
Phelan, E.A., S. Borson, L. Grothaus, S. Balch, and E.B. Larson. 2012. "Association of incident dementia with hospitalizations." Jama 307(2): 165-72.
Polniaszek, S., E.G. Walsh, and J.M. Wiener. 2011. "Hospitalizations of Nursing Home Residents: Background and Options." Washington, DC: Office of the Assistant Secretary for Planning and Evaluation, U.S. Department of Health and Human Services. Available at: http://aspe.hhs.gov/daltcp/reports/2011/NHResHosp.htm.
Reuben, D.B., C.P. Roth, J.C. Frank, S.H. Hirsch, D. Katz, H. McCreath, J. Younger, M. Murawski, E. Edgerly, J. Maher, K. Maslow, and N.S. Wenger. 2010. "Assessing care of vulnerable elders--Alzheimer's disease: A pilot study of a practice redesign intervention to improve the quality of dementia care." J Am Geriatr Soc 58(2): 324-9.
Rudolph, J.L., N.M. Zanin, R.N. Jones, E.R. Marcantonio, T.G. Fong, F.M. Yang, L. Yap, and S.K. Inouye. 2010. "Hospitalization in community-dwelling persons with Alzheimer's disease: Frequency and causes." J Am Geriatr Soc 58(8): 1542-8.
Smith, A.K., E. McCarthy, E. Weber, I.S. Cenzer, J. Boscardin, J. Fisher, and K. Covinsky. 2012. "Half of older Americans seen in emergency department in last month of life; most admitted to hospital, and many die there." Health Aff (Millwood) 31(6): 1277-85.
Spector, W.D., R. Limcangco, C. Williams, W. Rhodes, and D. Hurd. 2013. "Potentially avoidable hospitalizations for elderly long-stay residents in nursing homes." Med Care 51(8): 673-81.
St. Clair, P., D. Bugliari, N. Campbell, S. Chien, O. Hayden, M. Hurd, R. Main, A. Miu, M. Moldoff, C. Panis, P. Pantoja, A. Rastegar, S. Rohwedder, M. Oshiro, and J. Zissimopoulos. 2011. "RAND HRS Data Documentation, Version L" [accessed on July 12, 2011]. Available at: http://www.rand.org/content/dam/rand/www/external/labor/aging/dataprod/randhrsL.pdf.
Stephens, C.E., R. Newcomer, M. Blegen, B. Miller, and C. Harrington. 2012. "Emergency department use by nursing home residents: Effect of severity of cognitive impairment." Gerontologist 52(3): 383-93.
Sullivan-Marx, E.M. 2001. "Achieving restraint-free care of acutely confused older adults." J Gerontol Nurs 27(4): 56-61.
Taylor, D.H. Jr., G.G. Fillenbaum, and M.E. Ezell. 2002. "The accuracy of Medicare claims data in identifying Alzheimer's disease." J Clin Epidemiol55(9): 929-37.
Taylor, D.H. Jr., T. Ostbye, K.M. Langa, D. Weir, and B.L. Plassman. 2009. "The accuracy of Medicare claims as an epidemiological tool: The case of dementia revisited." J Alzheimers Dis 17(4): 807-15.
Teno, J.M., P.L. Gozalo, J.P. Bynum, N.E. Leland, S.C. Miller, N.E. Morden, T. Scupp, D.C. Goodman, and V. Mor. 2013. "Change in end-of-life care for Medicare beneficiaries: Site of death, place of care, and health care transitions in 2000, 2005, and 2009." Jama 309(5): 470-7.
Tilly, J., J.M. Wiener, E. Gould, and J. O'Keeffe. 2011. "Making the long-term services and supports system work for people with dementia and their caregivers." Issue brief supported by the U.S. Administration on Aging (Contract #GS-10F-0097L/HHSP233200900635G).
Tyler, D.A., Z. Feng, N.E. Leland, P. Gozalo, O. Intrator, and V. Mor. 2013. "Trends in postacute care and staffing in US nursing homes, 2001-2010." J Am Med Dir Assoc (in press).
U.S. Census Bureau. 2012. "Statistical Abstract of the United States: 2012, Section 3: Health and Nutrition."
U.S. Department of Health and Human Services. 2013. "National Plan to Address Alzheimer's Disease: 2013 Update" [accessed on July 12, 2013]. Available at: http://aspe.hhs.gov/daltcp/napa/NatlPlan2013.shtml.
Walsh, E.G., M.P. Freiman, S. Haber, A. Bragg, J. Ouslander, and J.M. Wiener. 2010. "Cost Drivers for Dually Eligible Beneficiaries: Potentially Avoidable Hospitalizations from Long-Term and Post-Acute Care Settings." Report for the Centers for Medicare and Medicaid Services. Waltham, MA: RTI International.
Walsh, E.G., J.M. Wiener, S. Haber, A. Bragg, M. Freiman, and J.G. Ouslander. 2012. "Potentially avoidable hospitalizations of dually eligible Medicare and Medicaid beneficiaries from nursing facility and home- and community-based services waiver programs." J Am Geriatr Soc 60(5): 821-9.
Walsh, E.G., B. Wu, J.B. Mitchell, and L.F. Berkmann. 2003. "Cognitive function and acute care utilization." J Gerontol B Psychol Sci Soc Sci 58(1): S38-49.
Weir, D., J. Faul, and K. Langa. 2011. "Proxy interviews and bias in the distribution of cognitive abilities due to non-response in longitudinal studies: A comparison of HRS and ELSA." Longitudinal and Life Course Studies 2(2): 170-84.
Wharam, J.F., B.E. Landon, A.A. Galbraith, K.P. Kleinman, S.B. Soumerai, and D. Ross-Degnan. 2007. "Emergency department use and subsequent hospitalizations among members of a high-deductible health plan." Jama 297(10): 1093-102.
Wilson, R.S., D.R. Weir, S.E. Leurgans, D.A. Evans, L.E. Hebert, K.M. Langa, B.L. Plassman, B.J. Small, and D.A. Bennett. 2011. "Sources of variability in estimates of the prevalence of Alzheimer's disease in the United States." Alzheimers Dement 7(1): 74-9.
Wolinsky, F.D., L. Liu, T.R. Miller, H. An, J.F. Geweke, B. Kaskie, K.B. Wright, E.A. Chrischilles, C.E. Pavlik, E.A. Cook, R.L. Ohsfeldt, K.K. Richardson, G.E. Rosenthal, and R.B. Wallace. 2008. "Emergency department utilization patterns among older adults." J Gerontol A Biol Sci Med Sci 63(2): 204-9.
Zhao, Y., T.C. Kuo, S. Weir, M.S. Kramer, and A.S. Ash. 2008. "Healthcare costs and utilization for Medicare beneficiaries with Alzheimer's." BMC Health Serv Res 8: 108.
APPENDIX A1. ILLUSTRATION OF ANALYTIC SAMPLE INCLUSION AND EXCLUSION CRITERIA
The following is a table representation of the graph available in the PDF version of this report.
| Inclusion | Exclusion | Cum # Exclusions | Cum % Exclusions | |||
| SOURCE: RTI analysis of HRS and Medicare claims data, 2008. NOTE: BASF = Beneficiary annual summary file; Cum = Cumulative; FFS = Fee-for-service; HMO = Health maintenance organization; HRS = Health and Retirement Study; NH = Nursing home.
| ||||||
| A. | Total HRS sample, 2008a | 17,217 | ||||
 | 1,127 | Zero weight (not eligible as HRS respondent)b | 1,127 | 6.5% | ||
| B. | Non-zero weight or zero weight but the respondent lives in a NH | 16,090 | ||||
| 4,851 | Age 65 at time of interview | 5,978 | 34.7% | ||
| C. | Age 65+ at time of interview | 11,239 | ||||
| 1,744 | Not linked to Medicare data (not beneficiaries/no consent) | 7,722 | 44.9% | ||
| D. | In BASF 2008 (linked to Medicare data) | 9,495 | ||||
| 2,497 | Alive and enrolled in HMO for 12 months or enrolled in HMO for all months during the year till death | 10,219 | 59.4% | ||
| E. | On FFS Medicare (Parts A or B) for 1+ months: Final samplec | 6,998 | ||||
APPENDIX A2. COMPARISON OF ALTERNATIVE MEASURES OF COGNITIVE IMPAIRMENT
A2.1. Appendix Overview
The purpose of this appendix is to describe the development of several cognitive impairment measures for consideration in analyses for this project. It provides a brief overview of the cognitive impairment measures, presents definitions for each of the measures developed, and compares the alternative definitions using descriptive analyses. RTI presented definitions 1-4 to the TAG in March 2013, and, based on TAG input, made refinements to the proposed definition. The final definition used for this study was a modified version of definition 4 and is presented in the last section of this appendix.
A2.2. Cognitive Impairment Measures
The key independent or explanatory variables for this study include measures of ADRD and cognitive impairment. Defining and measuring these conditions is challenging because Alzheimer's disease is underdiagnosed and the HRS has limited data on cognitive abilities. This section details four possible approaches to defining ADRD and cognitive impairment:
-
Definition 1 is an HRS -based approach established by Langa et al. (2001, 2008).
-
Definition 2 is an alternative HRS -based cognitive impairment measure developed by Langa, Kabeto, & Weir (2009), and was applied in Clark et al. (2012) and Crimmins et al. (2011).
-
Definition 3 is a Medicare claims-based measure of ADRD from the CMS CCW.
-
Definition 4, an RTI-developed measure of cognitive impairment, is a hybrid of these HRS and claims-based measures.
Below, we further detail the operational definitions of these measures and present the prevalence of cognitive impairment by each definition in the HRS.
A2.3. Definition 1: Adapted from Langa et al. (2001; 2008)
To assess levels of cognitive impairment, definition 1 relies on the HRS measures of cognitive function, which are asked consistently of respondents aged 65 and over across all waves. Specifically, the HRS assesses cognitive function using a 35-point scale which includes: an immediate and delayed 10-noun free recall test to measure memory; a serial seven subtraction test to measure working memory; a counting backwards test to measure speed of mental processing; an object naming test to measure knowledge and language; and recall of the date, the president, and the vice president to measure orientation. For self-respondents, the presence and severity of cognitive impairment are defined using this 35-point cognitive scale, with higher scores indicating better performance. Langa et al. (2008) used the following cutoffs to define cognitive impairment: a score of 11 or above was considered as "normal" cognitive function and a score of 10 or below as "CI"; the latter category was further sub-divided into "mild CI" (scores 8-10) and "moderate/severe CI" (scores 0-7).
The 35-point cognitive scale was not administered to respondents represented by a proxy (about 10% of the HRS sample), but each proxy was asked: "How would you rate [the respondent's] memory at the present time?" and "How would you rate [the respondent] in making judgments and decisions?" In the studies by Langa et al (2001; 2008), if a respondent's memory was assessed as "excellent," "very good," or "good" they were considered to have "normal" cognitive function, while those with "fair" or "poor" memory were considered to have cognitive impairment. They used proxy assessments of judgment to further classify those with cognitive impairment into mild cognitive impairment (judgment assessed as "excellent," "very good," or "good") and moderate/severe cognitive impairment (judgment assessment as "fair" or "poor"). These definitions and cut-points for cognitive impairment are based on prior studies by Langa et al. (2001; 2008) using the HRS data.
For definition 1, we applied the approach and cut-points used by Langa and colleagues, as described above, which have been validated for HRS respondents aged 70 and over as included in the ADAMS, a subsample of the HRS (Langa et al. 2008). However, we could not further divide the respondents with proxy assessments by levels of cognitive impairment because the judgment item was not asked consistently across waves. We also felt that there is much uncertainty in differentiating mild cognitive impairment from moderate/severe cognitive impairment in the absence of a clinical assessment. Therefore, we used a dichotomy to indicate whether or not a respondent had cognitive impairment. Appendix Table A2-1 shows the prevalence of cognitive impairment across waves, according to definition 1.
| CI Status | 2000 | 2002 | 2004 | 2006 | 2008 |
| N | 7,723 | 8,197 | 8,265 | 7,983 | 6,996 |
| SOURCE: RTI analysis of HRS data, 2000-2008. NOTE: CI = Cognitive impairment; HRS = Health and Retirement Study. | |||||
| No CI | 6,934 (89.8) | 7,413 (90.4) | 7,516 (90.9) | 7,304 (91.5) | 6,415 (91.7) |
| CI | 789(10.2) | 784(9.6) | 749(9.1) | 679(8.5) | 581(8.3) |
A2.4. Definition 2: By Langa, Kabeto, & Weir (2009)
A different HRS-based definition was developed and validated by Langa, Kabeto, & Weir (2009) with data from the ADAMS, a subsample of HRS respondents aged 70 and older who received a neuropsychological assessment for dementia and cognitive impairment. This definition has also been applied in recent studies by Clark et al. (2012) and Crimmins et al. (2011). Cognitive status for self-respondents was based on a modified TICS, a 27-point index. This is in contrast to the 35-point index used in definition 1. This measure is based on items for short-term memory, working memory, and speed of processing. The modified TICS measure was validated with diagnostic data from ADAMS. Scores on the index of 12 or above are considered normal cognitive function; scores between 7 and 11 are considered cognitive impairment, no dementia (CIND); and scores less than 6 are considered dementia.
This definition also classifies respondents with proxy assessments based on the memory item, five IADLs, and an interviewer assessment. The cognitive impairment assessments based on proxy information is scored from 0-2 where a value of 0 indicates no cognitive impairment; 1 indicates may have cognitive impairment; and 2 indicates cognitive impairment. This score is added to the number of the five IADLs with proxy-reported limitations for a total range of 0-11. Final proxy scores are coded as 0-2 for no cognitive impairment; 3-5 as CIND; and 6-11 as dementia.
We applied this definition and report the prevalence of cognitive impairment, CIND, and dementia in Appendix Table A2-2. Based on this measure, over 30% of the elderly population is categorized as having cognitive impairment.
| CI Status | 2000 | 2002 | 2004 | 2006 | 2008 |
| N | 7,741 | 8,215 | 8,281 | 8,017 | 6,995 |
| SOURCE: RTI analysis of HRS data, 2000-2008. NOTE: CI = Cognitive impairment; HRS = Health and Retirement Study. | |||||
| No CI | 5,044 (65.2) | 5,596 (68.2) | 5,612 (67.8) | 5,466 (68.2) | 4,853 (69.4) |
| CI, no dementia | 1,704(22.0) | 1,701(20.7) | 1,768(21.4) | 1,645(20.5) | 1,401(20.0) |
| CI, dementia | 993(12.8) | 918(11.2) | 901(10.9) | 906(11.3) | 741(10.6) |
Appendix Table A2-3 shows a cross-tabulation between definitions 1 and 2 which allows us to assess the overlap between the two definitions. Although definition 1 is a binary measure and definition 2 has three categories, both definitions have perfect overlap in categorizing respondents based on cognitive status. For example, among respondents in the 2008 HRS wave, 69% were consistently identified as having no cognitive impairment according to both definitions. Unlike definition 1, definition 2 further stratified respondents with cognitive impairment as having CIND or dementia. On the other hand, most (92%) of the cognitive impairment cases identified by definition 1 would be categorized as dementia according to definition 2.
| Definition 1 | Definition 2No CIn(Row %) (Column %) | Definition 2CINDn(Row %) (Column %) | Definition 2Dementian(Row %) (Column %) | Definition 2Totaln(Row %) (Column %) |
| Total | 4,851(69.4%)(100.0%) | 1,401(20.0%)(100.0%) | 741(10.6%)(100.0%) | 6,993(100.0%)(100.0%) |
| SOURCE: RTI analysis of HRS data, 2000-2008. NOTE: CI = Cognitive impairment; CIND = Cognitive impairment, no dementia; HRS = Health and Retirement Study. | ||||
| No CI | 4,851(75.6%)(100.0%) | 1,354(21.1%)(96.7%) | 210(3.3%)(28.3%) | 6,415(100.0%)(91.7%) |
| CI | 0(0.0%)(0.0%) | 47(8.1%)(3.4%) | 531(91.9%)(71.7%) | 578(100.0%)(8.3%) |
A2.5. Definition 3: Chronic Conditions Data Warehouse Indicator Based on Medicare Claims
Next, we rely on the merged Medicare claims data to identify ADRD in HRS respondents aged 65 and over. The claims data include a CCW variable indicating, on the basis of diagnostic codes captured in administrative data, whether beneficiaries ever had ADRD or Senile Dementia. It should be noted that Medicare claims data may be inadequate for identifying ADRD cases due to inaccuracy (Taylor et al. 2002; Taylor et al. 2009) and underdiagnosis (Lin et al. 2010).
The CCW indicator is a dichotomous measure and is based on diagnoses over the past 3 years. Appendix Table A2-4 reports the prevalence using the CCW definition in our sample across waves. The prevalence of ADRD based on this measure suggests an increasing trend over time, from 8.2% in 2000 to 11.2% in 2008, which may reflect the increasing willingness of physicians to use the Alzheimer's disease diagnosis.
| CCW ADRD Indicator | 2000 | 2002 | 2004 | 2006 | 2008 |
| Total N | 7,748 | 8,216 | 8,287 | 8,019 | 6,998 |
| SOURCE: RTI analysis of HRS and Medicare claims data, 2000-2008. NOTE: ADRD = Alzheimer's disease and related dementia; CCW = Chronic Conditions Data Warehouse; HRS = Health and Retirement Study. | |||||
| ADRD or Senile Dementia (n) | 638 | 718 | 799 | 804 | 784 |
| ADRD or Senile Dementia (%) | (8.2%) | (8.7%) | (9.6%) | (10.0%) | (11.2%) |
Next, we assessed the overlap of all three definitions using the 2008 wave. Cross-tabulations of the CCW indicator with definition 1 and definition 2 are presented in Appendix Table A2-5 and Appendix Table A2-6, respectively. The CCW indicator had a greater overlap with definition 1 in identifying no cognitive impairment. Among respondents with no ADRD according to the CCW indicator, 96.6% were identified as having no cognitive impairment according to definition 1. However, among those with ADRD, 52.6% were identified as having no cognitive impairment and 47.5% were identified as having cognitive impairment based on definition 1. According to definition 2, 75.5% of respondents with no ADRD based on the CCW indicator had no cognitive impairment according to definition 2. Among those with ADRD, 21.1% were coded as no cognitive impairment, 26.1% were identified as CIND, and 52.8% were identified as having dementia according to definition 2.
| Definition 1 | No ADRD (CCW) n(Row %)(Column %) | ADRD (CCW) n(Row %)(Column %) | Totaln(Row %) (Column %) |
| Total | 6,212(88.8%)(100.0%) | 784(11.2%)(100.0%) | 6,996(100.0%)(100.0%) |
| SOURCE: RTI analysis of HRS and Medicare claims data, 2008. NOTE: ADRD = Alzheimer's disease and related dementia; CCW = Chronic condition data warehouse; CI = Cognitive impairment; HRS = Health and Retirement Study. | |||
| No CI | 6,003(93.6%)(96.6%) | 412(6.4%)(52.6%) | 6,415(100.0%)(91.2%) |
| CI | 209(36.0%)(3.4%) | 372(64.0%)(47.5%) | 581(100.0%)(8.3%) |
| Definition 2 | No ADRD (CCW) n(Row %)(Column %) | ADRD (CCW) n(Row %)(Column %) | Totaln(Row %) (Column %) |
| Total | 6,213(88.8%)(100.0%) | 782(11.2%)(100.0%) | 6,995(100.0%)(100.0%) |
| SOURCE: RTI analysis of HRS and Medicare claims data, 2008. NOTE: ADRD = Alzheimer's disease and related dementia; CCW = Chronic condition data warehouse; CI = Cognitive impairment; CIND = Cognitive impairment, no dementia; HRS = Health and Retirement Study. | |||
| No CI | 4,668(96.6%)(75.5%) | 165(3.4%)(21.1%) | 4,853(100.0%)(69.4%) |
| CIND | 1,197(85.4%)(19.3%) | 204(14.6%)(26.1%) | 1,401(100.0%)(20.0%) |
| CI, dementia | 328(44.3%)(5.3%) | 413(55.7%)(52.8%) | 741(100.0%)(10.6%) |
A2.6. Definition 4: RTI's Proposed Hybrid Definition
Lastly, we present our study's proposed definition which is a hybrid of definition 1, definition 2, and the CCW ADRD indicator. We developed this measure to incorporate the strengths of the validated HRS-based measures of cognitive impairment, as well as the advantage of a diagnostic and claims-based approach available with the CCW indicator. This measure was dichotomous, with cognitive impairment initially defined as meeting either of the following criteria (which were subsequently revised with TAG input, as described later in this appendix):
- Cognitive impairment as defined in definition 1 (scores of 0-10 for self-respondents and memory ratings as fair or poor for proxy respondents); or
- Dementia as coded in definition 2; or
- CCW indication of ADRD.
The prevalence of cognitive impairment, based on this broadly defined measure, is reported in Appendix Table A2-7 below across waves. In 2008, 16.4% of HRS respondents had cognitive impairment. This estimate is higher than definition 1 and the CCW definition, but lower than definition 2.
| CI Status | 2000 | 2002 | 2004 | 2006 | 2008 |
| Total N | 7,748 | 8,216 | 8,287 | 8,019 | 6,998 |
| SOURCE: RTI analysis of HRS and Medicare claims data, 2000-2008. NOTE: CI = Cognitive impairment; HRS = Health and Retirement Study. | |||||
| No CI | 6,425 (82.9%) | 6,910 (84.1%) | 6,939 (83.7%) | 6,722 (83.8%) | 5,856 (83.7%) |
| CI | 1,323(17.1%) | 1,306(15.9%) | 1,348(16.3%) | 1,297(16.2%) | 1,142(16.3%) |
Appendix Table A2-8 reports the distribution of the cognitive impairment cases as identified across the three definitions and combinations of them. Thirty-one percent of all respondents with cognitive impairment under this new definition were consistently coded as having cognitive impairment across all three definitions, and 31% were coded as cognitive impairment on the CCW indicator but not indicated so by definition 1 or definition 2. We should also point out that nearly half of all cognitive impairment cases were identified only in one definition.
| Category | Frequency | Percent | Cumulative Percent |
| Total | 1,142 | 100.0 | --- |
| SOURCE: RTI analysis of HRS and Medicare claims data, 2008. NOTE: ADRD = Alzheimer's disease and related dementia; CCW = Chronic condition data warehouse; CI = Cognitive impairment; HRS = Health and Retirement Study. | |||
| CCW ADRD indicator only | 354 | 31.0 | 31.0 |
| Definition 2 only | 152 | 13.3 | 44.3 |
| CCW ADRD indicator & Definition 2 | 58 | 5.1 | 49.4 |
| Definition 1 only | 32 | 2.8 | 52.2 |
| Definition 1 & CCW ADRD Indicator | 15 | 1.3 | 53.5 |
| Definition 1 & Definition 2 | 176 | 15.4 | 68.9 |
| CCW ADRD Indicator & Definition 1 & Definition 2 | 355 | 31.1 | 100.0 |
A2.7. Final Cognitive Impairment Definition Based on Technical Advisory Group Input (Modified Definition 4)
RTI presented definitions 1 through 4 above to a TAG convened to provide input on this and other analytic issues. The recommendation from this meeting was to modify the hybrid definition 4 to include respondents categorized as cognitive impairment, with dementia per definition 2 or respondents with an ADRD diagnosis per the CCW indicator. As such, this definition focused on identifying cases with severe cognitive impairment that is consistent with dementia. The prevalence of cognitive impairment over the study period, according to this hybrid definition, remained relatively stable in the total HRS sample of Medicare beneficiaries and among those living in the community; however there was a downward trend among nursing home residents, from 65% in 2000 to 58% in 2008, as shown in Appendix Figure A2-1. Because the sampling weights of nursing home residents were much smaller relative to that of community residents, the decline in cognitive impairment among nursing home residents did not have a noticeable impact on the overall prevalence of cognitive impairment in the total sample.
| FIGURE A2-1. Trend in the Prevalence of CI, according to the Hybrid Definition of CI, 2000-2008 |
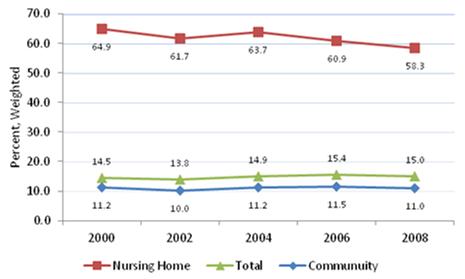 |
| SOURCE: RTI analysis of HRS data linked with Medicare claims, 2000-2008. NOTE: HRS = Health and Retirement Study; CI = Cognitive impairment. |
Given that there is no gold standard and relying on any single source would probably underestimate the prevalence of dementia, this refined hybrid definition is preferable over other alternatives, as it incorporates the strengths of the validated HRS-based cognitive measure and the advantage of a diagnosis-based indicator of ADRD. This cognitive impairment measure is the final measure used in all analyses presented in this report.
A2.8. References
Clark, D.O., T.E. Stump, W. Tu, D.K. Miller, K.M. Langa, F.W. Unverzagt, and C.M. Callahan. 2012. "Hospital and Nursing Home Use From 2002 to 2008 Among US Older Adults With Cognitive Impairment, Not Dementia in 2002." Alzheimer Dis Assoc Disord.
Crimmins, E.M., J.K. Kim, K.M. Langa, and D.R. Weir. 2011. "Assessment of cognition using surveys and neuropsychological assessment: The Health and Retirement Study and the Aging, Demographics, and Memory Study." J Gerontol B Psychol Sci Soc Sci 66 Suppl 1: i162-71.
Langa, K.M., M.E. Chernew, M.U. Kabeto, A.R. Herzog, M.B. Ofstedal, R.J. Willis, R.B. Wallace, L.M. Mucha, W.L. Straus, and A.M. Fendrick. 2001. "National estimates of the quantity and cost of informal caregiving for the elderly with dementia."J Gen Intern Med 16(11): 770-8.
Langa, K.M., M. Kabeto, and D. Weir. 2009. "Report on race and cognitive impairment using HRS." 2010 Alzheimer's Disease Facts and Figures. Available at: http://www.alz.org/documents_custom/report_alzfactsfigures2010.pdf.
Langa, K.M., E.B. Larson, J.H. Karlawish, D.M. Cutler, M.U. Kabeto, S.Y. Kim, and A.B. Rosen. 2008. "Trends in the prevalence and mortality of cognitive impairment in the United States: Is there evidence of a compression of cognitive morbidity?" Alzheimers Dement 4(2): 134-44.
Lin, P.J., D.I. Kaufer, M.L. Maciejewski, R. Ganguly, J.E. Paul, and A.K. Biddle. 2010. "An examination of Alzheimer's disease case definitions using Medicare claims and survey data." Alzheimers Dement 6(4): 334-41.
Taylor, D.H. Jr., G.G. Fillenbaum, and M.E. Ezell. 2002. "The accuracy of medicare claims data in identifying Alzheimer's disease." J Clin Epidemiol 55(9): 929-37.
Taylor, D.H. Jr., T. Ostbye, K.M. Langa, D. Weir, and B.L. Plassman. 2009. "The accuracy of Medicare claims as an epidemiological tool: the case of dementia revisited." J Alzheimers Dis 17(4): 807-15.
APPENDIX A3. CONDITIONS DEFINED AS POTENTIALLY AVOIDABLE HOSPITALIZATIONS ACCORDING TO SETTING
| Diagnostic Condition | Preventable/Manageable in Community Settinga | Preventable/Manageable in Nursing Facilitya | Rationale of the Technical Expert Panel |
| SOURCE: Walsh, E.G., J.M. Wiener, S. Haber, A. Bragg, M. Freiman, and J.G. Ouslander. 2012. "Potentially avoidable hospitalizations of dually eligible Medicare and Medicaid beneficiaries from nursing facility and home- and community-based services waiver programs." Journal of the American Geriatrics Society 60(5): 821-829. NOTES: CHF = Congestive heart failure; COPD = Chronic obstructive pulmonary disease; N = No; NF = Nursing facility; TEP = Technical Expert Panel; UTI = Urinary tract infection; Y = Yes; ? = TEP was uncertain about rating.
| |||
| Anemiab | N/Y | N/Y | Anemia should be identified, followed, and managed proactively. Bone marrow failure may require periodic transfusions, which generally do not require inpatient admission, except in some clinically complex patients. The frequent need for transfusions is a poor prognostic sign, and these patients should be considered for palliative care or hospice as an alternative to hospitalization. |
| CHF | Y/Y | Y/Y | Many episodes of exacerbations of CHF (not new onset or with hemodynamic instability) can be managed in a NF, and many can be prevented if patients at risk are monitored carefully. There are cases of frequent CHF exacerbation despite good management--this is a very poor prognostic sign, and these patients should be considered for palliative care or hospice as an alternative to hospitalization. |
| Hyper- and hypotension: separate conditions | Y/Y | Y/Y | Hypertension is often over-treated in long-term care patients. Hypertensive episodes are often related to agitation or discomfort, not a primary cardiovascular condition. Iatrogenic hypotension and postural hypotension are common due to polypharmacy with medications that can affect blood pressure and/or volume depletion related to diuretic use or poor fluid intake, and could be prevented. |
| Hyper- and hypoglycemia: diabetes mellitus with ketoacidosis or hyperosmolar coma | Y/Y | Y/Y | Diabetes is often over-treated in long-term care patients. Patients should be monitored at appropriate frequencies, and hypoglycemic medications adjusted to keep blood sugar in a broad range in most patients. Over-aggressive treatment can result in frequent and unnecessary episodes of hypoglycemia. |
| Dehydration acute renal failure hypokalemia hyponatremia | Y/Y | Y/Y | Acute renal failure is often the code used for patients who are dehydrated. Patients at risk should be monitored and treated for these conditions before they are severe enough to require acute care transfer. |
| Constipation or fecal impaction obstipation | Y/Y | Y/Y | Bowel habits should be routinely monitored and appropriate dietary, non-pharmacologic, and pharmacologic interventions implemented. Patients should not become so severely constipated they require acute care transfer. |
| Diarrheab | N/? | N/Y | Acute, severe diarrhea due to gastroenteritis or food poisoning may require hospitalization, but can often be managed in the NF. (See below under C. difficile). |
| Clostridium difficileb | ?/? | ?/? | The most common cause of diarrhea in this population is now C. difficile, which commonly results from the inappropriate and unnecessary use of antibiotics, and may be preventable in some cases. |
| Gastroenteritis with nausea and vomitingb | N/? | N/Y | Acute, severe gastroenteritis or food poisoning may require hospitalization for hydration, but can often be managed in the NF setting. |
| Cellulitisb | ?/Y | ?/Y | Most cases of cellulitis can be managed in a NF, and can often be managed in the community. |
| Skin ulcers including pressure ulcers | Y/Y | Y/Y | Pressure ulcers can often be prevented, and existing ulcers should be treated and monitored so that they do not become severe enough to require hospitalization. |
| Lower respiratory: Pneumonia Bronchitisb | ?/Y | ?/Y | Early identification and treatment have been shown to prevent many hospitalizations. Patients who meet specific severity of illness criteria may require hospitalization. |
| UTI | ?/Y | Y/Y | UTI is probably the most over-diagnosed and inappropriately treated acute condition in the long-term care population. Most cases of true UTI can be managed without hospitalization. |
| Falls and Traumab | ?/? | Y/? | Most of these conditions relate to injurious falls. Many but not all falls can be prevented. Patients who meet specific criteria may require evaluation in an emergency room, and some require admission. In the home setting, some individuals may elect to risk falls and injury given a lack of 24-hour supervision rather than accept NF placement. |
| Altered mental status/acute confusion/deliriumb | ?/? | Y/? | Initial assessment can be done in a NF unless there are unstable vital signs. Depending on the underlying condition, delirium often can be managed without hospitalization in the NF. However, in the home setting hospitalization may be required. |
| Psychosis, severe agitation, organic brain syndromeb | N/N | N/Y | Patients with dementia and psychotic disorders should be managed with non-pharmacologic and pharmacologic treatment and followed carefully. Geropsychiatrists, psychologists, and trained mental health nurses can help with follow-up. Appropriate medical evaluation should be done for acute changes. Hospitalization is only necessary if the patient is a danger to herself or others. |
| COPD, asthma, chronic bronchitis | Y/Y | Y/Y | These diagnoses are often used interchangeably in long-term care patients. Many episodes of exacerbations of COPD (not with severe bronchospasm, hypoxia, or hemodynamic instability) can be managed in the facility, and many can be prevented if patients at risk are monitored carefully. Frequent COPD exacerbation despite good management is a very poor prognostic sign, and these patients should be considered for palliative care or hospice as an alternative to hospitalization. |
| Weight loss, nutritional deficiencies, adult failure to thrive | Y/? | Y/? | Weight should be monitored regularly and significant weight loss evaluated and managed before it becomes severe enough to require hospitalization. |
| Seizures | Y/Y | Y/Y | Close follow-up and careful management of anticonvulsant medications can often prevent recurrent seizures. Not all patients who have had a seizure need to be transferred if they have a known cause of seizures. |
APPENDIX A4. DESCRIPTION OF ANALYTIC SAMPLES: MEDICARE BENEFICIARIES IN THE HRS, 2000-2008
| Characteristic | Total | Community Percentage/Mean (SD) | Nursing Home Percentage/Mean (SD) | Significance |
| N (Person-observations, unweighted) | 39,231 | 36,357 | 2,874 | --- |
| SOURCE: RTI analysis of HRS data, 2000-2008. NOTE: Reported in table are weighted percentages or means. ADL = Activity of daily living; HRS = Health and Retirement Study; SD = Standard deviation.Statistical significance: * p 0.05; ** p 0.01; *** p 0.001. | ||||
| Cognitive impairment | 14.7 | 11.0 | 61.8 | *** |
| Age: | ||||
| 65-74 (reference) | 49.4 | 52.0 | 16.9 | --- |
| 75-84 | 36.6 | 36.6 | 37.0 | --- |
| 85+ | 14.0 | 11.4 | 46.1 | --- |
| Female | 58.7 | 57.7 | 71.2 | *** |
| Race/ethnicity: | ||||
| White (reference) | 86.6 | 86.5 | 88.3 | --- |
| Black | 7.4 | 7.4 | 7.5 | --- |
| Hispanic | 4.2 | 4.3 | 2.9 | --- |
| Other | 1.8 | 1.8 | 1.3 | --- |
| Low education (12 years) | 28.1 | 27.4 | 37.2 | *** |
| Unmarried | 47.0 | 44.8 | 74.8 | *** |
| Insurance coverage: | ||||
| Medicare only (reference) | 73.2 | 74.6 | 55.1 | --- |
| Medicare-Medicaid dual eligible | 13.4 | 11.5 | 37.4 | --- |
| Other/supplemental insurance | 13.5 | 14.0 | 7.5 | --- |
| Number of ADL limitations (range 0-5) | 0.5(1.1) | 0.3(0.9) | 2.4(1.9) | *** |
| Number of conditions (range 0-8) | 2.3(1.4) | 2.3(1.4) | 3.2(1.5) | *** |
| Diabetes | 18.8 | 18.4 | 24.1 | *** |
| Cancer | 17.8 | 17.7 | 19.2 | --- |
| Lung disease | 11.4 | 11.1 | 15.7 | *** |
| Heart problems | 32.4 | 31.1 | 48.2 | *** |
| Stroke | 12.2 | 10.5 | 34.0 | *** |
| Psychiatric problems | 14.4 | 13.0 | 31.9 | *** |
| Arthritis or rheumatism | 66.2 | 65.3 | 78.4 | *** |
| Poor self-rated health | 32.5 | 30.2 | 60.9 | *** |
| Income: | ||||
| Quartile 1 (reference) | 24.4 | 22.7 | 45.3 | --- |
| Quartile 2 | 25.4 | 25.2 | 27.9 | --- |
| Quartile 3 | 24.9 | 25.6 | 16.5 | --- |
| Quartile 4 | 25.3 | 26.6 | 10.4 | --- |
| Urban | 63.4 | 63.3 | 64.7 | --- |
| Survey year: | ||||
| 2000 (reference) | 19.9 | 20.2 | 16.5 | --- |
| 2002 | 20.9 | 20.9 | 20.8 | --- |
| 2004 | 20.9 | 21.0 | 20.1 | --- |
| 2006 | 20.1 | 20.0 | 21.6 | --- |
| 2008 | 18.2 | 18.0 | 21.0 | --- |
| Region: | ||||
| New England | 5.6 | 5.4 | 8.0 | --- |
| Middle Atlantic | 12.0 | 12.0 | 12.1 | --- |
| East North Central | 19.0 | 18.9 | 21.2 | --- |
| West North Central | 10.3 | 10.2 | 11.2 | --- |
| South Atlantic | 20.8 | 21.0 | 17.8 | --- |
| East South Central | 6.0 | 6.1 | 4.9 | --- |
| West South Central | 11.2 | 11.4 | 9.3 | --- |
| Mountain | 4.8 | 4.7 | 5.1 | --- |
| Pacific (reference) | 10.3 | 10.3 | 10.2 | --- |
APPENDIX A5. DESCRIPTION OF ANALYTIC SAMPLES: HRS DECEDENTS, 2000-2008
| Characteristic | Total | Community Percentage/Mean (SD) | Nursing Home Percentage/Mean (SD) | Significance |
| N (Decedents, unweighted) | 3,298 | 2,408 | 890 | --- |
| SOURCE: RTI analysis of HRS data, 2000-2008. NOTE: Reported in table are weighted percentages or means. ADL = Activity of daily living; HRS = Health and Retirement Study; SD = Standard deviation.Statistical significance: * p 0.05; ** p 0.01; *** p 0.001. | ||||
| Cognitive impairment | 43.8 | 31.9 | 76.1 | *** |
| Age: | ||||
| 65-74 (reference) | 22.3 | 26.9 | 9.7 | --- |
| 75-84 | 41.3 | 44.3 | 32.9 | --- |
| 85+ | 36.5 | 28.8 | 57.3 | --- |
| Female | 54.8 | 50.4 | 66.9 | --- |
| Race/ethnicity: | ||||
| White(reference) | 86.1 | 85.8 | 87.1 | --- |
| Black | 8.3 | 8.1 | 8.4 | --- |
| Hispanic | 4.1 | 4.6 | 2.7 | --- |
| Other | 1.6 | 1.5 | 1.9 | --- |
| Low education (12 years) | 39.6 | 37.5 | 45.3 | *** |
| Unmarried | 60.3 | 54.8 | 75.2 | *** |
| Insurance coverage: | ||||
| Medicare only (reference) | 67.9 | 74.3 | 50.5 | --- |
| Medicare-Medicaid dual eligible | 23.9 | 16.7 | 43.6 | --- |
| Other/supplemental insurance | 8.2 | 9.1 | 6.0 | --- |
| Number of ADL limitations (range 0-5) | 1.57 | 0.98 | 3.17 | *** |
| Number of conditions (range 0-8) | 3.10 | 2.99 | 3.42 | *** |
| Diabetes | 25.4 | 25.1 | 26.3 | --- |
| Cancer | 25.9 | 27.9 | 20.5 | *** |
| Lung disease | 22.1 | 23.2 | 19.0 | ** |
| Heart problems | 51.9 | 50.4 | 55.9 | ** |
| Stroke | 25.2 | 20.2 | 38.8 | *** |
| Psychiatric problems | 23.5 | 18.8 | 36.3 | *** |
| Arthritis or rheumatism | 72.3 | 70.5 | 77.2 | *** |
| Poor self-rated health | 61.7 | 58.7 | 70.0 | *** |
| Income: | ||||
| Quartile 1 (reference) | 37.8 | 33.7 | 48.4 | --- |
| Quartile 2 | 28.3 | 28.6 | 27.7 | --- |
| Quartile 3 | 20.2 | 22.5 | 14.4 | --- |
| Quartile 4 | 13.7 | 15.3 | 9.5 | --- |
| Urban | 63.1 | 64.4 | 59.4 | ** |
| Year of death: | ||||
| 2000 (reference) | 4.9 | 5.0 | 4.8 | --- |
| 2001 | 10.2 | 10.5 | 9.5 | --- |
| 2002 | 10.4 | 10.7 | 9.7 | --- |
| 2003 | 12.0 | 11.7 | 12.7 | --- |
| 2004 | 12.2 | 12.5 | 11.6 | --- |
| 2005 | 12.7 | 12.5 | 13.7 | --- |
| 2006 | 12.8 | 12.9 | 12.5 | --- |
| 2007 | 12.0 | 11.4 | 13.8 | --- |
| 2008 | 12.6 | 12.9 | 11.7 | --- |
| Region: | ||||
| New England | 4.8 | 4.6 | 5.3 | --- |
| Middle Atlantic | 12.0 | 11.9 | 12.2 | --- |
| East North Central | 19.8 | 19.3 | 21.3 | --- |
| West North Central | 9.8 | 8.8 | 12.3 | --- |
| South Atlantic | 21.7 | 22.6 | 19.1 | --- |
| East South Central | 5.7 | 6.0 | 5.0 | --- |
| West South Central | 12.0 | 12.7 | 10.1 | --- |
| Mountain | 4.7 | 4.6 | 4.9 | --- |
| Pacific (reference) | 9.4 | 9.3 | 9.4 | --- |
APPENDIX A6. MEDICARE BENEFICIARIES IN THE HRS WITH HOSPITAL AND ED USE, 2008, BY CI AND RESIDENTIAL SETTING
| Service Use | Number (Beneficiaries) | Percent |
| SOURCE: RTI analysis of HRS data linked with Medicare claims, 2008. NOTE: Reported in table weighted numbers and percents. CI = Cognitive impairment; ED = Emergency department; HRS = Health and Retirement Study. | ||
| With any hospitalization: Total | 5,016,192 | 100.0 |
| CI: Community | 811,078 | 16.2 |
| CI: Nursing Home | 600,109 | 12.0 |
| Non-CI: Community | 3,228,368 | 64.4 |
| Non-CI: Nursing Home | 376,637 | 7.5 |
| With any potentially avoidable hospitalization: Total | 1,358,315 | 100.0 |
| CI: Community | 287,859 | 21.2 |
| CI: Nursing Home | 250,560 | 18.5 |
| Non-CI: Community | 663,824 | 48.9 |
| Non-CI: Nursing Home | 156,072 | 11.5 |
| With any ED visit, outpatient only: Total | 4,987,653 | 100.0 |
| CI: Community | 851,329 | 17.1 |
| CI: Nursing Home | 471,335 | 9.5 |
| Non-CI: Community | 3,421,429 | 68.6 |
| Non-CI: Nursing Home | 243,560 | 4.9 |
| With any potentially avoidable ED visit (outpatient only): Total | 954,919 | 100.0 |
| CI: Community | 173,532 | 18.2 |
| CI: Nursing Home | 135,299 | 14.2 |
| Non-CI: Community | 604,958 | 63.4 |
| Non-CI: Nursing Home | 41,130 | 4.3 |
| With any ED visit (regardless of admission): Total | 6,931,670 | 100.0 |
| CI: Community | 1,130,778 | 16.3 |
| CI: Nursing Home | 762,965 | 11.0 |
| Non-CI: Community | 4,624,808 | 66.7 |
| Non-CI: Nursing Home | 413,119 | 6.0 |
APPENDIX A7. MEDICARE DECEDENTS IN THE HRS WITH HOSPITAL AND ED USE IN THE LAST YEAR OF LIFE, 2008, BY CI AND RESIDENTIAL SETTING
| Service Use | Number (Beneficiaries) | Percent |
| SOURCE: RTI analysis of HRS data linked with Medicare claims, 2008. NOTE: Reported in table weighted numbers and percents. CI = Cognitive impairment; ED = Emergency department; HRS = Health and Retirement Study. | ||
| With any hospitalization: Total | 1,024,044 | 100.0 |
| CI: Community | 279,753 | 27.3 |
| CI: Nursing Home | 168,214 | 16.4 |
| Non-CI: Community | 500,967 | 48.9 |
| Non-CI: Nursing Home | 75,110 | 7.3 |
| With any potentially avoidable hospitalization: Total | 502,794 | 100.0 |
| CI: Community | 140,606 | 28.0 |
| CI: Nursing Home | 94,010 | 18.7 |
| Non-CI: Community | 218,845 | 43.5 |
| Non-CI: Nursing Home | 49,333 | 9.8 |
| With any ED visit, outpatient only: Total | 632,328 | 100.0 |
| CI: Community | 199,654 | 31.6 |
| CI: Nursing Home | 99,873 | 15.8 |
| Non-CI: Community | 294,340 | 46.6 |
| Non-CI: Nursing Home | 38,461 | 6.1 |
| With any potentially avoidable ED visit (outpatient only): Total | 208,043 | 100.0 |
| CI: Community | 52,536 | 25.3 |
| CI: Nursing Home | 40,218 | 19.3 |
| Non-CI: Community | 99,343 | 47.8 |
| Non-CI: Nursing Home | 15,946 | 7.7 |
| With any ED visit (regardless of admission): Total | 1,083,999 | 100.0 |
| CI: Community | 311,272 | 28.7 |
| CI: Nursing Home | 179,792 | 16.6 |
| Non-CI: Community | 520,222 | 48.0 |
| Non-CI: Nursing Home | 72,713 | 6.7 |
APPENDIX A8. EFFECT OF CI ON HOSPITAL AND ED USE BY MEDICARE BENEFICIARIES IN THE COMMUNITY: XTGEE LOGISTIC REGRESSION MODEL RESULTS (ODDS RATIOS)
| Variable | Any Hosp. | Any PotentiallyAvoidable Hosp. | Any ED Visit,Outpatient Only | Any ED Visit,Leading to Hosp. | Any ED Visit,Either Type | Any PotentiallyAvoidable ED Visit,Outpatient Only |
| N (person-observations) | 35,924 | 35,924 | 35,924 | 35,924 | 35,924 | 35,924 |
| SOURCE: RTI analysis of HRS data linked with Medicare claims, 2000-2008. NOTE: Reference group for categorical variables: no CI; age 65-74; male; non-Hispanic, White; 12 or more years of education; married; Medicare coverage only; good/excellent self-rated health; income in bottom quartile; rural residence; Pacific region; and year 2000. ADL = Activity of daily living; ED = Emergency department; Hosp = Hospitalization; HRS = Health and Retirement Study; XTGEE = Cross-sectional time series generalized estimating equation.Statistical significance: * p 0.05; ** p 0.01; *** p 0.001. | ||||||
| Cognitive impairment | 1.680*** | 1.844*** | 1.515*** | 1.923*** | 1.656*** | 1.557*** |
| Age 75-84 | 1.296*** | 1.559*** | 1.146*** | 1.414*** | 1.262*** | 1.275** |
| Age 85+ | 1.465*** | 2.181*** | 1.368*** | 1.763*** | 1.627*** | 1.671*** |
| Female | 0.902** | 0.943 | 1.066 | 0.948 | 1.022 | 1.158 |
| Black | 0.871* | 1.272* | 1.259*** | 0.980 | 1.146* | 1.541*** |
| Hispanic | 0.822* | 1.259 | 0.939 | 0.885 | 0.914 | 1.091 |
| Other | 0.809 | 1.174 | 0.871 | 0.826 | 0.818 | 1.254 |
| Low education ( 12 years) | 0.936 | 0.954 | 0.985 | 0.907 | 0.938 | 0.991 |
| Unmarried | 1.063 | 1.165* | 1.004 | 1.115* | 1.051 | 1.054 |
| Dual eligible | 1.114 | 1.041 | 1.451*** | 1.175* | 1.396*** | 1.306* |
| Supplemental insurance | 0.928 | 0.811 | 0.997 | 0.872 | 0.964 | 0.890 |
| Number of ADL limitations | 1.108*** | 1.137*** | 1.057** | 1.121*** | 1.108*** | 1.115*** |
| Number of conditions | 1.174*** | 1.118 | 0.992 | 1.187*** | 1.048 | 1.075 |
| Diabetes | 1.026 | 1.144 | 1.098 | 1.059 | 1.097 | 1.126 |
| Cancer | 1.128* | 1.116 | 1.121* | 1.014 | 1.096 | 0.900 |
| Lung disease | 1.257*** | 2.455*** | 1.295*** | 1.352*** | 1.405*** | 1.964*** |
| Heart problems | 1.492*** | 1.838*** | 1.482*** | 1.451*** | 1.515*** | 1.311* |
| Stroke | 1.120 | 1.223 | 1.304*** | 1.195* | 1.304*** | 1.125 |
| Psychiatric problems | 0.859* | 0.872 | 1.317*** | 0.844* | 1.198** | 1.067 |
| Arthritis or rheumatism | 1.016 | 0.782* | 1.228*** | 0.926 | 1.130* | 0.957 |
| Poor self-rated health | 1.599*** | 1.861*** | 1.338*** | 1.633*** | 1.444*** | 1.427*** |
| Income: Quartile 2 | 0.979 | 1.027 | 0.939 | 0.998 | 0.947 | 0.941 |
| Income: Quartile 3 | 0.998 | 1.018 | 0.921 | 0.964 | 0.910 | 0.989 |
| Income: Quartile 4 | 0.913 | 0.717** | 0.802*** | 0.828* | 0.792*** | 0.816 |
| Urban | 1.046 | 0.955 | 0.810*** | 1.208*** | 0.936 | 0.696*** |
| New England | 0.932 | 1.251 | 1.088 | 1.071 | 1.108 | 0.717 |
| Middle Atlantic | 1.062 | 1.163 | 1.055 | 1.257* | 1.160* | 0.965 |
| East North Central | 1.166* | 1.602** | 1.080 | 1.232* | 1.182* | 0.967 |
| West North Central | 1.162 | 1.338 | 1.134 | 1.108 | 1.160 | 1.104 |
| South Atlantic | 1.104 | 1.425** | 1.088 | 1.280** | 1.182** | 0.959 |
| East South Central | 0.979 | 1.430* | 1.088 | 1.106 | 1.116 | 1.100 |
| West South Central | 1.203* | 1.399* | 0.962 | 1.065 | 0.992 | 0.798 |
| Mountain | 1.067 | 1.443 | 1.121 | 1.179 | 1.169 | 1.096 |
| Year = 2002 | 0.990 | 0.998 | 1.019 | 1.039 | 1.011 | 1.075 |
| Year = 2004 | 1.022 | 0.947 | 1.034 | 1.093 | 1.027 | 1.122 |
| Year = 2006 | 0.873** | 0.871 | 1.172*** | 0.911 | 1.066 | 1.314** |
| Year = 2008 | 0.939 | 0.841 | 1.162** | 0.990 | 1.081 | 1.247* |
APPENDIX A9. EFFECT OF CI ON HOSPITAL AND ED USE BY MEDICARE BENEFICIARIES IN NURSING HOMES: XTGEE LOGISTIC REGRESSION MODEL RESULTS (ODDS RATIOS)
| Variable | Any Hosp. | Any PotentiallyAvoidable Hosp. | Any ED Visit,Outpatient Only | Any ED Visit,Leading to Hosp. | Any ED Visit,Either Type | Any PotentiallyAvoidable ED Visit,Outpatient Only |
| N (Person-observations) | 2,783 | 2,783 | 2,783 | 2,783 | 2,783 | 2,783 |
| SOURCE: RTI analysis of HRS data linked with Medicare claims, 2000-2008. NOTE: Reference group for categorical variables: no CI; age 65-74; male; non-Hispanic, White; 12 or more years of education; married; Medicare coverage only; good/excellent self-rated health; income in bottom quartile; rural residence; Pacific region; and year 2000. ADL = Activity of daily living; ED = Emergency department; Hosp = Hospitalization; HRS = Health and Retirement Study; XTGEE = Cross-sectional time series generalized estimating equation.Statistical significance: * p 0.05; ** p 0.01; *** p 0.001. | ||||||
| Cognitive impairment | 1.040 | 1.161 | 1.278* | 1.066 | 1.138 | 1.159 |
| Age 75-84 | 1.056 | 1.223 | 0.867 | 1.061 | 1.021 | 0.866 |
| Age 85+ | 0.941 | 1.375 | 0.993 | 1.204 | 1.335* | 0.914 |
| Female | 0.901 | 0.724* | 0.867 | 0.841 | 0.841 | 0.840 |
| Black | 0.890 | 1.196 | 1.086 | 0.779 | 0.883 | 1.795* |
| Hispanic | 0.907 | 0.761 | 1.227 | 1.054 | 1.186 | 0.923 |
| Other | 0.647 | 0.787 | 0.888 | 0.567 | 0.576 | 0.916 |
| Low education ( 12 years) | 1.152 | 0.914 | 1.133 | 1.107 | 1.160 | 2.057*** |
| Unmarried | 0.829 | 0.960 | 1.061 | 0.824 | 0.882 | 0.760 |
| Dual eligible | 0.752* | 0.899 | 0.795 | 0.792 | 0.835 | 0.992 |
| Supplemental insurance | 0.704 | 0.614 | 1.029 | 0.654* | 0.774 | 1.261 |
| Number of ADL limitations | 1.055 | 1.105** | 1.037 | 1.083** | 1.029 | 1.037 |
| Number of conditions | 1.291* | 1.254 | 1.063 | 1.232 | 1.191 | 1.147 |
| Diabetes | 1.052 | 1.065 | 0.987 | 1.156 | 1.015 | 0.617 |
| Cancer | 0.717* | 0.715 | 1.080 | 0.844 | 0.903 | 1.040 |
| Lung disease | 1.032 | 1.468* | 1.187 | 1.119 | 1.079 | 1.479 |
| Heart problems | 1.258 | 1.462 | 1.192 | 1.226 | 1.187 | 1.056 |
| Stroke | 0.667** | 0.760 | 0.944 | 0.717* | 0.822 | 1.025 |
| Psychiatric problems | 0.804 | 0.692* | 1.114 | 0.878 | 1.000 | 0.955 |
| Arthritis or rheumatism | 0.928 | 0.795 | 0.970 | 0.909 | 0.872 | 0.626 |
| Poor self-rated health | 1.471*** | 1.319* | 1.124 | 1.538*** | 1.488*** | 1.176 |
| Income: Quartile 2 | 1.083 | 0.845 | 1.055 | 1.081 | 1.169 | 1.157 |
| Income: Quartile 3 | 0.826 | 0.547** | 0.962 | 0.707* | 0.866 | 1.073 |
| Income: Quartile 4 | 1.043 | 0.875 | 0.789 | 0.837 | 0.941 | 0.862 |
| Urban | 1.062 | 0.915 | 0.648*** | 1.209 | 0.841 | 0.525** |
| New England | 1.516 | 1.422 | 0.916 | 1.667* | 1.351 | 1.139 |
| Middle Atlantic | 1.492* | 1.300 | 0.707 | 1.333 | 1.047 | 0.758 |
| East North Central | 1.639** | 1.173 | 1.077 | 1.694** | 1.532* | 0.877 |
| West North Central | 1.051 | 0.597 | 0.674 | 0.793 | 0.744 | 0.585 |
| South Atlantic | 1.509* | 1.385 | 1.064 | 1.693** | 1.502* | 0.612 |
| East South Central | 1.271 | 0.945 | 0.993 | 1.028 | 1.209 | 0.674 |
| West South Central | 1.603* | 1.089 | 0.935 | 1.274 | 1.143 | 0.587 |
| Mountain | 1.296 | 1.112 | 1.174 | 1.192 | 1.166 | 0.908 |
| Year = 2002 | 1.276 | 1.257 | 1.279 | 1.290 | 1.290 | 1.244 |
| Year = 2004 | 1.345* | 1.399* | 1.362* | 1.257 | 1.447** | 1.186 |
| Year = 2006 | 1.111 | 1.187 | 1.354* | 1.118 | 1.195 | 1.262 |
| Year = 2008 | 1.105 | 1.088 | 1.318 | 1.242 | 1.399* | 1.692 |
APPENDIX A10. HOSPITAL AND ED USE AMONG MEDICARE BENEFICIARIES IN THE HRS, 2000-2008, BY CI (UNADJUSTED PERCENTAGES)
| Utilization Outcome, Annually | Community Total | Community CI | Community Non-CI | Nursing Home Total | Nursing Home CI | Nursing Home Non-CI |
| N (Person-observations, unweighted) | 36,357 | 4,232 | 32,125 | 2,858 | 1,834 | 1,024 |
| SOURCE: RTI analysis of HRS data linked with Medicare claims, 2000-2008. NOTE: Reported in table are weighted but unadjusted percentages. CI = Cognitive impairment; ED = Emergency department; HRS = Health and Retirement Study.Statistical significance: * p 0.05; ** p 0.01; *** p 0.001. | ||||||
| Any hospitalization | 18.4 | 33.2 | 16.6*** | 48.6 | 48.7 | 48.4 |
| Any potentially avoidable hospitalization | 4.7 | 12.3 | 3.8*** | 21.1 | 23.1 | 17.9** |
| Any ED visit, outpatient only | 18.3 | 32.1 | 16.7*** | 33.3 | 35.7 | 29.4** |
| Any ED visit, leading to hospitalization | 11.5 | 25.5 | 9.8*** | 38.6 | 40.1 | 36.3* |
| Any ED visit, either type | 25.4 | 44.9 | 23.0*** | 54.4 | 56.4 | 51.1** |
| Any potentially avoidable ED visit, outpatient only | 3.2 | 7.1 | 2.7*** | 6.9 | 7.5 | 6.0 |
APPENDIX A11. ANNUALIZED RATES OF HOSPITAL AND ED VISITS AMONG MEDICARE BENEFICIARIES IN THE HRS, 2000-2008 (UNADJUSTED)
| Utilization Outcome, Annually | Community Total | Community CI | Community Non-CI | Nursing Home Total | Nursing Home CI | Nursing Home Non-CI |
| N (Person-observations, unweighted) | 36,357 | 4,232 | 32,125 | 2,858 | 1,834 | 1,024 |
| SOURCE: RTI analysis of HRS data linked with Medicare claims, 2000-2008. NOTE: Reported in table are weighted but unadjusted percentages. CI = Cognitive impairment; ED = Emergency department; HRS = Health and Retirement Study.Statistical significance: * p 0.05; ** p 0.01; *** p 0.001. | ||||||
| Number of hospitalizations | 297 | 607 | 259*** | 986 | 1,001 | 962 |
| Number of potentially avoidable hospitalizations | 61 | 168 | 48*** | 318 | 357 | 256** |
| Number of ED visits, outpatient only | 274 | 567 | 238*** | 550 | 596 | 475** |
| Number of ED visits, leading to hospitalization | 157 | 382 | 129*** | 651 | 687 | 592* |
| Number of ED visits, either type | 431 | 948 | 367*** | 1,200 | 1,282 | 1,068** |
| Number of potentially avoidable ED visits, outpatient only | 37 | 87 | 31*** | 83 | 90 | 73 |
APPENDIX A12. EFFECT OF CI ON HOSPITAL AND ED USE IN THE LAST YEAR OF LIFE AMONG COMMUNITY DECEDENTS: LOGISTIC REGRESSION MODEL RESULTS (ODDS RATIOS)
| Variable | Any Hosp. | Any Potentially Avoidable Hosp. | Any ED Visit, Outpatient Only | Any ED Visit, Leading to Hosp. | Any ED Visit, Either Type | Any Potentially Avoidable ED Visit, Outpatient Only |
| N (Decedents) | 2,380 | 2,380 | 2,380 | 2,380 | 2,380 | 2,380 |
| SOURCE: RTI analysis of HRS data linked with Medicare claims, 2000-2008. NOTE: Reference group for categorical variables: no CI; age 65-74; male; non-Hispanic, White; 12 or more years of education; married; Medicare coverage only; good/excellent self-rated health; income in bottom quartile; rural residence; Pacific region; and year 2000. ADL = Activity of daily living; ED = Emergency department; Hosp = Hospitalization; HRS = Health and Retirement Study.Statistical significance: * p 0.05; ** p 0.01; *** p 0.001. | ||||||
| Cognitive impairment | 0.964 | 1.044 | 1.318* | 1.166 | 1.090 | 1.103 |
| Age 75-84 | 1.116 | 1.265 | 1.018 | 1.155 | 1.089 | 0.991 |
| Age 85+ | 1.272 | 1.385* | 0.782 | 1.374* | 1.125 | 0.907 |
| Female | 1.348* | 0.943 | 1.154 | 1.349** | 1.400* | 1.047 |
| Black, non-Hispanic | 1.142 | 1.271 | 1.172 | 1.258 | 1.534* | 1.486 |
| Hispanic | 0.976 | 1.301 | 1.011 | 1.257 | 1.245 | 1.320 |
| Other | 0.554 | 0.953 | 1.068 | 0.592 | 0.545 | 0.942 |
| Low education (12 years) | 0.973 | 0.904 | 1.121 | 0.914 | 0.895 | 1.277 |
| Unmarried | 0.809 | 1.128 | 0.870 | 0.940 | 0.869 | 0.975 |
| Dual eligible | 0.816 | 0.989 | 1.301 | 0.888 | 1.189 | 0.916 |
| Supplemental insurance | 0.851 | 0.985 | 1.166 | 0.902 | 0.953 | 1.029 |
| Number of ADL limitations | 0.949 | 1.047 | 0.996 | 0.943 | 0.980 | 1.048 |
| Number of conditions | 1.041 | 1.098 | 0.942 | 1.071 | 0.909 | 1.014 |
| Diabetes | 1.268 | 1.181 | 1.190 | 1.203 | 1.494* | 1.267 |
| Cancer | 0.925 | 0.780 | 1.043 | 0.825 | 0.845 | 0.951 |
| Lung disease | 1.136 | 1.311 | 0.900 | 1.342 | 1.357 | 1.293 |
| Heart problems | 1.003 | 1.304 | 1.212 | 1.044 | 1.128 | 1.445 |
| Stroke | 0.980 | 0.994 | 1.145 | 0.991 | 1.178 | 1.155 |
| Psychiatric problems | 1.074 | 1.008 | 0.951 | 0.951 | 1.135 | 1.020 |
| Arthritis or rheumatism | 1.070 | 0.926 | 1.357* | 1.031 | 1.321 | 0.936 |
| Poor self-rated health | 1.018 | 1.120 | 0.903 | 0.954 | 0.882 | 0.830 |
| Income quartile 2 | 1.142 | 1.205 | 0.911 | 1.201 | 1.279 | 0.801 |
| Income quartile 3 | 1.070 | 1.021 | 1.109 | 1.011 | 1.178 | 0.950 |
| Income quartile 4 | 1.079 | 1.004 | 0.916 | 0.890 | 0.926 | 1.068 |
| Urban | 0.907 | 0.940 | 0.597*** | 1.117 | 0.662** | 0.612** |
| New England | 1.528 | 1.876* | 0.770 | 1.669 | 1.403 | 0.209* |
| Middle Atlantic | 1.189 | 1.329 | 0.595* | 1.391 | 0.868 | 0.424* |
| East North Central | 1.150 | 1.676* | 0.836 | 1.198 | 1.211 | 0.704 |
| West North Central | 1.089 | 1.204 | 0.835 | 1.079 | 0.912 | 0.671 |
| South Atlantic | 1.247 | 1.722** | 0.638* | 1.360 | 0.966 | 0.582 |
| East South Central | 1.668 | 1.238 | 0.677 | 1.201 | 1.134 | 0.845 |
| West South Central | 1.435 | 1.403 | 0.756 | 1.459 | 0.904 | 0.719 |
| Mountain | 1.122 | 1.455 | 0.625 | 1.312 | 1.191 | 0.544 |
| Year of death = 2001 | 1.243 | 1.115 | 0.958 | 1.145 | 0.873 | 0.824 |
| Year of death = 2002 | 1.760* | 1.090 | 1.180 | 1.617* | 1.374 | 0.813 |
| Year of death = 2003 | 1.416 | 0.965 | 0.815 | 1.602 | 1.191 | 0.825 |
| Year of death = 2004 | 1.372 | 1.061 | 1.016 | 1.248 | 1.338 | 0.757 |
| Year of death = 2005 | 1.739* | 1.199 | 1.059 | 1.804* | 1.378 | 0.771 |
| Year of death = 2006 | 1.188 | 1.231 | 0.935 | 1.189 | 1.005 | 0.660 |
| Year of death = 2007 | 1.124 | 1.104 | 0.994 | 1.102 | 0.994 | 0.970 |
| Year of death = 2008 | 1.151 | 0.991 | 1.096 | 1.165 | 1.282 | 1.015 |
APPENDIX A13. EFFECT OF CI ON HOSPITAL AND ED USE IN THE LAST YEAR OF LIFE AMONG NURSING HOME DECEDENTS: LOGISTIC REGRESSION MODEL RESULTS (ODDS RATIO)
| Variable | Any Hosp. | Any Potentially Avoidable Hosp. | Any ED Visit, Outpatient Only | Any ED Visit, Leading to Hosp. | Any ED Visit, Either Type | Any Potentially Avoidable ED Visit, Outpatient Only |
| N (Decedents) | 860 | 860 | 860 | 860 | 860 | 860 |
| SOURCE: RTI analysis of HRS data linked with Medicare claims, 2000-2008. NOTE: Reference group for categorical variables: no CI; age 65-74; male; non-Hispanic, White; 12 or more years of education; married; Medicare coverage only; good/excellent self-rated health; income in bottom quartile; rural residence; Pacific region; and year 2000. ADL = Activity of daily living; ED = Emergency department; Hosp = Hospitalization; HRS = Health and Retirement Study.Statistical significance: * p 0.05; ** p 0.01; *** p 0.001. | ||||||
| Cognitive impairment | 0.572* | 1.087 | 1.070 | 0.780 | 0.708 | 1.574 |
| Age 75-84 | 0.458* | 0.574 | 0.530* | 0.513* | 0.463* | 0.451* |
| Age 85+ | 0.475 | 0.729 | 0.504* | 0.578 | 0.529 | 0.209*** |
| Female | 1.032 | 0.835 | 0.637* | 0.938 | 0.753 | 0.678 |
| Black, non-Hispanic | 1.181 | 1.047 | 1.639 | 1.034 | 1.397 | 1.452 |
| Hispanic | 0.997 | 1.067 | 1.066 | 1.407 | 1.185 | 0.824 |
| Other | 1.192 | 0.672 | 0.808 | 0.633 | 1.028 | 0.522 |
| Low education ( 12 years) | 1.188 | 1.044 | 1.152 | 1.237 | 1.234 | 1.277 |
| Unmarried | 0.819 | 1.102 | 1.208 | 0.744 | 0.869 | 1.717 |
| Dual eligible | 0.909 | 1.234 | 0.830 | 1.014 | 1.052 | 1.003 |
| Supplemental insurance | 1.578 | 0.998 | 0.745 | 1.329 | 1.025 | 1.505 |
| Number of ADL limitations | 0.839** | 0.916 | 0.815*** | 0.902* | 0.804*** | 0.916 |
| Number of conditions | 1.250 | 1.064 | 1.178 | 1.097 | 1.101 | 0.802 |
| Diabetes | 1.443 | 1.074 | 0.879 | 1.199 | 1.030 | 0.814 |
| Cancer | 0.799 | 0.998 | 0.602 | 0.849 | 0.726 | 1.036 |
| Lung disease | 0.839 | 1.372 | 0.644 | 1.243 | 0.919 | 1.883 |
| Heart problems | 1.092 | 1.324 | 0.990 | 1.346 | 1.520 | 2.263* |
| Stroke | 0.766 | 0.992 | 0.890 | 0.812 | 0.843 | 1.062 |
| Psychiatric problems | 0.887 | 0.957 | 1.381 | 0.834 | 1.166 | 1.091 |
| Arthritis or rheumatism | 0.618 | 0.996 | 1.259 | 0.549* | 0.684 | 1.369 |
| Poor self-rated health | 1.295 | 1.020 | 0.990 | 1.211 | 1.147 | 1.158 |
| Income quartile 2 | 0.924 | 0.938 | 1.271 | 0.756 | 0.898 | 1.692 |
| Income quartile 3 | 1.079 | 0.970 | 1.052 | 1.229 | 1.100 | 1.268 |
| Income quartile 4 | 0.914 | 0.993 | 1.856 | 0.744 | 0.958 | 1.884 |
| Urban | 0.981 | 0.819 | 0.702* | 1.500* | 0.984 | 0.491** |
| New England | 0.670 | 1.192 | 1.161 | 0.767 | 0.634 | 1.192 |
| Middle Atlantic | 1.101 | 1.565 | 1.063 | 1.042 | 1.428 | 0.625 |
| East North Central | 1.808 | 1.802 | 1.807 | 2.098* | 2.786** | 1.307 |
| West North Central | 0.605 | 0.672 | 1.317 | 0.481 | 0.724 | 1.078 |
| South Atlantic | 1.365 | 1.800 | 1.592 | 1.790 | 1.732 | 0.694 |
| East South Central | 1.107 | 0.611 | 1.988 | 1.126 | 3.193* | 1.284 |
| West South Central | 1.389 | 1.412 | 2.460* | 1.184 | 1.514 | 1.387 |
| Mountain | 0.610 | 1.398 | 1.826 | 0.752 | 0.971 | 1.173 |
| Year of death = 2001 | 0.765 | 0.675 | 1.369 | 0.624 | 0.999 | 0.584 |
| Year of death = 2002 | 0.723 | 0.719 | 1.668 | 0.726 | 1.041 | 1.106 |
| Year of death = 2003 | 0.734 | 1.087 | 0.822 | 0.811 | 0.945 | 0.222* |
| Year of death = 2004 | 1.030 | 1.164 | 1.302 | 0.870 | 1.294 | 0.525 |
| Year of death = 2005 | 0.620 | 0.643 | 1.564 | 0.679 | 1.059 | 1.092 |
| Year of death = 2006 | 0.980 | 0.812 | 1.296 | 0.865 | 1.348 | 0.349 |
| Year of death = 2007 | 0.698 | 0.737 | 1.115 | 0.611 | 1.038 | 0.728 |
| Year of death = 2008 | 0.711 | 0.756 | 0.881 | 0.541 | 0.907 | 0.849 |
APPENDIX A14. HOSPITAL AND ED USE IN THE LAST YEAR OF LIFE AMONG HRS DECEDENTS, 2000-2008, BY CI (UNADJUSTED PERCENTAGES)
| Utilization Outcome, Annually | Community Total | Community CI | Community Non-CI | Nursing Home Total | Nursing Home CI | Nursing Home Non-CI |
| N (Decedents, unweighted) | 2,408 | 800 | 1,608 | 885 | 688 | 197 |
| SOURCE: RTI analysis of HRS data linked with Medicare claims, 2000-2008. NOTE: Reported in table are weighted but unadjusted percentages. CI = Cognitive impairment; ED = Emergency department; HRS = Health and Retirement Study.Statistical significance: * p 0.05; ** p 0.01; *** p 0.001. | ||||||
| Any hospitalization | 78.7 | 78.2 | 78.9 | 70.3 | 66.9 | 80.8*** |
| Any potentially avoidable hospitalization | 36.9 | 39.8 | 35.5* | 43.2 | 42.9 | 44.2 |
| Any ED visit, outpatient only | 46.1 | 50.7 | 44.0** | 42.4 | 40.7 | 47.9 |
| Any ED visit, leading to hospitalization | 67.0 | 69.5 | 65.8 | 60.8 | 59.2 | 66.0 |
| Any ED visit, either type | 80.1 | 81.4 | 79.4 | 73.5 | 71.1 | 81.3** |
| Any potentially avoidable ED visit, outpatient only | 12.4 | 14.0 | 11.6 | 12.6 | 12.2 | 13.9 |
APPENDIX A15. ANNUALIZED RATES OF HOSPITAL AND ED VISITS AMONG MEDICARE BENEFICIARIES IN THE LAST YEAR OF LIFE AMONG HRS DECEDENTS, 2000-2008 (UNADJUSTED)
| Rates of Utilization,Per 1,000 Person-Years | Community Total | Community CI | Community Non-CI | Nursing Home Total | Nursing Home CI | Nursing Home Non-CI |
| N (Person-observations, unweighted) | 2,408 | 800 | 1,608 | 885 | 688 | 197 |
| SOURCE: RTI analysis of HRS data linked with Medicare claims, 2000-2008. NOTE: Reported in table are unadjusted (actual) rates. CI = Cognitive impairment; ED = Emergency department; HRS = Health and Retirement Study.Statistical significance: * p 0.05; ** p 0.01; *** p 0.001. | ||||||
| Number of hospitalizations | 1,956 | 1,859 | 2,001 | 1,762 | 1,602 | 2,268*** |
| Number of potentially avoidable hospitalizations | 590 | 630 | 572 | 725 | 692 | 828 |
| Number of ED visits, outpatient only | 802 | 933 | 741*** | 726 | 706 | 788 |
| Number of ED visits, leading to hospitalization | 1,480 | 1,480 | 1,480 | 1,390 | 1,305 | 1,686** |
| Number of ED visits, either type | 2,277 | 2,409 | 2,212* | 2,090 | 2,009 | 2,371* |
| Number of potentially avoidable ED visits, outpatient only | 151 | 179 | 138* | 154 | 150 | 168 |
APPENDIX A16. TWO-PART MODEL RESULTS ON MEDICARE EXPENDITURES: MEDICARE BENEFICIARIES IN THE COMMUNITY
| Variable | Any Hospitalization | Any Potentially Avoidable Hospitalization | Any ED Visit, Outpatient Only | Any Potentially Avoidable ED Visit, Outpatient Only |
| N (person-observations) | 35,924 | 35,924 | 35,924 | 35,924 |
| SOURCE: RTI analysis of HRS and Medicare claims data, 2000-2008. NOTE: Reference group for categorical variables: no cognitive impairments; age 65-74; male; non-Hispanic, White; 12 or more years of education; married; Medicare coverage only; good/excellent self-rated health; income in bottom quartile; rural residence; Pacific region; and year 2000. ADL = Activity of daily living; ED = Emergency department; HRS = Health and Retirement Study; XTGEE = Cross-sectional time series generalized estimating equation.Statistical significance: * p 0.05; ** p 0.01; *** p 0.001. | ||||
| Cognitive impairment | 0.518*** | 0.608*** | 0.431*** | 0.478*** |
| Age 75-84 | 0.294*** | 0.455*** | 0.147*** | 0.275** |
| Age 85+ | 0.409*** | 0.787*** | 0.335*** | 0.596*** |
| Female | -0.084* | -0.038 | 0.064 | 0.151 |
| Black | -0.138* | 0.254** | 0.217*** | 0.434*** |
| Hispanic | -0.177* | 0.242 | -0.077 | 0.116 |
| Other | -0.204 | 0.185 | -0.106 | 0.276 |
| Low education (12 years) | -0.074 | -0.040 | -0.017 | -0.085 |
| Unmarried | 0.063 | 0.153 | 0.002 | 0.051 |
| Dual eligible | 0.106 | 0.046 | 0.362*** | 0.253* |
| Supplemental insurance | -0.057 | -0.210 | 0.025 | -0.061 |
| Number of ADL limitations | 0.103*** | 0.125*** | 0.047** | 0.107*** |
| Number of conditions | 0.164*** | 0.115 | 0.006 | 0.118 |
| Diabetes | 0.018 | 0.143 | 0.084 | 0.059 |
| Cancer | 0.114* | 0.111 | 0.111 | -0.138 |
| Lung disease | 0.231*** | 0.904*** | 0.264*** | 0.660*** |
| Heart problems | 0.405*** | 0.608*** | 0.377*** | 0.223 |
| Stroke | 0.094 | 0.208 | 0.250*** | 0.031 |
| Psychiatric problems | -0.144* | -0.127 | 0.250*** | 0.013 |
| Arthritis or rheumatism | -0.003 | -0.264** | 0.196*** | -0.095 |
| Poor self-rated health | 0.463*** | 0.605*** | 0.295*** | 0.422*** |
| Income: Quartile 2 | -0.024 | 0.023 | -0.058 | -0.004 |
| Income: Quartile 3 | -0.023 | -0.002 | -0.087 | 0.010 |
| Income: Quartile 4 | -0.121 | -0.341** | -0.230*** | -0.186 |
| Urban | 0.041 | -0.037 | -0.188*** | -0.379*** |
| New England | -0.050 | 0.194 | 0.085 | -0.258 |
| Middle Atlantic | 0.054 | 0.138 | 0.088 | 0.011 |
| East North Central | 0.135 | 0.484*** | 0.096 | -0.032 |
| West North Central | 0.118 | 0.301 | 0.116 | 0.054 |
| South Atlantic | 0.090 | 0.356** | 0.087 | 0.004 |
| East South Central | -0.019 | 0.402* | 0.074 | 0.097 |
| West South Central | 0.179* | 0.348* | -0.027 | -0.236 |
| Mountain | 0.063 | 0.374* | 0.086 | 0.046 |
| Year = 2002 | 0.000 | -0.005 | 0.581*** | 0.789*** |
| Year = 2004 | 0.035 | -0.042 | 0.600*** | 0.817*** |
| Year = 2006 | -0.134** | -0.139 | 0.724*** | 0.979*** |
| Year = 2008 | -0.071 | -0.182 | 0.712*** | 0.925*** |
| Intercept | -2.525*** | -4.639*** | -2.802*** | -5.073*** |
| Variable | Any Hospitalization | Any Potentially Avoidable Hospitalization | Any ED Visit, Outpatient Only | Any Potentially Avoidable ED Visit, Outpatient Only |
| N (person-observations) | 6,541 | 1,719 | 6,058 | 1,078 |
| SOURCE: RTI analysis of HRS and Medicare claims data, 2000-2008. NOTE: Reference group for categorical variables: no cognitive impairments; age 65-74; male; non-Hispanic, White; 12 or more years of education; married; Medicare coverage only; good/excellent self-rated health; income in bottom quartile; rural residence; Pacific region; and year 2000. ADL = Activity of daily living; ED = Emergency department; HRS = Health and Retirement Study.Statistical significance: * p 0.05; ** p 0.01; *** p 0.001. | ||||
| Cognitive impairment | 0.042 | 0.068 | 0.109* | 0.027 |
| Age 75-84 | -0.063 | -0.181* | 0.080* | 0.018 |
| Age 85+ | -0.225*** | -0.155 | 0.070 | 0.016 |
| Female | -0.202*** | -0.152* | -0.077* | 0.010 |
| Black | 0.046 | 0.060 | -0.074 | -0.211** |
| Hispanic | 0.214** | 0.187 | -0.060 | -0.297** |
| Other | -0.048 | 0.091 | 0.189 | -0.058 |
| Low education (12 years) | -0.068 | -0.062 | -0.060 | 0.034 |
| Unmarried | 0.002 | 0.007 | -0.019 | -0.003 |
| Dual eligible | 0.027 | -0.078 | 0.048 | 0.082 |
| Supplemental insurance | 0.009 | 0.105 | -0.077 | -0.055 |
| Number of ADL limitations | 0.086*** | 0.089*** | 0.040* | 0.021 |
| Number of conditions | 0.023 | 0.010 | 0.001 | 0.036 |
| Diabetes | 0.032 | 0.132 | -0.016 | -0.048 |
| Cancer | 0.055 | 0.032 | 0.102 | 0.039 |
| Lung disease | -0.052 | -0.001 | 0.024 | 0.096 |
| Heart problems | 0.159** | 0.209* | 0.161** | 0.101 |
| Stroke | -0.003 | 0.095 | 0.087 | -0.003 |
| Psychiatric problems | -0.090 | -0.096 | 0.038 | 0.023 |
| Arthritis or rheumatism | -0.056 | 0.011 | 0.020 | -0.099 |
| Poor self-rated health | 0.106** | 0.071 | 0.077* | 0.081 |
| Income: Quartile 2 | 0.065 | 0.001 | -0.050 | -0.055 |
| Income: Quartile 3 | 0.044 | -0.071 | 0.001 | -0.056 |
| Income: Quartile 4 | 0.064 | -0.157 | -0.065 | -0.162 |
| Urban | 0.157*** | 0.187** | -0.081* | -0.124* |
| New England | 0.095 | -0.160 | 0.149 | 0.145 |
| Middle Atlantic | 0.211** | 0.016 | -0.116 | -0.110 |
| East North Central | 0.045 | -0.012 | 0.100 | -0.027 |
| West North Central | 0.092 | -0.095 | -0.008 | -0.059 |
| South Atlantic | 0.010 | -0.189 | -0.052 | -0.013 |
| East South Central | -0.092 | -0.231 | -0.091 | -0.019 |
| West South Central | 0.104 | 0.014 | -0.100 | -0.137 |
| Mountain | 0.280* | 0.174 | 0.174 | -0.143 |
| Year = 2002 | -0.041 | -0.135 | 0.187** | 0.249* |
| Year = 2004 | -0.004 | -0.105 | 0.366*** | 0.382*** |
| Year = 2006 | -0.094 | -0.093 | 0.589*** | 0.630*** |
| Year = 2008 | -0.069 | -0.191* | 0.605*** | 0.419*** |
| Intercept | 9.483*** | 9.059*** | 5.673*** | 5.528*** |
APPENDIX A17. TWO-PART MODEL RESULTS ON MEDICARE EXPENDITURES: MEDICARE BENEFICIARIES IN NURSING HOMES
| Variable | Any Hospitalization | Any Potentially Avoidable Hospitalization | Any ED Visit, Outpatient Only | Any Potentially Avoidable ED Visit, Outpatient Only |
| N (person-observations) | 2,147 | 2,147 | 2,147 | 2,147 |
| SOURCE: RTI analysis of HRS and Medicare claims data, 2000-2008. NOTE: Reference group for categorical variables: no cognitive impairments; age 65-74; male; non-Hispanic, White; 12 or more years of education; married; Medicare coverage only; good/excellent self-rated health; income in bottom quartile; rural residence; Pacific region; and year 2000. ADL = Activity of daily living; ED = Emergency department; HRS = Health and Retirement Study; XTGEE = Cross-sectional time series generalized estimating equation.Statistical significance: * p 0.05; ** p 0.01; *** p 0.001. | ||||
| Cognitive impairment | 0.054 | 0.147 | 0.379** | 0.399 |
| Age 75-84 | 0.110 | 0.175 | -0.242 | -0.234 |
| Age 85+ | 0.052 | 0.313 | -0.101 | -0.059 |
| Female | -0.041 | -0.250 | -0.166 | -0.111 |
| Black | -0.200 | -0.036 | -0.001 | 0.618* |
| Hispanic | -0.240 | -0.667 | 0.122 | -0.488 |
| Other | -0.476 | -0.092 | 0.116 | 0.442 |
| Low education (12 years) | 0.130 | -0.117 | 0.123 | 0.777*** |
| Unmarried | -0.178 | -0.058 | 0.128 | -0.392 |
| Dual eligible | -0.194 | -0.012 | -0.152 | -0.092 |
| Supplemental insurance | -0.305 | -0.620* | 0.129 | 0.404 |
| Number of ADL limitations | 0.078* | 0.116** | 0.043 | -0.004 |
| Number of conditions | 0.212 | 0.113 | 0.036 | 0.202 |
| Diabetes | -0.072 | 0.156 | -0.116 | -0.500 |
| Cancer | -0.334 | -0.245 | 0.061 | 0.016 |
| Lung disease | -0.041 | 0.386 | 0.177 | 0.267 |
| Heart problems | 0.271 | 0.488* | 0.193 | -0.023 |
| Stroke | -0.041 | 0.050 | 0.093 | 0.071 |
| Psychiatric problems | -0.123 | -0.229 | 0.215 | -0.070 |
| Arthritis or rheumatism | 0.071 | -0.037 | 0.011 | -0.494 |
| Poor self-rated health | 0.388*** | 0.340* | 0.061 | 0.044 |
| Income: Quartile 2 | -0.024 | -0.253 | 0.110 | 0.066 |
| Income: Quartile 3 | -0.240 | -0.686** | -0.057 | -0.146 |
| Income: Quartile 4 | -0.091 | -0.277 | -0.179 | -0.331 |
| Urban | 0.048 | -0.077 | -0.485*** | -0.795** |
| New England | 0.300 | 0.088 | -0.333 | -0.394 |
| Middle Atlantic | 0.212 | -0.012 | -0.561* | -0.212 |
| East North Central | 0.318 | -0.059 | -0.154 | -0.342 |
| West North Central | -0.095 | -0.675* | -0.578* | -1.043* |
| South Atlantic | 0.281 | 0.154 | -0.196 | -0.836* |
| East South Central | 0.224 | -0.237 | -0.343 | -0.770 |
| West South Central | 0.170 | -0.242 | -0.530* | -0.819 |
| Mountain | 0.194 | -0.065 | -0.240 | -0.406 |
| Year = 2002 | 0.400* | 0.378 | 1.230*** | 1.657** |
| Year = 2004 | 0.329 | 0.408 | 1.219*** | 1.546* |
| Year = 2006 | 0.076 | 0.208 | 1.241*** | 1.585* |
| Year = 2008 | -0.030 | 0.117 | 1.136*** | 1.848** |
| Intercept | -1.214*** | -2.232*** | -1.690*** | -3.559*** |
| Variable | Any Hospitalization | Any Potentially Avoidable Hospitalization | Any ED Visit, Outpatient Only | Any Potentially Avoidable ED Visit, Outpatient Only |
| N (person-observations) | 1,110 | 473 | 728 | 157 |
| SOURCE: RTI analysis of HRS and Medicare claims data, 2000-2008. NOTE: Reference group for categorical variables: no cognitive impairments; age 65-74; male; non-Hispanic, White; 12 or more years of education; married; Medicare coverage only; good/excellent self-rated health; income in bottom quartile; rural residence; Pacific region; and year 2000. ADL = Activity of daily living; ED = Emergency department; HRS = Health and Retirement Study.Statistical significance: * p 0.05; ** p 0.01; *** p 0.001. | ||||
| Cognitive impairment | 0.052 | 0.147 | 0.084 | -0.110 |
| Age 75-84 | -0.051 | 0.133 | -0.059 | -0.129 |
| Age 85+ | -0.236* | -0.053 | -0.148 | 0.050 |
| Female | -0.112 | -0.231* | -0.068 | 0.152 |
| Black | 0.254* | 0.522** | 0.132 | -0.081 |
| Hispanic | 0.046 | 0.515 | 0.169 | -0.620* |
| Other | 0.378 | 0.668* | -0.216 | 0.167 |
| Low education (12 years) | -0.026 | 0.111 | 0.069 | 0.255 |
| Unmarried | -0.169 | -0.282* | 0.045 | 0.090 |
| Dual eligible | -0.044 | 0.075 | -0.066 | 0.052 |
| Supplemental insurance | 0.126 | -0.255 | 0.120 | 0.276 |
| Number of ADL limitations | 0.077** | 0.044 | -0.023 | -0.011 |
| Number of conditions | 0.109 | -0.010 | 0.038 | 0.044 |
| Diabetes | 0.087 | 0.084 | 0.104 | 0.197 |
| Cancer | 0.014 | -0.048 | -0.023 | 0.097 |
| Lung disease | 0.019 | 0.203 | -0.112 | -0.181 |
| Heart problems | -0.021 | 0.181 | 0.109 | 0.026 |
| Stroke | -0.162 | 0.014 | 0.070 | 0.286 |
| Psychiatric problems | -0.165 | -0.136 | 0.052 | 0.017 |
| Arthritis or rheumatism | -0.085 | 0.162 | -0.091 | 0.056 |
| Poor self-rated health | 0.115 | -0.126 | 0.112 | -0.084 |
| Income: Quartile 2 | 0.043 | 0.056 | -0.087 | 0.148 |
| Income: Quartile 3 | 0.053 | -0.274 | 0.204 | 0.625** |
| Income: Quartile 4 | 0.087 | -0.107 | -0.093 | 0.473 |
| Urban | 0.165 | -0.077 | -0.281** | -0.052 |
| New England | 0.030 | 0.031 | 0.098 | -0.563 |
| Middle Atlantic | 0.070 | 0.128 | -0.095 | -0.416 |
| East North Central | 0.098 | 0.059 | -0.130 | -0.017 |
| West North Central | -0.012 | -0.604*** | -0.281 | -0.349 |
| South Atlantic | -0.151 | -0.334* | -0.189 | -0.169 |
| East South Central | -0.351 | -0.703** | -0.330 | -0.727* |
| West South Central | 0.443 | -0.142 | -0.261 | -0.570* |
| Mountain | 0.170 | -0.123 | 0.008 | 0.611 |
| Year = 2002 | -0.065 | 0.260 | 0.262 | 0.762** |
| Year = 2004 | -0.202 | -0.015 | 0.542** | 0.990** |
| Year = 2006 | -0.036 | 0.024 | 0.609** | 1.080*** |
| Year = 2008 | -0.099 | 0.285 | 0.650** | 1.123*** |
| Intercept | 9.680*** | 9.267*** | 6.090*** | 4.913*** |
APPENDIX A18. MEDICARE EXPENDITURES FOR HOSPITAL AND ED VISITS AMONG MEDICARE BENEFICIARIES IN THE HRS, 2000-2008, BY CI (UNADJUSTED)
| Hospitalization/ED Visits | CI Mean | (SD) | Non-CI Mean | (SD) | Difference |
| SOURCE: RTI analysis of HRS data linked with Medicare claims, 2000-2008. NOTE: Reported in table are unadjusted(actual) amounts, in constant 2008 dollars. CI = Cognitive impairment; ED = Emergency department; HRS = Health and Retirement Study; SD = Standard deviation.Statistical significance: * p 0.05; ** p 0.01; *** p 0.001. | |||||
| Community | |||||
| Hospitalizations, total | $5,366 | (14,369) | $2,511 | (9,506) | $2,855*** |
| Hospitalizations, potentially avoidable | $1,145 | (5,964) | $315 | (2,430) | $831*** |
| Outpatient ED visits, total | $162 | (398) | $70 | (286) | $92*** |
| Outpatient ED visits, potentially avoidable | $27 | (129) | $9 | (84) | $18*** |
| N (Person-observations, unweighted) | 4,172 | --- | 31,752 | --- | --- |
| Nursing home | |||||
| Hospitalizations, total | $11,380 | (21,940) | $9,823 | (20,587) | $1,557 |
| Hospitalizations, potentially avoidable | $3,025 | (8,724) | $1,890 | (6,395) | $1,135** |
| Outpatient ED visits, total | $252 | (569) | $173 | (481) | $80*** |
| Outpatient ED visits, potentially avoidable | $51 | (273) | $28 | (182) | $23* |
| N (Person-observations, unweighted) | 1,207 | --- | 940 | --- | --- |
APPENDIX A19. TWO-PART MODEL RESULTS ON MEDICARE EXPENDITURES IN THE LAST YEAR OF LIFE: COMMUNITY DECEDENTS
| Variable | Any Hospitalization | Any Potentially Avoidable Hospitalization | Any ED Visit, Outpatient Only | Any Potentially Avoidable ED Visit, Outpatient Only |
| N (Decedents) | 2,380 | 2,380 | 2,380 | 2,380 |
| SOURCE: RTI analysis of HRS and Medicare claims data, 2000-2008. NOTE: Reference group for categorical variables: no cognitive impairments; age 65-74; male; non-Hispanic, White; 12 or more years of education; married; Medicare coverage only; good/excellent self-rated health; income in bottom quartile; rural residence; Pacific region; and year 2000. ADL = Activity of daily living; ED = Emergency department; HRS = Health and Retirement Study.Statistical significance: * p 0.05; ** p 0.01; *** p 0.001. | ||||
| Cognitive impairment | -0.025 | 0.057 | 0.308** | 0.164 |
| Age 75-84 | 0.186 | 0.254* | -0.036 | -0.066 |
| Age 85+ | 0.333* | 0.344* | -0.257 | -0.112 |
| Female | 0.274* | -0.041 | 0.159 | 0.029 |
| Black, non-Hispanic | 0.099 | 0.210 | 0.183 | 0.439* |
| Hispanic | -0.030 | 0.259 | -0.034 | 0.352 |
| Other | -0.653 | -0.040 | 0.017 | -0.031 |
| Low education (12 years) | -0.018 | -0.102 | 0.106 | 0.204 |
| Unmarried | -0.169 | 0.118 | -0.140 | -0.087 |
| Dual eligible | -0.133 | -0.012 | 0.257 | -0.111 |
| Supplemental insurance | -0.224 | -0.060 | 0.167 | 0.080 |
| Number of ADL limitations | -0.050 | 0.051 | -0.015 | 0.035 |
| Number of conditions | 0.114 | 0.112 | -0.044 | 0.055 |
| Diabetes | 0.110 | 0.124 | 0.200 | 0.214 |
| Cancer | -0.150 | -0.255 | 0.030 | -0.108 |
| Lung disease | 0.025 | 0.255 | -0.128 | 0.222 |
| Heart problems | -0.071 | 0.238 | 0.162 | 0.322 |
| Stroke | -0.177 | -0.042 | 0.053 | 0.057 |
| Psychiatric problems | -0.111 | -0.022 | -0.112 | -0.125 |
| Arthritis or rheumatism | -0.027 | -0.111 | 0.321* | -0.100 |
| Poor self-rated health | -0.003 | 0.109 | -0.113 | -0.225 |
| Income quartile 2 | 0.171 | 0.188 | -0.061 | -0.240 |
| Income quartile 3 | 0.073 | -0.003 | 0.096 | -0.070 |
| Income quartile 4 | -0.089 | -0.043 | -0.055 | 0.069 |
| Urban | -0.044 | -0.052 | -0.510*** | -0.490** |
| New England | 0.420 | 0.574* | -0.350 | -1.539* |
| Middle Atlantic | 0.189 | 0.288 | -0.520* | -0.957** |
| East North Central | 0.170 | 0.504* | -0.158 | -0.380 |
| West North Central | 0.163 | 0.174 | -0.256 | -0.495 |
| South Atlantic | 0.261 | 0.526** | -0.453* | -0.533 |
| East South Central | 0.593 | 0.223 | -0.366 | -0.140 |
| West South Central | 0.418 | 0.346 | -0.287 | -0.355 |
| Mountain | 0.191 | 0.348 | -0.516 | -0.668 |
| Year of death = 2001 | 0.185 | 0.142 | 0.828** | 1.392* |
| Year of death = 2002 | 0.486 | 0.096 | 1.111*** | 1.451** |
| Year of death = 2003 | 0.354 | -0.001 | 0.739** | 1.459** |
| Year of death = 2004 | 0.307 | 0.081 | 0.972*** | 1.377* |
| Year of death = 2005 | 0.552* | 0.221 | 0.981*** | 1.384* |
| Year of death = 2006 | 0.178 | 0.205 | 0.868*** | 1.226* |
| Year of death = 2007 | 0.144 | 0.133 | 0.935*** | 1.609** |
| Year of death = 2008 | 0.110 | -0.002 | 1.026*** | 1.663** |
| Intercept | 0.408 | -1.808*** | -0.706* | -2.948*** |
| Variable | Any Hospitalization | Any Potentially Avoidable Hospitalization | Any ED Visit, Outpatient Only | Any Potentially Avoidable ED Visit, Outpatient Only |
| N (Decedents) | 1,856 | 886 | 1,055 | 271 |
| SOURCE: RTI analysis of HRS and Medicare claims data, 2000-2008. NOTE: Reference group for categorical variables: no cognitive impairments; age 65-74; male; non-Hispanic, White; 12 or more years of education; married; Medicare coverage only; good/excellent self-rated health; income in bottom quartile; rural residence; Pacific region; and year 2000. ADL = Activity of daily living; ED = Emergency department; HRS = Health and Retirement Study.Statistical significance: * p 0.05; ** p 0.01; *** p 0.001. | ||||
| Cognitive impairment | -0.138* | -0.090 | -0.053 | -0.141 |
| Age 75-84 | -0.265*** | -0.288** | -0.078 | -0.097 |
| Age 85+ | -0.539*** | -0.388*** | -0.057 | 0.104 |
| Female | 0.016 | 0.025 | 0.112 | 0.093 |
| Black, non-Hispanic | 0.216* | 0.114 | -0.127 | 0.102 |
| Hispanic | 0.313** | 0.402** | -0.103 | -0.020 |
| Other | -0.102 | -0.296* | -0.115 | 0.118 |
| Low education (12 years) | -0.023 | 0.127 | 0.114 | 0.114 |
| Unmarried | -0.098 | 0.004 | -0.218** | -0.102 |
| Dual eligible | 0.079 | -0.122 | 0.024 | 0.213 |
| Supplemental insurance | 0.210* | 0.026 | 0.070 | -0.032 |
| Number of ADL limitations | -0.011 | -0.012 | -0.020 | -0.031 |
| Number of conditions | 0.083 | -0.008 | 0.013 | -0.022 |
| Diabetes | -0.059 | 0.192 | 0.027 | 0.154 |
| Cancer | -0.134 | -0.113 | 0.115 | -0.019 |
| Lung disease | -0.185* | 0.018 | -0.032 | 0.074 |
| Heart problems | 0.119 | 0.146 | 0.028 | -0.102 |
| Stroke | -0.040 | 0.063 | -0.038 | -0.014 |
| Psychiatric problems | -0.115 | -0.114 | 0.017 | 0.300* |
| Arthritis or rheumatism | -0.019 | 0.019 | -0.001 | -0.087 |
| Poor self-rated health | -0.071 | 0.078 | 0.028 | -0.020 |
| Income quartile 2 | 0.106 | 0.150 | -0.164* | -0.173 |
| Income quartile 3 | -0.012 | 0.172 | -0.083 | -0.111 |
| Income quartile 4 | -0.019 | -0.033 | -0.007 | -0.070 |
| Urban | 0.276*** | 0.141 | -0.149* | -0.204* |
| New England | 0.168 | -0.275 | 0.074 | 1.031* |
| Middle Atlantic | 0.286* | -0.039 | -0.126 | 0.191 |
| East North Central | 0.068 | -0.184 | -0.036 | 0.115 |
| West North Central | -0.009 | -0.512*** | -0.180 | -0.077 |
| South Atlantic | 0.095 | -0.298* | -0.177 | -0.085 |
| East South Central | -0.069 | -0.426* | -0.255 | 0.242 |
| West South Central | 0.325** | -0.117 | -0.171 | -0.014 |
| Mountain | 0.133 | -0.190 | -0.242 | -0.404 |
| Year of death = 2001 | 0.000 | 0.216 | 0.112 | 0.014 |
| Year of death = 2002 | -0.104 | 0.020 | 0.187 | 0.090 |
| Year of death = 2003 | -0.210 | -0.224 | 0.441* | 0.244 |
| Year of death = 2004 | -0.131 | 0.095 | 0.208 | 0.362 |
| Year of death = 2005 | -0.044 | -0.069 | 0.436* | 0.353 |
| Year of death = 2006 | -0.111 | 0.028 | 0.297 | 0.274 |
| Year of death = 2007 | -0.113 | -0.025 | 0.702*** | 0.797*** |
| Year of death = 2008 | -0.206 | -0.162 | 0.438* | 0.137 |
| Intercept | 10.198*** | 9.650*** | 6.418*** | 6.094*** |
APPENDIX A20. TWO-PART MODEL RESULTS ON MEDICARE EXPENDITURES IN THE LAST YEAR OF LIFE: NURSING HOME DECEDENTS
| Variable | Any Hospitalization | Any Potentially Avoidable Hospitalization | Any ED Visit, Outpatient Only | Any Potentially Avoidable ED Visit, Outpatient Only |
| N (Decedents) | 860 | 860 | 860 | 860 |
| SOURCE: RTI analysis of HRS and Medicare claims data, 2000-2008. NOTE: Reference group for categorical variables: no cognitive impairments; age 65-74; male; non-Hispanic, White; 12 or more years of education; married; Medicare coverage only; good/excellent self-rated health; income in bottom quartile; rural residence; Pacific region; and year 2000. ADL = Activity of daily living; ED = Emergency department; HRS = Health and Retirement Study.Statistical significance: * p 0.05; ** p 0.01; *** p 0.001. | ||||
| Cognitive impairment | -0.535* | 0.076 | -0.005 | 0.422 |
| Age 75-84 | -0.805* | -0.552 | -0.541 | -0.677 |
| Age 85+ | -0.763* | -0.317 | -0.531 | -1.269*** |
| Female | 0.039 | -0.185 | -0.460* | -0.389 |
| Black, non-Hispanic | 0.185 | 0.052 | 0.462 | 0.336 |
| Hispanic | 0.017 | 0.060 | 0.179 | 0.017 |
| Other | 0.193 | -0.379 | -0.177 | -0.605 |
| Low education (12 years) | 0.197 | 0.050 | 0.087 | 0.222 |
| Unmarried | -0.179 | 0.099 | 0.206 | 0.451 |
| Dual eligible | -0.083 | 0.222 | -0.165 | -0.039 |
| Supplemental insurance | 0.486 | 0.004 | -0.135 | 0.589 |
| Number of ADL limitations | -0.179** | -0.090 | -0.209*** | -0.114 |
| Number of conditions | 0.205 | 0.055 | 0.156 | -0.234 |
| Diabetes | 0.362 | 0.083 | -0.102 | -0.126 |
| Cancer | -0.187 | 0.010 | -0.550* | 0.017 |
| Lung disease | -0.167 | 0.304 | -0.533 | 0.591 |
| Heart problems | 0.115 | 0.284 | -0.012 | 0.770 |
| Stroke | -0.225 | 0.007 | -0.067 | 0.140 |
| Psychiatric problems | -0.082 | -0.027 | 0.343 | 0.122 |
| Arthritis or rheumatism | -0.484 | -0.001 | 0.293 | 0.453 |
| Poor self-rated health | 0.235 | 0.015 | -0.031 | 0.130 |
| Income quartile 2 | -0.066 | -0.053 | 0.267 | 0.550 |
| Income quartile 3 | 0.059 | -0.017 | 0.051 | 0.137 |
| Income quartile 4 | -0.060 | 0.012 | 0.592 | 0.514 |
| Urban | -0.018 | -0.190 | -0.350* | -0.710** |
| New England | -0.404 | 0.178 | -0.067 | -0.427 |
| Middle Atlantic | 0.046 | 0.447 | 0.140 | -0.345 |
| East North Central | 0.594 | 0.594 | 0.577 | 0.229 |
| West North Central | -0.498 | -0.391 | 0.206 | -0.145 |
| South Atlantic | 0.290 | 0.574 | 0.439 | -0.460 |
| East South Central | 0.123 | -0.481 | 0.665 | 0.271 |
| West South Central | 0.312 | 0.348 | 0.829* | 0.239 |
| Mountain | -0.488 | 0.337 | 0.592 | 0.077 |
| Year of death = 2001 | -0.326 | -0.389 | 1.632** | 1.455 |
| Year of death = 2002 | -0.313 | -0.328 | 1.928*** | 2.144 |
| Year of death = 2003 | -0.303 | 0.083 | 1.208* | 0.516 |
| Year of death = 2004 | 0.036 | 0.152 | 1.680** | 1.420 |
| Year of death = 2005 | -0.468 | -0.442 | 1.871*** | 2.139 |
| Year of death = 2006 | -0.018 | -0.210 | 1.650** | 0.931 |
| Year of death = 2007 | -0.358 | -0.309 | 1.528** | 1.719 |
| Year of death = 2008 | -0.367 | -0.306 | 1.285* | 1.838 |
| Intercept | 2.345** | -0.141 | -1.530* | -3.001* |
| Variable | Any Hospitalization | Any Potentially Avoidable Hospitalization | Any ED Visit, Outpatient Only | Any Potentially Avoidable ED Visit, Outpatient Only |
| N (Decedents) | 601 | 375 | 360 | 100 |
| SOURCE: RTI analysis of HRS and Medicare claims data, 2000-2008. NOTE: Reference group for categorical variables: no cognitive impairments; age 65-74; male; non-Hispanic, White; 12 or more years of education; married; Medicare coverage only; good/excellent self-rated health; income in bottom quartile; rural residence; Pacific region; and year 2000. ADL = Activity of daily living; ED = Emergency department; HRS = Health and Retirement Study.Statistical significance: * p 0.05; ** p 0.01; *** p 0.001. | ||||
| Cognitive impairment | -0.327** | -0.239* | 0.062 | 0.386 |
| Age 75-84 | -0.058 | 0.076 | -0.136 | -0.210 |
| Age 85+ | -0.280* | 0.014 | -0.205 | -0.190 |
| Female | -0.133 | -0.108 | 0.085 | 0.138 |
| Black, non-Hispanic | 0.526*** | 0.516*** | -0.010 | 0.164 |
| Hispanic | 0.364 | 0.765*** | -0.093 | -0.053 |
| Other | 0.169 | 0.381 | -0.194 | 0.371 |
| Low education (12 years) | -0.007 | -0.064 | 0.128 | 0.302 |
| Unmarried | -0.103 | -0.362** | -0.021 | 0.066 |
| Dual eligible | 0.012 | 0.001 | 0.160 | 0.032 |
| Supplemental insurance | -0.130 | 0.025 | 0.470* | 0.856** |
| Number of ADL limitations | 0.000 | 0.031 | -0.047 | -0.054 |
| Number of conditions | 0.078 | -0.152 | -0.210 | -0.344* |
| Diabetes | -0.078 | -0.001 | 0.422* | 0.407 |
| Cancer | -0.089 | 0.232 | 0.355* | 0.345 |
| Lung disease | -0.008 | 0.474** | 0.150 | 0.316 |
| Heart problems | 0.045 | 0.306* | 0.351* | 0.522* |
| Stroke | -0.308* | -0.070 | 0.666*** | 0.919*** |
| Psychiatric problems | -0.194 | -0.026 | 0.236 | 0.379 |
| Arthritis or rheumatism | -0.022 | 0.093 | 0.059 | 0.200 |
| Poor self-rated health | 0.086 | -0.073 | -0.218* | -0.578*** |
| Income quartile 2 | -0.027 | -0.336*** | 0.051 | 0.122 |
| Income quartile 3 | -0.174 | -0.396* | 0.061 | -0.107 |
| Income quartile 4 | -0.182 | -0.341 | 0.121 | 0.009 |
| Urban | 0.284*** | 0.197* | -0.280** | -0.548** |
| New England | 0.169 | 0.150 | 0.130 | -1.544*** |
| Middle Atlantic | 0.174 | -0.073 | -0.505* | -0.688* |
| East North Central | -0.096 | -0.142 | -0.463* | -0.662* |
| West North Central | -0.087 | -0.082 | -0.703** | -1.238*** |
| South Atlantic | -0.184 | -0.428** | -0.488* | -1.126*** |
| East South Central | 0.036 | -0.506* | -0.624* | -0.660 |
| West South Central | 0.204 | -0.036 | -0.577* | -1.274*** |
| Mountain | 0.238 | -0.396* | -0.364 | -0.743 |
| Year of death = 2001 | -0.510* | -0.408 | 0.140 | 0.854 |
| Year of death = 2002 | -0.426 | -0.146 | 0.573 | 1.196* |
| Year of death = 2003 | -0.287 | -0.295 | 0.319 | 1.608** |
| Year of death = 2004 | -0.584* | -0.692* | 0.707 | 1.118* |
| Year of death = 2005 | -0.527* | -0.412 | 0.944* | 1.952*** |
| Year of death = 2006 | -0.405 | -0.514 | 0.538 | 0.316 |
| Year of death = 2007 | -0.625** | -0.625* | 0.899* | 1.171* |
| Year of death = 2008 | -0.265 | -0.320 | 1.080** | 1.433** |
| Intercept | 10.784*** | 10.678*** | 6.487*** | 6.047*** |
APPENDIX A21. MEDICARE EXPENDITURES FOR HOSPITAL AND ED VISITS IN THE LAST YEAR OF LIFE AMONG HRS DECEDENTS, 2000-2008, BY CI (UNADJUSTED)
| Hospitalization/ED Visits | CI Mean | (SD) | Non-CI Mean | (SD) | Difference |
| SOURCE: RTI analysis of HRS data linked with Medicare claims, 2000-2008. NOTE: Reported in table are unadjusted (actual) amounts, in constant 2008 dollars. CI = Cognitive impairment; ED = Emergency department; HRS = Health and Retirement Study; SD = Standard deviation.Statistical significance: * p 0.05; ** p 0.01; *** p 0.001. | |||||
| Community | |||||
| Hospitalizations, total | $19,924 | (33,293) | $23,743 | (34,271) | -$3,819** |
| Hospitalizations, potentially avoidable | $5,402 | (13,819) | $5,097 | (12,845) | $305 |
| Outpatient ED visits, total | $321 | (547) | $292 | (557) | $29 |
| Outpatient ED visits, potentially avoidable | $66 | (210) | $55 | (207) | $11 |
| N (Person-observations, unweighted) | 790 | --- | 1,590 | --- | --- |
| Nursing home | |||||
| Hospitalizations, total | $15,408 | (25,209) | $25,694 | (34,805) | -$10,286*** |
| Hospitalizations, potentially avoidable | $5,825 | (15,175) | $8,055 | (18,489) | -$2,230 |
| Outpatient ED visits, total | $278 | (598) | $340 | (608) | -$62 |
| Outpatient ED visits, potentially avoidable | $70 | (332) | $84 | (337) | -$14 |
| N (Person-observations, unweighted) | 669 | --- | 191 | --- | --- |
NOTES
-
We initially planned to use six waves of the HRS data covering 2000-2010. However, the linked Medicare claims data for 2009 and 2010 were not available at the time of analyses for this project.
-
Results from analyses using count measures are not reported but available upon request.
-
One individual condition, high blood pressure or hypertension, was excluded from multivariate models to avoid the problem of multicollinearity.
-
Given the way the HRS sample is drawn and replenished, cross-sectionally it may not be truly representative of the underlying population at a given wave; nevertheless, it is a good approximation.
-
We applied sampling weights as they are provided in the HRS, with no modification made on the FFS only Medicare population underlying our final analytic sample, although these weights were developed for the entire HRS sample including Medicare managed care enrollees.
To obtain a printed copy of this report, send the full report title and your mailing information to:
U.S. Department of Health and Human ServicesOffice of Disability, Aging and Long-Term Care PolicyRoom 424E, H.H. Humphrey Building200 Independence Avenue, S.W.Washington, D.C. 20201FAX: 202-401-7733Email: webmaster.DALTCP@hhs.gov
RETURN TO:
Office of Disability, Aging and Long-Term Care Policy (DALTCP) Home [http://aspe.hhs.gov/office_specific/daltcp.cfm]Assistant Secretary for Planning and Evaluation (ASPE) Home [http://aspe.hhs.gov]U.S. Department of Health and Human Services (HHS) Home [http://www.hhs.gov]
Last Updated: 12/11/2013