
Jonathan D. Brown, Allison Barrett, Henry Ireys, Emily Caffery, and Kerianne Hourihan
Mathematica Policy Research
This brief was prepared under contract #HHSP23320095642WC between the U.S. Department of Health and Human Services, Office of the Assistant Secretary for Planning and Evaluation, Office of Disability, Aging and Long-Term Care Policy and Mathematica Policy Research. For additional information about this subject, you can visit the DALTCP home page at http://aspe.hhs.gov/_/office_specific/daltcp.cfm or contact the ASPE Project Officer, John Drabek, at HHS/ASPE/DALTCP, Room 424E, H.H. Humphrey Building, 200 Independence Avenue, S.W., Washington, D.C. 20201, John.Drabek@hhs.gov.
"
Acknowledgments
We appreciate the guidance of John Drabek, Kirsten Beronio, Richard Frank, and our technical expert panel. Sharon Clark and Daryl Hall assisted with the production of this report.
Executive Summary
As the largest payer of mental health services in the United States, Medicaid programs have an opportunity to promote high-quality care for serious and persistent mental illnesses (SPMI) through the use of reimbursement strategies and policies that encourage the delivery of evidence-based practices (EBPs). These EBPs, which include pharmacologic, psychosocial, and physical health services, help beneficiaries with SPMI avoid costly institutional care, maintain employment, and engage in the community.
Few studies have examined the extent to which Medicaid beneficiaries with SPMI receive EPBs, and most of those studies have focused on Medicaid beneficiaries in a single state or smaller geographic area. Given the wide variation in state Medicaid mental health benefits and mental health service delivery systems, the receipt of EBPs is likely to vary--perhaps substantially--between states. Understanding state-to-state variation in the receipt of EBPs and identifying factors associated with the receipt of EBPs, including beneficiary demographic characteristics and specific features of state mental health systems and Medicaid programs, may help state Medicaid agencies, mental health commissioners, providers, consumers, and other stakeholders design service systems and Medicaid policies that encourage the delivery of EBPs.
This project, conducted by Mathematica Policy Research for the Office of the Assistant Secretary for Planning and Evaluation, U.S. Department of Health and Human Services, used standardized Medicaid claims data from 22 states to measure the extent to which beneficiaries with schizophrenia and bipolar disorder received EBPs in calendar year 2007, and identify characteristics of beneficiaries, state mental health systems, and Medicaid programs associated with the receipt of EBPs. The EBPs investigated included receipt of medications, continuity of medications, medication monitoring, psychosocial services, and preventive physical health care.
Although there was some state-to-state variation in the findings, the study found that, while more than 90 percent of beneficiaries with schizophrenia or bipolar disorder received an evidence-based medication during the year, only 61 percent of those beneficiaries continuously refilled their prescriptions. Medication level monitoring was provided to about half of beneficiaries taking lithium or anticonvulsants, and screening for common side effects of antipsychotics was provided even less frequently. Only 30 percent of beneficiaries received any preventive physical health services. In some states, less than half of beneficiaries received psychosocial services. Overall, only 5 percent received all of the following: a continuous supply of evidence-based medications, medication level monitoring and screenings for medication side effects, and psychosocial services. Medication continuity and monitoring was particularly poor among African American beneficiaries. Younger beneficiaries also had difficulty in maintaining continuous use of evidence-based medications.
Several Medicaid program characteristics and features of state mental health systems were associated with the receipt of EBPs. Specifically, copayments and prior authorization requirements for certain types of prescription drugs were associated with worse medication continuity even after accounting for several other Medicaid program and beneficiary characteristics. For both schizophrenia and bipolar disorder, enrollment in a comprehensive managed care plan was associated with worse medication continuity. However, these findings should be interpreted with caution, since the data for this study included relatively few managed care plans from few states. Although this study could not measure every factor that may influence the delivery of EBPs, the preliminary findings point to certain features of Medicaid programs and mental health systems that may impede the receipt of evidence-based care.
The findings underscore the need to improve the receipt of EBPs for Medicaid beneficiaries with schizophrenia and bipolar disorder, and point to some specific Medicaid policies, populations, and intervention strategies that require further consideration. With respect to Medicaid policies, the findings suggest that states should carefully consider the impact that prior authorization requirements and copayment amounts have on the ability of certain populations to receive continuous medications--medications that help beneficiaries maintain their stability and avoid hospitalization. An increase of even one dollar in the copayment amount may inversely impact the ability of some beneficiaries to receive needed medications. Other medication management practices that we were unable to measure in this study, such as fail-first policies, may also require further examination. Likewise, due to data limitations, we were unable to measure Medicaid policies and practices that may influence the delivery of psychosocial and preventive health services. Given the poor rates of these services in many states, there is a need to determine if any state-specific Medicaid practices or mental health system characteristics facilitate or impede the delivery of these services. Finally, we found a particular need to focus on improving care for African American and transition-age beneficiaries.
There are several national and state initiatives aimed at improving the quality of care for Medicaid beneficiaries with SPMI. These include efforts to integrate behavioral and physical health services and bolster the adoption of EBPs through provider certification and reimbursement. Several resources described in this report provide Medicaid programs, state mental health agencies, and providers with technical assistance and guidance to establish reimbursement strategies and service systems that support the delivery of EBPs. As state and federal agencies work to improve the delivery of EBPs, they may wish to use these findings as a benchmark for future progress and use Medicaid claims data for continued monitoring of services.
Introduction and Rationale for the Project
Medicaid provides critical access to health and behavioral health care for individuals with serious and persistent mental illnesses (SPMI). More than half of Medicaid beneficiaries who are eligible on the basis of a disability are diagnosed with a mental illness--including schizophrenia and bipolar disorder (Kronick et al. 2009). Those beneficiaries with SPMI have a particularly high risk of disabling comorbid physical health conditions, substance abuse, frequent hospitalizations, and premature death.
Evidence-based practices (EBPs)--including medications, psychosocial services, and physical health care--help individuals with SPMI live successfully in the community and avoid negative health outcomes. A range of factors are likely to interact in a complex and dynamic manner to influence the receipt of EBPs. These factors include the demographic characteristics and treatment preferences of beneficiaries, providers awareness of and attitudes toward EBPs, and the organization and financing of service systems.
Because Medicaid pays for more mental health services than any other public or private payer in the nation, the program has a tremendous impact on the quality and outcomes of mental health services for a large and vulnerable population. Medicaid policies and practices have the potential to influence the receipt of EBPs. Despite the important role of Medicaid in paying for mental health services, little is known about the extent to which Medicaid beneficiaries with SPMI receive EBPs. There is also a need for information about the features of Medicaid programs and mental health systems that may facilitate or impede the receipt of EBPs. Such information would be useful in developing Medicaid policies and services systems to improve the quality of care for this population.
This project, conducted by Mathematica Policy Research for the Office of the Assistant Secretary for Planning and Evaluation (ASPE), U.S. Department of Health and Human Services, sought to answer the following three questions:
-
To what extent do Medicaid beneficiaries with schizophrenia and bipolar disorder receive medications, psychosocial services, and physical health care consistent with the latest evidence-based and recommended standards of care?
-
Is the receipt of EBPs associated with beneficiary demographic and health characteristics, including race/ethnicity, gender, age, and the presence of comorbid conditions?
-
What features of state mental health systems or Medicaid programs are associated with the receipt of EBPs for beneficiaries with schizophrenia and bipolar disorder?
Key program features noted in the third question include Medicaid policies and payment practices that may limit the circumstances under which a treatment is eligible for reimbursement, as well as broader delivery system characteristics, such as the financing and coordination of services. This project examined whether the receipt of certain EBPs was associated with the amount of funding controlled by state mental health agencies (SMHAs) and dedicated to community-based services, the managed care arrangements in states, and Medicaid practices that may restrict access to medications.
This project focused on beneficiaries with schizophrenia and bipolar disorder--a segment of the SPMI population for which there are several well-researched pharmacologic and psychosocial EBPs. The project began with a review of EBPs for schizophrenia and bipolar disorder. We then measured the extent to which beneficiaries received EBPs, using Medicaid claims data from 22 states. A technical advisory panel of clinicians, researchers, and policy experts guided the identification of EBPs and specification of measures and provided feedback on the analysis plan and the findings in this report.
This report summarizes key findings from the study. After providing a brief description of the data used for the study, we report the extent to which beneficiaries received EBPs and then describe state-to-state variation in the receipt of EBPs. We then report whether the receipt of EBPs was associated with beneficiary or state characteristics. In the final chapter, we discuss the implications of the findings and offer recommendations and resources states and others can use to improve the delivery of EBPs. A technical appendix to this report provides further detail on the methodology used for the study.
Data and Study Population
We used Medicaid Analytic Extract (MAX) files from calendar year 2007. The MAX files contain all inpatient (IP), outpatient, and pharmacy claims for Medicaid beneficiaries from each state and the District of Columbia. We investigated the service use of adult beneficiaries (ages 18-64) diagnosed with schizophrenia or bipolar disorder who were eligible for full Medicaid benefits on the basis of disability for at least 10 months in 2007, and who were not enrolled in any other sources of coverage--including Medicare. The analysis only included states that submitted complete fee-for-service (FFS) or managed care encounter claims in 2007. Twenty-two states had data sufficiently complete and reliable to include: Alabama, Alaska, California, Connecticut, the District of Columbia, Georgia, Idaho, Illinois, Indiana, Iowa, Louisiana, Maryland, Mississippi, Missouri, Nevada, New Hampshire, North Carolina, North Dakota, Oklahoma, South Dakota, West Virginia, and Wyoming.
The most significant data issue limiting the number of states in the analysis was missing or poor quality encounter data in states that used managed care to deliver services to disabled beneficiaries. Nearly two-thirds of the 29 states excluded from the study were dropped due to missing or unreliable encounter data. As of the time the 2007 MAX files were created, encounter claims were not subject the same validation process for completeness or reliability as FFS claims routinely undergo and the Centers for Medicare and Medicaid Services (CMS) did not recommend using these data for analysis. Nevertheless, a number of states reported encounter data that appeared to be complete and reliable in 2007, including at least one state (Iowa) that relied on managed care to deliver specialty mental health services. In six of the 22 states in the study, beneficiaries enrolled in some form of managed care were included in the analysis.
In comparison, relatively few states were excluded from the analysis due to problems in the completeness or reliability of FFS claims data. When states were excluded for problems with their FFS data, it was often the case that entire data files were missing or that mental health services specifically were missing due to special delivery and billing arrangements between Medicaid and other state agencies.1 Additionally, a number of states were excluded from the study due to unreliable identification of beneficiaries enrolled in managed care or private insurance on the enrollment file.2
The final analytic file included 143,710 beneficiaries. Based on the most frequent primary diagnosis during the year, 102,884 beneficiaries had a primary diagnosis of schizophrenia and 40,609 had a primary diagnosis of bipolar disorder.3 More information about the data and methodology used for the study, including specifications of our measures of EBPs, is included in the technical appendix at the end of this report. Given the limitations of using one calendar year of claims data, we did not seek to measure EBPs in terms of adherence to a strict clinical guideline or the degree to which a certain EBP was implemented with fidelity. Rather, we sought to measure whether beneficiaries received a minimal standard of care that is consistent with the evidence and measureable in claims data.
Receipt of Evidence-based Medications,psychosocial Services, and Physical Health CARE
Across states, most beneficiaries with schizophrenia or bipolar disorder received at least one evidence-based medication in 2007, but medication continuity and monitoring was poor. Few beneficiaries received a comprehensive physical examination or cancer screening. Finally, most received some type of psychosocial service, but the exact nature of those services is unclear. With the exception of psychotherapy, there were few claims for specific psychosocial EBPs, which may be due in part to states unique billing conventions, discussed below.
A. Medication Treatment and Monitoring
We examined whether beneficiaries had at least one claim for an evidence-based medication in 2007, which included any antipsychotic for schizophrenia and any antipsychotic, lithium, or certain evidence-based anticonvulsants (valproate, carbamazepine, or lamotrigine) for bipolar disorder. We also examined whether beneficiaries received these evidence-based medications for 80 percent of the days in which they were enrolled in Medicaid following the receipt of the first medication. Finally, because laboratory monitoring of certain medications is necessary to ensure that beneficiaries receive a therapeutic dose and avoid harmful side effects, we examined the extent to which beneficiaries with bipolar disorder who filled a prescription for lithium, valproate, or carbamazepine received regular monitoring of medication levels, as well as the extent to which beneficiaries who filled a prescription for an antipsychotic received screening for cardiovascular disease (cholesterol levels) and diabetes (glucose levels).
1. Receipt and Continuity of Evidence-Based Medications
a. Use and Continuity of Medications
Most beneficiaries with schizophrenia or bipolar disorder had at least one claim for an evidence-based medication in 2007. Ninety-two percent of beneficiaries with schizophrenia and 87 percent with bipolar disorder had at least one claim for an evidence-based medication. However, beneficiaries often failed to receive continuous medications. Among beneficiaries who received evidence-based medications, 64 percent of those with schizophrenia and 54 percent of those with bipolar disorder had a supply of evidence-based medications for at least 80 percent of the days enrolled in Medicaid following receipt of the first evidence-based medication (referred to hereafter as high medication continuity).
b. Depot Antipsychotics
While depot or injection antipsychotics are not necessarily considered to have a stronger evidence base than oral antipsychotics, some clinicians encourage the use of depot antipsychotics for individuals who have difficulty maintaining the use of oral antipsychotics (Kane 2011). Thus, we investigated the extent to which beneficiaries received depot antipsychotics and whether their use was associated with better medication continuity. Across all states in the study, only 10 percent (n=10,084) of beneficiaries with schizophrenia and 2 percent (n=884) with bipolar disorder received depot antipsychotics. Beneficiaries who received depot antipsychotics did not consistently have higher rates of medication continuity; in some states, continuity was higher among beneficiaries who received depot antipsychotics, while in others, continuity was lower among this group. These findings should be interpreted with caution, given the relatively small number of beneficiaries who received depot antipsychotics. In addition, the benefit of depot antipsychotics with respect to continuity may be observable beyond one year of data, or among different subpopulations.
c. Antidepressants for Bipolar Disorder
Bipolar disorder can be treated with a combination of medications that include mood stabilizers (lithium and anticonvulsants), antipsychotics, and antidepressants. The efficacy and safety of antidepressants in the absence of mood stabilizers or antipsychotics in the treatment of bipolar disorder remains controversial. This is because there is some evidence that the use of antidepressants alone may exacerbate mood swings. Across states, among beneficiaries with bipolar disorder who used an antidepressant continuously for at least 3 months, only 7 percent went 60 days or more without filling a concurrent prescription for lithium, valproate, carbamazepine, lamotrigine, or an antipsychotic.
2. Medication Monitoring
As mentioned above, certain antipsychotics may increase the risk for diabetes and cardiovascular disease. When we combined data across states, we found that fewer than half of beneficiaries who received antipsychotics were screened for metabolic side effects or cardiovascular disease in 2007: 43 percent received cholesterol monitoring to screen for cardiovascular disease, and 13 percent received glucose monitoring to screen for diabetes.4
Lithium and some anticonvulsants (valproate and carbamazepine) should be regularly monitored through blood tests to ensure that beneficiaries receive an appropriate dosage and avoid toxicity. Across states, 66 percent of beneficiaries with bipolar disorder who received lithium had a blood lithium test during 2007. Fifty-four percent of beneficiaries who received valproate had their valproate level monitored, while 49 percent of those who received carbamazepine had their carbamazepine level monitored.
B. Preventive Physical Health Services
Like other adults enrolled in Medicaid, beneficiaries with schizophrenia and bipolar disorder should receive basic preventive health services, such as periodic comprehensive exams or certain cancer screenings recommended for all adults of a certain age. Preventive health services are particularly important for this population in light of evidence that individuals with schizophrenia and bipolar disorder die 1-2 decades earlier than the general population (Laursen 2011). Premature death among this population is related to their increased prevalence of cardiovascular disease and diabetes (Hennekens et al. 2005) brought on by illness-related or genetic risk factors (Fleischhacker et al. 2008), obesity (Fontaine et al. 2001), smoking or other unhealthy behaviors (Tran et al. 2009), and side effects of certain antipsychotic medications (Newcomer 2005). Some studies have found that, compared with the general population, individuals with schizophrenia have twice the risk of developing metabolic syndrome, which increases their risk for future cardiovascular disease and diabetes (Cohn et al. 2004). There is also some evidence from smaller studies that older women with schizophrenia are less likely than those without schizophrenia to receive mammograms in the past 2 years (68 percent versus 98 percent) or a pelvic examination and Pap test in the past 3 years (71 percent versus 96 percent) (Lindamer et al. 2003).
We examined the extent to which Medicaid beneficiaries with schizophrenia or bipolar disorder received preventive health services during 2007. These included either a comprehensive physical examination or health behavior counseling (for example, smoking cessation or weight counseling). Only those procedure codes that clearly identified these services were used for the analysis. Thus, it is possible that our measure of preventive health services did not capture services that were delivered during medical visits for acute or chronic conditions but not billed separately as preventive health services.
We constructed measures to examine whether beneficiaries received cancer screening, which included colorectal cancer screening (colonoscopy) for men and women, and cervical (Pap smear) or breast (mammogram) cancer screening for women. These screenings were included in the measure of preventive health services rather than reported separately. Because the study used only 1 year of data, it was not possible to measure whether beneficiaries received guideline-concordant cancer screening (for example, screening that is to take place every few years).
When data was combined from all states, only 11 percent of beneficiaries with schizophrenia or bipolar disorder had a claim for a comprehensive physical examination or health behavior counseling in 2007. Some research suggests that Medicaid beneficiaries are about as likely as those with private insurance to receive a preventive physical health examination, with slightly less than one-quarter of adults in each group receiving an examination (Mehrotra, Zaslavsky, Ayanian 2007). Although the findings from this study are not directly comparable to Mehrotra et al. (2007) due to methodological differences in the way physical health examinations were measured, these findings may provide some preliminary evidence that disabled Medicaid beneficiaries with schizophrenia and bipolar disorder receive a physical examination less often than the overall Medicaid population,5 but further research is needed to examine differences between the population included in this study and other populations. Only 8 percent of men ages 50-64 with schizophrenia or bipolar disorder received a colonoscopy during 2007. Women were more likely to receive a cancer screening: 26 percent of all women with schizophrenia or bipolar disorder received screening for cervical cancer during 2007, and 15 percent between the ages of 41 and 64 received a mammogram. Eleven percent of women ages 50-64 received a colonoscopy in that year. When the definition of preventive health service was expanded to include recommended cancer screenings, 30 percent of beneficiaries received a cancer screening or comprehensive physical health examinations in 2007.
C. Psychosocial Services
Psychosocial services play an important role in helping beneficiaries with SPMI live successfully in the community, manage symptoms and medication side effects, and prevent relapse. Psychosocial services are heterogeneous and include a range of supports and therapies that vary considerably in their structure and duration.
When data was combined from all states, 73 percent of beneficiaries had at least one claim for some type of psychosocial service in 2007.6 However, this varied across states and the exact nature of these services is somewhat unclear in claims data. Some of the claims for psychosocial services are for specific EBPs, while the specific service being reimbursed using other claims is uncertain, as described below.
Based on a review of the literature and input from our advisory panel, the psychosocial services for schizophrenia and bipolar disorder with both the strongest evidence base and Medicaid billing codes include assertive community treatment (ACT), cognitive behavioral therapy (CBT), family therapy/psychoeducation, skills training, supportive employment, and psychotherapy.7 Identifying these psychosocial EBPs in Medicaid claims is difficult because billing codes for psychosocial services often lack specificity. For example, one state may use a billing code that clearly reimburses ACT while another state may reimburse ACT using a less specific billing code, labeled as “community support services.” Using claims data alone, we were unable to determine whether these nonspecific billing codes indeed are used for EBPs. Thus, state-to-state comparisons of the receipt of psychosocial EBPs using claims data alone can be misleading. In addition, psychosocial EBPs could be billed and paid as part of a larger bundled mental health service. For example, in some states, a beneficiary could receive CBT during a partial hospitalization visit.
We conducted an extensive review of national and state-specific billing codes used for psychosocial services. We identified nearly 50 national Current Procedural Terminology (CPT), Healthcare Common Procedure Coding System (HCPCS), or International Classification of Diseases (ICD) codes used for psychotherapy, and between 2 and 8 codes for ACT, CBT, family therapy or psychoeducation, skills training, and supported employment. Most states used some state-specific codes for psychosocial services, but the specific nature of the services being reimbursed was unclear for most codes, so it was not possible to determine whether the code was used to reimburse one of the psychosocial EBPs under investigation. Additionally, despite the large number of state-specific billing codes available for some psychosocial EBPs in some states, there was little correlation between the receipt of an EBP and the number of codes available. For example, one state had 127 state-specific codes that could be used for psychotherapy, but none of them actually were used for claims in 2007.
Given the limitations in identifying specific psychosocial EBPs, it is perhaps not surprising that there were few claims for psychosocial EBPs, with the exception of psychotherapy.8 When data were combined from all states, 59 percent of beneficiaries received at least one identifiable psychosocial EBP in 2007; most of those services were for some type of psychotherapy. Fifty-two percent of beneficiaries with schizophrenia and 60 percent of those with bipolar disorder had at least one identifiable claim for psychotherapy during 2007. Depending on the service, between 3 percent and 5 percent of beneficiaries had an identifiable claim for ACT, family therapy/psychoeducation, or skills training. Less than 1 percent of beneficiaries had an identifiable claim for supported employment or CBT. Again, the low number of claims for these services may be due, in part, to the lack of specificity of state Medicaid billing codes.
The difference in the proportion of beneficiaries who received a psychosocial EBP versus any psychosocial service is attributable both to the lack of specificity in billing codes to identify EBPs and the delivery of mental health services not considered EBPs (Table 1). In some states, the difference is small, whereas in others it is quite large. Nonetheless, in several states, 25-50 percent of beneficiaries did not have a claim for any psychosocial services.
|
State |
Proportion of Beneficiaries Who Received |
Difference |
|
|---|---|---|---|
|
Any Psychosocial EBP |
Any Psychosocial Service |
||
| All states (excluding CA) | 59.0 | 73.0 | 14.0 |
|
SOURCE: MAX data, calendar year 2007. NOTES: Any EBP includes claims for psychotherapy, family therapy, skills training, ACT, supported employment, and CBT. Any psychosocial service includes all claims for EBPs, plus other ambulatory mental health services except medication management, testing, or assessment. Most claims for any psychosocial EBP are for psychotherapy. |
|||
| CA | 1.0 | 82.5 | 81.6 |
| DC | 31.7 | 87.2 | 55.5 |
| SD | 35.1 | 73.7 | 38.6 |
| MO | 45.2 | 71.3 | 26.1 |
| OK | 49.4 | 75.0 | 25.6 |
| ID | 62.7 | 87.7 | 25.0 |
| NH | 60.7 | 85.6 | 24.9 |
| NC | 55.0 | 79.2 | 24.1 |
| GA | 65.8 | 82.2 | 16.5 |
| WY | 68.7 | 84.6 | 15.9 |
| AL | 71.3 | 84.5 | 13.2 |
| IL | 62.3 | 73.9 | 11.7 |
| IA | 53.2 | 62.3 | 9.1 |
| WV | 43.3 | 50.9 | 7.6 |
| MS | 61.2 | 68.3 | 7.1 |
| IN | 74.4 | 78.6 | 4.1 |
| MD | 77.4 | 81.3 | 3.9 |
| CT | 46.5 | 48.6 | 2.1 |
| AK | 69.8 | 71.8 | 2.0 |
| NV | 75.6 | 77.6 | 1.9 |
| LA | 53.0 | 53.9 | 0.8 |
| ND | 45.0 | 45.4 | 0.3 |
D. Receipt of Multiple EBPs
Ideally, beneficiaries with schizophrenia or bipolar disorder should receive a continuous supply of evidence-based medications, psychosocial services, and laboratory monitoring of medication levels (for lithium and certain anticonvulsants) or common physical complications (for antipsychotics).
More than half (57 percent) of beneficiaries with schizophrenia had high medication continuity, and 45 percent also received at least one psychosocial service during the year. However, few received recommended screenings for cardiovascular disease and diabetes; taking these screenings into account, roughly 5 percent of beneficiaries with schizophrenia received all of these services during the year (Figure 1).
Forty-five percent of beneficiaries with bipolar disorder had high medication continuity, and 35 percent also received at least one psychosocial service. As was the case for beneficiaries with schizophrenia, few beneficiaries with bipolar disorder (about 5 percent) received all of these services.
FIGURE 1. Receipt of Multiple EBPs by Medicaid Beneficiaries with Schizophrenia and Bipolar Disorder, 2007
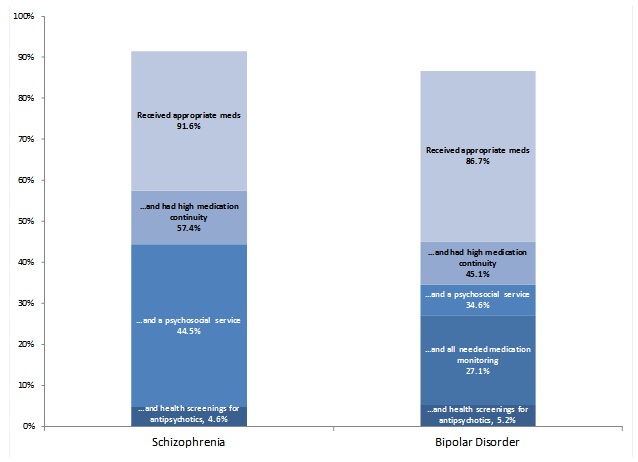
SOURCE: MAX data, calendar year 2007.
Variation in Receipt of Evidence-based Practices by Beneficiary Characteristics
Identifying differences in the receipt of EBPs among certain groups of beneficiaries may help to target quality improvement efforts. Past research has identified disparities in the quality of care related to geography, race/ethnicity, and age. For example, those who live in rural or medically underserved areas may have more difficulty in accessing services. In addition, due to more recent onset of symptoms and other developmental challenges, younger beneficiaries may experience greater difficulty initiating and maintaining medications and engaging in other services. Finally, racial/ethnic differences in the receipt of services may be due to provider biases in treatment practices or racial/ethnic differences in attitudes or beliefs about certain treatments.
In this chapter, we describe the extent to which beneficiary race/ethnicity, gender, age, residence in a rural area, or residence in a physician or mental health provider shortage area was associated with the receipt of EBPs.
A. Variance in Medication Use, Continuity, and Monitoring by Beneficiary Characteristics
Medication continuity was poorer among beneficiaries who were younger, African American, or had a comorbid substance abuse disorder (Table 2). In multivariate models, these differences were statistically significant after controlling for a range of other Medicaid program and mental health system characteristics, described in the next chapter. In bivariate analyses, medication continuity did not substantially differ by beneficiary gender or residence in a rural area and was only slightly lower for beneficiaries living in a mental health provider shortage area. Any medication use, measured as having at least one claim for an evidence-based medication, was not associated with beneficiary characteristics.
Among beneficiaries who received antipsychotics, those who were African American were the least likely to receive screening for cardiovascular disease and diabetes (Figure 2). African Americans were also less likely to receive monitoring of lithium and valproate. Hispanic beneficiaries had lower rates of medication monitoring for lithium and valproate, but slightly higher rates of cardiovascular and glucose screening for antipsychotic use.
|
Beneficiary Characteristics |
Proportion with High Medication Continuity |
|---|---|
| All beneficiaries with schizophrenia or bipolar disorder | 61.4 |
| Race or ethnicity | |
| African American | 51.0 |
| Caucasian | 67.0 |
| Hispanic | 62.1 |
| Other/Unknown | 67.5 |
| Age | |
| 18-24 | 52.8 |
| 25-30 | 56.4 |
| 31-40 | 57.7 |
| 41-50 | 60.8 |
| 51-60 | 67.8 |
| 61-64 | 74.0 |
| Comorbid conditions | |
| Substance abuse | 46.0 |
| Cardiovascular disease | 61.1 |
| Diabetes | 69.3 |
|
SOURCE: MAX data, calendar year 2007. NOTE: We measured high medication continuity as the beneficiary receiving an evidence-based medication for at least 80 percent of days enrolled in Medicaid in the calendar year following the first receipt of that medication. |
|
Older beneficiaries were more likely to receive screening for cardiovascular disease but not diabetes. Gender was not systemically associated with screening for cardiovascular disease or diabetes. Age and gender were not associated with monitoring of lithium or anticonvulsants. Living in a physician or mental health provider shortage or rural area was not clearly associated with medication monitoring or health screening in bivariate analyses.
As illustrated in Table 3, among beneficiaries with schizophrenia who received antipsychotics, a larger proportion of those who were African American or younger received depot antipsychotics, compared with their older or Caucasian counterparts. The receipt of depot antipsychotics did not differ substantially by beneficiary gender, rural residence, or residence in a mental health provider or physician shortage area. The small sample size did not allow for an examination of whether the receipt of depot antipsychotics was associated with specific beneficiary characteristics.
FIGURE 2. Proportion of Medication Users Who Received Recommended Medication Monitoring or Health Screenings, by Race and Ethnicity
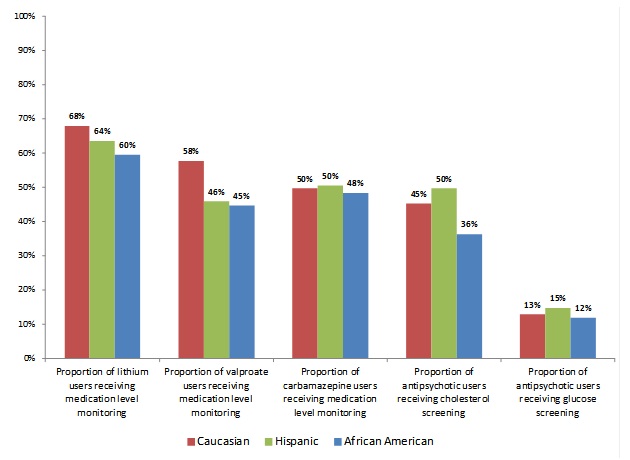
SOURCE: MAX data, calendar year 2007.
|
Beneficiary Characteristic |
Proportion with Schizophrenia Who Received Depot Antipsychotics |
|---|---|
| All beneficiaries with schizophrenia who received antipsychotics | 10.7 |
| Race or ethnicity | |
| African American | 12.9 |
| Caucasian | 9.6 |
| Hispanic | 8.7 |
| Other/Unknown | 8.9 |
| Age | |
| 18-24 | 13.2 |
| 25-30 | 13.0 |
| 31-40 | 10.3 |
| 41-50 | 10.5 |
| 51-60 | 9.8 |
| 61-64 | 9.3 |
B. Variation in Receipt of Preventive Health Services by Beneficiary Characteristics
A slightly higher proportion of female beneficiaries with schizophrenia or bipolar disorder received a comprehensive health examination or health behavior counseling, compared with male beneficiaries (14 percent of women versus 9 percent of men).
There were no substantial differences in the receipt of preventative health services or cancer screening by beneficiary residence in an area with a primary care or mental health provider shortage.
C. Variation in Receipt of Psychosocial Services by Beneficiary Characteristics
Given the low number of specific psychosocial EBPs in claims, the findings reported here indicate whether the receipt of psychotherapy or any psychosocial services differed by beneficiary characteristics.
Across states, younger beneficiaries were slightly more likely to receive any psychosocial service. For example, 78 percent of beneficiaries ages 18-24 received some type of psychosocial service, compared with 66 percent of beneficiaries ages 60-64. Likewise, a higher proportion of younger beneficiaries received psychotherapy.
African Americans were only slightly less likely than Caucasians to receive psychotherapy (53 percent versus 57 percent) but they were not less likely to receive any psychosocial services.
Receipt of psychotherapy or any psychosocial services was unrelated to gender, the presence of comorbid conditions, or living in a rural area or an area with a physician or mental health provider shortage.
State Variation in Receipt of Evidence-based Practices
Differences between states in the receipt of EBPs could be attributable to underlying differences in the demographic characteristics of state Medicaid populations, differences in structures or orientation of service systems, or specific Medicaid policies and practices that could limit reimbursement of a particular EBP. In this chapter, we describe state-to-state variation in the receipt of EBPs. We used descriptive and multivariate statistics to identify the features of state mental health service systems and Medicaid programs associated with this variation, and the likelihood that an individual beneficiary received services.
Our analysis of state Medicaid program or mental health system characteristics focused on state features that could be directly measured using MAX data or reliably constructed using secondary data sources. Thus, we focused on three main state features: (1) enrollment in managed care, (2) Medicaid prescription drug (RX) policies, and (3) funding for community-based mental health services. Table 4 summarizes the features of states and the size of the study population affected by a particular state feature.
Managed Care. Enrollment in managed care was measured directly using MAX data. As shown in Table 4, 13 percent of the study population located in three states was enrolled in an HMO for part or all of the year. Over 60 percent of beneficiaries in our study who were enrolled in an HMO lived in California, 37 percent lived in Maryland, and 2 percent lived in Indiana. Eight percent of the study population was enrolled in another form of managed care, such as a behavioral health organization (BHO), prepaid IP hospital plan, or primary care case management (PCCM) program. However, in these states, nearly the entire study population was enrolled in managed care, preventing an in-state comparison of managed care enrollees to beneficiaries in the FFS system. In sum, a relatively small proportion of the study population was enrolled in managed care in a few states, so readers should be cautious when drawing conclusions about managed care. The findings may differ if the data included a larger population of beneficiaries enrolled in managed care across many states.
Medicaid RX Policies. Medicaid RX policies were measured using data from the National Pharmaceutical Council. These policies included the state’s use of prior authorization policies for antipsychotics, anticonvulsants, or antidepressants; limits on medication quantity supplies and refills; and copayment requirements for RXs. Most beneficiaries lived in a state without prior authorization requirements or restrictive medication supply or refill limits (Table 4). Nearly one-quarter of the study population (24 percent) lived in a state with a three-dollar copayment for preferred or generic drugs, while 49 percent of the population lived in a state with a three-dollar copayment for nonpreferred or branded medications.
|
State Policy or Characteristic |
Number of States with Policy or Characteristics |
Beneficiaries with Schizophrenia or Bipolar Disorder Affected byPolicy or Characteristic |
|
|---|---|---|---|
|
Number |
Proportion |
||
| SOURCES: The National Pharmaceutical Council, for Medicaid medication management and copayment information. National Research Institute (NRI), for data on the proportion of SMHA funding used for community-based services. MAX provided managed care enrollment data for each beneficiary. | |||
| Total | 22 | 143,710 | 100 |
| Managed Care Arrangements | |||
| No managed care (FFS system) | 16 | 113,761 | 79 |
| Enrolled in HMO | 3 | 18,243 | 13 |
| Enrolled in BHO | 1 | 2,164 | 2 |
| Enrolled in PCCM | 1 | 4,023 | 3 |
| Enrolled in prepaid IP hospital program | 1 | 5,519 | 4 |
| Prior Authorization for Mental Health Medications | |||
| No prior authorization required | 14 | 113,111 | 79 |
| Required for antipsychotics | 4 | 13,513 | 9 |
| Required for antidepressants | 8 | 30,599 | 21 |
| Required for anticonvulsants | 3 | 5,989 | 4 |
| Monthly Medication Supply Limit | |||
| Limited to 31 days or less | 5 | 16,776 | 12 |
| Supply limit greater than 31 days | 17 | 126,934 | 88 |
| Limit on Refills per Prescription | |||
| Six or fewer | 2 | 9,763 | 7 |
| More than six | 20 | 133,947 | 93 |
| Beneficiary Copayment for Generic or Preferred Medications | |||
| None | 6 | 24,761 | 17 |
| $0.50-$1 | 7 | 71,137 | 50 |
| $2 | 3 | 13,478 | 9 |
| $3 | 6 | 34,334 | 24 |
| Beneficiary Copayment for Branded or Nonpreferred Medications | |||
| None | 3 | 6,721 | 5 |
| $1 | 2 | 52,413 | 36 |
| $2 | 4 | 14,132 | 10 |
| $3 | 13 | 70,444 | 49 |
| Proportion of SMHA Funding Used for Community-Based Services | |||
| 0-25% | 0 | 0 | 0 |
| 26-50% | 4 | 19,610 | 14 |
| 51-75% | 14 | 62,403 | 43 |
| 76-100% | 4 | 61,697 | 43 |
Funding for Community-Based Mental Health Services. The orientation of the state mental health system toward community-based versus institutional or hospital-based services (as indicated by financing levels), as well as the relationship between Medicaid and SMHAs, was measured using data from a 2007 survey of state mental health directors conducted by the National Association of State Mental Health Program Directors, NRI. As shown in Table 4, 43 percent of beneficiaries in the study lived in one of the four states where more than three-quarters of state mental health system funding was used to provide community-based services.
There are several features of states that could influence the receipt of EBPs but for which we did not have a reliable or authoritative source in 2007. These features include detailed information on the type and scope of mental health benefits covered for adults in each state, limitations on the number or duration of mental health services, and the qualifications required for individuals or organizations to enroll in the program as mental health providers. While information is available on whether states covered certain mental health services in 2007, in general it tended to lack sufficient detail to allow for adequate differentiation between states in the generosity and accessibility of their mental health benefit. Finally, the characteristics of Medicaid providers could not be measured using MAX data. These unmeasured variables could confound the findings and thus these findings should be interpreted cautiously.
We conducted state-level analyses to examine the relationship between certain state features and the proportion of beneficiaries who received an EBP. When there was sufficient variation and reliably collected explanatory variables, we conducted person-level random effects multivariate analyses to further examine whether any beneficiary, SMHA, or Medicaid program characteristics were associated with the receipt of EBPs.
A. State Variation in the Use and Continuity of Appropriate Medications
1. Medication Use and Continuity
While we found little variation between states in the proportion of beneficiaries who received appropriate medications (in every state at least 80 percent of beneficiaries with schizophrenia or bipolar disorder had at least one claim for an evidence-based medication), there was wide variation in the proportion of beneficiaries with high medication continuity (Figure 3). The proportion of beneficiaries with high medication continuity ranged from more than 80 percent in North Dakota to less than 50 percent in the District of Columbia and Mississippi.
Underlying differences in the demographic characteristics of state Medicaid populations explains some of the state variation in medication continuity. For example, many of the states with the lowest rates of medication continuity had a higher-than-average proportion of African American beneficiaries, who tend to have worse rates of medication continuity. To examine the extent to which state variation in medication continuity reflected differences in state demographic characteristics, we standardized the proportion of beneficiaries with high medication continuity in each state to account for age, gender, and race/ethnicity. The adjusted rate of medication continuity used the observed rates of medication continuity for each demographic group in the state, but applied the rates to a population with the same demographic composition as the entire study population in all 22 states. Thus, the adjusted rate reflects the expected rate for a state if the beneficiaries in that state had more closely resembled the entire study population. Using this technique, we found that while the proportion of beneficiaries who were female or older varied between states that variation had little to no effect on the proportion of beneficiaries in a state with high medication continuity. After adjusting the medication continuity rates to account for state differences in race and ethnicity, some states such as Alabama, Maryland, and Mississippi had slightly better rates of medication continuity whereas some states, including Oklahoma and Nevada, had worse rates of medication continuity. Other states such as the District of Columbia, Louisiana, and New Hampshire saw an improvement in continuity rates of between 5 and 10 percentage points once the measure was standardized to account for differences in race and ethnicity. However, states with below average rates of medication continuity remained below average while those with above average rates remained above average even after adjusting for demographic characteristics. Thus, differences in medication continuity in Figure 3 do not only reflect differences in state demographic characteristics.
FIGURE 3. Gap Between Proportion of Medicaid Beneficiaries with Continuous Use and Any Use of Appropriate Medications in 2007, by State
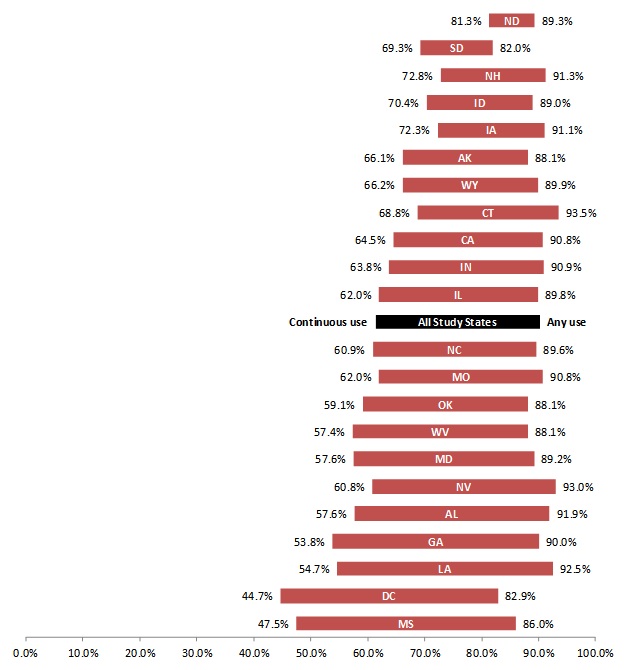
SOURCE: MAX data, calendar year 2007.
States differed in the proportion of beneficiaries with schizophrenia who received depot antipsychotics in 2007. At the low end, only 2 percent of beneficiaries in the District of Columbia received depot antipsychotics in 2007, whereas 20 percent received depot antipsychotics in Alabama. However, the variation in depot medication use did not appear related to medication continuity within a state. Due to a small sample size, we did not examine state variation in depot antipsychotics for bipolar disorder.
Medication continuity was associated with the region of the country, with states in the South Census region having the lowest proportion of beneficiaries with high medication continuity. Figure 4 illustrates that states in the South consistently scored below the median on our measure of medication continuity (states in the bottom left quadrant of the figure have the worst medication continuity, while those in the upper right quadrant have the best).
FIGURE 4. Medication Continuity Among Medicaid Beneficiaries with Schizophrenia or Bipolar Disorder in 2007, by Census Region
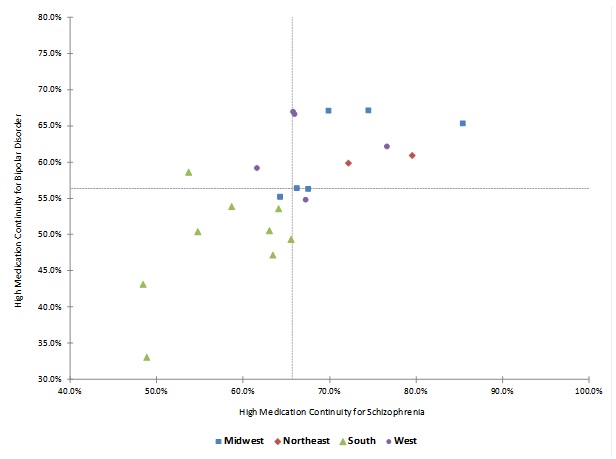
SOURCE: MAX data, calendar year 2007.
NOTE: Dotted lines indicate median value among all 22 states in the study.
This finding could be attributable to systematic differences in the funding or orientation of state mental health systems in different regions of the country; states in the South Census region had a lower proportion of total state mental health funding dedicated to providing services in the community (Table 5). It also might be related to other unmeasured differences between states that vary regionally.
|
Median per capita SMHA Spending on All Services ($) |
Median Percentage ofFunding Spent on Community-Based Services |
Median per capitaSMHA Spending on Community-Based Services ($) |
|
|---|---|---|---|
| SOURCE: NRI Revenue and Expenditure Reports, FY 2007. | |||
| All regions | 86 | 64 | 56 |
| Midwest | 85 | 66 | 57 |
| Northeast | 153 | 64 | 96 |
| South | 74 | 52 | 46 |
| West | 100 | 65 | 61 |
Given that a beneficiary may live in a state with several different medication policies, we further examined the relationship of these variables with medication continuity using random effects regression analyses to model the odds that an individual had high medication continuity as a function of several beneficiary and state characteristics (the full regression models are presented in Table A.10 of the technical appendix).9 These exploratory regression analyses were conducted to identify factors that may be associated with medication continuity while controlling for other factors. However, this study was not able to measure every beneficiary, state, or Medicaid program characteristic that could influence medication continuity. Therefore, the regression findings should be interpreted cautiously since other unmeasured state or beneficiary characteristics may be associated with medication continuity.
For beneficiaries with schizophrenia, the regression results suggested that a two-dollar copayment for preferred or generic medications (Odds Ratio [OR]): 0.45; 95 percent Confidence Interval [CI]: 0.27-0.76) or a $3 copayment (OR: 0.73; 95 percent CI: 0.57-0.94) versus no copayment were inversely associated with high medication continuity. In addition, a $1 copayment for branded medications (OR: 0.62 95 percent CI: 0.41-0.95) compared with no copayment was inversely associated with medication continuity whereas $2-$3 copayments were not. It may be that states exempt certain branded medications used for schizophrenia from these higher copayment requirements, but we cannot determine that using claims data alone. These findings suggest that a beneficiary with schizophrenia living in a state with no medication copayment requirement for generic medications who had a 70 percent probability of high medication continuity given his age, race, and co-occurring conditions, would have only a 63 percent probability of high medication continuity in a state that was otherwise similar with respect to the Medicaid and mental health system characteristics that we controlled for in the model but that required a copayments of $3. It is possible that beneficiaries could acquire medications outside of Medicaid-funded programs if faced with the challenge of paying a copayment. Nonetheless, these findings suggest that living in a state with a higher copayment for generic drugs was associated with a higher likelihood of medication interruptions.
The regression results also suggested that enrollment in an HMO was inversely associated with medication continuity (OR: 0.72; 95 percent CI: 0.67-0.75), but these findings should be interpreted with caution because few HMOs were included in the study. The regression confirmed the descriptive findings in that beneficiaries who were African American (OR: 0.45; 95 percent CI: 0.44-0.47), Hispanic (OR: 0.69; 95 percent CI: 0.66-0.73), or another or unidentified race and ethnicity (OR: 0.87; 95 percent CI: 0.83-0.91) had significantly lower odds of medication continuity compared with nonHispanic Caucasian beneficiaries. The presence of substance abuse disorder or cardiovascular disease was inversely associated with medication continuity, whereas the presence of diabetes was positively associated with medication continuity. Also consistent with the bivariate findings, a 1 year increase in age was associated with slightly better medication continuity. Controlling for other variables in the model, medication continuity was slightly worse among beneficiaries who lived in a county that was designated as a mental health provider shortage area (OR: 0.94; 95 percent CI: 0.92-0.98). Medication continuity was slightly better among beneficiaries who had at least one claim for a psychosocial service (OR: 1.07; 95 percent CI: 1.04-1.11), Finally, controlling for other variables in the model, medication continuity was better among beneficiaries who lived in states in which a higher percentage of state mental health funding was dedicated to community-based services rather than institutional care (OR: 1.06; 95 percent CI: 1.01-1.11).
We conducted similar multivariate analysis to model the odds of high medication continuity among beneficiaries with bipolar disorder.10 The regression results suggested that the number of prior authorization policies for different classes of mental health drugs (antidepressants, antipsychotics, and anticonvulsants) was inversely associated with high medication continuity such that the odds of medication continuity slightly decreased with each additional prior authorization requirement (OR: 0.90; 95 percent CI: 0.82-1.003), although this was only marginally statistically significant (p=0.058). Copayment amounts for generic medications were not statistically associated with medication continuity whereas, similar to our finding for beneficiaries with schizophrenia, a $1 copayment requirement for branded medications was inversely associated with medication continuity (OR: 0.52; 95 percent CI: 0.31-0.92). Copayment amounts may have a weaker relationship with medication continuity for bipolar disorder versus schizophrenia because of differences in the populations. Individuals with bipolar disorder may be able to maintain their functional status, employment, and relationships for longer periods of time than those with schizophrenia--which may provide them with more resources to pay for their medications. The medications used for bipolar disorder are also different from the medications for schizophrenia; states may exempt some medications for bipolar disorder from copayments but we do not have that detailed information.
As was the case with schizophrenia, medication continuity was inversely associated with enrollment in an HMO (OR: 0.79; 95 percent CI: 0.73-0.86) or the presence of a comorbid substance abuse diagnosis (OR: 0.49; 95 percent CI: 0.46-0.53) or cardiovascular disease (OR: 0.86; 95 percent CI: 0.77-0.96) while being positively associated with diabetes (OR: 1.37; 95 percent CI: 1.28-1.46). It may be that beneficiaries with diabetes have more regular contact with the health care system and thus more opportunities to receive their medications. Conversely, those beneficiaries with high medication continuity but poor medication monitoring may be more prone to developing diabetes. We cannot determine the direction of the relationship between the presence of comorbid conditions and medication continuity using a single year of cross-sectional claims data. Finally, similar to our findings for beneficiaries with schizophrenia, those beneficiaries with bipolar disorder who had at least one claim for a psychosocial service were slightly more likely to have high medication continuity (OR: 1.13; 95 percent CI: 1.07-1.20)
Both regression models for schizophrenia and bipolar disorder originally controlled for whether the state Medicaid program had monthly medication supply or refill limits. These variables were not statistically associated with medication continuity and were therefore excluded to develop the most parsimonious models. Their exclusion did not change the statistical significance, direction, or magnitude of the other coefficients. However, the lack of a statistical relationship should not be interpreted to imply that these Medicaid program characteristics are unimportant; we may have lacked enough variation to detect a relationship or these variables could have been measured imperfectly.
Given that beneficiaries in California accounted for 35 percent of the entire study population and 6o percent of beneficiaries in the sample who were enrolled in HMOs, we conducted sensitivity analyses to repeat these regression analyses excluding California. The direction, magnitude, and statistical significance of the coefficients did not substantially change when beneficiaries from California were excluded. HMO enrollment, in particular, was still inversely associated with high medication continuity, suggesting that the large number of beneficiaries from California in the study were not solely driving the findings. Nonetheless, the study included relatively few beneficiaries enrolled in HMOs from a few states such that the findings must be interpreted with caution. Finally, as previously mentioned, the study did not have reliable measures of every beneficiary, mental health system, or Medicaid program characteristic that could influence medication continuity. There may be unmeasured systematic differences between states that could confound the results. These exploratory findings point to certain Medicaid policies and features of mental health systems that may facilitate or impede medication continuity. Further research is needed to replicate these findings and understand the dynamic and complex way in which beneficiary, mental health system, and Medicaid program characteristics interact at the state level to potentially influence medication continuity as well as the receipt of other EBPs.
We considered including a variable in the model to serve as a proxy for the relationship between the state Medicaid and mental health agency to examine whether the strength of the relationship between the two agencies was associated with the delivery of EBPs. Unfortunately, the only variable that we could find from 2007 (the year of our claims data) to serve as a weak proxy for this relationship was from a survey conducted by NRI and available online through the NRI State Mental Health Agency Profiling System, which asked SMHA directors to report whether the state Medicaid and mental health agency “combined or coordinated funding.” This variable did not indicate whether the combining or coordination of funding was directed toward EBPs and we did not have any further information from the survey to contextualize or describe the specific nature of how or in what manner funding was combined or coordinated in each state. Thus, this variable could have different interpretations or meanings for each state. In addition, this variable was missing for the District of Columbia and two states (Mississippi and Missouri) in our study, which would require that these states to be dropped from the analysis if this variable was included in the regressions. Omitting these states would result in a sizeable reduction of our sample--9.7 percent of beneficiaries with schizophrenia and 13.6 percent of beneficiaries with bipolar disorder. Finally, this variable lacked variability among the remaining states. The seven states that did not coordinate or combine funding included Alaska, California, Idaho, Illinois, South Dakota, West Virginia, and Wyoming. With the exception of California and Illinois, these states have a small number of beneficiaries with schizophrenia or bipolar disorder, and therefore, in the context of these regression analyses, this variable may be functioning as a proxy for California and Illinois rather than serving as a true measure of whether states combine or coordinate funding. When we attempted to include this variable in the regressions, we found that it produced unstable estimates that changed in direction and statistical significance. We also did not see a clear relationship between medication continuity and whether the Medicaid and mental health agencies combined or coordinated funding in bivariate analyses. Given these limitations, we did not include this variable in our final regression models. There may be opportunities in future research to develop or include better measures of the degree to which Medicaid and mental health agency collaboration influences the delivery of EBPs.
FIGURE 5. Proportion of Medication Users in Each State Receiving Recommended Medication Monitoring or Health Screening in 2007
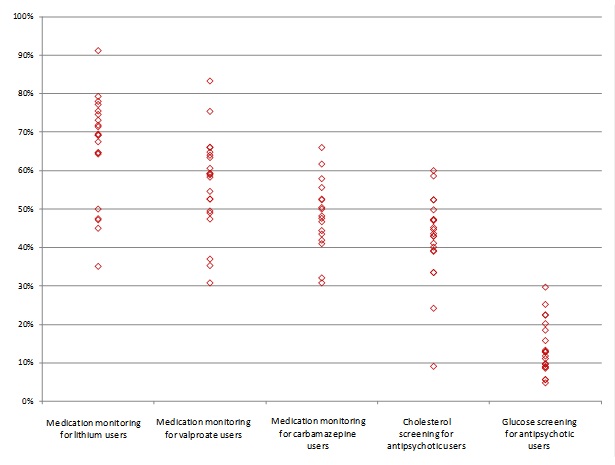
SOURCE: MAX data, calendar year 2007.
NOTES: Each diamond in the figure represents the proportion of beneficiaries in a state who received medication monitoring.
2. Medication Monitoring for Lithium and Anticonvulsants
We found a two to three-fold difference between states with the highest and lowest rates of medication monitoring for lithium and evidence-based anticonvulsants (carbamazepine and valproate) (Figure 5). In states with the poorest rates of medication monitoring, between one-fifth to one-third of beneficiaries with bipolar disorder who received the medication were monitored (Table 6). However, the proportion of beneficiaries who received monitoring tended to cluster; depending on the state, between 65 percent and 80 percent of beneficiaries on lithium received lithium monitoring, 40 percent and 60 percent of those on carbamazepine received carbamazepine monitoring, and 45 percent and 65 percent of those on valproate received valproate monitoring during 2007.
|
State |
Percent of Anticonvulsant Users Receiving Medication Monitoring |
Percent of Antipsychotic Users Receiving Health Screenings |
||||
|---|---|---|---|---|---|---|
|
Lithium Users |
Valproate Users |
Carbamazepine Users |
Cholesterol Screening |
Glucose Screening |
||
| Median | 69.2 | 58.9 | 50.0 | 43.6 | 12.8 | |
|
SOURCE: MAX data, calendar year 2007. NOTE: Data from Maryland is not displayed, as very low rates of medication monitoring and health screenings may be a result of missing laboratory encounter data for HMO enrollees. Rates are not displayed when fewer than ten beneficiaries used the medication in 2007. |
||||||
| AK | 45.0 | 35.3 | n.r. | 33.5 | 8.6 | |
| AL | 67.5 | 58.9 | 52.4 | 43.6 | 15.8 | |
| CA | 64.6 | 52.6 | 50.4 | 52.4 | 13.3 | |
| CT | 79.3 | 60.6 | 47.6 | 40.1 | 29.7 | |
| DC | 35.1 | 30.8 | 30.8 | 44.7 | 5.6 | |
| GA | 71.8 | 59.3 | 48.2 | 9.1 | 5.7 | |
| ID | 75.5 | 52.6 | 41.9 | 47.2 | 9.0 | |
| IL | 47.2 | 37.0 | 41.0 | 24.2 | 9.6 | |
| IN | 69.5 | 66.1 | 52.6 | 47.3 | 18.5 | |
| IA | 77.2 | 66.0 | 32.1 | 41.1 | 20.2 | |
| LA | 78.0 | 64.0 | 66.0 | 47.0 | 12.8 | |
| MD | n.r. | n.r. | n.r. | n.r. | n.r. | |
| MS | 69.2 | 59.2 | 50.0 | 39.2 | 11.8 | |
| MO | 64.3 | 54.6 | 44.4 | 43.0 | 9.8 | |
| NC | 74.6 | 64.8 | 61.7 | 52.4 | 11.1 | |
| ND | 50.0 | 83.3 | n.r. | 60.0 | 22.4 | |
| NH | 91.2 | 75.4 | 46.7 | 58.6 | 22.5 | |
| NV | 47.5 | 49.5 | 43.5 | 42.9 | 8.9 | |
| OK | 64.7 | 49.0 | 55.6 | 39.0 | 12.9 | |
| SD | 69.2 | 47.4 | n.r. | 45.2 | 25.2 | |
| WV | 73.1 | 63.4 | 57.9 | 49.8 | 13.0 | |
| WY | 71.4 | 58.3 | n.r. | 33.5 | 4.8 | |
Although we had few beneficiaries enrolled in managed care, we did observe that in two of the three states (California and Indiana) where beneficiaries were enrolled in an HMO, beneficiaries enrolled in managed care had lower rates of medication monitoring than those not enrolled. For example, among valproate users in California, 45 percent of those enrolled in an HMO received laboratory tests to monitor medication levels, compared to 55 percent of beneficiaries who were not enrolled in managed care for any part of the year. Similarly, in Indiana 50 percent of HMO enrollees using valproate received medication monitoring compared to 67 percent not enrolled in an HMO. Medication monitoring rates for other anticonvulsants displayed a similar pattern. In the third state (Maryland), potentially missing data among beneficiaries enrolled in managed care prevented us from reliably measuring medication monitoring.
3. Screenings for Diabetes and Cholesterol Among Beneficiaries Receiving Antipsychotics
There was a six-fold difference between states with the highest and lowest rates of cardiovascular and glucose screening for beneficiaries who received antipsychotics (Figure 5). With the exception of a few states, between 40 percent and 60 percent of beneficiaries on antipsychotics received a cholesterol screening in 2007. Rates of glucose monitoring among those who received antipsychotics was much lower, ranging from 5 percent to 30 percent depending on the state.
States that performed best on medication monitoring for lithium and anticonvulsants also tended to perform quite well on screenings for beneficiaries receiving antipsychotics. The relationship between managed care enrollment and medication monitoring was unclear. In California and Indiana, antipsychotic users not enrolled in an HMO were respectively 8 and 13 percentage points more likely to receive a cholesterol screening than those in an HMO. However, antipsychotic users in an HMO were respectively 6 and 2 percentage points more likely to receive a glucose screening. Conclusions cannot be drawn from managed care enrollees in Maryland, due to missing data.
B. State Variation in Receipt of Preventive Physical Health Services
The proportion of beneficiaries who received a comprehensive health examination in 2007 was generally low in every state, with less than one-third in each state receiving an examination. However, in three states (Alaska, Alabama, and Georgia) fewer than 5 percent of beneficiaries received a physical health exam.
If we consider certain cancer screenings (mammograms, colonoscopies, and Pap smears) as preventive health services, between 25 percent and 45 percent of beneficiaries in a given state received a preventive health service in 2007.
In California and Indiana, beneficiaries enrolled in HMOs were respectively 7 and 5 percentage points more likely to receive a preventive health exam, and 4 and 13 percentage points more likely to receive a cancer screening.
C. State Variation in Receipt of Psychosocial Services
Because of the aforementioned limitations in completely identifying specific psychosocial EBPs in each state, it is difficult to make direct state-to-state comparisons of the receipt of psychosocial EBPs. However, it is possible to make cautious state-to-state comparisons of the proportion of beneficiaries who received any psychosocial services, since this was measured consistently across states.
There was state-to-state variation in the proportion of beneficiaries who received any psychosocial services in 2007 (Table 7). Fewer than half received any psychosocial services in North Dakota and Connecticut, while in 12 states, more than three-quarters of beneficiaries received a psychosocial service.
|
State |
Any Psychosocial Service |
Specific Psychosocial EBPs |
|||
|---|---|---|---|---|---|
|
Psychotherapy |
Family Therapy |
Skills Training |
ACTa |
||
|
SOURCE: MAX data, calendar year 2007. NOTE: Any EBP includes claims for psychotherapy, family therapy, skills training, ACT, supported employment, and CBT. --- indicates that no claims for that service were identified. The absence of claims may be due to the lack of specific billing codes used in a state. Due to limitations in the claims data, specific psychosocial services could not be measured in California, so rates of psychosocial EBPs are not available in that state.
|
|||||
| ND | 45.4 | 44.0 | 0.7 | 1.7 | --- |
| CT | 48.6 | 45.8 | 0.9 | 0.8 | --- |
| WV | 50.9 | 40.9 | 1.1 | 0.8 | 2.0 |
| LA | 53.9 | 51.7 | 2.5 | 7.1 | --- |
| IA | 62.3 | 49.4 | 3.6 | 2.4 | 2.1 |
| MS | 68.3 | 59.2 | 5.0 | 0.3 | 3.9 |
| MO | 71.3 | 45.1 | 0.6 | 0.0 | --- |
| AK | 71.8 | 43.3 | 2.5 | 49.8 | --- |
| SD | 73.7 | 26.3 | 1.3 | --- | 9.0 |
| IL | 73.9 | 58.8 | 0.5 | 5.2 | 5.1 |
| OK | 75.0 | 45.1 | 6.1 | --- | 4.4 |
| NV | 77.6 | 70.7 | 1.7 | 19.4 | --- |
| IN | 78.6 | 64.5 | 3.1 | 34.2 | 8.9 |
| NC | 79.2 | 47.1 | 3.2 | 0.4 | 8.5 |
| MD | 81.3 | 71.5 | 10.7 | 2.9 | 6.5 |
| GA | 82.2 | 61.3 | 0.8 | 6.8 | 4.0 |
| CA | 82.5 | n.a. | n.a. | n.a. | n.a. |
| AL | 84.5 | 67.1 | 5.4 | 0.1 | 5.0 |
| WY | 84.6 | 62.6 | 3.1 | 18.9 | --- |
| NH | 85.6 | 59.9 | 2.9 | 1.1 | --- |
| DC | 87.2 | 23.0 | 0.8 | 3.1 | 7.9 |
| ID | 87.7 | 62.5 | 4.6 | 0.4 | --- |
States for which we identified claims for psychosocial EBPs used several Medicaid coverage options to reimburse these services. The clinic and rehabilitation options were used most commonly to reimburse psychosocial EBPs. In 11 of the 21 states (excluding California), more than half of the psychotherapy claims were reimbursed under the clinic option. One state (Wyoming) covered the majority of psychotherapy claims using the rehabilitation option, while two states (Illinois and Maryland) covered most psychotherapy under the physician benefit, and three states (South Dakota, Iowa, and Wyoming) covered most psychotherapy under the other practitioner benefit. However, even in states where most psychotherapy was covered using one benefit category, some psychotherapy claims were covered under the other benefit categories as well. In contrast, the other psychosocial EBPs were concentrated almost exclusively in a single benefit category. For example, in the 12 states with identifiable claims for ACT services, five used the clinic option exclusively to cover the service, four used the rehab option exclusively, and one used a mix of the clinic and rehab options. A similar pattern occurred with skills training, with states choosing either the clinic or rehab option to deliver the service. However, the benefit category under which the service was covered did not appear related to the proportion of beneficiaries in a state who received the service.
FIGURE 6. Proportion of Medicaid Beneficiaries in Each State Receiving an Identifiable Psychosocial EBP, by Proportion of SMHA Funding Used for Community-Based Services
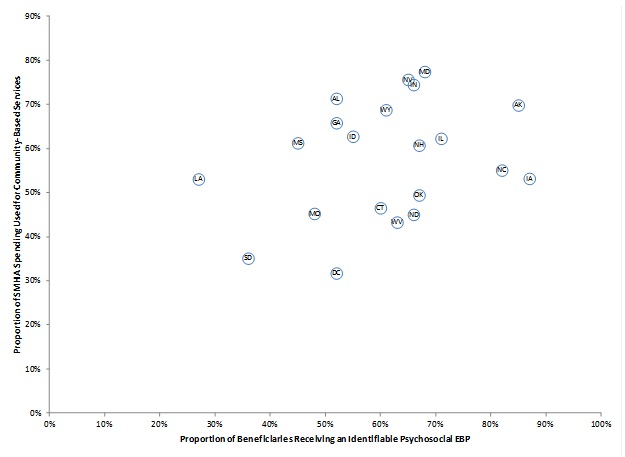
SOURCE: MAX data, calendar year 2007. NRI is source for data on the proportion of SMHA funding used for community-based services.
The relationship between managed care enrollment and the receipt of any psychosocial services was unclear. In one of the three states with comprehensive managed care (California), beneficiaries enrolled in the HMO were slightly more likely to receive any psychosocial service than those not enrolled. In Maryland, HMO enrollees were significantly more likely to receive a psychosocial service (82 percent compared with 55 percent). In contrast, in Indiana only 68 percent of HMO enrollees received a psychosocial service, compared with 79 percent of beneficiaries in the FFS system. In the only other state with comprehensive managed care (Indiana), beneficiaries enrolled in the HMO were much less likely to receive a psychosocial service than those not enrolled.
Unlike medication continuity, the receipt of any psychosocial service was not strongly associated with region or the proportion of the mental health system funding dedicated to community-based services. However, the receipt of an identifiable psychosocial EBP (mostly psychotherapy) was positively related to the proportion of mental health system funding dedicated to community-based services (Figure 6).
It is unclear whether states where a higher proportion of mental health system funding goes to community-based services offer more psychosocial EBPs or whether it is more likely that psychosocial EBPs are billed in a way that allows for their identification in those states.
D. State Variation in Receipt of Multiple EBPs
We found variation between states in the proportion of beneficiaries who received a combination of continuous medications, psychosocial services, and medication monitoring (Figure 7). Nearly twice as many beneficiaries with schizophrenia and bipolar disorder had high medication continuity in the best-performing state, compared to the worst-performing state (72 percent versus 35 percent). Similarly, the proportion of beneficiaries with high medication continuity and at least one claim for a psychosocial service varied from 24 percent to 55 percent among states. However, the proportion of beneficiaries who had high medication continuity, at least one psychosocial claims, and medication monitoring or screening for cardiovascular disease or diabetes was uniformly low for all states: depending on the state, only between 1 percent and 15 percent of beneficiaries received all of these services (Table 8).
FIGURE 7. Proportion of Medicaid Beneficiaries in Each State Receiving Multiple EBPs
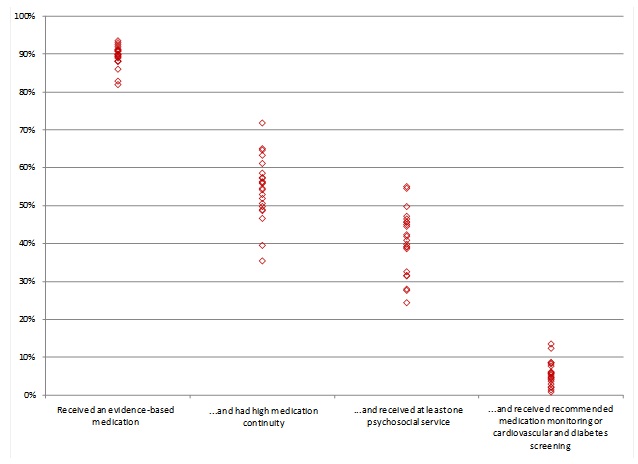
SOURCE: MAX data, calendar year 2007.
NOTES: Each diamond in the figure represents the proportion of beneficiaries in a state who received the service.
|
State |
Received an Appropriate Medication |
and had High Medication Continuity |
and Received at Least One Psychosocial Service |
and Received Medication Level Monitoringa |
and Received Health Screening for Medication Side Effectsb |
|---|---|---|---|---|---|
| Median | 89.9 | 55.2 | 41.4 | 39.2 | 5.3 |
|
SOURCE: MAX data, calendar year 2007. NOTES: Data on medication monitoring and health screenings is not displayed for Maryland, as very low rates of medication monitoring and health screenings may be a result of missing laboratory encounter data for HMO enrollees.
|
|||||
| AK | 88.1 | 57.4 | 44.6 | 41.1 | 3.7 |
| AL | 91.9 | 51.9 | 46.5 | 44.8 | 7.7 |
| CA | 90.8 | 57.3 | 47.2 | 45.3 | 6.2 |
| CT | 93.5 | 63.3 | 31.5 | 30.5 | 6.0 |
| DC | 82.9 | 35.4 | 32.6 | 31.0 | 1.4 |
| GA | 90.0 | 46.7 | 39.2 | 38.0 | 0.9 |
| IA | 91.1 | 65.1 | 40.9 | 39.2 | 8.6 |
| ID | 89.0 | 61.1 | 55.1 | 52.1 | 5.8 |
| IL | 89.8 | 54.2 | 39.8 | 37.0 | 2.0 |
| IN | 90.9 | 56.3 | 45.0 | 42.9 | 8.3 |
| LA | 92.5 | 48.7 | 28.0 | 27.1 | 4.5 |
| MD | 89.2 | 49.8 | 41.9 | n.r. | n.r. |
| MO | 90.8 | 54.6 | 39.1 | 35.9 | 4.7 |
| MS | 86.0 | 39.5 | 27.7 | 27.1 | 3.0 |
| NC | 89.6 | 53.0 | 42.3 | 40.8 | 5.3 |
| ND | 89.3 | 71.8 | 31.6 | 30.6 | 8.6 |
| NH | 91.3 | 64.7 | 54.6 | 53.5 | 12.4 |
| NV | 93.0 | 56.1 | 45.7 | 43.0 | 5.7 |
| OK | 88.1 | 50.6 | 38.7 | 36.6 | 4.8 |
| SD | 82.0 | 55.9 | 45.6 | 44.1 | 13.5 |
| WV | 88.1 | 48.9 | 24.4 | 22.6 | 4.2 |
| WY | 89.9 | 58.6 | 49.8 | 46.7 | 2.2 |
Discussion of Findings and Implications
The findings from this project can inform states efforts to design policies and interventions to improve the quality of care for beneficiaries with SPMI. While these beneficiaries make up a relatively small proportion of each states Medicaid population, their complex needs are costly: total Medicaid spending on the population in this study averaged $26,119 per year, compared with $5,337 for the Medicaid population as a whole.11 This project found that, although most beneficiaries received an evidence-based medication, continuity of medications was poor in many states, and few beneficiaries received medication monitoring and preventive physical health services. Further, in some states, nearly half of beneficiaries did not receive any psychosocial services and the extent to which these psychosocial services are evidence-based is unclear using claims data. Several characteristics of beneficiaries, state mental health systems, and Medicaid programs were associated with the receipt of EBPs, and with medication continuity in particular.
Using MAX data--which are standardized and suitable for making comparisons across states--this study was able to measure the receipt of EBPs systematically across 22 states and a large population of beneficiaries. Thus, with the exception of psychosocial EBPs, as previously noted, differences across states in the receipt of services do not reflect limitations of the data or missing data for a particular state. We should, however, note several limitations of our study. Several states are missing from this study due to concerns about the completeness and reliability of their data in MAX in 2007. Most notably, two states with large populations, New York and Texas were omitted from the analysis. In addition, several states that have made efforts to implement psychosocial EBPs (New York, Vermont, Oregon, and Ohio) or medication management practices (Arkansas, Kentucky, Texas, and New York) were excluded due to concerns about their MAX data in 2007. Further work might investigate how the rates of EBPs in the states excluded from these analyses compare with those included. We used only one calendar year of Medicaid claims, from 2007. It is possible that the receipt of some EBPs has improved since 2007. It is also possible that some beneficiaries received a physical health examination, cancer screening, or medication monitoring outside of the calendar year of the data, but within a reasonable timeframe. Nonetheless, even if some beneficiaries received these services outside of the calendar year, the rates of physical health services and medication monitoring would likely still be quite poor. Due to data limitations, the study included mostly FFS Medicaid claims, so it was not possible to measure features of managed care organizations that may be associated with the receipt of EBPs. Finally, there was insufficient variation in states use of different types of Medicaid waivers or optional coverage categories to draw conclusions about their relationship to the receipt of EBPs. This study could not measure all of the beneficiary, state, or Medicaid program characteristics that may influence the receipt of EBPs. There may be unmeasured variables that confound our bivarite or multivariate findings. State Medicaid agencies or SMHAs may wish to conduct additional analyses to identify state-specific factors associated with the receipt of EBPs. These exploratory findings can provide a foundation for future research and monitoring.
Based on the findings from this project, Medicaid agencies, SMHAs, state and federal policymakers, and other stakeholders may wish to consider the following opportunities to improve the quality of care for Medicaid beneficiaries with SPMI:
Continue to foster efforts to integrate mental health, physical health, and substance abuse services for Medicaid beneficiaries with SPMI. The findings from this project underscore the importance of overcoming longstanding deficits in the delivery of coordinated physical and behavioral health services for Medicaid beneficiaries with SPMI. While all adults should receive basic preventive health services, those with SPMI are in particular need of regular medication monitoring and health screening for the side effects of medications. The well-documented difficulties involved in addressing the physical health conditions of Medicaid beneficiaries with SPMI include the fragmentation of physical and behavioral health care providers and restrictions on same-day Medicaid billing for behavioral and physical health services imposed by some state Medicaid programs. However, some state Medicaid agencies already have taken steps to overcome these difficulties by removing same-day billing restrictions and/or creating billing codes specifically designed to support integrated physical behavioral health care (the Substance Abuse and Mental Health Services Administration [SAMHSA] and Health Resources and Services Administration [HRSA] Center for Integrated Health Solutions 2011). In addition, some state Medicaid agencies have adopted Health and Behavior Assessment and Intervention Codes, which provide a mechanism to bill for services that address the psychological, emotional, behavioral, and cognitive factors that affect physical health conditions (MaineHealth 2009). At the same time, state Medicaid agencies and managed care organizations have developed promising strategies for coordinating and integrating physical and behavioral health care (Hamblin et al. 2011). As state Medicaid agencies and mental health systems look to adopt these models of care and reimbursement mechanisms to support integrated services, they can draw upon the resources of the Center for Integrated Health Solutions, sponsored by SAMHSA and HRSA (National Council for Community Behavioral Healthcare 2011), as well as the Integrated Care Resource Center (2011), sponsored by CMS, for technical assistance and guidance. Finally, the inverse relationship between substance abuse disorders and medication continuity speaks to the need to strengthen the delivery of care for individuals with co-occurring disorders. Resources to help states and providers better integrate services and implement EBPs, including EBPs for co-occurring disorders, medication management, ACT, supported employment, family psychoeducation, and other services, are available from SAMHSAs EBP toolkit (SAMHSA 2011).
Improve the delivery of evidence-based psychosocial services. In some states, 25-50 percent of beneficiaries did not receive any psychosocial services during the year. In other states, the majority of beneficiaries received psychosocial services, but the degree to which those services were consistent with EBPs was unclear. There were few claims for specific psychosocial EBPs, including ACT, CBT, family therapy, skills training, or supported employment. As previously mentioned, the lack of claims for these EBPs could be due, in part, to the lack of specificity in billing codes. States may wish to examine the extent to which the psychosocial services being reimbursed are consistent with the evidence base. They also may want to seek ways to incentivize the delivery of EBPs and maintain their fidelity through provider certification or other mechanisms. Finally, there may be a need for some states to develop state-specific billing codes or adopt national CPT and HCPCS codes for psychosocial EPBs to facilitate the accurate tracking and monitoring of these services.
Consider whether certain Medicaid policies and practices impede care. As states refine their Medicaid benefit packages in light of continuing budget pressures and federal and state health care reforms, they should give further consideration to practices and policies that may facilitate or impede with the receipt of EBPs. Although this study could not measure every factor associated with the delivery of EBPs, the exploratory findings from this study provided some evidence that copayments and prior authorization requirement were inversely associated with medication continuity. Other studies have found that prior authorization policies may prevent Medicaid beneficiaries with bipolar disorder from filling prescriptions for antipsychotics and anticonvulsants (Lu et al. 2010). Given that poor medication continuity is associated with relapses and costly hospitalizations among individuals with SPMI (West et al. 2010), states may consider exempting these beneficiaries or certain medications from prior authorization and copayment requirements. In addition, while this study did not include many states with managed care arrangements, we found some evidence that HMO enrollment was associated with better receipt of preventive physical health services but worse medication continuity and monitoring. Although readers should be cautious in interpreting these findings from a small group of managed care plans, the findings suggest that states should carefully consider the potential benefits and harms associated with enrolling this population into HMOs and must monitor their quality of care.
Bolster efforts to reduce racial differences in medication use and monitoring. The findings from this project are consistent with well-documented racial and ethnic differences in the receipt of mental health services (Samnaliev et al. 2009). Previous research has found that African Americans in particular receive suboptimal medication therapy. We found that African Americans had the lowest rates of medication continuity, medication monitoring, and screening for cardiovascular disease and diabetes. Conversely, African Americans were more likely to receive depot antipsychotics. The causes of these differences are complex and may include beneficiary attitudes or beliefs about certain medications or services, providers biases in treatment or prescribing practices, and other barriers to care experienced by racial or ethnic minorities--which we could not explore in this study using claims data alone. Reducing these differences likely necessitates a multipronged approach of provider and beneficiary outreach and education to encourage appropriate prescribing practices, medication monitoring, and health screening. States could use Medicaid claims to monitor racial and ethnic differences in prescribing patterns and the receipt of services to identify geographic areas, providers, or subpopulations that may benefit from targeted interventions.
Target the needs of transition-age youth. Younger Medicaid beneficiaries with schizophrenia and bipolar disorder had worse medication continuity compared with their older counterparts. The symptoms and impairment associated with schizophrenia and bipolar disorder typically begin during young adulthood. If untreated, these disorders can disrupt the educational and employment trajectories of youth, leading to lifelong disability and economic hardship. In the coming years, the number of youth enrolled in Medicaid with SPMI may increase, due to guaranteed Medicaid eligibility for youth aging out of foster and other Medicaid eligibility expansions as a result of the Affordable Care Act. State Medicaid agencies and mental health systems will need to identify best practices for engaging transition-age youth in care and improving the delivery of services to this population. States may benefit from drawing on the resources of the Pathways to Positive Futures Center, sponsored by SAMHSA and the National Institute of Disability and Rehabilitation Research (Pathways to Positive Futures 2011). In addition, findings from the RAISE intervention, an initiative supported by the National Institute of Mental Health to identify promising strategies to help individuals in the early stages of schizophrenia and other mental illnesses, may help to inform best practices.
Use claims and enrollment data to monitor quality of care. State and federal agencies should continue to monitor the quality of care for Medicaid beneficiaries with SPMI. The National Behavioral Health Quality Framework, developed by SAMHSA, establishes priorities for improving the accessibility, quality, and outcomes of behavioral health services. Medicaid claims data are a valuable resource for tracking progress toward reaching the goals of the Quality Framework. However, the completeness and reliability of Medicaid data vary across states. Some states lack billing codes to track specific services, particularly psychosocial EBPs. These states may need to enhance the data to make them sufficient for quality monitoring. States may be able to use the findings from this project as a baseline from which to assess future progress.
Too few Medicaid beneficiaries with SPMI receive the medications, psychosocial services, and physical health care needed to support their ability to live independently, maintain employment, and prevent a relapse. For Medicaid programs and SMHAs, the findings from this study can be a starting point for a closer look at the factors within their state that are associated with the receipt of EBPs. For federal and state policymakers, the findings can serve as a baseline from which they can assess progress towards the broader use of EBPs.
References
Fleischhacker, W.W., M. Cetkovich-Bakmas, M. De Hert, C.H., Hennekens et al. Comorbid Somatic Illnesses in Patients with Severe Mental Disorders: Clinical, Policy, and Research Challenges. Journal of Clinical Psychiatry, vol. 69, no. 4, 514-519, 2008.
Fontaine, K.R., M. Heo, E.P. Harrigan et al. Estimating the Consequences of Antipsychotic Induced Weight Gain on Health and Mortality Rate. Psychiatry Research, vol. 101, 277-288, 2011.
Hennekens, C.H., A.R. Hennekens, D.Hollar, and D. Casey. Schizophrenia and Increased Risk of Cardiovascular Disease. American Heart Journal, vol. 51., no. 6, 1115-1121, 2005.
Integrated Care Resource Center. Available at http://www.integratedcareresourcecenter.com. 2011.
Kane, J.M. Improving Treatment Adherence in Patients with Schizophrenia. Journal of Clinical Psychiatry, vol. 72, no. 9, e28, 2011.
Kronick, R.G., M. Bella, and T.P. Gilmer. The Faces of Medicaid III: Refining the Portrait of People with Multiple Chronic Conditions. Center for Health Care Strategies, Inc. October 2009.
Lang, K., J.L. Meyers, J.R. Korn, S. Lee, M. Sikirica, C. Crivera et al. Medication Adherence and Hospitalization among Patients with Schizophrenia Treated with Antipsychotics.Psychiatric Services, vol. 61, no.12, 1239-1247, 2010.
Laursen, T.M. Life Expectancy Among Persons with Schizophrenia or Bipolar Affective Disorder. Schizophrenia Research, vol. 131, 101-104, 2011.
Lindamer, L.A., D.C. Buse, L. Auslander, J. Unutzer, S.J. Bartels, and D.B. Jeste. A Comparison of Gynecological Variables and Services Use Among Older Women With and Without Schizophrenia. Psychiatric Services, vol. 54, no. 6, 902-904, 2003.
Lu, C.Y., S.B. Soumerai, D. Ross-Degnan, F. Zhang, and A.S. Adams. Unintended Impacts of a Medicaid Prior Authorization Policy on Access to Medication for Bipolar Illness. Medical Care, vol. 48, no. 1, 4-9, January 2010.
MaineHealth. Health and Behavior Codes Guidelines for Use. Available at http://www.integration.samhsa.gov/financing/Maine_Health_code.pdf. March 2009.
Mehrotra, A., A.M. Zaslavsky, and J. Z. Ayanian. Preventive Health Examinations and Preventive Gynecological Examinations in the United States. Archives of Internal Medicine, vol. 167, no. 17, 1876-1883, 2007.
National Association of State Mental Health Program Directors, National Research Institute (NRI). State Mental Health Agency Profiling System: 2007. Available at http://www.nri-inc.org/projects/profiles/ProfilesRevExp.cfm?State=All&Year=07&Keyword=&Subject. 2011.
National Council for Community Behavioral Healthcare. Available at http://www.thenationalcouncil.org/cs/center_for_integrated_health_solutions. 2011.
National Pharmaceutical Council. Pharmaceutical Benefits Under State Medical Assistance Programs, 2007. 2008.
Newcomer, J.W. Second-Generation (Atypical) Antipsychotics and Metabolic Effects: A Comprehensive Literature Review. CNS Drugs, vol. 19, 1-93, 2005.
Pathways to Positive Futures. Available at http://www.pathwaysrtc.pdx.edu/index.shtml. 2011.
SAMHSA. Available at http://store.samhsa.gov/facet/Professional-Research-Topics/term/Evidence-Based-Practices?filterToAdd=Kit. 2011.
SAMHSA-HRSA Center for Integrated Health Solutions. Available at http://www.integration.samhsa.gov/financing/billing-tools.
Samnaliev, M., M.P. McGovern, and R.E. Clark. Racial/Ethnic Disparities in Treatment in Six Medicaid Programs. Journal of Health Care for the Poor and Underserved, vol. 20, no. 1, 165-176, February 2009.
Simon, G.E., and J. Unützer. Health Care Utilization and Costs Among Patients Treated for Bipolar Disorder in an Insured Population. Psychiatric Services, vol. 50, no. 10, 1303-1308, 1999.
Tran, E., F. Rouillon, J.Y., Loze, F. Casadebaig, A. Philippe, F. Vitry et al. Cancer Mortality in Patients with Schizophrenia: An 11-Year Prospective Cohort Study. Cancer, vol. 115, no. 15, 3555-3562, 2009.
Unützer J., G. Simon, C. Pabiniak, K. Bond, and W. Katon. The Treated Prevalence of Bipolar Disorder in a Large Staff-Model HMO. Psychiatric Services, vol. 49, no. 8, 1072-1078, 1998.
West, J.C., D.S. Rae, H.A. Huskamp, M. Rubio-Stipec, and D.A. Regier. Medicaid Medication Access Problems and Increased Psychiatric Hospital and Emergency Care. General Hospital Psychiatry, vol. 32, no. 6, 615-622, 2010.
Technical Appendix
This technical appendix describes the MAX data, the criteria for selecting states to include in the analysis, the process for identifying Medicaid beneficiaries with schizophrenia and bipolar disorder, and the specifications of the measures of EBPs. It also includes the full regression results.
I. Description of MAX Data
The MAX data are standardized eligibility and claims files for each state that include person-level information on every beneficiary enrolled in Medicaid during the calendar year. The MAX files are created from claims data that each state submits to CMS . Unlike other sources of Medicaid data, the MAX files are structured to reflect the use and cost of all Medicaid-funded services delivered to a beneficiary during the calendar year, regardless of the date that claims were paid. In addition, the variables in MAX are standardized to create comparable measures of service use and costs across states that may have significant variation in benefit packages and eligibility guidelines.
While MAX is the best data source available to examine state-to-state variation in Medicaid-funded services, there are several limitations to the data. To begin, claims data are subject to variation in diagnostic practices by physicians and other providers, and, for some states, ambiguity in mental health billing codes makes it difficult to determine what service is delivered. Studies that use claims data cannot measure EBPs as precisely as studies in clinical settings, and the use of claims data alone may make it difficult to evaluate the fidelity with which an EBP was delivered.
In addition, the MAX data do not include any service use that is not Medicaid-funded or any service use funded by state-only dollars. As a result, reliance solely on Medicaid claims may underestimate the number of beneficiaries who receive EBPs. Some components of certain psychosocial EBPs, such as supported employment, are not eligible for federal Medicaid matching funds under federal regulation. In addition, some IP psychiatric services that may serve as an indicator that a beneficiary should be receiving certain EBPs such as ACT may be missing from MAX.12 Finally, MAX files are derived from state administrative data systems that are used to determine eligibility and process and pay medical claims, and states vary in their ability to submit complete and reliable data to CMS . As a result, not all state Medicaid programs and beneficiaries could be included in the study. To the extent possible, the study attempted to include every state with MAX data of sufficient completeness and reliability, but not all states were included in the analysis and therefore not all Medicaid policy options that may affect the delivery of EBPs could be investigated.
II. Populations and States Included in the Study
The completeness and reliability of each states MAX data may vary from year to year. We examine the completeness and reliability of all key variables in the eligibility and claims files in each state using 2007 MAX data--the latest calendar year of data available at the start of our project. We identified 22 states with MAX data of sufficient completeness and reliability for inclusion in the study; below, we summarize the state selection process.
Given that the completeness and reliability of each states data may vary between years, we recommended limiting the study to populations enrolled in Medicaid in calendar year 2007 and the services they received during that year. The inclusion of other years of data would require additional project resources to investigate the reliability of the eligibility and FFS claims in each state in other years, to determine the completeness of the encounter data in states that used managed care in other years, and to evaluate outside sources to understand any potentially relevant policy or program changes between the years.
A. Populations Excluded from the Study
To maximize the number of states included in the study, we limited our analysis to adults who qualified for Medicaid on the basis of disability, because this population is often excluded from managed care programs into which other beneficiaries are required to enroll. In addition, we limited the analysis to community-dwelling disabled beneficiaries because of differences in the service delivery systems and thus state Medicaid policies affecting the institutionalized population.
The study excluded beneficiaries who qualified for only partial Medicaid benefits and beneficiaries with other sources of health insurance coverage (including those enrolled simultaneously in Medicare or private insurance). With much of such individuals’ service use not Medicaid-funded, the MAX data would present an incomplete picture of their conditions and treatments. As suggested by our expert panel, to ensure an adequate amount of data to evaluate service use, the analysis only included beneficiaries with at least 10 months of continuous enrollment in Medicaid.
Table A.1 summarizes the Medicaid populations to be excluded from the study due to the limitations of the MAX data.
|
Data Issue |
Populations Excluded from the Study |
Populations Included in the Study |
|---|---|---|
| MAX data contain only Medicaid-funded services. | Beneficiaries with Medicare (duals) and those over age 64.
Beneficiaries with private insurance. Beneficiaries qualifying only for restricted or partial benefits. |
Beneficiaries qualifying for full benefits with no other sources of health coverage.
Beneficiaries with at least ten continuous months of enrollment. |
| States vary in ability to report to CMS complete and reliable enrollment and claims data. | Beneficiaries in states with known problems in reporting key variables in their 2007 data. | |
| HMO or BHO encounter data may be missing or unreliable. | Children and adult beneficiaries qualifying for Medicaid due to family status; such populations are more likely to be enrolled in managed care.
Beneficiaries in states using HMOs or BHOs that do not report encounter data to CMS. Beneficiaries in states using HMOs or BHOs whose reported encounter data have missing or unreliable data on key variables for the analysis. |
Working-age adults who qualify for Medicaid due to disability.
Beneficiaries in states that use FFS or PCCM to deliver Medicaid services. Beneficiaries in states that use HMOs and/or BHOs to deliver services to disabled adults and report reliable and complete encounter data to CMS. |
B. State Selection Process
We examined three types of records to determine whether each state’s MAX data were sufficiently complete and reliable to identify beneficiaries with schizophrenia and bipolar disorder and to measure such beneficiaries’ use of Medicaid-funded services. First, we examined the enrollment records in the person summary file to ensure that the coding of key variables used to include or exclude certain populations was reliable. Second, we examined the FFS claims records in the IP, other acute care medical (OT), and RX files to ensure that no data reporting or data quality issues would cause omitted claims or key variables to be incompletely coded. Last, in states that enroll nondual disabled beneficiaries into risk-based managed care plans that cover some of the EBPs measured in this study,13 we examined the IP, OT, and RX files to ensure that each managed care plan reported encounter data and that the diagnosis coding was complete on the encounter records. As a final check, we compared across states the proportion of nondual disabled adults who had a diagnosis of schizophrenia or bipolar disorder to check for outlier values. Table A.2 summarizes the results of the state selection process and identify the states for inclusion in the analysis.
|
Completeness and Reliability of MAX 2007 Data |
States |
States Included in or Excluded from the Study |
|---|---|---|
| Problem with Enrollment File | ||
| Problems with reliably identifying beneficiaries enrolled in managed care, waiver programs, or with private insurance coverage | Arkansas, Kansas, Montana, South Carolina, Utah (5 states) | Excluded from analysis |
| Problem with FFS Claims in IP, OT, or RX Files | ||
| Missing FFS claims or FFS claims with incomplete coding on key analysis variables | Hawaii, Maine, Rhode Island, Texas, Washington (5 states) | Excluded from analysis |
| Abnormally low percentage of disabled beneficiaries had claims with schizophrenia or bipolar disorder diagnoses, indicating missing mental health data | Vermont (1 state) | Excluded from analysis |
| Problem with Encounter Claims in IP, OT, or RX Files | ||
| Significant enrollment of nondual disabled in managed care, but no encounter data reported | Colorado, Florida, Massachusetts, Michigan, Nebraska, Ohio, Pennsylvania (7 states) | Excluded from analysis |
| Significant enrollment of nondual disabled in managed care, but plan identifiers do not match between enrollment and claims files | Kentucky, Oregon, Tennessee, Virginia, Wisconsin (5 states) | Excluded from analysis |
| Significant enrollment of nondual disabled in managed care, with problems discovered in completeness of encounter data | Arizona, Delaware, Minnesota, New Jersey, New Mexico, New York (6 states) | Excluded from analysis |
| No Major Data Problems Identified | ||
| Very low enrollment of nondual disabled into HMOs or BHOs with no encounter data reported, and no major problems with FFS data | District of Columbia, Missouri, North Carolina, West Virginia (4 states) | Only FFS enrollees included in analysis |
| Significant enrollment of nondual disabled into HMOs, BHOs, or other managed care, with no major encounter data problems detected | Alabama, California, Indiana, Iowa, Maryland, Oklahoma (6 states) | All beneficiaries included in analysis |
| No enrollment of nondual disabled into HMOs or BHOs, and no major problems with FFS data | Alaska, Connecticut, Georgia, Idaho, Illinois, Louisiana, Mississippi, Nevada, New Hampshire, North Dakota, South Dakota, Wyoming (12 states) | All beneficiaries included in analysis |
III. Identification of Beneficiaries with Schizophrenia and Bipolar Disorder
As recommended by the expert panel, we included beneficiaries with a primary diagnosis of schizophrenia or bipolar I disorder on at least one IP claim or on two outpatient claims on different dates (Simon and Unützer 1999; Unützer et al. 1998) (Table A.3). Following the recommendation of the expert panel, beneficiaries with a diagnosis of both bipolar disorder and schizophrenia were categorized according to the most frequent diagnosis during the calendar year, allowing IP claims to be weighted more heavily than outpatient claims if we observed an equal number of claims for the two diagnoses.
|
ICD-9-CM Code |
Description |
|
|---|---|---|
| Bipolar disorder | 296.0 | Bipolar I disorder, single manic episode |
| 296.1 | Manic disorder, recurrent episode | |
| 296.4 | Bipolar I disorder, most recent episode (or current) manic | |
| 296.5 | Bipolar I disorder, most recent episode (or current) depressed | |
| 296.6 | Bipolar I disorder, most recent episode (or current) mixed | |
| 296.7 | Bipolar I disorder, most recent episode (or current) unspecified | |
| Schizophrenia | 295.0 | Schizophrenia, simple type |
| 295.1 | Schizophrenia, disorganized type | |
| 295.2 | Schizophrenia, catatonic type | |
| 295.3 | Schizophrenia, paranoid type | |
| 295.4 | Schizophreniform disorder | |
| 295.5 | Latent schizophrenia | |
| 295.6 | Schizophrenia, residual type | |
| 295.7 | Schizoaffective disorder | |
| 295.8 | Other specified types of schizophrenia | |
| 295.9 | Unspecified schizophrenia |
IV. Measurement of EBPs
This final section describes the approach used to measure EBPs. The measure specifications were informed by a review of the literature and existing quality measures and input from ASPE and the expert panel.
A. Pharmacologic EBPs for Schizophrenia
Table A.4 summarizes the approaches used to measure the use and continuity of medications for schizophrenia.
|
EBP for Schizophrenia |
Numerator |
Denominator |
|---|---|---|
| Use of antipsychotic medication | Beneficiaries with at least one claim for antipsychotic | Beneficiaries with a schizophrenia diagnosis |
| Continuity of antipsychotic medication | Number of beneficiaries for whom the total days supply on all nonoverlapping antipsychotic fills was 80 percent or more of the days since their first fill for an antipsychotic | Number of beneficiaries whose first prescription fill for an antipsychotic was more than 90 days away from the end of the study period (December 31, 2007) or their disenrollment from Medicaid. |
Medication continuity was measured by examining the ratio of the day’s supply on all antipsychotic prescriptions to the number of days that pass from the initial antipsychotic prescription until the end of the calendar year or disenrollment from Medicaid. Prescription fills for different antipsychotics that covered the same period of time were generally treated as a single prescription for the purpose of counting the number of days of medication supply, unless the overlap was less than 5 days in which case we assumed the beneficiary had filled their next month’s prescription early. Next, we then calculated the number of days that passed from the first dispensing of any antipsychotic until the end of the study period to define the “treatment period.” The sum of days’ supply of antipsychotics is divided by the “treatment period” to calculate the medication possession ratio (Sum of days’ supply of antipsychotics) / (Total days in treatment period). We then created a dichotomous variable that differentiated beneficiaries with low and high medication continuity, with high continuity defined as a possession ratio of 80 percent (Lang et al. 2010).
B. Pharmacologic EBPs for Bipolar Disorder
Table A.5 summarizes the approaches used to measure the receipt of evidence-based medications and medication continuity for bipolar disorder.
|
EBP for Bipolar Disorder |
Numerator |
Denominator |
|---|---|---|
| * Carbamazepine, valproate, and lamotrigine were the only anticonvulsants considered evidence-based. | ||
| Use of medication | Beneficiaries with at least one claim for lithium, anticonvulsant,* or antipsychotic | Beneficiaries diagnosed with bipolar disorder |
| Continuity of medication | Number of beneficiaries for whom the total days supply on all nonoverlapping lithium, anticonvulsant,* or antipsychotic fills was 80 percent or more of the days since their first fill for one of those medications | Number of beneficiaries whose first prescription fill for lithium, an anticonvulsant,* or an antipsychotic was more than 90 days away from the end of the study period (December 31, 2007) or their disenrollment from Medicaid |
| Use of antidepressants | At least 60 consecutive days of antidepressant use without concurrent claim of lithium, anticonvulsant,* or antipsychotic | Beneficiaries with any bipolar disorder diagnosis and at least 90 days consecutive days of antidepressant use |
We measured medication continuity among beneficiaries diagnosed with bipolar disorder following the same approach to medication continuity among beneficiaries with schizophrenia. However, for beneficiaries with bipolar disorder, the numerator for medication continuity included lithium, anticonvulsants, or antipsychotics, but the beneficiary was not required to remain on only one of these medications to be counted as receiving continuous medications. For example, an individual switching from lithium to an anticonvulsant but without a break in filled prescription days would be counted as receiving continuous medications. We used this strategy in recognition of the cyclical and evolving nature of bipolar disorder.
As an indicator of care inconsistent with EBPs, we also measured if a beneficiary diagnosed with bipolar disorder received an antidepressant for at least 60 days without a concurrent “mood stabilizer,” including lithium, anticonvulsants (carbamazepine, valproate, and lamotrigine), or any antipsychotic.
C. Laboratory Monitoring and Physical Health
Table A.6 summarizes the approach used to measure the receipt of preventive health care and laboratory monitoring of lithium, antipsychotics, or anticonvulsants.
|
EBP |
Numerator |
Denominator |
|---|---|---|
| Physical health maintenance | Beneficiaries with at least one claim during the study period for a comprehensive health examination or health behavior counseling | Beneficiaries diagnosed with schizophrenia or bipolar disorder |
| Breast, cervical, or colon cancer screening | Beneficiaries with at least one claim for a mammogram, Pap smear, or colonoscopy during the study period | Beneficiaries diagnosed with schizophrenia or bipolar disorder |
| Diabetes screening | Beneficiaries with at least one claim during the study period for a glucose test | Beneficiaries diagnosed with schizophrenia or bipolar disorder with at least one prescription fill for an antipsychotic |
| Cardiovascular disease screening | Beneficiaries with at least one claim during the study period for a cholesterol test | Beneficiaries diagnosed with schizophrenia or bipolar disorder with at least one prescription fill for an antipsychotic and no diagnosis or procedures indicating prior cardiovascular problems |
| Lithium monitoring | Beneficiaries with at least one claim during the study period for lithium level screening | Beneficiaries diagnosed with schizophrenia or bipolar disorder with at least one prescription fill for lithium |
| Anticonvulsant monitoring | Beneficiaries with at least one claim during the study period for valproate or carbamazepine level screening | Beneficiaries diagnosed with schizophrenia or bipolar disorder with at least one prescription fill for valproate or carbamazepine |
D. Psychosocial EBPs
We measured the receipt of specific psychosocial EBPs and any psychosocial services (not exclusively EBPs). Table A.7 summarizes the approach used to measure psychosocial services.
1. National Codes Used to Identify Psychosocial EBPs
We identified psychosocial EBPs using HCPCS, ICD-9, CPT, and state-specific billing codes in states that deliver mental health services under FFS arrangements (Table A.8). We did not attempt to measure the receipt of psychosocial EBPs among beneficiaries who receive mental health services through managed care arrangements because we have no way of knowing what codes (if any) managed care entities use for psychosocial EBPs.
|
EBP for Bipolar Disorder |
Numerator |
Denominator |
|---|---|---|
| Psychotherapy | Beneficiaries with at least one psychotherapy claim during the study period | Beneficiaries diagnosed with schizophrenia or bipolar disorder |
| Family therapy/ psychoeducation | Beneficiaries with at least one family therapy claim during the study period | Beneficiaries diagnosed with schizophrenia or bipolar disorder |
| Supported employment | Beneficiaries with at least one supported employment claim during the study period | Beneficiaries diagnosed with schizophrenia or bipolar disorder |
| Assertive Community Treatment | Beneficiaries with at least one ACT claim during the study period | Beneficiaries diagnosed with schizophrenia or bipolar disorder |
| Any psychosocial EBP | Beneficiaries with at least one claim for psychotherapy, family therapy, supported employment, or ACT during the study period | Beneficiaries diagnosed with schizophrenia or bipolar disorder |
| Any psychosocial services | Beneficiaries with at least one claim for an ambulatory mental health service other than evaluation, testing, or medication management during the study period | Beneficiaries diagnosed with schizophrenia or bipolar disorder |
|
HCPCS |
ICD-9 |
CPT |
|
|---|---|---|---|
| Assertive community treatment | H0039, H0040 | None | None |
| Cognitive behavioral therapy | None | None | 97532, 97633 |
| Family therapy | H1011 | 94.42 | 96154, 96155, 90846, 90847, 90849, 90887, 99510 |
| Psychotherapy | H0002, H2027, G0410, G0411 | 93.81, 94.3, 94.31 94.3694.39, 94.4, 94.51 | 9080490819, 9082190824, 9082690829, 90845, 90853, 90857, 90875, 90876, 90880, 97532, 97634, 4060F |
| Supported employment | H2023H2026 | None | None |
| Skills training | H2014 | None | 97535, 97537 |
2. Identification of State Codes for Psychosocial Services
Because some states have developed their own Medicaid billing codes for psychosocial services, we attempted to identify those codes that are used for specific psychosocial EBPs to include in the numerator of our measures. When states submit Medicaid claims data to CMS, they classify each claim into one of 30 types of service (TOS) codes that generally correspond to the basis for coverage under the Medicaid state plan. During the process of creating the MAX files, claims are classified according to four TOS codes--durable medical equipment, residential care, adult day care, and psychiatric services. This re-classification of claims uses national HCPCs, CPT, and ICD-9 procedure codes as well as state-specific procedure codes that the MAX team has identified through research and consultation with each states Medicaid agency.
|
Classification |
Inclusions |
Exclusions |
|---|---|---|
| NOTE: Only the state-specific procedure codes that are mapped to the psychiatric service TOS were evaluated using these criteria. | ||
| Any psychosocial treatment | All services provided to beneficiaries with mental illness, including all services identified as EBPs below as well as crisis services, case management, behavioral interventions or management, intensive day treatment programs, residential or day habilitation programs, partial hospitalization, collateral contacts or collateral therapy, psychiatric outpatient or clinic visits, and other unspecified services provided by mental health clinics, psychiatrists, psychologists, or other mental health providers | Any substance abuse treatment; services aimed at the MR/DD or autistic population; medication administration or medication management; evaluation or assessment services that are not clearly described as one of our EBPs |
| Assertive community treatment | Procedure codes labeled as ACT or Assertive Community Treatment | Case management, crisis services |
| Cognitive behavioral therapy | Procedure codes labeled as CBT or cognitive behavioral therapy only | None |
| Family therapy | Family therapy, family support, family education, or family counseling | Collateral therapy, collateral contacts |
| Psychotherapy | Individual, group, or unspecified psychotherapy, therapy, or counseling | None |
| Supported employment | Supportive employment habilitation | Prevocational habilitation, vocational rehabilitation |
| Skills training | Functional therapy, group or individual skill development, daily living skills, social skills, or coping support skills | |
|
Independent Variables |
Beneficiaries with Schizophrenia |
Beneficiaries with Bipolar Disorder |
||
|---|---|---|---|---|
|
Odds Ratio |
95% Confidence Interval |
Odds Ratio |
95% Confidence Interval |
|
|
* p < 0.05 ** p < 0.01 *** p < 0.001 NOTES: Nevada was dropped from both regressions because the majority of its beneficiaries are missing information on county residence (used to identify those living in mental health shortage areas) in the MAX data files. Additionally, Alaska, North Dakota, South Dakota, and Wyoming were dropped from the regression of medication continuity for bipolar disorder because each state had fewer than 100 beneficiaries with valid values for the medication continuity measure. The regression for medication continuity for schizophrenia included 91,338 beneficiaries in 21 states who had schizophrenia and had filled at least one prescription for an antipsychotic during the year. The regression for medication continuity for bipolar disorder included 33,124 beneficiaries across 17 states who had bipolar disorder and had filled at least one prescription for an evidence-based medication during the year. The regression for high medication continuity for schizophrenia included a variable for whether or not the state Medicaid program required prior authorization for antipsychotics since antipsychotics were considered the only evidence-based medications for schizophrenia. The regression of high medication continuity for bipolar disorder included a variable for the number of prior authorization policies in a state as opposed to modeling each prior authorization policy separately because we had few states that required prior authorization for anticonvulsants, and thus, a lack of statistical variation to generate a useful estimate. Residence in a mental health provider shortage area signifies that the beneficiary resided in a county where the whole county was designated as Mental Health Care Health Professional Shortage Area (HPSA) by HRSA. Data from the Area Resource File 2007 Release was used to identify HPSA counties. |
||||
| Prior authorization required for antipsychotics | 0.72** | 0.57-0.91 | n.a. | n.a. |
| Number of prior authorization policies | n.a. | n.a. | 0.90 | 0.83-1.003 |
| Generic copayment amount | ||||
| $0.50 $1 | 0.98 | 0.73-1.31 | 1.06 | 0.72-1.55 |
| $2 | 0.45** | 0.27-0.76 | 0.74 | 0.39-1.39 |
| $3 | 0.73** | 0.57-0.94 | 0.88 | 0.61-1.28 |
| Branded copayment amount | ||||
| $1 | 0.62* | 0.41-0.95 | 0.52* | 0.31-0.92 |
| $2 | 1.36 | 0.79-2.33 | 0.89 | 0.47-1.67 |
| $3 | 0.84 | 0.62-1.15 | 0.78 | 0.51-1.20 |
| Percent of SMHA funding spent on community-based services | 1.06* | 1.01-1.11 | 1.01 | 0.95-1.07 |
| Male beneficiary | 1.13*** | 1.09-1.16 | 1.15*** | 1.09-1.21 |
| Age | 1.02*** | 1.01-1.02 | 1.02*** | 1.01-1.03 |
| Beneficiary race | ||||
| African American | 0.45*** | 0.44-0.47 | 0.52*** | 0.49-0.57 |
| Hispanic | 0.69*** | 0.66-0.74 | 0.75*** | 0.68-0.83 |
| Other/Unknown | 0.87*** | 0.83-0.91 | 0.98 | 0.89-1.06 |
| Lived in county designated as mental health provider shortage area | 0.94** | 0.92-0.98 | 1.00 | 0.95-1.05 |
| Enrolled in HMO | 0.72*** | 0.67-.076 | 0.79*** | 0.73-0.86 |
| Comorbid substance abuse disorder | 0.53*** | 0.50-0.55 | 0.49*** | 0.46-0.53 |
| Comorbid cardiovascular disease | 0.80*** | 0.75-0.86 | 0.86** | 0.77-0.96 |
| Comorbid diabetes | 1.47*** | 1.40-1.53 | 1.37*** | 1.28-1.46 |
| Received any psychosocial services | 1.07*** | 1.04-1.11 | 1.13*** | 1.07-1.20 |
We examined state-specific codes that were mapped to the MAX TOS code for “psychiatric services” to identify codes that could identify specific psychosocial EBPs and those that identified other psychosocial services that may or may be evidence-based. Table A.9 summarizes the decision rules used to classify state-specific procedure codes as being a psychosocial EBP or as being for some other psychosocial treatment.
Notes
-
In these states, different agencies (such as the state mental health authority) are responsible for administering Medicaid benefits to specific populations and are unable to report services delivered to individuals in a uniform manner.
-
An inability to accurately identify beneficiaries with simultaneous private coverage or who were enrolled in managed care could potentially bias estimates of EBP receipt downward in the state, as some portion of their service use is expected to be missing from the MAX claims files.
-
There were only 217 beneficiaries with an equal number of claims for schizophrenia and bipolar disorder. These beneficiaries were excluded from the measures of any use, continuous use, and monitoring of evidence-based medications, but included in all other measures that had identical definitions for both disorders.
-
We excluded Maryland from our measures of cardiovascular and diabetes screening and monitoring of lithium and anticonvulsants due to potential missing managed care encounter data in 2007 MAX data.
-
Mehrotra et al. (2007) used a more restrictive method to identify physical health examinations than was used in this study, suggesting that we may have found even fewer beneficiaries who received a physical health examination had we used a more restrictive method to identify these visits. In addition, readers should be cautious to compare findings from studies that use survey data with those that use claims.
-
Any psychosocial service includes most ambulatory mental health services provided to beneficiaries with mental illness, including all psychosocial EBPs as well as crisis services, case management, behavioral interventions or management, intensive day treatment programs, residential or day habilitation programs, partial hospitalization, collateral contacts or collateral therapy, psychiatric outpatient or clinic visits, and other unspecified services provided by mental health clinics, psychiatrists, psychologists, or other mental health providers. It excludes substance abuse treatment, services aimed at the mental retardation and developmentally disabled (MR/DD) or autistic population, medication administration or medication management, and evaluation or assessment services. Visits to psychiatrists and other mental health providers billed as physician visits were only counted as psychosocial services if the visit was coded with a procedure code indicating the delivery of an EBP or one of the psychosocial services mentioned above.
-
Several other psychosocial services have some evidence base but either are not widely established practices or lack Medicaid billing codes.
-
Due to data limitations, we excluded California from our calculation of psychosocial EBPs. In California, counties have substantial responsibility for administering Medicaid services. Most beneficiaries are enrolled in health maintenance organizations (HMOs), from which specialty mental health services are carved out into county-based “mental health plans” (MHPs). Counties are responsible for paying mental health providers directly and in return receive funding from the state Medicaid agency after submitting claims to the California Department of Mental Health (DMH). Services in the MHPs are delivered on an FFS basis, but counties may require MHP providers to bill using HCPCS/CPT codes, DMH Mode of Service/Service Function codes, or a unique set of county-specific codes. While counties are required to translate any DMH or unique county codes into HCPCS/CPT codes before submitting claims to DMH, in many cases the translated codes are not as specific as those used to bill mental health services in other states. For more information on California’s claims system for mental health services, see the “Mental Health Medi-Cal Billing Manual,” available at http://www.dmh.ca.gov/MedCCC/docs/Mental_Health_Medi-Cal_Billing_Manual….
-
The regression modeled the odds of high medication continuity among beneficiaries with schizophrenia who received antipsychotics as a function of the following independent variables: residence in a state with a prior authorization policy for antipsychotics, generic copayment amount of $0.50-1, $2, or $3 versus $0; branded copayment amounts of $1, $2, or $3 versus $0; percentage of SMHA funding spent on community-based services measured using a 10 point scale that corresponded to 0-100 percent of funding; beneficiary gender, age, race, or residence in a mental health provider shortage area; HMO enrollment; and the presence of comorbid substance abuse, cardiovascular disease, or diabetes, as indicated by relevant diagnosis and/or procedure codes. The random effects regression accounted for the clustering of observations/beneficiaries by state.
Nevada was dropped from the regression because the majority of its beneficiaries are missing information on county residence (used to identify those living in mental health shortage areas) in the MAX data files. The regression included 91,338 beneficiaries in 21 states who had schizophrenia and had filled at least one prescription for an antipsychotic during the year.
-
We modeled the odds of medication continuity separately for schizophrenia and bipolar disorder because the evidence-based medications for these disorders are different, and thus the Medicaid policies and practices that may influence medication continuity may differ between the groups. The regression modeled the odds of high medication continuity among beneficiaries with bipolar disorder who received an evidence-based medication as a function of the following independent variables: the number of prior authorization policies in a state; generic copayment amount of $.50-1, $2, or $3 versus $0; branded copayment amounts of $1, $2, or $3 versus $0; percentage of SMHA funding spent on community-based services measured using a 10 point scale that corresponded to 0-100 percent of funding; beneficiary gender, age, race, or residence in a mental health provider shortage area; HMO enrollment; and the presence of comorbid substance abuse, cardiovascular disease, or diabetes, as indicated by relevant diagnosis and/or procedure codes. The regression included a variable for the number of prior authorization policies in a state as opposed to modeling each prior authorization policy separately because we had few states that required prior authorization for anticonvulsants, and thus, a lack of statistical variation to generate a useful estimate.
Nevada was dropped from the regression because the majority of its beneficiaries are missing information on county residence (used to identify those living in mental health shortage areas) in the MAX data files. Alaska, North Dakota, South Dakota, and Wyoming were dropped from the regression because each state had fewer than 100 beneficiaries with valid values for the medication continuity measure. The regression included 33,124 beneficiaries across 17 states who had bipolar disorder and had filled at least one prescription for an evidence-based medication during the year.
-
Beneficiaries enrolled in managed care were excluded from the calculation of average Medicaid costs for the study population, as we have incomplete data on payments made to managed care programs for their care. The average per beneficiary spending for all states is for fiscal year 2008 is drawn from Kaiser State Health Facts, available at http://statehealthfacts.org/comparemaptable.jsp?ind=183&cat=4.
-
States are not supposed to submit claims for services funded by state-only dollars in the data files used to create the MAX data files. The IMD exclusion prohibits federal Medicaid matching funds for services delivered to working-age adults in IMDs, which generally include psychiatric hospitals. As a result, stays in a psychiatric hospital among working-age adults cannot generally be observed in the MAX data.
-
These services include RXs, psychosocial rehabilitation services such as ACT or counseling, and some laboratory tests and routine physical health screenings. Further details on the EBPs measured in the analysis are in Chapter IV.