
U.S. Department of Health and Human Services
Individuals Living in the Community with Chronic Conditions and Functional Limitations: A Closer Look
Lisa Alecxih, Sophie Shen, Iris Chan and Duke TaylorThe Lewin Group
John DrabekOffice of the Assistant Secretary for Planning and Evaluation
January 2010
PDF Version: http://aspe.hhs.gov/daltcp/reports/2010/closerlook.pdf (51 PDF pages)
This report was prepared under contract #HHS-100-03-0027 between the U.S. Department of Health and Human Services (HHS), Office of Disability, Aging and Long-Term Care Policy (DALTCP) and the Lewin Group. For additional information about this subject, you can visit the DALTCP home page at http://aspe.hhs.gov/_/office_specific/daltcp.cfm or contact the ASPE Project Officer, John Drabek, at HHS/ASPE/DALTCP, Room 424E, H.H. Humphrey Building, 200 Independence Avenue, S.W., Washington, D.C. 20201. His e-mail address is: John.Drabek@hhs.gov.
TABLE OF CONTENTS
- I. INTRODUCTION
- Data & Definitions
- II. ALL COMMUNITY RESIDENTS
- Individuals and health spending by health/functional status
- Average health spending by number of chronic conditions and functional limitations
- Average health spending by health/functional status and health service type
- Average health spending by health/functional status and source of financing
- Overview of community residents with functional limitations and chronic conditions
- Average health spending by primary source of insurance
- Most common chronic conditions by health/functional status
- Most common chronic conditions by age
- Individuals and health spending by age and health/functional status
- III. TOP 5% OF HEALTH CARE SPENDERS
- Distribution of health spending by top 5% spenders versus those not in top 5% spenders
- Relative risk of being in the top 5% of spenders by health/functional status
- Individuals and health spending by health/functional status among the top 5% spenders
- Most common chronic conditions by age among the top 5% spenders
- Average health spending by health service type and health/functional status among the top 5% spenders
- Average health spending by primary source of insurance among the top 5% spenders
- Average health spending by health service type and primary source of insurance among the top 5% spenders
- IV. DUAL ELIGIBLES
- Overview of dual eligibles
- Average health spending by type of service and health/functional status among dual eligibles
- V. CONCLUSION
- LIST OF EXHIBITS
- EXHIBIT 1: Distribution of Community Residents and Health Care Spending by Select Groups, 2006
- EXHIBIT 2: Averge People with Chronic Conditions, Functional Limitations Are Associated with Increased Average Health Spending, Regardless of the Number of Chronic Conditions
- EXHIBIT 3: Average Spending by Type of Service for Select Groups, 2006
- EXHIBIT 4: Health Spending by Source of Financing for Select Groups, 2006
- EXHIBIT 5: Overview of Community Residents with Functional Limitations and Chronic Conditions by Age Groups, 2006
- EXHIBIT 6: Health Spending by Primary Source of Insurance and Payment Source, 2006
- EXHIBIT 7: Most Common Conditions by Selected Groups, 2006
- EXHIBIT 8: Most Common Conditions Among Community Residents Under Age 65, 2006
- EXHIBIT 9: Most Common Conditions Among Community Residents Age 65 and Over, 2006
- EXHIBIT 10: Distribution of Community Residents Under Age 65 and Health Care Spending by Select Groups, 2006
- EXHIBIT 11: Distribution of Community Residents Age 65 and Over and Health Care Spending by Select Groups, 2006
- EXHIBIT 12: Distribution of Health Care Spending by Top 5% Spenders Versus Those Not in the Top 5% Spenders, 2006
- EXHIBIT 13: Relative Risk of Being in the Top 5% of Health Care Spenders by Selected Groups, 2006
- EXHIBIT 14: Distribution of Community Residents and Health Care Spending Among the Top 5% of Spenders by Select Groups, 2006
- EXHIBIT 15: Most Common Chronic Conditions Among Top 5% of Spenders Under Age 65, 2006
- EXHIBIT 16: Most Common Chronic Conditions Among Top 5% of Spenders Age 65 and Over, 2006
- EXHIBIT 17: Health Care Spending by Type of Service Among the Top 5% of Spenders, 2006
- EXHIBIT 18: Average Health Spending for Community Residents by Primary Source of Insurance and Payment Source Among the Top 5% of Spenders, 2006
- EXHIBIT 19: Health Spending by Type of Service for the Top 5% by Primary Insurance, 2006
- EXHIBIT 20: Overview of Dual Eligibles in the Community, 2006
- EXHIBIT 21: Health Spending by Type of Service for Dual Eligibles in the Community by Selected Groups, 2006
- EXHIBIT A-1: Distribution of Community Residents and Health Care Spending by Select Groups, 2006
- EXHIBIT A-2: Average Annual Health Spending by Number of Chronic Conditions & Functional Limitations or ADLs/IADLs, 2006
- EXHIBIT A-3: Average Spending by Type of Service for Select Groups, 2006
- EXHIBIT A-4: Health Spending by Source of Financing for Select Group, 2006
- EXHIBIT A-6: Health Spending by Primary Source of Insurance and Payment Source Among Community Residents with Chronic Conditions & Functional Limitations, 2006
- EXHIBIT A-8: Most Common Conditions Among Community Residents Under Age 65 with At Least One Chronic Condition, 2006
- EXHIBIT A-9: Most Common Conditions Among Community Residents Age 65 and Over, 2006
- EXHIBIT A-10: Distribution of Community Residents Under Age 65 and Health Care Spending by Select Groups, 2006
- EXHIBIT A-11: Distribution of Community Residents Age 65 and Over and Health Care Spending by Select Groups, 2006
- EXHIBIT A-12: Distribution of Health Care Spending by Top 5% of Spenders Versus Those Not in the Top 5% Spenders, 2006
- EXHIBIT A-13: Relative Risk of Being in the Top 5% of Health Care Spenders by Selected Groups, 2006
- EXHIBIT A-14: Distribution of Community Residents and Health Care Spending Among the Top 5% of Spenders by Select Groups, 2006
- EXHIBIT A-15: Most Common Chronic Diseases Among Top 5% of Spenders Under Age 65, 2006
- EXHIBIT A-16: Most Common Conditions Among Top 5% of Spenders Age 65 and Over, 2006
- EXHIBIT A-17: Health Care Spending by Type of Service Among the Top 5% of Spenders, 2006
- EXHIBIT A-18: Average Health Spending for Community Residents with Chronic Conditions and Functional Limitations by Primary Source of Insurance and Payments Source Among the Top 5% of Spenders, 2006
- EXHIBIT A-19: Health Spending by Type of Service for the Top 5% by Primary Insurance, 2006
- EXHIBIT A-21: Health Spending by Type of Service for Dual Eligibles in the Community by Select Groups, 2006
I. INTRODUCTION
Introduction
-
Controlling health care costs has become an enormous policy challenge.
-
In examining drivers behind health care costs, researchers have found that individuals with chronic conditions account for a significant amount of health care spending.
-
Statistics showing that one half of the U.S. population has at least one chronic condition and represents more than 80 percent of the health care spending fail to discriminate among those who place a particularly high burden on the health system.
-
This chartbook examines the combination of chronic conditions and functional limitations as a potentially better predictor of high health care utilization.
-
People with functional limitations and chronic conditions need more health care services and help with activities of daily living, placing heavy demands on service delivery, social supports, and public budgets.
-
Although nearly half of the persons living in the community have at least one chronic condition, less than a third of those with chronic conditions have any functional limitation.
-
As the chartbook details, the co-occurrence of chronic conditions and functional limitations has wide-reaching consequences for the health care system, individuals, and the economy. Providing individuals who have both chronic conditions and functional limitations with delivery of effective treatment and coordination across health care and social service systems may offer a high yield strategy to improve lives and control spending.
Data and Definitions
-
Data -- The analyses rely on the 2006 Medical Expenditures Panel Survey (MEPS) which represents the non-institutionalized U.S. population. Having only information on the non-institutionalized is an important limitation for studying chronic disease and disability spending because the nearly two million nursing facility residents not included in the analysis would add close to $200 billion to the $1.03 trillion represented by the population presented here. Health spending includes the following services: inpatient stays, physician offices or outpatient visits, emergency room visits, prescription drugs, and home health care.1
-
Chronic Conditions -- A chronic condition lasts or is expected to last 12 months or longer and either places limitations on normal functioning or requires ongoing care. The analysis relied on a list of 180 diagnosis classifications2 determined to be chronic by a panel of five internists for a prior study for the Agency for Healthcare Research and Quality (AHRQ).3 This analysis focuses on the conditions included in the list defined by AHRQ as chronic.4
-
Functional Limitations -- Limitation in one or more of the following:
-
Physical activity, such as difficulty walking, bending, or stooping.
-
Normal life activity, such as work, housework, or school.
-
Received assistance with Activities of Daily Living (ADL): bathing, eating, dressing, transferring (i.e., from bed to chair), toileting, and walking.
-
Received assistance with Instrumental Activities of Daily Living (IADL): doing housework, preparing meals, taking medications, shopping, telephoning, and managing money.
-
-
Top 5% of Spenders -- People who had health care expenditures greater than $14,600 in 2006 represented the top 5 percent of spenders.
- Appendix Tables -- Each table in the Appendix provides data used in developing the corresponding figure or chart in this report. For example, Exhibit A-3 provides the amounts paid for each type of service listed in the bar chart Exhibit 3.
II. ALL COMMUNITY RESIDENTS
People with Chronic Conditions and Functional Limitations Use More Health Care Services than Those with Chronic Conditions Only
-
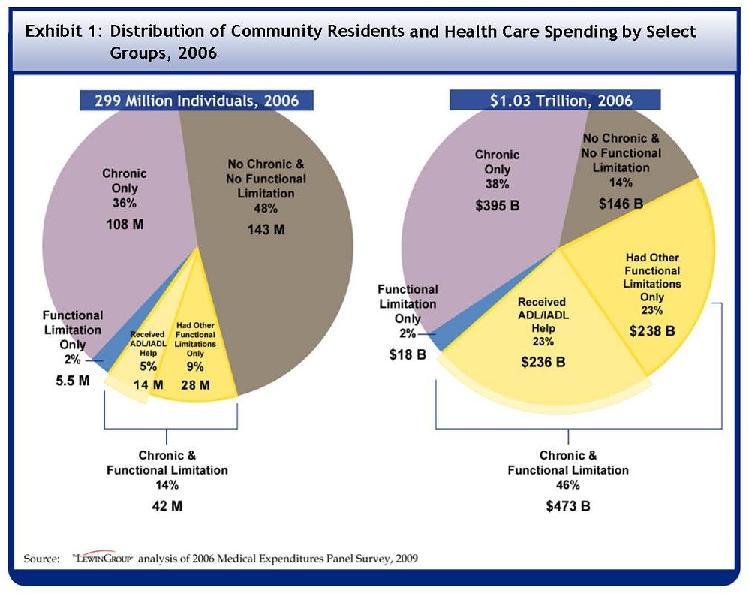
Fourteen percent of U.S. community residents had both chronic conditions and functional limitations. This 14 percent accounts for 46 percent of all health care spending.
-
Among the 42 million people with both a chronic condition and a functional limitation, 14 million also received help with an ADL or IADL. This 14 million represents 5 percent of the population and 23 percent of all spending.
-
Two percent of the population report functional limitations, including some receiving assistance with ADLs or IADLs, but no chronic conditions. Injuries and infections account for most of the non-chronic conditions among those with functional limitations only.
-
People with chronic conditions and functional limitations spent three times as much as people with only chronic conditions.
Among People with Chronic Conditions, Functional Limitations Are Associated with Increased Average Health Spending, Regardless of the Number of Chronic Conditions
-
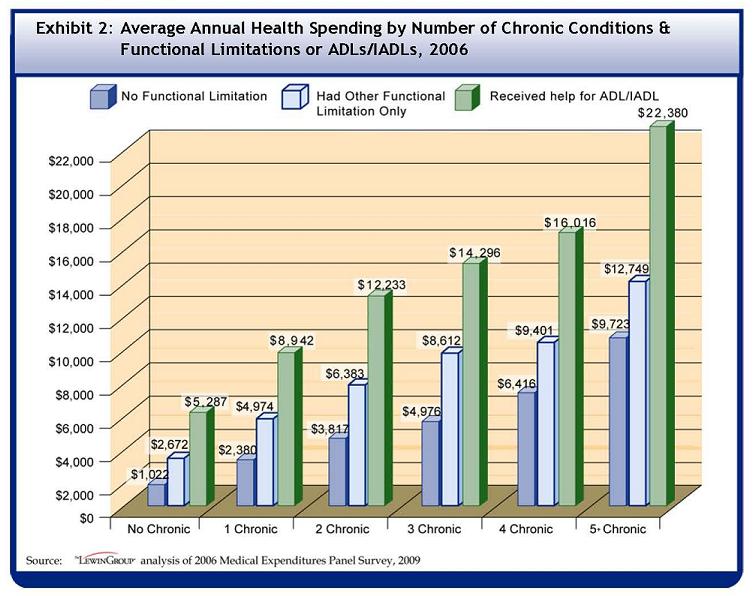
People with chronic conditions who received help for their ADLs or IADLs spent much more than their counterparts with just chronic conditions. For example, among those with one chronic condition, people who received help with an ADL or IADL spent almost four times that of people with only one chronic condition ($8,942 versus $2,380 per person per year, respectively).
-
People who did not receive assistance with ADLs or IADLs, but still had some functional limitations, spent considerably more than people with chronic conditions only.
People with Functional Limitations and Chronic Conditions Spend More on All Types of Health Care Services
-
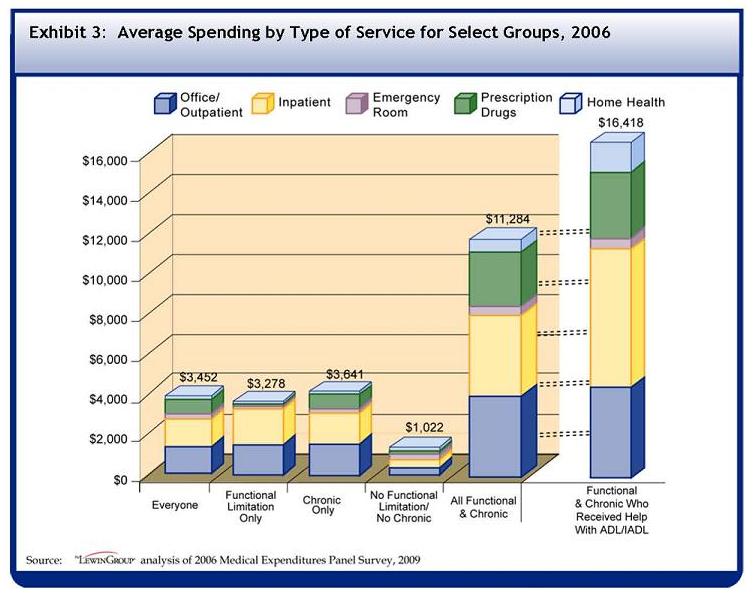
On average, the 42 million people with chronic conditions and functional limitations spent at least three times the overall average annual health expenditures for all community residents ($11,284 versus $3,452). People with chronic conditions and functional limitations also spend three times what people who only have chronic conditions spend ($11,284 versus $3,641).
-
The subset of persons with chronic conditions and functional limitations that received help with ADLs or IADLs on average spent the most-$16,418 per person. This is almost five times the overall population average of $3,452.
-
Approximately 42 percent of spending for those with chronic conditions and who received help with ADLs or IADLs went to inpatient hospital care, suggesting that improved care management may yield savings in health care spending.
Medicare and Private Insurance Cover the Majority of Health Spending for People with Functional Limitations & Chronic Conditions
-
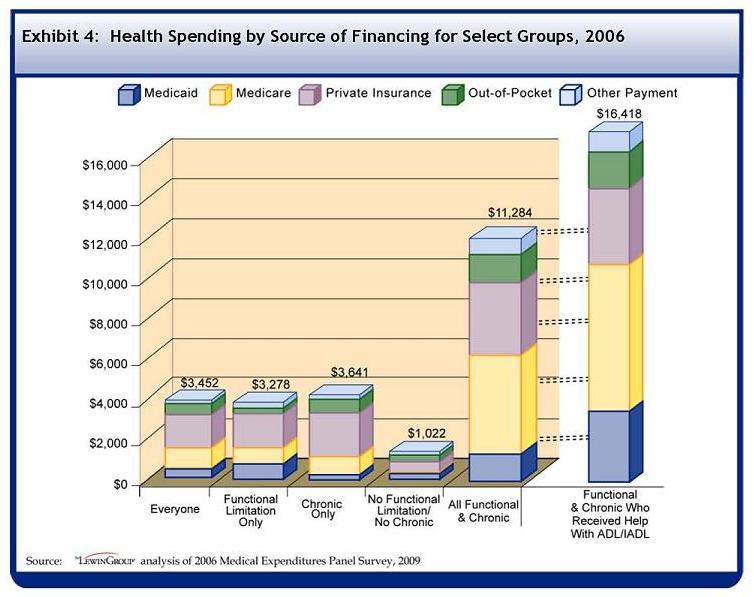
People with chronic conditions and functional limitations had higher average spending across all payment sources.
-
People with a combination of chronic conditions and functional limitations faced higher out-of-pocket costs. They paid two to three times as much out-of-pocket as the overall population, $1,557 versus $654, but paid a smaller proportion of their total expenditures out-of-pocket (14 percent versus 19 percent). (See Appendix).
-
Public programs covered a large portion of expenditures for people who received help with ADLs and IADLs. On average, Medicare accounted for 48 percent of the group's annual expenditures and Medicaid covered 13 percent.
People Under Age 65 Represent More than Half of the Population with Chronic Conditions and Functional Limitations
| Exhibit 5: Overview of Community Residents with Functional Limitations and Chronic Conditions by Age Groups, 2006 | ||||
| Number of Community Residents(Millions) | Percent of Age Group withChronicConditions &FunctionalLimitations | TotalHealth Care Expenditures (Billions) | AverageAnnualHealth Care Expenditures | |
| All Ages | 42 | 14% | $473 | $11,283 |
| Age 65 & Older | 18 | 48% | $235 | $12,880 |
| Under Age 65 | 24 | 9% | $239 | $10,068 |
| SOURCE: The Lewin Group analysis of 2006 Medical Expenditures Panel Survey, 2009 | ||||
-
The elderly have a higher prevalence rate of chronic conditions and functional limitations (48 percent of the elderly versus nine percent of the non-elderly).
-
However, the large size of the population under age 65 results in a greater number of non-elderly persons with chronic conditions and functional limitations. Most of the 42 million persons with chronic conditions and functional limitations were under age 65 (24 million, or 57 percent).
-
Total health care spending for the younger and older groups of persons with chronic conditions and functional limitations are similar, with $239 billion for the non-elderly and $235 billion for the elderly.
-
However, average annual health spending for those with chronic conditions and functional limitations is 28 percent higher among the elderly than among the non-elderly ($12,880 for the elderly and $10,068 for the non-elderly).
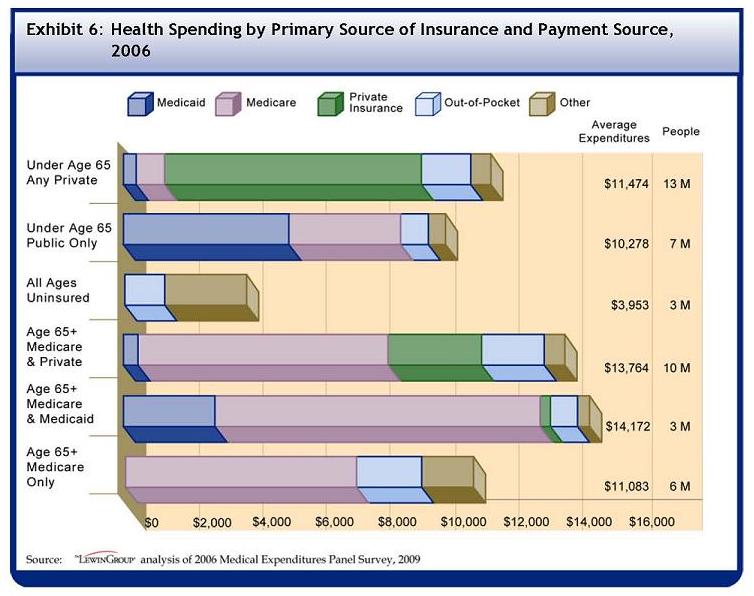
Among the 42 Million People with Both Chronic Conditions and Functional Limitations, Private Insurance Plays a Greater Role for Individuals Under Age 65
-
Among individuals under age 65 with chronic conditions and functional limitations, 13 million had some private insurance, while 7 million had only public insurance.
-
Among older Americans with chronic conditions and functional limitations, dual eligibles spent the most on average ($14,172 per person per year). Dual eligibles spent more than those who used a combination of public and private insurance ($13,764 per person per year) or people who primarily used Medicare only ($11,083 per person per year).
People with Chronic Conditions Only and Those with Both Chronic Conditions and Functional Limitations Have Similar Chronic Conditions
| Exhibit 7: Most Common Conditions by Select Groups, 2006 | |||
| People withChronicConditionsOnly | People withFunctionalLimitationsOnly | People withChronicConditions &FunctionalLimitations | People withChronicConditions &ReceivedADL/IADL Help |
| Chronic Conditions | Conditions Not Classified asChronic by AHRQ | Chronic Conditions | Chronic Conditions |
| Essential Hypertension | Back Disorder Nec & Nos | Essential Hypertension | Essential Hypertension |
| Allergic Rhinitis | Injury Nec/Nos | Dis of Lipoid Metabolism | Diabetes Mellitus |
| Dis of Lipoid Metabolism | Joint Disorder Nec & Nos | Arthropathies Nec/Nos | Dis of Lipoid Metabolism |
| Chronic Sinusitis | General Symptoms | Depressive Disorder Nec | Depressive Disorder Nec |
| Depressive Disorder Nec | Acute Nasopharyngitis | Diabetes Mellitus | Arthropathies Nec/Nox |
| Asthma | Other Intestinal Infection | Neurotic Disorders | Neurotic Disorders |
| Neurotic Disorders | Other Soft Tissue Dis | Allergic Rhinitis | Allergic Rhinitis |
| Diabetes Mellitus | Normal Pregnancy | Intervertebral Disc Dis | Ill-Defined Heart Disorder |
| Arthropathies Nec/Nos | Periph Enthesopathies | Asthma | Asthma |
| Migraine | Skin/Other Integument Symp | Ill-Defined Heart Disorder | Intervertebral Disc Dis |
| Acquired Hypothyroidism | Influenza | Chronic Sinusitis | Cataract |
| Hyperkinetic Syndrome | Sprain of Ankle & Foot | Cataract | Cardiac Dysrhythmias |
| Intervertebral Disc Disorder | Diseases of Esophagus | Cardiac Dysrhythmias | Acquired Hypothyroidism |
| Cataract | Sprain Of Knee & Leg | Acquired Hypothyroidism | Chronic Sinusitis |
| Ill-Defined Heart Disorder | Other Urinary Tract Disorder | Glaucoma | Heart Failure |
| SOURCE: The Lewin Group analysis of 2006 Medical Expenditures Panel Survey, 2009Dis: disorder; Nec: not elsewhere classified; Nos: not otherwise specified | |||
-
Hypertension (high blood pressure) tops the chronic condition list for all groups with some chronic condition.
-
People with chronic conditions and functional limitations commonly had hypertension, diabetes, lipoid metabolism disorders (high cholesterol), and arthritis disorders.
-
Mental health conditions (depression and neurotic disorders) constituted two of the top ten chronic conditions among people with chronic conditions and functional limitations.
-
The chronic conditions of allergies, chronic sinusitis, and asthma were more frequent among those with chronic conditions only than among those with both chronic conditions and functional limitations.
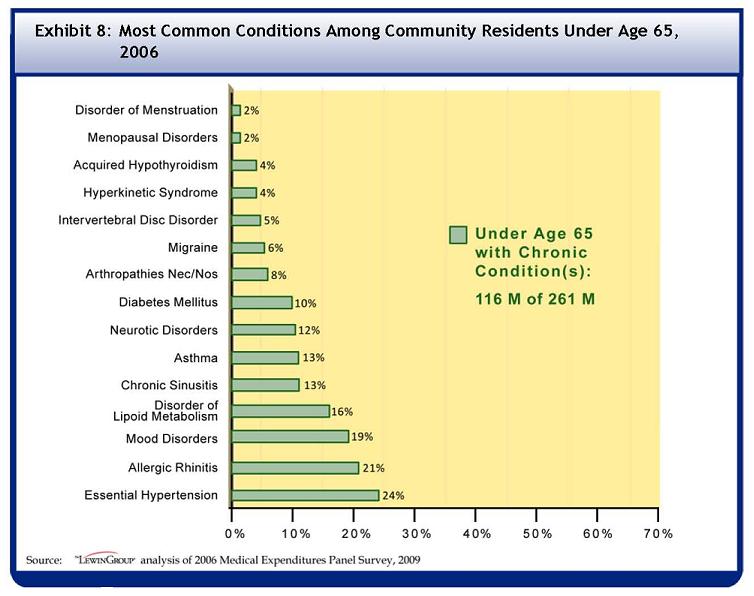
High Blood Pressure and Allergies Represent the Most Common Chronic Conditions Among People Under Age 65
 |
| Nec: not elsewhere classified; Nos: not otherwise specified |
-
About 44 percent of people under age 65 had a least one chronic condition (116 million out of 261 million).
-
About a quarter of people under age 65 with a chronic condition had hypertension (high blood pressure), and about a fifth had allergic rhinitis (allergies).
-
Other common chronic conditions included mood disorders (depression and affective psychoses) and lipoid metabolism disorders.
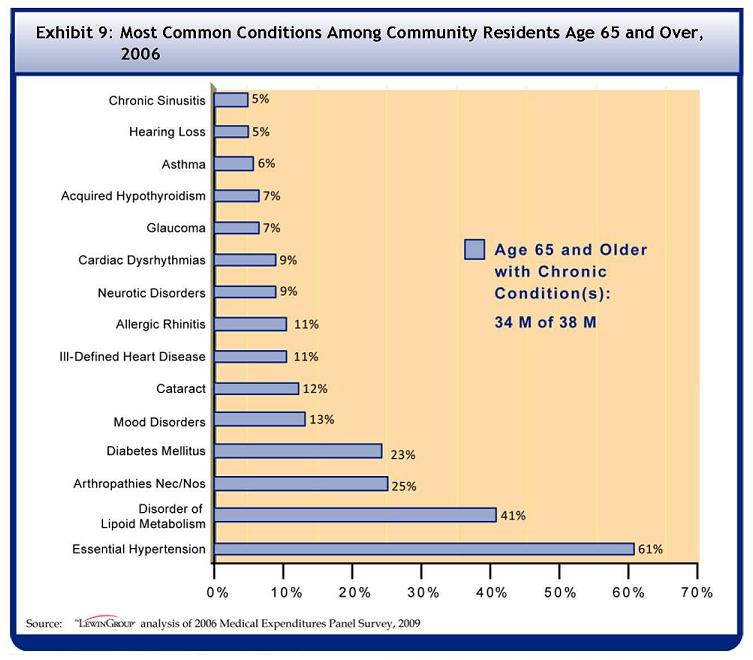
High Blood Pressure and High Cholesterol Represent the Most Common Chronic Conditions Among People Age 65 and Over
 |
| Nec: not elsewhere classified; Nos: not otherwise specified |
-
About 89 percent of people age 65 and over had a least one chronic condition (34 million out of 38 million).
-
About 60 percent of people age 65 and over with chronic conditions had hypertension (high blood pressure). About 40 percent had a lipoid metabolism disorder (high cholesterol). About a quarter had arthritis and nearly a quarter had diabetes.
-
Some conditions affected much larger percentages of people age 65 and over than people under age 65, such as arthropathies (arthritis), diabetes, hypertension and lipoid metabolism disorders.
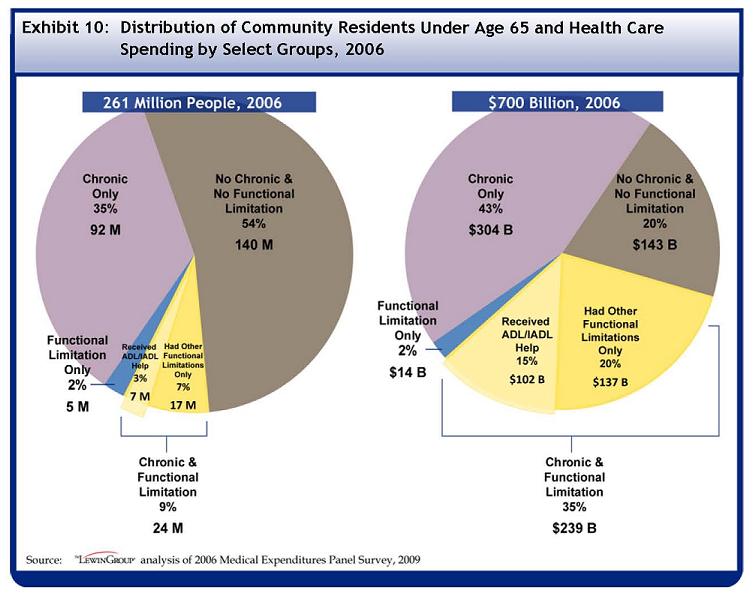
People with Functional Limitations and Chronic Conditions Represent Nine Percent of Adults Under Age 65, but Account for One-Third of the Group's Health Care Expenditures
-
Overall, the group under age 65 with chronic conditions and functional limitations (24 million) accounted for $239 billion in health care expenditures. On average, people in this group spent $10,391 on health care in 2006.
-
Among people under age 65, the group with chronic conditions who received help with ADLs or IADLs had disproportionately high health expenditures: 3 percent of people accounted for 15 percent of all spending.
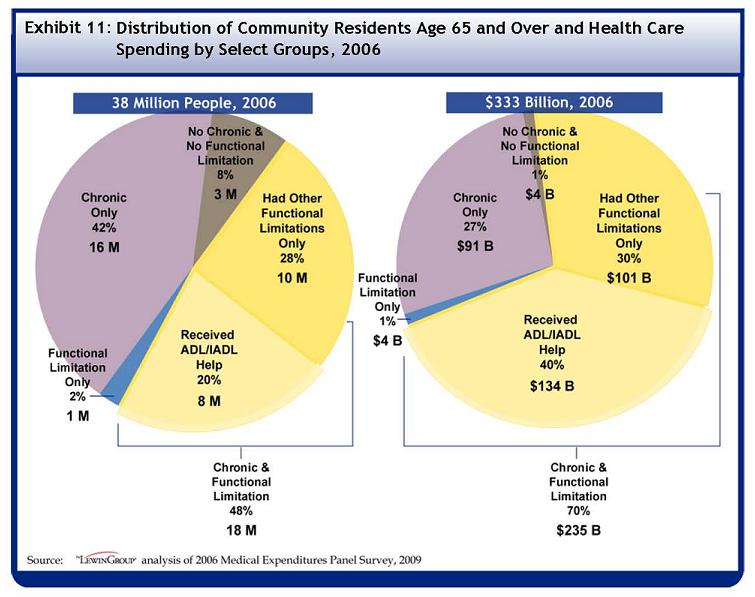
Almost Half of Older Adults Have Functional Limitations and Chronic Conditions, and Account for Over Two-Thirds of All Health Spending for that Age Group
-
The 18 million people age 65 and over with chronic conditions and functional limitations made up 6 percent of the all-ages community-based population and represented about a quarter of the nation's total health care spending ($235 billion out of $1.03 trillion).
-
The 20 percent of older adults with chronic conditions who received help with ADLs or IADLs represented 40 percent of all spending by community residents age 65 and over.
-
Older adults who had chronic conditions without functional limitations represented a relatively modest share of spending. The 42 percent with at least one chronic condition but no functional limitation accounted for 27 percent of spending for older adults.
III. TOP 5% OF HEALTH CARE SPENDERS
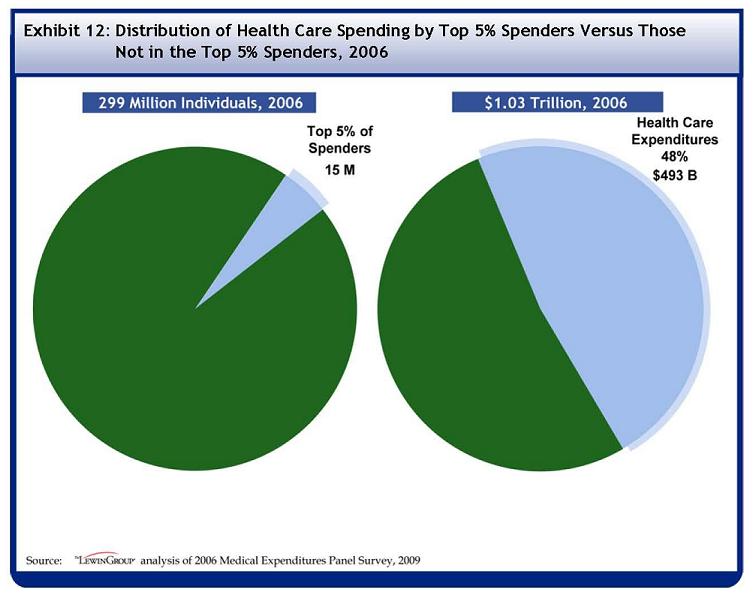
The Top 5% of Health Care Spenders in the Community Spend Half of Total Health Care Resources
-
Within the $1.03 trillion in health care expenditures among the U.S. community population, spending is highly concentrated among a relatively small proportion of individuals.
-
Given the high concentration of medical expenditures incurred by the top 5 percent of the population ranked by health care spending, identifying the characteristics of these individuals is important for policy.
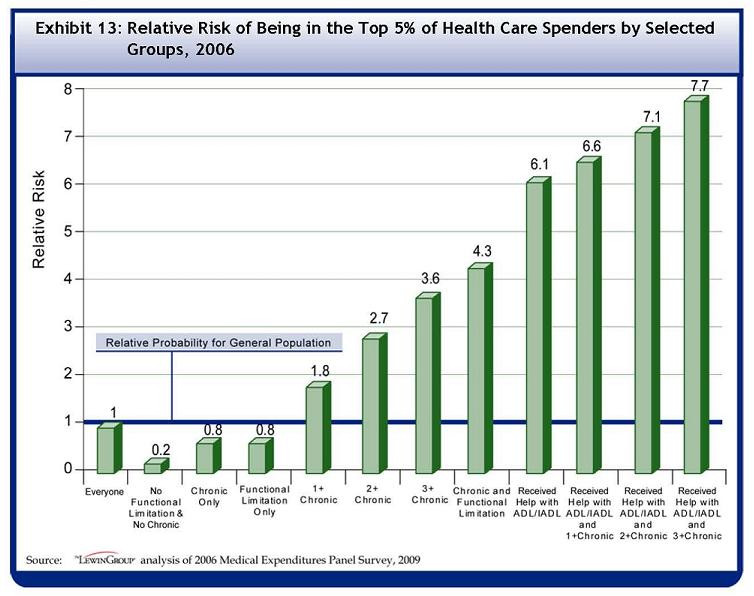
Among People with Chronic Conditions, Having a Functional Limitation Significantly Increases the Likelihood of Being in the Top 5% of Health Care Spenders
-
People with functional limitations and chronic conditions were over four times as likely to be in the top 5 percent of spenders as the general population.
-
People with at least one chronic condition who received help with an ADL or IADL were over six times as likely to be in the top 5 percent of spenders as the general population. Number of people in each bar and details of relative risk can be found in the Appendix.
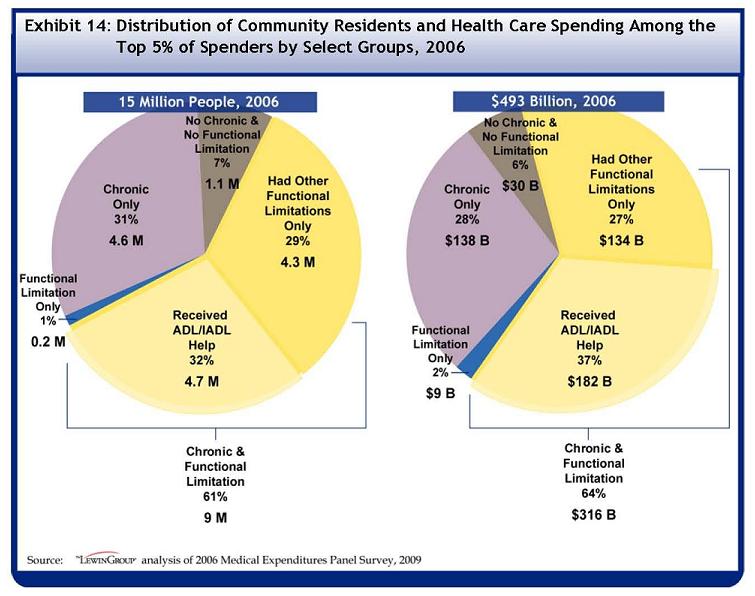
Among the Top 5% of Spenders, a Majority Have Chronic Conditions and Functional Limitations
-
People with chronic conditions who also received help with an ADL or IADL represented one-third of the top 5 percent of spenders and over a third of expenditures.
-
People in the top 5 percent of spenders with chronic conditions and, who received help with ADL or IADL, represent less than 2 percent of the overall community-based population, but represent 18 percent of all spending.
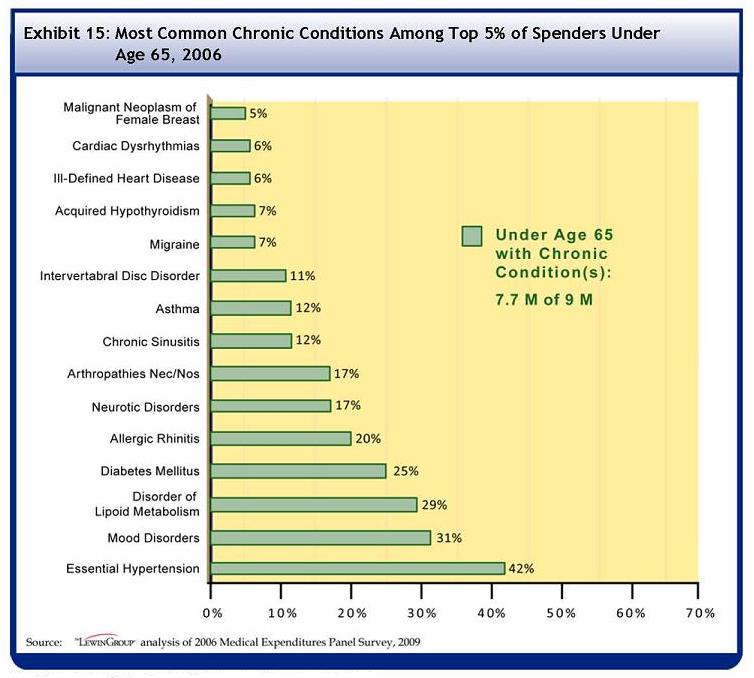
High Blood Pressure and Mood Disorders Represent the Most Common Chronic Conditions Among the Top 5% of Spenders Under Age 65
 |
| Nec: not elsewhere classified; Nos: not otherwise specified |
-
Top chronic conditions for those in the top 5 percent of spenders and the overall population were very similar-hypertension (high blood pressure), mood disorders (depression and affective psychoses), lipoid metabolism disorders, and diabetes.
-
However, chronic conditions were more prevalent among the top 5 percent of spenders than in the overall population under 65. For example, 24 percent of the overall population under age 65 had hypertension, as seen in Exhibit 8, but 42 percent of the top 5 percent under age 65 had hypertension.
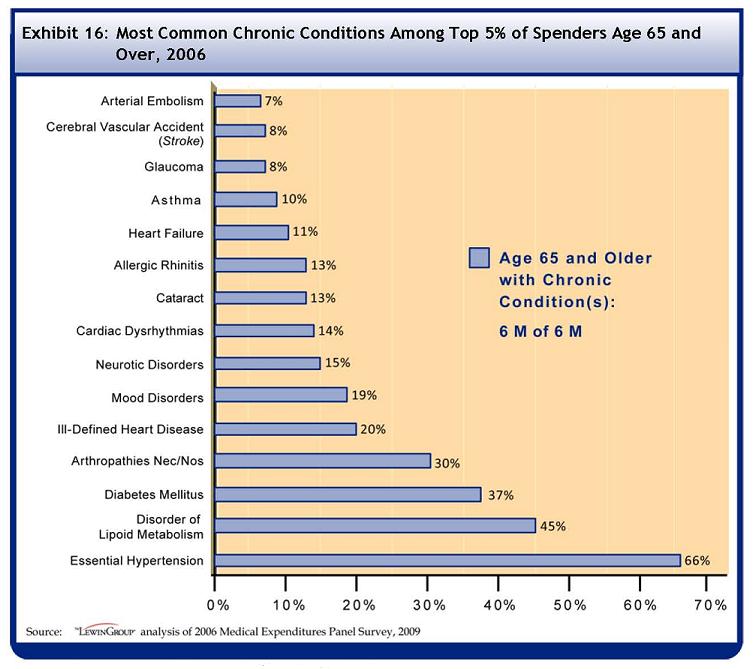
High Blood Pressure and High Cholesterol Also Represent the Most Common Chronic Conditions Among the Top 5% of Spenders Age 65 and Over
 |
| Nec: not elsewhere classified; Nos: not otherwise specified |
-
Two-thirds of older adults in the top 5 percent of spenders had hypertension (high blood pressure), and almost half had a lipoid metabolism disorder (high cholesterol).
-
While chronic conditions were important for high health care spenders in both age groups, the conditions affected much larger percentages of people age 65 and over. For example, 66 percent of older top-tier spenders reported hypertension, while 42 percent of the younger group reported hypertension.
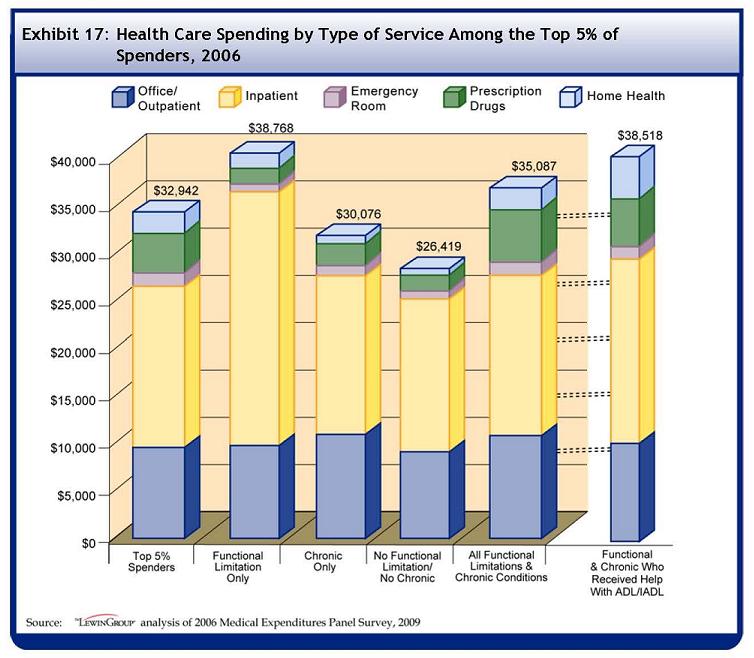
Among the Top 5% of Spenders, People with Chronic Conditions and Functional Limitations Spend More on Prescription Drugs and Home Health Care
-
On average, individuals in the top 5 percent spent ten times more than the general population on health care services ($32,942 versus $3,452).
-
People who received help with ADLs or IADLs and had chronic conditions spent nearly three times the average home health expenditures as the overall top 5 percent group ($4,611 versus $1,750, see Appendix).
-
On average, people with chronic conditions and functional limitations represent the higher spending among highest spenders. The 95th percentile of health care expenditures, the threshold for the top 5 percent of spenders group, was $14,600. However, the top 5 percent spenders with both functional limitations and chronic conditions spent an average of $35,087 on health care in 2006.
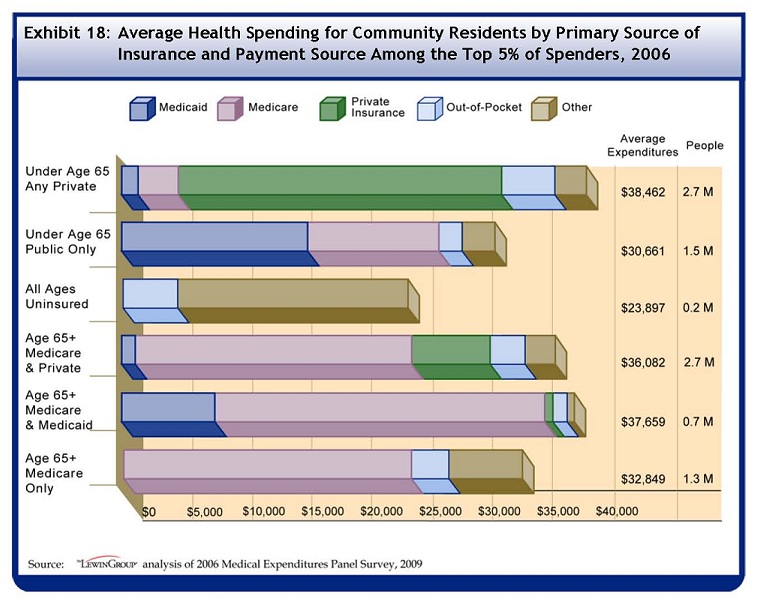
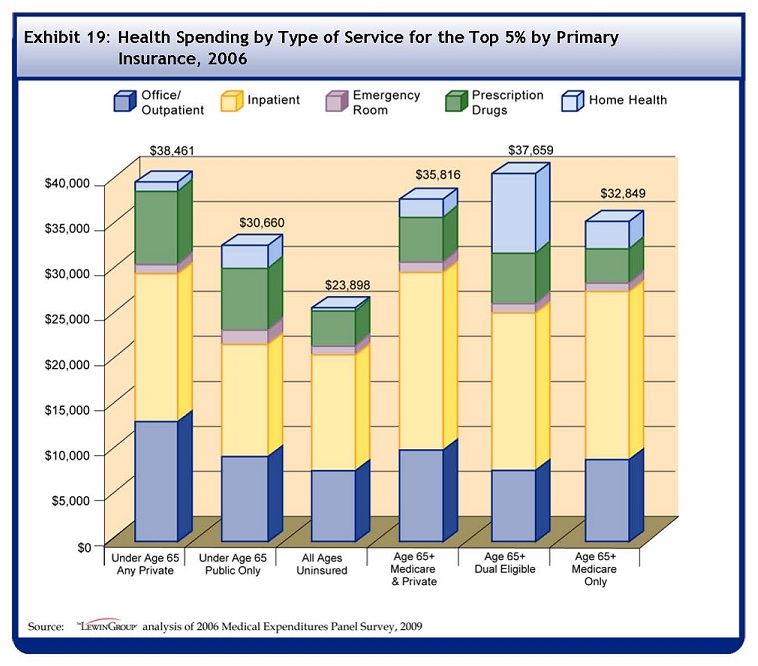
Among Top 5% Spenders with Both Chronic Conditions and Functional Limitations, Private Insurance Plays a Greater Role for Individuals Under Age 65
-
Among the nine million community residents with both chronic conditions and functional limitations who spent at least $14,600 in health care in 2006, individuals under age 65 relied more heavily on private insurance than public insurance.
-
Among the primary insurance groups for older adults in the top 5 percent with both chronic conditions and functional limitations, Medicare covered between $24,000 and $28,000 in 2006.
Older Adults with Medicaid and Medicare (Dual Eligibles) in the Top 5% of Spenders with Chronic Conditions and Functional Limitations Have High Home Health Expenditures
-
Older dual eligibles in the top 5 percent with both chronic conditions and functional limitations spent an average of $8,516 a year on home health, two to three times the amount that older adults in other insurance categories spent. The older dual eligibles also had lower expenditures for outpatient and inpatient care compared to other older adults of different coverage types.
-
Among people under age 65 in the top 5 percent with both chronic conditions and functional limitations, people with public insurance only spent on average over three times as much on home health as people with some private insurance ($3,502 versus $1,040).
IV. DUAL ELIGIBLES
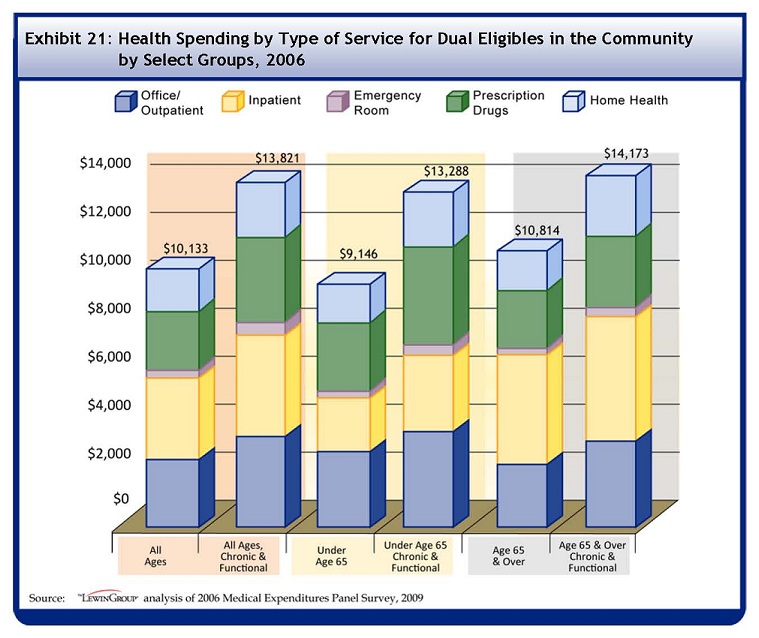
Dual Eligibles Are a Group with Chronic Conditions, Functional Limitations, and Significant Expenditures
| Exhibit 20: Overview of Dual Eligibles in the Community, 2006 | |||||
| Number ofDual Eligibles in Community (Millions) | Percent ofTotal Community Population | TotalHealth Care Expenditures (Billions) | Percent ofTotalHealth Care Expenditures | AverageAnnualHealth Care Expenditures | |
| All Dual Eligibles | 7.0 | 2.3% | $70 | 7% | $10,133 |
| Dual Eligibles with Chronic Conditions and Functional Limitations | 4.4 | 1.5% | $60 | 6% | $13,821 |
| Age 65 & Older | 2.6 | 0.6% | $37 | 4% | $14,173 |
| Under Age 65 | 1.7 | 0.9% | $23 | 2% | $13,288 |
| SOURCE: The Lewin Group analysis of 2006 Medical Expenditures Panel Survey, 2009 | |||||
-
In 2006, seven million people living in the community had both Medicare and Medicaid coverage. Among them, 63 percent had both chronic conditions and functional limitations.
-
Dual eligibles in the community spent $70.3 billion on health care in 2006. On average, dual eligibles spent $10,133 on health care, compared to $3,452 annual health care expenditure for the community-based population at the national level.
-
Dual eligibles with chronic conditions and functional limitations represented about 1.5 percent of the community-based population, and with $60.5 billion in total expenditures, represented 6 percent of the nation's spending.
-
On average, dual eligibles with chronic conditions and functional limitations spent $13,821 on health care in 2006. About 28 percent of this group is in the top 5 percent of spenders, meaning that dual eligibles with chronic conditions and functional limitations were over five times as likely to be in the top 5 percent of spenders as the general population.
-
Many dual eligibles with chronic conditions and functional limitations were younger- 1.7 million were under the age of 65, making up 39 percent of all dual eligibles with chronic conditions and functional limitations.
-
On average, older dual eligibles with chronic conditions and functional limitations spent $14,173 on health care a year, close to the 95th percentile of health care spending ($14,600).
Most Dual Eligibles Have Chronic Conditions and Functional Limitations, and Correspondingly Higher Expenditures
-
Overall, dual eligibles spent $10,133 on health care and dual eligibles with chronic conditions and functional limitations spent $13,821. The national average for health care spending among the general population was $3,452.
-
Younger dual eligibles with chronic conditions and functional limitations spent almost twice as much on home health ($2,240) than the overall younger dual eligibles group ($1,395).
V. CONCLUSION
Conclusion
-
People with functional limitations and chronic conditions need more health care services and help with activities of daily living, placing heavy demands on service delivery, social supports, and public budgets.
-
Functional limitations, ADLs, and IADLs, in combination with chronic conditions, appear to serve as a more promising indicator than chronic conditions alone for the small group of individuals with a heavy concentration of health care spending.
-
Some Key Findings from this Chartbook:
-
People with both chronic conditions and functional limitations who received help with an ADL or IADL represented 5 percent of the population and 23 percent of all spending. This group spent at least four times the overall average annual health expenditures for all community residents.
-
People under age 65 with chronic conditions and functional limitations represent nine percent of younger adults but account for one-third of health care expenditures for the group.
-
Almost half of older adults had chronic conditions and functional limitations and accounted for over two-thirds of all health spending for that age group.
-
Among those with one chronic condition, people who received help with ADLs or IADLs spent almost four times what people with only one chronic condition spent.
-
Those with chronic conditions and who received help with ADLs or IADLs spent nearly $2,000 on home health, about 19 times the overall average.
-
People with at least one chronic condition who received help with ADLs or IADLs were over six times as likely to be in the top 5 percent of spenders as the general population.
-
The $493 billion spent on health care by 5 percent of the U.S. population represented half of health care spending by the entire community-based population in 2006 ($1 trillion). Among the top 5 percent of spenders, a majority-61 percent-had a chronic condition and functional limitation, which represented 64 percent of spending.
-
Among the top 5 percent of spenders, people with chronic conditions and functional limitations spent more on prescription drugs and home health.
-
Most dual eligibles had chronic conditions and functional limitations, and correspondingly higher expenditures.
-
-
The data presented here support continued study of emerging new models to better manage chronic conditions and functional limitations, as well as other strategies to prevent or delay functional limitation among those with chronic conditions only.
APPENDIX
Appendix Each table in this Appendix provides data used in developing the corresponding figure or chart in the report. For example, Exhibit A-3 provides the amounts paid for each type of service listed in the bar chart Exhibit 3.
| Exhibit A-1: Distribution of Community Residents and Health Care Spending by Select Groups, 2006 | ||
| Health Status | Community Residents(Millions) | Percent of Total People |
| No Chronic, No Limitation | 143.3 | 48% |
| Chronic Only | 108.5 | 36% |
| Functional Limitation Only | 5.5 | 2% |
| Chronic and Functional Limitation | 42 | 14% |
| Among Chronic Condition and Functional Limitation | Community Residents(Millions) | Percent of Total People |
| Received ADL-IADL Help | 14.3 | 5% |
| Had Other Functional Limitations Only | 27.6 | 9% |
| Total | 299.3 | 100% |
| Expenditures | Total Spending(Billions) | Percent of Total Spending |
| No Chronic, No Limitation | $ 146.4 | 14% |
| Chronic Only | $ 395.1 | 38% |
| Functional Limitation Only | $ 18.1 | 2% |
| Chronic and Functional Limitation | $ 473.4 | 46% |
| Among Chronic Conditions and Functional Limitation | Total Spending(Billions) | Percent of Total Spending |
| Received ADL-IADL Help | $ 235.7 | 23% |
| Had Other Functional Limitations Only | $ 237.8 | 23% |
| Total | $ 1,033 | 100% |
| Exhibit A-2: Average Annual Health Spending by Number of Chronic Conditions & Functional Limitations or ADLs/IADLs, 2006 | |||
| Number of Chronic Conditions | No FunctionalLimitation | Had OtherFunctionalLimitation Only | Received Helpwith an ADL/IADL |
| No Chronic Condition | $ 1,022 | $ 2,672 | $ 5,287 |
| 1 Chronic Condition | $ 2,380 | $ 4,974 | $ 8,942 |
| 2 Chronic Conditions | $ 3,817 | $ 6,383 | $ 12,233 |
| 3 Chronic Conditions | $ 4,976 | $ 8,612 | $ 14,296 |
| 4 Chronic Conditions | $ 6,416 | $ 9,401 | $ 16,016 |
| 5+ Chronic Conditions | $ 9,723 | $ 12,749 | $22,380 |
| Exhibit A-3: Average Spending by Type of Service for Select Groups, 2006 | ||||||
| HealthServices | Everyone | Functional LimitationOnly | Chronic Condition Only | NoFunctionalLimitatoin, No Chronic Condition | All Functional Limitation& ChronicCondition | Subset ofFunctionalLimitation& Chronic--PeoplewhoReceived ADL/IADL Help |
| Outpatient | $ 1,117 | $ 1,168 | $ 1,349 | $ 365 | $ 3,079 | $ 3,464 |
| Inpatient | $ 1,027 | $ 1,298 | $ 843 | $ 288 | $3,989 | $ 6,870 |
| Emergency Room | $ 125 | $ 142 | $ 128 | $ 71 | $ 304 | $ 436 |
| Prescription Drugs | $ 746 | $ 230 | $ 893 | $ 69 | $ 2,746 | $ 3,286 |
| Home Health | $ 113 | $ 104 | $ 22 | $ 4 | $ 723 | $ 1,909 |
| Average Total Expenditures | $ 3,452 | $ 3,278 | $ 3,641 | $ 1,022 | $ 11,284 | $ 16,418 |
| HealthServices | Millions ofCommunityResidents,Everyone | Millions ofCommunityResidents,FunctionalLimitationOnly | Millions ofCommunityResidents,ChronicConditionOnly | Millions ofCommunityResidents,NoFunctionalLimitatoin,No ChronicCondition | Millions ofCommunityResidents,AllFunctionalLimitation& ChronicCondition | Millions ofCommunityResidents,Subset ofFunctionalLimitation& Chronic--PeoplewhoReceivedADL/IADLHelp |
| Community Residents (Millions) | 299.3 | 5.5 | 108.5 | 143.3 | 42.0 | 14.3 |
| Percent ofTotalSpending,Everyone | Percent ofTotalSpending,FunctionalLimitationOnly | Percent ofTotalSpending,ChronicConditionOnly | Percent ofTotalSpending,NoFunctionalLimitatoin,No ChronicCondition | Percent ofTotalSpending,AllFunctionalLimitation& ChronicCondition | Percent ofTotalSpending,Subset ofFunctionalLimitation& Chronic--PeoplewhoReceivedADL/IADLHelp | |
| Percent of Total Spending | 100% | 2% | 38% | 14% | 46% | 23% |
| Exhibit A-4: Health Spending by Source of Financing for Select Groups, 2006 | ||||||
| Payment Source | Everyone | Functional LimitationOnly | Chronic Condition Only | NoFunctionalLimitatoin, No Chronic Condition | All Functional Limitation& ChronicCondition | Subset ofFunctionalLimitation& Chronic--PeoplewhoReceived ADL/IADL Help |
| Medicaid Expenditures | $ 299 | $ 453 | $ 200 | $ 132 | $ 1,107 | $ 2,100 |
| Medicare Expenditures | $ 812 | $ 581 | $ 471 | $ 13 | $ 4,456 | $ 7,853 |
| Private Insurance Expenditures | $ 1,408 | $ 1,323 | $ 1,889 | $ 564 | $ 3,061 | $ 3,601 |
| Out-of-Pocket Expenditures | $ 654 | $ 525 | $ 860 | $ 239 | $ 1,557 | $ 1,831 |
| Other Payment | $ 278 | $ 396 | $ 221 | $ 74 | $ 1,103 | $ 1,032 |
| Average Total Expenditures | $ 3,452 | $ 3,278 | $ 3,641 | $ 1,022 | $ 11,284 | $ 16,418 |
| Payment Sources | Millions ofCommunityResidents,Everyone | Millions ofCommunityResidents,FunctionalLimitationOnly | Millions ofCommunityResidents,ChronicConditionOnly | Millions ofCommunityResidents,NoFunctionalLimitatoin,No ChronicCondition | Millions ofCommunityResidents,AllFunctionalLimitation& ChronicCondition | Millions ofCommunityResidents,Subset ofFunctionalLimitation& Chronic--PeoplewhoReceivedADL/IADLHelp |
| Community Residents (Millions) | 299.3 | 5.5 | 108.5 | 143.3 | 42.0 | 14.3 |
| Percent ofTotalSpending,Everyone | Percent ofTotalSpending,FunctionalLimitationOnly | Percent ofTotalSpending,ChronicConditionOnly | Percent ofTotalSpending,NoFunctionalLimitatoin,No ChronicCondition | Percent ofTotalSpending,AllFunctionalLimitation& ChronicCondition | Percent ofTotalSpending,Subset ofFunctionalLimitation& Chronic--PeoplewhoReceivedADL/IADLHelp | |
| Percent of Total Spending | 100% | 2% | 38% | 14% | 46% | 23% |
| Exhibit A-6: Health Spending by Primary Source of Insurance and Payment Source Among Community Residents with Chronic Conditions & Functional Limitations, 2006 | ||||||
| PaymentSource | Under Age65, AnyPrivate | Under Age65, PublicOnly | All Age,Uninsured | Age 65+,Medicare &Privatea | Age 65+,Medicare &Medicaid | Age 65+,MedicareOnly |
| Medicaid | $ 203 | $ 5,112 | --- | $ 173 | $ 2,646 | --- |
| Medicare | $ 929 | $ 3,311 | --- | $ 8,185 | $ 10,213 | $ 7,637 |
| Private | $ 7,746 | --- | --- | $ 2,578 | $ 132 | --- |
| Out-of-Pocket | $ 1,747 | $ 971 | $ 1,643 | $ 1,808 | $ 808 | $ 1,755 |
| Other | $ 849 | $ 884 | $ 2,310 | $ 1,020 | $ 373 | $ 1,691 |
| Average Total Expenditures | $ 11,474 | $ 10,278 | $ 3,953 | $ 13,764 | $ 14,172 | $ 11,083 |
| Millions ofCommunityResidents,Under Age65, AnyPrivate | Millions ofCommunityResidents,Under Age65, PublicOnly | Millions ofCommunityResidents,All Age,Uninsured | Millions ofCommunityResidents,Age 65+,Medicare &Private | Millions ofCommunityResidents,Age 65+,Medicare &Medicaid | Millions ofCommunityResidents,Age 65+,MedicareOnly | |
| Community Residents (Millions) | 13 | 7 | 3 | 10 | 3 | 6 |
| Percent ofTotalSpending,Under Age65, AnyPrivate | Percent ofTotalSpending,Under Age65, PublicOnly | Percent ofTotalSpending,All Age,Uninsured | Percent ofTotalSpending,Age 65+,Medicare &Private | Percent ofTotalSpending,Age 65+,Medicare &Medicaid | Percent ofTotalSpending,Age 65+,MedicareOnly | |
| Percent of Total Spending For those With Chronic Conditions and Functional Limitations | 31% | 17% | 7% | 24% | 7% | 14% |
| ||||||
| Exhibit A-8: Most Common Conditions Among Community Residents Under Age 65 with At Least One Chronic Condition, 2006 | |
| Under Age 65 | Percent of People with Condition, Outof 116 Million Community Residentswith Some Chronic Condition |
| Disorder of Menstruation | 2% |
| Menopausal Disorders | 2% |
| Acquired Hypothyroidism | 4% |
| Hyperkinetic Syndrome | 4% |
| Intervertebral Disc Disorder | 5% |
| Migraine | 6% |
| Arthropathies Nec/Nos | 8% |
| Diabetes Mellitus | 10% |
| Neurotic Disorders | 12% |
| Asthma | 13% |
| Chronic Sinusitis | 13% |
| Disorder of Lipoid Metabolism | 16% |
| Mood Disorder | 19% |
| Allergic Rhinitis | 21% |
| Essential Hypertension | 24% |
| Mood Disorders is comprised of people with Depressive Disorders Nec and Affective Psychoses.Total number of community residents under age 65 is 261 M. | |
| Exhibit A-9: Most Common Conditions Among Community Residents Age 65 and Over, 2006 | |
| Age 65 & Over | Percent of People with Condition, Outof 34 Million Community Residents withSome Chronic Condition |
| Chronic Sinusitis | 5% |
| Hearing Loss | 5% |
| Asthma | 6% |
| Acquired Hypothyroidism | 7% |
| Glaucoma | 7% |
| Cardiac Dysrhythmias | 9% |
| Neurotic Disorders | 9% |
| Allergic Rhinitis | 11% |
| Ill-Defined Heart Disorder | 11% |
| Cataract | 12% |
| Mood Disorders | 13% |
| Diabetes Mellitus | 23% |
| Arthropathies Nec/Nos | 25% |
| Disorder of Lipoid Metabolism | 41% |
| Essential Hypertension | 61% |
| Mood Disorders is comprised of people with Depressive Disorders Nec and Affective Psychoses.Total number of community residents age 65 and over is 38 M. | |
| Exhibit A-10: Distribution of Community Residents Under Age 65 and Health Care Spending by Select Groups, 2006 | ||
| Health Status | Community Residents(Millions) | Percent of Total People |
| No Chronic, No Limitation | 140.4 | 54% |
| Chronic Only | 92.4 | 35% |
| Functional Limitation Only | 4.7 | 2% |
| Chronic and Functional Limitation | 23.7 | 9% |
| Among Chronic Condition and Functional Limitation | Community Residents(Millions) | Percent of Total People |
| Received ADL-IADL Help | 6.6 | 3% |
| Had Other Functional Limitations Only | 17.1 | 7% |
| Total | 261.2 | 100% |
| Expenditures | Total Spending(Billions) | Percent of Total Spending |
| No Chronic, No Limitation | $ 142.8 | 20% |
| Chronic Only | $ 304.1 | 43% |
| Functional Limitation Only | $ 14.1 | 2% |
| Chronic and Functional Limitation | $ 238.7 | 35% |
| Among Chronic Conditions and Functional Limitation | Total Spending(Billions) | Percent of Total Spending |
| Received ADL-IADL Help | $ 101.8 | 15% |
| Had Other Functional Limitations Only | $ 136.9 | 20% |
| Total | $ 699.7 | 100% |
| Exhibit A-11: Distribution of Community Residents Age 65 and Over and Health Care Spending by Select Groups, 2006 | ||
| Health Status | Community Residents(Millions) | Percent of TotalPeople |
| No Chronic, No Limitation | 2.9 | 8% |
| Chronic Only | 16.1 | 42% |
| Functional Limitation Only | 0.8 | 2% |
| Chronic and Functional Limitation | 18.2 | 48% |
| Among Chronic Condition and Functional Limitation | Community Residents(Millions) | Percent of TotalPeople |
| Received ADL-IADL Help | 7.7 | 20% |
| Had Other Functional Limitations Only | 10.5 | 28% |
| Total | 38.0 | 100% |
| Expenditures | Total Spending(Billions) | Percent of TotalSpending |
| No Chronic, No Limitation | $ 3.6 | 1% |
| Chronic Only | $ 91.0 | 27% |
| Functional Limitation Only | $ 4.0 | 1% |
| Chronic and Functional Limitation | $ 234.7 | 70% |
| Among Chronic Conditions and Functional Limitation | Total Spending(Billions) | Percent of TotalSpending |
| Received ADL-IADL Help | $ 133.9 | 40% |
| Had Other Functional Limitations Only | $ 100.8 | 30% |
| Total | $ 333.4 | 100% |
| Exhibit A-12: Distribution of Health Care Spending by Top 5% of Spenders Versus Those Not in the Top 5% Spenders, 2006 | ||
| Spending Status | Community Residents(Millions) | Percent of TotalPeople |
| Not Top 5% | 284.3 | 95% |
| Top 5% | 15.0 | 5% |
| Total | 299.3 | 100% |
| Expenditures | Total Spending(Billions) | Percent of TotalSpending |
| Not Top 5% | $ 539.9 | 52% |
| Top 5% | $ 493.2 | 48% |
| Total | $ 1,033.1 | 100% |
| Exhibit A-13: Relative Risk of Being in the Top 5% of Health Care Spenders by Selected Groups, 2006 | |||
| Group (By Chronic Condition,Functional Limitation) | CommunityResidents in theTop 5% ofSpenders(Millions) | Percent of Groupin Top 5% ofSpenders | Relative Probabilityof Being in theTop 5% |
| All Community Residents | 15.0 | 5% | 1.0 |
| No Chronic Condition, No Functional Limitation | 1.1 | 1% | 0.2 |
| Chronic Condition Only | 4.6 | 4% | 0.8 |
| Functional Limitation Only | 0.2 | 4% | 0.8 |
| 1+ Chronic Conditions | 13.6 | 9% | 1.8 |
| 2+ Chronic Conditions | 11.5 | 13% | 2.7 |
| 3+ Chronic Conditions | 9.3 | 18% | 3.6 |
| Chronic Conditions and Functional Limitation | 9.0 | 21% | 4.3 |
| Help with an ADL/IADL | 4.8 | 31% | 6.1 |
| Help with an ADL/IADL and 1+ Chronic Conditions | 4.7 | 33% | 6.6 |
| Help with an ADL/IADL and 2+ Chronic Conditions | 4.4 | 36% | 7.1 |
| Help with an ADL/IADL and 3+ Chronic Conditions | 3.8 | 38% | 7.7 |
| NOTE: Relative risk for being in the top 5% of spenders is the probability that a specified group will be in the top 5%, compared to the overall probability of being in the top 5% of spenders. | |||
| Exhibit A-14: Distribution of Community Residents and Health Care Spending Among the Top 5% of Spenders by Select Groups, 2006 | ||
| Health Status | Community Residents(Millions) | Percent of Total People |
| No Chronic Condition, No Functional Limitation | 1.1 | 7% |
| Chronic Condition Only | 4.6 | 31% |
| Functional Limitation Only | 0.2 | 1% |
| Chronic Condition and Functional Limitation | 9.0 | 61% |
| Among Chronic Condition and Functional Limitation | Community Residents(Millions) | Percent of Total People |
| Received ADL-IADL Help | 4.7 | 32% |
| Had Other Functional Limitations Only | 4.3 | 29% |
| Total | 15 | 100% |
| Expenditures | Total Spending(Billions) | Percent of Total Spending |
| No Chronic Condition, No Functional Limitation | $ 30.3 | 6% |
| Chronic Condition Only | $ 137.9 | 28% |
| Functional Limitation Only | $ 8.6 | 2% |
| Chronic Condition and Functional Limitation | $ 316.3 | 64% |
| Among Chronic Conditions and Functional Limitation | Total Spending(Billions) | Percent of Total Spending |
| Received ADL-IADL Help | $ 181.8 | 37% |
| Had Other Functional Limitations Only | $ 134.5 | 27% |
| Total | $ 493.2 | 100% |
| Exhibit A-15: Most Common Chronic Diseases Among Top 5% of Spenders Under Age 65, 2006 | |
| Community Residents Under Age 65 | Percent of People with Condition, Outof 7.7 Million Community Residentswith Some Chronic Condition |
| Malignant Neoplasm of Female Breast | 5% |
| Cardiac Dysrhythmias | 6% |
| Ill-Defined Heart Disease | 6% |
| Acquired Hypothyroidism | 7% |
| Migraine | 7% |
| Intervertebral Disc Disorder | 11% |
| Asthama | 12% |
| Chronic Sinusitis | 12% |
| Arthropathies Nec/Nos | 17% |
| Neurotic Disorders | 17% |
| Allergic Rhinitis | 20% |
| Diabetes Mellitus | 25% |
| Disorder of Lipoid Metabolism | 29% |
| Mood Disorder | 31% |
| Essential Hypertension | 42% |
| Mood Disorders is comprised of people with Depressive Disorders Nec and Affective Psychoses.Total number of community residents in the top 5% of spenders under age 65 is 9 M. | |
| Exhibit A-16: Most Common Conditions Among Top 5% of Spenders Age 65 and Over, 2006 | |
| Community Residents Age 65 & Over | Percent of People with Condition, Outof 6 Million Community Residents withSome Chronic Condition |
| Arterial Embolism | 7% |
| Cerebral Vascular Accident | 8% |
| Glaucoma | 8% |
| Asthma | 10% |
| Heart Failure | 11% |
| Allergic Rhinitis | 13% |
| Cataract | 13% |
| Cardiac Dysrhythmias | 14% |
| Neurotic Disorder | 15% |
| Mood Disorders | 19% |
| Ill-Defined Heart Disease | 20% |
| Arthropathies Nec/Nos | 30% |
| Diabetes Mellitus | 37% |
| Disorder of Lipoid Metabolism | 45% |
| Essential Hypertension | 66% |
| Mood Disorders is comprised of people with Depressive Disorders Nec and Affective Psychoses.Total number of community residents in the top 5% of spenders age 65 and over is 6 M. | |
| Exhibit A-17: Health Care Spending by Type of Service Among the Top 5% of Spenders, 2006 | ||||||
| Top 5% of Spenders | Functional LimitationOnly | Chronic Condition Only | NoFunctionalLimitatoin, No Chronic Condition | Functional Limitation& ChronicCondition | Subset ofFunctionalLimitation& Chronic--PeoplewhoReceived ADL/IADL Help | |
| Outpatient | $ 8,363 | $ 8,562 | $ 9,324 | $ 6,555 | $ 8,100 | $ 7,305 |
| Inpatient | $ 16,628 | $ 25,629 | $ 15,602 | $ 16,694 | $ 16,919 | $ 19,462 |
| Emergency Room | $ 767 | $ 376 | $ 704 | $ 899 | $ 792 | $ 885 |
| Prescription Drugs | $ 4,630 | $ 1,892 | $ 3,101 | $ 1,132 | $ 5,920 | $ 5,608 |
| Home Health | $ 1,750 | $ 1,375 | $ 394 | $ 288 | $ 2,636 | $ 4,611 |
| Average Total Expenditures | $ 32,942 | $ 38,768 | $ 30,076 | $ 26,419 | $ 35,087 | $ 38,518 |
| Millions ofCommunityResidents,Top 5% ofSpenders | CommunityResidents,Top 5% ofSpenders,FunctionalLimitationOnly | CommunityResidents,Top 5% ofSpenders,ChronicConditionOnly | CommunityResidents,Top 5% ofSpenders,NoFunctionalLimitatoin,No ChronicCondition | CommunityResidents,Top 5% ofSpenders,FunctionalLimitation& ChronicCondition | CommunityResidents,Top 5% ofSpenders,Subset ofFunctionalLimitation& Chronic--PeoplewhoReceivedADL/IADLHelp | |
| Community Residents (Millions) | 15.0 | 0.2 | 4.6 | 1.1 | 9.0 | 4.7 |
| Percent ofTotalSpendingfor Top 5% | Percent ofTotalSpendingfor Top 5%FunctionalLimitationOnly | Percent ofTotalSpendingfor Top 5%ChronicConditionOnly | Percent ofTotalSpendingfor Top 5%NoFunctionalLimitatoin,No Chronic | Percent ofTotalSpendingfor Top 5%Functional& Chronic | Percent ofTotalSpendingfor Top 5%Subset ofFunctional& ChronicReceivedADL/IADLHelp | |
| Percent of Total Spending | 100% | 2% | 28% | 6% | 64% | 37% |
| Exhibit A-18: Average Health Spending for Community Residents with Chronic Conditions and Functional Limitations by Primary Source of Insurance and Payments Source Among the Top 5% of Spenders, 2006 | ||||||
| InsurancePayment | Under Age65 AnyPrivate | Under Age65 PublicOnly | All AgesUninsured | Age 65+Medicare& Private | Age 65+Medicare&Medicaid | Age 65+MedicareOnly |
| Medicaid | $ 736 | $ 15,065 | $ 0 | $ 616 | $ 7,192 | $ 0 |
| Medicare | $ 3,808 | $ 10,963 | $ 0 | $ 23,447 | $ 27,921 | $ 24,196 |
| Private | $ 27,185 | $ 0 | $ 0 | $ 6,307 | $ 373 | $ 0 |
| Self | $ 4,007 | $ 2,111 | $ 4,489 | $ 2,918 | $ 1,302 | $ 3,145 |
| Other | $ 2,726 | $ 2,522 | $ 19,408 | $ 2,794 | $ 871 | $ 5,508 |
| Average Total Expenditures | $ 38,461 | $ 30,660 | $ 23,898 | $ 36,081 | $ 37,659 | $ 32,849 |
| Millions ofCommunityResidents,Under Age65 AnyPrivate | Millions ofCommunityResidents,Under Age65 PublicOnly | Millions ofCommunityResidents,All AgeUninsured | Millions ofCommunityResidents,Age 65+Medicare &Private | Millions ofCommunityResidents,Age 65+Medicare &Medicaid | Millions ofCommunityResidents,Age 65+MedicareOnly | |
| Community Residents (Millions) | 2.7 | 1.5 | 0.2 | 2.7 | 0.7 | 1.3 |
| Percent ofTop 5%,Under Age65 AnyPrivate | Percent ofTop 5%,Under Age65 PublicOnly | Percent ofTop 5%, AllAgesUninsured | Percent ofTop 5%,Age 65+Medicare &Private | Percent ofTop 5%,Age 65+Medicare &Medicaid | Percent ofTop 5%,Age 65+MedicareOnly | |
| Percent of Top 5% with Chronic Conditions & Functional Limitations | 30% | 16% | 2% | 29% | 8% | 14% |
| Exhibit A-19: Health Spending by Type of Service for the Top 5% by Primary Insurance, 2006 | ||||||
| Health ServicesSettings | Under Age 65, AnyPrivate | Under Age 65, PublicOnly | All Age, Uninsured | Over Age65, Medicare & Private | Over Age 65, DualEligible | Over Age 65,MedicareOnly |
| Outpatient | $ 11,602 | $ 6,930 | $ 5,230 | $ 7,245 | $ 5,085 | $ 6,039 |
| Inpatient | $ 15,587 | $ 12,333 | $ 13,252 | $ 19,266 | $ 18,025 | $ 19,114 |
| Emergency Room | $ 937 | $ 837 | $ 855 | $ 725 | $ 1,071 | $ 653 |
| Prescription Drugs | $ 8,489 | $ 6,666 | $ 4,094 | $ 4,545 | $ 4,535 | $ 3,729 |
| Home Health | $ 1,040 | $ 3,502 | $ 94 | $ 3,146 | $ 8,516 | $ 2,518 |
| Average Total Expenditures | $ 38,461 | $ 30,660 | $ 23,898 | $ 35,816 | $ 37,659 | $ 32,849 |
| Exhibit A-21: Health Spending by Type of Service for Dual Eligibles in the Community by Select Groups, 2006 | ||||||
| Health ServicesSettings | All Ages | Under Age 65 | Age 65 & Over | |||
| All Groups | ChronicConditions&Functional Limitations | All Groups | ChronicConditions&Functional Limitations | All Groups | ChronicConditions&Functional Limitations | |
| Office/Outpatient ($) | 1,841 | 2,540 | 1,992 | 2,846 | 1,736 | 2,338 |
| Inpatient ($) | 3,480 | 4,459 | 2,355 | 3,206 | 4,256 | 5,288 |
| Emergency Room ($) | 290 | 403 | 282 | 379 | 296 | 420 |
| Prescription Drugs ($) | 2,543 | 3,451 | 2,831 | 4,218 | 2,344 | 2,944 |
| Home Health ($) | 1,700 | 2,589 | 1,395 | 2,240 | 1,910 | 2,820 |
| Average Total Expenditures ($) | 10,133 | 13,821 | 9,146 | 13,288 | 10,814 | 14,173 |
| Millions ofCommunityResidents,All Ages &Groups | Millions ofCommunityResidents,All AgeswithChronic &Functional | Millions ofCommunityResidents,Under Age65 & AllGroups | Millions ofCommunityResidents,Under Age65 withChronic &Functional | Millions ofCommunityResidents,Age 65 &Over, AllGroups | Millions ofCommunityResidents,Age 65 &Over withChronic &Functional | |
| Community Residents (Millions) | 6.9 | 4.4 | 2.8 | 1.7 | 4.1 | 2.6 |
| Percent ofTotalSpendingfor DualEligibles,All Ages &Groups | Percent ofTotalSpendingfor DualEligibles,All AgeswithChronic &Functional | Percent ofTotalSpendingfor DualEligibles,Under Age65 & AllGroups | Percent ofTotalSpendingfor DualEligibles,Under Age65 withChronic &Functional | Percent ofTotalSpendingfor DualEligibles,Age 65 &Over, AllGroups | Percent ofTotalSpendingfor DualEligibles,Age 65 &Over withChronic &Functional | |
| Percent of Total Spending for Dual Eligibles (%) | 100 | 86 | 37 | 33 | 63 | 53 |
NOTES
-
MEPS may miss some expenditures for high-cost cases while people are living in the community due to sample attrition. For further information see: Sing, Merrile, Jessica S. Banthin, Thomas M. Selden, Cathy A. Cowan and Sean P. Keehan, "Reconciling Medical Expenditure Estimates from the MEPS and NHEA, 2002," Health Care Financing Review 28, no. 1:25-40.
-
Diagnosis classification can be defined by 3-digit International Classification of Diseases codes (ICD-9).
-
URL: http://www.hcup-us.ahrq.gov/toolssoftware/chronic/chronic.jsp#files
-
Hwang, W., Heller, W., Ireys, H., Anderson, G. 2001. "Out-Of-Pocket Medical Spending for Care of Chronic Conditions," Health Affairs 20, no. 6:267-278.
To obtain a printed copy of this report, send the full report title and your mailing information to:
U.S. Department of Health and Human ServicesOffice of Disability, Aging and Long-Term Care PolicyRoom 424E, H.H. Humphrey Building200 Independence Avenue, S.W.Washington, D.C. 20201FAX: 202-401-7733Email: webmaster.DALTCP@hhs.gov
RETURN TO:
Office of Disability, Aging and Long-Term Care Policy (DALTCP) Home [http://aspe.hhs.gov/_/office_specific/daltcp.cfm]Assistant Secretary for Planning and Evaluation (ASPE) Home [http://aspe.hhs.gov]U.S. Department of Health and Human Services Home [http://www.hhs.gov]