
U.S. Department of Health and Human Services
Home Modifications: Use, Cost, and Interactions with Functioning Among Near-Elderly and Older Adults
Vicki A. Freedman, Ph.D.University of Medicine and Dentistry of New Jersey, School of Public Health
Emily M. Agree, Ph.D.Johns Hopkins University, Bloomberg School of Public Health
October 10, 2008
PDF Version: http://aspe.hhs.gov/daltcp/reports/2008/homemod.pdf (41 PDF pages)
This report was prepared under contract #HHS-100-03-0011 between the U.S. Department of Health and Human Services (HHS), Office of Disability, Aging and Long-Term Care Policy (DALTCP) and the Urban Institute. For additional information about this subject, you can visit the DALTCP home page at http://aspe.hhs.gov/_/office_specific/daltcp.cfm or contact the ASPE Project Officers, Hakan Aykan and William Marton, at HHS/ASPE/DALTCP, Room 424E, H.H. Humphrey Building, 200 Independence Avenue, S.W., Washington, D.C. 20201. Their e-mail addresses are: Hakan.Aykan@hhs.gov and William.Marton@hhs.gov.
The opinions and views expressed in this report are those of the authors. They do not necessarily reflect the views of the Department of Health and Human Services, the contractor or any other funding organization.
TABLE OF CONTENTS
- INTRODUCTION
- Research Questions
- Conceptual Approach
- Data and Methods
- RESULTS
- Existence, Addition, and Use of Assistive Home Features
- Comparing Estimates with Other National Surveys
- Out-of-Pocket Payments
- Demographic Disparities
- Population At Risk for Home Modifications
- LIST OF FIGURES
- FIGURE 1: Interplay of Assistive Home Features and Functioning
- LIST OF TABLES
- TABLE 1: Characteristics of Respondents to Health and Retirement Study's Home Modifications Module, 2006
- TABLE 2: Existence, Addition and Use of Home Modifications, 52+ Population, 2006
- TABLE 3: Benchmarking Estimates from the Health and Retirement Study's Home Modification Module to Previously Published Studies
- TABLE 4: Benchmarking Estimates of the Existence of Home Features: 2005 Pilot Study vs. 2006 HRS Module
- TABLE 5: Distribution of Amount Paid and Whether Insurance Paid
- TABLE 6: The Existence, Addition, and Use of Assistive Home Features by Demographic Characteristics, Population Ages 52+, 2006
- TABLE 7: The Existence, Addition, and Use of Assistive Home Features by Economic Characteristics, Population Ages 52+, 2006
- TABLE 8: The Existence, Addition, and Use of Assistive Home Features by Health and Functioning Characteristics, Population Ages 52+, 2006
- TABLE 9: Predictors of the Existence, Addition, and Use of Assistive Home Features, Population Ages 52+, 2006
- TABLE 9A: Predictors of the Existence of Assistive Home Features, Population Ages 52+, 2006
- TABLE 9B: Predictors of the Addition of Assistive Home Features, Population Ages 52+, 2006
- TABLE 9C: Predictors of the Use of Assistive Home Features, Population Ages 52+, 2006
- TABLE 10: Percentage of Adults Ages 52 and Older with Unmodified Environmental Barriers and Lower Body Limitation
- TABLE 11: Characteristics of Respondents At Risk for Home Modification, Population Ages 52+, 2006
- TABLE 12: Predictors of Being At Risk for a Home Modification, Population Ages 52+, 2006
ABSTRACT
This report analyzes new data from an experimental module to the 2006 Health and Retirement Study on assistive home features for near-elderly and older adults. In 2006, two-thirds of the population born in 1953 or earlier (ages 52 and older) had one or more assistive home features, about one-third added at least one of these features, and 40% used at least one feature in the last 30 days. The most common assistive home features included railings at the home entrance (36.2%), followed by grab bars in shower/tub (30.3%) and a seat for the shower/tub (27.3%). Among those who added features, roughly 9% reported no out-of-pocket payments, one-third less than $100, another third from $100 up to $500, 10% from $500 up to $1000 and the remaining 10% over $1000. Only 6% of respondents who added features could not reported an amount in broad brackets. A very low percentage--about 6%--reported that insurance or government programs paid some of the cost. In logistic regression models that included demographic, economic, health, and housing-related factors, significant predictors (direction of association by outcome shown parenthetically) included: age (+existence, +addition, +use), having another adult in the household (-use), home ownership (+addition), Medicare disability insurance (DI) (+existence, +addition, +use), and long-term care insurance (+existence). Few health-related factors predicted the existence or addition of assistive home features; however, respondents with high blood pressure, diabetes, cancer, and lower body limitations were more likely to use such features. One in four near-elderly and older adults is at risk for a home modification, that is, has a mobility limitation and an unmodified barrier at the entry to their home, inside their home, or in the bathroom (either shower/bath area or toilet area). Adults receiving Medicare through the DI program have elevated chances of being at risk for a home modification. Findings offer policy makers several new insights into the role of assistive home features in the daily lives of near-elderly and older adults.
EXECUTIVE SUMMARY
Background. Recent studies suggest a potentially large role for assistive home features in the daily lives of older adults. Yet surprisingly little current and generalizable information has been available to policy makers to allow them to investigate who has assistive home features, who has added these features and at what cost, who actually uses such features, and who potentially needs such features but has not put them into place. The 2005 Pilot Study of Technology and Aging was funded by the Assistant Secretary for Planning and Evaluation in cooperation with the National Center for Health Statistics and the National Institute on Aging to develop measures of the home environment and assistive technology use for national health and aging surveys (Freedman, Agree, & Cornman 2005; Freedman, Agree, & Landsberg 2006; Freedman, Agree, & Cornman 2006b). A subset of these items was included in the 2006 Health and Retirement Study (HRS) as an experimental module. In this report we analyze the 2006 HRS Home Modification Module (N=1,512) to describe the range of assistive home features for near-elderly and older adults (born 1953 or earlier; ages 52 and older in 2006).
Research Questions. Four questions are addressed:
-
To what extent do near-elderly and older adults live in homes with assistive features and to what extent have they added and do they use such features (alone and in combination with personal care)?
-
What is the distribution of out-of-pocket costs for adding assistive features and to what extent do insurance and government programs contribute?
-
How does the existence, addition, and use of assistive home features vary for demographic groups? Are these differences accounted for by differences in economic or health-related factors?
-
To what extent are near-elderly and older adults at risk for home modifications--that is, what percentage of near-elderly and older adults have low functioning, yet do not have relevant assistive home features--and what is the demographic and socioeconomic makeup of this group?
Data and Methods. Respondents to the 2006 HRS Home Modifications Module were asked about ten assistive home features: ramps at the entrance, handrails at the entrance (asked if the respondent has to step up or down to get into home), an emergency call system, grab bars in the shower or tub area, a seat for the shower or tub, grab bars around the toilet, a raised or modified toilet seat, a stair glide or chair lift to go up or down stairs (asked if the respondent has living space on more than one floor), handrails in the stairways (if the respondent has living space on more than one floor), and handrails in the hallways. For each feature, the respondent was asked about its existence (whether the home has the feature), addition (whether it was there when the respondent moved in or added), and use in the last 30 days (first by the respondent and then by others in the household). For persons who added features to the home, information on out-of-pocket costs was obtained through a series of bracketed questions. Respondents were first asked if they paid more than $500, about $500, or less than $500 for all the features added; then a follow-up question asked about either $100/$1000 depending on the previous answer. Respondents were also asked if any payments were made by insurance or government programs.
We developed summary measures to indicate the existence, addition, and use of any of nine assistive home features (excluding stair railings, which are nearly universal among respondents with living space on more than one floor). We also created a six-category indicator of amount spent out-of-pocket on assistive home features: don't know, $0, $1-100, $101-500, $501-1000, and >$1000. A final outcome identifies individuals at risk for a housing modification (i.e., those who currently have low functioning, yet do not have relevant assistive home features). Low functioning was defined as having either mild deficits indicated by only a behavioral change (e.g., fear of falling, holding onto walls when walking) or moderate to severe deficits reflected in difficulty or help with bathing, toileting, or walking across a room or use of a mobility device.
Results. In 2006 two-thirds of the population ages 52 and older had one or more assistive home features, about one-third added at least one of these features, and 40% used at least one feature in the last 30 days. The most common assistive home features included railings at the home entrance (36.2%), followed by grab bars in shower/tub (30.3%) and a seat for the shower/tub (27.3%). Among those who added features, roughly 9% reported no out-of-pocket payments, one-third $100, another third >=$100 to $500, 10% >=$500 to $1000 and the remaining 10% >=$1000. Only 6% of respondents who added features could not report an amount in broad brackets. A very low percentage--about 6%--reported that insurance or government programs paid some of the cost.
In logistic regression models that included demographic, economic, health, and housing-related factors, significant predictors (direction of association by outcome shown parenthetically) included: age (+existence, +addition, +use), having another adult in the household (-use), home ownership (+addition), Medicare DI (+existence, +addition, +use), and long-term care insurance (+existence). Few health-related factors predicted the existence or addition of assistive home features; however, respondents with high blood pressure, diabetes, cancer, and lower body limitations were more likely to use such features.
One in four near-elderly and older adults are at risk for a home modification, that is, have a lower body limitation and an unmodified barrier at the entry to their home, inside their home, or in the bathroom (either shower/bath area or toilet area). Persons at risk for a modification were more likely to be older, widowed, non-Hispanic Black, with less than a high school education, to rent their homes, to have Medicare, Medicare DI, and Medicaid coverage and less likely to have employer-provided coverage, and more likely to be in the lowest income and asset quartiles. They have a higher risk of reporting chronic conditions, upper and lower body limitations and fair/poor memory, vision and hearing. In logistic regression models, those receiving Medicare DI remained at elevated risk for a home modification after controlling for other economic and health-related factors.
Implications. Findings offer policy makers several new insights into the role of assistive home features in the daily lives of near-elderly and older adults. Five points are particularly noteworthy. First, assistive home features among near-elderly and older adults are more prevalent than previously suggested by national survey data. Second, we found that the existence, addition, and use of assistive home features varies considerably across demographic groups, but these effects do not persist once other demographic, economic and health-related factors were considered. Nevertheless, one consistent and strong finding--that home owners are significantly more likely to add assistive features to their home, compared to those who rent, even after controlling for demographic, economic, health, and housing-related factors--may require further investigation. Third, as many as one in four near-elderly and older adults have a lower body impairment and an unmodified barrier in their home and therefore may be considered at risk for a home modification. Thus, public policies that encourage extension of home modifications to those in greatest need have the potential to improve the functioning of older adults even more and potential reduce their reliance on personal care. Fourth, despite the finding that Medicare DI beneficiaries are more likely to have, add, and use assistive home features, we also found that these beneficiaries have an increased likelihood of being at risk for a home modification, even after controlling for demographic, health, and economic factors. This finding in turn suggests that the DI program may serve as a useful vehicle for identifying and targeting individuals at risk. Given that most home modifications are relatively inexpensive, it may be fruitful to investigate in future research the reasons (other than cost) why Medicare DI beneficiaries do not have home modifications on par with other individuals. Finally, it is not currently possible to track over time the contribution of assistive home features to disability trends or to monitor the size of the population at risk for assistive home features. Incorporating these measures into ongoing national health surveys would allow tracking these potentially important public health indicators.
I. INTRODUCTION
Housing features and modifications play an increasingly important role in facilitating independence for people as they age. The efficacy of environmental modifications and related assistive technologies in improving functioning and quality of life has been previously demonstrated in both experimental and observational studies (see, for example, Agree & Freedman 2003; Mann et al. 1999; Verbrugge et al. 1997). There is also evidence that the use of assistive technology among older adults has increased since the early 1990s, especially for activities such as walking and bathing, and this trend may account for half the decline in the number of older people dependent on personal care (Freedman et al. 2006a).
Yet the role of assistive home features per se in the functioning of older adults is not well understood. Estimates from the mid-1990s suggest that nearly half of Americans ages 65 and older (Kutty 2000; Newman 2003; Tabbarah, Silverstein & Seeman 2000) have one or more dwelling modifications. Using data from the mid-1990s Newman (2003) demonstrated that roughly one in four older persons face an unmet need for some type of housing modification, and low-income and minority elderly are especially at risk. Compared to the late 1970s, Newman found a doubling in the prevalence of dwelling modifications (from 26% in 1978 to 49% in 1995) and a similarly-sized decline in the proportion with an unmet need for such a modification (from 42% in 1979 to 27% in 1995). More recently, Dudgeon et al. (2008) have found in their analysis of the Medicare Current Beneficiary Survey (MCBS) about 30% of Medicare beneficiaries (of all ages) report having a bathroom modification, 10% a ramp at any entrance, and 3% special railings.
Taken together, these findings suggest a potentially large role for assistive home features in the daily lives of older adults. Yet surprisingly little current and generalizable information has been available to policy makers to allow them to investigate who has assistive home features, who has added these features and at what cost, who actually uses such features, and who potentially needs such features but has not put them into place. A major stumbling block has been the absence of valid and reliable survey questions that allow distinctions among those who have, who have added, and who use home features. Questions about cost of adding such features have also not been previously available.
The Pilot Study of Technology and Aging was funded by the Assistant Secretary for Planning and Evaluation in cooperation with the National Center for Health Statistics and the National Institute on Aging to develop measures of the home environment and assistive technology use for national health and aging surveys (Freedman, Agree, & Cornman 2005; Freedman, Agree, & Landsberg 2006; Freedman, Agree, & Cornman 2006b). A subset of items from the Pilot Study were included in the 2006 Health and Retirement Study (HRS) as an experimental module administered to a random subsample of approximately 1500 respondents. The module included questions about existence, use, and addition of home modifications and their cost. When combined with information from the core HRS interview, this new module offers a unique opportunity to investigate how adults in the United States change their homes to accommodate functional decline.
Research Questions
In this report we address four questions related to assistive home features:
-
To what extent do near-elderly and older adults live in homes with assistive features and to what extent have they added and do they use such features (alone and in combination with personal care)?
-
What is the distribution of out-of-pocket costs for adding assistive features and to what extent do insurance and government programs contribute?
-
How does the existence, addition, and use of assistive home features vary for demographic groups? Are these differences accounted for by differences in economic or health-related factors?
-
To what extent are near-elderly and older adults at risk for home modifications--that is, what percentage of near-elderly and older adults have low functioning, yet do not have relevant assistive home features--and what is the demographic and socioeconomic makeup of this group?
Conceptual Approach
Over 15 years ago, the Institute of Medicine (IOM) defined disability as a gap between an individual's capacity and the demands of the environment (IOM 1991). More recently, the World Health Organization (WHO) explicitly incorporated the environment into its International Classification of Disease, Functioning, and Health (ICF; WHO 2002). In doing so the ICF defined environment broadly to include: products and technology, the natural environment and man made changes to it, support and relationships, attitudes, and services, systems and policies (IOM 2007).
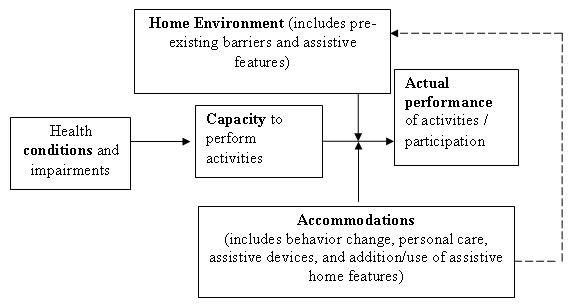
In this report we focus on a single aspect of the environment--physical features of the home. The home environment can influence the performance of activities in two ways (see Figure 1). First, the home environment may have a direct influence on the level of difficulty of an activity. For instance, an individual with limited upper and lower body strength may report difficulty bathing if he or she has a bathtub that poses difficulty getting in and out, but not if that person has a walk-in shower. Second, individuals may change their home environment in response to changes in functioning. So, for example, an individual may have grab bars installed in the shower in order to accommodate a loss of balance or in the tub to help facilitate getting in and out. In practice, these influences are difficult to distinguish because of absence of precise timing of changes. The conceptual model also illustrates the potential problem with including information on the level of difficulty performing activities in models predicting the presence, addition, and use of assistive home features. We therefore limit health-related measures in this analysis to those reflecting health conditions and impairments, which directly influence an individual's capacity to perform activities.
| FIGURE 1: Interplay of Assistive Home Features and Functioning |
 |
Data and Methods
Data and Sample. The HRS is an ongoing study of older adults sponsored by the National Institute of Aging and conducted by the University of Michigan (grant #NIA-U01AG009740). Initially designed as two separate panel studies, the HRS has evolved into a design that represents the full 50-and-over United States population, with new cohorts aged into the sample at six-year intervals. Baseline interviews are generally conducted in person and follow-up interviews generally administered by telephone at two-year intervals. Overall response rates have ranged between 86.8% and 89.1% across waves. HRS distributes files and the RAND Corporation has also prepared a set of files that merge a subset of HRS data across all waves. We analyzed the Home Modification Module in the 2006 early release version,1 along with selected health indicators (e.g., vision, hearing, cognition impairments) and an indicator of whether the respondent lives alone, with selected demographic, socioeconomic, and health-related variables from the RAND Version H cross wave file. All analyses are weighted using the 2006 respondent weights provided on the 2006 tracker file; standard errors have been adjusted using STATA "svy" procedures that account for the complex sampling design of the HRS.
As shown in Table 1, of the 16954 age-eligible HRS respondents (born in 1953 or earlier), 1801 (approximately 10%) were randomized to receive the experimental module on home modifications. The were no statistically significant differences with respect to demographic, socioeconomic, or health-related indicators between those who were and were not randomized to the home modifications module. Of the 1801 randomized to the home modifications module, 1512 agreed to answer the questions (84%). There were statistically significant differences between those who did and did not respond to the module on several demographic and health-related indicators. Nevertheless, because non-response was relatively low the profile of persons responding to the home modification module did not look appreciably different than the profile of age-eligible HRS respondents. Hence, generalizations that we make from the module sample to the 52 and older population appear to be reasonable.
Outcomes. Respondents to the 2006 HRS Home Modifications Module were asked about ten assistive home features: ramps at the entrance, handrails at the entrance (asked if the respondent has to step up or down to get into home), an emergency call system, grab bars in the shower or tub area, a seat for the shower or tub, grab bars around the toilet, a raised or modified toilet seat, a stair glide or chair lift to go up or down stairs (asked if the respondent has living space on more than one floor), handrails in the stairways (if the respondent has living space on more than one floor), and handrails in the hallways. For each feature, the respondent was asked about its existence (whether the home has the feature), addition (whether it was there when the respondent moved in or was added), and use in the last 30 days (first by the respondent and then by others in the household).
From these questions two sets of summary measures were created. The first set indicated the existence, addition, and use of any of the ten assistive home features. The second set, which is emphasized in the remainder of this report, included all features except railings, since such railings are nearly universal among those who have more than one floor in their home. In addition, for features related to bathing (e.g., grab bar/seat in shower or tub) and toileting (grab bar/raised toilet seat), we also tabulated whether respondents used such features alone or in combination with help from another person for the relevant activity.
For persons who added features to the home, information on out-of-pocket costs was obtained through a series of bracketed questions. Respondents were first asked if they paid more than $500, about $500, or less than $500 for all the features added; then a follow-up question asked about either $100/$1000 depending on the previous answer. From this information, six categories were constructed: don't know, $0, $1-100, $101-500, $501-1000, and >$1000. Respondents were also asked if any payments were made by insurance or government programs.2
A final outcome of interest is the population at risk for a housing modification--that is individuals who currently have low functioning, yet do not have relevant assistive home features. We created a hierarchical indicator of functioning reflecting: (1) no deficits in functioning; (2) mild deficits indicated by only a behavioral change (e.g., fear of falling, holding onto walls when walking); and (3) moderate to severe deficits reflected in difficulty or help with bathing, toileting, or walking across a room or use of a mobility device.
Demographic, Economic, Health and Housing-Related Characteristics. Demographic factors of interest include age, sex, race/ethnicity, foreign born status, marital status, educational status (9, 9-11, 12 and 13+ years completed) and whether the respondent lives with another adult (besides the spouse, if married). For some analyses we also control (in a series of nested logistic regression models) for economic, health-related, and housing-related characteristics. Economic characteristics include whether the respondent owns or rents their home, 2005 income quartile, non-housing asset quartile, housing value quartile, and insurance status. With respect to the latter, we include dummy variables indicating Medicare disability insurance (DI; coded 1 if the respondent has Medicare and is less than age 65), Medicaid, employer-based insurance, and whether the respondent has long-term care insurance coverage.3 We also control for a number of health-related characteristics, including the presence of chronic conditions, and physical, cognitive, and sensory limitations. Chronic conditions include heart disease, hypertension, diabetes, stroke, chronic lung disease, and arthritis. For arthritis, survey respondents were asked if they ever had or a doctor ever told them they have arthritis. For all other conditions, they were asked to report whether a doctor ever told them they have the given condition. Our measures of physical limitations include two previously validated scales of upper and lower body limitations (Freedman, Aykan, & Kleban 2003), and our measures of cognition, vision, and hearing limitations contrast fair or poor with good or better ratings. Finally, we control for two housing-related indicators--whether the house has more than one floor and whether the respondent has to step up or down to get into the home.
RESULTS
Existence, Addition, and Use of Assistive Home Features
Table 2 shows that a substantial percentage of respondents ages 52 and older report having, adding, or using assistive home features. However, these three concepts are distinct; that is, having a feature is not synonymous with having added it or currently using it. Focusing on the summary indicator that includes all features except stair railings (last row of table), about two-thirds (68.7%) of respondents report having at least one assistive home feature. About one-third (36.1% of respondents reported adding at least one of these features, and four out of ten respondents (41.1%) reported using at least one feature in the last 30 days. When use of the feature by other members of the household is also considered, estimates of use increase by about 5 percentage points (46.1%).
The most common assistive home features (in descending order of prevalence) were railings at the entrance (36.2%) and in stairways (30.8%), followed by grab bars in shower/tub (30.3%) and a seat for the shower/tub (27.3%). The most common features added to the home, however, were grab bars in shower/tub (16.3%), followed by railings at the entrance (14.4%), a seat for shower/tub (14.3%), and a raised toilet seat (10.8%). Use of features followed a pattern similar to the existence of such features, with use of railing at the entrance and stairways most common, followed by grab bars and a seat for the shower/tub.
We tabulated the percentage using specific assistive home features by whether help was received with relevant activities of daily living (ADLs). Cell sizes were too small in most cases to allow reporting in tabular format. However, the overwhelming majority of cases that reported using a given feature did so without receiving help from another person for that particular activity. For example, the 10.3% that reported using a seat in the shower or tub consists of two groups: 9.1% used a seat and received no help with bathing and only 1.2% used a seat and received help with bathing. Less than 1% of respondents reported the following: using grab bars in the bath/shower and getting help with bathing, using grab bars around the toilet and getting help with toileting, using a raised toilet seat and getting help toileting, and using railways in the hallway and getting help with walking. Less than 2% reported getting help with an activity but not having a relevant environmental feature to assist them.
Comparing Estimates with Other National Surveys
We compared selected findings from the 2006 HRS module to published estimates from the 1999 National Long-Term Care Survey (NLTCS) and 2001 MCBS as reported in Cornman et al. (2005), to the 2004 MCBS as reported in Dudgeon et al. (2008), and to the 1993 Survey of Asset and Health Dynamics of the Oldest Old (AHEAD; Tabbarah et al. 2000) (Table 3). In doing so, we subset the HRS sample as needed to match the benchmarking samples as closely as possible. We also carefully selected HRS measures so that they would be as comparable as possible to those in the benchmarking survey. In general, we expected that most estimates from the 2006 HRS module would be higher than previously published estimates, in part because the use of assistive technologies has been increasing.
NLTCS Comparisons. Two estimates from the 1999 NLTCS (found in Cornman et al. 2005) can be approximated with the HRS Home Modification Module data. The first identifies respondents ages 65 and older who had a chronic disability (at least one ADL limitation or unable to carry out one or more instrumental activities of daily living [IADLs]) and used special equipment to bathe/shower. The second identifies respondents ages 65 and older who had a chronic disability and used special equipment for toileting. We limited the HRS sample to respondents ages 65 and older, and calculated: (1) the percentage who reported difficulty with at least one ADL or who were unable to carry out at least one IADL and who used a grab bar or seat in the shower or tub in the last 30 days; and (2) the percentage who reported difficulty with at least one ADL or who were unable to carry out at least one IADL and who used a grab bar around the toilet or raised toilet seat in the last 30 days. We found in both cases that estimates from the 2006 HRS (9.1% for bathing; 7.2% for toileting) were higher than those from the 1999 NLTCS (8.5% and 4.9%, respectively).
MCBS Comparisons. Two estimates from the 2001 MCBS (found in Cornman et al. 2005) and three estimates from the 2004 MCBS (Dudgeon et al. 2008) can be approximated with the HRS. The 2001 MCBS estimates capture: (1) the percentage of adults ages 65 and older who report difficulty bathing and use special equipment to bathe; and (2) the percentage age 65 and older who report difficulty toileting and use special equipment to toilet. For these comparisons, we limited the HRS sample to respondents ages 65 and older, and calculated: (1) the percentage who reported difficulty bathing and who used a grab bar or seat in the shower or tub in the last 30 days; and (2) the percentage who reported difficulty toileting and who used a grab bar around the toilet or raised toilet seat in the last 30 days. The 2001 MCBS estimate of using special equipment for bathing was higher than the 2006 HRS estimate (6.5% vs. 3.6%) and the other, use special equipment for toileting, was nearly identical (3.2% in MCBS, 3.1% in HRS).
To compare with the 2004 MCBS (calculated from Dudgeon et al. 2008, which included community-dwelling beneficiaries of all ages, we limited analyses to Medicare beneficiaries ages 52 and older. Estimates of ramps at any entrance from the 2004 MCBS was slightly higher than the estimate from the 2006 HRS (10.5% vs. 7.8%). The 2004 MCBS estimate for having "a modification to any bathroom such as grab bars or a shower seat" was nearly identical to the 2006 HRS estimate of having added a grab bar or shower seat to the bath or shower (30.1% vs. 28.9%). The 2004 MCBS estimate of railings comes from a question that asks: "Other than stair railings, does your house have special railings to help you get around?" The HRS first asks about handrailings in the stairways (for those with more than one floor) and then asks "Whether or not you use them, does your home have handrails in any of the hallways? The latter question produced a higher estimate than the 2004 MCBS (2.6% in MCBS vs. 5.7% in HRS).
AHEAD Comparisons. We also compared HRS estimates with two previously published estimates from the 1993 AHEAD (from Tabbarah et al. 2000), which were limited to adults ages 70 and older living in the community in non-age segregated housing. The AHEAD asks: does your home/apartment have: modifications to the bathroom such as grab bars or a shower seat? Special railings to help you get around? Ramps at street level? The 2006 HRS estimate for having added a grab bar or seat to the shower or tub (among the 70+) was about one-third higher than the estimate from the 1993 AHEAD (32.8% in 2006 HRS vs. 22.9% in AHEAD). Estimates of railings in the hallway were similar (6.2% in HRS vs. 7.8% AHEAD) but the percentage with ramps was higher in the HRS (9.1% HRS vs 5.0% AHEAD).
Pilot Study of Technology and Aging Comparisons. Finally, we compared estimates from the HRS with those from the 2005 Pilot Study of Technology and Aging, the study from which the questions were drawn (Freedman et al. 2005). The pilot study was based on a racial and geographically diverse sample of adults ages 50 and older generated from marketing lists and reweighted to reflect the United States population by demographic characteristics. When we compare the 2006 HRS results to weighted estimates from the 2005 Pilot Study (Table 4), we found substantially similar prevalence estimates (most within one percentage point). The only finding in Table 4 that differed somewhat between the two was the percentage reporting having a seat for the shower seat or tub, which was higher in the 2006 HRS than in the pilot study (27.3% 2006 HRS vs 19.4% 2005 Pilot Study).
Out-of-Pocket Payments
Roughly 9% of respondents who added at least one assistive feature reported paying nothing, one-third less than $100, another third between $100 and $500, 10% between $500 and $1000 and the remaining 10% over $1000 (Table 5). The remaining respondents (about 6%) reported not knowing an amount. The distribution also shifted upward with the more assistive features that the respondent reported adding. Those adding exactly one feature most often reported paying less than $100, whereas those adding 3+ features most often reported paying $101-$500. About 6% of respondents reported that insurance or government programs paid some of the cost. This percentage varied by the number of features added: only 2.4% of those adding exactly one feature reported insurance or government programs contributed whereas 9.7% of those adding three or more features did so. Note that the imputation procedure did not substantially alter the distribution or the percentage reporting that insurance paid some for the reported modification(s).
Demographic Disparities
Respondents with demographic characteristics that are typically associated with greater health needs are generally more likely to report having, adding, and using assistive home features (Table 6). For instance, all three outcomes increase with age and are higher for widows. Respondents who are non-Hispanic Black are most likely to have, add, and use assistive features whereas respondents of Hispanic origin are least likely. Respondents with low education and women are more likely to report having added or using assistive home features. Those who are foreign born are less likely to add assistive features to their homes.
Economic characteristics also vary with the existence, addition, and use of assistive home features (Table 7). Home ownership, for example, is related to the presence, addition, and use of assistive home features. Owners are less likely (compared with renters) to have any feature and to use these features, but renters are less likely to have added features. Associations with insurance status are also apparent. For example, respondents with Medicare and Medicare DI are more likely to report having, adding, and using assistive home features. Respondents with Medicaid coverage are more likely to use such features, those with long-term care coverage are more likely to have such features, and those with no employer-sponsored coverage are more likely to have and use, but not add, such features. Low-income respondents are more likely to have, add, and use such features. Surprisingly, no relationship was observed between home value and the outcomes in Table 7, nor did non-housing assets have a strong relationship with the existence of addition of features, although persons in the lowest quartile of non-housing assets did report higher rates of use.
As shown in Table 8, all health conditions except lung disease are associated with a higher risk of having and using assistive home features, but far fewer were associated with adding. Upper and lower body functioning was associated with all three outcomes. Memory and vision problems were associated with having and using but not adding, and hearing only with using.
Nested models (shown in Table 9A, Table 9B and Table 9C) provide some insights into what accounts for demographic differentials in the existence, addition, and use of assistive home devices. After including all demographic factors in the models, only age, race, and nativity are significantly related to any of the outcomes of interest.4 Being 75 years old or older increases the odds for all three outcomes, and these effects largely persist after controlling for economic, health, and home-related factors. Non-Hispanic Blacks have 1.8 and 1.6 times the odds of Whites and other non-Hispanics of having and using, respectively, assistive home features. Once economic status is accounted for, however, these effects attenuate (to 1.5 and 1.3, respectively) and are no longer statistically significant. Persons born outside the United States have about half the risk (OR=0.56) of those who are native born of adding assistive home features. The odds ratio (OR) is attenuated and coefficient is no longer statistically significant after accounting for the fact that persons who are foreign born on average have fewer health conditions and impairments in functioning.
Focusing on the final columns of Tables 9A-9C (summarized in Table 9), after controlling for economic, health and housing-related factors, age and living arrangement are the only two statistically significant demographic factors. Not surprisingly, the risk of all three outcomes increases with age: the odds of having or adding home modifications are approximately double for persons 70+ than the odds for persons 52-64 and the odds of using a modification increase nearly three-fold. In addition, having another adult (besides a spouse) in the household is associated with a lower risk of using an assistive home feature (OR=0.68).
With respect to economic resources, only home ownership and insurance status are significantly associated with outcomes of interest. Owning one's home is associated with a nearly five-fold increase in the risk of adding a home modification.5 Having Medicare DI remains strongly and significantly associated with all three outcomes. Medicare DI beneficiaries have 4.7 times the odds of having, 2.2 times the odds of adding, and 3.7 times the odds of using an assistive home feature.6 Having long-term care insurance is also associated with increased odds (OR=1.55) of having (but not adding or using) an assistive home feature.7
Few health-related factors predict the existence or addition of assistive home features. However, several conditions predict the use of such features. Respondents who reported a doctor told them they had high blood pressure, diabetes, or cancer were all significantly more likely to report having used at least one assistive home feature in the last 30 days. In addition, respondents with at least one lower body limitation had nearly 50% higher risk (OR=1.48) of those with no lower body limitations of using an assistive home feature. Respondents who had a step at the entrance to their home also were more likely to report using an assistive home feature.
Population At Risk for Home Modifications
As shown in Table 10, one in four near-elderly and older adults is at risk for a home modification, that is, has a mobility limitation and an unmodified barrier at the entry to their home, inside their home, or in the bathroom (either shower/bath area or toilet area).8 Roughly half of this group has mild activity limitations (reflected in reports of fear of falling or holding onto walls when walking) and the other half moderate or severe limitations (reflected in difficulty or help with bathing, toileting, or walking across a room or use of a mobility device). One in five respondents (20%) with an activity limitation have an unmodified barrier around the toilet, 9% in the bathing/shower area, and 9% at the entry to their home.
Persons at risk for a home modification are more likely to be older, widowed, non-Hispanic Black, with less than a high school education (see Table 11). With respect to economic characteristics, they are more likely to rent their homes, to have Medicare, Medicare DI, and Medicaid coverage and less likely to have employer-provided coverage, and more likely to be in the lowest income and asset quartiles. With respect to health, they have a higher risk of reporting all of the chronic conditions considered here as well as upper and lower body limitations and fair/poor memory, vision and hearing. In a logistic regression model that includes demographic, economic, and health and functioning-related characteristics, we found several indicators of health and functioning--having a stroke, lung disease, arthritis, upper or lower body limitations, or fair/poor memory--predicted being at risk for a modification. The only additional factor that predicted this outcome was having Medicare DI (Table 12).
CONCLUSION
Summary. This report analyzes an experimental module administered to a random subsample from the 2006 HRS to address four questions related to assistive home features for near-elderly and older adults:
-
To what extent do near-elderly and older adults live in homes with assistive features and to what extent have they added and do they use such features (alone and in combination with personal care)? In 2006 two-thirds of the population 52 and older had one or more assistive home features, about one-third added at least one of these features, and 40% used at least one feature in the last 30 days. The most common assistive home features included railings at the home entrance (36.2%), followed by grab bars in shower/tub (30.3%) and a seat for the shower/tub (27.3%).
-
What is the distribution of out-of-pocket costs for adding assistive features and to what extent do insurance and government programs contribute? Among those who added features, roughly 9% reported no out-of-pocket payments, one-third less than $100, another third from $100 up to $500, 10% from $500 up to $1000 and the remaining 10% over $1000. Only 6% of respondents who added features could not reported an amount in broad brackets. A very low percentage--about 6%--reported that insurance or government programs paid some of the cost.
-
How does the existence, addition, and use of assistive home features vary for demographic groups? Are these differences accounted for by differences in economic or health-related factors? The existence, addition, and use of assistive home features varies by demographic groups. Older, widowed, non-Hispanic Blacks, those with low education, women, and those born in the United States were more likely to either have, add, or use assistive home features. After controlling for all demographic factors simultaneously in models, the chances of having, adding, and using assistive home features increase with age and these age effects largely persist after controlling for economic, health, and home-related factors. Non-Hispanic Blacks have 1.8 and 1.6 times the odds of whites and other non-Hispanics of having and using, respectively, assistive home features. Once economic factors are accounted for, however, these effects attenuate and are no longer statistically significant. Persons born outside the United States have about half the likelihood of those who are native born of adding assistive home features. The OR is attenuated and coefficient is no longer statistically significant after accounting for the fact that persons who are foreign born on average have fewer health conditions and impairments in functioning.
-
To what extent are near-elderly and older adults at risk for home modifications--that is, what percentage of near-elderly and older adults have low functioning, yet do not have relevant assistive home features--and what is the demographic and socioeconomic makeup of this group? One in four near-elderly and older adults is at risk for a home modification, that is, has a mobility limitation and an unmodified barrier at the entry to their home, inside their home, or in the bathroom (either shower/bath area or toilet area). Adults receiving Medicare through the DI program have an elevated likelihood of potentially needing a home modification.
Limitations. Although this is the first study to use national data to explore the existence, addition, use, and cost of assistive home features, this study has several limitations. Only 1512 respondents provided answers to the Home Modifications Module, making sample sizes inadequate for in-depth analyses in some cases. In addition, because the data are cross-sectional, and the timing of modifications was not assessed, we could not disentangle the dynamic interplay of the home environment with functioning. Nor could we assess with the data at hand whether persons put modifications in place in response to functional declines or whether their doing so prevents or slows functional decline or the need for formal care.
Implications. Despite these limitations, findings offer policy makers several new insights into the role of assistive home features in the daily lives of near-elderly and older adults. Five points are particularly noteworthy. First, assistive home features are more highly prevalent among near-elderly and older adults than previously suggested by national survey data. Estimates from the 2006 HRS--which suggest two out of three adults ages 52 and older have at least one assistive home features--are higher than most previously appearing in the literature for two main reasons. Such differences no doubt reflect an increase in the presence of assistive home features over the intervening years, especially in new construction. In addition, the higher estimates from the HRS also likely reflect the critical distinctions that were made in Home Modifications Module among having (whether or not it is used), adding, and using an assistive feature, and the fact that all respondents were asked about features whether or not they reported difficulty with daily activities (Cornman et al. 2004). Indeed, results presented here are nearly identical to those reported from the 2005 Pilot study on Aging and Technology (Freedman et al. 2005a), from which the HRS items were drawn, lending credibility to the items' validity and reliability.
Second, we found that the existence, addition, and use of assistive home features varies considerably across demographic groups. Age-related gradients in the existence, addition, and use of assistive home features are particularly strong, and persist after controlling for economic, health, and housing-related factors. With the exception of age gradients, however, these effects did not persist once other demographic, economic and, in the case of foreign born vs. native born, health-related factors were considered. Hence, such variation is not necessarily in and of itself an indicator of disparities that warrant policy attention. Nevertheless, one persistent finding --that home owners are significantly more likely to add assistive features to their home, compared to those who rent, even after controlling for demographic, economic, health, and housing-related factors--may require further investigation. It may be that renters believe that they are unable or unwilling to make changes to their home environment or that there are other differences between owners and renters not captured in the data presented herein. Further exploration of this point is needed to understand barriers that prevent those who do not own their homes from adding home assistive features.
Third, as many as one in four near-elderly and older adults have a lower body impairment and an unmodified barrier in their home and therefore may be considered at risk for a home modification. This estimate is similar to one developed by Newman (2003) using data from the 1995 American Housing Survey, which identified older adults with a (self-identified) unmet need for a dwelling modification. We also found that those at risk were more likely to be older, widowed, non-Hispanic Black, with less than a high school education, to rent their homes, to have public rather than employer-provided coverage, to be in the lowest income and asset quartiles, and to have higher than average rates of chronic conditions and impairments in functioning. Taken together with experimental and observational evidence of the efficacy of home modifications in reducing dependency (see, for example, Agree & Freedman 2003; Mann et al. 1999; Verbrugge et al. 1997), we conclude that public policies that encourage extension of home modifications to those in greatest need have the potential to substantially reduce dependency among older adults.
Fourth, despite the finding the Medicare DI beneficiaries are more likely to have, add, and use assistive home features, we also found that these beneficiaries are at an elevated risk of having an unmet need for a home modification, even after controlling for demographic, health, and economic factors. This finding in turn suggests that the DI program may serve as a useful vehicle for identifying and targeting individuals at risk. Also relevant, we found that most modifications are relatively inexpensive; in this study 40% of respondents who added assistive home features paid less than $100 out-of-pocket; three out of four paid less than $500. This finding suggests in turn that cost may not be the main barrier to these beneficiaries adding assistive home features. A potentially fruitful area for further research is to investigate reasons why individuals who receive Medicare DI do not have home modifications on par with other individuals.
Finally, given the previously demonstrated efficacy of environmental modifications and related assistive technologies in improving functioning and quality of life of older adults (see, for example, Agree and Freedman 2003; Mann et al. 1999; Verbrugge et al. 1997) and the high prevalence of assistive home features demonstrated in this reported, the current public health impact of such features is undoubtedly substantial. Many of the most common items--such as grab bars and bath seats for the tub or shower--may not only be assistive, allowing adults to perform daily tasks without help from another person, but preventive as well, potentially preventing falls and resulting injuries and disabilities. Moreover, we found that most assistive home features were used independently, that is, without the receipt of personal help for the given activity, raising the possibility that growth in home modifications may be contributing to aggregate declines in the need for help with daily activities (Freedman et al. 2006). Given the high prevalence of these features, they deserve closer attention in the search for causes of the late-life disability decline (Schoeni et al. 2008). Because existing national data surveys do not distinguish among the existence, addition, and use of features, however, it is not currently possible to track the contribution of assistive home features to disability trends or to monitor the size of the population at risk for assistive home features. Incorporating these measures into ongoing national health surveys would allow tracking these potentially important public health indicators.
REFERENCES
Agree, E.M., & V.A. Freedman. 2003. "A comparison of assistive technology and personal care in alleviating disability and unmet need." The Gerontologist 43(3):335-344.
Cornman, J., V.A. Freedman, & E.M. Agree. 2005. "Measurement of assistive device use: implications for estimates of device use and disability in late life." The Gerontologist 45(3):347-58.
Dudgeon, B.J., J.M. Hoffman, M.A. Ciol, A. Shumway-Cook, K.M. Yorkston, & L. Chan. 2008. Managing Activity Difficulties at Home: A Survey of Medicare Beneficiaries. Archives of Physical Medicine and Rehabilitation 89:1256-1261.
Freedman, V.A., E.M. Agree, L.G. Martin, & J.C. Cornman. 2006a. "Trends in the use of assistive technology and personal care for late-life disability, 1992-2001." The Gerontologist 46(1):124-127.
Freedman, VA., E.M. Agree, & J.C. Cornman. 2005. Development of an Assistive Technology and Home Environment Assessment Instrument for National Surveys: Final Report. Part I. Recommended Modules and Instrument Development Process. Report prepared for the Department of Health and Human Service, Office of the Assistant Secretary for Planning and Evaluation. [http://aspe.hhs.gov/daltcp/reports/ATEAdevI.htm]
Freedman, V.A., E.M. Agree, & L. Landsberg. 2005. Development of an Assistive Technology and Home Environment Assessment Instrument for National Surveys: Final Report. Part II. Pilot Study Results for Recommended Items. Report prepared for the Department of Health and Human Service, Office of the Assistant Secretary for Planning and Evaluation. [http://aspe.hhs.gov/daltcp/reports/ATEAdevII.htm]
Freedman, V.A., E.M. Agree, & J.C. Cornman. 2006b. Evaluation of New Measures of Assistive Technology and the Home Environment from the 2005 Pilot Study of Technology and Aging. Report to the Department of Health and Human Service, Office of the Assistant Secretary for Planning and Evaluation. [http://aspe.hhs.gov/daltcp/reports/2006/newmeas.htm]
Health and Retirement Study (HRS), 2006 early release (2008). Produced and distributed by the University of Michigan with funding from the National Institute on Aging (grant #NIA-U01AG009740). Ann Arbor, MI.
Institute of Medicine (IOM). 1991. Disability in America: Toward a National Agenda for Prevention. Washington, DC: National Academy Press.
Institute of Medicine (IOM). 2007. The Future of Disability in America. Washington, DC: National Academies Press.
Kutty N. 2000. "The production of functionality by the elderly: A household production function approach." Applied Econometrics 32:1269-1280.
Mann, W.C., K.J. Ottenbacher, L. Fraas, M. Tomita, & C.V. Granger. 1999. Effectiveness of assistive technology and environmental interventions in maintaining independence and reducing home care costs for the frail elderly. A randomized controlled trial. Archives of Family Medicine 8(3):210-217.
Newman, S. 2003. "The living conditions of elderly Americans." The Gerontologist 43(1):99-109.
Schoeni, R.F., V.A. Freedman, & L.G. Martin. 2008. "Why is late-life disability declining?" Milbank Memorial Quarterly 86(1):47-89.
Tabbarah, M., M. Silverstein, & T. Seeman. 2000. "A health and demographic profile of noninstitutionalized older Americans residing in environments with home modifications." Journal of Aging and Health 12(2):204-28.
| TABLE 1: Characteristics of Respondents to Health and Retirement Study's Home Modifications Module, 2006 | |||||||
| Randomized to Home Modifications Module | Responded to Home Modifications Module | ||||||
| Yes | No | p | Yes | No | p | ||
| Age Group | 52-64 | 50.8 | 52.6 | 51.8 | 44.9 | ** | |
| 65-74 | 25.5 | 24.9 | 26.4 | 20.9 | |||
| 75 and older | 23.7 | 22.5 | 21.8 | 34.2 | |||
| Marital Status | married | 67.6 | 66.6 | 66.5 | 73.7 | ** | |
| divorced or separated | 10.9 | 13.0 | 11.6 | 8.0a | |||
| widowed | 17.4 | 16.9 | 17.2 | 18.3 | |||
| never married | 4.1 | 3.6 | 4.7 | -- | |||
| Gender | male | 45.3 | 45.7 | 43.6 | 54.9 | ** | |
| female | 54.7 | 54.4 | 56.4 | 45.1 | |||
| Race/Ethnicity | White non-Hispanic | 84.0 | 83.8 | 84.8 | 79.9 | * | |
| Black non-Hispanic | 9.3 | 9.1 | 9.4 | 8.7 | |||
| Hispanic | 6.7 | 7.1 | 5.9 | 11.4 | |||
| Foreign Born | US born | 92.4 | 91.0 | 92.8 | 90.3 | ||
| foreign | 7.6 | 9.1 | 7.2 | 9.7 | |||
| Completed Education | less than high school | 18.5 | 17.7 | 16.9 | 27.4 | ** | |
| high school/GED | 32.8 | 34.8 | 32.8 | 32.3 | |||
| some college | 24.5 | 23.5 | 25.6 | 18.5 | |||
| college or more | 24.3 | 24.0 | 24.7 | 21.8 | |||
| Living Arrangement | other adult in HH | 24.1 | 26.0 | 23.0 | 29.9 | * | |
| Home Ownership | rent | 15.0 | 16.0 | 15.1 | 14.8 | ||
| own | 85.0 | 84.0 | 84.9 | 85.2 | |||
| Insurance | Medicare | 51.7 | 50.2 | 50.6 | 57.7 | ||
| Medicare DI | 4.3 | 4.5 | 3.7 | 4.4 | |||
| Medicaid | 5.8 | 5.9 | 5.6 | 6.8 | |||
| employer-based coverage | 53.1 | 53.6 | 53.3 | 51.7 | |||
| LTC insurance | 9.9 | 9.9 | 10.2 | 8.4 | |||
| 2005 Income | 1st quartile (lowest) | 19.9 | 21.9 | 19.6 | 21.6 | ||
| 2nd quartile | 23.5 | 22.2 | 23.2 | 25.5 | |||
| 3rd quartile | 25.0 | 24.9 | 25.5 | 22.2 | |||
| 4th quartile (highest) | 31.6 | 31.0 | 31.8 | 30.7 | |||
| Value of Home | 1st quartile (lowest) | 22.6 | 24.1 | 22.3 | 24.6 | ||
| 2nd quartile | 23.3 | 24.6 | 23.4 | 22.6 | |||
| 3rd quartile | 26.3 | 24.5 | 27.1 | 21.8 | |||
| 4th quartile (highest) | 27.8 | 26.8 | 27.3 | 31.0 | |||
| Value of Non-Housing Assets | 1st quartile (lowest) | 23.0 | 22.5 | 22.0 | 28.6 | ||
| 2nd quartile | 23.3 | 25.3 | 23.6 | 21.1 | |||
| 3rd quartile | 27.3 | 25.7 | 28.1 | 22.9 | |||
| 4th quartile (highest) | 26.5 | 26.5 | 26.3 | 27.4 | |||
| Chronic Conditions | health disease | 23.0 | 24.1 | 21.9 | 29.2 | * | |
| high blood pressure | 54.4 | 54.3 | 53.6 | 58.6 | |||
| diabetes | 18.9 | 18.5 | 19.1 | 17.9 | |||
| stroke | 8.4 | 7.5 | 7.6 | 12.6 | * | ||
| cancer | 13.9 | 13.7 | 13.6 | 15.8 | |||
| lung disease | 9.4 | 9.9 | 9.7 | 7.3 | |||
| arthritis | 57.9 | 58.1 | 58.2 | 56.3 | |||
| Functioning | upper body limitation | 54.4 | 54.9 | 53.4 | 60.3 | ||
| lower body limitation | 62.6 | 61.3 | 61.5 | 68.9 | |||
| Memory | excellent | 7.4 | 6.7 | 7.0 | 9.5 | ** | |
| very good | 24.0 | 25.5 | 24.2 | 23.3 | |||
| good | 41.2 | 41.6 | 42.6 | 33.8 | |||
| fair | 21.3 | 21.0 | 21.2 | 22.0 | |||
| poor | 6.0 | 5.1 | 5.1 | 11.4 | |||
| Vision | excellent | 11.5 | 10.4 | 11.8 | 10.1 | ||
| very good | 24.2 | 26.7 | 25.3 | 18.1 | |||
| good | 44.1 | 42.7 | 44.0 | 44.8 | |||
| fair | 15.2 | 15.1 | 14.3 | 20.6 | |||
| poor/legally blind | 4.9 | 5.2 | 4.7 | 6.4 | |||
| Hearing | excellent | 17.2 | 16.6 | 17.6 | 14.7 | ** | |
| very good | 27.8 | 27.6 | 28.9 | 21.9 | |||
| good | 34.5 | 34.7 | 34.4 | 35.3 | |||
| fair | 16.1 | 15.8 | 15.3 | 21.0 | |||
| poor | 4.3 | 5.4 | 3.8 | 7.1 | |||
| N | 1801 | 15153 | 1512 | 289 | |||
NOTE: Sample includes respondents ages 52 and older with positive weight. * p0.05 ** p0.01
| |||||||
| TABLE 2: Existence, Addition and Use of Home Modifications, 52+ Population, 2006 | ||||
| Feature | Have It | Added It | Respondent Used in Last 30 Days | Respondent or Someone Else Used inLast 30 Days |
| Ramp at entrance | 6.6 | 3.7 | 3.7 | 4.2 |
| Railing at entrance | 36.2 | 14.4 | 22.6 | 25.4 |
| Among those with step at entrancea | 43.8 | 17.4 | 27.7 | 31.0 |
| Emergency call | 7.4 | 3.6 | 1.0 | 4.2 |
| Grab bars in shower/tub | 30.3 | 16.3 | 15.4 | 18.1 |
| Seat for shower/tub | 27.3 | 14.3 | 10.3 | 14.6 |
| Grab bars around toilet | 8.5 | 5.6 | 4.4 | 6.2 |
| Raised toilet seat | 15.0 | 10.8 | 11.5 | 13.1 |
| Stair glide | 1.0 | 1.0 | 1.0 | 1.0 |
| Among those with 2+ floorsb | 1.9 | 1.4 | 1.0 | 1.0 |
| Railing in stairway | 30.8 | 5.4 | 22.5 | 24.3 |
| Among those with 2+ floorsb | 88.8 | 15.6 | 64.7 | 70.3 |
| Railing in hallway | 4.9 | 1.3 | 2.7 | 3.0 |
| Any feature | 78.2 | 37.6 | 53.2 | 57.8 |
| Any feature except railing in stairway | 68.7 | 36.1 | 41.1 | 46.1 |
N=1512
| ||||
| TABLE 3: Benchmarking Estimates from the Health and Retirement Study's Home Modification Module to Previously Published Studies | |||||||
| Outcome | Age Group | Year | Source | Published Estimate | Outcome in 2006HRS Module | Age Group | Estimate |
| Has chronic disability and uses special equipment to bathe/shower | 65+ | 1999 | NLTCSa | 8.5 | Has difficulty with ADL or unable to carry out IADL and used grab bar or seat in show/tub in last 30 days | 65+ | 9.1 |
| Has chronic disability and uses special equipment to toilet | 65+ | 1999 | NLTCSa | 4.9 | Has difficulty with ADL or unable to carry out IADL and used grab bar or raised toilet seat in last 30 days | 65+ | 7.2 |
| Has difficulty bathing and uses special equipment to bathe | 65+ | 2001 | MCBSa | 6.5 | Has difficulty bathing and used grab bar or seat in shower/tub in last 30 days | 65+ | 3.6 |
| Has difficulty toileting and uses special equipment to toilet | 65+ | 2001 | MCBSa | 3.2 | Had difficulty toileting and used grab bar or raised toilet seat in last 30 days | 65+ | 3.1 |
| Has ramps at any entrance | MedicareAll ages | 2004 | MCBSc | 10.5 | Home has ramp at the entrance | Medicare 52+ | 7.8 |
| Have modifications to any bathroom such as grab bars or a shower seat | MedicareAll ages | 2004 | MCBSc | 30.1 | Added grab bar or seat to bath/shower | Medicare 52+ | 28.9 |
| Other than stair railings, has special railings to help move around | Medicare All ages | 2004 | MCBSc | 2.6 | Home has railings in the hallway | Medicare 52+ | 5.7 |
| Home has a modification to the bathroom such as grab bars or shower seat | 70+ | 1993 | AHEADb | 22.9 | Added a grab bar or seat in the shower/tub | 70+ | 32.8 |
| Special railings to help you get around | 70+ | 1993 | AHEADb | 7.8 | Home has railings in the hallway | 70+ | 6.2 |
| Ramps at street level | 70+ | 1993 | AHEADb | 5.0 | Home has ramp at the entrance | 70+ | 9.1 |
| |||||||
| TABLE 4: Benchmarking Estimates of the Existence of Home Features: 2005 Pilot Study vs. 2006 HRS Module | ||
| 2005 Pilot Studya | 2006 HRS Module | |
| Railings at the entrance | 32.3 | 36.2 |
| Ramp at the entrance | 9.3 | 6.6 |
| Stair glide for going up/down stairs | 1.0 | 1.0 |
| Railings for going up/down hallway | 5.5 | 4.9 |
| Grab bars in the shower or tub area | 29.3 | 30.3 |
| A seat for the shower or tub | 19.4 | 27.3 |
| Grab bars around the toilet | 8.0 | 8.5 |
| Raised toilet seat | 15.7 | 15.0 |
| ||
| TABLE 5: Distribution of Amount Paid and Whether Insurance Paid | |||||
| By Imputation Status | By Number of Modifications Addeda | ||||
| Without | With | 1 | 2 | 3+ | |
| dk/rf | 7.5 | 6.5 | 6.9 | 6.5 | 5.5 |
| zero | 10.0 | 9.3 | 10.7 | 11.6 | 4.9 |
| =100 | 28.7 | 31.7 | 41.4 | 32.7 | 13.1 |
| 101-500 | 32.4 | 33.1 | 28.6 | 28.9 | 44.8 |
| 501-1000 | 10.1 | 9.2 | 4.9 | 11.7 | 14.7 |
| 1001+ | 11.3 | 10.3 | 7.5 | 8.7 | 17.0 |
| Total | 100.0 | 100.0 | 100.0 | 100.0 | 100.0 |
| % Insurance paid | 6.1 | 5.6 | 2.4 | 7.5 | 9.7 |
| (N) | 503 | 594 | 279 | 170 | 145 |
| |||||
| TABLE 6: The Existence, Addition and Use of Assistive Home Features by Demographic Characteristics, Population Ages 52+, 2006 | |||||
| N | Any Feature(excluding stair railing) | ||||
| Existence | Addition | Use | |||
| Total | 1512 | 68.7 | 36.1 | 41.1 | |
| Age Group | 52-64 | 541 | 62.3* | 30.0** | 31.6** |
| 65-74 | 571 | 71.3 | 36.3 | 41.7 | |
| 75 and older | 400 | 80.6 | 50.5 | 63.1 | |
| Marital Status | married | 1011 | 66.8* | 35.2** | 37.3** |
| divorced or separated | 147 | 63.8 | 23.2 | 38.3 | |
| widowed | 298 | 78.5 | 48.0 | 56.0 | |
| never married | 56 | 71.5 | 37.0 | 47.4 | |
| Gender | male | 627 | 66.8 | 32.4* | 36.5** |
| female | 885 | 70.2 | 39.0 | 44.7 | |
| Race/Ethnicity | White non-Hispanic/other | 1176 | 68.5** | 36.4* | 41.0** |
| Black non-Hispanic | 214 | 78.6 | 41.5 | 51.4 | |
| Hispanic | 122 | 55.6 | 23.5 | 26.5 | |
| Foreign Born | US born | 1371 | 68.8 | 37.1** | 41.6 |
| foreign | 141 | 67.6 | 23.5 | 35.2 | |
| Completed Education | less than high school | 315 | 71.3 | 40.5* | 47.5** |
| high school/GED | 515 | 71.0 | 40.3 | 47.2 | |
| some college | 359 | 65.5 | 33.9 | 34.3 | |
| college or more | 323 | 67.1 | 29.8 | 35.7 | |
| Other Adult in HH | No | 1184 | 69.8 | 36.2 | 42.5 |
| Yes | 328 | 65.1 | 35.7 | 36.6 | |
| * p0.05 ** p0.01 | |||||
| TABLE 7: The Existence, Addition and Use of Assistive Home Features by Economic Characteristics, Population Ages 52+, 2006 | |||||
| N | Any Feature(excluding stair railing) | ||||
| Existence | Addition | Use | |||
| Total | 1512 | 68.7 | 36.1 | 41.1 | |
| Home Ownership | rent | 234 | 74.7 | 20.5** | 48.5* |
| own | 1278 | 67.6 | 38.9 | 39.8 | |
| Medicare | No | 524 | 59.8** | 27.9** | 27.9** |
| Yes | 988 | 77.3 | 44.1 | 54.1 | |
| Medicare DI | No | 1453 | 67.7** | 35.4* | 39.7** |
| Yes | 59 | 90.1 | 52.3 | 72.2 | |
| Medicaid | No | 1403 | 68.1 | 35.8 | 40.0** |
| Yes | 109 | 78.8 | 41.0 | 60.6 | |
| Employer Coverage | No | 815 | 77.2* | 39.8 | 48.5** |
| Yes | 697 | 65.6 | 32.9 | 34.7 | |
| LTC Insurance | No | 1363 | 67.8* | 35.8 | 40.7 |
| Yes | 149 | 76.2 | 39.1 | 45.1 | |
| 2005 Income | 1st quartile (lowest) | 356 | 76.2* | 40.5* | 53.6** |
| 2nd quartile | 396 | 70.2 | 40.6 | 47.9 | |
| 3rd quartile | 378 | 67.9 | 35.9 | 40.1 | |
| 4th quartile (highest) | 382 | 63.6 | 30.3 | 29.3 | |
| Value of Home | 1st quartile (lowest) | 344 | 73.8 | 30.5 | 46.1 |
| 2nd quartile | 374 | 68.0 | 41.7 | 43.6 | |
| 3rd quartile | 405 | 71.3 | 38.3 | 38.7 | |
| 4th quartile (highest) | 389 | 62.5 | 33.7 | 37.4 | |
| Value of Non-Housing Assets | 1st quartile (lowest) | 369 | 72.0 | 37.9 | 49.8* |
| 2nd quartile | 355 | 68.4 | 40.7 | 40.5 | |
| 3rd quartile | 406 | 68.5 | 33.3 | 39.6 | |
| 4th quartile (highest) | 382 | 66.4 | 33.5 | 36.1 | |
| * p0.05 ** p0.01 | |||||
| TABLE 8: The Existence, Addition and Use of Assistive Home Features by Health and Functioning Characteristics, Population Ages 52+, 2006 | |||||
| N | Any Feature(excluding stair railing) | ||||
| Existence | Addition | Use | |||
| Total | 1512 | 68.7 | 36.1 | 41.1 | |
| Heart Disease | No | 1129 | 66.7** | 34.2* | 37.3** |
| Yes | 383 | 75.9 | 43.0 | 54.7 | |
| Hypertension | No | 636 | 61.4** | 30.2** | 30.8** |
| Yes | 876 | 75.0 | 41.2 | 50.0 | |
| Diabetes | No | 1192 | 66.6** | 34.9 | 36.9** |
| Yes | 320 | 77.7 | 41.2 | 58.8 | |
| Stroke | No | 1382 | 67.6* | 35.6 | 39.3** |
| Yes | 130 | 81.6 | 42.3 | 63.8 | |
| Cancer | No | 1294 | 66.9** | 35.3 | 38.5** |
| Yes | 218 | 80.1 | 41.5 | 57.7 | |
| Lung Disease | No | 1354 | 68.6 | 36.0 | 40.4 |
| Yes | 158 | 69.8 | 37.2 | 48.0 | |
| Arthritis | No | 580 | 62.9** | 29.6** | 31.7** |
| Yes | 932 | 72.8 | 40.7 | 47.9 | |
| Any Upper Body Limitations | No | 646 | 61.7** | 27.9** | 30.4** |
| Yes | 866 | 74.8 | 43.3 | 50.5 | |
| Any Lower Body Limitations | No | 519 | 59.6** | 27.1** | 26.8** |
| Yes | 993 | 74.4 | 41.7 | 50.1 | |
| Memory | excellent/very good/good | 1065 | 66.2** | 35.8 | 37.9** |
| fair/poor | 447 | 75.8 | 36.9 | 50.3 | |
| Vision | excellent/very good/good | 1183 | 66.9** | 35.2 | 37.8** |
| fair/poor/legally blind | 329 | 76.6 | 39.8 | 55.4 | |
| Hearing | excellent/very good/good | 1186 | 67.7 | 35.3 | 39.5* |
| fair/poor | 326 | 73.0 | 39.7 | 48.0 | |
| * p0.05 ** p0.01 | |||||
| TABLE 9: Predictors of the Existence, Addition, and Use of Assistive Home Features, Population Ages 52+, 2006 | |||
| OR for Any Feature(excluding stair railing) | |||
| Existence | Addition | Use | |
| Age group: 65-74 vs. 52-64 | 1.54* | 1.17 | 1.41 |
| Age group: 75 and older | 2.05** | 1.89** | 2.73** |
| Divorced/separated vs. married | 0.76 | 0.57 | 0.88 |
| Widowed | 1.30 | 1.25 | 1.16 |
| Never married | 1.07 | 1.20 | 1.46 |
| Female vs. male | 1.04 | 1.10 | 1.13 |
| Black non-Hispanic vs. White/Other non-Hispanic | 1.47 | 1.30 | 1.18 |
| Hispanic | 0.62 | 0.70 | 0.58 |
| Foreign born vs. US born | 1.39 | 0.67 | 1.01 |
| Less than high school vs. college grad or more | 0.73 | 1.21 | 0.83 |
| High school graduate | 0.87 | 1.16 | 0.98 |
| Some college | 0.77 | 0.99 | 0.70 |
| Other adult in home | 0.76 | 0.99 | 0.68* |
| Own vs. rent home | 0.85 | 4.74** | 0.77 |
| Medicare DI | 4.73** | 2.24* | 3.70** |
| Medicaid | 1.22 | 1.23 | 1.32 |
| Employer-sponsored health insurance | 1.12 | 0.94 | 0.96 |
| LTC insurance | 1.55* | 1.21 | 1.29 |
| 2005 income lowest vs. highest quartile | 0.92 | 0.92 | 0.96 |
| 2nd quartile | 0.77 | 0.89 | 0.98 |
| 3rd quartile | 0.90 | 0.94 | 1.08 |
| Non-housing assets lowest vs. highest quartile | 0.94 | 1.35 | 1.37 |
| 2nd quartile | 1.08 | 1.39 | 1.28 |
| 3rd quartile | 1.16 | 1.02 | 1.34 |
| Housing assets lowest vs. highest quartile | 1.58 | 1.47 | 0.84 |
| 2nd quartile | 1.21 | 0.98 | 0.93 |
| 3rd quartile | 1.51 | 1.03 | 0.90 |
| Heart disease | 0.97 | 1.00 | 1.09 |
| High blood pressure | 1.39* | 1.27 | 1.39* |
| Diabetes | 1.16 | 0.94 | 1.58* |
| Stroke | 1.50 | 1.06 | 1.74 |
| Cancer | 1.62 | 1.14 | 1.71** |
| Lung disease | 0.69 | 0.79 | 0.80 |
| Arthritis | 1.08 | 1.12 | 1.12 |
| Upper body limitation | 1.27 | 1.40* | 1.22 |
| Lower body limitation | 1.29 | 1.18 | 1.48* |
| Fair/poor vision | 1.25 | 0.96 | 1.36 |
| Fair/poor hearing | 0.89 | 0.97 | 0.89 |
| Fair/poor memory | 1.35* | 0.85 | 1.21 |
| Step up to get into home | 1.35 | 1.21 | 1.43* |
| Living space on multiple floors | 1.15 | 0.80 | 1.07 |
| N=1512 * p0.05 ** p0.01 | |||
| TABLE 9A: Predictors of the Existence of Assistive Home Features, Population Ages 52+, 2006 | ||||
| OR for Existence of Any Features(excluding stair railings) | ||||
| Age group: 65-74 vs. 52-64 | 1.41* | 1.70** | 1.52* | 1.54* |
| Age group: 75 and older | 2.24** | 2.62** | 1.99** | 2.05** |
| Divorced/separated vs. married | 0.89 | 0.76 | 0.78 | 0.76 |
| Widowed | 1.25 | 1.20 | 1.30 | 1.30 |
| Never married | 1.29 | 1.03 | 1.11 | 1.07 |
| Female vs. male | 1.05 | 1.05 | 1.03 | 1.04 |
| Black non-Hispanic vs. White/Other non-Hispanic | 1.82** | 1.55 | 1.46 | 1.47 |
| Hispanic | 0.58 | 0.61 | 1.58 | 0.62 |
| Foreign born vs. US born | 1.31 | 1.27 | 1.36 | 1.39 |
| Less than high school vs. college grad or more | 1.05 | 0.84 | 0.71 | 0.73 |
| High school graduate | 1.04 | 0.93 | 0.87 | 0.87 |
| Some college | 0.89 | 0.80 | 0.76 | 0.77 |
| Other adult in home | 0.86 | 0.85 | 0.78 | 0.76 |
| Own vs. rent home | 0.94 | 0.89 | 0.85 | |
| Medicare DI | 6.39** | 4.64** | 4.73** | |
| Medicaid | 1.22 | 1.19 | 1.22 | |
| Employer-sponsored health insurance | 1.13 | 1.14 | 1.12 | |
| LTC insurance | 1.51 | 1.52 | 1.55* | |
| 2005 income lowest vs. highest quartile | 1.11 | 0.91 | 0.92 | |
| 2nd quartile | 0.91 | 0.77 | 0.77 | |
| 3rd quartile | 1.00 | 0.89 | 0.90 | |
| Non-housing assets lowest vs. highest quartile | 0.97 | 0.94 | 0.94 | |
| 2nd quartile | 1.05 | 1.07 | 1.08 | |
| 3rd quartile | 1.13 | 1.19 | 1.16 | |
| Housing assets lowest vs. highest quartile | 1.70 | 1.59 | 1.58 | |
| 2nd quartile | 1.29 | 1.22 | 1.21 | |
| 3rd quartile | 1.52 | 1.48 | 1.51 | |
| Heart disease | 0.95 | 0.97 | ||
| High blood pressure | 1.39* | 1.39* | ||
| Diabetes | 1.17 | 1.16 | ||
| Stroke | 1.53 | 1.50 | ||
| Cancer | 1.64* | 1.62 | ||
| Lung disease | 0.69 | 0.69 | ||
| Arthritis | 1.07 | 1.08 | ||
| Upper body limitation | 1.28 | 1.27 | ||
| Lower body limitation | 1.29 | 1.29 | ||
| Fair/poor vision | 1.23 | 1.25 | ||
| Fair/poor hearing | 0.90 | 0.89 | ||
| Fair/poor memory | 1.35* | 1.35* | ||
| Step up to get into home | 1.35 | |||
| Living space on multiple floors | 1.15 | |||
| N=1512 * p0.05 ** p0.01 | ||||
| TABLE 9B: Predictors of the Addition of Assistive Home Features, Population Ages 52+, 2006 | ||||
| OR for Addition of Any Features(excluding stair railings) | ||||
| Age group: 65-74 vs. 52-64 | 1.21 | 1.29 | 1.18 | 1.17 |
| Age group: 75 and older | 2.01** | 2.21** | 1.89** | 1.89** |
| Divorced/separated vs. married | 0.52 | 0.55 | 0.57 | 0.57 |
| Widowed | 1.10 | 1.20 | 1.26 | 1.25 |
| Never married | 1.07 | 1.20 | 1.21 | 1.20 |
| Female vs. male | 1.14 | 1.16 | 1.10 | 1.10 |
| Black non-Hispanic vs. White/Other non-Hispanic | 1.26 | 1.23 | 1.28 | 1.30 |
| Hispanic | 0.69 | 0.67 | 0.70 | 0.70 |
| Foreign born vs. US born | 0.56* | 0.61* | 0.65 | 0.67 |
| Less than high school vs. college grad or more | 1.49 | 1.25 | 1.24 | 1.21 |
| High school graduate | 1.36 | 1.20 | 1.17 | 1.16 |
| Some college | 1.10 | 1.01 | 1.00 | 0.99 |
| Other adult in home | 1.09 | 1.02 | 0.97 | 0.99 |
| Own vs. rent home | 4.86** | 4.84** | 4.74** | |
| Medicare DI | 2.64** | 2.22* | 2.24* | |
| Medicaid | 1.30 | 1.27 | 1.23 | |
| Employer-sponsored health insurance | 0.96 | 0.95 | 0.94 | |
| LTC insurance | 1.21 | 1.22 | 1.21 | |
| 2005 income lowest vs. highest quartile | 1.07 | 0.95 | 0.92 | |
| 2nd quartile | 1.03 | 0.91 | 0.89 | |
| 3rd quartile | 1.05 | 0.96 | 0.94 | |
| Non-housing assets lowest vs. highest quartile | 1.37 | 1.36 | 1.35 | |
| 2nd quartile | 1.44 | 1.41 | 1.39 | |
| 3rd quartile | 1.02 | 1.04 | 1.02 | |
| Housing assets lowest vs. highest quartile | 1.60 | 1.53 | 1.47 | |
| 2nd quartile | 1.04 | 1.02 | 0.98 | |
| 3rd quartile | 1.07 | 1.04 | 1.03 | |
| Heart disease | 0.99 | 1.00 | ||
| High blood pressure | 1.28 | 1.27 | ||
| Diabetes | 0.95 | 0.94 | ||
| Stroke | 1.05 | 1.06 | ||
| Cancer | 1.16 | 1.14 | ||
| Lung disease | 0.80 | 0.79 | ||
| Arthritis | 1.14 | 1.12 | ||
| Upper body limitation | 1.41* | 1.40* | ||
| Lower body limitation | 1.19 | 1.18 | ||
| Fair/poor vision | 0.95 | 0.96 | ||
| Fair/poor hearing | 0.97 | 0.97 | ||
| Fair/poor memory | 0.85 | 0.85 | ||
| Step up to get into home | 1.21 | |||
| Living space on multiple floors | 0.80 | |||
| N=1512 * p0.05 ** p0.01 | ||||
| TABLE 9C: Predictors of the Use of Assistive Home Features, Population Ages 52+, 2006 | ||||
| OR for Use of Any Features(excluding stair railings) | ||||
| Age group: 65-74 vs. 52-64 | 1.43* | 1.64* | 1.39 | 1.41 |
| Age group: 75 and older | 3.28** | 3.74** | 2.63** | 2.73** |
| Divorced/separated vs. married | 1.06 | 0.87 | 0.90 | 0.88 |
| Widowed | 1.19 | 1.10 | 1.18 | 1.16 |
| Never married | 1.71 | 1.38 | 1.49 | 1.46 |
| Female vs. male | 1.14 | 1.13 | 1.12 | 1.13 |
| Black non-Hispanic vs. White/Other non-Hispanic | 1.62* | 1.30 | 1.17 | 1.18 |
| Hispanic | 0.59 | 0.56 | 0.55 | 0.58 |
| Foreign born vs. US born | 0.98 | 0.92 | 0.98 | 1.01 |
| Less than high school vs. college grad or more | 1.37 | 0.97 | 0.81 | 0.83 |
| High school graduate | 1.34 | 1.10 | 0.99 | 0.98 |
| Some college | 0.87 | 0.75 | 0.70 | 0.70 |
| Other adult in home | 0.82 | 0.79 | 0.70* | 0.68* |
| Own vs. rent home | 0.86 | 0.83 | 0.77 | |
| Medicare DI | 5.53** | 3.56** | 3.70** | |
| Medicaid | 1.43 | 1.29 | 1.32 | |
| Employer-sponsored health insurance | 0.97 | 0.97 | 0.96 | |
| LTC insurance | 1.28 | 1.27 | 1.29 | |
| 2005 income lowest vs. highest quartile | 1.21 | 0.96 | 0.96 | |
| 2nd quartile | 1.21 | 0.99 | 0.98 | |
| 3rd quartile | 1.23 | 1.07 | 1.08 | |
| Non-housing assets lowest vs. highest quartile | 1.41 | 1.36 | 1.37 | |
| 2nd quartile | 1.25 | 1.28 | 1.28 | |
| 3rd quartile | 1.29 | 1.37 | 1.34 | |
| Housing assets lowest vs. highest quartile | 0.92 | 0.85 | 0.84 | |
| 2nd quartile | 1.00 | 0.95 | 0.93 | |
| 3rd quartile | 0.93 | 0.88 | 0.90 | |
| Heart disease | 1.05 | 1.09 | ||
| High blood pressure | 1.40* | 1.39* | ||
| Diabetes | 1.60** | 1.58* | ||
| Stroke | 1.75 | 1.74 | ||
| Cancer | 1.74** | 1.71** | ||
| Lung disease | 0.81 | 0.80 | ||
| Arthritis | 1.13 | 1.12 | ||
| Upper body limitation | 1.23 | 1.22 | ||
| Lower body limitation | 1.48* | 1.48* | ||
| Fair/poor vision | 1.35 | 1.36 | ||
| Fair/poor hearing | 0.89 | 0.89 | ||
| Fair/poor memory | 1.21 | 1.21 | ||
| Step up to get into home | 1.43* | |||
| Living space on multiple floors | 1.07 | |||
| N=1512 * p0.05 ** p0.01 | ||||
| TABLE 10: Percentage of Adults Ages 52 and Older with Unmodified Environmental Barriers and Lower Body Limitationa | |
| Type of Barrier | Percent with Barrier and Lower Body Limitation |
| Entry: Has to step up to get into the home/building and has no ramp or handrails | 9.3 |
| Shower/bath: Does not have shower separate from bath and has no grab bars or bath seat | 9.0 |
| Toilet area: Has no raised toilet seat or grab bars in toilet area | 20.3 |
| Any: Has unmodified barrier at entry, shower/bath area, or toilet area | 23.1 |
| N | 510 |
| |
| TABLE 11: Characteristics of Respondents At Risk for Home Modification, Population Ages 52+, 2006 | ||||
| At Risk for Home Modification | ||||
| No | Yes | p | ||
| Age Group | 52-64 | 54.6 | 42.5 | ** |
| 65-74 | 26.5 | 25.8 | ||
| 75 and older | 18.8 | 31.7 | ||
| Marital Status | married | 68.7 | 59.1 | * |
| divorced or separated | 11.2 | 13.0 | ||
| widowed | 15.2 | 23.9 | ||
| never married | 4.9 | 4.0 | ||
| Gender | male | 45.2 | 38.5 | |
| female | 54.9 | 61.6 | ||
| Race/Ethnicity | White non-Hispanic | 86.5 | 79.0 | ** |
| Black non-Hispanic | 8.1 | 13.7 | ||
| Hispanic | 5.4 | 7.3 | ||
| Foreign Born | US born | 92.8 | 92.6 | |
| foreign | 7.2 | 7.4 | ||
| Completed Education | less than high school | 13.9 | 26.6 | ** |
| high school/GED | 31.7 | 36.6 | ||
| some college | 27.1 | 20.4 | ||
| college or more | 27.3 | 16.3 | ||
| Living Arrangement | other adult in HH | 22.3 | 25.4 | |
| Home Ownership | rent | 13.6 | 20.1 | ** |
| own | 86.5 | 79.9 | ||
| Insurance | Medicare | 45.5 | 67.8 | ** |
| Medicare DI | 2.2 | 11.8 | ** | |
| Medicaid | 3.7 | 12.2 | ** | |
| employer-based coverage | 58.4 | 36.7 | ** | |
| LTC insurance | 10.9 | 7.7 | ||
| 2005 Income | 1st quartile (lowest) | 15.2 | 34.0 | ** |
| 2nd quartile | 22.0 | 27.0 | ||
| 3rd quartile | 26.6 | 21.7 | ||
| 4th quartile (highest) | 36.2 | 17.3 | ||
| Value of Home | 1st quartile (lowest) | 20.0 | 29.8 | ** |
| 2nd quartile | 21.8 | 28.7 | ||
| 3rd quartile | 28.9 | 21.0 | ||
| 4th quartile (highest) | 29.3 | 20.5 | ||
| Value of Non-Housing Assets | 1st quartile (lowest) | 18.3 | 34.0 | ** |
| 2nd quartile | 23.2 | 24.9 | ||
| 3rd quartile | 30.3 | 20.7 | ||
| 4th quartile (highest) | 28.1 | 20.4 | ||
| Chronic Conditions | health disease | 18.3 | 33.5 | ** |
| high blood pressure | 49.1 | 68.9 | ** | |
| diabetes | 16.3 | 28.5 | ** | |
| stroke | 5.5 | 14.6 | ** | |
| cancer | 12.5 | 17.1 | * | |
| lung disease | 6.6 | 20.0 | ** | |
| arthritis | 51.5 | 80.5 | ** | |
| Functioning | upper body limitation | 43.5 | 86.1 | ** |
| lower body limitation | 53.1 | 89.4 | ** | |
| fair/poor memory | 21.4 | 42.4 | ** | |
| fair/poor vision | 14.2 | 34.5 | ** | |
| fair/poor hearing | 16.0 | 29.3 | ** | |
| N | 982 | 510 | ||
| NOTE: Sample includes respondents ages 52 and older with positive weight. * p0.05 ** p0.01 | ||||
| TABLE 12: Predictors of Being At Risk for a Home Modification, Population Ages 52+, 2006 | |
| Odds Ratio | |
| Age group: 65-74 vs. 52-64 | 0.94 |
| Age group: 75 and older | 1.27 |
| Divorced/separated vs. married | 1.00 |
| Widowed | 1.07 |
| Never married | 0.62 |
| Female vs. male | 0.95 |
| Black non-Hispanic vs. White/Other non-Hispanic | 0.44 |
| Hispanic | 0.54 |
| Foreign born vs. US born | 0.85 |
| Less than high school vs. college grad or more | 0.84 |
| High school graduate | 0.82 |
| Some college | 0.66 |
| Other adult in home | 1.18 |
| Own vs. rent home | 2.72** |
| Medicare DI | 1.33 |
| Medicaid | 0.72 |
| Employer-sponsored health insurance | 0.93 |
| LTC insurance | 0.94 |
| 2005 income lowest vs. highest quartile | 1.31 |
| 2nd quartile | 1.02 |
| 3rd quartile | 1.03 |
| Non-housing assets lowest vs. highest quartile | 0.78 |
| 2nd quartile | 0.84 |
| 3rd quartile | 0.85 |
| Housing assets lowest vs. highest quartile | 1.16 |
| 2nd quartile | 1.22 |
| 3rd quartile | 0.82 |
| Heart disease | 0.97 |
| High blood pressure | 1.11 |
| Diabetes | 1.10 |
| Stroke | 1.78* |
| Cancer | 1.12 |
| Lung disease | 1.92** |
| Arthritis | 1.73* |
| Upper body limitation | 3.56** |
| Lower body limitation | 2.27** |
| Fair/poor vision | 1.39 |
| Fair/poor hearing | 1.10 |
| Fair/poor memory | 1.41* |
| N=1512 * p0.05 ** p0.01 | |
NOTES
-
Early release means that there may be errors in the data files and/or the associated codebooks.
-
Out-of-pocket costs and source of payment are missing for approximately 91 people who were inadvertently skipped around the cost questions because they only added one assistive home feature. This skip pattern logic was corrected early in the fieldwork (version 4 of the CATI). We imputed missing information from respondents who added exactly one feature to their home, but who were not skipped around the payment questions (N=197). After exploring several approaches, we opted to assign values to missing cases based on a hot-deck (cell-based) methodology. Cells were created based upon what feature was added and the insurance status and age group of the respondent. As discussed in the Results section, the imputation procedure did not substantially alter the distribution or the percentage reporting that insurance paid for some of the reported modification(s).
-
Note we do not include an indicator of Medicare in models because the vast majority of persons 65 and older in the sample report having that source of coverage.
-
In additional analyses (not shown) we found that the associations between education and the addition and use of assistive home features were largely accounted for by age and Medicare DI. That is, although having fewer years of education significantly predicted higher chances of adding and using assistive home features in unadjusted models, after controlling for age and Medicare DI the OR for having less than a high school education (vs. college graduate or more) was attenuated and no longer statistically significant. The addition of health and housing-related factors had little influence on these educational effects (see Tables 9A-9C).
-
Analyses of individual assistive features (not shown) suggest the ORs are consistently strong across the different types of assistive features, and range from 3 to 12, depending on the feature.
-
However, the relationship between Medicare DI and assistive home features is limited to bathroom modifications (grab bars for bath/shower, seat for bath/shower, grab bars around toilet, raised toilet seat).
-
In analyses of individual features, we found this relationship is limited to only two cases: having grab bars in the bath or shower and having a seat in the bath or shower.
-
This estimate is nearly identical to the estimate generated from the 2005 Pilot Study of Technology and Aging (Freedman, Agree, & Cornman 2007).
To obtain a printed copy of this report, send the full report title and your mailing information to:
U.S. Department of Health and Human ServicesOffice of Disability, Aging and Long-Term Care PolicyRoom 424E, H.H. Humphrey Building200 Independence Avenue, S.W.Washington, D.C. 20201FAX: 202-401-7733Email: webmaster.DALTCP@hhs.gov
RETURN TO:
Office of Disability, Aging and Long-Term Care Policy (DALTCP) Home [http://aspe.hhs.gov/_/office_specific/daltcp.cfm]Assistant Secretary for Planning and Evaluation (ASPE) Home [http://aspe.hhs.gov]U.S. Department of Health and Human Services Home [http://www.hhs.gov]