
U.S. Department of Health and Human Services
The Impact of Private Long-Term Care Insurance Benefits on Selected Medicare Services
Jessica Miller, M.S., Boryana Dimitrova, M.A. and Marc Cohen, Ph.D.
LifePlans, Inc.
March 12, 2002
PDF Version: http://aspe.hhs.gov/daltcp/reports/2002/privimp.pdf (33 PDF pages)
This report was prepared under contract #BPA-OS-01-0267C between the U.S. Department of Health and Human Services (HHS), Office of Disability, Aging and Long-Term Care Policy (DALTCP) and LifePlans, Inc. For additional information about this subject, you can visit the DALTCP home page at http://aspe.hhs.gov/_/office_specific/daltcp.cfm or contact the ASPE Project Officer, Pamela Doty, at HHS/ASPE/DALTCP, Room 424E, H.H. Humphrey Building, 200 Independence Avenue, S.W., Washington, D.C. 20201. Her e-mail address is: Pamela.Doty@hhs.gov.
The opinions and views expressed in this report are those of the authors. They do not necessarily reflect the views of the Department of Health and Human Services, the contractor or any other funding organization.
TABLE OF CONTENTS
A. Medicare Use Among Privately Insured Claimants
B. Medicare Use Among Privately Insured Disabled Claimants and Non-Privately Insured Disabled Elders
C. Multivariate Analysis of Medicare Use Among Privately Insured Disabled Claimants and Non-Privately Insured Disabled Elders
LIST OF FIGURES
FIGURE 1: Use of Medicare Services Among Privately Insured Claimants
FIGURE 2: Use of Medicare Services by Insurance Status
FIGURE 3: Medicare Acute Expenditures by Service Type and Insurance Status
LIST OF TABLES
TABLE 1: Mean Visits and Expenditures on Medicare Services by Privately Insured Claimants
TABLE 2: Use of Medicare Services by Insurance Status
TABLE 3: Characteristics of Privately Insured and Non-Privately Insured Disabled Elders
TABLE 4: Independent Impact of Private Long-Term Care Insurance on Measures of Medicare Services Utilization
TABLE 5: Characteristics Related to Expenditures on Selected Medicare Services
APPENDIX 1: Use of Any Medicare Services or Any Home Health Services by Insurance State
APPENDIX 2: Use of Medicare Home Health Aide and Skilled Nurse Services by Insurance Status
APPENDIX 3: Mean Number of Home Health Aide and Skilled Nursing Visits by Insurance Status
APPENDIX 4: Use of Skilled Nursing Facility and Inpatient Services by Insurance Status
APPENDIX 5: Mean Number of Skilled Nursing Facility and Inpatient Days by Insurance Status
APPENDIX 6: Mean Expenditures on Home Health Aide and Skilled Nursing Services by Insurance Status
APPENDIX 7: Mean Expenditures on Skilled Nursing Facility and Inpatient Services by Insurance Status
APPENDIX 8: Characteristics Associated with the Use of Home Health Aide Services
APPENDIX 9: Characteristics Associated with the Use of Skilled Nursing Services
APPENDIX 10: Characteristics Associated with the Use of Skilled Nursing Facility Services
APPENDIX 11: Characteristics Associated with the Use of Inpatient Hospitalization Services
EXECUTIVE SUMMARY
The purpose of this study is to gain a better understanding of how having a private long-term care (LTC) insurance policy interacts with and affects the use of Medicare financed home health, skilled nursing and inpatient services. We use Medicare claims data provided by the Centers for Medicare and Medicaid Services (CMS) and link it to a sample of 578 community-based disabled elders receiving benefits under their long-term care insurance policies. Results are compared to a similarly disabled population -- derived from the 1994 National Long-Term Care Survey -- of 1,349 disabled elders who are not privately insured.
Key findings include:
-
Between one-quarter and one-third of private insurance claimants used Medicare home health services in the year immediately preceding the use of insurance benefits or within one year of their claim being opened.
-
Most privately insured individuals who access Medicare financed home health care use skilled nursing visits, and the proportion of those who do so actually increases after the receipt of private insurance benefits.
-
Long-term care insurance claimants tend to be less likely than similarly disabled non-insured elders to use home health aide services.
-
The privately insured have fewer home health aide visits and fewer skilled nursing visits. In fact, they receive roughly half as many visits as their non-insured counterparts.
-
The per-visit home health aide and skilled nursing cost for privately insured claimants is much higher than for the non-privately insured.
-
While Medicare does spend less on the privately insured for home-based services, this is somewhat offset by higher expenditures on facility-based skilled care.
- After accounting for the differences in the health and socio-demographic characteristics of the two samples, individuals who are receiving private long-term care insurance payments:
- are less likely to access Medicare financed home health aide services;
- have fewer visits and lower expenditures (i.e. $2,400 lower) for home health aide services;
- are just as likely to use Medicare skilled nursing services and have roughly similar expenditures; and
-
use similar levels of facility-based skilled nursing services and inpatient hospital care.
In sum, as more individuals purchase private LTC insurance policies, the use of and expenditures on the Medicare home health aide benefit should decline. To the extent that over time the differential between Medicare reimbursement and private pay rates for skilled nursing diminishes, the proliferation of private insurance policies will also lead to expenditure reductions in Medicare skilled nursing services. Taken together, these findings support the proposition that patterns of service use in the private market can and do have an effect on the use of publicly financed long-term care expenditures.
PURPOSE
The purpose of this analysis is to gain a better understanding of how having a private LTC insurance policy interacts with and affects the use of Medicare financed home health, skilled nursing and inpatient services. We use Medicare claims data provided by the CMS and link it to a sample of 578 community based disabled elders receiving benefits under their long-term care insurance policies. The sample of claimants, who comprise the 2000 LTC Insurance Panel, was developed for an ASPE-sponsored study completed in 2000. By linking Medicare claims data to these individuals we are able to examine the relationship between long-term care and acute or post-acute care service utilization in the year prior to and after the time when private insurance benefits were paid. We also make comparisons of Medicare use and expenditures to a sample of 1,349 disabled non-insured community residents in the general population. Information about this sample is derived from the 1994 National Long-Term Care Survey. The aims of this inquiry are to:
-
Compare the use of Medicare financed home health aide, skilled nursing, nursing care in institutions and inpatient hospital care among privately insured and non-privately insured disabled elders in the community.
-
Examine the impact of long-term care policy ownership on various measures of utilization volume of visits and annual expenditures. We will look at the incidence of Medicare financed care for the period prior to, and during the time of claim for the privately insured.
-
Identify the factors and independent effect of owning long-term care insurance on the use of Medicare financed services.
BACKGROUND AND METHOD
In a prior study, we showed that most individuals (93%) receiving benefits under their long-term care insurance policies reported that they were not receiving Medicare financed home health care services the week prior to their interview.1 Based on these self-reports, we concluded that Medicare was not a particularly important home care payment source for the privately insured. In contrast, for non-privately insured disabled elders, roughly 30% reported using Medicare as a payment source for home care services.2
There may be a number of reasons why the privately insured reported accessing Medicare home health services less frequently than the non-privately insured. First, because they have private insurance that pays for the same services that are reimbursable under the Medicare home health program, one would expect lower utilization of Medicare services. Also, given that people are paying premiums for policies that cover home care, there may be less incentive and general awareness about the ability to access Medicare benefits for home health care services. Finally, the health and medical status of the privately insured may vary significantly from that of the non-privately insured and there may be less need or demand for the skilled post-acute services for which Medicare has been a traditional payer.
Whatever the reason, there is a clear difference in reported use of Medicare home health services among privately insured and non-privately insured disabled elders. However, given the fact that agencies may bill Medicare directly for provided services, reported use may not reflect actual use. Also, individuals who have multiple payment sources that can pay for overlapping services may be unsure which payer source is paying for which service. Finally, there is the general issue of confusion when it comes to identifying public and private financing sources. Although individuals were asked about payment sources for services delivered in the week prior to the in-person interview, it is possible that they simply do not know or that someone other than himself or herself handles the payment function.
In order to gain a more precise picture of Medicare use, in the analyses that follow, we rely exclusively on Medicare claims data that were provided for all individuals in the LTC Insurance Panel. The claims data were linked to the information collected at the time of in-person interviews. The data include:
- home health aide visits and expenditures;
- skilled nursing visits and expenditures;
- the number of days of skilled nursing facility care and associated expenditures; and
-
the number of inpatient hospital days and associated expenditures.
Medicare claims data from between 1992 and 2000 were linked to each individual in the LTC Insurance Panel. The primary time-dependent units of analysis are the use of care and expenditures in the year prior to a LTC insurance claim first being paid and the year after the LTC insurance claim was first paid.
When making comparisons to the non-privately insured sample, that is, those disabled elders comprising the 1994 National Long-Term Care Survey (NLTCS), the time-dependent unit of analysis is the interview year. For the 2000 LTC Insurance Panel this is typically 1998 whereas for the 1994 NLTCS, this is 1994. All comparisons between the two samples will be based on their respective interview year. To account for the fact that there is an average four-year difference in interview dates, we inflate the expenditure data of the 1994 sample to 1998 dollars. This assures that sample comparisons related to expenditures can be made between each group. The adjustment is based on the medical component of the consumer price index, which increased on average roughly 3% per year during the period.
FINDINGS
A. Medicare Use Among Privately Insured Claimants
Figure 1 shows whether or not there has been any use of Medicare reimbursed services among the privately insured sample before and after the start of private insurance claims.
| FIGURE 1: Use of Medicare Services Among Privately Insured Claimants |
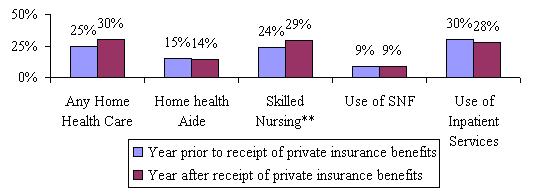 |
| SOURCE: 2000 Long-Term Care Insurance Panel. NOTE: "Any Home Health Care" includes use of home health aides or skilled nursing services. ** significant at the .05 level. |
As shown, between one-quarter and one-third of the private insurance claimants accessed Medicare home health services in the year immediately preceding the use of insurance benefits or within one year of their claim being opened. This is clearly greater than the 7% of individuals who reported Medicare as a payment source for their home health care services during the period of this study. Most individuals who access Medicare financed home health care use skilled nursing visits, and the proportion of those who do so actually increases after the receipt of private insurance benefits. This may reflect individuals' worsening condition, or it may also reflect that individuals allocate private insurance dollars to pay for less skilled services -- which Medicare is less likely to pay for -- while Medicare pays for the more costly skilled services. About one in ten claimants required some level of skilled nursing facility care before and after his or her claim was opened.
Table 1 shows the mean number of visits and expenditures for selected Medicare services.
| TABLE 1. Mean Visits and Expenditures on Medicare Services by Privately Insured Claimants | ||
| Service Category | Year Prior to Claim First Paid | Year After Claim First Paid |
| Number of Home Health Visits | 15*** | 20 |
| Home Health Aide Visits | 8 | 11 |
| Skilled Nurse Visits | 8*** | 10 |
| Home Health Payments | $1335*** | $1737 |
| Home Health Aide Payments | $515 | $745 |
| Skilled Nurse Payments | $830*** | $1099 |
| Number of SNF Medicare Covered Days | 2 | 3 |
| Skilled Nursing Facility Payment | $643 | $755 |
| Number of Inpatient Medicare Covered Days | 6*** | 5 |
| Inpatient Payment | $5561 | $4460 |
| SOURCE: 2000 Long-Term Care Insurance Panel.NOTE: "Any Home Health Care" includes use of home health aides and skilled nursing services.***significant at the .01 level; ** significant at the .05 level. | ||
The average annual number of home health visits for LTC insurance claimants varies between 15 and 20, depending on whether one focuses on pre-claim or post-claim utilization. Total home health payments are between $1,335 and $1,737 per claimant (depending on pre- or post-claim status). Again, differences between the two time periods are related to the use of and expenditure on skilled nursing care services. Between $4,500 and $5,500 was spent on inpatient hospital care for these claimants.
Taken alone, it is difficult to evaluate whether this level of utilization is high or low, given the circumstance of these individuals. Clearly, utilization of Medicare reimbursed services is higher than what was reported by claimants, but it may also be lower than what would be expected for a similarly disabled non-privately insured population. In the sections that follow, we illustrate how use of these services differs depending on the insurance status of an individual. We also examine the independent effect of insurance status on various measures of service utilization and cost.
B. Medicare Use Among Privately Insured Disabled Claimants and Non-Privately Insured Disabled Elders
In Figure 2 we compare the use of selected Medicare services among privately insured claimants (2000 LTC Insurance Panel) and non-privately insured disabled elders (1994 NLTCS). Both groups are living in the community and are either disabled in two or more activities of daily living (ADLs) or are cognitively impaired as measured by the Short Portable Mental Status Questionnaire (SPMSQ) or by a dementia-related medical diagnosis. The figure shows the percentage of each sample using specific services during the year of the interview.
| FIGURE 2: Use of Medicare Services by Insurance Status |
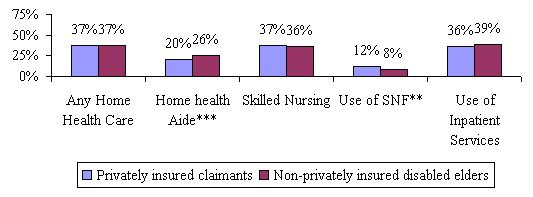 |
| SOURCE: 2000 Long-Term Care Insurance Panel and 1994 National Long-Term Care Survey. NOTE: "Any Home Health Care" includes use of home health aides or skilled nursing services. ***significant at the .01 level; ** significant at the .05 level. |
As shown, long-term care insurance claimants tend to be less likely to use home health aide services but are somewhat more likely to access post-acute care in skilled facilities. There are no statistically significant differences in the use of skilled nursing services or in the use of inpatient care during the interview year.
| TABLE 2. Use of Medicare Services by Insurance Status | ||
| Year of Interview Privately Insured | Year of Interview Non-PrivatelyInsured | |
| Number of Home Health Visits | 21*** | 40 |
| Home Health Aide Visits | 11*** | 25 |
| Skilled Nurse Visits | 11*** | 15 |
| Home Health Payments | $1866** | $2482 |
| Home Health Aide Payments | $768*** | $1290 |
| Payment per Home Health Aide visit | $68*** | $54 |
| Skilled Nurse Payments | $1169 | $1221 |
| Payment per Skilled Nurse visit | $113*** | $82 |
| Number of SNF Medicare Covered Days | 3 | 2 |
| Skilled Nursing Facility Payment | $925* | $603 |
| Payment per day for SNF | $347*** | $275 |
| Number of Inpatient Medicare Covered Days | 5* | 6 |
| Inpatient Payment | $5348 | $5161 |
| Payment per day for Inpatient | $1248 | $1073** |
| SOURCE: 2000 Long-Term Care Insurance Panel and 1994 National Long-Term Care Survey.***significant at the .01 level; ** significant at the .05 level; * significant at the .10 level. | ||
Table 2 summarizes the mean number of visits, expenditures, and unit costs for selected Medicare services by the insurance status of individuals. The privately insured have fewer home health aide visits and fewer skilled nursing visits. In fact, they receive roughly half as many visits as their non-insured counterparts. Had per visit costs between the two groups been equal, one would expect that aggregate expenditures of the privately insured to be roughly half that of the non-privately insured. Instead, there is only a 25% difference in expenditures -- $1,866 compared to $2,482. This smaller difference results because the per-visit home health aide and skilled nursing costs for privately insured claimants are much higher than those for the non-privately insured.
In addition, although the average number of skilled nursing home days for each of the two groups is comparable, expenditures are 53% higher for the privately insured group. Finally, the privately insured use slightly fewer inpatient days but again, their costs per day are higher. There is no statistically significant difference in the expenditures on inpatient care between the two groups.
These findings suggest that privately insured disabled elders are accessing higher cost providers or that they are receiving longer visits, hence higher per visit costs and Medicare reimbursement. The higher costs associated with facility-based skilled nursing and inpatient care also reinforce the impression that many of these individuals may have started their recent course of disability with an acute incident requiring post-acute care or they may be more functionally or cognitively disabled.
Of course, it is important to note that in these bivariate analyses, we have not yet controlled for differences in the socio-demographic and health characteristics of the samples. Only after controlling for such variables can we ascribe with more certainty the magnitude of any differences observed by insurance status.
Figure 3 summarizes the differences in expenditures across service types and provides aggregate expenditures (i.e. home health aide and skilled nursing expenditures in the community and in facilities) by insurance status. The figure shows that while Medicare does spend less on privately insured individuals for home health aide services, this is somewhat offset by higher expenditures on facility-based skilled care.
| FIGURE 3: Medicare Acute Expenditures by Service Type and Insurance Status |
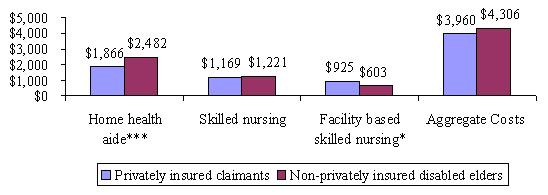 |
| SOURCE: 2000 Long-Term Care Insurance Panel and 1994 National Long-Term Care Survey. ***significant at the .01 level; ** significant at the .05 level; * significant at the .10 level. |
Appendices 1 through 7 summarize the relationship between measures of Medicare services utilization and the characteristics of individuals in each of the two samples. Summarized is the proportion of individuals who access a particular service and among those who do use services, the number of visits or days of care as well as total expenditures on care.
The key findings from these appendices are:
-
There are few differences in the proportion of disabled individuals who access Medicare home health services by insurance status or by other socio-demographic characteristics.
-
There are significant differences in the number of home health aide and skilled nursing visits by insurance status. For the most part, the non-privately insured consume more visits.
-
A number of socio-demographic characteristics are related to the use of home health aide and skilled nursing visits including age, functional status, cognitive status, gender, income level and marital status.
-
Differences in expenditures by insurance status exist, but are less pronounced than differences in the volume of visits. Typically, the privately insured spend somewhat less on home health aide and skilled nursing services.
-
Many of the socio-demographic characteristics related to the use of care are also related to the expenditures on care.
| TABLE 3. Characteristics of Privately Insured and Non-Privately Insured Disabled Elders | ||
| Socio-Demographic Characteristic | Privately Insured | Non-Privately Insured |
| Average Age | 79 years | 79 years |
| Female | 66% | 66% |
| Married | 48%** | 44% |
| Living alone | 29%*** | 23% |
| ADL Status | ||
| 0-1 Limitations | 7%*** | 33% |
| 2-3 limitations | 33%*** | 26% |
| 4+ limitations | 60%*** | 41% |
| Cognitive Impairment | 39% | 56% |
| Income greater than $30,000 | 50% | 6% |
| SOURCE: 2000 Long-Term Care Insurance Panel and 1994 National Long-Term Care Survey.NOTE: Individuals in the sample must have at least two or more ADL limitations or be cognitively impaired.***significant at the .01 level; ** significant at the .05 level; * significant at the .10 level. | ||
As previously mentioned, there may be significant socio-demographic and health differences between the two groups that account for these patterns of service utilization. Until controlled for, we cannot know whether observed differences in service utilization and expenditures are related to the "private insurance effect" or to some of these socio-demographic or health effects. Table 3 highlights the socio-demographic characteristics of each of the two groups.
As shown, there are important differences between the two groups. The privately insured tend to have more physical limitations, whereas disabled elders without private insurance tend to exhibit higher rates of cognitive impairment. Also, the privately insured are wealthier, and more likely to be living alone. In the section that follows, we control for many of these characteristics to determine whether insurance status alone can explain differences in patterns of service utilization between the two groups.
C. Multivariate Analysis of Medicare Use Among Privately Insured Disabled Claimants and Non-Privately Insured Disabled Elders
1. Access and Volume
We are interested in determining whether having private long-term care insurance influences:
-
the probability of accessing specific Medicare post-acute and skilled services;
-
the volume (i.e. number of visits or days of care) of service use;
-
the level of expenditures for specific Medicare post-acute and skilled services.
To answer the first question we employ logistic regression techniques. The dependent variable is simply use/non-use of a particular service, and therefore its values are constrained between 0 (non-use) and 1 (use). Because the dependent variable is dichotomous, it is possible to conceptualize the problem in terms of probabilities. In essence, we are predicting the probability of accessing a particular service given a set of characteristics.
To model the level of visits, we focus only on those individuals who have at least one visit. Thus, the dependent variable is continuous and we employ standard regression techniques to measure the independent effect of variables on volume of service use. For one dependent variable -- the number of days in a skilled nursing facility -- there were not enough observations to perform a meaningful statistical analysis. Too few individuals (152) used care, and the variation in the number of days used was very small.
We also use standard regression analysis to measure the characteristics associated with the expenditure levels of selected Medicare services. We tested 11 variables in each of the equations. These included age, marital status, education, number of ADL limitations, cognitive status, the presence of a diagnosis of cancer, stroke, heart condition or respiratory illness, and insurance status. Gender was also tested but not found to be significant in any of the equations. The same was true of income level. Moreover, because of the high degree of collinearity between income and insurance status, both variables could not be modeled together.
In previous research, we demonstrated that in the presence of insurance, the income effect on service utilization is not significant.3
For the most part, the models did not explain a great deal of the variation in the dependent variable. The adjusted R2 for the equations varied between 3% and 11%. Thus, there is still a great deal of unexplained variance in the data. Even so, we were able to isolate the independent effect of insurance status and other variables on the dependent variables tested. Table 4 below summarizes the results from the regression analyses, all of which are presented in Appendices 8 through 11.
| TABLE 4. Independent Impact of Private Long-Term Care Insurance on Measures of Medicare Services Utilization | |
| Service Category | Impact of Private Long-Term Care Insurance |
| Home Health Aide Services | |
| Any Use | Negative effect |
| Volume of use (number of visits) | Negative effect |
| Total Expenditures | Negative effect |
| Skilled Nursing Services | |
| Any Use | No effect |
| Volume of use (number of visits) | Negative effect |
| Total Expenditures | No effect |
| Skilled Nursing Facility Services | |
| Any Use | No effect |
| Volume of use (number of visits)* | ----- |
| Total Expenditures* | ----- |
| Inpatient Facility Services | |
| Any Use | No effect |
| Volume of use (number of visits) | No effect |
| Total Expenditures | No effect |
| SOURCE: 2000 Long-Term Care Insurance Panel and 1994 National Long-Term Care Survey.* Too few observations to enable multivariate analysis. | |
In general, the selected key findings are that:
-
Individuals who are receiving private long-term care insurance payments are less likely to access Medicare financed home health aide services, and among those who do use such services both the volume and the expenditure level are lower than that for non-privately insured individuals (See Appendix 8).
-
Individuals receiving private insurance benefits are only .65 times as likely to use Medicare home health aide services and they tend to use an average of 52 fewer visits per year.
-
Individuals suffering from a stroke or a respiratory illness are 1.8 and 1.3 times more likely to use some level of home health aide services respectively than are individuals without these diagnoses. However, among users of these services there is no difference in the volume of use by diagnosis.
-
Married individuals who use home health aide services typically use 19 fewer visits per year than non-married individuals.
-
Each additional ADL limitation increases the annual number of home health aide visits by 12.
-
Individuals with more than a high school education are less likely to access home health aide services, and among those who do, they tend to receive fewer visits over the course of a year.
-
-
Privately insured individuals are just as likely to use Medicare skilled nursing services, as are those without private insurance. However, among users of skilled nursing services, the privately insured use fewer visits (See Appendix 9).
-
A privately insured individual who uses skilled nursing services receives 12 fewer visits per year, everything else held constant.
-
Individuals with cognitive impairment are only .73 times as likely to access skilled nursing services as are those who are cognitively intact.
-
The most likely users of this service are individuals who have suffered a stroke. Those with respiratory, heart, diabetes, or cancer diagnoses are also more likely to access this service than are individuals who have other medical diagnoses.
-
-
The receipt of private LTC insurance benefits has no effect on the use of facility-based skilled nursing services (Appendix 10).
-
The use of facility-based skilled nursing is associated with advancing age, increases in limitations in ADLs, and having a diagnosis of either stroke or cancer.
-
-
The availability of private insurance benefits has no effect on the use of inpatient hospital services (See Appendix 11).
2. Expenditures
The analysis of access, volume, and visit cost differences between the privately insured and the non-privately insured does not clarify whether receipt of private LTC insurance benefits is associated with lower Medicare home health and facility-based nursing care expenditures. In the analysis that follows, we identify the independent effect of private insurance on Medicare expenditures for each of the service categories. We also combine home health aide and community-based skilled nursing services into a single variable labeled "Total Medicare Home Health Expenditures".
Table 5 summarizes results for the relationship between various independent variables, including insurance status, and expenditures on each of the service categories. What this table shows is that holding all other variables constant, annual Medicare home health aide expenditures on privately insured individuals are roughly $2,400 lower than they are for the non-privately insured.4 Regarding skilled services, there is no significant difference in expenditure levels by insurance status.
| TABLE 5. Characteristics Related to Expenditures on Selected Medicare Services | ||||
| Variable | HomeHealth Aide Expenditures (n=404) | Skilled Nursing CareExpenditures(n=628) | Inpatient Hospital Care Expenditures(n=656) | Total Medicare Home HealthExpenditures(n=690) |
| Age | -3.805(33.968) | -32.41(21.562) | -280.835***(80.608) | -40.072(38.113) |
| Education(1=high school and above) | -579.896(523.939) | -603.886*(346.927) | 338.23(1289.411) | -1146.748*(607.028) |
| Marital Status(1=married) | -1079.514**(514.807) | -246.271(334.037) | -735.045(1218.725) | -782.451(587.194) |
| Number of ADLs | 697.67***(145.801) | 271.795***(90.556) | -37.303(335.527) | -1353.871*(723.637) |
| Insurance(1=have insurance) | -2392.481***(682.94) | -208.129(428.241) | 1543.788(1596.413) | -365.118(578.499) |
| Cognitive status(1=cognitive impairment) | -268.023(486.508) | 355.48(315.526) | -3178.757***(1178.237) | 1258.368(776.994) |
| Diabetes(1=have diabetes) | 298.253(633.16) | 1208.166***(420.603) | 421.281(1533.748) | 1236.205(959.5) |
| Cancer(1=have cancer) | 649.384(769.277) | 1487.482***(514.967) | 1553.854(1829.322) | -21.987(674.68) |
| Stroke(1=suffered a stroke) | 430.916(560.886) | -461.749(366.633) | -1247.018(1426.904) | -136.409(642.278) |
| Heart attack(1=suffered a heart attack) | -1230.621(882.915) | 947.21*(535.926) | 3984.786**(1826.004) | -55.425(936.979) |
| Respiratory(1=has respiratory illness) | -485.563(551.175) | -340.643(366.575) | 1876.382(1319.983) | -732.87(642.577) |
| Constant | 3837.487(3003.469) | 4944.695***(1876.147) | 35227.59***(6943.493) | 7711.907**(3309.257) |
| Adjusted R2 | 8% | 5% | 4% | 8% |
| NOTE: standard errors are in parentheses. Total home health expenditures include expenditures on home health aides and skilled nursing care.** significant at the .01 level; ** significant at the .05 level; * significant at the .10 level. | ||||
SUMMARY
Individuals receiving benefits under their private LTC insurance policies are less likely to use home health aide services than are those without private insurance. Among users of Medicare home health aide services, the privately insured have far fewer visits and lower expenditures. This is not surprising given that the major category of service reimbursed by private insurance is home health aide care. The fact that roughly one-quarter receives Medicare financed services during the year of the interview suggests that Medicare may be paying for care when an individual has not yet completed their elimination period under their LTC insurance policies. There may also be cases where individuals are receiving care reimbursed by both private and public sources. While the claimants themselves did not report that Medicare was paying for care, it is possible that providers billed both Medicare and private insurance directly.
Insurance status does not affect whether or not someone accesses skilled nursing services, although the privately insured do use fewer visits. Medicare is designed to pay for the post-acute and skilled care needs of disabled elders. Thus, when given the choice, it is reasonable that disabled elders would prefer to have Medicare rather than their private insurance, pay for this type of care. Because most private LTC insurance policies have finite benefit pools, use of Medicare financed skilled services helps "stretch" the benefits of private insurance. By not spending private insurance dollars on skilled care, there are more dollars available to pay for home health aide, chore, companion, and other non-skilled services. It is noteworthy that for both home health aide and skilled nursing services the cost per visit is significantly higher among the non-privately insured.
In sum, as more individuals purchase private LTC insurance policies, the use of and expenditures on the Medicare home health aide benefit should decline. To the extent that over time the differential between Medicare reimbursement and private pay rates for skilled nursing diminishes, the proliferation of private insurance policies will also lead to expenditure reductions in Medicare skilled nursing services. Taken together, these findings support the proposition that patterns of service use in the private market can and do have an effect on the use of publicly financed long-term care expenditures.
NOTES
-
Cohen, M., Miller, J. and Weinrobe, M. (2000). "Multivariate Analysis of Patterns of Informal and Formal Caregiving among Privately Insured and Non-Privately Insured Disabled Elders Living in the Community." U.S. Department of Health and Human Services Office of Disability, Aging and Long-Term Care Policy, Washington, D.C. [http://aspe.hhs.gov/daltcp/reports/multanal.htm]
-
For more detailed information on the use of Medicare home health services see Jackson, B. and Doty, P. (1999). Medicare Home Health Services 1989-1994: Patterns of Benefit Use Among Chronically Disabled Elders. U.S. Department of Health and Human Services Office of Disability, Aging and Long-Term Care Policy, Washington, D.C. [http://aspe.hhs.gov/daltcp/reports/medhhs.htm]
-
Cohen, M., Miller, J. and Weinrobe, M. (2000). "Multivariate Analysis of Patterns of Informal and Formal Caregiving among Privately Insured and Non-Privately Insured Disabled Elders Living in the Community." U.S. Department of Health and Human Services Office of Disability, Aging and Long-Term Care Policy, Washington, D.C. [http://aspe.hhs.gov/daltcp/reports/multanal.htm]
-
When we take the natural logarithm of the dependent variable, the coefficient on the insurance status variable is -.879. This suggests that holding all other variables constant, for every $1 spent by Medicare on home health aide services for non-privately insured individuals, Medicare spends only $.12 on the privately insured.
APPENDICES
| APPENDIX 1. Use of Any Medicare Services or Any Home Health Services by Insurance Status | ||||
| Any Medicare Services | Any Home Health Services | |||
| Privately Insured Sample | Non-Privately Insured Sample | Privately Insured Sample | Non-Privately Insured Sample | |
| Gender | ||||
| Male | 60% | 52% | 46% | 36% |
| Female | 43% | 52% | 33% | 37% |
| Age | ||||
| 75 | 51% | 49% | 39% | 34% |
| 75-79 | 51% | 48% | 36% | 32% |
| 80-84 | 46% | 58% | 36% | 43% |
| 85+ | 47% | 54% | 36% | 38% |
| Marital Status | ||||
| Married | 51% | 52% | 41% | 38% |
| Not Married | 48% | 52% | 34% | 36% |
| Income | ||||
| 30,000 | 53% | 53% | 44% | 37% |
| >30,000 | 43% | 43% | 28% | 28% |
| Disability | ||||
| 0-1 ADLS | 30% | 33% | 13% | 21% |
| 2-3 ADLS | 42% | 55% | 29% | 38% |
| 4+ ADLS | 56% | 64% | 45% | 47% |
| Cognitive | ||||
| Impaired | 44% | 46% | 31% | 31% |
| Not Impaired | 53% | 60% | 42% | 44% |
| APPENDIX 2. Use of Medicare Home Health Aide and Skilled Nurse Services by Insurance Status | ||||
| Home Health Aide Services | Skilled Nurse Services | |||
| Privately Insured Sample | Non-Privately Insured Sample | Privately Insured Sample | Non-Privately Insured Sample | |
| Gender | ||||
| Male | 31% | 25% | 46% | 36% |
| Female | 14% | 26% | 32% | 36% |
| Age | ||||
| 75 | 22% | 23% | 39% | 34% |
| 75-79 | 18% | 23% | 35% | 32% |
| 80-84 | 20% | 31% | 36% | 42% |
| 85+ | 18% | 27% | 36% | 38% |
| Marital Status | ||||
| Married | 24% | 27% | 41% | 37% |
| Not Married | 16% | 25% | 33% | 36% |
| Income | ||||
| 30,000 | 24% | 27% | 43% | 37% |
| >30,000 | 14% | 17% | 28% | 28% |
| Disability | ||||
| 0-1 ADLS | 3% | 11% | 13% | 21% |
| 2-3 ADLS | 12% | 27% | 28% | 38% |
| 4+ ADLS | 26% | 36% | 44% | 47% |
| Cognitive | ||||
| Impaired | 16% | 21% | 31% | 31% |
| Not Impaired | 22% | 32% | 42% | 43% |
| APPENDIX 3. Mean Number of Home Health Aide and Skilled Nursing Visits by Insurance Status(for individuals who use the service) | ||||
| Mean Number ofHome Health Aide Visits | Mean Number ofSkilled Nurse Visits | |||
| Privately Insured Sample | Non-Privately Insured Sample | Privately Insured Sample | Non-Privately Insured Sample | |
| Gender | ||||
| Male | 51*** | 90** | 30 | 44 |
| Female | 68** | 102*** | 27 | 42 |
| Age | ||||
| 75 | 60 | 76 | 29** | 43 |
| 75-79 | 54*** | 115 | 26*** | 51 |
| 80-84 | 61* | 98 | 30 | 37 |
| 85+ | 48*** | 109 | 32 | 42 |
| Marital Status | ||||
| Married | 63* | 85 | 27*** | 41 |
| Not Married | 51*** | 110 | 31** | 44 |
| Income | ||||
| 30,000 | 67** | 99 | 30** | 43 |
| >30,000 | 38** | 90 | 24** | 42 |
| Disability | ||||
| 0-1 ADLS | 13 | 44 | 11 | 34 |
| 2-3 ADLS | 40*** | 104 | 18*** | 43 |
| 4+ ADLS | 63*** | 108 | 33** | 45 |
| Cognitive | ||||
| Impaired | 58** | 91 | 33 | 40 |
| Not Impaired | 46*** | 105 | 22*** | 45 |
| *** significant at the .01 level** significant at the .05 level* significant at the .10 level | ||||
| APPENDIX 4. Use of Skilled Nursing Facility and Inpatient Services by Insurance Status | ||||
| Skilled Nursing Facility Services | Inpatient Services | |||
| Privately Insured Sample | Non-Privately Insured Sample | Privately Insured Sample | Non-Privately Insured Sample | |
| Gender | ||||
| Male | 15% | 9% | 46% | 41% |
| Female | 10% | 8% | 31% | 39% |
| Age | ||||
| 75 | 11% | 8% | 38% | 40% |
| 75-79 | 9% | 6% | 36% | 36% |
| 80-84 | 13% | 9% | 35% | 42% |
| 85+ | 14% | 9% | 33% | 40% |
| Marital Status | ||||
| Married | 12% | 9% | 35% | 38% |
| Not Married | 11% | 7% | 37% | 40% |
| Income | ||||
| 30,000 | 13% | 8% | 40% | 40% |
| >30,000 | 9% | 10% | 33% | 32% |
| Disability | ||||
| 0-1 ADLS | 5% | 2% | 25% | 26% |
| 2-3 ADLS | 7% | 11% | 33% | 43% |
| 4+ ADLS | 15% | 11% | 39% | 47% |
| Cognitive | ||||
| Impaired | 13% | 6% | 33% | 34% |
| Not Impaired | 11% | 11% | 39% | 47% |
| APPENDIX 5. Mean Number of Skilled Nursing Facility and Inpatient Days by Insurance Status(for individuals who use the service) | ||||
| Mean Number ofSNF Medicare Covered Days | Mean Number ofInpatient Medicare Covered Days | |||
| Privately Insured Sample | Non-Privately Insured Sample | Privately Insured Sample | Non-Privately Insured Sample | |
| Gender | ||||
| Male | 29 | 25 | 17 | 17 |
| Female | 24* | 33 | 13 | 16 |
| Age | ||||
| 75 | 18 | 28 | 14* | 21 |
| 75-79 | 22 | 27 | 17 | 15 |
| 80-84 | 33 | 32 | 15 | 15 |
| 85+ | 29 | 32 | 11 | 14 |
| Marital Status | ||||
| Married | 30 | 26 | 17 | 16 |
| Not Married | 22** | 34 | 13** | 17 |
| Income | ||||
| 30,000 | 18** | 31 | 16 | 17 |
| >30,000 | 41 | 25 | 13 | 12 |
| Disability | ||||
| 0-1 ADLS | 32 | 38 | 9 | 13 |
| 2-3 ADLS | 26 | 22 | 12** | 18 |
| 4+ ADLS | 26* | 35 | 17 | 17 |
| Cognitive | ||||
| Impaired | 24 | 30 | 13 | 14 |
| Not Impaired | 30 | 31 | 15* | 18 |
| *** significant at the .01 level** significant at the .05 level* significant at the .10 level | ||||
| APPENDIX 6. Mean Expenditures on Home Health Aides and Skilled Nursing Services by Insurance Status(for individuals who use the service) | ||||
| Mean Home Health Aide Payments | Mean Skilled Nurse Payments | |||
| Privately Insured Sample | Non-Privately Insured Sample | Privately Insured Sample | Non-Privately Insured Sample | |
| Gender | ||||
| Male | $3322* | $4619 | $3305 | $3464 |
| Female | $4799 | $5307 | $3016 | $3338 |
| Age | ||||
| 75 | $3974 | $4042 | $3276 | $3629 |
| 75-79 | $3503** | $6119 | $2654* | $4030 |
| 80-84 | $3890 | $4840 | $3336 | $2880 |
| 85+ | $4103 | $5613 | $3618 | $3159 |
| Marital Status | ||||
| Married | $4270 | $4424 | $3045 | $3336 |
| Not Married | $3517** | $5640 | $3346 | $3413 |
| Income | ||||
| 30,000 | $4732 | $5065 | $3285 | $3360 |
| >30,000 | $2471* | $5517 | $2646 | $3379 |
| Disability | ||||
| 0-1 ADLS | $428 | $2161 | $1115 | $2550 |
| 2-3 ADLS | $2330*** | $5405 | $1945*** | $3307 |
| 4+ ADLS | $4432 | $5612 | $3684 | $3700 |
| Cognitive | ||||
| Impaired | $3624 | $4650 | $3628*** | $3130 |
| Not Impaired | $2928*** | $5463 | $2461 | $3604 |
| *** significant at the .01 level** significant at the .05 level* significant at the .10 level | ||||
| APPENDIX 7. Mean Expenditures on Skilled Nursing Facility and Inpatient Services by Insurance Status(for individuals who use the service) | ||||
| Mean Skilled NursingFacility Payments | Mean Inpatient Payments | |||
| Privately Insured Sample | Non-Privately Insured Sample | Privately Insured Sample | Non-Privately Insured Sample | |
| Gender | ||||
| Male | $8228 | $5733 | $17090* | $13571 |
| Female | $7935 | $8389 | $13266 | $12804 |
| Age | ||||
| 75 | $6138 | $8087 | $17001 | $18071 |
| 75-79 | $6829 | $6676 | $16649** | $10946 |
| 80-84 | $9914 | $8622 | $13341 | $11223 |
| 85+ | $7849 | $7059 | $11585 | $10404 |
| Marital Status | ||||
| Married | $8581 | $6476 | $18344*** | $14930 |
| Not Married | $7526 | $8431 | $11870 | $13474 |
| Income | ||||
| 30,000 | $6281 | $7482 | $13208 | $13246 |
| >30,000 | $10971 | $7318 | $15302 | $9889 |
| Disability | ||||
| 0-1 ADLS | $8476 | $9895 | $10434 | $10119 |
| 2-3 ADLS | $9295 | $6669 | $12542 | $13958 |
| 4+ ADLS | $7695 | $7626 | $16273 | $13737 |
| Cognitive | ||||
| Impaired | $8108 | $7430 | $10015 | $11483 |
| Not Impaired | $7990 | $7497 | $15701 | $14543 |
| *** significant at the .01 level** significant at the .05 level* significant at the .10 level | ||||
| APPENDIX 8. Characteristics Associated with the Use of Home Health Aide Services | |||
| Variable | Use of Any Home Health Aide Services (N=1754) | Number of Visits for Those Who Have atLeast One Visit(N=404) | |
| Coefficient | Exp (B) | Coefficient | |
| Age | .016**(.008) | 1.016 | .388(.609) |
| Education(1=high school and above) | -.26**(.132) | .77 | -16.988*(9.401) |
| Marital Status(1=married) | .169(.126) | 1.184 | -18.801**(9.237) |
| Number of ADLS | .247***(.034) | 1.281 | 12.223***(2.616) |
| Insurance(1=have insurance) | -.437***(.164) | .645 | -52.222***(12.254) |
| Cognitive status(1=cognitive impairment) | -.234*(.122) | .791 | -9.396(8.729) |
| Diabetes(1=have diabetes) | .205(.161) | 1.227 | 10.044(11.361) |
| Cancer(1=have cancer) | .287(.203) | 1.333 | 3.353(13.803) |
| Stroke(1=suffered a stroke) | .572***(.148) | 1.771 | 11.048(10.064) |
| Heart attack(1=suffered a heart attack) | .097(.233) | 1.103 | -14.109(15.842) |
| Respiratory(1=has respiratory illness) | .266*(.143) | 1.304 | -11.526(9.899) |
| Constant | -3.264***(.708) | 42.971(53.892) | |
| Adjusted/Pseudo R2 | 7% | 11% | |
| NOTE: standard errors are in parentheses.*** significant at the .01 level** significant at the .05 level* significant at the .10 level | |||
| APPENDIX 9. Characteristics Associated with the Use of Skilled Nursing Services | |||
| Variable | Use of Any Skilled Nurse Home Health Services(N=1754) | Number of Visits forThose Who Have atLeast One Visit(N=628) | |
| Coefficient | Exp (B) | Coefficient | |
| Age | .021***(.007) | 1.021 | -.323(.250) |
| Education(1=high school and above) | -.171(.12) | .842 | -9.571**(4.031) |
| Marital Status(1=married) | .0(.112) | 1 | -3.151(3.881) |
| Number of ADLS | .195***(.03) | 1.215 | 2.549**(1.052) |
| Insurance(1=have insurance) | .005(.14) | 1.005 | -11.823**(4.976) |
| Cognitive status(1=cognitive impairment) | -.302***(.109) | .738 | 1.75(3.666) |
| Diabetes(1=have diabetes) | .338**(.148) | 1.402 | 12.762***(4.887) |
| Cancer(1=have cancer) | .361*(.188) | 1.435 | 13.938**(5.984) |
| Stroke(1=suffered a stroke) | .678***(.137) | 1.971 | -5.738(4.26) |
| Heart attack(1=suffered a heart attack) | .536**(.213) | 1.709 | 12.235**(6.227) |
| Respiratory(1=has respiratory illness) | .384***(.131) | 1.468 | -5.5(4.259) |
| Constant | -3.013***(.635) | 61.64***(21.802) | |
| Adjusted/Pseudo R2 | 6% | 7% | |
| NOTE: standard errors are in parentheses.*** significant at the .01 level** significant at the .05 level* significant at the .10 level | |||
| APPENDIX 10. Characteristics Associated with the Use of Skilled Nursing Facility Services | ||
| Variable | Use of Any Skilled Nursing Facilities (N=1754) | |
| Coefficient | Exp (B) | |
| Age | .02*(.012) | 1.02 |
| Education(1=high school and above) | .267(.199) | 1.307 |
| Marital Status(1=married) | .189(.187) | 1.208 |
| Number of ADLS | .225***(.051) | 1.253 |
| Insurance(1=have insurance) | .089(.223) | 1.094 |
| Cognitive status(1=cognitive impairment) | -.08(.177) | .922 |
| Diabetes(1=have diabetes) | -.051(.263) | .949 |
| Cancer(1=have cancer) | .09*(.312) | 1.094 |
| Stroke(1=suffered a stroke) | .381*(.206) | 1.465 |
| Heart attack(1=suffered a heart attack) | .486(.3) | 1.626 |
| Respiratory(1=has respiratory illness) | .32(.216) | 1.377 |
| Constant | -5.163***(1.07) | ----- |
| Pseudo R2 | 4% | |
| NOTE: standard errors are in parentheses.*** significant at the .01 level** significant at the .05 level* significant at the .10 level | ||
| APPENDIX 11. Characteristics Associated with the Use of Inpatient Hospitalization Services | |||
| Variable | Use ofAny InpatientHospitalization Services(N=1754) | Number of Visits forThose Who Have atLeast One Visit(N=658) | |
| Coefficient | Exp (B) | Coefficient | |
| Age | .002(.007) | 1.002 | -237***(.095) |
| Education(1=high school and above) | -.071(.199) | .93 | -.99(1.525) |
| Marital Status(1=married) | -.204*(.112) | .815 | -2.029*(1.444) |
| Number of ADLS | .129***(.029) | 1.137 | .209(.399) |
| Insurance(1=have insurance) | -.009(.14) | .99 | -.76(1.883) |
| Cognitive status(1=cognitive impairment) | -.205*(.109) | .814 | -2.158(1.398) |
| Diabetes(1=have diabetes) | .361***(.147) | 1.437 | 1.118(1.825) |
| Cancer(1=have cancer) | .655***(.188) | 1.926 | 1.51(2.176) |
| Stroke(1=suffered a stroke) | .488***(.138) | 1.63 | 2.283(1.691) |
| Heart attack(1=suffered a heart attack) | 1.284***(.229) | 3.612 | 1.628(2.158) |
| Respiratory(1=has respiratory illness) | .752***(.13) | 2.122 | 3.595** |
| Constant | -1.319**(.623) | 33.786***(8.254) | |
| Adjusted R2 | 7% | 2% | |
| NOTE: standard errors are in parentheses.*** significant at the .01 level** significant at the .05 level* significant at the .10 level | |||
To obtain a printed copy of this report, send the full report title and your mailing information to:
U.S. Department of Health and Human ServicesOffice of Disability, Aging and Long-Term Care PolicyRoom 424E, H.H. Humphrey Building200 Independence Avenue, S.W.Washington, D.C. 20201FAX: 202-401-7733Email: webmaster.DALTCP@hhs.gov
RETURN TO:
Office of Disability, Aging and Long-Term Care Policy (DALTCP) Home [http://aspe.hhs.gov/_/office_specific/daltcp.cfm]Assistant Secretary for Planning and Evaluation (ASPE) Home [http://aspe.hhs.gov]U.S. Department of Health and Human Services Home [http://www.hhs.gov]