
Publication Date
Brenda Spillman and Timothy Waidmann
"Policy context of study
- Dually eligible Medicare enrollees are disproportionately costly for Medicaid
- Minority of Medicaid enrollees
- High costs primarily owing to need for long term services and supports
- Policy concerns are two-fold
- Some believe asset transfer to gain eligibility is widespread in the middle class
- Others believe more accessible prefunding options could reduce need for “spend-down” to eligibility
- Both suggest a need for updated analyses of the rate and process of transitions to Medicaid
Study aims
To provide new estimates of the rate and timing of Medicaid transitions in a representative cohort
- Descriptive estimates of Medicaid at baseline and transitions over 4 years
- Estimated relationship between baseline characteristics and probability of transition to Medicaid within a 4-year period
- Estimated relationship between time-variant factors (health spending and utilization, nursing home entry) and timing of transitions
Data
- Nationally representative cohort of Medicare enrollees age 65+ from the National Long Term Care Survey 2004
- Detailed interview respondents (n=~6,000) for overall estimates of Medicaid status
- Community residing population age 65+ and not enrolled in Medicaid at baseline for transition estimates (n=~4,300)
- Linked administrative data
- Beneficiary and claims data for Medicare (2004-2009) and Medicaid (2004-2007)
- Minimum data set (MDS) assessments for nursing home admissions after baseline
- State Medicaid program characteristics compiled from various published sources
Medicaid enrollment
- Transition measure is full benefit enrollment, not estimated eligibility
- Relies on data from 3 sources
- Monthly Medicaid eligibility indicators for 2004-07 from MAX PS file
- Monthly duals eligibility indicator for 2006-08 from Medicare beneficiary files (derived from MSIS)
- Monthly Medicare “buy-in” indicators from beneficiary file 2004-09
- Decision rules for transition
- Based primarily on MAX indicators
- MAX data suggest few “false positives” from buy-in and duals indicators, but about 20% “false negatives”
- Assumed continuous enrollment after transition based on MAX analyses
Overview of Medicaid enrollment
| Percent enrolled at baseline | Percent enrolling within 4 years | |
|---|---|---|
| All Medicare aged | 14 | 5 |
| Disability | ||
| None | 10 | 3 |
| Receiving no help | 13 | 7 |
| Help with IADLs only | 21 | 10 |
| Help with 1-2 ADLs | 27 | 11 |
| Help with 3+ ADLs | 33 | 11 |
| Institutional resident | 63 | 7 |
| Cognitive status | ||
| Not impaired | 12 | 4 |
| Impaired | 38 | 12 |
Community residents enrolling over 4 years:Place and timing of transition
| Place of transition | Percent of transitions | Time to transition (months) |
|---|---|---|
| All | 100 | 21 |
| Community | 56 | 20 |
| Nursing home | ||
| At admission | 10 | 19 |
| After admission | 34 | 23 |
Key predictors of Medicaid transition over 4 years
| Marginal effect | |
|---|---|
| Omitted categories: nonHispanic White/other; lives with spouse; traditional community residence; income $30,000 or more, housing value $150,000 or more, some college education, no disability, self-reported health excellent or good, and none of selected health conditions or events. **(*) Significantly different from zero at the 5%(10%) confidence level. |
|
| Nursing home entry during analysis period | 0.081 ** |
| Income < $10,000 | 0.064 ** |
| Income $10,000 -<$20,000 | 0.055 ** |
| Home value less than $75,000 | 0.024 ** |
| Not a homeowner | 0.021 ** |
| Cognitively impaired | 0.027 ** |
| Help with 3+ ADLs | 0.020 * |
| % of Medicaid LTSS spending in community >median | 0.013 ** |
| Medically needy program | 0.012 ** |
| Spousal protection income max AND resource >= 75th%ile | 0.011 * |
| Community residential care | 0.033 * |
| Retirement community/housing | 0.028 ** |
| Lives alone | -0.009 * |
| Black, nonhispanic | 0.062 ** |
| Less than high school education | 0.012 * |
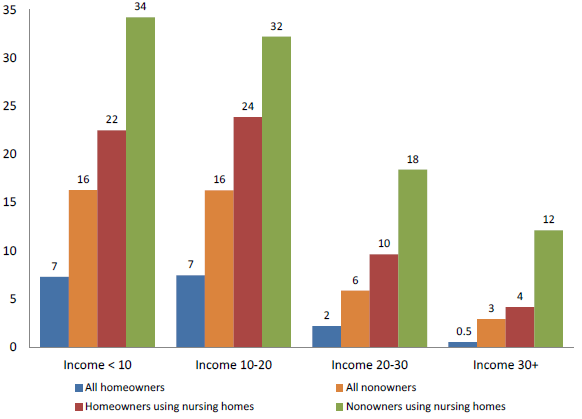
Predicted Medicaid transition rate over 4 years by home ownership, income & nursing home use
Summary of major findings
- 5% of community residents transition to Medicaid over 4 years
- 56% percent of transitions occur in the community
- 10% occur at nursing home admission, and 34% occur an average 9 months after admission
- Nursing home use is by far the greatest predictor of transition followed by low income & assets
- Nearly 30% of the poor and near poor who used nursing homes transitioned vs about 6% of nonusers
- Homeowners were less likely to transition, but even higher income homeowners were 8 times more likely to transition if they used nursing homes (4% vs 0.5% for nonusers).
- Baseline cognitive impairment associated with 3 percentage point increase in cumulative risk of transition
- More generous state eligibility standards and HCBS commitment associated with higher risk of transition
Study limitations
- We cannot observe changes over time in baseline characteristics
- Functional status
- Living arrangement, home ownership, informal supports may occur in response to functional changes
- Financial information is limited to baseline income and home ownership and value at baseline
- Home ownership, value correlated with other wealth accumulations, and may capture baseline economic status relative to others
- Cannot capture “spenddown” and other changes in wealth, income
- We do not account for potential endogeneity of the nursing home entry decision
Implications for policy
- Current efforts and trends toward changing the locus of LTSS from nursing homes to community settings may be able to reduce the rate of transitions
- Increased provision of Medicaid HCBS modestly increases the rate of transitions but may have long-term beneficial effects on costs
- Policies to improve access to affordable prefunding earlier in life might be able to bridge gaps between financial means and care needs for those with modest retirement income and resources
- Increased supports for informal caregivers may be able to reduce nursing home admissions and Medicaid transitions