
By: Kenneth Finegold, Kelsey Avery, Bula Ghose, and Caryn Marks
A central aim of the Affordable Care Act is to increase the number of Americans with health insurance coverage. Over the past two years, significant progress has been made towards this goal as measured by the decline in the proportion of Americans who lack health insurance coverage, often called the “uninsured rate.” Using data from the Gallup-Healthways Well-Being Index (Gallup-Healthways WBI), ASPE recently estimated that 17.6 million uninsured people have gained health insurance coverage as several of the Affordable Care Act’s coverage provisions took effect.[1]
In this brief, we use recently released data from the National Health Interview Survey (NHIS) to examine the composition of people that remained uninsured though the first quarter of 2015 and may be eligible to purchase insurance coverage from a Qualified Health Plan (QHP) through the Marketplaces (“QHP-eligible uninsured”). It also presents data on the attitudes and experiences of the uninsured, drawn from a number of private surveys.
In a separate ASPE report, “How Many Individuals Might Have Marketplace Coverage at the End of 2016?,”[2] we estimate that there are 10.5 million QHP-eligible uninsured Americans. This estimate uses both the 2013 American Community Survey (ACS) and results from the Gallup-Healthways WBI through the second quarter of 2015. This number represents our best estimate of the number of QHP-eligible uninsured going into the third Open Enrollment Period. The estimates of the number of QHP-eligible uninsured (using the ACS and Gallup-Healthways WBI) and the composition of that population (using the NHIS) come from distinct data sources selected to best match the objectives of each analysis. As a result, these estimates are not fully consistent with each other.
Key Findings:
Likely QHP-eligible Uninsured Individuals:
- Income: Nearly half (48 percent) of QHP-eligible uninsured individuals have family incomes between 100% and 250% of the Federal Poverty Level (FPL) and may qualify for the advance payments of the premium tax credit (APTC) and cost-sharing reductions (CSR). About 30 percent have incomes between 250% and 400% FPL and may qualify for APTC. The remaining 22 percent have family incomes above 400% FPL.
- Gender: An estimated 57 percent of the QHP-eligible uninsured are men.
- Age: Almost half of QHP-eligible uninsured individuals are between the ages of 18 and 34.
- Race: Approximately one-third of the QHP-eligible uninsured are people of color: 19 percent are Hispanic, 14 percent are African American, and 2 percent are Asian American.
- Gender and Race: Nearly 35 percent of the QHP-eligible uninsured are White males, 10.6 percent are Hispanic males, and 26.6 percent are White females.
All Uninsured Individuals:
- Financial Circumstances: Nearly 8 in 10 of all people without insurance have less than $1,000 in savings and about half have less than $100 in savings.
- Views about Insurance: Nearly 75 percent of all uninsured people think that having health insurance is important.
- Perceptions of Affordability: People without health insurance are primarily concerned with the affordability of coverage.
- Understanding of the Health Insurance Marketplace: Nearly three in five of all people without health insurance do not understand or are unaware of the premium tax credits.
Overview
Recent analysis of Gallup-Healthways WBI data suggests that 17.6 million previously uninsured people have gained coverage as several of the Affordable Care Act’s coverage provisions have taken effect.[3] The increases in coverage reflect individuals newly covered through the Marketplaces, Medicaid, the Children’s Health Insurance Program (CHIP), the expansion of dependent coverage, and other sources such as employer sponsored insurance. The next Health Insurance Marketplace Open Enrollment Period, from November 1, 2015 to January 31, 2016, will offer an opportunity to continue to provide coverage for more individuals and to reduce the number of uninsured even further.[4]
This brief uses the most recent data from the National Health Interview Survey (NHIS) to examine the composition of people that remained uninsured though the first quarter of 2015, and who may be eligible to purchase insurance coverage from a Qualified Health Plan (QHP) through the Marketplaces (“QHP-eligible uninsured”). The NHIS is a federal survey designed to provide reliable estimates over time and is considered to be the gold standard for measuring the number and characteristics of the uninsured.
We use the term “QHP-eligible uninsured” to refer to those who are most likely to have or shop for coverage in the Marketplaces. For the purposes of this analysis, we consider QHP-eligible uninsured to be any nonelderly, lawfully present individual who is uninsured and has a family income: (a) above 138% of the Federal Poverty Level (FPL) for adults in Medicaid expansion states or at least 100% FPL for adults in states that have not yet expanded, or (b) above 250% FPL for children in any state. Not all uninsured individuals who are “QHP-eligible” are necessarily eligible for coverage or financial assistance through the Marketplaces.[5] For more information about eligibility to purchase coverage in the Marketplaces, see https://www.healthcare.gov/quick-guide/eligibility/.
In Section I of this brief, we analyze selected characteristics of the uninsured who may be eligible for Marketplace coverage. Our analysis is based on NHIS data for January to March 2015.
In Section II, we present data on the attitudes and experiences of the uninsured drawn from a number of private surveys of low and middle-income populations. These analyses typically do not make adjustments to remove immigrants who are not lawfully present (who are not eligible for Medicaid or Marketplace coverage) or distinguish between individuals who would be eligible for different sources of coverage (Marketplace, Medicaid/CHIP, or in the Medicaid coverage gap in states that have not expanded). However, we believe the findings gleaned from these survey data provide insights that may apply to the likely QHP-eligible population.
Section I: Characteristics of the QHP-Eligible Uninsured
Using NHIS data from the first quarter of 2015, Figure 1 below provides a demographic profile of the remaining uninsured:
- Nearly half of the uninsured (49 percent) are likely QHP-eligible.[6] This group is the primary focus of this brief.
- Approximately 30 percent are potentially eligible for the Medicaid program:
- About 12 percent are adults who live in Medicaid expansion states and have family incomes below 138% FPL.
- About 11 percent are adults who live in states that have not yet expanded Medicaid, have family incomes below 100% FPL, and who would potentially be eligible for Medicaid if their state expanded eligibility (also called the Medicaid coverage gap).[7]
- About 7 percent are children who are potentially eligible for Medicaid or CHIP (family incomes below 250% FPL).
- About 21 percent are not eligible for these programs because they are not lawfully present in the U.S.
Figure 1. Nonelderly Uninsured, by Eligibility for Insurance Affordability Programs
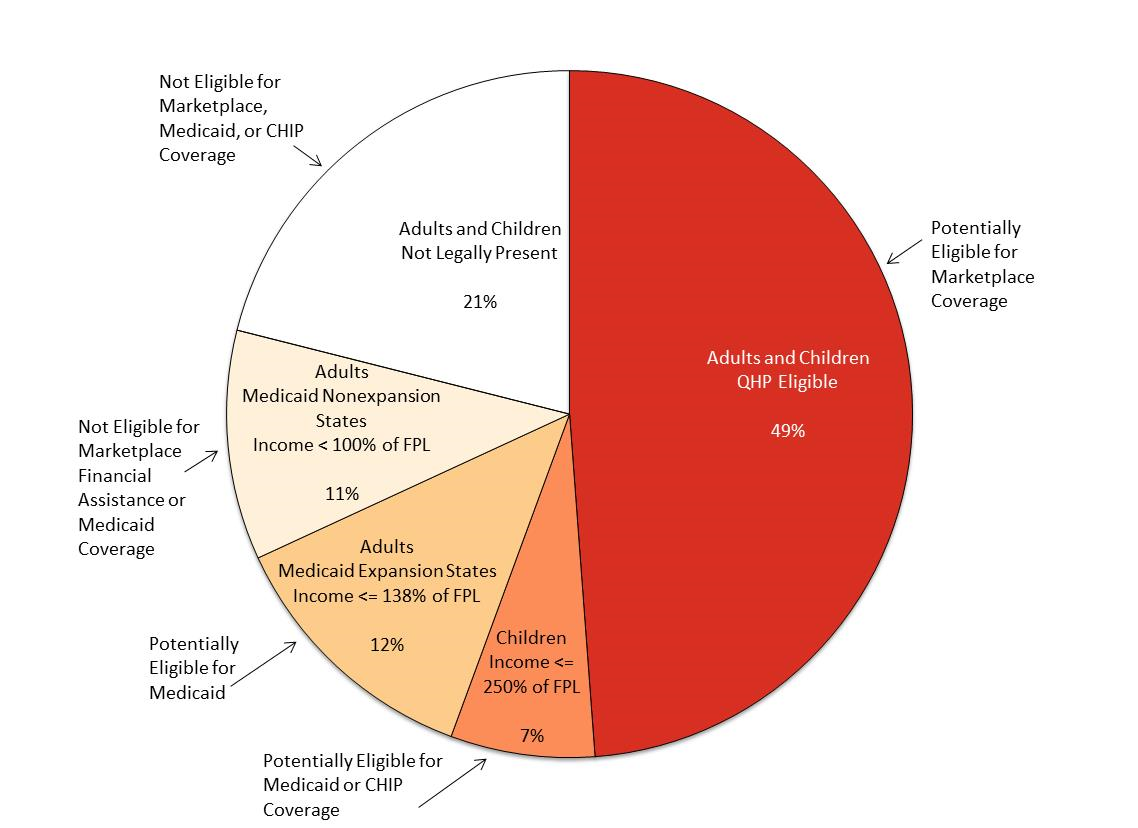
Source: ASPE analysis of National Health Interview Survey (NHIS) Preliminary Quarterly Microdata Files for January-March 2015, adjusted using imputations of immigration status from ASPE’s TRIM3 microsimulation model.
Figures 2, 3, 4, and 5 below illustrate the distribution of the QHP-eligible uninsured by various demographic characteristics.
Of the QHP-eligible uninsured:
- Income: Nearly half have incomes between 100% and 250% FPL, making them likely to be eligible for both APTC and CSR in the Marketplaces (Figure 2).
- Employment: More than 70 percent are employed.
- Education: Approximately half have education beyond high school. Only 13 percent do not have either a high school diploma or a GED.
Figure 2. Distribution of QHP-Eligible Uninsured by Income
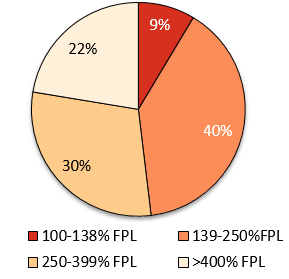
NOTE: Totals add up to more than 100% due to rounding
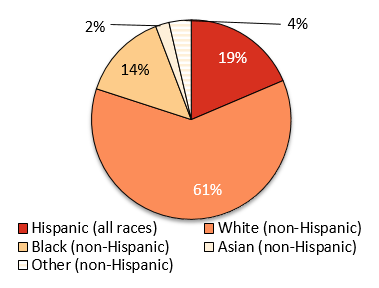
- Race: 61 percent are White, 19 percent are Hispanic, and 14 percent are African American (Figure 3).
- Health status: Nearly two-thirds are in excellent or very good health, compared with 8 percent whose reported health is fair or poor.
Figure 3. Distribution of QHP-Eligible Uninsured by Race
Figures 4 and 5 also illustrate key differences between the QHP-eligible uninsured and the general nonelderly population:
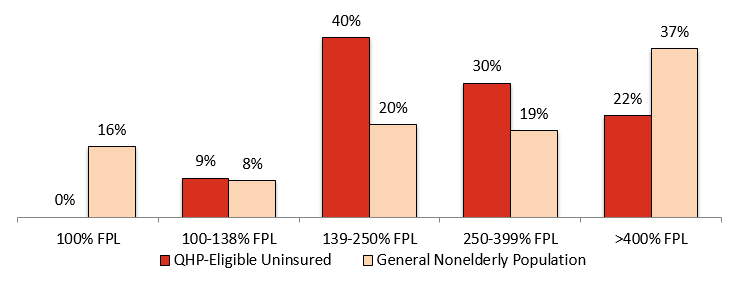
- Income: QHP-eligible uninsured individuals are less likely to have family incomes above 400% FPL than the nonelderly (Figure 4).
- Employment: QHP-eligible uninsured adults are more than twice as likely as all nonelderly adults to be unemployed, as opposed to employed or not in the labor force.
- Marital Status: QHP-eligible uninsured adults are less likely to be single compared to the general nonelderly adult population.
Figure 4. Distribution by Income: QHP-Eligible Uninsured vs. General Nonelderly Population
- Education: QHP-eligible uninsured adults are about as likely as all nonelderly adults to have less than a high school education, but more likely to have only a high school education or GED, and less likely to have gone beyond high school (Figure 5).
- Race: The QHP-eligible uninsured population is more likely to be African American, and less likely to be Asian American, than the general nonelderly population. The proportions of individuals who are White or Hispanic are about the same among the QHP-eligible as in the general population.
- Metropolitan status: QHP-eligible uninsured individuals are more likely than all nonelderly adults to be residents of nonmetropolitan or rural areas.
Figure 5. Distribution by Education: QHP-Eligible Uninsured vs. General Nonelderly Population
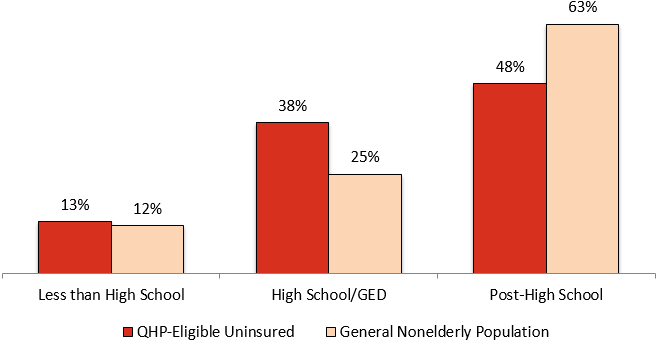
Table 1 presents selected characteristics of the estimated nonelderly uninsured population who may be eligible for Marketplace coverage and the general population of nonelderly individuals. Selected characteristics examined include: income, age, gender, education, health status, race, metropolitan status, employment status, marital status, and usual source of care.
| Table 1. QHP-Eligible Nonelderly Uninsured and All Nonelderly, January-March 2015, by Selected Characteristics | ||
| Variable | QHP-Eligible Uninsured (Percentage) | General Nonelderly Population (Percentage) |
| Family Income | ||
| 100% FPL | N/A | 15.5 |
| 100-138% FPL | 8.6 | 8.0 |
| 139-250% FPL | 39.5 | 20.3 |
| 250-399% FPL | 29.5 | 19.0 |
| >400% FPL | 22.4 | 37.1 |
| Total | 100.0 | 100.0 |
|
| ||
| Age | ||
| 0-17 | 7.5 | 27.3 |
| 18-25 | 20.5 | 13.0 |
| 26-34 | 25.9 | 14.0 |
| 35-54 | 34.6 | 30.7 |
| 55-64 | 11.5 | 14.9 |
| Total | 100.0 | 100.0 |
|
| ||
| Gender | ||
| Male | 56.9 | 49.6 |
| Female | 43.1 | 50.4 |
| Total | 100.0 | 100.0 |
|
| ||
| Race / Ethnicity | ||
| Hispanic (all races) | 18.6 | 19.2 |
| White (non-Hispanic) | 61.4 | 59.5 |
| Black (non-Hispanic) | 14.2 | 12.7 |
| Asian (non-Hispanic) | 2.2 | 5.7 |
| Other (non-Hispanic) | 3.6 | 2.9 |
| Total | 100.0 | 100.0 |
|
| ||
| Education Level (ages 18-64 only) | ||
| Less than High School | 13.4 | 12.3 |
| High School/GED | 38.3 | 24.8 |
| Post-High School | 48.3 | 62.9 |
| Total | 100.0 | 100.0 |
| Table 1. QHP-Eligible Nonelderly Uninsured and All Nonelderly, January-March 2015, by Selected Characteristics (cont.) | ||
| Variable | QHP-Eligible Uninsured (Percentage) | General Nonelderly Population (Percentage) |
| Health Status* | ||
| Excellent | 34.1 | 40.3 |
| Very Good | 30.2 | 30.1 |
| Good | 27.6 | 21.7 |
| Fair/Poor | 8.0 | 7.9 |
| Total | 100.0 | 100.0 |
|
| ||
| Metropolitan Status | ||
| Metropolitan | 80.8 | 86.5 |
| Nonmetropolitan | 19.2 | 13.5 |
| Total | 100.0 | 100.0 |
|
| ||
| Employment Status (ages 18-64 only) | ||
| Employed | 72.2 | 72.0 |
| Unemployed | 10.5 | 5.0 |
| Not in Labor Force | 17.3 | 23.0 |
| Total | 100.0 | 100.0 |
|
| ||
| Marital Status (ages 18-64 only) | ||
| Married | 36.7 | 54.2 |
| Not Married | 63.3 | 45.8 |
| Total | 100.0 | 100.0 |
|
| ||
| Has Usual Source of Care* | ||
| Yes | 51.4 | 86.4 |
| No | 48.6 | 13.6 |
| Total | 100.0 | 100.0 |
| * Not adjusted for immigration status |
|
|
Source: ASPE analysis of National Health Interview Survey (NHIS) Preliminary Quarterly Microdata Files for January-March 2015, adjusted using imputations of immigration status from ASPE’s TRIM3 microsimulation model.
| Table 2 presents additional analysis of the relationship between race/ethnicity and gender among the QHP-eligible uninsured. Overall, men account for 57 percent of the QHP-eligible population. The proportion of men among QHP-eligible Hispanics and Whites is similar to the proportion of men in the overall QHP-eligible population, but is higher (60 percent) among African Americans and lower (44 percent) among Asian Americans. More than one-third of the QHP-eligible uninsured are non-Hispanic White males.
Table 2. QHP-Eligible Nonelderly Uninsured, January-March 2015, by Race/Ethnicity and Gender | ||
| Category | Percentage of Race/Ethnicity Group | Percentage of Total
|
| Male | ||
| Hispanic (all races) | 56.9 | 10.6 |
| White (non-Hispanic) | 56.8 | 34.9 |
| Black (non-Hispanic) | 59.6 | 8.5 |
| Asian (non-Hispanic) | 44.2 | 1.0 |
| Other (non-Hispanic) | 57.3 | 2.1 |
| Total | 56.9 | 56.9 |
|
| ||
| Female | ||
| Hispanic (all races) | 43.1 | 8.0 |
| White (non-Hispanic) | 43.2 | 26.6 |
| Black (non-Hispanic) | 40.4 | 5.7 |
| Asian (non-Hispanic) | 55.8 | 1.2 |
| Other (non-Hispanic) | 42.7 | 1.5 |
| Total | 43.1 | 43.1 |
Source: ASPE analysis of National Health Interview Survey (NHIS) Preliminary Quarterly Microdata Files for January-March 2015, adjusted using imputations of immigration status from ASPE’s TRIM3 microsimulation model.
Section II: Attitudes and Experiences of the uninsured
Surveys of uninsured people fielded by the Robert Wood Johnson Foundation, the Kaiser Family Foundation, the Commonwealth Fund, McKinsey & Company, and the Urban Institute all provide valuable information about the attitudes and experiences of the remaining uninsured. New content areas that are not measured by federal surveys but are included in private surveys include topics such as: perceptions of affordability; experiences with and attitudes towards health insurance; and awareness of new coverage options and financial assistance available under the Affordable Care Act.
These surveys were fielded during or after the 2015 Open Enrollment Period and together provide rich information on specific populations that are the focus for the 2016 Open Enrollment Period. Each survey cited (see Table 3) examined different populations over different periods of time with different survey instruments. The definition of being uninsured varies across surveys and many report findings collectively for those eligible for Medicaid and the Marketplaces. [8] Many uninsured people are eligible for Medicaid or CHIP, or are immigrants who are not lawfully present (and therefore not eligible for Marketplace, Medicaid, or CHIP coverage), and their attitudes and experiences may be somewhat different from those whose incomes and immigration status make them eligible for Marketplace or Medicaid/CHIP coverage.
| Table 3. Private Surveys of the Uninsured
|
| ||
| Source | Time Period | Sample | Sample Size[9] |
| Robert Wood Johnson Foundation National Survey of Uninsured Adults | May 2015 | Uninsured non-elderly adults | 1,270 |
| Kaiser Family Foundation Survey of Low-Income Americans and the ACA | Fall 2014 (September – December) | 19-64 year olds with various types of coverage | 10,502 |
| Commonwealth Fund ACA Tracking Survey | March – May 2015 | 19-64 year olds with various types of coverage | 4,881 |
| McKinsey & Company Consumer Health Insights Survey | February 2015 | QHP-eligible uninsured and non-elderly adults with coverage in the individual market | 3,007 |
| Urban Institute Health Reform Monitoring Survey | March 2015 | Uninsured non-elderly adults | 7,500 |
Financial Challenges and the Priorities of Uninsured Individuals
People who are uninsured often experience financial barriers to coverage and may place other priorities over obtaining health insurance.
- Only 26 percent of those who are uninsured say that they are doing well financially. Nearly 80 percent have less than $1,000 in savings and about half have less than $100 in savings.[10]
- More than half of people who are uninsured feel financially insecure[11] and half had difficulty affording basic necessities such as food or housing in the past year.[12]
- When asked what they would do if they were to become better off financially, many uninsured people say they would pay down their debt, put money into savings, or make home or car repairs before buying health insurance.[13]
Impacts of Being Uninsured on Use of Health Care
Lack of health insurance coverage affects individuals’ access to and use of health care services.
- Most people without health insurance are not confident they can get or afford routine or major medical care without insurance.[14],[15]
- Some uninsured individuals obtain services by paying out of pocket and/or using free or low-cost clinics.[16],[17] However, one survey indicated that only 28 percent of those who are uninsured and have ongoing medical care needs feel that they are getting all or most of the care that they need.[18]
- People who are uninsured are much less likely than their insured counterparts to receive a check-up or preventive care visit (33 percent versus 74 percent of adults with employer-sponsored insurance) and more likely to be unable to afford prescription drugs (21 percent versus 4 percent of adults with employer-sponsored insurance).[19]
- Furthermore, 33 percent of the uninsured have postponed care and never received it, and 34 percent of those who postponed care did so because they could not afford the cost.[20]
- Uninsured individuals experience more problems paying medical and other bills than their insured counterparts, including having medical bills use up all or most of their savings, having problems paying for basic necessities, or having their bill sent to a collection agency.[21]
Concerns about Affordability and Knowledge of Subsidies
According to the Robert Wood Johnson Foundation, nearly 75 percent of uninsured people think that having health insurance is important. Fewer than 20 percent of those who are uninsured say they are uninsured because they do not want insurance.[22]
- Nearly 60 percent of those without insurance do not understand or have not heard of APTC.[23]
People without health insurance are primarily concerned with the affordability of coverage.
- A sizeable proportion of those without insurance have not shopped for or obtained coverage because they did not believe coverage was affordable; however, many of the uninsured also are not aware of their eligibility for free or low-cost coverage.[24],[25],[26],[27],[28]
- In addition, among uninsured adults surveyed by the Kaiser Family Foundation who sought coverage and said it was too expensive, 42 percent appeared likely eligible for APTC and 14 percent were potentially eligible for Medicaid.[29]
People without health insurance may also experience gaps in eligibility or confusion about their eligibility.
- About 40 percent of the uninsured who sought coverage in 2014 but did not enroll said that they were told that they were ineligible for coverage, yet nearly half appeared likely eligible for APTC (30 percent) or Medicaid (19 percent) at the time that they were surveyed.[30]
- Furthermore, 60 percent of the uninsured have not heard about, or are not sure if they have heard about, Special Enrollment Periods (SEPs).[31]
Awareness of Penalties for Not Buying Insurance
Uninsured individuals may be more inclined to enroll in coverage for the 2016 coverage year as a result of the individual shared responsibility payment (tax penalty), which is the larger of 2.5 percent of yearly income or $695 per person ($347.50 per child under 18) in 2016.
Many of the uninsured are not aware of, or know very little about the tax penalty.
- Approximately 40 percent of uninsured persons were unaware of the penalty.[32]
- In December 2014, approximately 40 percent of uninsured persons were unsure if they would pay the penalty for 2014.[33]
- When informed about the penalty, 30 percent of the uninsured who were previously unaware of the penalty stated that they were more likely to enroll.[34]
Section III: Conclusion
Data from the first quarter of 2015 from the NHIS and findings from private surveys provide insight into the demographic characteristics, financial circumstances, and attitudes towards health insurance among those who do not have coverage. We estimate that nearly half of the uninsured population that is QHP-eligible has family incomes between 100% and 250% FPL, making them likely eligible for APTC and CSR. Almost half of the uninsured who qualify for Marketplace plans are between the ages of 18 and 34. More than 30 percent are people of color: 19 percent are Hispanic, 14 percent are African- American, and about 2 percent are Asian American.
Private surveys suggest that the uninsured value insurance but have financial circumstances, perceptions of affordability, and knowledge gaps that are barriers to enrolling in coverage. Many people who are uninsured have less than $1,000 in savings and choose other financial priorities over purchasing health insurance. Even though they do not currently have health insurance, nearly three-quarters of those without coverage say that they think health insurance is important. Affordability of coverage is of high concern to those without health insurance, yet many lack knowledge about subsidies that reduce the cost of purchasing health insurance and their potential eligibility for this financial assistance. In addition, approximately 40 percent of the uninsured are not aware of or know very little about the tax penalty.
The next Health Insurance Marketplace Open Enrollment Period, from November 1, 2015 to January 31, 2016, will offer an opportunity to continue to provide coverage for more individuals and to reduce the number of uninsured even further.
Methods Appendix
The national estimates for the nonelderly uninsured, for QHP-eligible nonelderly uninsured, and for all nonelderly presented in Figures 1-5 and Tables 1-2 are based on ASPE analysis of National Health Interview Survey Preliminary Quarterly Microdata Files for January-March 2015.[35] For the purposes of this analysis, we consider QHP-eligible uninsured to be any nonelderly, lawfully present individual who is uninsured and has a family income: (a) above 138% of the Federal Poverty Level (FPL) for adults in Medicaid expansion states or at least 100% FPL for adults in states that have not yet expanded, or (b) above 250% FPL for children in any state. Our QHP eligibility definition is not the same as actual eligibility for coverage or financial assistance through the Marketplaces, and is an attempt to identify who is most likely to have or shop for coverage in the Marketplaces. For the purposes of this brief, we have not included within our definition of “QHP eligible” individuals whose family incomes are in the coverage gap (family incomes above Medicaid eligibility and below financial assistance eligibility through the Marketplaces) in states that have not yet expanded Medicaid, as these individuals are unlikely to purchase coverage through the Marketplaces. We also do not include in our definition lawfully present immigrants with family incomes below 100% FPL. The NHIS Preliminary Quarterly Microdata include the variables used for the selected characteristics shown in Figures 2-5 and Tables 1-2.
The NHIS quarterly data do not provide information on citizenship or immigration status. Such information is needed to determine QHP eligibility because immigrants who are not lawfully present are not eligible for Medicaid (except for emergency services), CHIP, or Marketplace coverage. The American Community Survey (ACS) Public Use Microdata Sample (PUMS) data analyzed for this brief include information on place of birth and citizenship but do not distinguish persons who are not lawfully present from legally resident noncitizens. To exclude estimated persons who are not lawfully present from our estimates of the uninsured, we subtracted the estimated number of individuals who are not lawfully present in each category of interest from the NHIS estimates. Estimates for uninsured individuals who are not lawfully present are shown in Figure 1 but this population is not included in the estimates for QHP-eligible uninsured and their characteristics in Figures 2-5 and Tables 1-2.
Our estimates of immigrants who are not lawfully present are based on ASPE analysis of data from the 2013 ACS, using an adjustment methodology based on imputations of immigrant legal status in ASPE’s TRIM3 microsimulation model. The TRIM3 imputation methods, originally developed by Jeffrey Passel and Rebecca Clark in the 1990s, assign noncitizens in data from the Current Population Survey Annual Social and Economic Supplement (CPS ASEC) to one of four possible legal statuses: legal permanent resident (“LPR,” or “green card” holder); refugee or asylee; nonimmigrant (temporary legal resident, generally in the U.S. with a student visa or work visa); or immigrants who are not lawfully present. Our use of the 2013 ACS data assumes that immigrants who are not lawfully present have not benefited from the coverage gains under the Affordable Care Act since 2013 because they are not eligible for the Marketplace or Medicaid expansion.
Another important limitation of the NHIS estimates is that they measure family income rather than income for the Health Insurance Unit (HIU), which comes closer to the tax concepts used to determine eligibility for Medicaid, CHIP, and the Marketplaces. Family income and HIU income will be the same for many families, but for others the two concepts will produce different results. The income of a young adult living at home, for example, would be counted in family income along with that of parents who might earn more, but the child’s and parents’ income would be broken out separately in HIU income. Research by the State Health Access Data Assistance Center (SHADAC) suggests that on net, using HIU rather than family income categorizes more individuals below Medicaid income eligibility limits and fewer individuals within the QHP-eligible income range.[36] Data to construct HIU income was not available in NHIS.
ASPE appreciates the assistance of the Centers for Disease Control and Prevention National Center for Health Statistics Research Data Center in facilitating our access to and analysis of the restricted NHIS Preliminary Quarterly Microdata Files. The findings and conclusions in this brief are those of the authors and do not necessarily represent the views of the Research Data Center, the National Center for Health Statistics, or the Centers for Disease Control and Prevention.
[1] Office of the Assistant Secretary for Planning and Evaluation. “Health Insurance Coverage and the Affordable Care Act.” September 2015. Available at: http://aspe.hhs.gov/health-insurance-coverage-and-affordable-care-act-aspe-issue-brief-september-2015.
[2] Office of the Assistant Secretary for Planning and Evaluation. “How Many Individuals Might Have Marketplace Coverage at the End of 2016?” October 15, 2015. Available at: http://aspe.hhs.gov/pdf-report/how-many-individuals-might-have-marketplace-coverage-at-the-end-of-2016.
[3] Gallup-Healthways WBI data are through 9/12/2015. Office of the Assistant Secretary for Planning and Evaluation. “Health Insurance Coverage and the Affordable Care Act.” September 2015. Available at: http://aspe.hhs.gov/health-insurance-coverage-and-affordable-care-act-aspe-issue-brief-september-2015.
[4] Individuals who meet the criteria for Special Enrollment Periods, or who qualify for Medicaid or CHIP, can enroll at any time.
[5] For the purposes of this brief, we have not included within our definition of “QHP-eligible” individuals whose family incomes are in the coverage gap (family incomes above Medicaid eligibility and below financial assistance eligibility through the Marketplaces) in states that have not yet expanded Medicaid, as these individuals are unlikely to purchase coverage through the Marketplaces. We also do not include in our definition lawfully present immigrants with family incomes below 100% FPL. Likewise, there are individuals with current health coverage who may purchase coverage through the Marketplace—for example, - individuals with unaffordable or non-minimum value coverage who could drop it and enroll in a Marketplace plan—who are not included in the QHP-eligible uninsured estimates presented here.
[6] Rachel Garfield, Anthony Damico, Cynthia Cox, Gary Claxton, and Larry Levitt, “New Estimates of Eligibility for ACA Coverage among the Uninsured,” released by the Kaiser Family Foundation on October 13, 2015 (http://kff.org/uninsured/issue-brief/new-estimates-of-eligibility-for-aca-coverage-among-the-uninsured/), analyzes the eligibility of the uninsured for insurance affordability programs in ways that are somewhat similar to the estimates presented in Figure 1. Their analyses are based on Calendar Year 2014 data from the March 2015 Current Population Survey Annual Social and Economic Supplement (CPS ASEC), which does not capture the gains in coverage in 2015, or the changes in the distribution of the uninsured because the 2015 gains have been concentrated among those eligible for Marketplace subsidies or Medicaid expansion. Because higher-income individuals tend to be uninsured for shorter periods, the CPS ASEC estimate of the full-year uninsured used for the Kaiser Family Foundation analysis has a different income distribution than the NHIS, which captures the uninsured at the time of interview. Both the ASPE and Kaiser Family Foundation analyses suggest that nearly half the nonelderly uninsured are eligible to select Marketplace plans.
[7] Adults who live in states that have not yet expanded and have family incomes from 100% to 138% FPL are considered for the purposes of this brief to be likely eligible for Marketplace coverage.
[8] We have interpreted survey findings in a manner that is consistent with each individual survey, but for simplicity use the term uninsured broadly in this discussion. We recommend seeing the sources cited in Table 3 for additional details on methodologies, instruments, timeframes, samples, and definitions. A recent overview by the Urban Institute also provides comparative information on some of the surveys: Michael Karpman, Sharon K. Long, and Michael Huntress, “Nonfederal Surveys Fill a Gap in Data on ACA,” March 2015, available at http://www.urban.org/research/publication/nonfederal-surveys-fill-gap-data-aca.
[9] Sample size listed is for the entire survey sample, which may include individuals who have coverage.
[10] Robert Wood Johnson Foundation, “Understanding the Uninsured Now.” June 2015. Available at: http://www.rwjf.org/en/library/research/2015/06/understanding-the-uninsured-nRow.html.
[11] Rachel Garfield and Katherine Young, “How Does Gaining Coverage Affect People’s Lives? Access, Utilization, and Financial Security among Newly Insured Adults.” Kaiser Family Foundation, June 19, 2015. Available at: http://kff.org/health-reform/issue-brief/how-does-gaining-coverage-affect-peoples-lives-access-utilization-and-financial-security-among-newly-insured-adults/.
[12] Adele Shartzer, Genevieve M. Kenney, Sharon K. Long, and Yvette Odu, “A Look at Remaining Uninsured Adults as of March 2015.” Urban Institute, August 18, 2015. Available at: http://hrms.urban.org/briefs/A-Look-at-Remaining-Uninsured-Adults-as-of-March-2015.html.
[13] Robert Wood Johnson Foundation, “Understanding the Uninsured Now.” June 2015. Available at: http://www.rwjf.org/en/library/research/2015/06/understanding-the-uninsured-now.html.
[14] Rachel Garfield and Katherine Young, “How Does Gaining Coverage Affect People’s Lives? Access, Utilization, and Financial Security among Newly Insured Adults.” Kaiser Family Foundation, June 19, 2015. Available at: http://kff.org/health-reform/issue-brief/how-does-gaining-coverage-affect-peoples-lives-access-utilization-and-financial-security-among-newly-insured-adults/.
[15] Sara R. Collins, Petra W. Rasmussen, Michelle M. Doty, and Sophie Beutel, “Americans’ Experiences with Marketplace and Medicaid Coverage.” Commonwealth Fund, June 2015. Available at: http://www.commonwealthfund.org/publications/issue-briefs/2015/jun/experiences-marketplace-and-medicaid.
[16] Rachel Garfield and Katherine Young, “How Does Gaining Coverage Affect People’s Lives? Access, Utilization, and Financial Security among Newly Insured Adults.” Kaiser Family Foundation, June 19, 2015. Available at: http://kff.org/health-reform/issue-brief/how-does-gaining-coverage-affect-peoples-lives-access-utilization-and-financial-security-among-newly-insured-adults/.
[17] McKinsey & Company. “2015 OEP: Insight into Consumer Behavior.” March 2015. Available at: http://healthcare.mckinsey.com/2015-oep-insight-consumer-behavior.
[18] Robert Wood Johnson Foundation, “Understanding the Uninsured Now.” June 2015. Available at: http://www.rwjf.org/en/library/research/2015/06/understanding-the-uninsured-now.html.
[19] Kaiser Family Foundation. “Key Facts about the Uninsured Population.” October 5, 2015. Available at: http://kff.org/uninsured/fact-sheet/key-facts-about-the-uninsured-population/. Sommers et al. found significant decreases in the proportion of individuals who said they did not have easy access to medicine after the first Marketplace Open Enrollment Period and for low-income individuals in states expanding Medicaid, but not for low-income individuals in states that have not yet expanded. Benjamin D. Sommers, Munira Z. Gunja, Kenneth Finegold, and Thomas Musco, “Changes in Self-reported Insurance Coverage, Access to Care, and Health Under the Affordable Care Act,” Journal of the American Medical Association, 2015, 314(4):366-374.
[20] Rachel Garfield and Katherine Young, “How Does Gaining Coverage Affect People’s Lives? Access, Utilization, and Financial Security among Newly Insured Adults.” Kaiser Family Foundation, June 19, 2015. Available at: http://kff.org/health-reform/issue-brief/how-does-gaining-coverage-affect-peoples-lives-access-utilization-and-financial-security-among-newly-insured-adults/.
[21] Ibid.
[22] Adele Shartzer, Genevieve M. Kenney, Sharon K. Long, and Yvette Odu, “A Look at Remaining Uninsured Adults as of March 2015.” Urban Institute, August 18, 2015. Available at: http://hrms.urban.org/briefs/A-Look-at-Remaining-Uninsured-Adults-as-of-March-2015.html.
[23] Robert Wood Johnson Foundation, “Understanding the Uninsured Now.” June 2015. Available at: http://www.rwjf.org/en/library/research/2015/06/understanding-the-uninsured-now.html.
[24] Ibid.
[25] Rachel Garfield and Katherine Young, “How Does Gaining Coverage Affect People’s Lives? Access, Utilization, and Financial Security among Newly Insured Adults.” Kaiser Family Foundation, June 19, 2015. Available at: http://kff.org/health-reform/issue-brief/how-does-gaining-coverage-affect-peoples-lives-access-utilization-and-financial-security-among-newly-insured-adults/.
[26] Adele Shartzer, Genevieve M. Kenney, Sharon K. Long, and Yvette Odu, “A Look at Remaining Uninsured Adults as of March 2015.” Urban Institute, August 18, 2015. Available at: http://hrms.urban.org/briefs/A-Look-at-Remaining-Uninsured-Adults-as-of-March-2015.html.
[27] Sara R. Collins, Petra W. Rasmussen, Michelle M. Doty, and Sophie Beutel, “Americans’ Experiences with Marketplace and Medicaid Coverage.” Commonwealth Fund, June 2015. Available at: http://www.commonwealthfund.org/publications/issue-briefs/2015/jun/experiences-marketplace-and-medicaid.
[28] McKinsey & Company. “2015 OEP: Insight into Consumer Behavior.” March 2015. Available at: http://healthcare.mckinsey.com/2015-oep-insight-consumer-behavior.
[29] Rachel Garfield and Katherine Young, “Adults who Remained Uninsured at the End of 2014.” Kaiser Family Foundation, January 29, 2015. Available at: http://kff.org/report-section/adults-who-remained-uninsured-at-the-end-of-2014-issue-brief/.
[30] Ibid.
[31] Robert Wood Johnson Foundation, “Understanding the Uninsured Now.” June 2015. Available at: http://www.rwjf.org/en/library/research/2015/06/understanding-the-uninsured-now.html.
[32] McKinsey & Company. “2015 OEP: Insight into Consumer Behavior.” March 2015. Available at: http://healthcare.mckinsey.com/2015-oep-insight-consumer-behavior.
[33] Michael Karpman, Genevieve M. Kenney, Sharon K. Long, and Stephen Zuckerman, “Quick Take: As of December, Many Uninsured Adults Were Not Aware of Tax Penalties for Not Having coverage, the Marketplaces, or the Open Enrollment Deadline.” Urban Institute, February 19, 2015. Available at: http://hrms.urban.org/quicktakes/As-of-December-Man-Uninsured-Adults-Were-Not-Aware-of-Tax-Penalties.html.
[34] McKinsey & Company. “2015 OEP: Insight into Consumer Behavior.” March 2015. Available at: http://healthcare.mckinsey.com/2015-oep-insight-consumer-behavior.
[35] Centers for Disease Control and Prevention, National Center for Health Statistics, National Health Interview Survey Early Release Program. “Preliminary Quarterly Microdata Files: National Health Interview Survey, January–March 2015.” August 2015. Available at: http://www.cdc.gov/nchs/data/nhis/earlyrelease/microdata.pdf.
[36] State Health Access Data Assistance Center (SHADAC). “Defining ‘Family’ for Studies of Health Insurance Coverage.” March 2012. Available at: http://www.shadac.org/files/shadac/publications/SHADAC_Brief27.pdf.