
| In March 2015, ASPE estimated that 16.4 million uninsured people had gained health insurance coverage as several of the Affordable Care Act’s coverage provisions took effect. Using updated data, ASPE now estimates that 17.6 million uninsured people have gained health insurance coverage. Coverage gains refer to different sources of coverage, including Medicaid, the Health Insurance Marketplace, and individual market coverage; therefore, gains are not limited to Marketplace-eligible individuals.
|
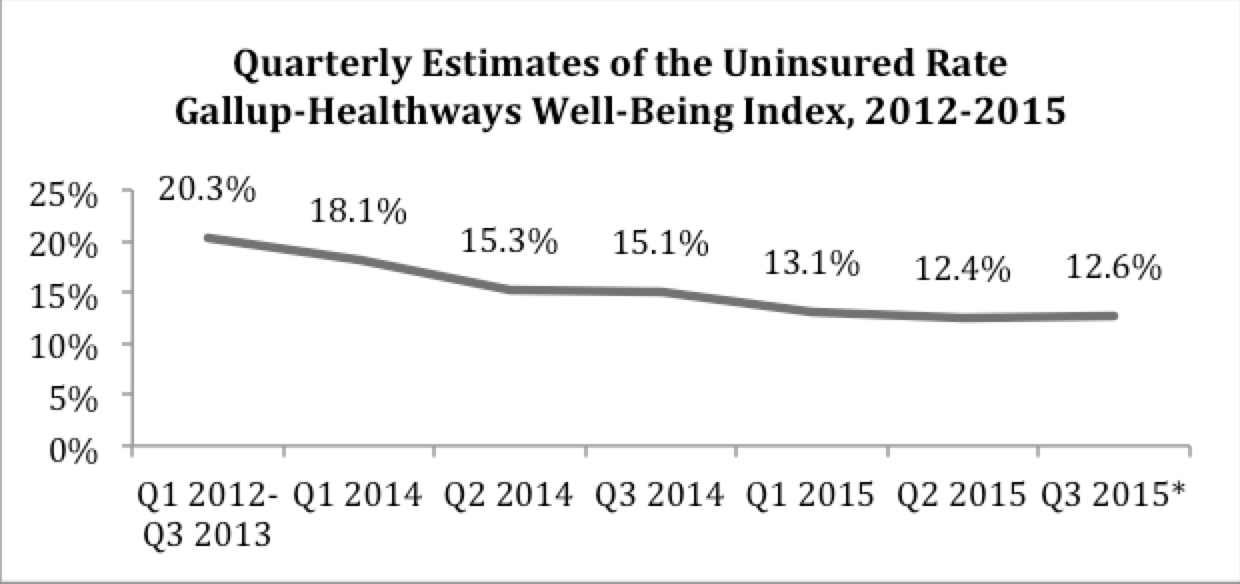
*Data are through 9/12/2015. Source: Office of the Assistant Secretary for Planning and Evaluation (ASPE) analysis of Gallup-Healthways Well-Being Index survey data through 9/12/15. The baseline period is from Q1 2012 to Q3 2013. All models use nationally-representative survey weights and adjust for age, sex, race, ethnicity, employment, state of residence, marital status, rural location, and a linear time trend in order to control for changes in the economy, population composition, and non-policy factors affecting health insurance coverage. Models do not adjust for income due to changes in Gallup methodology beginning on June 1, 2015. Historical estimates have been updated to reflect the new methodology and differ from those in ASPE’s analysis from March 2015 (http://aspe.hhs.gov/health-insurance-coverage-and-affordable-care-act-aspe-issue-brief-march-2015). See technical notes for additional details. |
Uninsured Rates by Race and Ethnicity
The uninsured rate declined across all race/ethnicity categories since the baseline period. There were greater declines in the uninsured rate among African Americans and Hispanics than among Whites.
- Among Whites, the uninsured rate declined by 6.0 percentage points, from a baseline uninsured rate of 14.3 percent to 8.3 percent, resulting in 7.4 million adults gaining coverage.
- Among African Americans, the uninsured rate declined by 10.3 percentage points, from a baseline uninsured rate of 22.4 percent to 12.1 percent, resulting in 2.6 million adults gaining coverage.
- Among Hispanics, the uninsured rate declined by 11.5 percentage points, from a baseline uninsured rate of 41.8 percent to 30.3 percent, resulting in about 4.0 million adults gaining coverage.
|
| Baseline Uninsured Rate | Q1 2014 | Q3 2014 | Q1 2015 | Q3 2015* | Uninsured Rate in Q3 2015* | Number Gained Coverage Since Baseline |
|---|---|---|---|---|---|---|---|
| Change in Percentage Points from Baseline Trend | |||||||
| Whites | 14.3 | -1.5 | -4.8 | -5.7 | -6.0 | 8.3 | 7.4 million |
| African Americans | 22.4 | -3.8 | -6.6 | -9.8 | -10.3 | 12.1 | 2.6 million |
| Hispanics | 41.8 | -3.4 | -5.4 | -10.5 | -11.5 | 30.3 | 4.0 million |
*Data are through 9/12/2015.
Source: Office of the Assistant Secretary for Planning and Evaluation (ASPE) analysis of Gallup-Healthways Well-Being Index survey data through 9/12/15. The baseline period is from Q1 2012 to Q3 2013. All models use nationally-representative survey weights and adjust for age, sex, race, ethnicity, employment, state of residence, marital status, rural location, and a linear time trend in order to control for changes in the economy, population composition, and non-policy factors affecting health insurance coverage. Models do not adjust for income due to changes in Gallup methodology beginning on June 1, 2015. Historical estimates have been updated to reflect the new methodology and differ from those in ASPE’s analysis from March 2015 (http://aspe.hhs.gov/health-insurance-coverage-and-affordable-care-act-aspe-issue-brief-march-2015). See technical notes for additional details.
Uninsured Rates by State Medicaid Expansion Status
Health insurance coverage gains continued to be especially strong in Medicaid expansion states.
- Expansion states experienced a decline in their uninsured rate of 8.1 percentage points, from an average baseline rate of 18.2 percent to 10.1 percent.
- Non-expansion states experienced a decline in their uninsured rate of 7.3 percentage points, from an average baseline rate of 23.4 percent to 16.1 percent.
|
| Baseline Uninsured Rate | Q1 2014 | Q3 2014 | Q1 2015 | Q3 2015* | Uninsured Rate in Q3 2015* | ||
|---|---|---|---|---|---|---|---|---|
| Change in Percentage Points from Baseline Trend | ||||||||
| Expansion | 18.2 | -2.5 | -6.0 | -7.5 | -8.1 | 10.1 | ||
| Non-expansion | 23.4 | -2.0 | -4.2 | -7.0 | -7.3 | 16.1 | ||
*Data are through 9/12/2015.
Source: Office of the Assistant Secretary for Planning and Evaluation (ASPE) analysis of Gallup-Healthways Well-Being Index survey data through 9/12/15. The baseline period is from Q1 2012 to Q3 2013. All models use nationally-representative survey weights and adjust for age, sex, race, ethnicity, employment, state of residence, marital status, rural location, and a linear time trend in order to control for changes in the economy, population composition, and non-policy factors affecting health insurance coverage. Models do not adjust for income due to changes in Gallup methodology beginning on June 1, 2015. Historical estimates have been updated to reflect the new methodology and differ from those in ASPE’s analysis from March 2015 (http://aspe.hhs.gov/health-insurance-coverage-and-affordable-care-act-aspe-issue-brief-march-2015). See technical notes for additional details. Medicaid expansion states include AZ, AR, CA, CO, CT, DE, DC, HI, IL, IN, IA, KY, MD, MA, MI, MN, NV, NH, NJ, NM, NY, ND, OH, OR, PA, RI, VT, WA, and WV.
Uninsured Rates for Young Adults
|
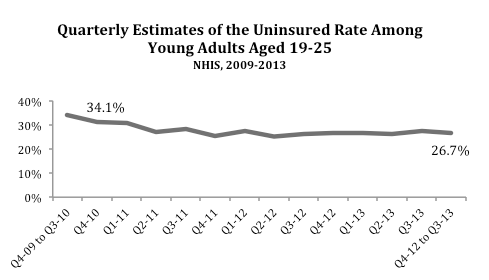
Young Adults: Coverage gains for young adults aged 19-25 started in 2010 with the ACA’s provision enabling them to stay on their parents’ plans until age 26. From the baseline period through the start of open enrollment in October 2013, the uninsured rate for young adults declined from 34.1 percent to 26.7 percent, which translates to 2.3 million young adults gaining coverage.*
*Source: National Health Interview Survey; see technical notes for methods
|
** Source: Office of the Assistant Secretary for Planning and Evaluation (ASPE) analysis of Gallup-Healthways Well-Being Index survey data through 9/12/15. The baseline period is from Q1 2012 to Q3 2013. All models use nationally-representative survey weights and adjust for age, sex, race, ethnicity, employment, state of residence, marital status, rural location, and a linear time trend in order to control for changes in the economy, population composition, and non-policy factors affecting health insurance coverage. Models do not adjust for income due to changes in Gallup methodology beginning on June 1, 2015. Historical estimates have been updated to reflect the new methodology and differ from those in ASPE’s analysis from March 2015 (http://aspe.hhs.gov/health-insurance-coverage-and-affordable-care-act-aspe-issue-brief-march-2015). See technical notes for additional details. |
Uninsured Rates by Gender
The uninsured rate declined for both males and females since the baseline period. There was a greater decline in the uninsured rate among females than among males.
- Males experienced a decline in their uninsured rate of 7.3 percentage points, from an average baseline rate of 21.8 percent to 14.5 percent, resulting in 7.3 million adult males gaining coverage.
- Females experienced a decline in their uninsured rate of 8.1 percentage points, from an average baseline rate of 18.9 percent to 10.8 percent, resulting in nearly 8.2 million adult women gaining coverage.
|
| Baseline Uninsured Rate | Q1 2014 | Q3 2014 | Q1 2015 | Q3 2015 | Uninsured Rate in Q3 2015* | Number Gained Coverage Since Baseline |
|---|---|---|---|---|---|---|---|
| Change in Percentage Points from Baseline Trend | |||||||
| Male | 21.8 | -2.1 | -5.4 | -6.8 | -7.3 | 14.5 | 7.3 million |
| Female | 18.9 | -2.4 | -5.1 | -7.7 | -8.1 | 10.8 | 8.2 million |
Source: Office of the Assistant Secretary for Planning and Evaluation (ASPE) analysis of Gallup-Healthways Well-Being Index survey data through 9/12/15. The baseline period is from Q1 2012 to Q3 2013. All models use nationally-representative survey weights and adjust for age, sex, race, ethnicity, employment, state of residence, marital status, rural location, and a linear time trend in order to control for changes in the economy, population composition, and non-policy factors affecting health insurance coverage. Models do not adjust for income due to changes in Gallup methodology beginning on June 1, 2015. Historical estimates have been updated to reflect the new methodology and differ from those in ASPE’s analysis from March 2015 (http://aspe.hhs.gov/health-insurance-coverage-and-affordable-care-act-aspe-issue-brief-march-2015). See technical notes for additional details.