
Recent interest among policymakers in helping Social Security Disability Insurance (SSDI) beneficiaries return to work has increased the in desire for knowledge about the employment activities of people with disabilities before they apply for benefits. Learning about the participation of applicants in programs designed to support employment and provide income supports may offer opportunities for early intervention to enable them to remain employed. In this issue brief, we summarize results from a working paper, conducted through the Social Security Administration's (SSA's) Disability Research Consortium, on the experiences of SSDI applicants before they apply for SSDI (Thompkins et al. forthcoming).
Although relatively few studies have uncovered the employment and program participation paths of eventual SSDI applicants and recipients, we know the paths they take to application are often characterized by disruptive changes in health, separation from employment, and an interval between job separation and application (Lindner 2013). They may also be marked by changes in or involvement with other benefits and support programs (Livermore et al. 2010; Daly 1998; Honeycutt 2004).
In this brief, we describe the employment and program participation patterns of people with disabilities before they apply for SSDI, adding to the existing literature by focusing on patterns as much as 42 months before application and including a range of programs. A better understanding of the experiences of people immediately before SSDI application can inform policies and programs designed to help potential applicants remain in the workforce and stem growth in the SSDI rolls.
We used data from the Survey of Income and Program Participation (SIPP) matched to SSA administrative data to identify SSDI applicants accurately and address the question: What are the employment, income, and program participation characteristics of applicants during the 42 months before they apply for SSDI? Box 1 presents a short description of the methods used for this analysis.1 The following is a summary of our findings.
| BOX 1. Methods Used |
|---|
| For this analysis, we pooled data from the 1996, 2001, and 2004 panels of the SIPP, a nationally representative sample of the non-institutionalized civilian population 15 years old and older. Respondents are interviewed once every four months for the duration of the survey panel. SIPP contains information on demographic characteristics, employment outcomes, and program participation of each respondent. We linked these data to SSA administrative files to identifying SSDI application dated, SSDI receipt, and Supplemental Security Income (SSI) receipt. Not all SIPP records could be matched to SSA administrative data; the match rate for panels ranged from 60 percent to 84 percent. The statistics presented here therefore represent lower-bound estimates and could be biased if non-matched respondents systematically differ from matched respondents by SSDI receipt or application status. Using the SSA administrative data, we excluded people who received SSDI benefits as of the first SIPP wave and identified initial SSDI applications up to six years after the first SIPP wave. The sample for this analysis was restricted to people ages 25-55 whose first survey response occurred in wave 1 and who applied for SSDI benefits within six years of the first SIPP interview. The analytical methods incorporated descriptive statistics, measured at a point in time or across six-month intervals, and comparative statistics (such as t-tests) to determine statistical significance. To improve the precision of our estimates, we show data only for statistics with at least 50 observations across all three panels. Data are weighted using SIPP panel wave 1 weights. |
Employment Patterns Before SSDI Application
Employment Patterns Before SSDI Application
| FIGURE 1. Labor Force Participation of SSDI Applicants |
|---|
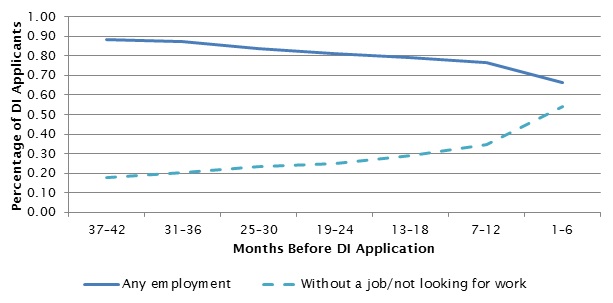 |
Although employment among SSDI applicants declined during the two years before application, the majority worked in the six-month period before that point. SSDI applicants experienced a consistent decline in employment--and an increase in being out of the labor market entirely--beginning more than two years before SSDI application. In Figure 1, we show two statistics: the proportion of SSDI applicants who were employed and the proportion who were without jobs and not looking for work; both are calculated when reported for at least one month during six-month intervals before SSDI application, and so are not mutually exclusive. Between 37 months and 42 months before their application, 89 percent of applicants worked (compared with 84 percent of the general population ages 25-55), whereas 18 percent were without jobs and were not looking for work at any point during the period (compared with 17 percent of the general population) (Table 1).
In the six-month period before SSDI application, the proportion of applicants who were employed declined to about two-thirds (66 percent). More than half of these applicants (54 percent) were neither working nor looking for work for at least one month during this period, however. This pattern suggests that, for many applicants, the attachment to the labor market is strong leading up to the point of applying for SSDI.
Earnings and Poverty Rates
Earnings and Poverty Rates
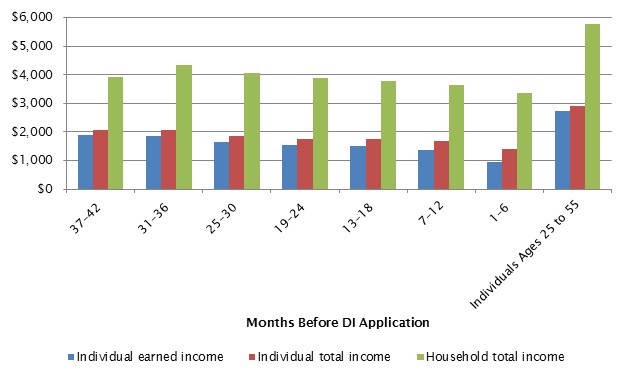
SSDI applicants had lower earnings and higher poverty rates compared to the general population ages 25-55, even up to 42 months before application. However, the observed decline in earnings leading up to application was partially offset by other income. Earnings patterns were consistent with the decreasing connection we found between applicants and the labor market before benefit application. We considered three measures of income at six-month intervals during this period: individual earned income, individual total income, and household total income (see Figure 2 and Table 1). At 37-42 months before SSDI application, the mean monthly individual earned income of applicants was $1,887, the earned income of those with earnings was $2,364, the individual total income was $2,068, and the household total income was $3,923. (As a reference, the corresponding numbers for the population ages 25-55, shown at the right of the figure, were $2,727, $3,399, $2,892, and $5,783, respectively.) In the six months before application, the mean individual monthly earned income of SSDI applicants fell by 50 percent, to $944 (though of those with earnings, earned income dropped by 18 percent, to $1,941). The mean individual total income and household income declined as well, but not as much. The smaller change in total income than in earned income suggests future SSDI applicants offset the decline in their earnings by making use of programs that provided at least partial financial support.
The decline in income was accompanied by an increase in the number of future SSDI applicants falling below the federal poverty level. At 37-42 months before application, 24 percent were below the federal poverty level; this proportion increased to 40 percent in the six months before application. The poverty rate in the population ages 25-55 was 13 percent.
| FIGURE 2. Monthly Income of Individuals Before SSDI Application |
|---|
 |
Participation in Other Programs
Participation in Other Programs
SSDI applicants increased their participation in selected programs other than SSDI, particularly in the six months before application. We examined their participation in four types of programs: poverty-related benefits, disability-related benefits, health insurance, and employment-related benefits. In general, their program participation rates were greater than those of all people age 25-55, and they increased their participation during the six-month period before application. The exception to this pattern was employment-related benefits. Although greater than for the population ages 25-55, participation in this program remained stable for applicants over the 42-month period before application.
-
Poverty-Related Benefits. A larger proportion of SSDI applicants received means-tested benefits, compared to the general population, up to 42 months before applying for SSDI (Table 2). Between 10 percent and 21 percent of eventual SSDI applicants received benefits from the Supplemental Nutrition Assistance Program (SNAP), 4-8 percent received energy assistance, and 2-3 percent received housing assistance. Benefit receipt increased in the six-month period before SSDI application, and the proportion of applicants receiving poverty-related benefits across the 42-month period before application was typically greater than that of all people ages 25-55.
-
Disability-Related Benefits. The proportion of SSDI applicants receiving other disability-related benefits was typically small in the 7-42 months before SSDI application: between 2 percent and 6 percent received workers' compensation, and less than 3 percent received other disability-related benefits. As with poverty-related benefits, however, the proportion increased in the six months just before SSDI application: 9 percent of applicants received worker's compensation, and 7 percent received employer-based disability insurance.
-
Health Insurance. Most people had private health insurance before SSDI application, even in the six-month period immediately before it, although that percentage steadily declined over the 42-month period. In contrast, the percentage with Medicaid coverage increased as people approached application, from 11 percent at 37-42 months before application to 20 percent in the six-month period immediately before it.
-
Employment-Related Benefits. Relatively few SSDI applicants received unemployment or veterans' benefits during the 42 months before application; these proportions (5-8 percent for unemployment benefits and 2-4 percent for veterans' benefits) were stable across the observed periods.
Conclusion
Conclusion
In this brief, we presented the employment, income, and program participation patterns of people during the 42-month period before they applied for SSDI benefits. Identifying characteristics of those at greater risk for SSDI application can inform policies to divert people with disabilities from applying for SSDI, and can ensure that the supports necessary to make work feasible are provided to them.
As expected, we observed a decline in employment and earned income of SSDI applicants before they applied for benefits, with the biggest change occurring during the six months preceding application. Surprisingly, more than two-thirds were employed at some point during this period--and had private health insurance coverage--suggesting an opportunity to divert SSDI entry by providing employment supports to maintain their connection to the workforce. Conversely, a larger proportion of applicants received poverty-related benefits and Medicaid up to 36 months before applying for SSDI than the general population did, pointing to possible longer-term issues in their attachment to or level of work.
It is noteworthy that participation in income and other support programs increased markedly during the six months before SSDI application. This increased access to some benefit programs--most notably, employer-based disability insurance, workers' compensation, SNAP, and Medicaid--may point to areas where investments in early intervention initiatives could be fruitful.
Notes
NOTES
-
We appreciate the support of SSA's Disability Research Consortium, which provided additional funding for this project.
References
REFERENCES
Daly, M.C. "Characteristics of SSI and DI recipients in the years before receiving benefits." In Growth in Disability Benefits, edited by K. Rupp and D.C. Stapleton. Kalamazoo, MI: W.E. Upjohn Institute for Employment Research, 1998.
Honeycutt, T. "Program and benefit paths to the Social Security Disability Insurance program." Journal of Vocational Rehabilitation, 21(2), 2004, pp. 83-94.
Linder, S. "From working to applying: Employment transitions of applicants for disability insurance in the United States." Journal of Social Policy, 42(2), pp. 329-348, 2013.
Livermore, G., D. Stapleton, and H. Claypool. "Health care when workers needed it most: Before and after entry into the Social Security insurance program." Inquiry, 47, pp. 135-149, 2010.
Thompkins, A., T. Honeycutt, C. Gill, J. Mastrianni, and M. Bailey. "To Apply or Not To Apply: The Employment and Program Participation Experiences of Social Security Disability Insurance Applicants and Non-Applicants." Washington, DC: Mathematica Policy Research, DRC Working Paper Series, forthcoming.
| TABLE 1. Employment and Income Characteristics of SSDI Applicants | |||||||||
|---|---|---|---|---|---|---|---|---|---|
| Months Before SSDI Application | Difference Between 37-42 Months & 1-6 Months Before Application | All Individuals Ages 25-55 | |||||||
| 37-42 | 31-36 | 25-30 | 19-24 | 13-18 | 7-12 | 1-6 | |||
| Labor Force Participation | |||||||||
| Any employment | 88.5% | 87.5% | 83.6% | 81.0% | 79.0% | 76.7%* | 66.4%** | -25% | 84.0% |
| Without a job/ not looking for work | 17.9% | 20.2% | 23.4% | 24.9% | 29.1% | 34.6%* | 54.1%** | 202% | 16.7% |
| Monthly Income (mean) | |||||||||
| Individual earned income | $1,887 | $1,865 | $1,656 | $1,531 | $1,507 | $1,356* | $944** | -50% | $2,727 |
| Individual earned income for those with income | $2,364 | $2,309 | $2,204 | $2,080 | $2,151 | $2,082 | $1,941 | -18% | $3,399 |
| Individual total income | $2,068 | $2,071 | $1,860 | $1,766 | $1,767 | $1,699 | $1,396* | -32% | $2,892 |
| Household total income | $3,923 | $4,351 | $4,047 | $3,889 | $3,776 | $3,637 | $3,359 | -14% | $5,783 |
| Federal poverty level | 24.0% | 22.4% | 25.8% | 25.9% | 29.1% | 33.0% | 40.4%* | 68% | 13.4% |
| Unweighted Sample Size | 204 | 376 | 626 | 856 | 1,045 | 1,202 | 1,335 | 127,972 | |
| Unweighted Sample Size (for individual earned income of those with earnings) | 183 | 323 | 515 | 689 | 822 | 904 | 841 | 104,834 | |
| Weighted Sample Size (average per panel) | 173,487 | 322,895 | 556,766 | 762,919 | 939,560 | 1,094,278 | 1,219,322 | 121,410,365 | |
| SOURCE: 1996, 2001, and 2004 SIPP panels matched to SSA administrative data. NOTES: Table shows employment and income characteristics of SSDI applicants at 6-month intervals before they applied for benefits. Income statistics adjusted to 2004 dollars using the Consumer Price Index for All Urban Consumers. Statistics for "all individuals ages 25-55" are for individuals ages 25-55 in wave 1 of each SIPP panel, regardless of disability, SSDI, or at-risk group status. Statistics for each 6-month period were compared with those for the 37-42 month period using t-tests. * p<0.05; ** p<0.01. | |||||||||
| TABLE 2. Program Participation of SSDI Applicants | ||||||||
|---|---|---|---|---|---|---|---|---|
| Months Before SSDI Application | All Individuals Ages 25-55 | |||||||
| 37-42 | 31-36 | 25-30 | 19-24 | 13-18 | 7-12 | 1-6 | ||
| Poverty-Related Benefits | ||||||||
| SNAP | 10.2%* | 12.6%* | 10.7%** | 12.4%* | 13.2%* | 15.2% | 21.1% | 4.0%** |
| Energy assistance | 4.1% | 5.6% | 5.1% | 5.7% | 5.2% | 5.4% | 7.6% | 2.1%** |
| Subsidized housing | 2.8% | 3.4% | 2.7% | 2.3% | 1.7% | 2.2% | 2.8% | 1.2% |
| Temporary Assistance for Needy Families | 3.7% | 2.9% | 2.6% | 2.2% | 2.9% | 3.6% | 4.7% | 1.2%* |
| Disability-Related Benefits | ||||||||
| SSI | 0.5% | 0.3% | 0.5% | 0.5% | 0.7% | 0.9% | 1.0% | 1.1% |
| Employer-based disability insurance | 0.0%** | 0.0%** | 0.7%** | 0.8%** | 1.1%** | 2.7% | 6.5% | 0.2%** |
| Own sickness or accident insurance | 0.0%* | 0.3% | 0.2%* | 0.4% | 0.4% | 1.2% | 2.1% | 0.0%* |
| Workers' compensation | 4.1% | 3.9%* | 1.7%** | 2.6%** | 4.4%* | 5.6% | 9.3% | 0.4%** |
| Health Coverage | ||||||||
| Medicaid | 10.6%* | 11.9%* | 12.1%* | 11.8%* | 13.8% | 15.9% | 20.4% | 6.1%** |
| Private health insurance | 72.9% | 72.0% | 70.3% | 71.1% | 67.5% | 67.4% | 66.7% | 77.9%** |
| Employment-Related Benefits | ||||||||
| Unemployment benefits | 7.5% | 5.7% | 6.4% | 7.2% | 5.4% | 5.9% | 7.5% | 2.4%** |
| Veterans benefits' | 1.7% | 1.9% | 3.4% | 3.6% | 3.7% | 3.3% | 3.2% | 0.7%* |
| Unweighted Sample Size | 204 | 376 | 626 | 856 | 1,045 | 1,202 | 1,335 | 127,972 |
| Weighted Sample Size(average per panel) | 173,487 | 322,895 | 556,766 | 762,919 | 939,560 | 1,094,278 | 1,219,322 | 121,410,365 |
| SOURCE: 1996, 2001, and 2004 SIPP panels matched to SSA administrative data. NOTES: Program participation of SSDI applicants at 6-month intervals before they applied for benefits shown in table. The statistics for "all individuals ages 25-55" are for individuals ages 25-55 in wave 1 of each SIPP panel, regardless of disability, SSDI application, or at-risk group status. The table includes 2 types of comparisons: (1) statistics for each 6-month period were compared with those for the period 1-6 months before SSDI application; and (2) statistics for the period 1-6 months before SSDI application were compared with those for individuals ages 25-55. Both comparisons used t-test statistics. * p<0.05; ** p<0.01. | ||||||||