
Original Research
Prepared for:
Office of the Assistant Secretary for Planning and Evaluation
U.S. Department of Health and Human Services
| This research brief describes rates of health care coverage for married- and single-parent families with children under age 18, a key target population of both marriage and health care coverage initiatives. Drawing on nationally representative data from the Current Population Survey (CPS), the brief reports differences in rates of health care coverage by marital status among families with children, for the overall national population and separately by income level and racial/ethnic group. |
Coverage Rates Among Families with Children
Overall rates of health care coverage are similar for married-parent and single-parent families.
In 2003, 82 percent of married-parent families (22.1 million) and 80 percent of single-parent families (7.0 million) had health care coverage for all family members for at least part of the year (Table 1). An additional 14 percent of married-parent families (3.7 million) and 16 percent of single-parent families (1.4 million) had coverage for some but not all family members. Examples of partially covered families include those in which the children were covered by the State Children's Health Insurance Program (SCHIP) but the parents lacked coverage or families in which a parent had employment-based health care coverage but the other family members lacked coverage.
| Marital Status and Coverage Type | Percentage of Families Covered | Number of Families Covered (in millions) |
|---|---|---|
| Fully Covered | ||
| Married-parent families | 82 | 22.1 |
| Single-parent families | 80 | 7.0 |
| Partially Covered | ||
| Married-parent families | 14 | 3.7 |
| Single-parent families | 16 | 1.4 |
| Source: Annual Social and Economic Supplement (ASEC) to the Current Population Survey (CPS), 2004. Notes: Fully covered means that everyone in the family had coverage for at least part of the year. Partially covered means that only some family members were covered. | ||
Although married-parent and single-parent families have similar overall rates of health care coverage, they depend on different sources of coverage.
In 2003, the two most common sources of health care coverage for families with children were employment-based health care plans and public programs such as SCHIP or Medicaid (Figure 1). Coverage rates were lower for plans purchased directly from private health insurance companies ("direct-purchased") and for "mixed" coverage plans involving a combination of employment-based, public, and direct-purchased coverage. The percentage of families fully covered by employment-based plans was higher for married-parent families (69 percent) than for single-parent families (38 percent). However, rates of health care coverage through public programs were higher for single-parent families (40 percent versus 11 percent). Coverage rates for direct-purchased and mixed coverage types were similar by marital status. These estimates exclude partially covered families in which some but not all family members had health care coverage. However, this exclusion does not change the overall pattern of results.
Figure 1
Source of Full Health Care Coverage Among Families with Children, by Marital Status, 2003.
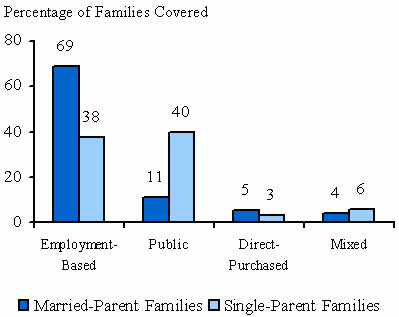
Source: Annual Social and Economic Supplement (ASEC)
to the Current Population Survey (CPS), 2004.
Notes: Limited to families with health care coverage for all family members.
Rates for source of coverage do not sum to overall coverage rates (Table 1)
because some families have more than one coverage source.
The difference in rates of employment-based and public health care coverage between married-parent and single-parent families may be due in part to differences in income levels, employment patterns, and other demographic characteristics. For example, in 2003, the median income for the families included in this analysis was more than three times higher for married-parent families ($64,500) than for single-parent families ($20,827). Higher family income indicates both an increased chance for employment-based coverage and a reduced chance for means-tested public health care coverage. By contrast, single-parent families had a greater chance of being unemployed or working in service occupations, which often do not offer health benefits.
Coverage Rates for Low-Income Families
Among low-income families, married-parent families are less likely than single-parent families to have full family health care coverage.
In 2003, 61 percent of low-income married-parent families had health care coverage for all family members for at least part of the year, compared with 78 percent of low-income single-parent families (Table 2). The number of low-income families with full health care coverage was also lower for married-parent than single-parent families (4.0 million versus 4.3 million). Low-income is defined in these analyses as having a family income below 200 percent of the federal poverty level.
| Marital Status and Coverage Type | Percentage of Families Covered | Number of Families Covered (in millions) |
|---|---|---|
| Fully Covered | ||
| Married-parent families | 61 | 4.0 |
| Single-parent families | 78 | 4.3 |
| Partially Covered | ||
| Married-parent families | 33 | 2.2 |
| Single-parent families | 19 | 1.0 |
| Source: Annual Social and Economic Supplement (ASEC) to the Current Population Survey (CPS), 2004. Notes: Limited to families with incomes below 200 percent of the federal poverty level. Fully covered means that everyone in the family had coverage for at least part of the year. Partially covered means that only some family members were covered. | ||
There are several possible reasons why low-income married-parent families might be less likely to have full family health care coverage. Although married-parent families are more likely to have at least one full-time worker, many workers in low-wage employment are not offered family health care coverage (DiJulio and Jacobs 2007). Additionally, compared to low-income families with married parents, those with single parents are more likely to have incomes below poverty, so more single-parent families may be eligible for public health care coverage that includes all family members.
When not fully covered, low-income married parent families are more likely than single-parent families to have health care coverage for at least some family members.
In 2003, 33 percent of low-income married-parent families (2.2 million) and 19 percent of low-income single-parent families (1.0 million) had partial health care coverage (Table 2). In many of these families, it is possible that the children were covered by SCHIP while the parents lacked coverage. If so, the gap in health care coverage rates between low-income single-parent and married-parent families may be smaller for children than for parents. The information needed to determine which family members lacked health care coverage was not available for this analysis.
Higher rates of public health care coverage for single-parent families account for almost all of the difference in coverage rates between low-income single-parent and married-parent families.
In 2003, 58 percent of low-income single-parent families were fully covered by some type of public health care program, compared with 28 percent of low-income families with married parents (Figure 2). Rates of employment-based coverage were higher for married-parent families (32 percent versus 20 percent), but the difference in employment-based coverage was smaller than the difference in rates of public health care coverage. Regardless of marital status, few low-income families received coverage through either direct-purchased or mixed health care plans.
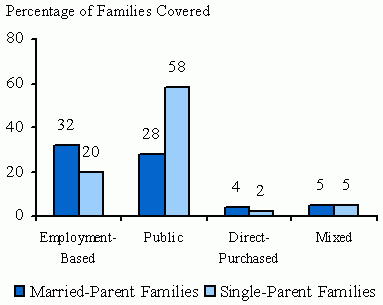
Source: Annual Social and Economic Supplement (ASEC)
to the Current Population Survey (CPS), 2004.
Notes: Limited to families with health care coverage for all family members.
Rates for source of coverage do not sum to overall coverage rates (Table 2)
because some families have more than one coverage source.
Racial and Ethnic Differences in Coverage Rates
The relationship between marital status and family health care coverage differs among racial and ethnic groups.
Among whites, the percentage of families with any type of full family health care coverage (Table 3) is higher for married-parent families (90 percent) than for single-parent families (83 percent). Among Hispanics, however, single-parent families have higher coverage rates than married-parent families (69 percent versus 50 percent). The percentage of African-American families with full family health care coverage does not differ by marital status.
| Coverage Type and Racial/Ethnic Group | Percentage of Families Fully Covered | |
|---|---|---|
| Married-Parent Families | Single-Parent Families | |
| Any Type | ||
| Whites | 90 | 83 |
| African-Americans | 82 | 81 |
| Hispanics | 50 | 69 |
| Public | ||
| Whites | 10 | 34 |
| African-Americans | 16 | 48 |
| Hispanics | 10 | 41 |
| Employment-Based | ||
| Whites | 77 | 46 |
| African-Americans | 65 | 32 |
| Hispanics | 36 | 26 |
| Source: Annual Social and Economic Supplement (ASEC) to the Current Population Survey (CPS), 2004. Notes: Estimates of direct-purchased and mixed health care coverage are excluded from this table because rates for these coverage types are less than 10 percent for all racial/ethnic groups. The estimates for whites and Africans are limited to non-Hispanics in these groups. For married-parent families, the estimates are limited to same-race couples. | ||
Hispanic families with married parents have the lowest rates of full family health care coverage.
In 2003, the percentage of married-parent families with health care coverage for all family members (Table 3) was lower for Hispanic families (50 percent) than for African Americans (82 percent) and whites (90 percent). Almost all of this difference is due to low rates of employment-based health care coverage among Hispanic families (36 percent coverage for Hispanics versus 65 percent for African-Americans and 77 percent for whites). By contrast, rates of public health care coverage for married-parent families were similar regardless of racial/ethnic background.
Rates of partial family health care coverage are higher for Hispanic families than for African Americans and whites.
In 2003, about 40 percent of married-parent Hispanic families had health care coverage for some but not all family members, compared to 8 percent for married-parent white families and 14 percent for African American families with married parents (Figure 3). Rates of partial health care coverage were also higher for single-parent Hispanic families (24 percent) than for African Americans (16 percent) and whites (14 percent). These differences in rates of partial family health care coverage are due in part to the lower rates of full family health care coverage among Hispanic families (Table 3).
Figure 3
Rates of Partial Health Care Coverage Among Families with Children,
by Marital Status and Race/Ethnicity, 2003
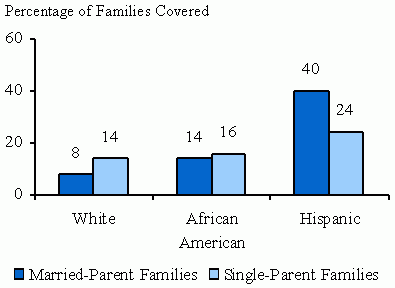
Source: Annual Social and Economic Supplement (ASEC)
to the Current Population Survey (CPS), 2004.
Note: Partial health care coverage means that some
but not all family members had coverage.
Summary
The relationship between marital status and family health care coverage is complex. Similar overall coverage rates among married-parent and single-parent families mask important differences in source of coverage and the proportion of family members covered. The relationship between marital status and health care coverage also differs by income level and racial/ethnic group. Key findings from this analysis include the following:
- Overall rates of health insurance coverage are similar for married-parent and single-parent families.
- Rates of employment-based health care cover-age are higher for married-parent families, whereas rates of public health care coverage are higher for single-parent families.
- Among low-income families with children, the percentage of families in which every family member has coverage is higher for single-parent families than for married-parent families.
- The relationship between marital status and family health care coverage differs by racial/ethnic group. Among Hispanics, coverage rates are higher for single-parent families than for those with married parents. Among whites, however, married-parent families have higher coverage rates.
- The percentage of families with health care coverage for some but not all family members is higher for Hispanics than for members of other racial/ethnic groups, regardless of marital status.
- Racial/ethnic differences in the relationship between marital status and health care coverage primarily reflect low rates of employment-based coverage among Hispanic families.
The findings presented in this brief are based on data from a single time point and do not adjust for differences in income levels, employment rates, job characteristics, education levels, and other demographic characteristics between single-parent and married-parent families. Therefore, any association between marital status and health care coverage identified in this analysis should not be interpreted as implying a causal link. Additional research based on longitudinal data is needed to determine the causal effect of marital status on family health care coverage apart from the other factors that distinguish married-parent and single-parent families.
References
DeNavas-Walt, C., B.D. Proctor, and J. Smith. "Income, Poverty, and Health Insurance Coverage in the United States: 2006." U.S. Census Bureau, Current Population Reports, P60-233. Washington, DC: U.S. Government Printing Office, 2007.
DiJulio, B. and P.D. Jacobs. "Change in the Percentage of Families Offered Coverage at Work, 1998-2005." Menlo Park, CA: The Henry J. Kaiser Family Foundation, July 2007.
Dubay, L., J. Holahan, and A. Cook. "The Uninsured and the Affordability of Health Insurance Coverage." Health Affairs, vol. 26, no. 1, November 2006, pp. w22-w30.
McLanahan, S., and G. Sandefur. Growing Up with a Single Parent. Cambridge, MA: Harvard University Press, 1994.
Waite, L., and M. Gallagher. The Case for Marriage. New York: Doubleday, 2000.
Wood, R., B. Goesling, and S. Avellar. "The Effects of Marriage on Health: A Synthesis of Recent Research Evidence." Princeton, NJ: Mathematica Policy Research, Inc., June 2007.
Study Methods
| This brief is based on secondary data tables provided to Mathematica Policy Research, Inc. (MPR) by the Office of the Assistant Secretary for Planning and Evaluation (ASPE). The tables are based on survey data from the 2004 Annual Social and Economic Supplement (ASEC) to the Current Population Survey (CPS), a nationally representative survey of the non-institutionalized U.S. population conducted annually by the U.S. Census Bureau. The data were collected from February through April of 2004 but assess rates of health care coverage for the calendar year 2003. For this analysis, we focused on families with children under age 18 who were living with their biological parents, adoptive parents, or stepparents.
In comparing differences in rates of health care coverage between married-parent and single-parent families, we excluded data for the approximately 5 percent of households headed by cohabiting parents, because rates of health care coverage are very different for families headed by cohabiting parents than for other families with children. For similar reasons, we also excluded data for the less than 4 percent of families headed by parents who were married but separated. The estimates for single-parent families include parents who were widowed, divorced, or had never been married. Because families can have more than one source of health care coverage, the estimates for source of coverage (Figures 1 and 2) are not mutually exclusive and therefore do not sum to the totals for overall rates of health care coverage (Tables 1 and 2). For the estimates of health care coverage among low-income families, the sample is limited to families with incomes below 200 percent of the federal poverty level. For the estimates of racial/ethnic differences in coverage rates, the figures for African-Americans and whites are limited to non-Hispanics in these groups. For African-Americans, the figures exclude people who reported their race as African-American in combination with some other group. The estimates of racial/ethnic differences for married-parent families include only same-race couples. In the data tables provided to MPR, the estimates of coverage rates through public health care programs including Medicaid and the State Children's Health Insurance Program (SCHIP) were adjusted for underreporting of public health care coverage in the CPS (DeNavas-Walt et al. 2007, p. 18) using the TRIM3 microsimulation model. The purpose of the adjustment is to align the survey estimates of public coverage with program statistics on persons who were enrolled in Medicaid or SCHIP at any time during the calendar year. The adjustment increases the survey estimates of the percentage of families with public health care coverage and reduces the estimates of families who were without health care coverage for the entire year. Alternative adjustment procedures may yield different estimates (Dubay et al. 2006), so readers should interpret these results accordingly. For more details on the TRIM3 simulation model, see http//trim3.urban.org/T3Welcome.php. |
|
The brief was written by Brian Goesling and Heather Koball, Mathematica Policy Research, Inc.(MPR) for the Office of the Assistant Secretary for Planning and Evaluation (ASPE), Office of Human Services Policy in the U.S. Department of Health and Human Services (HHS). |