
Executive Summary
The focus of this study is on the key events that individual children may experience in the public child welfare service system. This report discusses the importance of this type of research, the issues that can be addressed with the information produced, an initial set of analyses addressing key questions in child welfare and an agenda for future work.
The child welfare system is split into two domains: 1) child protection, which receives and investigates reports of abuse and neglect and 2) child welfare services, which provides out-ofhome care, casework and other in-home or community based services. In this report, our goal is to create indicators across the two domains by linking data from the information systems of the two domains. We also hope to find comparability among children’s history patterns in both Illinois and Michigan.
The size of the population in this report is nearly 1.4 million children in Illinois and 800,000 in Michigan. Using methods to unduplicate counting across the system, these numbers are children and not events in the system. The major difference in this work compared to most other work done at the population-level, is that our unit of analysis is the child across years and not a child or a child-event within a particular year.
Main Findings
- Despite the concern around the high numbers of children being placed in substitute care, relatively few children who come into contact with the system actually enter substitute care. In Illinois, 7% of the first contacts between 1990 and 1994 resulted in a placement, and in Michigan 4% (1990-1993). The majority of children who are placed are those with either substantiated investigations or those who enter the system without an investigation.
- In both states, about two-thirds of the children who have first contacts with the state never experience a substantiated allegation of abuse or neglect in their first contact or any subsequent contact during the period of our study. In two-thirds of the cases, investigators found no evidence of abuse or neglect.
- Of the children substantiated for abuse or neglect, 8.5% are placed in Michigan and almost 14% in Illinois. Fewer than one half of a percent of the children with unsubstantiated cases are placed.
- Placement into substitute care often varies by the type of reported abuse or neglect.In both states, the children who are substantiated cases of social neglect and physical or medical neglect are the most likely to be placed in foster care (18% in IL, 12.5% in MI).
- Placement may also differ by geographic location within states. For example, Chicago has a much greater placement rate for socially neglected children (31%) compared to the balance of Illinois (12%), and the balance of Michigan has nearly twice the placement rate for physically neglected children as Wayne County.
Child Welfare Service Histories
Introduction
The focus of this study is on the key events that individual children may experience in the public child welfare service system. The system includes both the government agency responsible for investigating and responding to child maltreatment and those private agencies that contract with the government agency to provide services. This report discusses the importance of this type of research, the issues that can be addressed with the information produced, an initial set of analyses addressing key questions in child welfare and an agenda for future work. This report is very much an introduction to the topic and only begins to address key questions around the careers of children across the entire child welfare system. It is in response to the conclusion of The Panel on Research on Child Abuse and Neglect that studies on this topic have the problems of lack of comparable data because of the variation of policies from state to state; a lack of explication of those policies; and the inability to disentangle aggregate data into its components which would allow making the results more comparable.
Background
The child welfare system is split into two domains: 1) child protection, which receives and investigates reports of abuse and neglect and 2) child welfare services, which provides out-ofhome care, casework and other in-home or community based services. These two domains have been kept administratively separate at the federal, state, and local levels for at least the last 25 years. The separation is based on the belief that those investigating the occurrence of child abuse or neglect should not also be providing services, and vice versa, since it could compromise each activity, i.e. families being investigated” by one worker are less likely to be receptive to receiving help” from the same worker.
While one can argue about the effectiveness or efficiency of splitting investigative reporting and service provision functions into the two domains, a definite consequence of it has been that the experiences of children (either individually or in the aggregate) have not been well described. This is due to the fact that a linkage between the two systems, either organizationally or within the data system, has never been made. A fair amount is known within child protection from the NCANDS project about the number of children investigated, the reasons for the investigations and the percent which are substantiated. Similarly, a fair amount is known in child welfare about the number of children receiving services or placed in foster care and the outcomes of those services. But little is know about children’s combined experiences in the two domains.
Because of the separation of these two functions both in practice and in objective, separate information systems or databases have been set up to track the children and families in each area. In many states, identification numbers are also different in order to keep the two functions separate. Our work attempts to overcome the consequences associated with these administrative obstacles. This study utilizes record-matching techniques, which allow us to connect records from two different information systems at the child and family level.
Our work is in contrast to the National Child Abuse and Neglect Data System (NCANDS) and the Adoption and Foster Care Analysis and Reporting System (AFCARS), the efforts aimed at collecting data at the national level on maltreatment reports, and foster care and adoption, respectively. The unit of analysis in each of these is the individual event, either the report or the foster care receipt. Our unit of analysis is the child, and in some cases, where it makes sense, the family. Also, while we attempt to look at children longitudinally, over a number of years, both NCANDS and AFCARS focus on events experienced during a particular time frame, either a year or a quarter. In both of these systems, there are attempts to fully describe the event of interest, but the ability to do so is limited because of state information system design issues, which includes how new cases are identified, how data is collected, how it is maintained and the unit of analysis.
Research Questions
Linking the two systems provides answers to simple questions about the experience of individual children in the child welfare system, which in many cases have never been answered. When one lists these questions and then lists the questions for which answers are usually produced, one can more easily identify how this study differs from previous ones. It is very important to note that the “usual” questions and answers are extremely important ones for the management and operations of the child welfare system. The questions addressed in this study are posed from the perspective of the child, the child being the unit of analysis. This study’s questions are in bold below.
What is the basic flow of children through the child welfare system?
Usually the questions that are answered, quite independently, are:
- How many reports of child abuse or neglect in a particular year, and;
- How many placements are made in a particular year?
What percentage of children in the general population have contact (investigation or service) with the child welfare system in a particular year that are not known to the child welfare system already?
Usually the question that is answered is:
- How many reports are there per 1000 children in the population? Since children may have multiple reports within a year and across years, the reports per 1000 children rate is an inflated indicator of how many children are being reported.
Of children who have contact with the child welfare system, how many are placed into foster care?
Usually the question that is answered is:
- How many foster care placements are made in a particular year independent of how many children actually are represented in those placements?
Of those children who are investigated, what percentage are substantiated?
Usually the question that is answered is:
- How many reports are substantiated? What is usually reported is the number of reports that are substantiated, not the number of children.
Of children who are investigated for abuse or neglect, how many are placed in foster care and how does it vary by whether or not the report is substantiated?
Usually the question that is answered is:
- How many protective custodies are taken in a particular year? Protective custodies are only one type of placement that occurs and some of these are "vacated", which means that the child actually goes home after a couple of days.
How does placement into foster care vary by the type of initial abuse or neglect allegation?
Usually the question that is answered is:
- What are the reasons that children enter foster care? Since child welfare service tracking systems are separate from child protective service systems, the reason for placement that is recorded may not be the same as the allegation that originally brought the child to the attention of the child welfare system.
Previous Child Welfare Population Research
In addition to this problem of linking across the two domains, there is also the fundamental problem of how little population-level child welfare statistics have been done. Most research and analysis is not longitudinal and only counts children or cases during a period of time. Neither does most research unduplicate to the child or family level. Without a method for unduplicating them, multiple reports for the same child being counted within a year may result. Also, on the service side, much of the reporting is for a particular point-in-time, which mixes children who have been in the system from 1 day with those who have been in the system for up to 18 years. This point-in-time research is extremely important for administrators and service providers as it tells them the characteristics of children that must be served at a point in time, but it does little to show the outcomes for children who have either been in the system for varying amounts of time or who enter because of different reasons.
There are numerous reasons for the absence of longitudinal, child-level, population-wide work in addition to the historical separation between the two systems and a lack of an ID link between the two. The simple volume of data which one must process and analyze to understand the experiences of the populations of children in both domains is so large that it has been nearly impossible and exorbitantly expensive to compute without the recent decrease in the cost of computing and increase in computing power. Also, states have been unwilling to share this data without extensive confidentiality agreements that often take months and sometimes years to develop. These factors, in addition to poor documentation, often provided obstacles that were too difficult to overcome. Finally, the complexity of analyzing sequences has only recently been addressed with methods of pattern matching. This study utilizes these methods to analyze the results.
The information from this type of analysis is important for a number of reasons that respond to today’s child welfare system challenges including:
- Outcomes of service - linking future events (e.g. reunification or adoption) to the initial events that led to intake.
- Managed care - understanding service histories are critical to having good information to both plan and implement managed care around foster care or other services that children and their parents may receive while in the child welfare system.
- Family Preservation - Understanding the front end of the child welfare system is necessary so that family preservation services can be designed more effectively through more effective triage and resources allocation.
- Children who are not reported as abused or neglected - The percent of children who are in the child welfare system for a reason other than abuse or neglect varies over time. Depending on the availability of resources and the "policy" environment at a point in time in a state, these children may be more or less welcome in the foster care system.
This report
In this report, we attempt to address some of the gaps in knowledge that have resulted from the split between child protection and child welfare services by comparing child welfare system data from two states (Illinois and Michigan) and sub-populations within those states. We will focus on the indicators which we can make comparable in the two states. Our long term goals include analyzing each state separately in order to illuminate important issues about child and family experience with the child welfare system that are unique to each state.
Comparability means that the data in each state has similar definitions. Making data comparable is a time-consuming task, requiring deep understanding of each of the jurisdictions which are to be compared. There is variation in how and where states keep certain pieces of information in their data systems about the service events the children experience, and it often takes considerable detective work to determine whether data items are the same across states and often within them.
Method
The basic method of this study is the aggregation of the investigative and service events for a particular child into a sequence of events that they experience across the system. We accumulate events so that, for each child, we have the sequence of events that he or she experienced.
We follow the child from first investigation through last event of his or her first episode of service in the system. A complete episode would include the following events:
- Birth of the child
- Investigation records to which the type of allegations and the results of investigations are attached. Investigations occur after a report of abuse or neglect to a state central registry (a “hotline”). Not all reports are investigated and those reports that are not investigated are usually not recorded. Often the results of investigations are recorded soon after the report, but they must be concluded within 21 days in Michigan and 180 in Illinois. An investigator can remove the children from the home immediately (protective custody) and place them in an out-of-home placement before the investigation is complete. (Juvenile court must rule on the appropriateness of the removal within 48 hours.) We use the date of the report as the date of the investigation. Since we are interested in whether a child is part of a substantiated report, we assign the outcome of the family investigation to the child.
- Case openings and closings for the child occur when the child is going to be placed in an out-of-home placement (the vast majority) or when the child is going to be the focus of some intensive in-home service.
- Out-of-home care placements include foster family care, kinship care, specialized foster care, group homes, shelter care, residential care and other out-of-home placements (e.g. hospitalization) that the child may experience while in the custody of the state.
Of course, all children may not experience each of the events. We follow each child through all of his or her events until she or he has experienced a complete episode.
All of the events are merged into one file and the characteristics of child, caretaker or family are attached to these events. From the series of events that each child has experienced, we create a sequence of events. We then count how many children experience each type of sequence and cross-classify these by independent variables (region, year, type of initial allegation). The children are classified into cohorts by the year of their first contact with the system. In our database for this study, we include children from the 1990-1994 cohorts and follow their experiences through the end of 1994.
When tracking children from 1990 to 1994, unless otherwise noted, it is important to note that for each subsequent cohort, there is one less year of follow-up time that we have in our database. For children who had their first contact in 1990, there is follow-up through 1994. For children who had their first contact in 1994, we only look at that year’s subsequent events for that child. To adjust for this, we have also analyzed our data for all of the events that children experience only one year after their first contact with the system.
Because unsubstantiated records are expunged from the system, in compliance with state law, meaning that all identifying information on the records of the involved individuals is deleted, if a child does not have a substantiated investigation previous to an unsubstantiated one, that child may be double counted over a period of time. If a child experiences two unsubstantiated reports within a short period of time (usually less than a month), the child will likely be double counted. Also, if a perpetrator requests that the record not be expunged, because he or she wants to prove harassment on the part of a reporter, a child’s unsubstantiated reports will also be “trackable” over a longer period of time. The privacy concern is that states do not track perpetrators who have not been involved in substantiated cases.
Child welfare case opening refers to how many children have case openings of their own. This is the least comparable event in our report, since case opening is very much an administrative function and because families can also have case openings under which children can receive services. In Illinois, we are able to track family case openings for each child, while in Michigan, there is no source for such information. Thus, this will be an instance where separate analyses will have to be done for each state.
There are cases which come into the child welfare services domain without first experiencing an abuse or neglect investigation. These are cases in which for some other reason, the child and parents cannot live together. These reasons include the child’s behavior (children too young to be incarcerated), dependency (those cases in which the child may be an orphan or the parent in institutionalized) and, in some cases, status offenders. Since the practice around children entering child welfare services without an abuse or neglect report is highly variable from one county to another, not to mention one state to another, an argument could be made to drop these children from the study altogether. However, since these children are receiving service from the child welfare system and they do represent a sizable portion of the child welfare caseload, we include them.
Given that some children can have upwards of 20 either substantiated or unsubstantiated investigations and 5 case openings and 5 placement spells, the possible combinations that we have put together are in the thousands. We must make certain assumptions about types of cases in order to reduce our analytic units to a reasonable number.
We have taken the string of investigations that children experience and reduced them to three types. The first grouping is only one substantiated investigation with any number of unsubstantiated investigations. The second grouping is 2 or more substantiated investigations and any number of unsubstantiated investigations. The third is any number of unsubstantiated investigations. These investigations all have to occur before a case opening, which must occur before an out-of-home placement. Investigations that happen after a case opening or out-of-home placement constitute another type of sequence or maltreatment while in foster care.
In Michigan, the 1992 and 1993 cohorts’ placement figures will increase significantly since we could not obtain 1994 placement data from the state of Michigan. Children from the 1992 and 1993 cohorts could be placed at any time in the future. In 1992, there was a change in policy in Michigan, where the state had to inform the perpetrators of alleged child abuse or neglect. While a decrease in the number of substantiated reports is seen at that time, it is unclear what proportion is due to the follow-up period being short or due to the change in policy. With additional follow-up, the reason will become clearer.
Findings
Structure of the answer to each question
Each of the sections will discuss a comparison of Illinois and Michigan - not only the numbers, but the different ways in which practice and policy affect the experiences of children. The answer to the question will come first. We will study children and families who came into contact with the system for the first time from 1990 to 1994 (trend). We will compare the major urban area (Chicago in Illinois, Wayne County in Michigan) to the balance of the state. We will also analyze the sequences by differences in initial allegation type (sexual abuse, physical/medial neglect, social neglect/abandonment, other abuse). Subsequent to the statistics, there will be a short discussion of policy and practice issues.
What percentage of children in the general population have substantiated abuse or neglect allegations for the first time in a particular year?
We find that 0.91% in Illinois and 0.85% in Michigan of the children 0-19 years of age had substantiated abuse or neglect allegations for the first time in 19901. When one compares the major urban area and the balance of the state, a different picture emerges. In Chicago, 1.52% of the children in 1990 were a newly substantiated case of child abuse or neglect, while only 0.72% of the children in the balance of Illinois fell into this category. Thus, twice as many children are being substantiated in Chicago compared to the balance of Illinois. However, in Michigan the difference is much less, with 0.92% of the children in Wayne County and 0.81% of the children in the balance of Michigan being a newly substantiated case in 1990.
Discussion
One must look to the child protective side of the child welfare system for possible explanations of the difference between Chicago and other three regions (balance of Illinois, Wayne County and balance of Michigan. Possible explanations include a greater maltreatment in certain sub-populations (Chicago) and an environment of more surveillance and reporting by reporters, (police, medical personnel, teachers and neighbors) with greater pressures to substantiate allegations of abuse and neglect.
Given that the socioeconomic and demographic characteristics of Chicago and Wayne County are so similar, it is unlikely that there is greater maltreatment in Chicago. Thus, one must further investigate the possibility that the environment is the cause of this must be studied further. Such a study is beyond the scope of this report. However, in Illinois, particularly in Chicago, a great deal of media attention is paid to the issues of child abuse and neglect and foster care. (A comparative study of media attention has never been done, thus a statistical analysis of media attention is not available.) It may be that public vigilance is greater in Illinois, particularly in Chicago, resulting in more media coverage. Illinois medical personnel are also required to report all confirmed cases of illegal substances in a child’s urine. All of these substance-exposed infant cases are substantiated cases of neglect.
Finally, Michigan’s AFDC benefits are clearly more generous than that of Illinois’s and may account for a large fraction of the difference since most experts believe that many families come to the attention of the child welfare system because of reasons associated with poverty. While difficult to prove without a more rigorous experimental design, more generous benefits may act on the margin to keep certain families from being reported and substantiated for child maltreatment. It may be that this effect is different in Chicago and the balance of Illinois.
Of children who have contact with the child welfare system, how many are placed into foster care?
While there is great concern around the high numbers of children being placed, in actuality, a small percentage of the children who come in contact with the child welfare system enter substitute care.A greater percentage of children who have contact with the child welfare system in Illinois are placed into foster care than those in Michigan (See Tables 1 and 2). Over 7% of all contacts with the child welfare system in Illinois resulted in foster care placements during the period from 1990 to 1994. In Michigan between 1990 and 1993, almost 4% of all children with initial contacts resulted in foster care placements. When the two states are compared by year, Illinois’ figures are 35% higher in 1990 and more that 100% higher in 1993.
Since the follow-up periods varied in each of the states, we controlled for this by simply looking at what happened one year after the first contact (See Tables 3 and 4). Between 70 and 80% of all placements we found in the longer follow-up periods occur within one year of the time of the initial contact. When using this period of time, we still find that the placement rate is 30% (in 1990) to 80% (in 1993) higher in Illinois.
Table 1.
Percent of First Contacts Placed: Illinois Full Histories
| 1990 | 1991 | 1992 | 1993 | 1994 | Grand Total | |
|---|---|---|---|---|---|---|
| Illinois | 7.7% | 8.2% | 7.4% | 7.4% | 6.8% | 7.5% |
| Chicago | 11.1% | 12.7% | 11.3% | 10.7% | 10.0% | 11.1% |
| Balance of Illinois | 5.7% | 5.9% | 5.4% | 5.6% | 5.0% | 5.5% |
Table 2.
Percent of First Contacts Placed: Michigan Full Histories
| 1990 | 1991 | 1992 | 1993 | Grand Total | |
|---|---|---|---|---|---|
| Michigan | 5.7% | 5.0% | 3.7% | 2.8% | 3.7% |
| Wayne | 5.1% | 4.6% | 3.2% | 2.4% | 3.2% |
| Balance of Michigan | 5.9% | 5.1% | 3.9% | 3.0% | 3.9% |
This one-year follow-up period also allows us to study the trends within each state. In Michigan, the percentage of children being placed is decreasing, while in Illinois, the placement rate within one year of initial contact increased through 1994.
Wayne County, which has slightly over a quarter of the initial contacts in the state during this period, has slightly lower one-year placement rates than the balance of the Michigan. Chicago, with about a third of Illinois’ first contacts, has a one-year placement rate 80% greater than that of the balance of Illinois. Chicago’s rate is also growing and driving the increase in the entire state. It grew from 7% in 1990 to 10% in 1994, with the 1994 figure certain to increase because of a censored follow-up period for the 1994 cohort of children with initial contacts.
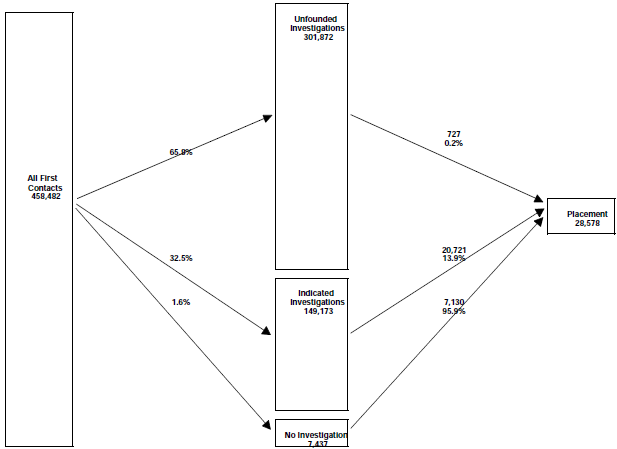
As one can see from Figures 3 and 4, the majority of the children placed are those with either substantiated investigations or those who enter the system without an investigation.
Table 3.
Percent of First Contacts Placed One Year Histories
| 1990 | 1991 | 1992 | 1993 | 1994 | Grand Total | |
|---|---|---|---|---|---|---|
| Illinois | 5.5% | 6.2% | 5.9% | 6.7% | 6.8% | 6.2% |
| Chicago | 7.0% | 9.3% | 8.4% | 9.6% | 10.0% | 8.9% |
| Balance of Illinois | 4.5% | 4.6% | 4.5% | 5.2% | 5.0% | 4.8% |
Figure 4a. MICHIGAN One Year Histories 1990-1993
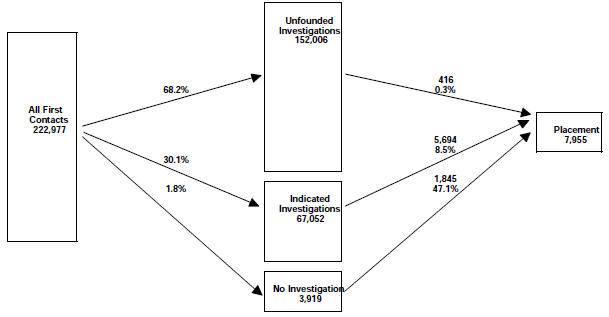
Figure 3a. ILLINOIS One Year Histories 1990-1994
More about the substantiated rates is discussed in the following section.
From 1990 to 1994, one fifth to one quarter of those children entering placement do so without initially experiencing an abuse or neglect investigation. The numbers in Michigan have been decreasing, while in Illinois there has been a slight increase. These children have entered placement without any previously substantiated case of abuse or neglect. These children, often put in the custody of the child welfare agency by juvenile courts to avoid incarceration or because of the need for children to live in foster care because of a parent’s inability to care for them because of illness, death or incarceration, do account for a high percentage of the foster care entry.
Discussion
Until both the child protection data and child welfare services data were combined, it was not possible to determine how many children came to the attention of the entire child welfare services domain for the first time in a particular year and who were not previously known to the system and then placed into foster care. This is because one never knew whether or not a child’s entry into one domain in a particular year had been preceded by an entry into the other domain. With a longitudinal design and data, one is able to properly classify children into their actual entry cohorts.
The placement figures are very consistent with the findings of the Multistate Foster Care Data Archive results, where the incidence rates of first entry to foster care for the entire population of children is from 15 to 75% greater in Illinois compared to Michigan from 1990 to 1993.
The issue of children who enter foster care without a child abuse or neglect report may be one that will become more important in the near future. These children are often not considered in discussions of the child welfare population, which has been dominated by the issues of child abuse and child neglect. Because of the increasing numbers of children entering foster care in Illinois, as well as the proportion, the Illinois legislature has passed legislation (implemented in July 1995) to exclude those children who are over 13 and have been adjudicated as being delinquent. While it is still unclear as to whether or not the legislation will have an actual effect on practice, it certainly symbolizes an effort (as may the decrease in Michigan), to remove the children without a substantiated report of abuse or neglect from the foster care population.
Of those children who are investigated, what percentage are substantiated?
In both states, about two-thirds of the children who have first contacts with the state never experience a substantiated allegation of abuse or neglect in their first contact or any subsequent contact during the period of our study . In two-thirds of the cases, investigators do not find evidence of abuse or neglect (See Table 4).
Table 5. First Contact Types by Finding Illinois & Michigan
Illinois
| Investigation Finding | 1990 | 1991 | 1992 | 1993 | 1994 | |||||
|---|---|---|---|---|---|---|---|---|---|---|
| Number | Percent | Number | Percent | Number | Percent | Number | Percent | Number | Percent | |
| Substantiated | 27,095 | 32.7% | 29,073 | 33.0% | 31,100 | 33.3% | 31,400 | 34.0% | 30,505 | 32.3% |
| Unsubstantiated | 55,807 | 67.3% | 58,906 | 67.0% | 62,249 | 66.7% | 61,017 | 66.0% | 63,893 | 67.7% |
Chicago
| Investigation Finding | 1990 | 1991 | 1992 | 1993 | 1994 | |||||
|---|---|---|---|---|---|---|---|---|---|---|
| Number | Percent | Number | Percent | Number | Percent | Number | Percent | Number | Percent | |
| Substantiated | 10,577 | 33.8% | 10,684 | 35.8% | 11,694 | 36.1% | 11,649 | 35.9% | 11,685 | 34.0% |
| Unsubstantiated | 20,701 | 66.2% | 19,197 | 64.2% | 20,659% | 63.9% | 20,835% | 64.1% | 22,681 | 66.0% |
Balance Of Illinois
| Investigation Finding | 1990 | 1991 | 1992 | 1993 | 1994 | |||||
|---|---|---|---|---|---|---|---|---|---|---|
| Number | Percent | Number | Percent | Number | Percent | Number | Percent | Number | Percent | |
| Substantiated | 16,538 | 32.0% | 18,389 | 31.7% | 19,406 | 31.8% | 19,751 | 33.0% | 18,820 | 31.3% |
| Unsubstantiated | 35,106 | 68.0% | 39,709 | 68.3% | 41,590 | 68.2% | 40,182 | 67.0% | 41,212 | 68.7% |
Michigan
| Investigation Finding | 1990 | 1991 | 1992 | 1993 | 1994 | |||||
|---|---|---|---|---|---|---|---|---|---|---|
| Number | Percent | Number | Percent | Number | Percent | Number | Percent | Number | Percent | |
| Substantiated | 19,122 | 36.0% | 19,029 | 34.0% | 15,624 | 27.9% | 13,277 | 23.7% | 5,701 | 16.5% |
| Unsubstantiated | 33,990 | 63.1% | 34,842 | 62.3% | 40,320 | 72.1% | 42,854 | 76.3% | 28,780 | 83.5% |
Wayne County
| Investigation Finding | 1990 | 1991 | 1992 | 1993 | 1994 | |||||
|---|---|---|---|---|---|---|---|---|---|---|
| Number | Percent | Number | Percent | Number | Percent | Number | Percent | Number | Percent | |
| Substantiated | 4,898 | 37.1% | 5,304 | 36.8% | 4,173 | 26.2% | 3,372 | 20.1% | 1,236 | 11.6% |
| Unsubstantiated | 8,304 | 62.9% | 9,109 | 63.2% | 11,770 | 73.8% | 13,440 | 79.9% | 9,381 | 88.4% |
Balance Of Michigan
| Investigation Finding | 1990 | 1991 | 1992 | 1993 | 1994 | |||||
|---|---|---|---|---|---|---|---|---|---|---|
| Number | Percent | Number | Percent | Number | Percent | Number | Percent | Number | Percent | |
| Substantiated | 14,224 | 35.6% | 13,725 | 34.8% | 11,451 | 28.6% | 9,905 | 25.2% | 4,465 | 18.7% |
| Unsubstantiated | 25,686 | 64.4% | 25,733 | 65.2% | 28,550 | 71.4% | 29,414 | 74.8% | 19,399 | 81.3% |
* Michigan CPS data complete only through August of 1994
Over the study period, the percent of initial contacts in a year that are substantiated remains remarkably consistent in Illinois. The differences between Chicago and the balance of Illinois are small. In Michigan, while the 1990 and 1991 substantiation rates were very similar to Illinois’s, 1992 and 1993 each showed a large decrease (more than 15%) from the earlier years, so that now only 25% of investigations are substantiated. We assume this was due to the policy requiring investigators to notify perpetrators and the investigators’ behavior in reaction to this policy. The decrease that we see statewide is more pronounced in Wayne County (more than 25% decrease) than in the balance of Michigan, which suggests that the impact of the policy change mentioned above on investigatory practice is less in the balance of Michigan that in Wayne County.
Discussion
Since, as will be discussed below, less than one percent of children’s reports that are unsubstantiated receive foster care, this is obviously a key gate-keeping mechanism. In all of these cases, the child welfare agency has sent an investigator to these homes and determines that there is no credible evidence for the substantiation of abuse or neglect.
If we had only studied 1990 and 1991, we would have put forward a hypothesis that a 33% substantiation percentage can be expected in these states and perhaps this might be a standard by which other states could gauge themselves. However, given the significant decrease in Michigan in 1992 and 1993, we now see how quickly this statistic can change due to a policy change. While we again have not done a study that proves that the decrease in substantiation rate is due to the change in notification of the perpetrator, few other types of changes (e.g. socioeconomic ones) could have such a great effect.
Of children who are investigated for abuse or neglect, how many are placed in foster care and how does it vary by whether or not the report is substantiated?
Statewide in Michigan, 8.5% of those children substantiated are placed in foster care, while in Illinois nearly 14% are placed, a nearly two-thirds larger placement rate (See Table 6). Less than half a percent of children with unsubstantiated cases are placed. Within states, Wayne County has a slightly lower placement rate than the balance of Michigan, while Chicago’s placement for substantiated cases is nearly twice that of the balance of Illinois.
Discussion
Given the somewhat higher substantiation rate in Illinois than in Michigan over this period of time, one might expect a lower percentage of placement for those substantiated in Illinois. This is because one might expect the severity of cases in Michigan to be greater, all else being equal. However, this is not the case. More children come to the attention of the child welfare system in Illinois, more are substantiated out of those that come to the attention and more are placed of those who are substantiated. The distribution of sequences that children experience in Illinois is certainly skewed toward more children being substantiated and placed.
Table 6. Percent of Children Investigated for Abuse/Neglect Placed in Foster Care
| Illinois 1990-1994 | Michigan 1990-1993 | |||||
|---|---|---|---|---|---|---|
| Total | Chicago | Balance | Total | Chicago | Balance | |
| Substantiated | 13.9% | 19.0% | 10.8% | 8.5% | 7.1% | 9.0% |
| Unsubstantiated | 0.2% | 0.3% | 0.2% | 0.3% | 0.4% | 0.2% |
* We do not have Michigan foster care placement data for 1994
How does placement into foster care vary by the type of initial abuse or neglect allegation?
In both states, the children who are substantiated cases of social neglect and physical or medical neglect are most likely to be placed in foster care (18% in IL, 12.5% in MI; see Table 7). When one compares the major urban area with the balance of the state, significant differences are seen. Chicago has a much greater placement rate for socially neglected children (31% in Chicago to 12% in the balance of the state). The balance of Michigan has nearly twice the placement rate for physically neglected children as Wayne County.
Table 7. Placement By Allegation Type For Substantiated Investigations Illinois & Michigan
Illinois
| No Allegation | Sexual Abuse | Physical Abuse | Phys/Med Neglect | Social Neglect | |
|---|---|---|---|---|---|
| Placed | 4.2% | 7.8% | 16.1% | 17.9% | 18.9% |
| Not Placed | 95.8% | 92.2% | 83.9% | 82.1% | 81.1% |
Chicago
| No Allegation | Sexual Abuse | Physical Abuse | Phys/Med Neglect | Social Neglect | |
|---|---|---|---|---|---|
| Placed | 6.4% | 10.0% | 24.7% | 17.0% | 31.0% |
| Not Placed | 93.6% | 90.0% | 75.3% | 83.0% | 69.0% |
Balance Of Illinois
| No Allegation | Sexual Abuse | Physical Abuse | Phys/Med Neglect | Social Neglect | |
|---|---|---|---|---|---|
| Placed | 2.6% | 7.2% | 13.0% | 19.1% | 11.6% |
| Not Placed | 97.4% | 92.8% | 87.0% | 80.9% | 88.4% |
Michigan
| No Allegation | Sexual Abuse | Physical Abuse | Phys/Med Neglect | Social Neglect | |
|---|---|---|---|---|---|
| Placed | 4.0% | 5.8% | 8.2% | 12.5% | 12.5% |
| Not Placed | 96.0% | 94.2% | 91.8% | 87.5% | 87.5% |
Wayne
| No Allegation | Sexual Abuse | Physical Abuse | Phys/Med Neglect | Social Neglect | |
|---|---|---|---|---|---|
| Placed | 2.9% | 4.5% | 8.2% | 8.7% | 13.2% |
| Not Placed | 97.1% | 95.5% | 91.8% | 91.3% | 86.8 |
Balance Of Michigan
| No Allegation | Sexual Abuse | Physical Abuse | Phys/Med Neglect | Social Neglect | |
|---|---|---|---|---|---|
| Placed | 4.4% | 6.0% | 8.1% | 15.0% | 12.4% |
| Not Placed | 95.6% | 94.0% | 91.9% | 85.0% | 87.6% |
Except for those children who do not have a specific allegation, in both Illinois and Michigan the lowest percentage placed are those children substantiated as being sexually abused. The placement rate for sexually abused children is low because, often, the perpetrator has been removed from the family’s home as the result of an arrest or a court order.
Appendix Tables 1, 2a-2c, and 3a-3c describe the allegation classification, and provide more detail on the relationship between initial allegations and substantiation.
Discussion
The difference in the placement rate between Chicago and the balance of state in Illinois is likely the population that enters kinship care in Chicago. Significant analysis of this issue has taken place in Illinois recently and it has been found that a great proportion of the children entering care are those who are reported by their grandparent for being abandoned by their parent. Recent legislation aimed at attempting to provide permanency for these children with relatives has been passed in Illinois in an attempt to address what some think is an inappropriate use of the child protective system.
1 We use 1990 because the decennial Census figures are available for that year, making the
calculations most accurate.
Implications
Similarities and Differences
In studies comparing two or more regions or sites, especially when not using an experimental design, one must often speculate as to the reasons for differences between the sites, simply because of not having data on all the possible explanations. In this study, we have attempted to explain differences, but there are limits due to the depth of our knowledge about practice, policy and administration of the child welfare system. We hope to increase our knowledge in the future to better explain some of the differences between Michigan and Illinois. We intend to use the expertise of practitioners, policymakers and administrators in the states we study and outside of those states to improve the relevance of the work.
Prevention and early intervention
The findings on the percent of children coming into contact with the system and the type of contact they have (often no substantiated cases of abuse or neglect) suggest that points of early intervention might be clearer than previously thought. It is generally believed that even families where there is a report but no substantiation of abuse or neglect may require additional support and in some cases a high level of intervention. Further work could help pinpoint those neighborhoods and types of families which might be good targets for prevention and early intervention services.
Response of the state
Understanding the flow of cases at each juncture can help characterize the service system of the state. The higher placement rates in Illinois with the higher first contact rates obviously result in more children going into placement, per capita in Illinois. However, if one state had a higher placement rate and lower first contact percentage, it may be that the actual per capita placement rate would be very similar in the two states.
Future Work
In this, our first report, we focused primarily on the first complete sequence. In future work, one could look at all sequences, which primarily entails looking at reentry cases and reabuse cases in greater detail. One could also explore adding other services beside casework and out-of-home care, e,g. various counseling, homemaker, family preservation and psychiatric hospitalization.
In addition to additional description of sequences, multivariate analysis should be undertaken to understand the factors that contribute to different outcomes. Such analyses would entail analyzing the characteristics of children, families and services that increase or decrease the probability of making a particular transition.
Small region analysis is necessary if one is to accurately understand the heterogeneity of the child welfare system. We commonly analyze the experiences of children in the child welfare system at the state level and incorrectly treat children as if they are all from the same geographic region. One could analyze the probability of making certain transitions in various types of communities. For example, is it more likely that a child will be substantiated for neglect in a community primarily consisting of unmarried, teenage mothers?
Conclusion
The biggest limitation in studying the sequences of services that children experience is how the data is collected by state agencies. The process that we have gone through in this study is not possible to accomplish in every state. However, the Federal government has given the states an opportunity and resources to address this issue through the State Automated Child Welfare Information System initiative. One of the areas the Federal government addresses in SACWIS is linking the two child welfare system domains.
Appendix
Data
Source of the data
The source of the data is the information systems of the Illinois Department of Children and Family Services and Michigan Department of Social Services. In Illinois, the child protection event data comes from the Child Abuse and Neglect Tracking System (CANTS) and the child welfare service events come from the Child and Youth Centered Information System (CYCIS). In Michigan, the child protection event data comes from the Protective Services Management Information System (PSMIS) and the child welfare service events come from the Children’s Services Management Information System (CSMIS).
Normalization of the data
Once the data were cleaned (primarily dates that were out of range), they were stored in a normalized relational database. Data in relational databases are kept in tables” which in this case stored attributes of children, investigations, child welfare cases, and placements separately. This structure allowed us a great deal of flexibility in our analyses.
Separation into events
Once our database was built, the first decision that was made was to store children’s service experiences as events. We created an event table and inserted events of interest from data records in other tables in our database. In this table, each record contained a child’s ID, date of event, and event type. Each child’s events were in order by date. The following outlines our event types and the corresponding dates that were used:
| Event Type | Event | Event Date |
|---|---|---|
| 0 | Birth | Birth Date |
| 1 | Indicated Investigation,No Foster Parent Involvement | Invest. date |
| 2 | Indicated Investigation, Foster Parent Involvement | Invest. date |
| 3 | Unfounded Investigation, No Foster Parent Involvement | Invest. date |
| 4 | Unfounded Investigation, Foster Parent Involvement | Invest.date |
| 5 | Pending Investigation (Illinois Only) | Invest. date |
| 6 | Child Welfare Case Opening | Case Opn date |
| 8 | Placement Beginning | Plcmnt bg date |
| 9 | Placement Ending | Plcmnt en date |
| B | Child Welfare Case Closing | Case Cls date |
Determining the comparability of the datasets & Comparing events across states
We began by selecting children who first entered the Illinois or Michigan systems in 1990 or later. Because of purging protocols, we would not be certain that we were working with complete information if we began before 1990.
Although both states’ data contained the events named in the above section, the substantive meaning of these events was not always the same. We were able to clarify these differences after studying the documentation and much interaction with state staff.
Investigation events have similar meanings in the two states. When a report of abuse/neglect is made, both Illinois and Michigan have 24 hours to begin an initial investigation. The information gathered during the investigation is evaluated to assess the risk to the child and a decision is made as to its disposition within 21 days in Michigan and 60 days in Illinois (with the possibility of a 30 day extension). In both cases, substantiation is based on risk of harm to the child.
Illinois and Michigan differ in how they code allegations associated with investigations. Illinois specifies each harm, while Michigan categorizes theirs into seven abuse and five neglect codes. In order to compare the two states, we collapsed Michigan’s codes into two abuse and two neglect categories: sexual abuse, physical abuse, physical/medical neglect, and social neglect/abandonment and used these for our analyses. (See Appendix Table 1 for allegation comparison). Because Michigan does not retain allegations for unsubstantiated investigations, we were only able to analyze allegations associated with substantiated investigations.
The significance of a child welfare case opening also differs in the two states. In Illinois, case opening marks the beginning of service provision to the child or family since no services are provided in child protection. In Michigan however, services such as counselling or substance abuse treatment ( "protective services") are provided within the child protection domain. We were able to identify these cases but since Illinois had nothing comparable, we did not include these services as events in our analyses. In light of these differences, case openings cannot be assigned the same significance.
Placement in both Illinois and Michigan refers to out of home substitute care placements.
Data linking and merging
Probabilistic record-linkage
The most reliable means of matching records proves to be a process called probabilistic record-matching, first developed by researchers in the fields of demography and epidemiology (Newcombe, 1988; Winkler, 1988; Jaro, 1985, 1989; Baldwin, Acheson, & Graham, 1987). Probabilistic record-matching is based on the assumption that no single match between variables common to the source databases will identify a child with complete reliability. Instead, probabilistic record-matching calculates the probability that two records belong to the same child using multiple pieces of identifying information. Such identifying data may include name, birthdate, gender, race/ethnicity, and county of residence. When multiple pieces of identifying information from two databases are comparable, the probability of a correct match is increased. A few commercial software programs perform record-matching and can be customized to perform matches between two databases.
Once a match has been determined, a unique number is assigned to the matched records so that each record can be uniquely identified. The end result of computer matching is a new file, in our parlance a "link-file", which contains the unique number assigned during matching, the child's identifying data (name, birthdate, race/ethnicity, gender, and country of residence), and all the identification numbers assigned by agencies from which the child received service. For example, if Janie Smith has been a foster child and received mental health services, the new file will contain her foster care and mental health ID numbers, her new unique number, and her name, birthdate, race/ethnicity, gender, and county of residence. In the aggregate, link-files serve to establish the relationships among data in source databases and provide a means of retrieving groups of records that meet specific criteria.
Child protection and child welfare data are stored in two separate systems in Illinois:
CANTS, the Child Abuse and Neglect Tracking System, and CYCIS, the Child and Youth Centered Information System. Since children are identified by different IDs in CANTS and CYCIS, we have applied probabilistic record-linkage techniques to identify the same child in both systems. Children are matched on a host of variables (i.e. name, address, date of birth, sex and race) each of which can be given different weights to allow for data entry error.
Michigan assigns a recipient ID to every person receiving state services. As a result, its child protection and child welfare data systems were already "linked".
Data analysis
Pattern-matching
In this analysis we looked at children’s child welfare careers as a series of "patterns". We created a string variable based on a child’s events, in which each of the characters represented a certain type of contact (event) with the child welfare system. We called this string the child’s "history". The histories were then analyzed using pattern matching techniques that we developed using the AWK programming language. This methodology allowed us to examine the varying paths children take through the child welfare system.
Reducing the number of unique patterns
Because each child’s situation is unique, there are countless variations to their histories or the "paths" they take through the system. The challenge in this analysis was to find comparability among the variation. In practice, what this meant was that we were forced to emphasize certain events over others.
In this case, we knew that we wanted to look at the progression of events that led to child welfare case opening and placement. A child can have any number of investigations before a case opening, but we knew from policy and preliminary analyses that for most, a case would not be opened as a result of an unfounded investigation. Therefore we were able to make the decision to ignore unfounded investigations in our history strings when they were interspersed with indicated investigations. We then decided that there was a significant difference between having only one indicated and having multiple indicated investigations before case opening, and that we would treat these as two separate pattern categories.
Even though we were not interested in unfounded investigations when there were indicated present, we were curious about what happened to children whose investigations were all unfounded. Therefore we included these as our third pattern of entry into the system.
The last way a child could enter the system was directly through child welfare service intake, without passing through child protection. Since these are mostly dependency and "behavior" cases, we decided it would be important to know how their subsequent histories differed from children who entered with an abuse or neglect allegation.
Entry Pattern Types and Descriptions
| Pattern Type | Description |
|---|---|
| A | Indicated Investigation, any number of unfounded |
| B | Indicated investigations, any number of unfounded |
| C | All unfounded/pending investigations |
| D | Case opening, no investigations |
Once the children had entered the system by any of the four pathways, our pattern matching program looked for a case opening immediately following the entry pattern. If it found one, it then looked after the opening for one or more indicated investigations, the beginning of a placement, one or more indicated investigations again, case closing and/or placement ending. The program would continue to look for these subsequent patterns until we had captured the child’s first full sequence or, the child’s history ran out of events.
Subsequent Pattern Types (the program cycles through these repeatedly)
| Pattern Type | Description |
|---|---|
| D | Case opening |
| D | At least one indicated investigation |
| F | Case Closing |
| G/H | Placement Beginning |
| I | Foster parent involved investigation |
| J | Placement Ending |
When the program finished, we were left with a condensed” pattern for each child that could be imported into a spreadsheet program and analyzed.
Description of Tables and Figures
Figures 1 and 2 describe the flow that we are comparing between Michigan and Illinois for the period 1990 through 1994. All first contacts refer to the number of children that came in contact with the child welfare system for the first time in this time period - in Illinois, nearly half a million and in Michigan slightly over a quarter million children. The second box refers to the outcome of the investigations and the number of children who have substantiated or unsubstantiated cases of abuse or neglect. The last box refers to how many children out of the those that had first contacts were placed in foster care.
Tables 1 and 2 provide a more detailed look at the flow of children through the child welfare system based on the type” of first contact with the system. First contact refers to the series of CPS events a child experienced from first investigation (if any investigation) to the beginning of CWS (if any). In these tables, there are no time constraints on child histories such that, if a child experienced a series of investigations and/or child welfare cases over the course of a 3 year period, all of the child’s events would be included in the numbers. Since the children who entered the system in 1993 and 1994 have not been in the system as long as those who entered in earlier years, their full” histories are not as comparable.
Tables 3 and 4 are also based on type of first contact. However in this case, child histories are limited to the events that occur up to one year from date of entry. This standardizes the histories so that we can compare children who entered in 1990 to those who entered in 1993.
Table 5 looks at the number of children whose first contacts were substantiated or unsubstantiated by year of entry into the system.
Table 6 looks at the number of children who came into the system with a substantiated or unsubstantiated investigation between 1990 and 1994 and were placed in foster care.
Table 7 examines the relationship between the allegation at first indicated investigation and the placement that immediately follows.