
Robert Goerge, Lucy Mackey-Bilaver, Bong Joo Lee, David Koepke and Allison Harris
University of Chicago, Chapin Hall Center for Children
"This report was prepared under grant #94ASPE266A between the U.S. Department of Health and Human Services (HHS), Office of Disability, Aging and Long-Term Care Policy (DALTCP) and the University of Chicago. For additional information about this subject, you can visit the DALTCP home page at http://aspe.hhs.gov/_/office_specific/daltcp.cfm or contact the office at HHS/ASPE/DALTCP, Room 424E, H.H. Humphrey Building, 200 Independence Avenue, S.W., Washington, D.C. 20201. The e-mail address is: webmaster.DALTCP@hhs.gov. The Project Officer was Kathleen Bond.
The opinions and views expressed in this report are those of the authors. They do not necessarily reflect the views of the Department of Health and Human Services, the contractor or any other funding organization.
I. INTRODUCTION
The objective of this research project was to describe the demographic characteristics and human service utilization of all children and adolescents who are identified as having a disability in Illinois, as well as to understand the stability of the care that they receive through childhood and adolescence. Given the recent changes in the Supplemental Security Income program for children and adolescents in the 1996 Welfare Reform legislation, the study can serve as a baseline to assess the impact of the changes on service provision to children and adolescents with disabilities.
Our specific aims for this study were: 1) To describe the trends in demographic characteristics of the disabled child population in Illinois; 2) To describe the pattern of movement and stability of care of disabled children across different service settings; 3) To describe the pattern of multi-service use of disabled children; 4) To determine the extent to which type of disability and demographic factors are related to multi-service use; 5) To demonstrate the utility of administrative data for advancing the state of knowledge on children with disabilities; and 6) To determine the policy implications of these findings.
Illinois provides a geographic unit that contains a range of environments, cultures, and socioeconomic statuses. Four and a half percent of our country's children live in Illinois, and their demographic characteristics are representative of the country overall as well as the larger states. For example, the racial/ethnic distribution of Illinois children is very similar to that of the United States as a whole (69% white in the U.S., 68% white in IL, and 14% non English-speaking in both the U.S. and Illinois). Illinois ranks in the middle third of states in percent of children living in poverty and in percent of children living with both parents.
This study is unique because it is based on statewide service data. All children in Illinois who are identified by a set of agencies as having a disability will be tracked through the use of the Integrated Database on Children's Services in Illinois (IDB), which has been shown to be a reliable source of data for policy makers at both the state and the Federal level. The IDB combines individual child and family level data from the late 1970's through the present and is updated at least yearly. The population under study are those children identified as having a disability from July 1, 1989 through June 30, 1994.
We begin the report with a short summary of the policy context during the time period and the data and methods used for the study. We follow this summary with a discussion of our results, both descriptive and multivariate. We have not fully analyzed the data prepared for this study and intend to use it in the future, not only as a baseline to follow up this population, but also to better understand the changes that we saw during the five year time period. We hope that the implications flow easily from these results and end with an implications and future work section.
II. POLICY CONTEXT
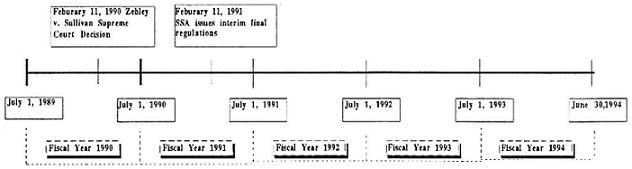
The time period analyzed in this study spans several major policy changes that affected publicly provided services to disabled children in Illinois and nationwide. The most significant of these changes was the implementation of the Supreme Court's decision in the Zebley vs. Sullivan case. The Zebley decision, which expanded the list of disabling impairments and included a functional assessment in the disability determination for children, significantly increased the number of children receiving SSI nationwide.
Medicaid funded services in Illinois were also under going changes throughout this time period. In May of 1992, mental health services reimbursed by Medicaid were expanded in Illinois through the implementation of the Medicaid clinic/rehab option. For the first time, individuals could receive an array of Medicaid reimbursed mental health services (i.e. case management, crisis intervention, mental health assessment) from community mental health centers. Managed care was also being phased in to primary health care programs reimbursed by Medicaid. In May of 1993, the Healthy Morns/Healthy Kids Managed Care Program began in the City of Chicago after being started prior to May of 1993 in the downstate regions of Illinois. These changes are reflected in our analyst . Whenever possible, we note the policy change as well as highlight how they affected the patterns of service receipt.
III. DATA--INTEGRATED DATABASE ON CHILDREN'S SERVICES IN ILLINOIS
One of the unfortunate consequences of administering services to children through more than one public agency is that information about children and youth receiving services from the state is scattered among the various agencies. The fact that each agency provides only a specified range of services to children and has limited responsibility toward them inevitably restricts each agency's view of the client and its knowledge of the client's history and participation in the service system as a whole. No public agency or other office of state government has been charged with the responsibility of gathering together all the information about children that is collected across the human services, and none of the agencies has routine access to information gathered and stored by the others.
The Illinois Integrated Database on Children and Family Services is a state-level, longitudinal, and relational database constructed out of administrative data gathered by public agencies serving children and families. The database tracks all child and family contact with the following programs and services: foster care, child abuse and neglect, special education, mental health, juvenile justice, Medicaid, Food Stamps, and Aid to Families with Dependent Children (AFDC). In the aggregate, these records represent all child contact with Illinois human services over the course of a decade and can be made to yield a detailed and comprehensive picture of children's service provision in the state.
Administrative databases constitute a rich though underutilized source of knowledge about the operation of the children's service system. What is especially important about these databases is that they document the characteristics of entire client populations, that they often preserve a wealth of information about each child, and that in many cases they extend back more than a decade. The utility of the database, and the kinds of analyses it can support, are greatly enhanced by linking together all records pertaining to each individual client, resulting in a complete record of that client's contact with the agency over the years. Each administrative database represents a complete, longitudinal record of the experiences of the entire population of children receiving service over the time span of the data.
A. Data Description
This section describes the datasets that have been integrated for this study, the nature or format of each of those datasets, and the variables that are available for analysis. We also discuss the reliability of the data.
Department of Public Aid, Client Database
Illinois Department of Public Aid maintains a client database that includes Aid to the Aged, Blind, and Disabled (AABD), Medicaid, Aid to Families with Dependent Children (AFDC), and Food Stamps. AABD is the specific program that we focused on for this study. As stated in the Department description, "AABD is specifically for people who are 65 or older, blind, or disabled (blind or disabled children are included). It is available to people who have applied for, or are receiving, a monthly SSI check from the Social Security Administration. It is also available to people who meet the age/disability criteria for SSI, but whose income is from Social Security or a different source." AABD receipt entitles the recipient to Medicaid in addition to supplemental cash assistance. The database contains demographic details (such as client's age, sex, and address), case opening and closing dates, family composition, level of need, and deduction and grant size.
Department of Public Aid, Medical Service Database
The Principal Investigator has requested (in November, 1990) and received access (in March, 1991) to the Medical Services database of the Illinois Department of Public Aid, the state agency that administers the Medicaid program in Illinois. Non-residential services included under Medicaid include, but are not limited to, assessment, treatment planning, medication, crisis intervention, day treatment, individual, family and group psychotherapy, community-based rehabilitation, intensive family-based services, case management developmental rehabilitation, and pre-hospital screening. "Medicaid" services reflect the full range of medical services provided to children by health care providers in Illinois; a "Medicaid" service simply refers to the method of reimbursement.
The quality of the Medicaid data, in general, is thought to be good. Since the records of the database are tied to payments made to providers, all services provided should be included. Also, since there are regular audits of this data for the purposes of data quality and fraud detection, we expect the data to be of good quality. Finally, automated "edit-checking" prevents wrong codes from being entered into the database.
Department of Mental Health and Developmental Disabilities
The inpatient system records the inpatient episodes of children, adolescents, and adults in the state facilities. The strength of the database is that it is longitudinal and that for some cases it may go back as far as five decades. The database contains the admission date, the movement date (if a change in setting occurred), the prior admission date, and the date of discharge. It contains important demographic information, behavioral characteristics, administrative data (e.g. unit, planning area), legal status and social security number.
The information in this database is believed to be reliable and can often be checked from the case files themselves. The database is useful for tracking admissions and readmissions, length of stay, specific diagnoses, and discharge status of children and adolescents that are hospitalized in DMHDD facilities. However, we do recognize that diagnoses are often used to get a child into an inpatient facility and may not be the result of a comprehensive assessment.
Illinois State Board of Education (Special education database)
There are two funding sources under which handicapped children and adolescents are served. The first is Public Law 94-142, which is the Education of the Handicapped Act. The second is P.L. 89- 313, the Education Consolidation and Improvement Act of 1981, which is the source under which children and adolescents are placed in residential care. These two funding sources are tracked separately. The Illinois State Board of Education (ISBOE) maintains a computerized child tracking system of children who receive special education services in the state of Illinois, the Funding and Child Tracking System (F.A.C.T.S.).
The F.A.C.T.S information system contains information on the child or adolescent's demographics, services received, primary, secondary and tertiary handicap, and type of facility in which service is provided. Since 1) the special education population is the largest population of children who are disabled, 2) most disabled children are first identified as such in the schools and 3) P.L. 94-142 puts the responsibility of serving all children with handicapping conditions aged 3-21 with the schools, this database is an important tool for counting children with specific handicaps and for identifying precursors to future problems.
B. Record Linkage Methodology
The databases of each agency were linked on the basis of common information on each of the individuals in each of the databases. Determining what data were necessary and reliable provided a challenge. This required extensive review of the existing data and cooperation on the part of the human service agencies to allow access to their administrative data.
Deterministic vs. Probabilistic Matching
The greatest technical challenge involved in creating an integrated database is accurately linking the records of individual clients across agencies. This process is complicated by the fact no single variable can be relied upon to establish the identity of a child from the records of various agencies. Though each child receiving a service is typically given an identification number (ID) unique to a particular program, each agency and department uses its own system of identification numbers. Indeed, a single agency may issue a single client more than one ID, since IDs may be assigned each time a case is opened or a child or family receives services. Other variables that might be used to establish an "all-or-nothing" match are equally problematic: even names and birthdates that "match perfectly" may refer to two different individuals, as a result of incorrectly entered data or other human error.
The most reliable means of matching records proves to be a process called probabilistic record- matching, first developed by researchers in the fields of demography and epidemiology (Newcombe, 1988; Winkler, 1988; Jaro, 1985, 1989; Baldwin, Acheson, & Graham, 1987). Probabilistic record-matching is based on the assumption that no single match between variables common to the source databases will identify a child with complete reliability. Instead, probabilistic record- matching calculates the probability that two records belong to the same child using multiple pieces of identifying information. Such identifying data may include name, birth date, gender, race/ethnicity, and county of residence. When multiple pieces of identifying information from two databases are comparable, the probability of a correct match is increased. A few commercial software programs perform record-matching and can be customized to perform matches between two databases. The software program called Automatch was used for this analysis.
IV. METHODOLOGY
A. Identification of Children with Disabilities
From each of the databases described above, the population of children with disabilities was identified. All children under the age of 18 at the beginning of state fiscal years 1990-1994 were identified as disabled if they were receiving services through special education, the Department of Mental Health and Developmental Disabilities (DMEDD) inpatient treatment, Assistance for the Aged, Blind and Disabled (AABD) disability programs, or Medicaid reimbursed services. Because individual level data on SSI receipt was only available to us for very recent time periods, children receiving AABD were used to approximate the SSI population in Illinois over the five fiscal years.1
Disability identification was based solely on program participation for children in special education, AABD, and DMH. The Medicaid reimbursed services data, however, contains data on services provided for preventative and well-child care as well as for the more serious inpatient and rehabilitative services. Identifying "disabled children" in this service data was not a straight-forward task. In order to use the least restrictive definition of disability, we selected children who demonstrated a disabling condition in one of three ways. First, we selected all children who had a non-institutional claim containing an ICD-9-CM (International Classification of Diseases Clinical Modification) diagnosis code that indicated a disabling condition according to the Social Security disability evaluation standards.2 Second, we selected all children who received a service under a category of service that indicated a special need. Finally, provider types that were associated with disabling conditions or conditions requiring rehabilitation were selected. A detailed description of the ICD-9-CM diagnosis codes used to map to the Social Security Administration's listing of disabling conditions can be found in Appendix A.
Each of the selection methods was designed to identify children eligible for SSI under the most current disability evaluation standards. We recognize that disability determination in children is a complex evaluation that does not depend on diagnosis or program service alone. We expect that our selection criteria err on the side of overestimating the disabled population. Throughout the analysis, the utilization of "Medicaid services" will refer only to Medicaid reimbursed services that indicate a disabling condition as defined by our selection criterion. Likewise, children referred to as participating in the Medicaid program will refer only to children receiving services specified in our selection criterion.
A description of the disabling conditions, categories of service, and provider types that we used in the selection and their prevalence can be found in table 1. Two of the ICD-9-CM diagnoses that are included in the selection were associated with a few restrictions. Asthma, for example, was only used identify a child as disabled when it was accompanied by two or more hospitalizations or three or more emergency room visits. Epilepsy was similarly conditioned on the presence of a hospitalization or three or more emergency room visits within the fiscal year. Inpatient hospitalizations (general, psychiatric, and rehabilitative) also had conditions that were necessary for the disability determination in our selection. Three or more inpatient hospitalizations within a fiscal year or one hospitalization that lasted for 20 days or longer indicated disability in this analysis.
From the ICD-9-CM selection, the significant increase in the number of children that were identified after FY 1992 was due mainly to the increased prevalence of developmental speech or language disorders and other mental disorders. This increased "prevalence" however was primarily due to expanded service availability, particularly for mental health services. Two provider types, mental health service providers and local educational agencies, served significantly higher number of children after FY 1992. Most children were selected by the ICD-9-CM diagnosis code on a particular claim rather than the category of service or provider type. Over time the number of children that met the selection criteria by the ICD-9-CM diagnosis code and category of service also rose significantly (Table 2). This was more likely to happen as services became increasingly available for diagnoses that fell within our selection criterion.
B. Study Time Frame
The state fiscal year was the unit of time selected to analyze the indicators of service provision. The primary reason for choosing the state fiscal year was that the special education program data only reflected a child's activity during a school year (September to June). The beginning and end of the state fiscal year (July 1 to June 30) brackets the entire school year. From each of the databases that were analyzed, we identified children receiving each service for fiscal years 1990 to 1994. The beginning of fiscal year 1990 (July 1, 1989) offered a time point nearly 2 years prior to the implementation of the Zebley decision while the end of fiscal year 1994 (June 30, 1994) provided three full years of post-Zebley follow-up.
 |
The time frame for this study allowed us to analyze five cross sections (FY 1990-1994) and four new entry cohorts (FY 1991-1994). By new entry, we are referring to children who were not participating in the previous year of disability services. We defined entry cohorts both by entry into any one of the four programs and by entry into a particular program. The cross-sections were analyzed in order to understand the prevalence of multi-service use among disabled children in Iffinois. By comparing indicators across time, we described the prevailing patterns of multi-service use. We also described the characteristics of children who use multiple services over the five fiscal years. Through the analysis of the new entry cohorts, we tracked program participation before and after the Zebley decision. In part, our findings reflect the dramatic change in program participation due to Zeble and the expansion of the role of Medicaid in non-traditional health care settings in Hlinois. Given the changes in SSI eligibility due to Zebley and the concern over the growing caseloads as expressed in the recent welfare reform legislation, the impact of multi-service use on the receipt of SSI was of particular interest. Using the risk population available to us within our data, we examined the incidence of AAED receipt while controlling for demographic characteristics and type of disability.
V. RESULTS
A. Children with Disabilities
The number of children who were identified as being disabled from each of the four databases is presented below. The overall number of disabled children identified in this analysis has increased over time from 259,113 children in FY 1990 to 277,689 children in FY 1994. This growth represents approximately a 7% increase. This growth occurred over a time when the AABD and Medicaid program populations were increasing steadily while the special education population, the largest of the four, was decreasing. Under out selection criteria, this population of disabled children represents approximately 8% of all children in Illinois.3
| Database | Number of Children | ||||
|---|---|---|---|---|---|
| FY 1990 | FY 1991 | FY 1992 | FY 1993 | FY 1994 | |
| AABD | 12,184 | 14,839 | 19,986 | 33,555 | 43,941 |
| Special Education | 228,762 | 229,015 | 240,417 | 217,946 | 198,020 |
| Medicaid Paid Claims | 34,541 | 39,225 | 45,038 | 56,063 | 87,764 |
| DMH Inpatient | 294 | 257 | 319 | 255 | 199 |
| All Disabled Children | 259,113 | 263,758 | 279,608 | 272,779 | 277,689 |
Demographic Profiles
In Illinois, each of the four programs that we examined served very different populations in terms of race/ethnicity, sex, and age (Tables 3-6). Children in the state AABD programs were most often African-American children and were increasingly so over time. Because AABD program participation should mirror SSI participation, we see an increase in the number of children served after Zebley implementation. The post-Zebley time period in Illinois shows increased participation of children of all ages. Special education serves the largest number of children with disabilities in Illinois. Nearly 2/3 of the children in special education are boys. Approximately 70% of the children were white in fiscal year 1990 but were more likely to be of African American or Hispanic origin over time. Children identified with disabling conditions in the Medicaid service data were distinct from the special education and AABD populations. Medicaid program children had very similar percentages of white and African-American children over time. Boys were slightly more likely to have been identified in this population in each of the fiscal years. The growth in this population over time had its biggest affect on the age distribution of children with disabling conditions. In fiscal years 1990 and 1991, our selection criterion identified infants 25% of the time. After FY 1992, the percentage of infant children that we identified decreased. Conversely, the percentage of school age children began to rise. The DME inpatient population is the smallest population examined in this study. Boys were slightly more likely to be among children served in DMH facilities as were white children over time. Children served in DME inpatient facilities were more often children over age 9.
Type of Disability
The administrative data on each of the four programs offered few program generated descriptors of the participating child's type of disability. Moreover, disability categorizations were not uniform over time. In the special education program, an aggregation of the primary exceptional characteristic lead to a general categorization over the five fiscal years. Of the children in special education, approximately one half were identified as having learning disabilities. For example in FY 1994, approximately 49% were categorized as having learning disabilities, 25% as having speech or language disorders, 11% as severely emotionally disturbed, and 11% as mentally retarded. (Table 7). From the Medicaid services data, the ICD-9-CM diagnosis code was available for almost all children selected. Institutional claims records which primarily identify inpatient hospitalizations, could not be categorized by ICD-9-CM diagnosis codes. Table 8 presents the distribution of the ICD-9-CM diagnosis categories. The categorization was based primarily on the section headings contained within the ICD-9-CM, however, some particular diagnoses of interest were included in the distribution. While most of the diagnosis categories fluctuated little over the fiscal years, the percentage of children with mental disorders rose significantlyhrom 20.9% of Medicaid program children in FY 1990 to 40.7% of children in the Medicaid program in FY 1994.
Patterns of Program Participation
Because each of the four programs provide very different services to disabled children in Illinois, the duration of program participation varies considerably. We would expect AABD (SSI) program participation, for example, to be longer term given that it provides basic human services including income support and health insurance. Medicaid program identification, however, is not likely to be observed year to year unless a particular disabling condition requires constant treatment provided through Medicaid. Because our data did not allow for continuous time estimates of duration, discrete time service receipt histories were analyzed for new entrants to each of the programs by fiscal year. A new entrant to AABD in FY 1992, for example, was defined as a child not observed participating in AABD prior to the fiscal year 1992. Only children who were age 13 or younger at the end of the fiscal year of the first year of service, and thus would not reach age 18 during the observation period, were examined. The survival rates are presented in Table 9.
Both special education and AABD program participation were likely to last longer than Medicaid program or DMH inpatient participation. For children entering the AABD program in FY 1991, 70% were still participating after 4 years. Over time, children entering AABD programs were more likely to continue participation after 1 year. For example, 78% of the AABD children entering in FY 1991 were participating after 3 years while 86% of the children entering in FY 1992 were participating after 3 years. In special education over time, children were slightly less likely to continue participation for a second year. Of children entering special education in FY 1991, 75.7% were participating for a second year while only 71.9% of children entering in FY 1993 were participating. The length of participation in the Medicaid program increased substantially between the FY 1992 and FY 1993 cohorts. 32.2% of the FY 1992 entry cohort was found to be participating for a second year while 44.9% of the FY 1993 entry cohort was participating in the next year.
Service History
Table 10 presents indicators of the past year of service receipt for each program entry cohort. New entry is again defined by the first year of service in a particular program. Overall, AABD entrants are the most "known" to the system. In FY 1991, 47% of children entering AABD had participated in another service last year while just 3% of special education entrants and 14% Medicaid entrants had done so. An examination of the participation rates of AABD entrants over the fiscal years, however, reveals that the degree of participation in other services prior to AABD entry has decreased. By FY 1994, 39.3% of children entering AABD had prior service experience. For special education and Medicaid new entrants, we observe the opposite trend. Children in special education were more likely to have had prior service experience in both AABD and Medicaid. Entrants to the Medicaid program were also more likely to have received other services in the past year. Medicaid entrants who participated in special education in the past year increased from 12.7% of entrants in FY 1991 to 18.3% of entrants in FY 1994. Although these indicators can only approximate the pathways that children take, the trend in recent fiscal years suggests that frequency of transitions between other services to Medicaid and special education is increasing while the frequency of transitions from other services to AABD is decreasing.
B. Patterns of Multi-Service Utilization
Describing the patterns of multi-service utilization of disabled children was a primary goal of this study. At a time when eligibility for SSI will possibly be restricted, it is important to understand the extent to which SSI and other services have been supporting the population of children with disabilities. In addition, indicators of multi-service utilization over time can further illustrate the effects of the Zebley decision.
Cross-Sectional Analysis
A point in time examination of multi-service utilization reveals that the majority of children participate in one of two services: special education or Medicaid services (Table 11). Over time however, multi-service use becomes more prevalent. In FY 1990, 5.3% of the children receiving service were multi-service users, while 15.2% of the children receiving services in FY 1994 were multi-service users. Although a small percentage of the total disabled population, the number of children using some combination of programs increase substantially over time. Only 2,747 children used AABD, special education, and Medicaid services within FY 1990. In FY 1994, this number had increased nearly four times to 10,031 children. The number of children participating in special education and the Medicaid program also increased from 5,501 in FY 1990 to 16,201 children in FY 1994. At the same time that these increases occurred, the nurnber of children participating in AABD or the Medicaid program only increased steadily while the number participating in special education only decreased over time.
By examining the incidence of multi-service utilization by program type, we see that the patterns of multi-service use do vary considerably (Table 12). Children in AABD programs have the highest incidence of multi-service utilization but it is not increasing over time. In FY 1990, 51.3% of the AABD children were in special education while only 42.3% were participating in FY 1994. As a percentage of all children in special education, multi-service use is rare but increasing over the fiscal years. Special education children utilizing Medicaid reimbursed services increased substantially from 3.6% of children in FY 1990 versus 13.3% of children in FY 1994. Similarly, special education children were more likely to participate in AABD. In FY 1990, 2.7% of children were participating in AABD while 9.4% were participating in FY 1994. Children receiving Medicaid services were slightly more likely to participate in either AABD or special education over time. In FY 1990, 13.8% of the Medicaid children were also participating in AABD while 19.8% were participating in both programs in FY 1994.
Entry Cohorts
Although multi-service use increased overall and especially for children in special education and Medicaid, the impact of children new to disability programs (especially because of Zebley implementation) could not be assessed in the cross sectional analysis. New entry cohorts, defined by the first year of participation in any of the four services, were analyzed for FY 1991-1994. Although the overall number of disabled children identified from the four programs has grown, the overall number of new entrants to one of the four programs has decreased from 89,193 children entering in FY 1991 to 59,014 children entering in FY 1994 (Table 13). This trend is due primarily to the decrease in special education enrollment. None of the multi-service categories increased substantially over the fiscal years. Only a small percentage of the new entrants participated in more than one service during the fiscal year of entry. For example, 2.7% of the FY 1991 entry cohort participated in multiple services during FY 1991. In FY 1994, only 5.4% of the new entrants participated in multiple services. This was true despite the radically changing composition of the entry cohorts. In FY 1991, single service special education children made up 70.5% of the cohort. In FY 1994, only 23.8% of the entry cohort were single service special education children while 61.2% were single service children identified in the Medicaid reimbursed services data.
The trends seen by program type in the cross-sectional analysis are observed again for the new entrants. Over the new entry cohorts, children who began their service receipt in AABD became increasingly less likely to participate in multiple services within their first year of service (Table 14). New entrants participating in special education were slightly more likely to participate in multiple services, especially Medicaid. Children in the Medicaid program for the first time were slightly more likely to be multi-service users. Although the new entrants look similar to the cross-sections in terms of the trend in multi-service use, they contribute little to the overall incidence of multi-service use. In FY 1991, multi-service users that were new entrants made up approximately 1% of the 16,213 multi-service users observed in FY 1991. In FY 1994, new entrants using multiple services continued to represent I% of disabled children using multiple services in Illinois. It appears that although multi-service utilization has increased since FY 1990, the new entrants contributed little to the trend.
The time frame for this study allows us to follow the FY 1991 cohort of new entrants up to three years. This longitudinal analysis can illustrate the program participation of single service children in the future. As presented in table 15, each of the single service groups from each cohort was identified by multiple service use in the future. The patterns overall and by service type are not clear. Overall, an additional 8.1% of the FY 1991 cohort and 10.6% of the FY 1992 cohort was found to be multi-service users after 2 years. The percentage of multi-service users identified after one and two years appears to rise until except for a sharp decrease for the FY 1993 cohort. For children only participating in AABD in FY 1991, 16.9% became multi-service users after 1 year while only 10.8% of the children in the FY 1993 cohort became multi-service users. After 2 years, however, the percentage of children becorriing multi-service users rose slightly from 23.2% of the FY 1991 cohort to 26.2% of the FY 1992 cohort. Special education and Medicaid program single users were even less likely to become multi-service users in the future.
C. Characteristics of Multi-Service Users
In order to approximate which disabled children participated in more than one service, the descriptive variables available to us were examined by single service and multi-service categories. In table 16, the distribution of the primary characteristic is presented for all special education children, as well as special education children participating in more than one service. Only multi- service use involving AABD and the Medicaid program is presented because it represents the majority of the multi-service utilization. In each of the fiscal years, the majority of children in both special education and AABD were those with mental retardation. Over time, however, children with learning disabilities and severe emotional disturbance were more likely to participate in AABD an special education simultaneously. By FY 1994, 35.1% of the children in both special education and AABD were mentally retarded, 30.9% were learning disabled, and 15% were severely emotionally disturbed. In terms of the utilization of the Medicaid program and special education, the patterns of service utilization for different categories of the children varied over time. Mentally retarded and SED children became less likely to use Medicaid reimbursed services while participating in special education. In FY 1990, 25.4% and 25.3% of the children participating in both services were respectively mentally retarded and SED while in FY 1994 only 19.5% and 17.4% of children in both services were respectively mentally retarded and SED. Learning disabled children were more likely to represent children participating in special education and receiving Medicaid reimbursed services over time. The increase was especially pronounced between FY 1992 when 15.9% of children in both services were learning disabled and FY 1993 when 24.4% of children were indicated as learning disabled in special education.
Children participating in the Medicaid program were similarly examined by single and multiple service categories. In FY 1990, the children who received Medicaid reimbursed services and special education looked very different from children who received Medicaid reimbursed services and AABD (Table 17a-17e). The majority of children participating in both the Medicaid program and special education were receiving service under special categories of service (14.6%), for multiple diagnoses (14.2%), and for other mental disorders (13.9%). Children receiving Medicaid reimbursed services and AABD were most likely to be treating infantile cerebral palsy (16.5%) and multiple diagnoses (15.0%) within fiscal year 1990. In terms of the type of Medicaid recipient with the highest degree of multi-service utilization, infantile cerebral palsy was highest with 80.9% of children in FY 1990 participating in multiple services. Children with multiple diagnoses and developmental speech or language disorders also had substantial multi-service use.
These patterns begin to change in FY 1992. In FY 1992, children participating in the Medicaid program and special education are more likely to have been identified by multiple diagnoses, other mental disorders, and developmental speech and language disorders. By FY 1994, the majority of children participating in the Medicaid program and either special education or AABD were being treated for mental disorders. By 1994, the percentage of children with both mental disorders and multiple diagnoses who used special education or AABD had increased during the period. This increase, however, is due in part to the changing composition of the Medicaid population after the Medicaid community mental health services program began. Without controlling for other factors, it is not clear whether the increase is due to changes in multi-service use or to changes in the composition of the population. This hypothesis will be tested using multivariate methods with regard to AABD participation specifically.
D. Factors Affecting the Incidence of Multi-Service Utilization
The descriptive analysis revealed a pattern of increasing multi-service utilization over the time period. The analysis by program type indicates that multi-service utilization is increasing for the special education and Medicaid service populations, but is the decreasing for the AABD service population. In order to further confirm the trends observed in the descriptive analysis, logistic regression was used to model the probability that a child would use multiple services during a fiscal year while controlling for demographic and disability characteristics.
Table 18 presents the odds ratios from each of the three models. Each program type was modeled separately because of the variation in the incidence of multi-service use. DMH multi-service utilization was not examined in the multivariate analysis because it was so rare. The odds ratios describe the effect on the probability of being a multi-service user during a fiscal year relative to a baseline group while holding all other factors constant For example in the model for AABD program participants, females are 20% less likely than males to be multi-service users during a fiscal year. Minority children in AABD were less likely to be multi-service users than were white children. The odds ratios of the age categories indicate that children between the ages of 8 and 13 are slightly more likely than children ages 6 to 7 to be multi-service users. It appears that the very young and teenage children were less likely to be using multiple services during a fiscal year. The direction of the indicators of fiscal year indicate a discontinuous upward trend in the likelihood that children in AABD used multiple services during the fiscal year. In FY 1991 and FY 1992, children were nearly two times more likely to be multi-service users than children in AABD in FY 1990. In FY 1993, however, children were slightly less likely to be multi-service users than children in FY 1990. This drop coincides with the dramatic increase in the AABD population after Zebley and the decreasing likelihood of new entrants to have had prior service experience in any of the other three disability programs. Although this decreasing likelihood of multi-service use persisted in the descriptive trend, after controlling for all other factors the direction of the FY 1994 indicator showed that children were more likely to have participated in multiple services than in FY 1990.
Model 2 presents the odds ratios for children participating in special education during each of the fiscal years. Unlike AABD, females in special education were slightly more likely than males to be multi-service users. Minority children were 2 to 3 times more likely to be multi-service users. With the exception of infants, the likelihood of being a multi-service users decreases with age. Children over the age of 7 are approximately 20% less likely to be multi-service users than children ages 6 and 7. The fiscal year indicators point to a slightly increasing likelihood of multi-service use among the special education population between FY 1992 and 1993. In FY 1994 however, children were 2.25 times more likely to be multi-service users than children participating in FY 1990 holding all other characteristics constant. In addition to the program and demographic characteristics already mentioned, the primary characteristic for each child per fiscal year was included in the model. The odds ratios show that mentally retarded children, physically disabled children and children with other disabilities were approximately 2 times more likely to be multi-service users than were severely emotionally disturbed children. Children with learning disabilities and speech or language disorders were nearly 70% less likely to be multi-service users during a fiscal year than were severely emotionally disturbed children.
In Model 3, the likelihood of being a multi-service user during a fiscal year is modeled for children participating in the Medicaid program. The effects of demographic and program indicators for the Medicaid program population tend to look similar to the effects in the Model 1. Females, for example, are 25% less likely than males to be multi-service users in a fiscal year. Hispanic and African-American children are slightly more likely than white children to be multi-service users during a fiscal year. In the Medicaid program population, children over the age of 7 are more likely to be multi-service users than are children ages 6 to 7. Like the special education population, children participating in the Medicaid program after FY 1990 are more likely to be multi-service users during the fiscal year than are children who participated in FY 1990. The description of the selection into the Medicaid program population was also included in the model in order to control for any effect of the type of disabling condition. Children selected due to mental diagnoses or a combination of mental and non-mental diagnoses were more likely to be multi-service users during a fiscal year than were children selected because of one or more non-mental diagnoses.
E. Predicting AABD Service Utilization
Understanding the factors associated with AABD service utilization is of particular interest in light of the policy changes that are likely to emanate from welfare reform. As we have seen, multi-service use has increased over time among the disabled children identified in this study. In order to assess the risk of AABD program participation over time in Illinois, we have focused on the population of children identified by our Medicaid service selection criterion. We would expect all of these children to be at risk for AABD. We recognize that there are certainly children at risk who would not have prior Medicaid program participation. Again, logistic regression was used to predict the probability of AABD participation within 3 years of participation in the Medicaid program. All children receiving Medicaid reimbursed services in FY 1990 through 1992 were included in the model.
Table 19 presents the results of this analysis. Females were nearly 20% less likely than males to participated in AABD within three years. Espanic and African American children were approximately 1.3 times more likely than white children to participate in AABD. Children over the age of 7 were more likely to become AABD participants within 3 years than were children ages 6 and 7. Children under age 6 were less likely to become AABD participants. The method of the Medicaid selection was also included in the model. Interestingly, children included in the Medicaid program population because of a combination of mental and non-mental diagnoses during a fiscal year were nearly three an a half times more likely to become AABD participants than children included because of one or more non-mental disorder diagnoses. This strong effect indicates that children with the more complex conditions were most likely to receive AABD. The likelihood of participating in AABD appeared to increase over fiscal years 1990 to 1992. Children participating in the Medicaid program in fiscal year 1991 were over two and a half times more likely to receive AABD within three years than were children in Medicaid in FY 1990. Children in Medicaid in FY 1992 were over three times as likely.
VI. IMPLICATIONS AND FUTURE WORK
This study shows very strikingly that the population of children served by public programs for disabilities in Illinois has changed dramatically over a five year period. The expansion due to Zebley to include more children with emotional disorders has opened a new door into services provided through the Medicaid program. The Medicaid program has been expanded simultaneously to address the needs of children with severe emotional disturbances by providing services in settings other than traditional health care settings. It also seems, however, that the new SSI population is slow to use additional services. In other words, children in the SSI population do not quickly become participants in multiple programs. The special education population is also decreasing as there is a move to bring children with handicapping conditions into the regular classroom; the poor fiscal condition of schools also provides little incentive to identify more children as requiring special education. This is our interpretation of the diverging trends in program eligibility and utilization between the SSI and Medicaid programs and the special education program.
We also found that multiple program participation reflected intuitions about how that might occur. In general, children with less severe conditions (language disorders or learning disabilities) were less likely to participate in multiple programs that children with more severe or chronic disabilities (e.g. severe emotional disturbance). This, however, may be due to the fact that we focused on public programs, which are primarily used by the poorer segment of the population; this means that the children with less severe conditions in special education would be less likely to appear in the Medicaid or SSI population.
Given the changes that have been made to SSI eligibility criteria in 1996 and the potential future changes in Medicaid and welfare programs in general, we hope that this study provides a baseline for future monitoring of participation in programs for disabled children. While we have not included every program for children with disabilities, we have included the major public programs which would reflect the trends in the service provision to the population. The addition of other programs into our analysis could provide important information on those programs. In particular, the addition of the new early intervention programs would be an important addition. Better tracking of these children from birth is also key to more complete and better monitoring.
ENDNOTES
-
Throughout this report, AABD receipt is used as a proxy variable for SSI receipt. The table below presents the published numbers of children receiving SSI in the state of Illinois in December of each year. The measure in December represents the midpoint of each fiscal year. The AABD figures map nicely to the midpoints even during the period of rapid growth beginning in 1992.
Number of Children in Illinois Receiving: December
1989December
1990December
1991December
1992December
1993Supplemental Security Income (SSI) 12,951 15,387 21,178 31,874 41,225 July 1, 1989
to
June 30, 1990July 1, 1990
to
June 30, 1991July 1, 1991
to
June 30, 1992July 1, 1992
to
June 30, 1993July 1, 1993
to
June 30, 1994Aid to the Aged, Blind, and Disabled (AABD) 12,184 14,839 19,986 33,555 43,941 SOURCE: Social Security Bulletin, Annual Statistical Supplement, 1989-1993 -
An error was found in the diagnosis field of our medical claims database for services received January 1993-June 1995. The error involved only institutional claims made during the time period, thus we did not expect our diagnosis code selection to be substantially affected. In order to measure the error introduced, we compared the number of children that we identified as disabled using all claims versus all non-institutional claims in fiscal year 1990. We found that using all types of claims in the diagnosis code selection gave us 42,147 Medicaid program participants versus 34,541 using only non-institutional claim records. This represents 82% of the total Medicaid population available to us if the diagnosis code of all claim records could have been used.
-
The population incidence of 8% is based on 3,338,418 children living in Illinois according to the 1990 U.S. Census.
TABLES
| TABLE 1. Number of Children by Method of Disabling Condition in Medicaid Services Database: FY 1990-1994 | ||||||||||
|---|---|---|---|---|---|---|---|---|---|---|
| 1990 | 1991 | 1992 | 1993 | 1994 | ||||||
| N | % | N | % | N | % | N | % | N | % | |
| ICD-9-CM SELECTION | ||||||||||
| Infectious Diseases | 41 | 0.2 | 60 | 0.2 | 63 | 0.2 | 115 | 0.3 | 143 | 0.2 |
| AIDS | 20 | 0.1 | 43 | 0.2 | 53 | 0.2 | 102 | 0.2 | 127 | 0.2 |
| Other Infectious Diseases | 21 | 0.1 | 17 | 0.1 | 10 | 0.0 | 13 | 0.0 | 16 | 0.0 |
| Neoplasms | 471 | 2.1 | 619 | 2.1 | 845 | 2.6 | 1,190 | 2.8 | 1,377 | 2.0 |
| Endocrine, Nutritional and Metabolic Diseases | 678 | 3.0 | 892 | 3.4 | 1,281 | 4.0 | 1,187 | 2.8 | 1,769 | 2.5 |
| Diseases of the Blood and Blood Forming Organs | 1,027 | 4.6 | 1,171 | 4.4 | 1,247 | 3.9 | 1,196 | 2.8 | 1,512 | 2.1 |
| Sickle Cell Anemia | 850 | 3.8 | 941 | 3.6 | 987 | 3.1 | 909 | 2.1 | 1,127 | 1.6 |
| Other Diseases of the Blood and Blood Forming Organs | 177 | 0.8 | 230 | 0.9 | 260 | 0.8 | 287 | 0.7 | 385 | 0.5 |
| Mental Disorders | 7,776 | 34.9 | 9,305 | 35.3 | 12,481 | 39.1 | 20,740 | 48.5 | 37,984 | 54.0 |
| Developmental Speech or Language Disorder | 1,381 | 6.2 | 1,460 | 5.5 | 2,501 | 7.8 | 7,138 | 16.7 | 13,245 | 18.8 |
| Attention Deficit Disorders | 1,920 | 8.6 | 2,645 | 10.0 | 3,623 | 11.3 | 4,800 | 11.2 | 6,734 | 9.6 |
| Disturbance of Emotions Specific to Childhood and Adolescence | 176 | 0.8 | 288 | 1.1 | 599 | 1.9 | 1,106 | 2.6 | 7,952 | 11.3 |
| Other Mental Disorders | 4,299 | 19.3 | 4,912 | 18.7 | 5,758 | 18.0 | 7,696 | 18.0 | 10,053 | 14.3 |
| Diseases of the Nervous System and Sense Organs | 3,913 | 17.6 | 4,538 | 17.2 | 4,687 | 14.7 | 5,111 | 12.0 | 5,888 | 8.4 |
| Infantile Cerebral Palsy | 1,127 | 5.1 | 1,198 | 4.6 | 1,277 | 4.0 | 1,271 | 3.0 | 1,111 | 1.6 |
| Hearing Loss | 2,241 | 10.1 | 2,751 | 10.4 | 2,837 | 8.9 | 3,217 | 7.5 | 3,963 | 5.6 |
| Other Diseases of the Nervous System and Sense Organs | 545 | 2.4 | 589 | 2.2 | 573 | 1.8 | 623 | 1.5 | 814 | 1.2 |
| Diseases of the Circulatory System | 306 | 1.4 | 311 | 1.2 | 359 | 1.1 | 318 | 0.7 | 442 | 0.6 |
| Diseases of the Respiratory System | 1,992 | 8.9 | 1,861 | 7.1 | 2,276 | 7.1 | 2,119 | 5.0 | 2,576 | 3.7 |
| Asthma | 1,982 | 8.9 | 1,855 | 7.0 | 2,272 | 7.1 | 2,111 | 4.9 | 2,572 | 3.7 |
| Other Diseases of the Respiratory System | 10 | 0.0 | 6 | 0.0 | 4 | 0.0 | 8 | 0.0 | 4 | 0.0 |
| Diseases of the Digestive System | 68 | 0.3 | 75 | 0.3 | 76 | 0.2 | 57 | 0.1 | 83 | 0.1 |
| Diseases of the Genitourinary System | 216 | 1.0 | 198 | 0.8 | 207 | 0.6 | 202 | 0.5 | 255 | 0.4 |
| Diseases of the Skin and Subcutaneous Tissue | 4 | 0.0 | 4 | 0.0 | 4 | 0.0 | 8 | 0.0 | 7 | 0.0 |
| Diseases of the Musculoskeletal System and Connective Tissue | 264 | 1.2 | 300 | 1.1 | 314 | 1.0 | 302 | 0.7 | 329 | 0.5 |
| Congenital Anomolies | 2,392 | 10.7 | 2,849 | 10.8 | 3,069 | 9.6 | 2,999 | 7.0 | 3,734 | 5.3 |
| Conditions Originating in the Perinatal Period | 26 | 0.1 | 90 | 0.3 | 69 | 0.2 | 73 | 0.2 | 100 | 0.1 |
| Injury and Poisoning | 39 | 0.2 | 31 | 0.1 | 80 | 0.3 | 111 | 0.3 | 126 | 0.2 |
| Supplementary Classification | 7 | 0.0 | 19 | 0.1 | 19 | 0.1 | 23 | 0.1 | 19 | 0.0 |
| Multiple Diagnoses | 3,056 | 13.7 | 4,006 | 15.2 | 4,874 | 15.3 | 6,973 | 16.3 | 14,039 | 19.9 |
| Total Number of Children Identified by ICD-9-CM Diagnosis | 22,276 | 100.0 | 26,329 | 100.0 | 31,951 | 100.0 | 42,724 | 100.0 | 70,383 | 100.0 |
| INPATIENT SELECTION | ||||||||||
| Inpatient Hospitalization: 3 or more Hospitalizations | 2,472 | 43.0 | 2,096 | 37.1 | 1,728 | 39.8 | 1,521 | 32.5 | 2,388 | 35.5 |
| Inpatient Hospitalization: Hospitalization 20 Days or Longer | 2,745 | 47.7 | 3,035 | 53.8 | 2,284 | 52.6 | 2,822 | 60.3 | 3,757 | 55.9 |
| Inpatient Hospitalization: 3 or more Hospitalization and Hospitalization 20 Days or Longer | 533 | 9.3 | 512 | 9.1 | 334 | 7.7 | 339 | 7.2 | 578 | 8.6 |
| Total Number of Children Identified by Inpatient Hospitalization | 5,750 | 100.0 | 5,643 | 100.0 | 4,346 | 100.0 | 4,682 | 100.0 | 6,723 | 100.0 |
| PROVIDER TYPE SELECTION | ||||||||||
| Physical Therapists | 14 | 0.2 | 12 | 0.2 | 33 | 0.4 | 41 | 0.1 | 71 | 0.4 |
| Occupational Therapists | 1 | 0.0 | 9 | 0.1 | 19 | 0.3 | 56 | 0.5 | 84 | 0.4 |
| Speech Therapists | 26 | 0.4 | 53 | 0.7 | 61 | 0.8 | 79 | 0.7 | 146 | 0.7 |
| Audiologists | 648 | 9.7 | 877 | 11.3 | 713 | 9.5 | 553 | 4.7 | 705 | 3.6 |
| MR Facilities | 0 | 0.0 | 0 | 0.0 | 2 | 0.0 | 58 | 0.5 | 536 | 2.7 |
| Psychiatric Hospitals | 122 | 1.8 | 315 | 4.1 | 328 | 4.4 | 493 | 4.2 | 818 | 4.2 |
| Rehabilitation Hospitals | 128 | 1.9 | 136 | 1.8 | 194 | 2.6 | 340 | 2.9 | 482 | 2.4 |
| Nursing Facilities | 643 | 9.6 | 585 | 7.5 | 598 | 8.0 | 35 | 0.3 | 11 | 0.1 |
| Long Term Care Facilities (State) | 781 | 11.7 | 719 | 9.3 | 668 | 8.9 | 444 | 3.8 | 266 | 1.4 |
| Mental Health Services Provider | 40 | 0.6 | 349 | 4.5 | 1,504 | 20.0 | 5,694 | 48.8 | 11,216 | 57.0 |
| ICF/MI Facility | 2 | 0.0 | 4 | 0.1 | 3 | 0.0 | 4 | 0.0 | 1 | 0.0 |
| Home Health Agencies | 2,729 | 40.7 | 2,920 | 37.6 | 2,545 | 33.9 | 2,097 | 18.0 | 3,029 | 15.4 |
| Community Health Agencies | 1,367 | 20.4 | 1,484 | 19.1 | 529 | 7.1 | 503 | 4.3 | 714 | 3.6 |
| DORS Schools | 0 | 0.0 | 0 | 0.0 | 0 | 0.0 | 73 | 0.6 | 110 | 0.6 |
| Multiple Service Providers | 197 | 2.9 | 298 | 3.8 | 305 | 4.1 | 1,190 | 10.2 | 1,491 | 7.6 |
| Total Number of Children Identified by Provider Type | 6,698 | 100.0 | 7,761 | 100.0 | 7,502 | 100.0 | 11,660 | 100.0 | 19,680 | 100.0 |
| CATEGORY OF SERVICE SELECTION | ||||||||||
| DCFS Rehab Option | 0 | 0.0 | 0 | 0.0 | 0 | 0.0 | 1,423 | 4.8 | 3,775 | 7.7 |
| Physical Therapy | 90 | 0.7 | 115 | 0.7 | 168 | 0.9 | 234 | 0.8 | 339 | 0.7 |
| Occupational Therapy | 92 | 0.7 | 176 | 1.1 | 396 | 2.0 | 526 | 1.8 | 806 | 1.6 |
| Speech Therapy | 1,310 | 9.7 | 1,578 | 10.0 | 2,507 | 12.9 | 7,909 | 26.4 | 16,052 | 32.8 |
| Audiology Services | 683 | 5.0 | 779 | 4.9 | 949 | 4.9 | 1,312 | 4.4 | 2,337 | 4.8 |
| Psychiatric Clinic Services | 2,899 | 21.4 | 2,920 | 18.5 | 3,457 | 17.8 | 3,638 | 12.2 | 4,724 | 9.6 |
| Rehab Clinic Services | 96 | 0.7 | 132 | 0.8 | 158 | 0.8 | 243 | 0.8 | 194 | 0.4 |
| DMHDD Clinic Option | 40 | 0.3 | 348 | 2.2 | 1,175 | 6.0 | 1,132 | 3.8 | 1,506 | 3.1 |
| DMHDD Rehab Option | 0 | 0.0 | 0 | 0.0 | 265 | 1.4 | 2,462 | 8.2 | 4,573 | 9.3 |
| Alcohol and Drug Services | 454 | 3.4 | 683 | 4.3 | 759 | 3.9 | 973 | 3.3 | 1,301 | 2.7 |
| Exceptional Care-Hosp Residing | 0 | 0.0 | 0 | 0.0 | 0 | 0.0 | 0 | 0.0 | 3 | 0.0 |
| Prosthetic Devices | 6,385 | 47.1 | 7,615 | 48.3 | 8,153 | 41.9 | 8,226 | 27.5 | 10,976 | 22.4 |
| Targeted Case Management | 0 | 0.0 | 0 | 0.0 | 62 | 0.3 | 630 | 2.1 | 1,308 | 2.7 |
| LTC Skilled | 6 | 0.0 | 11 | 0.1 | 8 | 0.0 | 5 | 0.0 | 5 | 0.0 |
| LTC Intermediate | 133 | 1.0 | 162 | 1.0 | 204 | 1.0 | 188 | 0.6 | 167 | 0.3 |
| ICF/MR Skilled Pediatric | 660 | 4.9 | 582 | 3.7 | 534 | 2.7 | 492 | 1.6 | 487 | 1.0 |
| LTC Special Living Center | 1 | 0.0 | 0 | 0.0 | 0 | 0.0 | 0 | 0.0 | 1 | 0.0 |
| MI Recipient Under 22 | 675 | 5.0 | 663 | 4.2 | 643 | 3.3 | 529 | 1.8 | 401 | 0.8 |
| MI Recipient Non-matchable | 0 | 0.0 | 1 | 0.0 | 1 | 0.0 | 0 | 0.0 | 1 | 0.0 |
| LTC Day Care | 20 | 0.1 | 14 | 0.1 | 10 | 0.1 | 8 | 0.0 | 10 | 0.0 |
| Total Number of Children Identified by Category of Service | 13,544 | 100.0 | 15,779 | 100.0 | 19,449 | 100.0 | 29,930 | 100.0 | 48,966 | 100.0 |
| TABLE 2. Selection Method Used to Identify Disabling Conditions in the Medicaid Services Data: FY 1990-1994 | ||||||||||
|---|---|---|---|---|---|---|---|---|---|---|
| Method | 1990 | 1991 | 1992 | 1993 | 1994 | |||||
| N | % | N | % | N | % | N | % | N | % | |
| ICD-9-CM Diagnosis Only | 15,202 | 44.0 | 17,680 | 45.1 | 21,072 | 46.8 | 21,668 | 38.6 | 32,778 | 37.3 |
| Inpatient Service Only | 2,240 | 6.5 | 1,941 | 4.9 | 1,349 | 3.0 | 1,427 | 2.5 | 1,927 | 2.2 |
| Category of Service Only | 6,353 | 18.4 | 7,232 | 18.4 | 8,316 | 18.5 | 8,671 | 15.5 | 10,425 | 11.9 |
| Provider Type Only | 1,377 | 4.0 | 1,408 | 3.6 | 1,219 | 2.7 | 942 | 1.7 | 1,303 | 1.5 |
| ICD-9-CM Diagnosis and Category of Service | 1,771 | 5.1 | 2,229 | 5.7 | 4,914 | 10.9 | 10,791 | 19.2 | 20,503 | 23.4 |
| ICD-9-CM Diagnosis and Provider Type | 245 | 0.7 | 396 | 1.0 | 409 | 0.9 | 494 | 0.9 | 807 | 0.9 |
| Inpatient and ICD-9-CM Diagnosis | 1,451 | 4.2 | 1,512 | 3.9 | 1,126 | 2.5 | 1,099 | 2.0 | 1,268 | 1.4 |
| Inpatient and Category of Service | 417 | 1.2 | 413 | 1.1 | 379 | 0.8 | 327 | 0.6 | 521 | 0.6 |
| Inpatient and Provider Type | 237 | 0.7 | 191 | 0.5 | 159 | 0.4 | 125 | 0.2 | 227 | 0.3 |
| Provider Type and Category of Service | 1,352 | 3.9 | 1,465 | 3.7 | 1,452 | 3.2 | 1,726 | 3.1 | 2,784 | 3.2 |
| ICD-9-CM Diagnosis, Provider Type, and Category of Service | 2,491 | 7.2 | 3,172 | 8.1 | 3,310 | 7.3 | 7,089 | 12.6 | 12,441 | 14.2 |
| Inpatient, ICD-9-CM Diagnosis, and Category of Service | 409 | 1.2 | 457 | 1.2 | 380 | 0.8 | 420 | 0.7 | 662 | 0.8 |
| Inpatient, ICD-9-CM Diagnosis, and Provider Type | 245 | 0.7 | 318 | 0.8 | 255 | 0.6 | 378 | 0.7 | 488 | 0.6 |
| Inpatient, Provider Type, and Category of Service | 289 | 0.8 | 246 | 0.6 | 213 | 0.5 | 121 | 0.2 | 194 | 0.2 |
| Inpatient, ICD-9-CM Diagnosis, Provider Type, and Category of Service | 462 | 1.3 | 565 | 1.4 | 485 | 1.1 | 785 | 1.4 | 1,436 | 1.6 |
| Total Number of Children | 34,541 | 100.0 | 39,225 | 100.0 | 45,038 | 100.0 | 56,063 | 100.0 | 87,764 | 100.0 |
| TABLE 3. Demographic Profile of Children in AABD Programs: FY 1990-1994 | ||||||||||
|---|---|---|---|---|---|---|---|---|---|---|
| 1990 | 1991 | 1992 | 1993 | 1994 | ||||||
| N | % | N | % | N | % | N | % | N | % | |
| All AABD Children | 12,148 | 100 | 14,839 | 100 | 19,986 | 100 | 33,555 | 100 | 43,941 | 100 |
| Race/Ethnicity | ||||||||||
| White | 4,435 | 36.5 | 5,330 | 35.9 | 6,784 | 33.9 | 11,182 | 33.3 | 14,164 | 32.2 |
| African American | 6,216 | 51.2 | 7,659 | 51.6 | 10,876 | 54.4 | 18,894 | 56.3 | 25,477 | 58.0 |
| Hispanic | 1,395 | 11.5 | 1,715 | 11.6 | 2,169 | 10.9 | 3,221 | 9.6 | 3,986 | 9.1 |
| Asian | 88 | 0.7 | 120 | 0.8 | 139 | 0.7 | 212 | 0.6 | 250 | 0.6 |
| Native American | 13 | 0.1 | 14 | 0.1 | 18 | 0.1 | 46 | 0.1 | 64 | 0.1 |
| Other | 1 | 0.0 | 1 | 0.0 | 0 | 0.0 | 0 | 0.0 | 0 | 0.0 |
| Gender | ||||||||||
| Female | 5,064 | 41.7 | 6,073 | 40.9 | 7,904 | 39.5 | 13,418 | 40.0 | 17,368 | 39.5 |
| Male | 7,084 | 58.3 | 8,766 | 59.1 | 12,082 | 60.5 | 20,137 | 60.0 | 26,573 | 60.5 |
| Age at Beginning of Fiscal Year | ||||||||||
| Less than 1 year | 436 | 3.6 | 605 | 4.1 | 720 | 3.6 | 1,365 | 4.1 | 1,909 | 4.3 |
| 1 year | 424 | 3.5 | 528 | 3.6 | 786 | 3.9 | 1,062 | 3.2 | 1,348 | 3.1 |
| 2 years | 470 | 3.9 | 598 | 4.0 | 819 | 4.1 | 1,306 | 3.9 | 1,515 | 3.4 |
| 3 years | 530 | 4.4 | 651 | 4.4 | 858 | 4.3 | 1,368 | 4.1 | 1,802 | 4.1 |
| 4 years | 560 | 4.6 | 690 | 4.6 | 932 | 4.7 | 1,455 | 4.3 | 1,923 | 4.4 |
| 5 years | 626 | 5.2 | 714 | 4.8 | 941 | 4.7 | 1,536 | 4.6 | 1,999 | 4.5 |
| 6 years | 659 | 5.4 | 759 | 5.1 | 1,062 | 5.3 | 1,620 | 4.8 | 2,131 | 4.8 |
| 7 years | 701 | 5.8 | 895 | 6.0 | 1,141 | 5.7 | 1,790 | 5.3 | 2,339 | 5.3 |
| 8 years | 750 | 6.2 | 918 | 6.2 | 1,297 | 6.5 | 1,972 | 5.9 | 2,552 | 5.8 |
| 9 years | 703 | 5.8 | 942 | 6.3 | 1,313 | 6.6 | 2,119 | 6.3 | 2,719 | 6.2 |
| 10 years | 736 | 6.1 | 896 | 6.0 | 1,379 | 6.9 | 2,253 | 6.7 | 2,867 | 6.5 |
| 11 years | 691 | 5.7 | 930 | 6.3 | 1,306 | 6.5 | 2,252 | 6.7 | 3,044 | 6.9 |
| 12 years | 725 | 6.0 | 875 | 5.9 | 1,316 | 6.6 | 2,270 | 6.8 | 3,037 | 6.9 |
| 13 years | 697 | 5.7 | 902 | 6.1 | 1,200 | 6.0 | 2,275 | 6.8 | 3,074 | 7.0 |
| 14 years | 721 | 5.9 | 863 | 5.8 | 1,239 | 6.2 | 2,110 | 6.3 | 2,987 | 6.8 |
| 15 years | 736 | 6.1 | 878 | 5.9 | 1,115 | 5.6 | 2,208 | 6.6 | 2,800 | 6.4 |
| 16 years | 802 | 6.6 | 917 | 6.2 | 1,155 | 5.8 | 1,993 | 5.9 | 2,885 | 6.6 |
| 17 years | 1,181 | 9.7 | 1,278 | 8.6 | 1,407 | 7.0 | 2,601 | 7.8 | 3,010 | 6.9 |
| TABLE 4. Demographic Profile of Children in the Special Education Program: FY 1990-1994 | ||||||||||
|---|---|---|---|---|---|---|---|---|---|---|
| 1990 | 1991 | 1992 | 1993 | 1994 | ||||||
| N | % | N | % | N | % | N | % | N | % | |
| All Special Education Children | 228,762 | 100 | 229,015 | 100 | 240,417 | 100 | 217,946 | 100 | 198,020 | 100 |
| Race/Ethnicity | ||||||||||
| White | 161,865 | 70.8 | 161,617 | 70.6 | 166,419 | 69.2 | 151,412 | 69.5 | 135,366 | 68.4 |
| African American | 49,886 | 21.8 | 49,792 | 21.7 | 54,304 | 22.6 | 48,370 | 22.2 | 45,627 | 23.0 |
| Hispanic | 14,198 | 6.2 | 14,868 | 6.5 | 16,927 | 7.0 | 15,616 | 7.2 | 14,884 | 7.5 |
| Asian | 2,530 | 1.1 | 2,480 | 1.1 | 2,526 | 1.1 | 2,353 | 1.1 | 1,972 | 1.0 |
| Native American | 187 | 0.1 | 177 | 0.1 | 190 | 0.1 | 165 | 0.1 | 162 | 0.1 |
| Other | 96 | 0.0 | 81 | 0.0 | 51 | 0.0 | 30 | 0.0 | 9 | 0.0 |
| Gender | ||||||||||
| Female | 74,241 | 32.5 | 75,635 | 33.0 | 79,884 | 33.2 | 73,171 | 33.6 | 65,553 | 33.1 |
| Male | 145,540 | 63.6 | 148,074 | 64.7 | 158,060 | 65.7 | 143,355 | 65.8 | 131,750 | 66.5 |
| Unknown | 8,981 | 3.9 | 5,306 | 2.3 | 2,473 | 1.0 | 1,420 | 0.7 | 717 | 0.4 |
| Age at Beginning of Fiscal Year | ||||||||||
| Less than 1 year | 724 | 0.3 | 656 | 0.3 | 623 | 0.3 | 1,508 | 0.7 | 597 | 0.3 |
| 1 year | 267 | 0.1 | 420 | 0.2 | 413 | 0.2 | 1,670 | 0.8 | 1,110 | 0.6 |
| 2 years | 1,594 | 0.7 | 1,711 | 0.7 | 1,974 | 0.8 | 2,503 | 1.1 | 1,414 | 0.7 |
| 3 years | 5,351 | 2.3 | 5,463 | 2.4 | 5,791 | 2.4 | 5,546 | 2.5 | 2,817 | 1.4 |
| 4 years | 8,971 | 3.9 | 9,206 | 4.0 | 9,051 | 3.8 | 8,439 | 3.9 | 5,862 | 3.0 |
| 5 years | 13,490 | 5.9 | 13,486 | 5.9 | 13,883 | 5.8 | 11,534 | 5.3 | 8,157 | 4.1 |
| 6 years | 18,386 | 8.0 | 17,154 | 7.5 | 17,938 | 7.5 | 15,301 | 7.0 | 11,473 | 5.8 |
| 7 years | 20,792 | 9.1 | 20,875 | 9.1 | 20,661 | 8.6 | 18,539 | 8.5 | 14,798 | 7.5 |
| 8 years | 21,202 | 9.3 | 21,019 | 9.2 | 22,119 | 9.2 | 18,895 | 8.7 | 17,208 | 8.7 |
| 9 years | 19,794 | 8.7 | 20,375 | 8.9 | 20,794 | 8.6 | 18,829 | 8.6 | 17,237 | 8.7 |
| 10 years | 17,860 | 7.8 | 19,109 | 8.3 | 20,197 | 8.4 | 17,566 | 8.1 | 17,406 | 8.8 |
| 11 years | 16,838 | 7.4 | 17,439 | 7.6 | 19,250 | 8.0 | 17,230 | 7.9 | 16,819 | 8.5 |
| 12 years | 16,540 | 7.2 | 16,686 | 7.3 | 17,786 | 7.4 | 16,907 | 7.8 | 17,117 | 8.6 |
| 13 years | 15,249 | 6.7 | 16,161 | 7.1 | 16,980 | 7.1 | 15,500 | 7.1 | 16,545 | 8.4 |
| 14 years | 14,998 | 6.6 | 14,508 | 6.3 | 16,096 | 6.7 | 14,503 | 6.7 | 14,896 | 7.5 |
| 15 years | 14,159 | 6.2 | 14,012 | 6.1 | 14,540 | 6.0 | 13,516 | 6.2 | 13,768 | 7.0 |
| 16 years | 12,624 | 5.5 | 11,875 | 5.2 | 12,828 | 5.3 | 11,322 | 5.2 | 12,096 | 6.1 |
| 17 years | 9,923 | 4.3 | 8,860 | 3.9 | 9,493 | 3.9 | 8,638 | 4.0 | 8,700 | 4.4 |
| TABLE 5. Demographic Profile of Children in Medicaid Services Program: FY 1990-1994 | ||||||||||
|---|---|---|---|---|---|---|---|---|---|---|
| 1990 | 1991 | 1992 | 1993 | 1994 | ||||||
| N | % | N | % | N | % | N | % | N | % | |
| All Medicaid Services Children | 34,541 | 100 | 39,225 | 100 | 45,038 | 100 | 56,063 | 100 | 87,764 | 100 |
| Race/Ethnicity | ||||||||||
| White | 15,233 | 44.1 | 17,986 | 45.9 | 21,099 | 46.8 | 26,175 | 46.7 | 36,987 | 42.1 |
| African American | 15,874 | 46.0 | 16,940 | 43.2 | 18,771 | 41.7 | 23,222 | 41.4 | 39,587 | 45.1 |
| Hispanic | 3,158 | 9.1 | 3,928 | 10.0 | 4,693 | 10.4 | 6,057 | 10.8 | 10,235 | 11.7 |
| Asian | 222 | 0.6 | 299 | 0.8 | 413 | 0.9 | 529 | 0.9 | 837 | 1.0 |
| Native American | 53 | 0.2 | 59 | 0.2 | 47 | 0.1 | 64 | 0.1 | 108 | 0.1 |
| Other | 1 | 0.0 | 13 | 0.0 | 15 | 0.0 | 16 | 0.0 | 10 | 0.0 |
| Gender | ||||||||||
| Female | 15,373 | 44.5 | 17,337 | 44.2 | 19,259 | 42.8 | 23,497 | 41.9 | 35,896 | 40.9 |
| Male | 19,168 | 55.5 | 21,888 | 55.8 | 25,779 | 57.2 | 32,566 | 58.1 | 51,868 | 59.1 |
| Age at Beginning of Fiscal Year | ||||||||||
| Less than 1 year | 8,733 | 25.3 | 9,974 | 25.4 | 10,277 | 22.8 | 10,791 | 19.2 | 14,476 | 16.5 |
| 1 year | 1,888 | 5.5 | 2,317 | 5.9 | 2,815 | 6.3 | 2,908 | 5.2 | 3,724 | 4.2 |
| 2 years | 1,656 | 4.8 | 1,949 | 5.0 | 2,371 | 5.3 | 2,885 | 5.1 | 3,849 | 4.4 |
| 3 years | 1,548 | 4.5 | 1,820 | 4.6 | 2,270 | 5.0 | 2,859 | 5.1 | 4,269 | 4.9 |
| 4 years | 1,575 | 4.6 | 1,770 | 4.5 | 2,195 | 4.9 | 2,987 | 5.3 | 4,549 | 5.2 |
| 5 years | 1,612 | 4.7 | 1,886 | 4.8 | 2,306 | 5.1 | 3,223 | 5.7 | 5,250 | 6.0 |
| 6 years | 1,676 | 4.9 | 1,788 | 4.6 | 2,373 | 5.3 | 3,349 | 6.0 | 5,417 | 6.2 |
| 7 years | 1,722 | 5.0 | 1,865 | 4.8 | 2,258 | 5.0 | 3,430 | 6.1 | 5,510 | 6.3 |
| 8 years | 1,570 | 4.5 | 1,773 | 4.5 | 2,132 | 4.7 | 3,039 | 5.4 | 5,522 | 6.3 |
| 9 years | 1,466 | 4.2 | 1,631 | 4.2 | 1,976 | 4.4 | 2,739 | 4.9 | 4,995 | 5.7 |
| 10 years | 1,341 | 3.9 | 1,572 | 4.0 | 1,849 | 4.1 | 2,628 | 4.7 | 4,562 | 5.2 |
| 11 years | 1,245 | 3.6 | 1,454 | 3.7 | 1,837 | 4.1 | 2,411 | 4.3 | 4,347 | 5.0 |
| 12 years | 1,315 | 3.8 | 1,397 | 3.6 | 1,857 | 4.1 | 2,464 | 4.4 | 4,269 | 4.9 |
| 13 years | 1,369 | 4.0 | 1,583 | 4.0 | 1,797 | 4.0 | 2,381 | 4.2 | 4,161 | 4.7 |
| 14 years | 1,548 | 4.5 | 1,638 | 4.2 | 1,890 | 4.2 | 2,317 | 4.1 | 3,948 | 4.5 |
| 15 years | 1,497 | 4.3 | 1,694 | 4.3 | 1,734 | 3.9 | 2,201 | 3.9 | 3,482 | 4.0 |
| 16 years | 1,487 | 4.3 | 1,569 | 4.0 | 1,682 | 3.7 | 1,925 | 3.4 | 3,116 | 3.6 |
| 17 years | 1,293 | 3.7 | 1,545 | 3.9 | 1,419 | 3.2 | 1,526 | 2.7 | 2,318 | 2.6 |
| TABLE 6. Demographic Profile of Children in DMH Inpatient Programs: FY 1990-1994 | ||||||||||
|---|---|---|---|---|---|---|---|---|---|---|
| 1990 | 1991 | 1992 | 1993 | 1994 | ||||||
| N | % | N | % | N | % | N | % | N | % | |
| All DMH Inpatient Children | 294 | 100 | 257 | 100 | 319 | 100 | 255 | 100 | 199 | 100 |
| Race/Ethnicity | ||||||||||
| White | 143 | 48.6 | 129 | 50.2 | 150 | 47.0 | 131 | 51.4 | 97 | 48.7 |
| African American | 122 | 41.5 | 110 | 42.8 | 132 | 41.4 | 98 | 38.4 | 83 | 41.7 |
| Hispanic | 26 | 8.8 | 16 | 6.2 | 31 | 9.7 | 24 | 9.4 | 17 | 8.5 |
| Asian | 0 | 0.0 | 1 | 0.4 | 4 | 1.3 | 2 | 0.8 | 2 | 1.0 |
| Native American | 0 | 0.0 | 0 | 0.0 | 1 | 0.3 | 0 | 0.0 | 0 | 0.0 |
| Other | 3 | 1.0 | 1 | 0.4 | 1 | 0.3 | 0 | 0.0 | 0 | 0.0 |
| Gender | ||||||||||
| Female | 113 | 38.4 | 148 | 57.6 | 113 | 35.4 | 95 | 37.3 | 588 | 295.5 |
| Male | 144 | 49.0 | 171 | 66.5 | 142 | 44.5 | 104 | 40.8 | 736 | 369.8 |
| Age at Beginning of Fiscal Year | ||||||||||
| Less than 1 year | 15 | 5.1 | 13 | 5.1 | 23 | 7.2 | 12 | 4.7 | 5 | 2.5 |
| 1 year | 5 | 1.7 | 5 | 1.9 | 11 | 3.4 | 9 | 3.5 | 7 | 3.5 |
| 2 years | 2 | 0.7 | 8 | 3.1 | 9 | 2.8 | 5 | 2.0 | 5 | 2.5 |
| 3 years | 4 | 1.4 | 8 | 3.1 | 8 | 2.5 | 9 | 3.5 | 5 | 2.5 |
| 4 years | 1 | 0.3 | 5 | 1.9 | 8 | 2.5 | 9 | 3.5 | 11 | 5.5 |
| 5 years | 18 | 6.1 | 2 | 0.8 | 7 | 2.2 | 4 | 1.6 | 4 | 2.0 |
| 6 years | 8 | 2.7 | 16 | 6.2 | 4 | 1.3 | 7 | 2.7 | 4 | 2.0 |
| 7 years | 9 | 3.1 | 8 | 3.1 | 18 | 5.6 | 8 | 3.1 | 4 | 2.0 |
| 8 years | 12 | 4.1 | 12 | 4.7 | 9 | 2.8 | 14 | 5.5 | 5 | 2.5 |
| 9 years | 12 | 4.1 | 9 | 3.5 | 8 | 2.5 | 14 | 5.5 | 12 | 6.0 |
| 10 years | 12 | 4.1 | 13 | 5.1 | 24 | 7.5 | 10 | 3.9 | 13 | 6.5 |
| 11 years | 18 | 6.1 | 14 | 5.4 | 24 | 7.5 | 18 | 7.1 | 8 | 4.0 |
| 12 years | 23 | 7.8 | 19 | 7.4 | 23 | 7.2 | 18 | 7.1 | 20 | 10.1 |
| 13 years | 25 | 8.5 | 18 | 7.0 | 23 | 7.2 | 23 | 9.0 | 25 | 12.6 |
| 14 years | 26 | 8.8 | 26 | 10.1 | 30 | 9.4 | 21 | 8.2 | 14 | 7.0 |
| 15 years | 34 | 11.6 | 34 | 13.2 | 27 | 8.5 | 30 | 11.8 | 12 | 6.0 |
| 16 years | 37 | 12.6 | 20 | 7.8 | 35 | 11.0 | 27 | 10.6 | 28 | 14.1 |
| 17 years | 33 | 11.2 | 27 | 10.5 | 28 | 8.8 | 17 | 6.7 | 17 | 8.5 |
| TABLE 7. Primary Characteristic Category for Children in Special Ed: FY 1990-1994 | ||||||||||
|---|---|---|---|---|---|---|---|---|---|---|
| Category | 1990 | 1991 | 1992 | 1993 | 1994 | |||||
| N | % | N | % | N | % | N | % | N | % | |
| Deaf and Blind | 3,842 | 1.7 | 3,864 | 1.7 | 4,073 | 1.7 | 3,942 | 1.8 | 4,044 | 2.0 |
| Learning Disabled | 100,382 | 43.9 | 103,440 | 45.2 | 112,210 | 46.7 | 100,699 | 46.2 | 96,556 | 48.8 |
| Mentally Retarded | 21,904 | 9.6 | 21,688 | 9.5 | 22,578 | 9.4 | 19,909 | 9.1 | 20,809 | 10.5 |
| Physical Disability | 3,200 | 1.4 | 3,230 | 1.4 | 3,121 | 1.3 | 3,402 | 1.6 | 3,013 | 1.5 |
| Speech or Language Disorder | 68,199 | 29.8 | 68,515 | 29.9 | 68,389 | 28.4 | 63,918 | 29.3 | 48,522 | 24.5 |
| Severely Emotionally Disturbed | 29,256 | 12.8 | 26,241 | 11.5 | 27,771 | 11.6 | 22,015 | 10.1 | 21,769 | 11.0 |
| Other Type of Disability | 1,978 | 0.9 | 2,037 | 0.9 | 2,275 | 0.9 | 4,061 | 1.9 | 3,307 | 1.7 |
| Total Number of Children | 228,762 | 100.0 | 229,015 | 100.0 | 240,417 | 100.0 | 217,946 | 100.0 | 198,020 | 100.0 |
| TABLE 8. Number of Children Selected from the Medicaid Services Database by ICD-9 Diagnostic Category: FY 1990-1994 | ||||||||||
|---|---|---|---|---|---|---|---|---|---|---|
| Diagnostic Category | 1990 | 1991 | 1992 | 1993 | 1994 | |||||
| N | % | N | % | N | % | N | % | N | % | |
| Infectious Diseases | 78 | 0.2 | 90 | 0.2 | 107 | 0.2 | 177 | 0.3 | 215 | 0.2 |
| AIDS | 16 | 0.0 | 35 | 0.1 | 42 | 0.1 | 86 | 0.2 | 97 | 0.1 |
| Other Infectious Diseases | 62 | 0.2 | 55 | 0.1 | 65 | 0.1 | 91 | 0.2 | 118 | 0.1 |
| Neoplasms | 433 | 1.3 | 558 | 1.4 | 772 | 1.7 | 1,122 | 2.0 | 1,299 | 1.5 |
| Endocrine, Nutritional and Metabolic Diseases | 628 | 1.8 | 847 | 2.2 | 1,200 | 2.7 | 1,132 | 2.0 | 1,733 | 2.0 |
| Diseases of the Blood and Blood Forming Organs | 956 | 2.8 | 1,090 | 2.8 | 1,175 | 2.6 | 1,140 | 2.0 | 1,331 | 1.5 |
| Sickle Cell Anemia | 800 | 2.3 | 882 | 2.2 | 936 | 2.1 | 867 | 1.5 | 985 | 1.1 |
| Other Diseases of the Blood and Blood Forming Organs | 156 | 0.5 | 208 | 0.5 | 239 | 0.5 | 273 | 0.5 | 346 | 0.4 |
| Mental Disorders | 7,214 | 20.9 | 8,574 | 21.9 | 11,697 | 26.0 | 19,748 | 35.2 | 35,707 | 40.7 |
| Developmental Speech or Language Disorder | 1,255 | 3.6 | 1,305 | 3.3 | 2,268 | 5.0 | 6,603 | 11.8 | 12,235 | 13.9 |
| Attention Deficit Disorders | 1,875 | 5.4 | 2,574 | 6.6 | 3,544 | 7.9 | 4,694 | 8.4 | 6,465 | 7.4 |
| Disturbance of Emotions Specific to Childhood and Adolescence | 164 | 0.5 | 268 | 0.7 | 571 | 1.3 | 1,044 | 1.9 | 7,603 | 8.7 |
| Other Mental Disorders | 3,920 | 11.3 | 4,427 | 11.3 | 5,314 | 11.8 | 7,407 | 13.2 | 9,404 | 10.7 |
| Diseases of the Nervous System and Sense Organs | 3,113 | 9.0 | 3,558 | 9.1 | 3,865 | 8.6 | 4,453 | 7.9 | 5,324 | 6.1 |
| Infantile Cerebral Palsy | 515 | 1.5 | 528 | 1.3 | 539 | 1.2 | 711 | 1.3 | 666 | 0.8 |
| Hearing Loss | 1,983 | 5.7 | 2,377 | 6.1 | 2,543 | 5.6 | 2,934 | 5.2 | 3,651 | 4.2 |
| Other Diseases of the Nervous System and Sense Organs | 615 | 1.8 | 653 | 1.7 | 783 | 1.7 | 808 | 1.4 | 1,007 | 1.1 |
| Diseases of the Circulatory System | 290 | 0.8 | 297 | 0.8 | 340 | 0.8 | 315 | 0.6 | 418 | 0.5 |
| Diseases of the Respiratory System | 1,728 | 5.0 | 1,572 | 4.0 | 1,888 | 4.2 | 3,248 | 5.8 | 4,671 | 5.3 |
| Asthma | 1,657 | 4.8 | 1,519 | 3.9 | 1,827 | 4.1 | 2,915 | 5.2 | 4,230 | 4.8 |
| Other Diseases of the Respiratory System | 71 | 0.2 | 53 | 0.1 | 61 | 0.1 | 333 | 0.6 | 441 | 0.5 |
| Diseases of the Digestive System | 103 | 0.3 | 107 | 0.3 | 111 | 0.2 | 109 | 0.2 | 134 | 0.2 |
| Diseases of the Genitourinary System | 207 | 0.6 | 194 | 0.5 | 211 | 0.5 | 197 | 0.4 | 251 | 0.3 |
| Complications of Pregnancy | 43 | 0.1 | 56 | 0.1 | 116 | 0.3 | 115 | 0.2 | 140 | 0.2 |
| Diseases of the Skin and Subcutaneous Tissue | 33 | 0.1 | 33 | 0.1 | 34 | 0.1 | 32 | 0.1 | 38 | 0.0 |
| Diseases of the Musculoskeletal System and Connective Tissue | 238 | 0.7 | 270 | 0.7 | 302 | 0.7 | 365 | 0.7 | 481 | 0.5 |
| Congenital Anomolies | 1,849 | 5.4 | 2,282 | 5.8 | 2,572 | 5.7 | 2,571 | 4.6 | 3,251 | 3.7 |
| Conditions Orignating in the Perinatal Period | 338 | 1.0 | 420 | 1.1 | 405 | 0.9 | 839 | 1.5 | 1,336 | 1.5 |
| Symptoms, Signs, and Ill-Defined Conditions | 167 | 0.5 | 235 | 0.6 | 321 | 0.7 | 645 | 1.2 | 1,054 | 1.2 |
| Injury and Poisoning | 247 | 0.7 | 208 | 0.5 | 266 | 0.6 | 432 | 0.8 | 706 | 0.8 |
| Supplementary Classification | 415 | 1.2 | 448 | 1.1 | 197 | 0.4 | 587 | 1.0 | 1,760 | 2.0 |
| Multiple Diagnoses | 4,953 | 14.3 | 6,169 | 15.7 | 7,449 | 16.5 | 9,611 | 17.1 | 16,765 | 19.1 |
| Unrequired Code | 3,642 | 10.5 | 4,452 | 11.3 | 4,848 | 10.8 | 2,390 | 4.3 | 1,835 | 2.1 |
| Institutional Claim | 7,866 | 22.8 | 7,765 | 19.8 | 7,162 | 15.9 | 7,162 | 12.8 | 9,315 | 10.6 |
| Total Number of Children | 34,541 | 100.0 | 39,225 | 100.0 | 45,038 | 100.0 | 56,063 | 100.0 | 87,764 | 100.0 |
| * Note: Multiple Diagnosis refers to the presence of diagnoses in more than one valid three digit diagnostic category during an fiscal year. ** Note: ICD-9 codes are not entered on claims for medical supplies and equipment. | ||||||||||
| TABLE 9. Number of Children Age 13 and Under by Consequtive Years of Program Participation: Entry Cohorts FY 1991-1994 | ||||||||||
|---|---|---|---|---|---|---|---|---|---|---|
| New Entry Cohort | 1 Year | 2 Years | 3 Years | 4 Years | 5 Years | |||||
| N | % | N | % | N | % | N | % | N | % | |
| AABD PROGRAM | ||||||||||
| FY 1991 | 3,685 | 100.0 | 3,376 | 91.6 | 2,856 | 77.5 | 2,578 | 70.0 | ||
| FY 1992 | 5,729 | 100.0 | 5,331 | 93.1 | 4,900 | 85.5 | ||||
| FY 1993 | 10,968 | 100.0 | 10,353 | 94.4 | ||||||
| FY 1994 | 10,327 | 100.0 | ||||||||
| SPECIAL EDUCATION PROGRAM | ||||||||||
| FY 1991 | 53,346 | 100.0 | 40,387 | 75.7 | 27,933 | 52.4 | 21,271 | 39.9 | ||
| FY 1992 | 52,241 | 100.0 | 35,970 | 68.9 | 27,316 | 52.3 | ||||
| FY 1993 | 43,667 | 100.0 | 31,385 | 71.9 | ||||||
| FY 1994 | 14,799 | 100.0 | ||||||||
| MEDICAID SERVICES | ||||||||||
| FY 1991 | 21,217 | 100.0 | 6,943 | 32.7 | 3,245 | 15.3 | 2,351 | 11.1 | ||
| FY 1992 | 22,950 | 100.0 | 7,391 | 32.2 | 4,219 | 18.4 | ||||
| FY 1993 | 28,422 | 100.0 | 12,754 | 44.9 | ||||||
| FY 1994 | 42,355 | 100.0 | ||||||||
| DMH INPATIENT SERVICES | ||||||||||
| FY 1991 | 82 | 100.0 | 16 | 19.5 | 12 | 14.6 | 11 | 13.4 | ||
| FY 1992 | 123 | 100.0 | 28 | 22.8 | 17 | 13.8 | ||||
| FY 1993 | 64 | 100.0 | 13 | 20.3 | ||||||
| FY 1994 | 46 | 100.0 | ||||||||
| TABLE 10. Number of Children Entering Disability Programs by Participation in the Past Year: Entry Cohorts FY 1991-1994 | |||||||||||
|---|---|---|---|---|---|---|---|---|---|---|---|
| Any Other Participation Last Year | Participation in AABD Last Year | Participation in Special Education Last Year | Participation in Medicaid Last Year | Participation in DMH Last Year | Total | ||||||
| N | % | N | % | N | % | N | % | N | % | N | |
| FY 1991 | |||||||||||
| New AABD Participants | 2,487 | 47.2 | N/A | N/A | 1,678 | 31.8 | 1,129 | 21.4 | 5 | 0.1 | 5,274 |
| New Special Education Participants | 1,988 | 3.2 | 570 | 0.9 | N/A | N/A | 1,700 | 2.7 | 8 | 0.0 | 63,060 |
| New Medicaid Service Participants | 3,753 | 14.2 | 991 | 3.8 | 3,351 | 12.7 | N/A | N/A | 2 | 0.0 | 26,390 |
| New DMH Participants | 31 | 22.1 | 10 | 7.1 | 25 | 17.9 | 19 | 13.6 | N/A | N/A | 140 |
| FY 1992 | |||||||||||
| New AABD Participants | 3,971 | 51.2 | N/A | N/A | 2,732 | 35.2 | 1,764 | 22.7 | 5 | 0.1 | 7,757 |
| New Special Education Participants | 2,476 | 4.0 | 813 | 1.3 | N/A | N/A | 2,043 | 3.3 | 4 | 0.0 | 62,208 |
| New Medicaid Service Participants | 4,074 | 14.7 | 874 | 3.1 | 3,738 | 13.5 | N/A | N/A | 2 | 0.0 | 27,763 |
| New DMH Participants | 45 | 22.1 | 12 | 5.9 | 33 | 16.2 | 25 | 12.3 | N/A | N/A | 204 |
| FY 1993 | |||||||||||
| New AABD Participants | 6,873 | 41.5 | N/A | N/A | 5,151 | 31.1 | 2,576 | 15.6 | 9 | 0.1 | 16,543 |
| New Special Education Participants | 2,793 | 5.5 | 845 | 1.7 | N/A | N/A | 2,429 | 4.8 | 7 | 0.0 | 50,325 |
| New Medicaid Service Participants | 6,365 | 18.7 | 1,224 | 3.6 | 5,981 | 17.5 | N/A | N/A | 2 | 0.0 | 34,122 |
| New DMH Participants | 30 | 24.0 | 8 | 6.4 | 23 | 18.4 | 18 | 14.4 | N/A | N/A | 125 |
| FY 1994 | |||||||||||
| New AABD Participants | 5,854 | 39.3 | N/A | N/A | 3,923 | 26.4 | 2,856 | 19.2 | 4 | 0.0 | 14,879 |
| New Special Education Participants | 1,978 | 10.8 | 848 | 4.6 | N/A | N/A | 1,481 | 8.1 | 2 | 0.0 | 18,246 |
| New Medicaid Service Participants | 10,630 | 20.6 | 3,044 | 5.9 | 9,435 | 18.3 | N/A | N/A | 3 | 0.0 | 51,522 |
| New DMH Participants | 12 | 15.2 | 8 | 10.1 | 10 | 12.7 | 8 | 10.1 | N/A | N/A | 79 |
| TABLE 11. Number of Children Per Fiscal Year by Type of Service Category: FY 1990-1994 | ||||||||||
|---|---|---|---|---|---|---|---|---|---|---|
| Type of Service | 1990 | 1991 | 1992 | 1993 | 1994 | |||||
| N | % | N | % | N | % | N | % | N | % | |
| AABD Services Only | 3,939 | 1.5 | 4,712 | 1.8 | 5,954 | 2.1 | 14,374 | 5.3 | 18,021 | 6.5 |
| Special Education Services Only | 216,987 | 83.7 | 215,265 | 81.6 | 221,722 | 79.3 | 193,464 | 70.9 | 163,210 | 58.8 |
| Medicaid Services Only | 24,230 | 9.4 | 27,395 | 10.4 | 29,918 | 10.7 | 35,395 | 13.0 | 54,172 | 19.5 |
| DMH Services Only | 195 | 0.1 | 173 | 0.1 | 226 | 0.1 | 183 | 0.1 | 147 | 0.1 |
| Special Education and Medicaid Services | 5,501 | 2.1 | 6,046 | 2.3 | 7,710 | 2.8 | 10,150 | 3.7 | 16,201 | 5.8 |
| AABD and Medicaid Services | 1,971 | 0.8 | 2,445 | 0.9 | 3,074 | 1.1 | 4,853 | 1.8 | 7,316 | 2.6 |
| AABD and Special Education Services | 3,444 | 1.3 | 4,376 | 1.7 | 6,661 | 2.4 | 8,692 | 3.2 | 8,539 | 3.1 |
| Medicaid and DMH Services | 8 | 0.0 | 10 | 0.0 | 14 | 0.0 | 20 | 0.0 | 6 | 0.0 |
| Special Education and DMH Services | 6 | 0.0 | 5 | 0.0 | 5 | 0.0 | 3 | 0.0 | 4 | 0.0 |
| AABD and DMH Services | 0 | 0.0 | 2 | 0.0 | 1 | 0.0 | 3 | 0.0 | 1 | 0.0 |
| AABD, Medicaid, and DMH Services | 7 | 0.0 | 6 | 0.0 | 3 | 0.0 | 8 | 0.0 | 6 | 0.0 |
| AABD, Special Education and Medicaid Services | 2,747 | 1.1 | 3,262 | 1.2 | 4,250 | 1.5 | 5,599 | 2.1 | 10,031 | 3.6 |
| AABD, Special Education, and DMH Services | 1 | 0.0 | 0 | 0.0 | 1 | 0.0 | 0 | 0.0 | 3 | 0.0 |
| Special Education, Medicaid, and DMH Services | 38 | 0.0 | 25 | 0.0 | 27 | 0.0 | 9 | 0.0 | 8 | 0.0 |
| AABD, Special Education, Medicaid, and DMH Services | 39 | 0.0 | 36 | 0.0 | 42 | 0.0 | 29 | 0.0 | 24 | 0.0 |
| Total Number of Children | 259,113 | 100.0 | 263,758 | 100.0 | 279,608 | 100.0 | 272,779 | 100.0 | 277,689 | 100.0 |
| TABLE 12. Summary of Multi-Service Utilization by Program Type: FY 1990-1994 | |||||
|---|---|---|---|---|---|
| 1990 | 1991 | 1992 | 1993 | 1994 | |
| ALL DISABLED CHILDREN | 259,113 | 263,758 | 279,608 | 272,779 | 277,689 |
| Multi-Service Users | 13,762 | 16,213 | 21,788 | 29,366 | 42,139 |
| Services | 5.3% | 6.1% | 7.8% | 10.8% | 15.2% |
| Number of Children | |||||
| AABD | 12,148 | 14,839 | 19,986 | 33,555 | 43,941 |
| AABD and Special Education | 6,231 | 7,674 | 10,954 | 14,320 | 18,597 |
| AABD and Medicaid | 4,764 | 5,749 | 7,369 | 10,489 | 17,377 |
| AABD and DMH | 40 | 38 | 44 | 32 | 28 |
| AABD and any other service | 8,209 | 10,127 | 14,032 | 19,184 | 25,920 |
| Percentage of AABD Children | |||||
| % of AABD and Special Education | 51.3% | 51.7% | 54.8% | 42.7% | 42.3% |
| % of AABD and Medicaid | 39.2% | 38.7% | 36.9% | 31.3% | 39.5% |
| % of AABD and DMH | 0.3% | 0.3% | 0.2% | 0.1% | 0.1% |
| % of AABD and any other service | 67.6% | 68.2% | 70.2% | 57.2% | 59.0% |
| Number of Children | |||||
| SPECIAL EDUCATION | 228,763 | 229,015 | 240,418 | 217,946 | 198,020 |
| Special Education and AABD | 6,231 | 7,674 | 10,954 | 14,320 | 18,597 |
| Special Education and Medicaid | 8,325 | 9,369 | 12,029 | 15,787 | 26,264 |
| Special Education and DMH | 84 | 66 | 75 | 41 | 39 |
| Special Education and any other service | 11,776 | 13,750 | 18,696 | 24,482 | 34,810 |
| Percentage of Special Education Children | |||||
| % of Special Education and AABD | 2.7% | 3.4% | 4.6% | 6.6% | 9.4% |
| % of Special Education and Medicaid | 3.6% | 4.1% | 5.0% | 7.2% | 13.3% |
| % of Special Education and DMH | 0.0% | 0.0% | 0.0% | 0.0% | 0.0% |
| % of Special Education and any other service | 5.1% | 6.0% | 7.8% | 11.2% | 17.6% |
| Number of Children | |||||
| MEDICAID SERVICES | 34,541 | 39,225 | 45,038 | 56,063 | 87,764 |
| Medicaid and AABD | 4,764 | 5,749 | 7,369 | 10,489 | 17,377 |
| Medicaid and Special Education | 8,325 | 9,369 | 12,029 | 15,787 | 26,264 |
| Medicaid and DMH | 92 | 77 | 86 | 66 | 44 |
| Medicaid and any other service | 10,311 | 11,830 | 15,120 | 20,668 | 33,592 |
| Percentage of Medicaid Children | |||||
| % of Medicaid and AABD | 13.8% | 14.7% | 16.4% | 18.7% | 19.8% |
| % of Medicaid and Special Education | 24.1% | 23.9% | 26.7% | 28.2% | 29.9% |
| % of Medicaid and DMH | 0.3% | 0.2% | 0.2% | 0.1% | 0.1% |
| % of Medicaid and any other service | 29.9% | 30.2% | 33.6% | 36.9% | 38.3% |
| Number of Children | |||||
| DMH SERVICES | 294 | 257 | 319 | 255 | 199 |
| DMH and AABD | 47 | 44 | 47 | 40 | 34 |
| DMH and Special Education | 84 | 66 | 75 | 41 | 39 |
| DMH and Medicaid | 92 | 77 | 86 | 66 | 44 |
| DMH and any other service | 99 | 84 | 93 | 72 | 52 |
| Percentage of DMH Children | |||||
| % of DMH and AABD | 16.0% | 17.1% | 14.7% | 15.7% | 17.1% |
| % of DMH and Special Education | 28.6% | 25.7% | 23.5% | 16.1% | 19.6% |
| % of DMH and Medicaid | 31.3% | 30.0% | 27.0% | 25.9% | 22.1% |
| % of DMH and any other service | 33.7% | 32.7% | 29.2% | 28.2% | 26.1% |
| TABLE 13. Number of Children Per Fiscal Year of Entry by Type of Service Category: Entry Cohorts FY 1991-1994 | ||||||||
|---|---|---|---|---|---|---|---|---|
| Type of Service | 1991 | 1992 | 1993 | 1994 | ||||
| N | % | N | % | N | % | N | % | |
| AABD Services Only | 1,771 | 2.1 | 2,104 | 2.5 | 6,849 | 8.7 | 5,642 | 9.6 |
| Special Education Services Only | 59,338 | 70.5 | 56,972 | 68.6 | 44,017 | 56.0 | 14,052 | 23.8 |
| Medicaid Services Only | 20,697 | 24.6 | 21,109 | 25.4 | 24,018 | 30.6 | 36,103 | 61.2 |
| DMH Services Only | 102 | 0.1 | 149 | 0.2 | 90 | 0.1 | 60 | 0.1 |
| Special Education and Medicaid Services | 1,262 | 1.5 | 1,472 | 1.8 | 1,858 | 2.4 | 1,245 | 2.1 |
| AABD and Medicaid Services | 550 | 0.7 | 541 | 0.7 | 948 | 1.2 | 1,495 | 2.5 |
| AABD and Special Education Services | 344 | 0.4 | 554 | 0.7 | 544 | 0.7 | 243 | 0.4 |
| Medicaid and DMH Services | 1 | 0.0 | 4 | 0.0 | 0 | 0.0 | 1 | 0.0 |
| Special Education and DMH Services | 1 | 0.0 | 1 | 0.0 | 0 | 0.0 | 1 | 0.0 |
| AABD and DMH Services | 0 | 0.0 | 0 | 0.0 | 1 | 0.0 | 0 | 0.0 |
| AABD, Medicaid, and DMH Services | 0 | 0.0 | 0 | 0.0 | 0 | 0.0 | 0 | 0.0 |
| AABD, Special Education and Medicaid Services | 122 | 0.1 | 166 | 0.2 | 228 | 0.3 | 172 | 0.3 |
| AABD, Special Education, and DMH Services | 0 | 0.0 | 0 | 0.0 | 0 | 0.0 | 0 | 0.0 |
| Special Education, Medicaid, and DMH Services | 5 | 0.0 | 1 | 0.0 | 0 | 0.0 | 0 | 0.0 |
| AABD, Special Education, Medicaid, and DMH Services | 0 | 0.0 | 0 | 0.0 | 0 | 0.0 | 0 | 0.0 |
| Total Number of Children | 84,193 | 100.0 | 83,073 | 100.0 | 78,553 | 100.0 | 59,014 | 100.0 |
| TABLE 14. Summary of Multi-Service Utilization by Program Type: Entry Cohorts FY 1991-1994 | ||||
|---|---|---|---|---|
| 1991 | 1992 | 1993 | 1994 | |
| ALL DISABLED CHILDREN | 84,193 | 83,073 | 78,553 | 59,014 |
| Multi-Service Users | 2,285 | 2,739 | 3,579 | 3,157 |
| Services | 2.7% | 3.3% | 4.6% | 5.3% |
| Number of Children | ||||
| AABD | 2,787 | 3,365 | 8,570 | 7,552 |
| AABD and Special Education | 466 | 720 | 772 | 415 |
| AABD and Medicaid | 672 | 707 | 1,176 | 1,667 |
| AABD and DMH | 0 | 0 | 1 | 0 |
| AABD and any other service | 1,016 | 1,216 | 1,721 | 1,910 |
| Percentage of AABD Children | ||||
| % of AABD and Special Education | 16.7% | 21.4% | 9.0% | 5.5% |
| % of AABD and Medicaid | 24.1% | 21.0% | 13.7% | 22.1% |
| % of AABD and DMH | 0.0% | 0.0% | 0.0% | 0.0% |
| % of AABD and any other service | 36.5% | 37.5% | 20.1% | 25.3% |
| Number of Children | ||||
| SPECIAL EDUCATION | 61,072 | 59,166 | 46,647 | 15,713 |
| Special Education and AABD | 466 | 720 | 772 | 415 |
| Special Education and Medicaid | 672 | 707 | 1,176 | 1,667 |
| Special Education and DMH | 6 | 2 | 0 | 1 |
| Special Education and any other service | 1,734 | 2,194 | 2,630 | 1,661 |
| Percentage of Special Education Children | ||||
| % of Special Education and AABD | 0.8% | 1.2% | 1.7% | 2.6% |
| % of Special Education and Medicaid | 1.1% | 1.2% | 2.5% | 10.6% |
| % of Special Education and DMH | 0.0% | 0.0% | 0.0% | 0.0% |
| % of Special Education and any other service | 2.8% | 3.7% | 5.6% | 10.6% |
| Number of Children | ||||
| MEDICAID SERVICES | 22,637 | 23,293 | 27,052 | 39,016 |
| Medicaid and AABD | 672 | 707 | 1,176 | 1,667 |
| Medicaid and Special Education | 1,389 | 1,639 | 2,086 | 1,417 |
| Medicaid and DMH | 6 | 5 | 0 | 1 |
| Medicaid and any other service | 1,940 | 2,184 | 3,034 | 2,913 |
| Percentage of Medicaid Children | ||||
| % of Medicaid and AABD | 3.0% | 3.0% | 4.3% | 4.3% |
| % of Medicaid and Special Education | 6.1% | 7.0% | 7.7% | 3.6% |
| % of Medicaid and DMH | 0.0% | 0.0% | 0.0% | 0.0% |
| % of Medicaid and any other service | 8.6% | 9.4% | 11.2% | 7.5% |
| Number of Children | ||||
| DMH SERVICES | 109 | 055 | 91 | 62 |
| DMH and AABD | 0 | 0 | 1 | 0 |
| DMH and Special Education | 6 | 2 | 0 | 1 |
| DMH and Medicaid | 6 | 5 | 0 | 1 |
| DMH and any other service | 7 | 6 | 1 | 2 |
| Percentage of DMH Children | ||||
| % of DMH and AABD | 0.0% | 0.0% | 1.1% | 0.0% |
| % of DMH and Special Education | 5.5% | 1.3% | 0.0% | 1.6% |
| % of DMH and Medicaid | 5.5% | 3.2% | 0.0% | 1.6% |
| % of DMH and any other service | 6.4% | 3.9% | 1.1% | 3.2% |
| TABLE 15. Number of Single Service Children Indicated for Future Multi-Service Use: Entry Cohorts FY 1991-1993 | ||||||||
|---|---|---|---|---|---|---|---|---|
| Initial Type of Service | Fiscal Year of Entry | After 1 Year | After 2 Years | After 3 Years | Total | |||
| N | % | N | % | N | % | N | ||
| All Single Service Users | 1991 | 3,559 | 4.3 | 6,823 | 8.3 | 9,637 | 11.8 | 81,908 |
| 1992 | 5,038 | 6.3 | 8,744 | 10.9 | 80,334 | |||
| 1993 | 4,592 | 6.1 | 74,974 | |||||
| AABD Services Only | 1991 | 299 | 16.9 | 411 | 23.2 | 505 | 28.5 | 1,771 |
| 1992 | 325 | 15.4 | 552 | 26.2 | - | - | 2,104 | |
| 1993 | 740 | 10.8 | - | - | - | - | 6,849 | |
| Special Education Services Only | 1991 | 1,419 | 2.4 | 3,259 | 5.5 | 5,391 | 9.1 | 59,338 |
| 1992 | 2,590 | 4.5 | 5,313 | 9.3 | - | - | 56,972 | |
| 1993 | 2,002 | 4.5 | - | - | - | - | 44,107 | |
| Medicaid Services Only | 1991 | 1,839 | 8.9 | 3,149 | 15.2 | 3,737 | 18.1 | 20,697 |
| 1992 | 2,122 | 10.1 | 2,875 | 13.6 | - | - | 21,109 | |
| 1993 | 1,848 | 7.7 | - | - | - | - | 24,018 | |
| DMH Services Only | 1991 | 2 | 2.0 | 4 | 3.9 | 4 | 3.9 | 102 |
| 1992 | 1 | 0.7 | 4 | 2.7 | - | - | 149 | |
| 1993 | 2 | 2.2 | - | - | - | - | 90 | |
| TABLE 16. Number of Children Receiving Special Education by Primary Characteristic Category and Type of Service: FY 1990-1994 | |||||||
|---|---|---|---|---|---|---|---|
| Category | Special Education | Special Education and AABD Services | Special Education and Medicaid Services | Percent of Special Education Children in AABD or Medicaid | |||
| N | % | N | % | N | % | % | |
| FY 1990 | |||||||
| Deaf and Blind | 3,843 | 1.7 | 476 | 7.6 | 309 | 3.7 | 15.5 |
| Learning Disabled | 100,382 | 43.9 | 585 | 9.4 | 1,768 | 21.2 | 2.2 |
| Mentally Retarded | 21,904 | 9.6 | 3,303 | 53.0 | 2,112 | 25.4 | 18.3 |
| Physical Disability | 3,200 | 1.4 | 668 | 10.7 | 616 | 7.4 | 25.0 |
| Speech or Language Disorder | 68,199 | 29.8 | 181 | 2.9 | 1,156 | 13.9 | 1.9 |
| Severely Emotionally Disturbed | 29,256 | 12.8 | 763 | 12.2 | 2,110 | 25.3 | 8.7 |
| Other Type of Disability | 1,978 | 0.9 | 255 | 4.1 | 254 | 3.1 | 18.8 |
| Total Number of Children | 228,762 | 100.0 | 6,231 | 100.0 | 8,325 | 100.0 | 5.1 |
| FY 1991 | |||||||
| Deaf and Blind | 3,864 | 1.7 | 525 | 6.8 | 410 | 4.4 | 18.1 |
| Learning Disabled | 103,440 | 45.2 | 958 | 12.5 | 2,168 | 23.1 | 2.8 |
| Mentally Retarded | 21,688 | 9.5 | 3,804 | 49.6 | 2,272 | 24.3 | 21.0 |
| Physical Disability | 3,230 | 1.4 | 758 | 9.9 | 715 | 7.6 | 28.3 |
| Speech or Language Disorder | 68,515 | 29.9 | 259 | 3.4 | 1,299 | 13.9 | 2.1 |
| Severely Emotionally Disturbed | 26,241 | 11.5 | 1,042 | 13.6 | 2,167 | 23.1 | 10.6 |
| Other Type of Disability | 2,037 | 0.9 | 328 | 4.3 | 338 | 3.6 | 23.8 |
| Total Number of Children | 229,015 | 100.0 | 7,674 | 100.0 | 9,369 | 100.0 | 6.0 |
| FY 1992 | |||||||
| Deaf and Blind | 4,073 | 1.7 | 654 | 6.0 | 432 | 3.6 | 20.0 |
| Learning Disabled | 112,210 | 46.7 | 2,177 | 19.9 | 3,113 | 25.9 | 4.2 |
| Mentally Retarded | 22,578 | 9.4 | 4,895 | 44.7 | 2,759 | 22.9 | 25.7 |
| Physical Disability | 3,121 | 1.3 | 755 | 6.9 | 715 | 5.9 | 29.6 |
| Speech or Language Disorder | 68,389 | 28.4 | 493 | 4.5 | 1,916 | 15.9 | 3.2 |
| Severely Emotionally Disturbed | 27,771 | 11.6 | 1,587 | 14.5 | 2,687 | 22.3 | 13.1 |
| Other Type of Disability | 2,275 | 0.9 | 393 | 3.6 | 407 | 3.4 | 25.5 |
| Total Number of Children | 240,417 | 100.0 | 10,954 | 100.0 | 12,029 | 100.0 | 7.8 |
| FY 1993 | |||||||
| Deaf and Blind | 3,942 | 1.8 | 705 | 4.9 | 592 | 3.7 | 22.4 |
| Learning Disabled | 100,699 | 46.2 | 3,875 | 27.1 | 3,962 | 25.1 | 6.8 |
| Mentally Retarded | 19,909 | 9.1 | 5,312 | 37.1 | 3,031 | 19.2 | 31.6 |
| Physical Disability | 3,402 | 1.6 | 891 | 6.2 | 937 | 5.9 | 33.9 |
| Speech or Language Disorder | 63,918 | 29.3 | 953 | 6.7 | 3,859 | 24.4 | 6.9 |
| Severely Emotionally Disturbed | 22,015 | 10.1 | 1,984 | 13.9 | 2,596 | 16.4 | 17.5 |
| Other Type of Disability | 4,061 | 1.9 | 600 | 4.2 | 810 | 5.1 | 26.0 |
| Total Number of Children | 217,946 | 100.0 | 14,320 | 100.0 | 15,787 | 100.0 | 11.2 |
| FY 1994 | |||||||
| Deaf and Blind | 4,044 | 2.0 | 830 | 4.5 | 845 | 3.2 | 26.2 |
| Learning Disabled | 96,556 | 48.8 | 5,752 | 30.9 | 8,429 | 32.1 | 12.1 |
| Mentally Retarded | 20,809 | 10.5 | 6,536 | 35.1 | 5,123 | 19.5 | 39.3 |
| Physical Disability | 3,013 | 1.5 | 855 | 4.6 | 930 | 3.5 | 36.2 |
| Speech or Language Disorder | 48,522 | 24.5 | 1,150 | 6.2 | 5,534 | 21.1 | 12.3 |
| Severely Emotionally Disturbed | 21,769 | 11.0 | 2,783 | 15.0 | 4,567 | 17.4 | 26.5 |
| Other Type of Disability | 3,307 | 1.7 | 691 | 3.7 | 836 | 3.2 | 31.6 |
| Total Number of Children | 198,020 | 100.0 | 18,597 | 100.0 | 26,264 | 100.0 | 17.6 |
| TABLE 17a. Number of Children Receiving Medicaid Services by Type of Selection and Type of Service: FY 1990 | |||||||
|---|---|---|---|---|---|---|---|
| Type of Selection | Medicaid Services | Medicaid Services and Special Education | Medicaid Services and AABD | Percent of Medicaid Services Receiving Special Education or AABD | |||
| N | % | N | % | N | % | % | |
| ICD-9-CM DIAGNOSIS SELECTION | |||||||
| Infectious Diseases | 41 | 0.1 | 4 | 0.0 | 4 | 0.1 | 19.5 |
| AIDS | 20 | 0.1 | 0 | 0.0 | 2 | 0.0 | 10.0 |
| Other Infectious Diseases | 21 | 0.1 | 4 | 0.0 | 2 | 0.0 | 28.6 |
| Neoplasms | 471 | 1.4 | 70 | 0.8 | 86 | 1.8 | 27.0 |
| Endocrine, Nutritional and Metabolic Diseases | 678 | 2.0 | 70 | 0.8 | 70 | 1.5 | 16.4 |
| Diseases of the Blood and Blood Forming Organs | 1,027 | 3.0 | 96 | 1.2 | 219 | 4.6 | 26.0 |
| Sickle Cell Anemia | 850 | 2.5 | 72 | 0.9 | 194 | 4.1 | 26.5 |
| Other Diseases of the Blood and Blood Forming Organs | 177 | 0.5 | 24 | 0.3 | 25 | 0.5 | 23.7 |
| Mental Disorders | 7,776 | 22.5 | 2,837 | 34.1 | 583 | 12.2 | 38.9 |
| Developmental Speech or Language Disorder | 1,381 | 4.0 | 769 | 9.2 | 115 | 2.4 | 57.6 |
| Attention Deficit Disorders | 1,920 | 5.6 | 861 | 10.3 | 127 | 2.7 | 46.1 |
| Disturbance of Emotions Specific to Childhood and Adolescence | 176 | 0.5 | 52 | 0.6 | 8 | 0.2 | 31.8 |
| Other Mental Disorders | 4,299 | 12.4 | 1,155 | 13.9 | 333 | 7.0 | 30.0 |
| Diseases of the Nervous System and Sense Organs | 3,913 | 11.3 | 1,355 | 16.3 | 1,130 | 23.7 | 44.0 |
| Infantile Cerebral Palsy | 1,127 | 3.3 | 666 | 8.0 | 784 | 16.5 | 80.9 |
| Hearing Loss | 2,241 | 6.5 | 569 | 6.8 | 234 | 4.9 | 28.7 |
| Other Diseases of the Nervous System and Sense Organs | 545 | 1.6 | 120 | 1.4 | 112 | 2.4 | 30.3 |
| Diseases of the Circulatory System | 306 | 0.9 | 35 | 0.4 | 18 | 0.4 | 14.1 |
| Diseases of the Respiratory System | 1,992 | 5.8 | 111 | 1.3 | 94 | 2.0 | 9.1 |
| Asthma | 1,982 | 5.7 | 109 | 1.3 | 94 | 2.0 | 9.0 |
| Other Diseases of the Respiratory System | 10 | 0.0 | 2 | 0.0 | 0 | 0.0 | 20.0 |
| Diseases of the Digestive System | 68 | 0.2 | 11 | 0.1 | 6 | 0.1 | 22.1 |
| Diseases of the Genitourinary System | 216 | 0.6 | 24 | 0.3 | 19 | 0.4 | 18.5 |
| Diseases of the Skin and Subcutaneous Tissue | 4 | 0.0 | 1 | 0.0 | 0 | 0.0 | 25.0 |
| Diseases of the Musculoskeletal System and Connective Tissue | 264 | 0.8 | 56 | 0.7 | 43 | 0.9 | 29.2 |
| Congenital Anomolies | 2,392 | 6.9 | 318 | 3.8 | 389 | 8.2 | 21.8 |
| Conditions Originating in the Perinatal Period | 26 | 0.1 | 0 | 0.0 | 0 | 0.0 | 0.0 |
| Injury and Poisoning | 39 | 0.1 | 4 | 0.0 | 3 | 0.1 | 12.8 |
| Supplementary Classification | 7 | 0.0 | 1 | 0.0 | 4 | 0.1 | 57.1 |
| Multiple Diagnoses | 3,056 | 8.8 | 1,183 | 14.2 | 716 | 15.0 | 48.5 |
| OTHER SELECTION METHOD | |||||||
| Inpatient Hospitalization | 3,183 | 9.2 | 237 | 2.8 | 157 | 3.3 | 10.7 |
| Provider Type | 2,729 | 7.9 | 695 | 8.3 | 524 | 11.0 | 31.7 |
| Category of Service | 6,353 | 18.4 | 1,217 | 14.6 | 699 | 14.7 | 23.1 |
| Total Number of Children | 34,541 | 100.0 | 8,325 | 100.0 | 4,764 | 100.0 | 29.8 |
| TABLE 17b. Number of Children Receiving Medicaid Services by Type of Selection and Type of Service: FY 1991 | |||||||
|---|---|---|---|---|---|---|---|
| Type of Selection | Medicaid Services | Medicaid Services and Special Education | Medicaid Services and AABD | Percent of Medicaid Services Receiving Special Education or AABD | |||
| N | % | N | % | N | % | % | |
| ICD-9-CM DIAGNOSIS SELECTION | |||||||
| Infectious Diseases | 60 | 0.2 | 3 | 0.0 | 7 | 0.1 | 15.0 |
| AIDS | 43 | 0.1 | 3 | 0.0 | 6 | 0.1 | 18.6 |
| Other Infectious Diseases | 17 | 0.0 | 0 | 0.0 | 1 | 0.0 | 5.9 |
| Neoplasms | 619 | 1.6 | 67 | 0.7 | 101 | 1.8 | 22.9 |
| Endocrine, Nutritional and Metabolic Diseases | 892 | 2.3 | 85 | 0.9 | 87 | 1.5 | 16.0 |
| Diseases of the Blood and Blood Forming Organs | 1,171 | 3.0 | 117 | 1.2 | 285 | 5.0 | 28.7 |
| Sickle Cell Anemia | 941 | 2.4 | 94 | 1.0 | 240 | 4.2 | 29.6 |
| Other Diseases of the Blood and Blood Forming Organs | 230 | 0.6 | 23 | 0.2 | 45 | 0.8 | 24.8 |
| Mental Disorders | 9,305 | 23.7 | 3,221 | 34.4 | 852 | 14.8 | 37.8 |
| Developmental Speech or Language Disorder | 1,460 | 3.7 | 751 | 8.0 | 155 | 2.7 | 55.0 |
| Attention Deficit Disorders | 2,645 | 6.7 | 1,077 | 11.5 | 223 | 3.9 | 43.0 |
| Disturbance of Emotions Specific to Childhood and Adolescence | 288 | 0.7 | 86 | 0.9 | 17 | 0.3 | 32.3 |
| Other Mental Disorders | 4,912 | 12.5 | 1,307 | 14.0 | 457 | 7.9 | 30.2 |
| Diseases of the Nervous System and Sense Organs | 4,538 | 11.6 | 1,499 | 16.0 | 1,251 | 21.8 | 41.6 |
| Infantile Cerebral Palsy | 1,198 | 3.1 | 705 | 7.5 | 815 | 14.2 | 79.5 |
| Hearing Loss | 2,751 | 7.0 | 647 | 6.9 | 291 | 5.1 | 26.5 |
| Other Diseases of the Nervous System and Sense Organs | 589 | 1.5 | 147 | 1.6 | 145 | 2.5 | 34.8 |
| Diseases of the Circulatory System | 311 | 0.8 | 24 | 0.3 | 16 | 0.3 | 10.6 |
| Diseases of the Respiratory System | 1,861 | 4.7 | 118 | 1.3 | 103 | 1.8 | 10.2 |
| Asthma | 1,855 | 4.7 | 116 | 1.2 | 102 | 1.8 | 10.1 |
| Other Diseases of the Respiratory System | 6 | 0.0 | 2 | 0.0 | 1 | 0.0 | 33.3 |
| Diseases of the Digestive System | 75 | 0.2 | 10 | 0.1 | 9 | 0.2 | 21.3 |
| Diseases of the Genitourinary System | 198 | 0.5 | 25 | 0.3 | 16 | 0.3 | 18.2 |
| Diseases of the Skin and Subcutaneous Tissue | 4 | 0.0 | 1 | 0.0 | 0 | 0.0 | 25.0 |
| Diseases of the Musculoskeletal System and Connective Tissue | 300 | 0.8 | 76 | 0.8 | 42 | 0.7 | 31.7 |
| Congenital Anomolies | 2,849 | 7.3 | 386 | 4.1 | 441 | 7.7 | 21.4 |
| Conditions Originating in the Perinatal Period | 90 | 0.2 | 1 | 0.0 | 0 | 0.0 | 1.1 |
| Injury and Poisoning | 31 | 0.1 | 2 | 0.0 | 3 | 0.1 | 16.1 |
| Supplementary Classification | 19 | 0.0 | 3 | 0.0 | 6 | 0.1 | 31.6 |
| Multiple Diagnoses | 4,006 | 10.2 | 1,552 | 16.6 | 1,005 | 17.5 | 49.7 |
| OTHER SELECTION METHOD | |||||||
| Inpatient Hospitalization | 2,791 | 7.1 | 189 | 2.0 | 157 | 2.7 | 10.7 |
| Provider Type | 2,873 | 7.3 | 629 | 6.7 | 497 | 8.6 | 27.9 |
| Category of Service | 7,232 | 18.4 | 1,361 | 14.5 | 871 | 15.2 | 23.5 |
| Total Number of Children | 39,225 | 100.0 | 9,369 | 100.0 | 5,749 | 100.0 | 30.1 |
| TABLE 17c. Number of Children Receiving Medicaid Services by Type of Selection and Type of Service: FY 1992 | |||||||
|---|---|---|---|---|---|---|---|
| Type of Selection | Medicaid Services | Medicaid Services and Special Education | Medicaid Services and AABD | Percent of Medicaid Services Receiving Special Education or AABD | |||
| N | % | N | % | N | % | % | |
| ICD-9-CM DIAGNOSIS SELECTION | |||||||
| Infectious Diseases | 63 | 0.1 | 10 | 0.1 | 14 | 0.2 | 36.5 |
| AIDS | 53 | 0.1 | 8 | 0.1 | 10 | 0.1 | 34.0 |
| Other Infectious Diseases | 10 | 0.0 | 2 | 0.0 | 4 | 0.1 | 50.0 |
| Neoplasms | 845 | 1.9 | 76 | 0.6 | 114 | 1.5 | 19.4 |
| Endocrine, Nutritional and Metabolic Diseases | 1,281 | 2.8 | 112 | 0.9 | 113 | 1.5 | 14.4 |
| Diseases of the Blood and Blood Forming Organs | 1,247 | 2.8 | 128 | 1.1 | 352 | 4.8 | 32.1 |
| Sickle Cell Anemia | 987 | 2.2 | 104 | 0.9 | 295 | 4.0 | 33.8 |
| Other Diseases of the Blood and Blood Forming Organs | 260 | 0.6 | 24 | 0.2 | 57 | 0.8 | 25.4 |
| Mental Disorders | 12,481 | 27.7 | 5,002 | 41.6 | 1,483 | 20.1 | 43.8 |
| Developmental Speech or Language Disorder | 2,501 | 5.6 | 1,649 | 13.7 | 429 | 5.8 | 69.9 |
| Attention Deficit Disorders | 3,623 | 8.0 | 1,518 | 12.6 | 430 | 5.8 | 45.7 |
| Disturbance of Emotions Specific to Childhood and Adolescence | 599 | 1.3 | 181 | 1.5 | 59 | 0.8 | 33.6 |
| Other Mental Disorders | 5,758 | 12.8 | 1,654 | 13.8 | 565 | 7.7 | 32.4 |
| Diseases of the Nervous System and Sense Organs | 4,687 | 10.4 | 1,594 | 13.3 | 1,330 | 18.0 | 42.6 |
| Infantile Cerebral Palsy | 1,277 | 2.8 | 767 | 6.4 | 871 | 11.8 | 81.1 |
| Hearing Loss | 2,837 | 6.3 | 679 | 5.6 | 314 | 4.3 | 27.0 |
| Other Diseases of the Nervous System and Sense Organs | 573 | 1.3 | 148 | 1.2 | 145 | 2.0 | 33.9 |
| Diseases of the Circulatory System | 359 | 0.8 | 31 | 0.3 | 20 | 0.3 | 12.3 |
| Diseases of the Respiratory System | 2,276 | 5.1 | 168 | 1.4 | 194 | 2.6 | 13.4 |
| Asthma | 2,272 | 5.0 | 168 | 1.4 | 194 | 2.6 | 13.4 |
| Other Diseases of the Respiratory System | 4 | 0.0 | 0 | 0.0 | 0 | 0.0 | 0.0 |
| Diseases of the Digestive System | 76 | 0.2 | 8 | 0.1 | 11 | 0.1 | 19.7 |
| Diseases of the Genitourinary System | 207 | 0.5 | 27 | 0.2 | 24 | 0.3 | 20.8 |
| Diseases of the Skin and Subcutaneous Tissue | 4 | 0.0 | 0 | 0.0 | 0 | 0.0 | 0.0 |
| Diseases of the Musculoskeletal System and Connective Tissue | 314 | 0.7 | 83 | 0.7 | 59 | 0.8 | 35.7 |
| Congenital Anomolies | 3,069 | 6.8 | 466 | 3.9 | 527 | 7.2 | 23.4 |
| Conditions Originating in the Perinatal Period | 69 | 0.2 | 0 | 0.0 | 0 | 0.0 | 0.0 |
| Injury and Poisoning | 80 | 0.2 | 7 | 0.1 | 2 | 0.0 | 11.3 |
| Supplementary Classification | 19 | 0.0 | 5 | 0.0 | 11 | 0.1 | 63.2 |
| Multiple Diagnoses | 4,874 | 10.8 | 1,995 | 16.6 | 1,404 | 19.1 | 53.3 |
| OTHER SELECTION METHOD | |||||||
| Inpatient Hospitalization | 2,100 | 4.7 | 150 | 1.2 | 173 | 2.3 | 12.4 |
| Provider Type | 2,671 | 5.9 | 573 | 4.8 | 498 | 6.8 | 27.9 |
| Category of Service | 8,316 | 18.5 | 1,594 | 13.3 | 1,040 | 14.1 | 24.1 |
| Total Number of Children | 45,038 | 100.0 | 12,029 | 100.0 | 7,369 | 100.0 | 33.5 |
| TABLE 17d. Number of Children Receiving Medicaid Services by Type of Selection and Type of Service: FY 1993 | |||||||
|---|---|---|---|---|---|---|---|
| Type of Selection | Medicaid Services | Medicaid Services and Special Education | Medicaid Services and AABD | Percent of Medicaid Services Receiving Special Education or AABD | |||
| N | % | N | % | N | % | % | |
| ICD-9-CM DIAGNOSIS SELECTION | |||||||
| Infectious Diseases | 115 | 0.2 | 8 | 0.1 | 31 | 0.3 | 31.3 |
| AIDS | 102 | 0.2 | 6 | 0.0 | 30 | 0.3 | 32.4 |
| Other Infectious Diseases | 13 | 0.0 | 2 | 0.0 | 1 | 0.0 | 23.1 |
| Neoplasms | 1,190 | 2.1 | 74 | 0.5 | 131 | 1.2 | 15.0 |
| Endocrine, Nutritional and Metabolic Diseases | 1,187 | 2.1 | 92 | 0.6 | 143 | 1.4 | 15.8 |
| Diseases of the Blood and Blood Forming Organs | 1,196 | 2.1 | 94 | 0.6 | 364 | 3.5 | 33.1 |
| Sickle Cell Anemia | 909 | 1.6 | 77 | 0.5 | 308 | 2.9 | 36.5 |
| Other Diseases of the Blood and Blood Forming Organs | 287 | 0.5 | 17 | 0.1 | 56 | 0.5 | 22.3 |
| Mental Disorders | 20,740 | 37.0 | 8,539 | 54.1 | 3,401 | 32.4 | 47.5 |
| Developmental Speech or Language Disorder | 7,138 | 12.7 | 4,948 | 31.3 | 1,481 | 14.1 | 74.3 |
| Attention Deficit Disorders | 4,800 | 8.6 | 1,602 | 10.1 | 793 | 7.6 | 40.9 |
| Disturbance of Emotions Specific to Childhood and Adolescence | 1,106 | 2.0 | 273 | 1.7 | 132 | 1.3 | 30.4 |
| Other Mental Disorders | 7,696 | 13.7 | 1,716 | 10.9 | 995 | 9.5 | 29.3 |
| Diseases of the Nervous System and Sense Organs | 5,111 | 9.1 | 1,544 | 9.8 | 1,502 | 14.3 | 41.0 |
| Infantile Cerebral Palsy | 1,271 | 2.3 | 733 | 4.6 | 837 | 8.0 | 79.5 |
| Hearing Loss | 3,217 | 5.7 | 664 | 4.2 | 491 | 4.7 | 26.9 |
| Other Diseases of the Nervous System and Sense Organs | 623 | 1.1 | 147 | 0.9 | 174 | 1.7 | 35.0 |
| Diseases of the Circulatory System | 318 | 0.6 | 30 | 0.2 | 31 | 0.3 | 16.0 |
| Diseases of the Respiratory System | 2,119 | 3.8 | 125 | 0.8 | 223 | 2.1 | 14.3 |
| Asthma | 2,111 | 3.8 | 124 | 0.8 | 222 | 2.1 | 14.3 |
| Other Diseases of the Respiratory System | 8 | 0.0 | 1 | 0.0 | 1 | 0.0 | 12.5 |
| Diseases of the Digestive System | 57 | 0.1 | 7 | 0.0 | 12 | 0.1 | 22.8 |
| Diseases of the Genitourinary System | 202 | 0.4 | 14 | 0.1 | 47 | 0.4 | 26.2 |
| Diseases of the Skin and Subcutaneous Tissue | 8 | 0.0 | 0 | 0.0 | 0 | 0.0 | 0.0 |
| Diseases of the Musculoskeletal System and Connective Tissue | 302 | 0.5 | 67 | 0.4 | 73 | 0.7 | 38.1 |
| Congenital Anomolies | 2,999 | 5.3 | 504 | 3.2 | 632 | 6.0 | 27.7 |
| Conditions Originating in the Perinatal Period | 73 | 0.1 | 0 | 0.0 | 0 | 0.0 | 0.0 |
| Injury and Poisoning | 111 | 0.2 | 4 | 0.0 | 7 | 0.1 | 8.1 |
| Supplementary Classification | 23 | 0.0 | 5 | 0.0 | 16 | 0.2 | 69.6 |
| Multiple Diagnoses | 6,973 | 12.4 | 2,818 | 17.9 | 2,304 | 22.0 | 54.1 |
| OTHER SELECTION METHOD | |||||||
| Inpatient Hospitalization | 2,000 | 3.6 | 87 | 0.6 | 141 | 1.3 | 10.1 |
| Provider Type | 2,668 | 4.8 | 571 | 3.6 | 463 | 4.4 | 29.2 |
| Category of Service | 8,671 | 15.5 | 1,204 | 7.6 | 968 | 9.2 | 20.2 |
| Total Number of Children | 56,063 | 100.0 | 15,787 | 100.0 | 10,489 | 100.0 | 36.8 |
| TABLE 17e. Number of Children Receiving Medicaid Services by Type of Selection and Type of Service: FY 1994 | |||||||
|---|---|---|---|---|---|---|---|
| Type of Selection | Medicaid Services | Medicaid Services and Special Education | Medicaid Services and AABD | Percent of Medicaid Services Receiving Special Education or AABD | |||
| N | % | N | % | N | % | % | |
| ICD-9-CM DIAGNOSIS SELECTION | |||||||
| Infectious Diseases | 143 | 0.2 | 8 | 0.0 | 33 | 0.2 | 25.2 |
| AIDS | 127 | 0.1 | 8 | 0.0 | 31 | 0.2 | 26.8 |
| Other Infectious Diseases | 16 | 0.0 | 0 | 0.0 | 2 | 0.0 | 12.5 |
| Neoplasms | 1,377 | 1.6 | 49 | 0.2 | 139 | 0.8 | 12.1 |
| Endocrine, Nutritional and Metabolic Diseases | 1,769 | 2.0 | 71 | 0.3 | 169 | 1.0 | 11.4 |
| Diseases of the Blood and Blood Forming Organs | 1,512 | 1.7 | 82 | 0.3 | 396 | 2.3 | 28.2 |
| Sickle Cell Anemia | 1,127 | 1.3 | 65 | 0.2 | 344 | 2.0 | 32.4 |
| Other Diseases of the Blood and Blood Forming Organs | 385 | 0.4 | 17 | 0.1 | 52 | 0.3 | 15.8 |
| Mental Disorders | 37,984 | 43.3 | 16,234 | 61.8 | 7,282 | 41.9 | 49.0 |
| Developmental Speech or Language Disorder | 13,245 | 15.1 | 8,148 | 31.0 | 2,796 | 16.1 | 66.1 |
| Attention Deficit Disorders | 6,734 | 7.7 | 1,811 | 6.9 | 1,130 | 6.5 | 35.0 |
| Disturbance of Emotions Specific to Childhood and Adolescence | 7,952 | 9.1 | 4,199 | 16.0 | 2,088 | 12.0 | 59.7 |
| Other Mental Disorders | 10,053 | 11.5 | 2,076 | 7.9 | 1,268 | 7.3 | 27.3 |
| Diseases of the Nervous System and Sense Organs | 5,888 | 6.7 | 1,370 | 5.2 | 1,420 | 8.2 | 32.9 |
| Infantile Cerebral Palsy | 1,111 | 1.3 | 602 | 2.3 | 717 | 4.1 | 77.7 |
| Hearing Loss | 3,963 | 4.5 | 645 | 2.5 | 522 | 3.0 | 21.8 |
| Other Diseases of the Nervous System and Sense Organs | 814 | 0.9 | 123 | 0.5 | 181 | 1.0 | 25.9 |
| Diseases of the Circulatory System | 442 | 0.5 | 26 | 0.1 | 38 | 0.2 | 11.5 |
| Diseases of the Respiratory System | 2,576 | 2.9 | 107 | 0.4 | 298 | 1.7 | 14.2 |
| Asthma | 2,572 | 2.9 | 107 | 0.4 | 298 | 1.7 | 14.2 |
| Other Diseases of the Respiratory System | 4 | 0.0 | 0 | 0.0 | 0 | 0.0 | 0.0 |
| Diseases of the Digestive System | 83 | 0.1 | 5 | 0.0 | 8 | 0.0 | 13.3 |
| Diseases of the Genitourinary System | 255 | 0.3 | 17 | 0.1 | 37 | 0.2 | 18.0 |
| Diseases of the Skin and Subcutaneous Tissue | 7 | 0.0 | 0 | 0.0 | 1 | 0.0 | 14.3 |
| Diseases of the Musculoskeletal System and Connective Tissue | 329 | 0.4 | 61 | 0.2 | 74 | 0.4 | 33.1 |
| Congenital Anomolies | 3,734 | 4.3 | 392 | 1.5 | 665 | 3.8 | 21.4 |
| Conditions Originating in the Perinatal Period | 100 | 0.1 | 0 | 0.0 | 0 | 0.0 | 0.0 |
| Injury and Poisoning | 126 | 0.1 | 5 | 0.0 | 6 | 0.0 | 7.1 |
| Supplementary Classification | 19 | 0.0 | 4 | 0.0 | 11 | 0.1 | 68.4 |
| Multiple Diagnoses | 14,039 | 16.0 | 6,252 | 23.8 | 4,987 | 28.7 | 57.3 |
| OTHER SELECTION METHOD | |||||||
| Inpatient Hospitalization | 2,869 | 3.3 | 65 | 0.2 | 232 | 1.3 | 9.4 |
| Provider Type | 4,087 | 4.7 | 579 | 2.2 | 516 | 3.0 | 20.7 |
| Category of Service | 10,425 | 11.9 | 937 | 3.6 | 1,065 | 6.1 | 15.8 |
| Total Number of Children | 87,764 | 100.0 | 26,264 | 100.0 | 17,377 | 100.0 | 38.3 |
| TABLE 18. Relative Odds of Being a Multi-Service User within a Fiscal Year: Cross Sections FY 1990-1994 by Program Type--Estimates from Logit Models | |||
|---|---|---|---|
| Variable | Odds Ratios | ||
| AABD (model 1) | Special Education (model 2) | Medicaid Services (model 3) | |
| Male | 1.00 | 1.00 | 1.00 |
| Female | 0.80 | 1.13 | 0.75 |
| White | 1.00 | 1.00 | 1.00 |
| African-American | 0.70 | 3.39 | 1.21 |
| Hispanic | 0.85 | 1.99 | 1.03* |
| Other | 0.20 | 1.79 | 0.95** |
| Age 1 and under | 0.58 | 0.94* | 0.15 |
| Ages 2 and 3 | 0.54 | 1.44 | 0.44 |
| Ages 4 and 5 | 0.77 | 1.23 | 0.75 |
| Ages 6 and 7 | 1.00 | 1.00 | 1.00 |
| Ages 8 and 9 | 1.15 | 0.88 | 1.27 |
| Ages 10 and 11 | 1.16 | 0.80 | 1.42 |
| Ages 12 and 13 | 1.10 | 0.78 | 1.37 |
| Ages 14 and 15 | 0.93 | 0.81 | 1.22 |
| Ages 16 to 18 | 0.69 | 0.81 | 1.30 |
| FY 1990 | 1.00 | 1.00 | 1.00 |
| FY 1991 | 1.73 | 0.78 | 1.89 |
| FY 1992 | 1.93 | 1.05 | 1.68 |
| FY 1993 | 0.96* | 1.05 | 1.74 |
| FY 1994 | 1.99 | 2.24 | 2.15 |
| Severely Emotionally Disturbed | 1.00 | ||
| Mentally Retarded | 1.75 | ||
| Learning Disabled | 0.34 | ||
| Physically Disabled | 2.23 | ||
| Deaf and/or Blind | 1.32 | ||
| Speech or Language Disorder | 0.30 | ||
| Other Disability | 1.62 | ||
| 1 or more Mental Disorder Diagnoses | 1.27 | ||
| 1 or more Non-Mental Disorder Diagnoses | 1.00 | ||
| Combination of Mental and Non-Mental Diagnoses | 2.72 | ||
| Provider or Category of Service Selection | 0.71 | ||
| NOTE: Baseline categories are indicated by a relative odds of 1. ** Estimates are not statistically significant at the .05 level. * Estimates are not statistically significant at the .01 level. | |||
| TABLE 19. Relative Odds of Entering AABD within Three Years Given Medicaid Service Participation: Cross Sections FY 1990-1992--Estimates from Logit Models | |
|---|---|
| Variable | Odds Ratios |
| Male | 1.00 |
| Female | 0.79 |
| White | 1.00 |
| African-American | 1.38 |
| Hispanic | 1.37 |
| Other | 1.07** |
| Age 1 and under | 0.35 |
| Ages 2 and 3 | 0.78 |
| Ages 4 and 5 | 0.92 |
| Ages 6 and 7 | 1.00 |
| Ages 8 and 9 | 1.18 |
| Ages 10 and 11 | 1.19 |
| Ages 12 and 13 | 1.22 |
| Ages 14 and 15 | 1.14 |
| Ages 16 to 18 | 1.44 |
| FY 1990 | 1.00 |
| FY 1991 | 2.61 |
| FY 1992 | 3.23 |
| 1 or more Mental Disorder Diagnoses | 0.42 |
| 1 or more Non-Mental Disorder Diagnoses | 1.00 |
| Combination of Mental and Non-Mental Diagnoses | 1.46 |
| Provider or Category of Service Selection | 0.59 |
| NOTE: Baseline categories are indicated by a relative odds of 1. ** Estimates are not statistically significant at the .05 level. | |
APPENDIX A: ICD-9-CM Codes
The use of ICD-9-CM codes to approximate eligibility for SSI and thus disability was developed from two sources: 1.) Input from the Medstat Group based on their ongoing research on the incidence of chronically and severely disabled children on Medicaid. 2.) An examination of the List of impairments for children published in Disability Evaluation Under Social Security by the Social Security Administration. Although the majority of the ICD-9-CM codes were captured in the list from the Medstat Group, staff at Chapin Hall added codes as identified in the listing of impairments for children.
Although the listing of impairments specifies conditions that map neatly to the ICD-9-CM codes, there was no way for us to approximate the functional criteria or level of severity that were also included in some sections in the instructions for determining disability. In some cases, this meant excluding a specified ICD-9-CM code because the code in and of itself would grossly exaggerate the number of disabled children. For example, hundreds of children had non-specific diagnostic codes for malignant neoplasms, such as malignant neoplasms of the bone NOS and soft tissues of the bone NOS. Without a measure of severity, we did not include the NOS diagnostic codes in our selection criteria. In many other cases, there were specific ICD-9-CM codes for the listed impairments, but these were insufficient to determine severity. For example impairment 101.08, chronic osteomyelitis with persistence, would be coded ICD-9-CM 730.1, chronic osteomyelitis. Under the disability determination criteria, this condition must be unresponsive to treatment for six months. In still other cases, service indicators were used to approximate the severity of a particular condition. For example, asthma without an idea of severity would be a poor indicator of disability. As suggested by the Medstat group's criteria, the presence of three or more emergency room visits or two or more hospitalizations in combination with a diagnosis of asthma was used to indicate disability.
The following table lists all of the ICD-9-CM codes that were used in our selection criterion as well as the corresponding category number used in the SSA listing of impairments for children. The ICD-9-CM codes that were not included in the Medstat Group's list are also indicated.
| Listing of Social Security Administration Impairments and Corresponding ICD-9-CM Diagnosis Codes (The listing of impairments is based on the most recent version: September 1994) |
||||
|---|---|---|---|---|
| Section Name | Category Number from Listing of Impairments |
Category Name | ICD-9-CM Diagnosis |
ICD-9-CM Diagnosis Name |
| Mulsculoskeletal System | 101.02 | Juvenile rheumatoid arthritis | 714.3 | JUV CHRON POLYARTHRITIS* |
| 101.02 | Juvenile rheumatoid arthritis | 714.30 | JUV RHEUM ARTHRITIS NOS | |
| 101.02 | Juvenile rheumatoid arthritis | 714.31 | POLYART JUV RHEUM ARTHR | |
| 101.02 | Juvenile rheumatoid arthritis | 714.32 | PAUCIART JUV RHEUM ARTHR | |
| 101.02 | Juvenile rheumatoid arthritis | 714.33 | MONOART JUV RHEUM ARTHR | |
| 101.03 | function | 728.3 | MUSCLE DISORDERS NEC | |
| 101.03 | function | 732.1 | JUV OSTEOCHONDROS PELVIS | |
| 101.03 | function | 732.2 | FEMORAL EPIPHYSIOLYSIS | |
| 101.03 | function | 749.00 | CLEFT PALATE NOS | |
| 101.03 | function | 749.20 | CLEFT PALATE & LIP NOS | |
| 101.03 | function | 749.21 | UNIL CLEFT PALAT/ LIP-COM | |
| 101.03 | function | 749.22 | UNIL CLEFT PALAT/ LIP-INC | |
| 101.03 | function | 756.4 | CHONDRODYSTROPHY | |
| 101.03 | function | 756.51 | OSTEOGENESIS IMPERFECTA | |
| 101.03 | function | 756.7 | ABDOMINAL WALL ANOMALIES | |
| 101.03 | function | 897.6 | AMULTATION LEG BILAT | |
| 101.03 | function | 897.7 | AMPUTAT LEG BILAT-COMPL | |
| 101.05 | Disorders of the spine | 806. | VERTEBRAL FX W CORD INJ* * | |
| 101.05 | Disorders of the spine | 806.0 | CLOS CERV FX W CORD INJ* * | |
| 101.05 | Disorders of the spine | 806.00 | C1-C4 FX-CL/ CORD INJ NOS * | |
| 101.05 | Disorders of the spine | 806.01 | C1-C4 FX-CL/ COM CORD LES * | |
| 101.05 | Disorders of the spine | 806.02 | C1-C4 FX-CL/ ANT CORD SYN * | |
| 101.05 | Disorders of the spine | 806.03 | C1-C4 FX-CL/ CEN CORD SYN * | |
| 101.05 | Disorders of the spine | 806.04 | C1-C4 FX-CL/ CORD INJ NEC * | |
| 101.05 | Disorders of the spine | 806.05 | C5-C7 FX-CL/ CORD INJ NOS * | |
| 101.05 | Disorders of the spine | 806.06 | C5-C7 FX-CL/ CORD LES * | |
| 101.05 | Disorders of the spine | 806.08 | C5-C7 FX-CL/ CEN CORD SYN * | |
| 101.05 | Disorders of the spine | 806.09 | C5-C7 FX-CL/ CORD INJ NEC * | |
| 101.05 | Disorders of the spine | 806.1 | OPEN CERV FX W CORD INJ* * | |
| 101.05 | Disorders of the spine | 806.10 | C1-C4 FX-OP/ CORD INJ NOS * | |
| 101.05 | Disorders of the spine | 806.11 | C1-C4 FX-OP/ COM CORD LES * | |
| 101.05 | Disorders of the spine | 806.15 | C5-C7 FX-OP/ CORD INJ NOS * | |
| 101.05 | Disorders of the spine | 806.16 | C5-C7 FX-OP/ COM CORD LES * | |
| 101.05 | Disorders of the spine | 806.2 | CL DORSAL FX W CORD INJ* * | |
| 101.05 | Disorders of the spine | 806.20 | T1-T6 FX-CL/ CORD INJ NOS * | |
| 101.05 | Disorders of the spine | 806.21 | T1-T6 FX-CL/ COM CORD LES * | |
| 101.05 | Disorders of the spine | 806.24 | T1-T6 FX-CL/ CORD INJ NEC * | |
| 101.05 | Disorders of the spine | 806.25 | T7-T12 FX-CL/ CRD INJ NOS * | |
| 101.05 | Disorders of the spine | 806.26 | T7-T12 FX-CL/ COM CRD LES * | |
| 101.05 | Disorders of the spine | 806.28 | T7-T12 FX-CL/ CEN CRD SYN * | |
| 101.05 | Disorders of the spine | 806.29 | T7-T12 FX-CL/ CRD INJ NEC * | |
| 101.05 | Disorders of the spine | 806.3 | OPN DORSAL FX W CORD INJ * | |
| 101.05 | Disorders of the spine | 806.30 | T1-T6 FX-OP/ CORD INJ NOS * | |
| 101.05 | Disorders of the spine | 806.31 | T1-T6 FX-OP/ COM CORD LES * | |
| 101.05 | Disorders of the spine | 806.34 | T1-T6 FX-OP/ CORD INJ NEC * | |
| 101.05 | Disorders of the spine | 806.35 | T7-T12 FX-OP/ CRD INJ NOS * | |
| 101.05 | Disorders of the spine | 806.36 | T7-T12 FX-OP/ COM CRD LES * | |
| 101.05 | Disorders of the spine | 806.39 | T7-T12 FX-OP/ CRD INJ NEC * | |
| 101.05 | Disorders of the spine | 806.4 | CL LUMBAR FX W CORD INJ * | |
| 101.05 | Disorders of the spine | 806.5 | OPN LUMBAR FX W CORD INJ * | |
| 101.05 | Disorders of the spine | 806.6 | FX SACRUM-CL W CORD INJ* | |
| 101.05 | Disorders of the spine | 806.60 | FX SACRUM-CL/ CRD INJ NOS | |
| 101.05 | Disorders of the spine | 806.62 | FX SACR-CL/ CAUDA INJ NEC | |
| 101.05 | Disorders of the spine | 806.70 | FX SACRUM-OP/ CRD INJ NOS | |
| 101.05 | Disorders of the spine | 806.8 | VERT FX NOS-CL W CRD INJ | |
| 101.05 | Disorders of the spine | 806.9 | VERT FX NOS-OP W CRD INJ | |
| Special Senses and Speech | 102.02 | Impairments of central visual acuity | 369. | BLINDNESS AND LOW VISION |
| 102.02 | Impairments of central visual acuity | 369.0 | PROFOUND BLIND BOTH EYES | |
| 102.02 | Impairments of central visual acuity | 369.00 | BOTH EYES BLIND-WHO DEF | |
| 102.02 | Impairments of central visual acuity | 369.01 | TOT IMPAIRMENT-BOTH EYES | |
| 102.02 | Impairments of central visual acuity | 369.02 | ONE EYE-NEAR TOT/OTH-NOS | |
| 102.02 | Impairments of central visual acuity | 369.03 | ONE EYE-NEAR TOT/OTH-TOT | |
| 102.02 | Impairments of central visual acuity | 369.04 | NEAR-TOT IMPAIR-BOTH EYE | |
| 102.02 | Impairments of central visual acuity | 369.08 | PROFOUND IMPAIR BOTH EYE | |
| 102.02 | Impairments of central visual acuity | 369.1 | MOD/ SEV W PROFND IMPAIR* | |
| 102.02 | Impairments of central visual acuity | 369.10 | BLINDNESS/ LOW VISION | |
| 102.02 | Impairments of central visual acuity | 369.11 | 1 EYE-SEV/ OTH-BLIND NOS | |
| 102.02 | Impairments of central visual acuity | 369.12 | ONE EYE-SEVERE/ OTH-TOTAL | |
| 102.02 | Impairments of central visual acuity | 369.14 | ONE EYE-SEV/ OTH-PRFND | |
| 102.02 | Impairments of central visual acuity | 369.15 | ONE EYE-MOD/ OTH-BLIND | |
| 102.02 | Impairments of central visual acuity | 369.2 | MOD/ SEV IMPAIR-BOTH EYES | |
| 102.02 | Impairments of central visual acuity | 369.20 | LOW VISION 2 EYES NOS | |
| 102.02 | Impairments of central visual acuity | 369.21 | ONE EYE-SEVERE/ OTH-NOS | |
| 102.02 | Impairments of central visual acuity | 369.23 | ONE EYE-MODERATE/ OTH-NOS | |
| 102.02 | Impairments of central visual acuity | 369.25 | MODERATE IMPAIR-BOTH EYE | |
| 102.02 | Impairments of central visual acuity | 369.3 | BLINDNESS NOS BOTH EYES | |
| 102.02 | Impairments of central visual acuity | 369.4 | LEGAL BLINDNESS-USA DEF | |
| 102.02 | Impairments of central visual acuity | 369.6 | PROFOUND IMPAIR-ONE EYE* | |
| 102.02 | Impairments of central visual acuity | 369.60 | BLINDNESS ONE EYE | |
| 102.02 | Impairments of central visual acuity | 369.61 | ONE EYE-TOTAL/ OTH-UNKNWN | |
| 102.02 | Impairments of central visual acuity | 369.63 | ONE EYE-TOTAL/ OTH-NORMAL | |
| 102.02 | Impairments of central visual acuity | 369.64 | ONE EYE-NEAR TOT/ OTH-NOS | |
| 102.02 | Impairments of central visual acuity | 369.66 | NEAR-TOTAL IMPAIR/ NORMAL | |
| 102.02 | Impairments of central visual acuity | 369.67 | ONE EYE-PRFOUND/ OTH-UNKN | |
| 102.02 | Impairments of central visual acuity | 369.69 | PROFOUND IMPAIR/ NORMAL | |
| 102.02 | Impairments of central visual acuity | 369.7 | MOD/ SEVERE IMPAIR 1 EYE | |
| 102.02 | Impairments of central visual acuity | 369.70 | LOW VISION ONE EYE | |
| 102.02 | Impairments of central visual acuity | 369.71 | ONE EYE-SEVERE/ OTH-UNKNW | |
| 102.02 | Impairments of central visual acuity | 369.74 | ONE EYE-MOD/ OTHER-UNKNWN | |
| 102.02 | Impairments of central visual acuity | 369.75 | ONE EYE-MOD/ OTH-NR NORM | |
| 102.02 | Impairments of central visual acuity | 369.76 | ONE EYE-MOD/ OTH NORMAL | |
| 102.02 | Impairments of central visual acuity | 369.8 | VISUAL LOSS ONE EYE NOS | |
| 102.02 | Impairments of central visual acuity | 369.9 | VISUAL LOSS NOS | |
| 102.08 | Hearing impairments | 389. | HEARING LOSS* | |
| 102.08 | Hearing impairments | 389.0 | CONDUCTIVE HEARING LOSS* | |
| 102.08 | Hearing impairments | 389.00 | CONDUCT HEARING LOSS NOS | |
| 102.08 | Hearing impairments | 389.01 | CONDUCT HEAR LOSS EXT EAR | |
| 102.08 | Hearing impairments | 389.02 | CONDUCT HEAR LOSS TYMPAN | |
| 102.08 | Hearing impairments | 389.03 | CONDUC HEAR LOSS MID EAR | |
| 102.08 | Hearing impairments | 389.04 | COND HEAR LOSS INNER EAR | |
| 102.08 | Hearing impairments | 389.08 | COND HEAR LOSS COMB TYPE | |
| 102.08 | Hearing impairments | 389.1 | SENSORINEURAL HEAR LOSS* | |
| 102.08 | Hearing impairments | 389.10 | SENSORNEUR HEAR LOSS NOS | |
| 102.08 | Hearing impairments | 389.11 | SENSORY HEARING LOSS | |
| 102.08 | Hearing impairments | 389.12 | NEURAL HEARING LOSS | |
| 102.08 | Hearing impairments | 389.14 | CENTRAL HEARING LOSS | |
| 102.08 | Hearing impairments | 389.18 | SENSORNEUR LOSS COMB TYP | |
| 102.08 | Hearing impairments | 389.2 | MIXED HEARING LOSS | |
| 102.08 | Hearing impairments | 389.7 | DEAF MUTISM NEC | |
| 102.08 | Hearing impairments | 389.8 | HEARING LOSS NEC | |
| 102.08 | Hearing impairments | 389.9 | HEARING LOSS NOS | |
| Respiratory System | 103.00 | Respiratory System | 135. | SARCOIDOSIS |
| 103.02 | Chronic pulmonary insufficiency | 491.2 | OBSTRUCT CHR BRONCHITIS* | |
| 103.02 | Chronic pulmonary insufficiency | 491.20 | OBS CHR BRNC W/O ACT EXA | |
| 103.02 | Chronic pulmonary insufficiency | 491.21 | OBS CHR BRNC W ACT EXA | |
| 103.03 | Asthma | 493. | ASTHMA* | |
| 103.03 | Asthma | 493.0 | EXTRINSIX ASTHMA* | |
| 103.03 | Asthma | 493.00 | EXT ASTHMA W/O STAT ASTH | |
| 103.03 | Asthma | 493.01 | EXT ASTHMA W STATUS ASTH | |
| 103.03 | Asthma | 493.1 | INTRINSIC ASTHMA* | |
| 103.03 | Asthma | 493.10 | INT ASTHMA W/O STAT ASTH | |
| 103.03 | Asthma | 493.11 | INT ASTHMA W STATUS ASTH | |
| 103.03 | Asthma | 493.2 | CHR OBS ASTHMA W/COPD | |
| 103.03 | Asthma | 493.20 | CH OB ASTH W/O STAT ASTH | |
| 103.03 | Asthma | 493.21 | CH OB ASTHMA W STAT ASTH | |
| 103.03 | Asthma | 493.9 | ASTHMA NOS* | |
| 103.03 | Asthma | 493.90 | ASTHMA W/O STATUS ASTHM | |
| 103.03 | Asthma | 493.91 | ASTHMA W STATUS ASTHMAT | |
| 103.04 | Cystic fibrosis | 277.0 | CYSTIC FIBROSIS* | |
| 103.04 | Cystic fibrosis | 277.00 | CYSTIC FIBROS W/O ILEUS | |
| 103.04 | Cystic fibrosis | 277.01 | CYSTIC FIBROSIS W ILEUS | |
| Cardiovasulare System | 104.02 | Chronic heart failure | 428. | HEART FAILURE* * |
| 104.02 | Chronic heart failure | 428.0 | CONGESTIVE HEART FAILURE * | |
| 104.02 | Chronic heart failure | 428.1 | LEFT HEART FAILURE * | |
| 104.02 | Chronic heart failure | 428.9 | HEART FAILURE NOS * | |
| 104.03 | Hypertensive cardiovascular disease | 401.0 | MALIGNANT HYPERTENSION * | |
| 104.06 | Congential heart disease | 745.0 | COMMON TRUNCUS | |
| 104.06 | Congential heart disease | 745.1 | TRANSPOS OF GREAT VESSEL | |
| 104.06 | Congential heart disease | 745.10 | COMPL TRANSPOS GREAT VES | |
| 104.06 | Congential heart disease | 745.11 | DOUBLE OUTLET RT VENTRIC | |
| 104.06 | Congential heart disease | 745.12 | CORRECT TRANSPO GRT VES | |
| 104.06 | Congential heart disease | 745.19 | TRANSPOS GREAT VESS NEC | |
| 104.06 | Congential heart disease | 745.2 | TETRALOGY OF FALLOT | |
| 104.06 | Congential heart disease | 745.3 | COMMON VENTRICLE | |
| 104.06 | Congential heart disease | 745.4 | VENTRICULAR SEPT DEFECT | |
| 104.06 | Congential heart disease | 745.5 | SECUNDUM ATRIAL SEPT DUF | |
| 104.06 | Congential heart disease | 745.60 | ENDOCARD CUSHION DEF NOS | |
| 104.06 | Congential heart disease | 745.61 | OSTIUM PRIMUM DEFECT | |
| 104.06 | Congential heart disease | 746.00 | PULMONARY VALVE ANOM NOS | |
| 104.06 | Congential heart disease | 746.01 | CONG PULMON VALV ATRESIA | |
| 104.06 | Congential heart disease | 746.02 | CONG PULMON VALVE STENOS | |
| 104.06 | Congential heart disease | 746.1 | CONG TRICUSP ATRES/ STEN | |
| 104.06 | Congential heart disease | 746.2 | EBSTEIN'S ANOMALY | |
| 104.06 | Congential heart disease | 746.3 | CONG AORTA VALV STENOSIS | |
| 104.06 | Congential heart disease | 746.4 | CONG AORTA VALV INSUFFIC | |
| 104.06 | Congential heart disease | 746.5 | CONGEN MITRAL STENOSIS | |
| 104.06 | Congential heart disease | 746.6 | CONG MITRAL INSUFFICIENC | |
| 104.06 | Congential heart disease | 746.7 | HYPOPLAS LEFT HEART SYND | |
| 104.06 | Congential heart disease | 746.81 | CONG SUBAORTIC STENOSIS | |
| 104.06 | Congential heart disease | 746.83 | INFUNDIB PULMON STENOSIS | |
| 104.06 | Congential heart disease | 747.0 | PATENT DUCTUS ARTERIOSUS | |
| 104.06 | Congential heart disease | 747.10 | COARCTATION OF AORTA | |
| 104.06 | Congential heart disease | 747.21 | ANOMALIES OF AORTIC ARCH | |
| 104.06 | Congential heart disease | 747.3 | PULMONARY ARTERY ANOM | |
| 104.06 | Congential heart disease | 747.41 | TOT ANOM PULM VEN CONNEC | |
| 104.06 | Congential heart disease | 747.42 | PART ANOM PULM VEN CONN | |
| 104.07 | Valvular heart disease or other stenotic defects, or valvulare regurgitation | 424.1 | AORTIC VALVE DISORDER | |
| 104.07 | Valvular heart disease or other stenotic defects, or valvulare regurgitation | 424.3 | PULMONARY VALUE DISORDER | |
| 104.08 | Cardiomyopathies | 425.1 | HYPERTR OBSTR CARDIOMYOP | |
| 104.08 | Cardiomyopathies | 425.3 | ENDOCARD FIBROELASTOSIS | |
| 104.09 | Cardiac transplantation | V42.1 | HEART TRANSPLANT STATUS * | |
| 104.13 | Chronic rheumatic fever or rheumatic heart disease | 398.90 | RHEUMATIC HEART DIS NOS | |
| 104.14 | Hyperlipidemia | 272.0 | PURE HYPERCHOLESTEROLEM | |
| 104.15 | Kawasaki syndrome | 446.1 | MUCOCUTAN LYMPH NODE SYN | |
| Digestive System | 105.00 | Digestive System | 577.1 | CHONRIC PANCREATITIS |
| 105.00 | Digestive System | 579.0 | CELIAC DISEASE | |
| 105.03 | Esphogeal obstruction-caused by atresia, stricture, or stenosis | 530.3 | ESOPHAGEAL STRICTURE * | |
| 105.03 | Esphogeal obstruction-caused by atresia, stricture, or stenosis | 750.3 | CONG ESOPH FISTULA/ ATRES | |
| 105.05 | Chronic liver disease | 571. | CHR LIVER DIS/ CIRRHOSIS* | |
| 105.05 | Chronic liver disease | 571.4 | CHRONIC HEPATITIS* | |
| 105.05 | Chronic liver disease | 571.40 | CHRONIC HEPATITIS NOS | |
| 105.05 | Chronic liver disease | 571.41 | CHR PERSISTENT HEPATITIS | |
| 105.05 | Chronic liver disease | 571.49 | CHRONIC HEPATITIS NEC | |
| 105.05 | Chronic liver disease | 571.6 | BILIARY CIRRHOSIS | |
| 105.05 | Chronic liver disease | 572.2 | HEPATIC COMA | |
| Genito-Urinary System | 106.02 | Chronic renal disease | 580.4 | AC RAPIDLY PROGR NEPHRIT |
| 106.02 | Chronic renal disease | 582.0 | CHR PROLIFERAT NEPHRITIS | |
| 106.02 | Chronic renal disease | 582.1 | CHR MEMBRANOUS NEPHRITIS | |
| 106.02 | Chronic renal disease | 582.2 | CHR MEMBRANOPROLIF NEPHR | |
| 106.02 | Chronic renal disease | 582.4 | CHR RAPID PROGR NEPHRIT | |
| 106.02 | Chronic renal disease | 582.9 | CHRONIC NEPHRITIS NOS | |
| 106.02 | Chronic renal disease | 583.0 | PROLIFERAT NEPHRITIS NOS | |
| 106.02 | Chronic renal disease | 583.1 | MEMBRANOUS NEPHRITIS NOS | |
| 106.02 | Chronic renal disease | 583.2 | MEMBRANOPROLIF NEPHR NOS | |
| 106.02 | Chronic renal disease | 583.4 | RAPIDLY PROG NEPHRIT NOS | |
| 106.02 | Chronic renal disease | 583.8 | NEPHRITIS NOS W OTH LES* | |
| 106.02 | Chronic renal disease | 583.81 | NEPHRITIS NOS IN OTH DIS | |
| 106.02 | Chronic renal disease | 583.89 | NEPHRITIS NEC | |
| 106.02 | Chronic renal disease | 583.9 | NEPHRITIS NOS | |
| 106.02 | Chronic renal disease | 585 | CHRONIC RENAL FAILURE | |
| 106.02 | Chronic renal disease | 586 | RENAL FAILURE NOS | |
| 106.02 | Chronic renal disease | V42.0 | KIDNEY TRANSPLANT STATUS * | |
| 106.02 | Chronic renal disease | V45.1 | RENAL DIALYSIS STATUS * | |
| 106.06 | Nephrotic syndrome with edema | 581.0 | NEPHROTIC SYN PROLIFER | |
| 106.06 | Nephrotic syndrome with edema | 581.1 | EPIMEMBRANOUS NEPHRITIS | |
| 106.06 | Nephrotic syndrome with edema | 581.2 | MEMBRANOPROLIF NEPHROSIS | |
| 106.06 | Nephrotic syndrome with edema | 581.3 | MINIMAL CHANGE NEPHROSIS | |
| 106.06 | Nephrotic syndrome with edema | 581.9 | NEPHROTIC SYNDROME NOS | |
| Hemic and Lymphatic System | 107.00 | Hemic and Lympatic System | 237.7 | NEUROFIBROMATOSIS* |
| 107.00 | Hemic and Lympatic System | 284.0 | CONGEN APLASTIC ANEMIA | |
| 107.00 | Hemic and Lympatic System | 284.8 | APLASTIC ANEMIAS NEC | |
| 107.00 | Hemic and Lympatic System | 284.9 | APLASTIC ANEMIA NOS | |
| 107.03 | Hemolytic anemia (due to any cause) | 282.0 | HEREDITARY SPHEROCYTOSIS | |
| 107.03 | Hemolytic anemia (due to any cause) | 282.3 | ENZYME DEFIC ANEMIA NEC | |
| 107.03 | Hemolytic anemia (due to any cause) | 282.6 | SICKLE-CELL ANEMIA* | |
| 107.03 | Hemolytic anemia (due to any cause) | 282.60 | SICKLE-CELL ANEMIA NOS | |
| 107.03 | Hemolytic anemia (due to any cause) | 282.61 | HB-S DISEASE W/O CRISIS | |
| 107.03 | Hemolytic anemia (due to any cause) | 282.62 | HB-S DISEASE WITH CRISIS | |
| 107.03 | Hemolytic anemia (due to any cause) | 282.63 | SICKLE-CELL/ HB-C DISEASE | |
| 107.03 | Hemolytic anemia (due to any cause) | 282.69 | SICKLE-CELL ANEMIA NEC | |
| 107.03 | Hemolytic anemia (due to any cause) | 282.7 | HEMOGLOBINOPATHIES NEC | |
| 107.03 | Hemolytic anemia (due to any cause) | 283.0 | AUTOIMMUN HEMOLYTIC ANEM | |
| 107.03 | Hemolytic anemia (due to any cause) | 283.1 | NONAUTOIMMU HEMOLYT ANEM | |
| 107.03 | Hemolytic anemia (due to any cause) | 283.10 | NONAUTO HEM ANEMIA NOS | |
| 107.03 | Hemolytic anemia (due to any cause) | 283.11 | HEMOLYTIC UREMIC SYND | |
| 107.05 | Sickle cell disease | 282.4 | THALASSEMIAS | |
| 107.08 | Inherited coagulation disorder | 286.0 | CONG FACTOR VIII DIORD | |
| 107.08 | Inherited coagulation disorder | 286.1 | CONG FACTOR IX DISORDER | |
| 107.08 | Inherited coagulation disorder | 286.2 | CONG FACTOR XI DISORDER | |
| 107.08 | Inherited coagulation disorder | 286.4 | VON WILLEBRAND'S DISEASE | |
| 107.11 | Acute leukemia | 204.0 | ACUTE LYMPHOID LEUKEMIA* | |
| 107.11 | Acute leukemia | 204.00 | ACT LYM LEUK W/O RMSION | |
| 107.11 | Acute leukemia | 204.01 | ACT LYM LEUK W RMSION | |
| 107.11 | Acute leukemia | 205.0 | ACUTE MYELOID LEUKEMIA* | |
| 107.11 | Acute leukemia | 205.00 | ACT MYL LEUK W/O RMSION | |
| 107.11 | Acute leukemia | 205.01 | ACT MYL LEUK W RMSION | |
| 107.11 | Acute leukemia | 206.0 | ACUTE MONOCYTIC LEUKEMIA | |
| 107.11 | Acute leukemia | 206.00 | ACT MONO LEUK W/O RMSION | |
| 107.11 | Acute leukemia | 207.0 | ACUTE ERYTHREMIA* | |
| 107.11 | Acute leukemia | 207.00 | ACT ERTH/ ERYLK W/O RMSON | |
| 107.11 | Acute leukemia | 208.0 | ACT LEUK UNS CL W/O RMSN * | |
| 107.11 | Acute leukemia | 208.00 | ACT LEUK UNS CL W/O RMSN * | |
| 107.11 | Acute leukemia | 208.01 | ACT LEUK UNS CL W RMSON * | |
| Endocrine System | 109.00 | Endocrine System | 245.2 | CHR LYMPHOCYT THYROIDIT |
| 109.00 | Endocrine System | 253.2 | PANHYPOPITUITARISM | |
| 109.02 | Thyroid Disorders | 242.0 | TOXIC DIFFUSE GOITER* | |
| 109.02 | Thyroid Disorders | 242.00 | TOX DIF GOITER NO CRISIS | |
| 109.02 | Thyroid Disorders | 242.01 | TOX DIF GOITER W CRISIS | |
| 109.02 | Thyroid Disorders | 243. | CONGENITAL HYPOTHYROIDSM * | |
| 109.05 | Diabetes insipidus | 253.5 | DIABETES INSIPIDUS | |
| 109.05 | Diabetes insipidus | 588.1 | NEPHROGEN DIABETES INSIP | |
| 109.08 | Juvenile diabetes mellitus | 250.13 | DMI KETOACD UNCONTROLD * | |
| 109.08 | Juvenile diabetes mellitus | 250.33 | DMI OTH COMA UNCONTROLD * | |
| 109.10 | Pituitary dwarfism | 253.3 | PITUITARY DWARFISM | |
| 109.11 | Adrenogenital syndrome | 255.2 | ADRENOGENITAL DISORDERS | |
| 109.13 | Gonadal dysgenesis (Turners Syndrome) | 758.6 | GONADAL DYSGENESIS | |
| Multiple Body Systems | 110.06 | Down syndrome (excluding mosaic Down syndrome) | 758.0 | DOWN'S SYNDROME |
| 110.07 | Multiple body dysfunction | 268.0 | RICKETS ACTIVE | |
| 110.07 | Multiple body dysfunction | 268.1 | RICKETS LATE EFFECT | |
| 110.07 | Multiple body dysfunction | 270.0 | AMINO-ACID TRANSPORT DIS | |
| 110.07 | Multiple body dysfunction | 270.1 | PHENYLKETONURIA-PKU | |
| 110.07 | Multiple body dysfunction | 270.2 | AROM AMIN-ACID METAB NEC | |
| 110.07 | Multiple body dysfunction | 270.3 | BRAN-CHAIN AMIN-ACID DIS | |
| 110.07 | Multiple body dysfunction | 270.4 | SULPH AMINO-ACID MET DIS | |
| 110.07 | Multiple body dysfunction | 270.5 | DIS HISTIDINE METABOLISM | |
| 110.07 | Multiple body dysfunction | 270.6 | DIS UREA CYCLE METABOL | |
| 110.07 | Multiple body dysfunction | 270.7 | STRAIG AMIN-ACID MET NEC | |
| 110.07 | Multiple body dysfunction | 270.8 | DIS AMINO-ACID METAB NEC | |
| 110.07 | Multiple body dysfunction | 271.0 | CLYCOGENOSIS | |
| 110.07 | Multiple body dysfunction | 271.1 | GALACTOSEMIA | |
| 110.07 | Multiple body dysfunction | 271.3 | DISACCHARIDASE DEF/ MALAB | |
| 110.07 | Multiple body dysfunction | 271.8 | DIS CARBOHYDR METAB NEC | |
| 110.07 | Multiple body dysfunction | 272.5 | LIPOPROTEIN DEFICIENCIES | |
| 110.07 | Multiple body dysfunction | 272.6 | LIPODYSTROPHY | |
| 110.07 | Multiple body dysfunction | 272.7 | LIPIDOSES | |
| 110.07 | Multiple body dysfunction | 275.0 | DIS IRON METABOLISM | |
| 110.07 | Multiple body dysfunction | 275.1 | DIS COPPER METABOLISM | |
| 110.07 | Multiple body dysfunction | 277.4 | DIS BILIRUBIN EXCRETION | |
| 110.07 | Multiple body dysfunction | 277.5 | MUCOPOLYSACCHARIDOSIS | |
| 110.07 | Multiple body dysfunction | 277.6 | DEFIC CIRCUL ENZYME NEC | |
| 110.07 | Multiple body dysfunction | 277.8 | METABOLISM DISORDER NEC | |
| 110.07 | Multiple body dysfunction | 742.0 | ENCEPHALOCELE | |
| 110.07 | Multiple body dysfunction | 742.1 | MICROCEPHALUS | |
| 110.07 | Multiple body dysfunction | 742.3 | CONGENITAL HYDROCEPHALUS | |
| 110.07 | Multiple body dysfunction | 742.4 | BRAIN ANOMALY NEC | |
| 110.07 | Multiple body dysfunction | 742.8 | NERVOUS SYSTEM ANOM NEC | |
| 110.07 | Multiple body dysfunction | 758.7 | KLINEFELTER'S SYNDROME | |
| 110.07 | Multiple body dysfunction | 758.8 | SEX CHROMOSOME ANOM NEC | |
| 110.07 | Multiple body dysfunction | 759.3 | SITUS INVERSUS | |
| 110.07 | Multiple body dysfunction | 759.5 | TUBEROUS SCLEROSIS | |
| 110.07 | Multiple body dysfunction | 759.6 | HAMARTOSES NEC | |
| 110.07 | Multiple body dysfunction | 759.7 | MULT CONGEN ANOMAL NEC | |
| 110.07 | Multiple body dysfunction | 759.81 | PRADER-WILLI SYNDROME | |
| 110.07 | Multiple body dysfunction | 759.82 | MARFAN SYNDROME | |
| 110.07 | Multiple body dysfunction | 759.89 | SPECFIED CONG ANOMAL NEC | |
| 110.07 | Multiple body dysfunction | 771.0 | CONGENITAL RUBELLA | |
| 110.08 | Catastrophic congenital abnormalities or disease | 330.0 | LEUKODYSTROPHY | |
| 110.08 | Catastrophic congenital abnormalities or disease | 330.1 | CEREBRAL LIPIDOSES | |
| 110.08 | Catastrophic congenital abnormalities or disease | 330.2 | CEREB DEGEN IN LIPIDOSIS | |
| 110.08 | Catastrophic congenital abnormalities or disease | 330.3 | CERB DEG CHLD IN OTH DIS | |
| 110.08 | Catastrophic congenital abnormalities or disease | 330.8 | CEREB DEGEN IN CHILD NEC | |
| 110.08 | Catastrophic congenital abnormalities or disease | 331.81 | REYE'S SYNDROME | |
| 110.08 | Catastrophic congenital abnormalities or disease | 740.0 | ANENCEPHALUS | |
| 110.08 | Catastrophic congenital abnormalities or disease | 758.1 | PATAU'S SYNDROME * | |
| 110.08 | Catastrophic congenital abnormalities or disease | 758.2 | EDWARD'S SYNDROME * | |
| 110.08 | Catastrophic congenital abnormalities or disease | 758.3 | AUTOSOMAL DELETION SYND * | |
| Neurological | 111.00 | Neurological | 348.3 | ENCEPHALOPATHY NOS |
| 111.02 | Major motor seizures | 345.1 | GEN CONVULSIVE EPILEPSY* | |
| 111.02 | Major motor seizures | 345.10 | GEN CNV EPIL W/O INTR EP | |
| 111.02 | Major motor seizures | 345.11 | GEN CNV EPI W/INT EP | |
| 111.02 | Major motor seizures | 345.11 | GEN CNV EPIL W INTR EPIL | |
| 111.02 | Major motor seizures | 345.3 | GRAND MAL STATUS | |
| 111.03 | Minor motor seizures | 345. | EPILEPSY* | |
| 111.03 | Minor motor seizures | 345.0 | GEN NONCONVULS EPILEPSY* | |
| 111.03 | Minor motor seizures | 345.00 | GEN NONCV EP W/O INTR EP | |
| 111.03 | Minor motor seizures | 345.01 | GEN NONCONV EP W INTR EP | |
| 111.03 | Minor motor seizures | 345.2 | PETIT MAL STATUS | |
| 111.03 | Minor motor seizures | 345.4 | PSYCHOMOTOR EPILEPSY* | |
| 111.03 | Minor motor seizures | 345.40 | PSYMOTR EPIL W/O INT EPI | |
| 111.03 | Minor motor seizures | 345.41 | PSYMOTR EPIL W INTR EPIL | |
| 111.03 | Minor motor seizures | 345.5 | PARTIAL EPILEPSY NEC* | |
| 111.03 | Minor motor seizures | 345.50 | PART EPIL W/O INTR EPIL | |
| 111.03 | Minor motor seizures | 345.51 | PART EPI W/INT EP | |
| 111.03 | Minor motor seizures | 345.51 | PART EPIL W INTR EPIL | |
| 111.03 | Minor motor seizures | 345.6 | INFANTILE SPASMS* | |
| 111.03 | Minor motor seizures | 345.60 | INF SPASM W/O INTR EPIL | |
| 111.03 | Minor motor seizures | 345.7 | EPILEPS PARTIAL CONTINUA | |
| 111.03 | Minor motor seizures | 345.70 | EPIL PAR CONT W/O INT EP | |
| 111.03 | Minor motor seizures | 345.71 | EPIL PAR CONT W INTR EPI | |
| 111.03 | Minor motor seizures | 345.8 | EPILEPSY NEC* | |
| 111.03 | Minor motor seizures | 345.80 | EPILEP NEC W/O INTR EPIL | |
| 111.03 | Minor motor seizures | 345.81 | EPILEPSY NEC W INTR EPIL | |
| 111.03 | Minor motor seizures | 345.9 | EPILEPSY NOS* | |
| 111.03 | Minor motor seizures | 345.90 | EPILEP NOS W/O INTR EPIL | |
| 111.03 | Minor motor seizures | 345.91 | EPILEPSY NOS W INTR EPIL | |
| 111.05 | Brain tumors | 191.0 | MALIGN NEOPL CEREBRUM | |
| 111.05 | Brain tumors | 191.5 | MAL NEO CEREB VENTRICLE | |
| 111.05 | Brain tumors | 191.6 | MAL NEO CEREBELLUM NOS | |
| 111.05 | Brain tumors | 191.7 | MAL NEO BRAIN STEM | |
| 111.05 | Brain tumors | 191.9 | MALIG NEO BRAIN NOS * | |
| 111.06 | Motor dysfunction (due to any neurological disorder) | 045. | ACUTE POLIOMYELITIS* | |
| 111.06 | Motor dysfunction (due to any neurological disorder) | 045.0 | ACUTE BULBAR POLIO* | |
| 111.06 | Motor dysfunction (due to any neurological disorder) | 045.00 | AC BULBAR POLIO-TYPE NOS | |
| 111.06 | Motor dysfunction (due to any neurological disorder) | 045.1 | AC PARALYTIC POLIO NEC* | |
| 111.06 | Motor dysfunction (due to any neurological disorder) | 045.10 | PARAL POLIO NEC-TYPE NOS | |
| 111.06 | Motor dysfunction (due to any neurological disorder) | 045.2 | ACUTE NONPARALYTIC POLIO | |
| 111.06 | Motor dysfunction (due to any neurological disorder) | 045.9 | ACUTE POLIOMYELITIS NOS* | |
| 111.06 | Motor dysfunction (due to any neurological disorder) | 045.90 | AC POLIO NOS-TYPE NOS | |
| 111.06 | Motor dysfunction (due to any neurological disorder) | 341.0 | NEUROMYELITIS OPTICA | |
| 111.06 | Motor dysfunction (due to any neurological disorder) | 341.1 | SCHILDER'S DISEASE | |
| 111.06 | Motor dysfunction (due to any neurological disorder) | 344.0 | QUADRIPLEGIA NOS* | |
| 111.06 | Motor dysfunction (due to any neurological disorder) | 359.1 | HERED PROG MUSC DYSTRPHY | |
| 111.07 | Cerebral palsy | 343. | INFANTILE CEREBRAL PALSY | |
| 111.07 | Cerebral palsy | 343.0 | CONGENITAL DIPLEGIA | |
| 111.07 | Cerebral palsy | 343.1 | CONGENITAL HEMIPLEGIA | |
| 111.07 | Cerebral palsy | 343.2 | CONGENITAL QUADRIPLEGIA | |
| 111.07 | Cerebral palsy | 343.3 | CONGENITAL MONOPLEGIA | |
| 111.07 | Cerebral palsy | 343.4 | INFANTILE HEMIPLEGIA | |
| 111.07 | Cerebral palsy | 343.8 | CEREBRAL PALSY NEC | |
| 111.07 | Cerebral palsy | 343.9 | CEREBRAL PALSY NOS * | |
| 111.08 | Meningomyelocele (and related disorders) | 741.0 | SPINA BIF W HYDROCEPHAL* | |
| 111.08 | Meningomyelocele (and related disorders) | 741.00 | SPIN BIF W HYDROCEPH NOS | |
| 111.08 | Meningomyelocele (and related disorders) | 741.01 | SPIN BIF W HYDRCEPH-CERV | |
| 111.08 | Meningomyelocele (and related disorders) | 741.02 | SPIN BIF W HYDRCEPH-DORS | |
| 111.08 | Meningomyelocele (and related disorders) | 741.03 | SPIN BIF W HYDRCEPH-LUMB | |
| 111.08 | Meningomyelocele (and related disorders) | 741.9 | SPINA BIFIDA* | |
| 111.08 | Meningomyelocele (and related disorders) | 741.90 | SPINA BIFIDA | |
| 111.08 | Meningomyelocele (and related disorders) | 741.91 | SPINA BIFIDA-CERV | |
| 111.08 | Meningomyelocele (and related disorders) | 741.92 | SPINA BIFIDA-DORSAL | |
| 111.08 | Meningomyelocele (and related disorders) | 741.93 | SPINA BIFIDA-LUMBAR | |
| Mental Disorders | 112.00 | Mental Disorders | 300. | NEUROTIC DISORDERS* |
| 112.00 | Mental Disorders | 300.0 | ANXIETY STATES* | |
| 112.00 | Mental Disorders | 300.00 | ANXIETY STATE NOS | |
| 112.00 | Mental Disorders | 300.01 | PANIC DISORDER | |
| 112.00 | Mental Disorders | 300.02 | GENERALIZED ANXIETY DIS | |
| 112.00 | Mental Disorders | 300.09 | ANXIETY STATE NEC | |
| 112.00 | Mental Disorders | 300.1 | HYSTERIA* | |
| 112.00 | Mental Disorders | 300.10 | HYSTERIA NOS | |
| 112.00 | Mental Disorders | 300.11 | CONVERSION DISORDER | |
| 112.00 | Mental Disorders | 300.12 | PSYCHOGENIC AMNESIA | |
| 112.00 | Mental Disorders | 300.13 | PSYCHOGENIC FUGUE | |
| 112.00 | Mental Disorders | 300.14 | MULTIPLE PERSONALITY | |
| 112.00 | Mental Disorders | 300.15 | DISSOCIATIVE REACT NOS | |
| 112.00 | Mental Disorders | 300.16 | FACTITIOUS ILL W SYMPTOM | |
| 112.00 | Mental Disorders | 300.19 | FACTITIOUS ILL NEC/NOS | |
| 112.00 | Mental Disorders | 300.2 | PHOBIC DISORDERS* | |
| 112.00 | Mental Disorders | 300.20 | PHOBIA NOS | |
| 112.00 | Mental Disorders | 300.21 | AGORAPHOBIA WITH PANIC | |
| 112.00 | Mental Disorders | 300.22 | AGORAPHOBIA W/O PANIC | |
| 112.00 | Mental Disorders | 300.23 | SOCIAL PHOBIA | |
| 112.00 | Mental Disorders | 300.29 | ISOLATED PHOBIAS NEC | |
| 112.00 | Mental Disorders | 300.3 | OBSESSIVE-COMPULSIVE DIS | |
| 112.00 | Mental Disorders | 300.4 | NEUROTIC DEPRESSION | |
| 112.00 | Mental Disorders | 300.5 | NEURASTHENIA | |
| 112.00 | Mental Disorders | 300.6 | DEPERSONALIZATION SYND | |
| 112.00 | Mental Disorders | 300.7 | HYPOCHONDRIASIS | |
| 112.00 | Mental Disorders | 300.8 | NEUROTIC DISORDERS NEC* | |
| 112.00 | Mental Disorders | 300.81 | SOMATIZATION DISORDER | |
| 112.00 | Mental Disorders | 300.89 | NEUROTIC DISORDERS NEC | |
| 112.00 | Mental Disorders | 300.9 | NEUROTIC DISORDER NOS | |
| 112.00 | Mental Disorders | 309. | ADJUSTMENT REACTION* | |
| 112.00 | Mental Disorders | 309.0 | BRIEF DEPRESSIVE REACT | |
| 112.00 | Mental Disorders | 309.1 | PROLONG DEPRESSIVE REACT | |
| 112.00 | Mental Disorders | 309.2 | ADJUST REACT/OTH EMOTION | |
| 112.00 | Mental Disorders | 309.21 | SEPARATION ANXIETY | |
| 112.00 | Mental Disorders | 309.22 | EMANCIPATION DISORDER | |
| 112.00 | Mental Disorders | 309.23 | ACADEMIC/WORK INHIBITION | |
| 112.00 | Mental Disorders | 309.24 | ADJ REACT-ANXIOUS MOOD | |
| 112.00 | Mental Disorders | 309.28 | ADJ REACT-MIXED EMOTION | |
| 112.00 | Mental Disorders | 309.29 | ADJ REACT-EMOTION NEC | |
| 112.00 | Mental Disorders | 309.3 | ADJUST REACT-CONDUCT DIS | |
| 112.00 | Mental Disorders | 309.4 | ADJ REACT-EMOTION/ CONDUC | |
| 112.00 | Mental Disorders | 309.8 | OTHER ADJUST REACTION* | |
| 112.00 | Mental Disorders | 309.81 | PROLONG POSTTRAUM STRESS | |
| 112.00 | Mental Disorders | 309.82 | ADJUST REACT-PHYS SYMPT | |
| 112.00 | Mental Disorders | 309.83 | ADJUST REACT-WITHDRAWAL | |
| 112.00 | Mental Disorders | 309.89 | ADJUSTMENT REACTION NEC | |
| 112.00 | Mental Disorders | 309.9 | ADJUSTMENT REACTION NOS | |
| 112.00 | Mental Disorders | 315. | SPECIFIC DEVELOP DELAYS* | |
| 112.00 | Mental Disorders | 315.0 | SPECIFIC READING DIS* | |
| 112.00 | Mental Disorders | 315.00 | READING DISORDER NOS | |
| 112.00 | Mental Disorders | 315.01 | ALEXIA | |
| 112.00 | Mental Disorders | 315.02 | DEVELOPMENTAL DYSLEXIA | |
| 112.00 | Mental Disorders | 315.09 | READING DISORDER NEC | |
| 112.00 | Mental Disorders | 315.1 | ARITHMETICAL DISORDER | |
| 112.00 | Mental Disorders | 315.2 | OTH LEARNING DIFFICULTY | |
| 112.00 | Mental Disorders | 315.3 | SPEECH/ LANGUAGE DISORDER | |
| 112.00 | Mental Disorders | 315.31 | DEVELOPMENT LANGUAGE DIS | |
| 112.00 | Mental Disorders | 315.39 | SPEECH/ LANGUAGE DIS NEC | |
| 112.00 | Mental Disorders | 315.4 | COORDINATION DISORDER | |
| 112.00 | Mental Disorders | 315.5 | MIXED DEVELOPMENT DIS | |
| 112.00 | Mental Disorders | 315.8 | DEVELOPMENT DELAYS NEC | |
| 112.00 | Mental Disorders | 315.9 | DEVELOPMENTAL DELAY NOS | |
| 112.02 | Organic mental disorders | 293. | TRANSIENT ORG MENTAL DIS | |
| 112.02 | Organic mental disorders | 293.0 | ACUTE DELIRIUM | |
| 112.02 | Organic mental disorders | 293.1 | SUBACUTE DELIRIUM | |
| 112.02 | Organic mental disorders | 293.8 | OTH TRANSIENT ORG MENTAL | |
| 112.02 | Organic mental disorders | 293.81 | ORGANIC DELUSIONAL SYND | |
| 112.02 | Organic mental disorders | 293.82 | ORGANIC HALLUCINOSIS SYN | |
| 112.02 | Organic mental disorders | 293.83 | ORGANIC AFFECTIVE SYND | |
| 112.02 | Organic mental disorders | 293.89 | TRANSIENT ORG MENTAL NEC | |
| 112.02 | Organic mental disorders | 293.9 | TRANSIENT ORG MENTAL NOS | |
| 112.02 | Organic mental disorders | 294. | OTHER ORGANIC PSYCH COND | |
| 112.02 | Organic mental disorders | 294.0 | AMNESTIC SYNDROME | |
| 112.02 | Organic mental disorders | 294.1 | DEMENTIA IN OTH DISEASES | |
| 112.02 | Organic mental disorders | 294.8 | ORGANIC BRAIN SYND NEC | |
| 112.02 | Organic mental disorders | 294.9 | ORGANIC BRAIN SYND NOS | |
| 112.03 | Schizophrenic/ delusional/ schizoaffective, and other psychotic disorders | 295. | SCHIZOPHRENIC DISORDERS* | |
| 112.03 | Schizophrenic/ delusional/ schizoaffective, and other psychotic disorders | 295.0 | SIMPLE SCHIZOPHRENIA* | |
| 112.03 | Schizophrenic/ delusional/ schizoaffective, and other psychotic disorders | 295.00 | SIMPL SCHIZOPHREN-UNSPEC | |
| 112.03 | Schizophrenic/ delusional/ schizoaffective, and other psychotic disorders | 295.01 | SIMPL SCHIZOPHREN-SUBCHR | |
| 112.03 | Schizophrenic/ delusional/ schizoaffective, and other psychotic disorders | 295.02 | SIMPLE SCHIZOPHREN-CHR | |
| 112.03 | Schizophrenic/ delusional/ schizoaffective, and other psychotic disorders | 295.03 | SIMP SCHIZ-SUBCHR/ EXACER | |
| 112.03 | Schizophrenic/ delusional/ schizoaffective, and other psychotic disorders | 295.1 | HEBEPHRENIA* | |
| 112.03 | Schizophrenic/ delusional/ schizoaffective, and other psychotic disorders | 295.10 | HEBEPHRENIA-UNSPEC | |
| 112.03 | Schizophrenic/ delusional/ schizoaffective, and other psychotic disorders | 295.11 | HEBEPHRENIA-SUBCHRONIC | |
| 112.03 | Schizophrenic/ delusional/ schizoaffective, and other psychotic disorders | 295.12 | HEBEPHRENIA-CHRONIC | |
| 112.03 | Schizophrenic/ delusional/ schizoaffective, and other psychotic disorders | 295.13 | HEBEPHREN-SUBCHR/ EXACERB | |
| 112.03 | Schizophrenic/ delusional/ schizoaffective, and other psychotic disorders | 295.14 | HEBEPHRENIA-CHR/ EXACERB | |
| 112.03 | Schizophrenic/ delusional/ schizoaffective, and other psychotic disorders | 295.15 | HEBEPHRENIA-REMISSION | |
| 112.03 | Schizophrenic/ delusional/ schizoaffective, and other psychotic disorders | 295.2 | CATATONIC SCHIZOPHRENIA* | |
| 112.03 | Schizophrenic/ delusional/ schizoaffective, and other psychotic disorders | 295.20 | CATATONIA-UNSPEC | |
| 112.03 | Schizophrenic/ delusional/ schizoaffective, and other psychotic disorders | 295.21 | CATATONIA-SUBCHRONIC | |
| 112.03 | Schizophrenic/ delusional/ schizoaffective, and other psychotic disorders | 295.22 | CATATONIA-CHRONIC | |
| 112.03 | Schizophrenic/ delusional/ schizoaffective, and other psychotic disorders | 295.23 | CATATONIA-SUBCHR/ EXACERB | |
| 112.03 | Schizophrenic/ delusional/ schizoaffective, and other psychotic disorders | 295.24 | CATATONIA-CHR/ EXACERB | |
| 112.03 | Schizophrenic/ delusional/ schizoaffective, and other psychotic disorders | 295.25 | CATATONIA-REMISSION | |
| 112.03 | Schizophrenic/ delusional/ schizoaffective, and other psychotic disorders | 295.3 | PARANOID SCHIZOPHRENIA* | |
| 112.03 | Schizophrenic/ delusional/ schizoaffective, and other psychotic disorders | 295.30 | PARANOID SCHIZO-UNSPEC | |
| 112.03 | Schizophrenic/ delusional/ schizoaffective, and other psychotic disorders | 295.31 | PARANOID SCHIZO-SUBCHR | |
| 112.03 | Schizophrenic/ delusional/ schizoaffective, and other psychotic disorders | 295.32 | PARANOID SCHIZO-CHRONIC | |
| 112.03 | Schizophrenic/ delusional/ schizoaffective, and other psychotic disorders | 295.33 | PARAN SCHIZO-SUBCHR/ EXAC | |
| 112.03 | Schizophrenic/ delusional/ schizoaffective, and other psychotic disorders | 295.34 | PARAN SCHIZO-CHR/ EXACERB | |
| 112.03 | Schizophrenic/ delusional/ schizoaffective, and other psychotic disorders | 295.35 | PARANOID SCHIZO-REMISS | |
| 112.03 | Schizophrenic/ delusional/ schizoaffective, and other psychotic disorders | 295.4 | AC SCHIZOPHRENIC EPISODE | |
| 112.03 | Schizophrenic/ delusional/ schizoaffective, and other psychotic disorders | 295.40 | AC SCHIZOPHRENIA-UNSPEC | |
| 112.03 | Schizophrenic/ delusional/ schizoaffective, and other psychotic disorders | 295.41 | AC SCHIZOPHRENIA-SUBCHR | |
| 112.03 | Schizophrenic/ delusional/ schizoaffective, and other psychotic disorders | 295.42 | AC SCHIZOPHRENIA-CHR | |
| 112.03 | Schizophrenic/ delusional/ schizoaffective, and other psychotic disorders | 295.43 | AC SCHIZO-SUBCHR/ EXACERB | |
| 112.03 | Schizophrenic/ delusional/ schizoaffective, and other psychotic disorders | 295.44 | AC SCHIZOPHR-CHR/ EXACERB | |
| 112.03 | Schizophrenic/ delusional/ schizoaffective, and other psychotic disorders | 295.5 | LATENT SCHIZOPHRENIA* | |
| 112.03 | Schizophrenic/ delusional/ schizoaffective, and other psychotic disorders | 295.50 | LATENT SCHIZOPHREN-UNSP | |
| 112.03 | Schizophrenic/ delusional/ schizoaffective, and other psychotic disorders | 295.52 | LATENT SCHIZOPHREN-CHR | |
| 112.03 | Schizophrenic/ delusional/ schizoaffective, and other psychotic disorders | 295.53 | LAT SCHIZO-SUBCHR/ EXACER | |
| 112.03 | Schizophrenic/ delusional/ schizoaffective, and other psychotic disorders | 295.6 | RESIDUAL SCHIZOPHRENIA* | |
| 112.03 | Schizophrenic/ delusional/ schizoaffective, and other psychotic disorders | 295.60 | RESID SCHIZOPHREN-UNSP | |
| 112.03 | Schizophrenic/ delusional/ schizoaffective, and other psychotic disorders | 295.61 | RESID SCHIZOPHREN-SUBCHR | |
| 112.03 | Schizophrenic/ delusional/ schizoaffective, and other psychotic disorders | 295.62 | RESIDUAL SCHIZOPHREN-CHR | |
| 112.03 | Schizophrenic/ delusional/ schizoaffective, and other psychotic disorders | 295.63 | RESID SCHIZO-SUBCHR/ EXAC | |
| 112.03 | Schizophrenic/ delusional/ schizoaffective, and other psychotic disorders | 295.64 | RESID SCHIZO-CHR/ EXACERB | |
| 112.03 | Schizophrenic/ delusional/ schizoaffective, and other psychotic disorders | 295.65 | RESID SCHIZOPHREN-REMISS | |
| 112.03 | Schizophrenic/ delusional/ schizoaffective, and other psychotic disorders | 295.7 | SCHIZOAFFECTIVE TYPE* | |
| 112.03 | Schizophrenic/ delusional/ schizoaffective, and other psychotic disorders | 295.70 | SCHIZOAFFECTIVE-UNSPEC | |
| 112.03 | Schizophrenic/ delusional/ schizoaffective, and other psychotic disorders | 295.71 | SCHIZOAFFECTIVE-SUBCHR | |
| 112.03 | Schizophrenic/ delusional/ schizoaffective, and other psychotic disorders | 295.72 | SCHIZOAFFECTIVE-CHRONIC | |
| 112.03 | Schizophrenic/ delusional/ schizoaffective, and other psychotic disorders | 295.73 | SCHIZOAFF-SUBCHR/ EXACER | |
| 112.03 | Schizophrenic/ delusional/ schizoaffective, and other psychotic disorders | 295.74 | SCHIZOAFFECT-CHR/ EXACER | |
| 112.03 | Schizophrenic/ delusional/ schizoaffective, and other psychotic disorders | 295.8 | SCHIZOPHRENIA NEC* | |
| 112.03 | Schizophrenic/ delusional/ schizoaffective, and other psychotic disorders | 295.80 | SCHIZOPHRENIA NEC-UNSPEC | |
| 112.03 | Schizophrenic/ delusional/ schizoaffective, and other psychotic disorders | 295.82 | SCHIZOPHRENIA NEC-CHR | |
| 112.03 | Schizophrenic/ delusional/ schizoaffective, and other psychotic disorders | 295.83 | SCHIZO NEC-SUBCHR/EXACER | |
| 112.03 | Schizophrenic/ delusional/ schizoaffective, and other psychotic disorders | 295.84 | SCHIZO NEC-CHR/ EXACERB | |
| 112.03 | Schizophrenic/ delusional/ schizoaffective, and other psychotic disorders | 295.9 | SCHIZOPHRENIA NOS* | |
| 112.03 | Schizophrenic/ delusional/ schizoaffective, and other psychotic disorders | 295.90 | SCHIZOPHRENIA NOS-UNSPEC | |
| 112.03 | Schizophrenic/ delusional/ schizoaffective, and other psychotic disorders | 295.91 | SCHIZOPHRENIA NOS-SUBCHR | |
| 112.03 | Schizophrenic/ delusional/ schizoaffective, and other psychotic disorders | 295.92 | SCHIZOPHRENIA NOS-CHR | |
| 112.03 | Schizophrenic/ delusional/ schizoaffective, and other psychotic disorders | 295.93 | SCHIZO NOS-SUBCHR/ EXACER | |
| 112.03 | Schizophrenic/ delusional/ schizoaffective, and other psychotic disorders | 295.94 | SCHIZO NOS-CHR/ EXACERB | |
| 112.03 | Schizophrenic/ delusional/ schizoaffective, and other psychotic disorders | 295.95 | SCHIZOPHRENIA NOS-REMISS | |
| 112.03 | Schizophrenic/ delusional/ schizoaffective, and other psychotic disorders | 297. | PARANOID STATES* | |
| 112.03 | Schizophrenic/ delusional/ schizoaffective, and other psychotic disorders | 297.0 | PARANOID STATE SIMPLE | |
| 112.03 | Schizophrenic/ delusional/ schizoaffective, and other psychotic disorders | 297.1 | PARANOIA | |
| 112.03 | Schizophrenic/ delusional/ schizoaffective, and other psychotic disorders | 297.2 | PARAPHRENIA | |
| 112.03 | Schizophrenic/ delusional/ schizoaffective, and other psychotic disorders | 297.3 | SHARED PARANOID DISORDER | |
| 112.03 | Schizophrenic/ delusional/ schizoaffective, and other psychotic disorders | 297.8 | PARANOID STATES NEC | |
| 112.03 | Schizophrenic/ delusional/ schizoaffective, and other psychotic disorders | 297.9 | PARANOID STATE NOS | |
| 112.03 | Schizophrenic/ delusional/ schizoaffective, and other psychotic disorders | 298. | OTH NONORGANIC PSYCHOSES | |
| 112.03 | Schizophrenic/ delusional/ schizoaffective, and other psychotic disorders | 298.0 | REACT DEPRESS PSYCHOSIS | |
| 112.03 | Schizophrenic/ delusional/ schizoaffective, and other psychotic disorders | 298.1 | EXCITATIV TYPE PSYCHOSIS | |
| 112.03 | Schizophrenic/ delusional/ schizoaffective, and other psychotic disorders | 298.2 | REACTIVE CONFUSION | |
| 112.03 | Schizophrenic/ delusional/ schizoaffective, and other psychotic disorders | 298.3 | ACUTE PARANOID REACTION | |
| 112.03 | Schizophrenic/ delusional/ schizoaffective, and other psychotic disorders | 298.4 | PSYCHOGEN PARANOID PSYCH | |
| 112.03 | Schizophrenic/ delusional/ schizoaffective, and other psychotic disorders | 298.8 | REACT PSYCHOSIS NEC/ NOS | |
| 112.03 | Schizophrenic/ delusional/ schizoaffective, and other psychotic disorders | 298.9 | PSYCHOSIS NOS | |
| 112.03 | Schizophrenic/ delusional/ schizoaffective, and other psychotic disorders | 299.1 | DISINTEGRATIVE PSYCHOSIS | |
| 112.03 | Schizophrenic/ delusional/ schizoaffective, and other psychotic disorders | 299.10 | DISINTEGR PSYCH-ACTIVE | |
| 112.03 | Schizophrenic/ delusional/ schizoaffective, and other psychotic disorders | 299.8 | EARLY CHLD PSYCHOSES NEC | |
| 112.03 | Schizophrenic/ delusional/ schizoaffective, and other psychotic disorders | 299.80 | CHILD PSYCHOS NEC-ACTIVE | |
| 112.03 | Schizophrenic/ delusional/ schizoaffective, and other psychotic disorders | 299.81 | CHILD PSYCHOS NEC-RESID | |
| 112.03 | Schizophrenic/ delusional/ schizoaffective, and other psychotic disorders | 299.9 | EARLY CHLD PSYCHOSIS NOS | |
| 112.03 | Schizophrenic/ delusional/ schizoaffective, and other psychotic disorders | 299.90 | CHILD PSYCHOS NOS-ACTIVE | |
| 112.03 | Schizophrenic/ delusional/ schizoaffective, and other psychotic disorders | 299.91 | CHILD PSYCHOS NOS-RESID | |
| 112.04 | Mood disorders | 296. | AFFECTIVE PSYCHOSES* | |
| 112.04 | Mood disorders | 296.0 | MANIC DIS SINGL EPISODE | |
| 112.04 | Mood disorders | 296.00 | MANIC DISORDER-UNSPEC | |
| 112.04 | Mood disorders | 296.01 | MANIC DISORDER-MILD | |
| 112.04 | Mood disorders | 296.02 | MANIC DISORDER-MOD | |
| 112.04 | Mood disorders | 296.03 | MANIC DISORDER-SEVERE | |
| 112.04 | Mood disorders | 296.1 | MANIC RECURRENT EPISODE | |
| 112.04 | Mood disorders | 296.10 | RECUR MANIC DIS-UNSPEC | |
| 112.04 | Mood disorders | 296.12 | RECUR MANIC DIS-MOD | |
| 112.04 | Mood disorders | 296.13 | RECUR MANIC DIS-SEVERE | |
| 112.04 | Mood disorders | 296.14 | RECUR MANIC-SEV W PSYCHO | |
| 112.04 | Mood disorders | 296.15 | RECUR MANIC-PART REMISS | |
| 112.04 | Mood disorders | 296.2 | DEPR PSYCH SINGL EPISOD | |
| 112.04 | Mood disorders | 296.20 | DEPRESS PSYCHOSIS-UNSPEC | |
| 112.04 | Mood disorders | 296.21 | DEPRESS PSYCHOSIS-MILD | |
| 112.04 | Mood disorders | 296.22 | DEPRESSIVE PSYCHOSIS-MOD | |
| 112.04 | Mood disorders | 296.23 | DEPRESS PSYCHOSIS-SEVERE | |
| 112.04 | Mood disorders | 296.24 | DEPR PSYCHOS-SEV W PSYCH | |
| 112.04 | Mood disorders | 296.25 | DEPR PSYCHOS-PART REMISS | |
| 112.04 | Mood disorders | 296.26 | DEPR PSYCHOS-FULL REMISS | |
| 112.04 | Mood disorders | 296.3 | DEPR PSYCH RECUR EPISOD | |
| 112.04 | Mood disorders | 296.30 | RECURR DEPR PSYCHOS-UNSP | |
| 112.04 | Mood disorders | 296.31 | RECURR DEPR PSYCHOS-MILD | |
| 112.04 | Mood disorders | 296.32 | RECURR DEPR PSYCHOS-MOD | |
| 112.04 | Mood disorders | 296.33 | RECUR DEPR PSYCH-SEVERE | |
| 112.04 | Mood disorders | 296.34 | REC DEPR PSYCH-PSYCHOTIC | |
| 112.04 | Mood disorders | 296.35 | RECUR DEPR PSYC-PART REM | |
| 112.04 | Mood disorders | 296.36 | RECUR DEPR PSYC-FULL REM | |
| 112.04 | Mood disorders | 296.4 | BIPOLAR AFFECTIVE MANIC | |
| 112.04 | Mood disorders | 296.40 | BIPOL AFF MANIC-UNSPEC | |
| 112.04 | Mood disorders | 296.41 | BIPOLAR AFF MANIC-MILD | |
| 112.04 | Mood disorders | 296.42 | BIPOLAR AFFEC MANIC-MOD | |
| 112.04 | Mood disorders | 296.43 | BIPOL AFF MANIC-SEVERE | |
| 112.04 | Mood disorders | 296.44 | BIPOL MANIC-SEV W PSYCH | |
| 112.04 | Mood disorders | 296.45 | BIPOL AFF MANIC-PART REM | |
| 112.04 | Mood disorders | 296.46 | BIPOL AFF MANIC-FULL REM | |
| 112.04 | Mood disorders | 296.5 | BIPOLAR AFFECT DEPRESS* | |
| 112.04 | Mood disorders | 296.50 | BIPOLAR AFF DEPR-UNSPEC | |
| 112.04 | Mood disorders | 296.51 | BIPOLAR AFFEC DEPR-MILD | |
| 112.04 | Mood disorders | 296.52 | BIPOLAR AFFEC DEPR-MOD | |
| 112.04 | Mood disorders | 296.53 | BIPOL AFF DEPR-SEVERE | |
| 112.04 | Mood disorders | 296.54 | BIPOL DEPR-SEV W PSYCH | |
| 112.04 | Mood disorders | 296.55 | BIPOL AFF DEPR-PART REM | |
| 112.04 | Mood disorders | 296.56 | BIPOL AFF DEPR-FULL REM | |
| 112.04 | Mood disorders | 296.6 | BIPOLAR AFFECTIVE MIXED | |
| 112.04 | Mood disorders | 296.60 | BIPOL AFF MIXED-UNSPEC | |
| 112.04 | Mood disorders | 296.61 | BIPOLAR AFF MIXED-MILD | |
| 112.04 | Mood disorders | 296.62 | BIPOLAR AFFEC MIXED-MOD | |
| 112.04 | Mood disorders | 296.63 | BIPOL AFF MIXED-SEVERE | |
| 112.04 | Mood disorders | 296.64 | BIPOL MIXED-SEV W PSYCH | |
| 112.04 | Mood disorders | 296.65 | BIPOL AFF MIX-PART REM | |
| 112.04 | Mood disorders | 296.66 | BIPOL AFF MIX-FULL REM | |
| 112.04 | Mood disorders | 296.7 | BIPOLAR AFFECTIVE NOS | |
| 112.04 | Mood disorders | 296.8 | MANIC-DEPRESSIVE NEC/ NOS | |
| 112.04 | Mood disorders | 296.80 | MANIC-DEPRESSIVE NOS | |
| 112.04 | Mood disorders | 296.81 | ATYPICAL MANIC DISORDER | |
| 112.04 | Mood disorders | 296.82 | ATYPICAL DEPRESSIVE DIS | |
| 112.04 | Mood disorders | 296.89 | MANIC-DEPRESSIVE NEC | |
| 112.04 | Mood disorders | 296.9 | AFFECT PSYCHOSES NEC/ NOS | |
| 112.04 | Mood disorders | 296.90 | AFFECTIVE PSYCHOSIS NOS | |
| 112.04 | Mood disorders | 296.99 | AFFECTIVE PSYCHOSES NEC | |
| 112.04 | Mood disorders | 311. | DEPRESSIVE DISORDER NEC | |
| 112.05 | Mental retardation | 317. | MILD MENTAL RETARDATION | |
| 112.05 | Mental retardation | 318. | OTHER MENTAL RETARDATION | |
| 112.05 | Mental retardation | 318.0 | MOD MENTAL RETARDATION | |
| 112.05 | Mental retardation | 318.1 | SEVERE MENTAL RETARDAT | |
| 112.05 | Mental retardation | 318.2 | PROFOUND MENTAL RETARDAT | |
| 112.08 | Personality disorders | 301. | PERSONALITY DISORDERS* | |
| 112.08 | Personality disorders | 301.0 | PARANOID PERSONALITY | |
| 112.08 | Personality disorders | 301.1 | AFFECTIVE PERSONALITY* | |
| 112.08 | Personality disorders | 301.10 | AFFECTIV PERSONALITY NOS | |
| 112.08 | Personality disorders | 301.11 | CHRONIC HYPOMANIC PERSON | |
| 112.08 | Personality disorders | 301.12 | CHR DEPRESSIVE PERSON | |
| 112.08 | Personality disorders | 301.13 | CYCLOTHYMIC DISORDER | |
| 112.08 | Personality disorders | 301.2 | SCHIZOID PERSONALITY* | |
| 112.08 | Personality disorders | 301.20 | SCHIZOID PERSONALITY NOS | |
| 112.08 | Personality disorders | 301.21 | INTROVERTED PERSONALITY | |
| 112.08 | Personality disorders | 301.22 | SCHIZOTYPAL PERSONALITY | |
| 112.08 | Personality disorders | 301.3 | EXPLOSIVE PERSONALITY | |
| 112.08 | Personality disorders | 301.4 | COMPULSIVE PERSONALITY | |
| 112.08 | Personality disorders | 301.5 | HISTRIONIC PERSONALITY* | |
| 112.08 | Personality disorders | 301.50 | HISTRIONIC PERSON NOS | |
| 112.08 | Personality disorders | 301.51 | CHR FACTITIOUS ILLNESS | |
| 112.08 | Personality disorders | 301.59 | HISTRIONIC PERSON NEC | |
| 112.08 | Personality disorders | 301.6 | DEPENDENT PERSONALITY | |
| 112.08 | Personality disorders | 301.7 | ANTISOCIAL PERSONALITY | |
| 112.08 | Personality disorders | 301.8 | OTHER PERSONALITY DIS* | |
| 112.08 | Personality disorders | 301.81 | NARCISSISTIC PERSONALITY | |
| 112.08 | Personality disorders | 301.82 | AVOIDANT PERSONALITY | |
| 112.08 | Personality disorders | 301.83 | BORDERLINE PERSONALITY | |
| 112.08 | Personality disorders | 301.84 | PASSIVE-AGGRESSIV PERSON | |
| 112.08 | Personality disorders | 301.89 | PERSONALITY DISORDER NEC | |
| 112.08 | Personality disorders | 301.9 | PERSONALITY DISORDER NOS | |
| 112.08 | Personality disorders | 312. | CONDUCT DISTURBANCE NEC* | |
| 112.08 | Personality disorders | 312.0 | UNSOCIALIZED AGGRESSION* | |
| 112.08 | Personality disorders | 312.00 | UNSOCIAL AGGRESS-UNSPEC | |
| 112.08 | Personality disorders | 312.01 | UNSOCIAL AGGRESSION-MILD | |
| 112.08 | Personality disorders | 312.02 | UNSOCIAL AGGRESSION-MOD | |
| 112.08 | Personality disorders | 312.03 | UNSOCIAL AGGRESS-SEVERE | |
| 112.08 | Personality disorders | 312.1 | UNSOCIALIZ UNAGGRESSIVE | |
| 112.08 | Personality disorders | 312.10 | UNSOCIAL UNAGGRESS-UNSP | |
| 112.08 | Personality disorders | 312.11 | UNSOCIAL UNAGGRESS-MILD | |
| 112.08 | Personality disorders | 312.12 | UNSOCIAL UNAGGRESS-MOD | |
| 112.08 | Personality disorders | 312.13 | UNSOCIAL UNAGGR-SEVERE | |
| 112.08 | Personality disorders | 312.2 | SOCIALIZED CONDUCT DIS* | |
| 112.08 | Personality disorders | 312.20 | SOCIAL CONDUCT DIS-UNSP | |
| 112.08 | Personality disorders | 312.21 | SOCIAL CONDUCT DIS-MILD | |
| 112.08 | Personality disorders | 312.22 | SOCIAL CONDUCT DIS-MOD | |
| 112.08 | Personality disorders | 312.23 | SOCIAL CONDUCT DIS-SEV | |
| 112.08 | Personality disorders | 312.3 | IMPULSE CONTROL DIS NEC* | |
| 112.08 | Personality disorders | 312.30 | IMPULSE CONTROL DIS NOS | |
| 112.08 | Personality disorders | 312.32 | KLEPTOMANIA | |
| 112.08 | Personality disorders | 312.33 | PYROMANIA | |
| 112.08 | Personality disorders | 312.34 | INTERMITT EXPLOSIVE DIS | |
| 112.08 | Personality disorders | 312.35 | ISOLATED EXPLOSIVE DIS | |
| 112.08 | Personality disorders | 312.39 | IMPULSE CONTROL DIS NEC | |
| 112.08 | Personality disorders | 312.4 | MIX DIS CONDUCT/ EMOTION | |
| 112.08 | Personality disorders | 312.8 | OTHER CONDUCT DISTURB* | |
| 112.08 | Personality disorders | 312.9 | CONDUCT DISTURBANCE NOS | |
| 112.08 | Personality disorders | 313. | EMOTIONAL DIS CHILD/ ADOL | |
| 112.08 | Personality disorders | 313.0 | OVERANXIOUS DISORDER | |
| 112.08 | Personality disorders | 313.1 | MISERY & UNHAPPINESS DIS | |
| 112.08 | Personality disorders | 313.2 | SENSITIVITY & WITHDRAWAL | |
| 112.08 | Personality disorders | 313.21 | SHYNESS DISORDER-CHILD | |
| 112.08 | Personality disorders | 313.22 | INTROVERTED DIS-CHILD | |
| 112.08 | Personality disorders | 313.23 | ELECTIVE MUTISM | |
| 112.08 | Personality disorders | 313.3 | RELATIONSHIP PROBLEMS | |
| 112.08 | Personality disorders | 313.8 | OTH EMOTIONAL DIS CHILD* | |
| 112.08 | Personality disorders | 313.81 | OPPOSITIONAL DISORDER | |
| 112.08 | Personality disorders | 313.82 | IDENTITY DISORDER | |
| 112.08 | Personality disorders | 313.83 | ACADEMIC UNDERACHIEVMENT | |
| 112.08 | Personality disorders | 313.89 | EMOTIONAL DIS CHILD NEC | |
| 112.08 | Personality disorders | 313.9 | EMOTIONAL DIS CHILD NOS | |
| 112.09 | Psychoactive substance dependence disorder | 291. | ALCOHOLIC PSYCHOSES* | |
| 112.09 | Psychoactive substance dependence disorder | 291.0 | DELIRIUM TREMENS | |
| 112.09 | Psychoactive substance dependence disorder | 291.1 | ALCOHOL AMNESTIC SYND | |
| 112.09 | Psychoactive substance dependence disorder | 291.2 | ALCOHOLIC DEMENTIA NEC | |
| 112.09 | Psychoactive substance dependence disorder | 291.3 | ALCOHOL HALLUCINOSIS | |
| 112.09 | Psychoactive substance dependence disorder | 291.4 | PATHOLOGIC ALCOHOL INTOX | |
| 112.09 | Psychoactive substance dependence disorder | 291.8 | ALCOHOLIC PSYCHOSIS NEC | |
| 112.09 | Psychoactive substance dependence disorder | 291.9 | ALCOHOLIC PSYCHOSIS NOS | |
| 112.09 | Psychoactive substance dependence disorder | 292. | DRUG PSYCHOSES* | |
| 112.09 | Psychoactive substance dependence disorder | 292.0 | DRUG WITHDRAWAL SYNDROME | |
| 112.09 | Psychoactive substance dependence disorder | 292.1 | DRUG PARANOID/ HALLUCINOS | |
| 112.09 | Psychoactive substance dependence disorder | 292.11 | DRUG PARANOID STATE | |
| 112.09 | Psychoactive substance dependence disorder | 292.12 | DRUG HALLUCINOSIS | |
| 112.09 | Psychoactive substance dependence disorder | 292.2 | PATHOLOGIC DRUG INTOX | |
| 112.09 | Psychoactive substance dependence disorder | 292.8 | OTHER DRUG MENTAL DIS* | |
| 112.09 | Psychoactive substance dependence disorder | 292.81 | DRUG-INDUCED DELIRIUM | |
| 112.09 | Psychoactive substance dependence disorder | 292.82 | DRUG-INDUCED DEMENTIA | |
| 112.09 | Psychoactive substance dependence disorder | 292.84 | DRUG DEPRESSIVE SYNDROME | |
| 112.09 | Psychoactive substance dependence disorder | 292.89 | DRUG MENTAL DISORDER NEC | |
| 112.09 | Psychoactive substance dependence disorder | 292.9 | DRUG MENTAL DISORDER NOS | |
| 112.10 | disorders | 299.0 | INFANTILE AUTISM* | |
| 112.11 | Attention deficit hyperactivity disorder | 314. | HYPERKINETIC SYNDROME* | |
| 112.11 | Attention deficit hyperactivity disorder | 314.0 | ATTENTION DEFICIT DIS* | |
| 112.11 | Attention deficit hyperactivity disorder | 314.00 | ATTN DEFIC NONHYPERACT | |
| 112.11 | Attention deficit hyperactivity disorder | 314.01 | ATTN DEFICIT W HYPERACT | |
| 112.11 | Attention deficit hyperactivity disorder | 314.1 | HYPERKINET W DEVEL DELAY | |
| 112.11 | Attention deficit hyperactivity disorder | 314.2 | HYPERKINETIC CONDUCT DIS | |
| 112.11 | Attention deficit hyperactivity disorder | 314.8 | OTHER HYPERKINETIC SYND | |
| 112.11 | Attention deficit hyperactivity disorder | 314.9 | HYPERKINETIC SYND NOS | |
| Neoplastic Diseases-Malignant | 113.02 | Lymphoreticular malignant neoplasms | 200.1 | LYMPHOSARCOMA* |
| 113.02 | Lymphoreticular malignant neoplasms | 200.10 | LYMPHSRC UNSP XTRNDL ORG | |
| 113.02 | Lymphoreticular malignant neoplasms | 200.13 | LYMPHOSARCOMA ABDOM | |
| 113.02 | Lymphoreticular malignant neoplasms | 200.15 | LYMPHOSARCOMA INGUIN | |
| 113.02 | Lymphoreticular malignant neoplasms | 200.18 | LYMPHOSARCOMA MULT | |
| 113.02 | Lymphoreticular malignant neoplasms | 200.2 | BURKITT'S TUMOR/ LYMPHOMA | |
| 113.02 | Lymphoreticular malignant neoplasms | 200.20 | BRKT TMR UNSP XTRNDL ORG | |
| 113.02 | Lymphoreticular malignant neoplasms | 200.21 | BURKITT'S TUMOR HEAD | |
| 113.02 | Lymphoreticular malignant neoplasms | 200.23 | BURKITT'S TUMOR ABDOM | |
| 113.02 | Lymphoreticular malignant neoplasms | 200.28 | BURKITT'S TUMOR MULT | |
| 113.02 | Lymphoreticular malignant neoplasms | 200.80 | OTH VARN UNSP XTRNDL ORG | |
| 113.02 | Lymphoreticular malignant neoplasms | 201.0 | HODGKIN'S PARAGRANULOMA* | |
| 113.02 | Lymphoreticular malignant neoplasms | 201.00 | HDGK PRG UNSP XTRNDL ORG | |
| 113.02 | Lymphoreticular malignant neoplasms | 201.01 | HODGKINS PARAGRAN HEAD | |
| 113.02 | Lymphoreticular malignant neoplasms | 201.03 | HODGKINS PARAGRAN ABDOM | |
| 113.02 | Lymphoreticular malignant neoplasms | 201.10 | HDGK GRN UNSP XTRNDL ORG | |
| 113.02 | Lymphoreticular malignant neoplasms | 201.4 | HODGKINS LYMPH-HISTIOCYT | |
| 113.02 | Lymphoreticular malignant neoplasms | 201.40 | LYM-HST UNSP XTRNDL ORGN | |
| 113.02 | Lymphoreticular malignant neoplasms | 201.44 | HODG LYMPH-HISTIO AXILLA | |
| 113.02 | Lymphoreticular malignant neoplasms | 201.5 | HODGKINS NODULAR SCLEROS | |
| 113.02 | Lymphoreticular malignant neoplasms | 201.50 | NDR SCLR UNSP XTRNDL ORG | |
| 113.02 | Lymphoreticular malignant neoplasms | 201.51 | HODG NODUL SCLERO HEAD | |
| 113.02 | Lymphoreticular malignant neoplasms | 201.52 | HODG NODUL SCLERO THORAX | |
| 113.02 | Lymphoreticular malignant neoplasms | 201.58 | HODG NODUL SCLERO MULT | |
| 113.02 | Lymphoreticular malignant neoplasms | 201.6 | HODGKINS MIX CELLULARITY | |
| 113.02 | Lymphoreticular malignant neoplasms | 201.60 | MXD CELR UNSP XTRNDL ORG | |
| 113.02 | Lymphoreticular malignant neoplasms | 201.61 | HODGKINS MIX CELL HEAD | |
| 113.02 | Lymphoreticular malignant neoplasms | 201.9 | HODGKINS DISEASE NOS* | |
| 113.02 | Lymphoreticular malignant neoplasms | 201.90 | HDGK DIS UNSP XTRNDL ORG | |
| 113.02 | Lymphoreticular malignant neoplasms | 201.91 | HODGKINS DIS NOS HEAD | |
| 113.02 | Lymphoreticular malignant neoplasms | 201.92 | HODGKINS DIS NOS THORAX | |
| 113.02 | Lymphoreticular malignant neoplasms | 201.93 | HODGKINS DIS NOS ABDOM | |
| 113.02 | Lymphoreticular malignant neoplasms | 201.94 | HODGKINS DIS NOS AXILLA | |
| 113.02 | Lymphoreticular malignant neoplasms | 201.95 | HODGKINS DIS NOS INGUIN | |
| 113.02 | Lymphoreticular malignant neoplasms | 201.96 | HODGKINS DIS NOS PELVIC | |
| 113.02 | Lymphoreticular malignant neoplasms | 201.98 | HODGKINS DIS NOS MULT | |
| 113.02 | Lymphoreticular malignant neoplasms | 202. | OTH MAL NEO LYMPH/ HISTIO * | |
| 113.02 | Lymphoreticular malignant neoplasms | 202.0 | NODULAR LYMPHOMA* | |
| 113.02 | Lymphoreticular malignant neoplasms | 202.00 | NDLR LYM UNSP XTRNDL ORG | |
| 113.02 | Lymphoreticular malignant neoplasms | 202.02 | NODULAR LYMPHOMA THORAX | |
| 113.02 | Lymphoreticular malignant neoplasms | 202.04 | NODULAR LYMPHOMA AXILLA | |
| 113.02 | Lymphoreticular malignant neoplasms | 202.1 | MYCOSIS FUNGOIDES* | |
| 113.02 | Lymphoreticular malignant neoplasms | 202.10 | MYCS FNG UNSP XTRNDL ORG | |
| 113.02 | Lymphoreticular malignant neoplasms | 202.11 | MYCOSIS FUNDOIDES HEAD | |
| 113.02 | Lymphoreticular malignant neoplasms | 202.2 | SEZARY'S DISEASE* | |
| 113.02 | Lymphoreticular malignant neoplasms | 202.20 | SZRY DIS UNSP XTRNDL ORG | |
| 113.02 | Lymphoreticular malignant neoplasms | 202.21 | SEZARY'S DISEASE HEAD | |
| 113.02 | Lymphoreticular malignant neoplasms | 202.22 | SEZARY'S DISEASE THORAX | |
| 113.02 | Lymphoreticular malignant neoplasms | 202.24 | SEZARY'S DISEASE AXILLA | |
| 113.02 | Lymphoreticular malignant neoplasms | 202.25 | SEZARY'S DISEASE INGUIN | |
| 113.02 | Lymphoreticular malignant neoplasms | 202.3 | MALIGNANT HISTIOCYTOSIS* | |
| 113.02 | Lymphoreticular malignant neoplasms | 202.30 | MLG HIST UNSP XTRNDL ORG | |
| 113.02 | Lymphoreticular malignant neoplasms | 202.31 | MAL HISTIOCYTOSIS HEAD | |
| 113.02 | Lymphoreticular malignant neoplasms | 202.32 | MAL HISTIOCYTOSIS THORAX | |
| 113.02 | Lymphoreticular malignant neoplasms | 202.38 | MAL HISTIOCYTOSIS MULT | |
| 113.02 | Lymphoreticular malignant neoplasms | 202.4 | LEUKEM RETICULOENDOTHEL* | |
| 113.02 | Lymphoreticular malignant neoplasms | 202.5 | LETTERER-SIWE DISEASE* | |
| 113.02 | Lymphoreticular malignant neoplasms | 202.50 | LTR-SIWE UNSP XTRNDL ORG | |
| 113.02 | Lymphoreticular malignant neoplasms | 202.51 | LETTERER-SIWE DIS HEAD | |
| 113.02 | Lymphoreticular malignant neoplasms | 202.6 | MALIG MAST CELL TUMORS* | |
| 113.02 | Lymphoreticular malignant neoplasms | 202.60 | MLG MAST UNSP XTRNDL ORG | |
| 113.02 | Lymphoreticular malignant neoplasms | 202.61 | MAL MASTOCYTOSIS HEAD | |
| 113.02 | Lymphoreticular malignant neoplasms | 202.62 | MAL MASTOCYTOSIS THORAX | |
| 113.02 | Lymphoreticular malignant neoplasms | 202.8 | LYMPHOMAS NEC* | |
| 113.02 | Lymphoreticular malignant neoplasms | 208.80 | OTH LYMP UNSP XTRNDL ORG | |
| 113.02 | Lymphoreticular malignant neoplasms | 202.81 | LYMPHOMAS NEC HEAD | |
| 113.02 | Lymphoreticular malignant neoplasms | 202.82 | LYMPHOMAS NEC THORAX | |
| 113.02 | Lymphoreticular malignant neoplasms | 202.83 | LYMPHOMAS NEC ABDOM | |
| 113.02 | Lymphoreticular malignant neoplasms | 202.84 | LYMPHOMAS NEC AXILLA | |
| 113.02 | Lymphoreticular malignant neoplasms | 202.85 | LYMPHOMAS NEC INGUIN | |
| 113.02 | Lymphoreticular malignant neoplasms | 202.86 | LYMPHOMAS NEC PELVIC | |
| 113.02 | Lymphoreticular malignant neoplasms | 202.87 | LYMPHOMAS NEC SPLEEN | |
| 113.02 | Lymphoreticular malignant neoplasms | 202.88 | LYMPHOMAS NEC MULT | |
| 113.02 | Lymphoreticular malignant neoplasms | 202.9 | MAL NEO LYM/ HIST TIS NEC | |
| 113.02 | Lymphoreticular malignant neoplasms | 202.90 | UNSP LYM UNSP XTRNDL ORG | |
| 113.03 | Malignant solid tumors | 159. | OTH MALIG NEO GI/ PERITON | |
| 113.03 | Malignant solid tumors | 159.0 | MALIG NEO INTESTINE NOS | |
| 113.03 | Malignant solid tumors | 159.8 | MAL NEO GI/ INTRA-ABD NEC | |
| 113.03 | Malignant solid tumors | 159.9 | MAL NEO GI TRACT ILL-DEF | |
| 113.03 | Malignant solid tumors | 164.0 | MALIGNANT NEOPL THYMUS | |
| 113.03 | Malignant solid tumors | 189. | MAL NEO URINARY NEC/ NOS* | |
| 113.03 | Malignant solid tumors | 189.0 | MALIG NEOPL KIDNEY | |
| 113.03 | Malignant solid tumors | 189.2 | MALIGN NEOPL URETER | |
| 113.03 | Malignant solid tumors | 189.3 | MALIGN NEOPL URETHRA | |
| 113.03 | Malignant solid tumors | 189.9 | MAL NEO URINARY NOS | |
| 113.03 | Malignant solid tumors | 192.1 | MAL NEO CEREBRAL MENING | |
| 113.03 | Malignant solid tumors | 194.0 | MALIGN NEOPL ADRENAL | |
| 113.03 | Malignant solid tumors | 190.5 | MALIGN NEOPL RETINA * | |
| Immune System | 114.02 | Systemic lupus erythematosus | 695.4 | LUPUS ERYTHEMATOSUS |
| 114.02 | Systemic lupus erythematosus | 710.0 | SYST LUPUS ERYTHEMATOSUS | |
| 114.04 | Systemic sclerosis and sclerodernia | 710.1 | SYSTEMIC SCLEROSIS * | |
| 114.07 | Congenital immune deficiency disease | 279.0 | DEFIC HUMORAL IMMUNITY* * | |
| 114.07 | Congenital immune deficiency disease | 279.00 | HYPOGAMMAGLOBULINEM NOS * | |
| 114.07 | Congenital immune deficiency disease | 279.01 | SELECTIVE IGA IMMUNODEF * | |
| 114.07 | Congenital immune deficiency disease | 279.02 | SELECTIVE IGM IMMUNODEF * | |
| 114.07 | Congenital immune deficiency disease | 279.03 | SELECTIVE IG DEFIC NEC * | |
| 114.07 | Congenital immune deficiency disease | 279.04 | CONG HYPOGAMMAGLOBULINEM * | |
| 114.07 | Congenital immune deficiency disease | 279.05 | IMMUNODEFIC W HYPER-IGM * | |
| 114.07 | Congenital immune deficiency disease | 279.06 | COMMON VARIABL IMMUNODEF * | |
| 114.07 | Congenital immune deficiency disease | 279.09 | HUMORAL IMMUNITY DEF NEC * | |
| 114.07 | Congenital immune deficiency disease | 279.1 | DEFIC CELLULAR IMMUNITY* * | |
| 114.07 | Congenital immune deficiency disease | 279.10 | IMMUNDEF T-CELL DEF NOS * | |
| 114.07 | Congenital immune deficiency disease | 279.11 | DIGEORGE'S SYNDROME * | |
| 114.07 | Congenital immune deficiency disease | 279.12 | WISKOTT-ALDRICH SYNDROME * | |
| 114.07 | Congenital immune deficiency disease | 279.13 | NEZELOF'S SYNDROME * | |
| 114.07 | Congenital immune deficiency disease | 279.19 | DEFIC CELL IMMUNITY NOS * | |
| 114.07 | Congenital immune deficiency disease | 279.2 | COMBINED IMMUNITY DEFIC * | |
| 114.08 | Human immunodeficiency virus (HIV) infection | 042. | HUMAN IMMUNO VIRUS DIS | |
| 114.08 | Human immunodeficiency virus (HIV) infection | 042.0 | HIV W/SPECIF INFECTIONS | |
| 114.08 | Human immunodeficiency virus (HIV) infection | 042.1 | HIV CAUS OTH SPEC INFEC | |
| 114.08 | Human immunodeficiency virus (HIV) infection | 042.2 | HIV W/SPEC MALIG NEOPLS | |
| 114.08 | Human immunodeficiency virus (HIV) infection | 042.9 | AIDS UNSPECIFIED | |
| 114.08 | Human immunodeficiency virus (HIV) infection | 043.0 | HIV CAUS LYMPHADENOPATH * | |
| 114.08 | Human immunodeficiency virus (HIV) infection | 043.1 | HIV CAUS SP CNS DISEASE * | |
| 114.08 | Human immunodeficiency virus (HIV) infection | 043.2 | HIV CAUS OT DISOR IMMUN * | |
| 114.08 | Human immunodeficiency virus (HIV) infection | 043.3 | HIV CAUS OTH SPECIF CON * | |
| 114.08 | Human immunodeficiency virus (HIV) infection | 043.9 | ARC UNSPECIFIED * | |
| 114.08 | Human immunodeficiency virus (HIV) infection | 044.0 | HIV CAUS ACUTE INFECTIO * | |
| 114.08 | Human immunodeficiency virus (HIV) infection | 044.9 | HIV UNSPECIFIED * | |
| Uncertain | - | Uncertain | 237.70 | NEUROFIBROMATOSIS NOS |
| - | Uncertain | 237.70 | NEUROFIBROMATOSIS TYPE I | |
| - | Uncertain | 237.72 | NEUROFIBROMATOSIS TYP II | |
| - | Uncertain | 299. | PSYCHOSES OF CHILDHOOD* | |
| - | Uncertain | 299.00 | INFANTILE AUTISM-ACTIVE | |
| - | Uncertain | 299.01 | INFANTILE AUTISM-RESID | |
| - | Uncertain | 302. | SEXUAL DISORDERS* | |
| - | Uncertain | 302.0 | EGO-DYSTONIC HOMOSEXLTY | |
| - | Uncertain | 302.1 | ZOOPHILIA | |
| - | Uncertain | 302.2 | PEDOPHILIA | |
| - | Uncertain | 302.3 | TRANSVESTISM | |
| - | Uncertain | 302.4 | EXHIBITIONISM | |
| - | Uncertain | 302.50 | TRANS-SEXUALISM NOS | |
| - | Uncertain | 302.6 | PSYCHOSEX IDENTITY DIS | |
| - | Uncertain | 302.7 | PSYCHOSEXUAL DYSFUNCTION | |
| - | Uncertain | 302.70 | PSYCHOSEXUAL DYSFUNC NOS | |
| - | Uncertain | 302.71 | INHIBITED SEXUAL DESIRE | |
| - | Uncertain | 302.72 | INHIBITED SEX EXCITEMENT | |
| - | Uncertain | 302.75 | PREMATURE EJACULATION | |
| - | Uncertain | 302.79 | PSYCHOSEXUAL DYSFUNC NEC | |
| - | Uncertain | 302.8 | PSYCHOSEXUAL DIS NEC* | |
| - | Uncertain | 302.81 | FETISHISM | |
| - | Uncertain | 302.82 | VOYEURISM | |
| - | Uncertain | 302.84 | SEXUAL SADISM | |
| - | Uncertain | 302.85 | GEND IDEN DIS ADOL/ ADULT | |
| - | Uncertain | 302.89 | PSYCHOSEXUAL DIS NEC | |
| - | Uncertain | 302.9 | PSYCHOSEXUAL DIS NOS | |
| - | Uncertain | 588.0 | RENAL OSTEODYSTROPHY | |
| - | Uncertain | 740.1 | CRANIORACHISCHISIS | |
| - | Uncertain | 740.2 | INIENCEPHALY | |
| - | Uncertain | 777.1 | MECONIUM OBSTRUCTION | |
| * ICD-9-CM code was not included in the Medstat group selection criteria. | ||||