
Mental Health Treatment Need and Treatment System Capacity
ASPE ISSUE BRIEF
Ellen Bouchery
Mathematica
March 2021
Link to Printer Friendly Version in PDF Format (8 PDF pages)
ABSTRACT: This brief presents an overview of trends in mental health treatment need and system capacity to provide treatment between 2014 and 2018 using existing data sources. Data analyzed includes data from the National Mental Health Services Survey, the National Survey on Drug Use and Health and quality measurement data submitted to the Centers for Medicaid and Medicare Services. Overall, results indicate increasing numbers of individuals with unmet need for mental health treatment, very high utilization rates for inpatient and residential mental health treatment, and low rates of follow-up for individuals after hospitalization for mental illness. Taken together, these data suggest that the mental health treatment system may not have sufficient capacity to treat current rates of treatment need.
This brief was prepared under contract #HHSP233201600021I between the U.S. Department of Health and Human Services, Office of the Assistant Secretary for Planning and Evaluation, Office of Behavioral Health, Disability, and Aging Policy (BHDAP) and Mathematica. For additional information about this subject, you can visit the BHDAP home page at https://aspe.hhs.gov/bhdap or contact the ASPE Project Officers at HHS/ASPE/BHDAP, Room 424E, H.H. Humphrey Building, 200 Independence Avenue, S.W., Washington, D.C. 20201; Judith.Dey@hhs.gov, Laura.Jacobus-Kantor@hhs.gov, Helen.Lamont@hhs.gov.
DISCLAIMER: The opinions and views expressed in this brief are those of the authors. They do not reflect the views of the Department of Health and Human Services, the contractor or any other funding organization. This brief was completed and submitted on March 2020.
| Analysis of recent national data suggests that the mental health treatment system does not have the capacity to address current rates of treatment need. There are rising numbers of young adults with perceived unmet needs for mental health treatment, high utilization rates for inpatient and residential beds designated for mental health treatment, and low rates of 30-day follow-up after hospitalization for mental illness. This brief discusses these trends in more detail. |
Trends in Treatment Need and Use
The number of persons with any mental illness and the number with a serious mental illness increased significantly from 2014 to 2018 (9% and 16%, respectively) (Figure 1). These increases were concentrated among adults ages 18-49, as there has been no change in the number of persons with any mental illness or serious mental illness among adults ages 50 or older. The causes of these increases are not well understood.
The use of mental health treatment has also increased during this period, but it has not kept up with the increase in need. Although the number of persons with any mental illness increased 9%, the number of persons who used mental health treatment services increased only 6%. Similarly, although the number of persons with serious mental illness increased 16%, the number of persons who used services increased only 8%. As a result, from 2014 to 2018, the number of persons who reported a perceived unmet need for mental health services increased substantially for persons ages 18-25 and 26-49 (Figure 2).
Indicators of the Treatment System's Adequacy
In addition to the recent increases in the perceived unmet need for treatment, other recent metrics suggest that the capacity to provide mental health treatment is not sufficient or that there are gaps in the quality of mental health treatment.
From 2014 to 2018, the utilization rate[1] for both residential and inpatient beds designated for mental health treatment increased (Figure 3). In 2018, these rates were 94% and 118%, respectively. A summary of the literature from the United States and the United Kingdom suggests utilization rates at this high level can have important implications for the quality of care. For example, average utilization rates[2] for psychiatric hospitals greater than 80% may create a more stressful work environment, and utilization rates above 85% are associated with a deterioration in the quality of care (Jones 2013). Higher average utilization rates also increase the likelihood that a hospital may have no availability when a patient has an acute need for care (Jones 2013).
Quality metrics for mental health care are another source of information for assessing the adequacy of the mental health treatment system. Here, we give one example: the rate of follow-up after hospitalization for mental illness, a measure from the Healthcare Effectiveness Data and Information Set. In 2018, 42 states reported this measure to the Centers for Medicaid & Medicare Services (CMS) for their Medicaid and/or CHIP population as part of the Adult Core Set. It is important to follow up after a mental health hospitalization to ensure that the patient's mental health status remains stable or improves after discharge and that any adverse effects of changes in medication are addressed (Kurdyak et al. 2018; Lee et al. 2015). Follow-up care can also prevent relapse and readmissions (Fontanella et al. 2011; Ilgen et al. 2008; Marcus et al. 2017). Despite the importance of follow-up care, the follow-up rates vary substantially across the reporting states (Figure 4). The median across the reporting states was 58.6%. In all but one reporting state, more than one in five hospitalized patients did not receive follow-up treatment within 30 days of hospital discharge. In the majority of states, 30%-50% of hospitalized patients did not receive follow-up treatment, and in ten states, less than 50% received such treatment. Low rates of follow-up care may be attributable to a shortage of outpatient providers, a lack of motivation to obtain care, and barriers to obtaining follow-up care for low income individuals such as lack of transportation or childcare (Becker et al. 2018; Ilgen et al. 2008). Although there are many challenges to ensuring that beneficiaries receive follow-up care, the higher rates of follow-up in some states suggest that improving follow-up rates in other states is feasible.
Discussion
Overall, this review of recent data found several indictors suggesting that the mental health treatment system does not have the capacity to address current rates of treatment need. Treatment system enhancements are needed to expand access for those with treatment needs who do not receive any treatment and to improve the continuity and quality of care among those currently receiving treatment. Expanding capacity will likely need to include increasing the number of mental health professionals in the workforce but will also likely require innovative approaches to extend the behavioral health workforce capacity, such as telehealth services and mobile applications.
| FIGURE 1. Percent Changes in Adults Who Need and Use Mental Health Treatment, 2014-2018 |
|---|
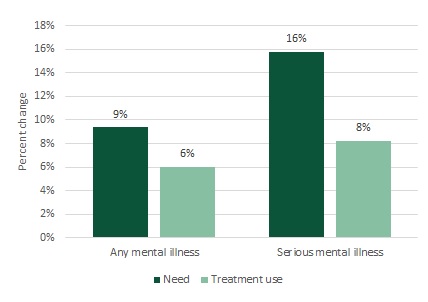 |
| SOURCE: Mathematica's analysis of 2018 NSDUH Detailed Tables (SAMHSA 2019a). * The difference between the 2014 and 2018 count is statistically significant at the 0.05 level. |
| FIGURE 2. Adults Reporting an Unmet Need for MH Treatment Services, by Age Group, 2014 and 2018 |
|---|
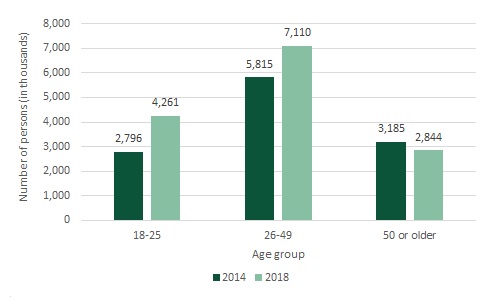 |
| SOURCE: Mathematica's analysis of 2018 NSDUH Detailed Tables (SAMHSA 2019b). * The difference between the 2014 and 2018 count is statistically significant at the 0.05 level. |
| FIGURE 3. Utilization Rate for Inpatient and Residential MH Treatment Beds, 2014 and 2018 |
|---|
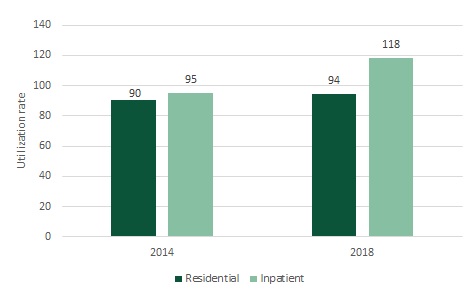 |
| SOURCE: N-MHSS: 2014 (SAMHSA 2016) and N-MHSS: 2018 (SAMHSA 2019c). |
| FIGURE 4. Number of States by 30-day Follow-up Rate after Hospitalization for Mental Illness for Adult Medicaid and/or CHIP Beneficiaries, 2018 |
|---|
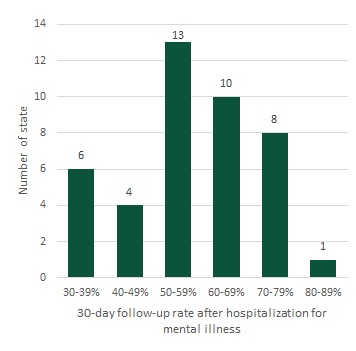 |
| SOURCE: Mathematica analysis of CMS, Performance on the Adult Core Set Measures as reported by 42 states. Available at https://www.medicaid.gov/medicaid/quality-of-care/downloads/performance-measurement/performance-on-the-adult-core-set-measures-ffy-2018.zip. |
References
Becker, Edmund R., Matlin Gilman, Marie McPherson, Beom Lee, and Sabrina Singh. "The Performance of Florida Medicaid Health Plans on Follow-Up After Hospitalization for Mental Illness in 2014." Juniper Online Journal of Public Health, vol. 3, issue 1, February 2018. Available at https://juniperpublishers.com/jojph/pdf/JOJPH.MS.ID.555603.pdf. Accessed February 15, 2020.
Fontanella, Cynthia A., Jeffrey A. Bridge, Steven C. Marcus, and John V. Campo. "Factors Associated with Antidepressant Adherence for Medicaid-Enrolled Children and Adolescents." Annals of Pharmacotherapy, vol. 45, no. 7-8, 2011, pp. 898-909.
Ilgen, M.A., K.U. Hu, R.H. Moos, and J. McKellar. "Continuing Care After Inpatient Psychiatric Treatment for Patients with Psychiatric and Substance Use Disorders." Psychiatric Services, vol. 59, no. 9, September 2008, pp. 982-988.
Jones, R.B. "Optimum Bed Occupancy in Psychiatric Hospitals." Psychiatry On-line, July 2013. Available at http://www.priory.com/psychiatry/psychiatric_beds.htm. Accessed March 16, 2019.
Kurdyak, Paul, Simone Natalie Vigod, Alice Newman, Vasily Giannakeas, Benoit H. Mulsant, and Therese Stukel. "Impact of Physician Follow-Up Care on Psychiatric Readmission Rates in a Population-Based Sample of Patients with Schizophrenia." Psychiatric Services, vol. 69, no. 1, January 2018, pp. 61-68.
Lee, Seung Yup Lee, Kyoung Hoon Kim, Tae Kim, Sun Min Kim, Jong-Woo Kim, Changsu Han, Ji Young Song, and Jong-Woo Paik. "Outpatient Follow-Up Visit After Hospital Discharge Lowers Risk of Rehospitalization in Patients with Schizophrenia: A Nationwide Population-Based Study." Psychiatry Investigation, vol. 12, no. 4, 2015, pp. 425-433. doi: 10.4306/pi.2015.12.4.425. Accessed February 27, 2020.
Marcus, Steven C., Chien-Chia Chuang, Daisy S. Ng-Mak, and Mark Olfson. "Outpatient Follow-Up Care and Risk of Hospital Readmission in Schizophrenia and Bipolar Disorder." Psychiatric Services, vol. 68, no. 12, December 2017, pp. 1239-1246.
Substance Abuse and Mental Health Services Administration (SAMHSA). "National Mental Health Services Survey (N-MHSS): 2014. Data on Mental Health Treatment Facilities." Table 2.10. BHSIS Series S-87, HHS Publication No. (SMA) 16-5000. Rockville, MD: SAMHSA, Center for Behavioral Health Statistics and Quality 2016.
Substance Abuse and Mental Health Services Administration (SAMHSA). "Results from the 2018 National Survey on Drug Use and Health: Detailed Tables Prevalence Estimates, Standard Errors, P Values, and Sample Sizes." Table 10.1A, Table 10.3A, Table 10.17A, and Table 10.18A. Rockville, MD: SAMHSA, Center for Behavioral Health Statistics and Quality 2019a. Available at https://www.samhsa.gov/data/sites/default/files/cbhsq-reports/NSDUHDetailedTabs2018R2/NSDUHDetTabsSect10pe2018.htm. Accessed February 16, 2020.
Substance Abuse and Mental Health Services Administration (SAMHSA). Results from the 2018 National Survey on Drug Use and Health: Detailed Tables Prevalence Estimates, Standard Errors, P Values, and Sample Sizes." Table 10.22A. Rockville, MD: SAMHSA, Center for Behavioral Health Statistics and Quality 2019b. Available at https://www.samhsa.gov/data/sites/default/files/cbhsq-reports/NSDUHDetailedTabs2018R2/NSDUHDetTabsSect10pe2018.htm. Accessed February 16, 2020.
Substance Abuse and Mental Health Services Administration (SAMHSA). "National Mental Health Services Survey (N-MHSS): 2018. Data on Mental Health Treatment Facilities." Table 2.10. Rockville, MD: SAMHSA, Center for Behavioral Health Statistics and Quality 2019c.
Endnotes
-
The utilization rates presented in Figure 3 are calculated based on information reported by facilities responding to the National Mental Health Services Survey. The utilization rates for residential and inpatient hospital care are calculated as follows: (a) The numerator is the sum across reporting facilities of the number of patients receiving the respective type of care on the last working day in March; (b) The denominator is the sum across the same reporting facilities of the number of hospital inpatient beds specifically designated for providing mental health treatment; and (c) The utilization rate is the numerator divided by the denominator.
-
The utilization rate in studies that Jones (2013) cites examined the number of patients divided by the number of fully-staffed beds (which he calls the occupancy rate) either on a single day or averaged over time, and in either a single hospital or averaged across multiple hospitals.
Analyses of Disability, Aging and Long-Term Care Policy and Data
These reports summarize results from BHDAP work examining recent trends in mental health (MH) and substance use disorder (SUD) treatment needs, unmet needs, and system capacity to provide treatment. The reports synthesize data from a variety of existing sources including the National Mental Health Services Survey (N-MHSS), the National Survey of Substance Abuse Treatment Services (N-SSATS), the Treatment Episode Data Set (TEDS), and quality measurement data submitted to the Centers for Medicaid & Medicare Services. Overall, results indicate increasing numbers of individuals with unmet need for MH treatment, very high utilization rates for inpatient and residential MH treatment, and low rates of follow-up for individuals after hospitalization for mental illness. Taken together, these findings suggest that the MH treatment system may not have sufficient capacity to treat current rates of treatment need. The reports also highlight recent increases in the delivery of SUD treatment provided in private doctor’s offices and specialty outpatient settings, and the delivery of medication assisted treatment. Analyses also suggest that SUD prevalence rates have declined among adolescents and young adults, while rates have remained constant, or increased, among adults aged 26 or older. However, rates of unmet need for SUD treatment also remain very high.
Reports were prepared under contract #HHSP233201600021I between the U.S. Department of Health and Human Services, Office of the Assistant Secretary for Planning and Evaluation, Office of Behavioral Health, Disability, and Aging Policy (BHDAP) and Mathematica. For additional information about this subject, you can visit the BHDAP home page at https://aspe.hhs.gov/bhdap or contact the ASPE Project Officers at HHS/ASPE/BHDAP, Room 424E, H.H. Humphrey Building, 200 Independence Avenue, S.W., Washington, D.C. 20201; Judith.Dey@hhs.gov, Laura.Jacobus-Kantor@hhs.gov, Helen.Lamont@hhs.gov.
Reports Available
Has Treatment for Substance Use Disorders Increased? Issue Brief
Chartbook on Behavioral Health Treatment Demand and Provider Capacity in the United States
Mental Health Treatment Need and Treatment System Capacity Issue Brief
Age Group Differences in Progress toward Reducing Substance Use Disorders, 2015-2018 Issue Brief