
U.S. Department of Health and Human Services
Working Papers on Long-Term Care
Office of Social Services Policy, Office of the Assistant Secretary for Planning and Evaluation, U.S. Department of Health and Human Services
October 1981
This paper was prepared by the Office of Social Services Policy (now the Office of Disability, Aging and Long-Term Care Policy) within the U.S. Department of Health and Human Services for the 1980 Under Secretary's Task Force on Long-Term Care. For additional information, you may visit the DALTCP home page at http://aspe.hhs.gov/daltcp/home.shtml or contact the office at HHS/ASPE/DALTCP, Room 424E, H.H Humphrey Building, 200 Independence Avenue, SW, Washington, DC 20201. The e-mail address is: webmaster.DALTCP@hhs.gov.
PREFACE
Long-term care is a complex policy area which involves many of the programs of the Department of Health and Human Services. The projected increase in the number of elderly above the age of 75; the longer life expectancy of the disabled; and the inflation of nursing home, home health care, and personal care costs make it increasingly difficult to maintain the security of those in need of long-term care services. Federal, state, and local programs must be organized to use resources as efficiently as possible to assure the quality of care and quality of life of the long-term care population - both in the institution and in the community. Creative solutions to providing and financing long-term care must be developed, which acknowledge the desire of people to be independent and productive for as long as possible.
These Working Papers describe the current state of knowledge about long-term care in the United States, and serve as a knowledge base for the difficult analytic tasks that lie ahead. They are based on the work of the Department Task Force on Long-Term Care up to January, 1981 and contain data that have not been available before.
The Working Papers were prepared by staff of the Division of Long-Term Care Policy, Office of the Assistant Secretary for Planning and Evaluation, under the direction of Maureen Baltay. Barbara Manard served as the principal author and editor of these papers. Substantial contributions were made by John Grana. Numerous staff of the Department were responsible for much of the data, analysis, and documents on which these papers were based. They are listed in the appendix to Working Paper #1. Brenda Thorne typed the several drafts and was assisted by Jewell Griffin. Graphics were executed by Ray Shapiro and Vijaya Sonti.
TABLE OF CONTENTS
- WORKING PAPER #1: OVERVIEW AND SUMMARY
- The Population
- Services and Settings
- Programs and Financing for Long-Term Care
- Dynamics of the Current System
- Appendix 1-A: The Under Secretary's Task Force on Long-Term Care, Members and Participants
- WORKING PAPER #2: THE LONG-TERM CARE POPULATION
- Introduction
- Chronic Conditions, Functional Disability, and Service Requirements
- Estimates of the Size of the Long-Term Care Population
- Estimating the Size of Subgroups in the Long-Term Care Population
- The Age and Income of the Long-Term Care Population
- The Future Size of the Long-Term Care Population
- Appendix 2-A: Distribution of Non-Institutionalized Population
- WORKING PAPER #3: SERVICES AND SETTINGS
- Introduction
- Types of Services
- Settings: Selected Issues
- Cross-Cutting Issues
- Appendix 3-A: Number and Percent of Non-Institutional Chronically Ill and Functionally Dependent by Who Provides Help, Living Arrangement, Income and Marital Status
- Appendix 3-B: An Overview of Federal Housing Programs Benefitting the Elderly and Handicapped
- WORKING PAPER #4: PROGRAMS AND FINANCING FOR LONG-TERM CARE SERVICES
- Introduction
- Public and Private Roles in Long-Term Care Financing
- Coverage and Coordination of Long-Term Care Programs
- Eligibility
- Appendix 4-A: Selected Highlights of Legislative Activity Related to Long-Term Care
- Appendix 4-B: Selected Federal Programs Serving the Long-Term Care Population
- WORKING PAPER #5: DYNAMICS OF THE CURRENT SYSTEM
- Introduction
- The Supply of Long-Term Care Services and Settings
- The Cost of Different Long-Term Care Services and Settings
- Conclusion
- Appendix 5-A: Long-Term Care, Health Planning, and Certificate of Need
- LIST OF TABLES
- Working Paper #2
- TABLE I: Number (Percent) of People at Different "Levels" of Disability Due to Chronic Coniditions
- TABLE II: Estimates of the Prevalence of Physical Handicapping Conditions Resulting in Limitation of Major Activity
- TABLE A2-I: Distribution of Non-Institutionalized Population by Level II Disability, Age and Income
- TABLE A2-II: Distribution of Non-Institutionalized Population by Age, Income, and Need for Help With Personal Care
- TABLE A2-III: Distribution of Non-Institutionalized Population by Age, Need for Help with Personal Care, and Living Arrangement
- Working Paper #3
- TABLE I: Number and Percent of Non-Institutionalized Chronically Ill and Functionally Dependent According to Levels of Dependence for Activities of Daily Living by Sex, United States, 1977
- TABLE II: Number and Percent of Non-Institutionalized Chronically Ill and Functionally Dependent According to Levels of Dependence for Activities of Daily Living by Age, United States, 1977
- TABLE III: Comparisons of the Dependency Levels of Nursing Home and Non-Institutionalized Population by Age
- TABLE A3-I: Number and Percent of Non-Institutional Chronically Ill and Functionally Dependent Persons Who Receive ADL Assistance by Who Provide Help, United States, 1977
- TABLE A3-II: Number and Percent of Non-Institutional Chronically Ill and Functionally Dependent According to levels of Dependence for Activities of Daily Living by Living Arrangement, United States, 1977
- TABLE A3-III: Number and Percent of Non-Institutional Chronically Ill and Functionally Dependent According to Levels of Dependence for Activities of Daily Living by Income, United States, 1977
- TABLE A3-IV: Number and Percent of Non-Institutional Chronically Ill and Functionally Dependent According to Levels of Dependence for Activities of Daily Living by Marital Status, United States, 1977
- Working Paper #4
- TABLE I: Service Expenditures for Selected Federal Programs, FY 1978
- TABLE II: Expenditures for Nursing Home Care, 1972 - 1979
- TABLE III: Federal Programs Which Fund Long-Term Care Services
- TABLE IV: Eligibility Standards for Specific Target Groups for Titles III, XVIII, XIX, XX, and SSI, CMHC Programs
- TABLE V: Title XIX and Title XX Comparison of Income Eligibility Levels (as of January, 1979)
- Working Paper #5
- TABLE I: Proportion of the Elderly in Institutions and Group Quarters by Age Cohort: 1950 - 1970
- TABLE II: Distribution of the Known Institutionalized Population, Aged 65+ (One Day Census) by Type of Institution: 1890 - 1970
- TABLE III: Growth Rate of the Elderly Nursing Home Population by Type of Facility, 1960 - 1970
- TABLE IV: Distribution of Nursing Home Beds by Type of Care
- TABLE A5-I: Categories of States According to Level of Nursing Home Beds
- TABLE A5-II: Summary of Goals and CON Actions Taken by High-Bed and Low-Bed States
- LIST OF FIGURES
- Working Paper #2
- FIGURE I: The Interrelation of Chronic Disabilities Based on the National Health Interview Survey
- FIGURE II: Distribution of Beds in Long-Perm Care Facilities, United States, 1976
- FIGURE III: Projected Number of Persons with Limitation of Activity due to Chronic Conditions, and Percent Distributions by Age, in 1978 and 2003, United States
- FIGURE IV: Projected Number of Residents in Nursing Homes, and Percent Distribution, by Age, in 1978 and 2003, United States
- Working Paper #5
- FIGURE I: Proportion of Those Aged 65+ in Institutions and Group Quarters
- FIGURE II: Growth of Elderly Population
- FIGURE III: Population Growth Rates by Age Cohort
WORKING PAPER #1: OVERVIEW AND SUMMARY
Long-term care refers to the services required by people who have functional limitations as a result of or in conjunction with chronic illness or conditions. Appropriate long-term care services are fundamentally cross-cutting, involving both medical care and social support, with the line between them often blurred. Now, as in the distant past, families and friends provide most of the care received by the chronically disabled. In addition, there has been a substantial public role since the colonial era, though the nature and scope has changed over time.
Federal involvement in the care of the frail and dependent dates largely from the passage of the Social Security Act in 1935, prompted in part by widespread dissatisfaction with state and muncipal almshouses housing indigent disabled and elderly people. The Social Security Act and subsequent amendments established a complex patchwork of programs variously targeted by age, income, condition and largely organized along functional lines -- income support, social services, and medical care. These patterns of funding and organization are mirrored at every level of public responsibility: federal, state, and local. The Congress, government officials at all levels, consumers, and providers generally agree that the present programs often fail to promote desired objectives:
- the maximum feasible independence of the individual in making decisions and in performing everyday activities;
- the provision of services in the least restrictive environment, preferably at home or in other community settings;
- the provision of appropriate, cost-effective, accessible, and humane care to all individuals who need it; and
- the encouragement and support of the care provided by family and friends.
The Department of Health and Human Services administers most of the major federal programs which serve the chronically disabled. Escalating program costs, anticipated growth in the number of the aged and disabled, and increasing awareness of unsatisfactory aspects of the current system prompted Secretary Patricia Roberts Harris to establish the 1980 Task Force on long-term care. The scope of its responsibilities was considerably broader and the orientation of its activities significantly different from existing Departmental efforts involving long-term care issues.
The 1980 Task Force had three major responsibilities:
- To establish a clear organizational structure and lines of responsibility for long-term care throughout the Department, creating a central focus for policy development and program coordination;
- To identify, analyze, and review priority long-term care issues which required immediate attention; and
- To begin the systemmatic and in-depth analysis which will lead to a comprehensive long-term care policy for the Department.
The Task Force was headed by the Under Secretary and the Assistant Secretary for Planning and Evaluation and composed of senior officials at the level of Deputy Assistant Secretary from principal operating components and staff offices. The Task Force incorporated other related activities underway such as the implementation of the National Long-Term Care Demonstration Program, and established staff working groups to review research, budget, and analytical issues. These working groups were organized around eleven long-term care issues. Much of their work is incorporated in these Working Papers (See Appendix 1-A for a complete list of Task Force members and staff). In addition, the Assistant Secretary for Planning and Evaluation and each principal operating component in the Department established a long-term care organizational unit or function to signal its commitment to this key policy area and to ensure permanent staff capacity for these activities.
Long-Term Care System Analysis
A major problem which has confronted this Department and others in developing policy recommendations in long-term care has been the absence of a consistent and generally accepted definition of the issue. The characteristics of the population to be considered, the services which should be included, the overlap between services and settings, the definition of need, and the assessment of the extent to which it is currently being met have all been dealt with in fundamentally different ways at different times.
The development of a coordinated comprehensive long-term care policy requires a different approach. The Task Force agreed that as an initial step we need a common ground of understanding for the Department as a whole. This has meant standing back from specific program issues and attempting to define and understand basic elements of the current long-term care system and how they interact. The Task Force Working Papers represent one effort toward that goal. They are summarized below.
A. Working Paper #2: The Population
Approximately 30 million people or more than 13% of the total U. S. population have some "activity limitation" as a result of a chronic disease or condition. This long-term care population is varied one: varied in age, source of limitation, degree of disability and dependence on others, and in the capacity to obtain assistance on their own, through either personal or public financial resources or from families and friends.
Approximately 6.0 million people are substantially disabled. They include:
- Approximately 3.6 million individuals reporting a need for help with personal care and/or mobility assistance or basic living services;
- approximately 1.8 million individuals in long-term care institutions; and
- an estimated .6 million disabled individuals living in board and care homes and other individuals not likely to have been interviewed in the National Health Interview Survey.
Older people are particularly vulnerable to chronic illness and accompanying functional disabilities. Eighty-five percent of the nursing home population (approximately 1.1 million people) is 65 years and older. Approximately 4% of the elderly living outside of institutions (approximately 0.9 million people) have levels of functional disability so high that they require direct personal assistance in performing even the most basic activities of daily living.
The elderly -- and hence the potential long-term care population -- are a rapidly growing segment of the population. Furthermore, projected growth rates are greatest among the "old-old" who are the most vulnerable. According to the Series II Census projections, the population aged 65 and over is expected to increase by 26% between 1980 and 1999. The rate of increase among those 85 and over, however, will be twice that: in 1999 there will be 1.4 million more very old people than there are today.
While the elderly are particularly vulnerable, there are numerically more younger people in the long-term care population. Those who are developmentally disabled, mentally retarded, chronically mentally ill may need more services over a life-time than those whose problems begin in old age.
Many people in the long-term care population have low incomes and this seriously compounds their problems. In 1977, 41% of the non-institutionalized functionally disabled had incomes less than $6,000; 46% of the functionally disabled age 65 and older had incomes less than $6,000. In comparison, only 16% of all individuals and 39% of all elderly were similarly poor. People who are too poor to purchase adequate services and whose family and friends are unable to help sufficiently find it difficult to maintain an independent existence in the community. Although most of the disabled live with others, who can help them, some 20% live alone and therefore must make arrangements to secure services -- services which are often accessible only in institutional settings.
B. Working Paper #3: Services and Settings
People in the long-term care population suffer from a wide variety of physical and mental conditions and often have multiple conditions and multiple service requirements. These needs range from social to medical, from basic living services to highly skilled technical ones needed to diagnose, test, treat, and manage chronic or acute illness.
-
Basic Living Services are those services associated with the maintenance of a household and participation in community life. They include home maintenance, meals, chore, transportation, legal counseling, and the like.
-
Personal Care Services are those services which assist functionally limited individuals with, or directly provide for them, care of the person including functions of bathing, eating, dressing, toilet ing, or "activities of daily living".
-
Illness/Disability Services include the full range of diagnostic and therapeutic services directed at objectives related to the management of chronic illness. They are services needed to identify the etiology and pathology of the illness; to stabilize and manage the condition; to decrease its rate of progression; to prevent acute flare-ups and complications; and to maximize functional capacity.
Theoretically, the full range of basic living, pesonal care, and health services for long-term care could be provided in any setting. At present, nearly two million people are in institutions and group settings -- mostly nursing homes.
Analysis of unpublished data indicates that the need for personal care services is a greater factor in institutionalization than has previously been thought.
-
Nursing home residents are considerably more functionally dependendent than the non-institutionalized.
- 95% of the non-institutionalized, but only 10% of nursing home residents need no ADL asistance.
-
The greater the degree of dependency, the more likely is institutionalization.
-
Elderly people who need a great deal of ADL assistance are more likely to be in nursing homes than in the community.
- 4% of the nursing home population is over age 75 and needs help with all ADL activities.
- There are three times as many people of that age and condition in nursing homes as in the community.
Nevertheless, functional needs alone do not determine whether or not an individual is cared for at home or in an institution. For example, among those who require some but not many personal care services (about 30% of the LTC population), for every one person in an institution, there are approximately three with similar needs functioning in the community. The availability of family and friends to help appears to be a critical distinguishing factor.
Thus, nursing homes are currently an important source of personal care services for people without families able or willing to provide these services, without the financial resources to purchase them in the community, or with personal care requirements which might be most efficiently provided in an institutional setting. While this is true, relatively few nursing have residents need nursing services or therapeutic services that can only be provided in an institutional setting. Further, recent research indicates that nursing homes provide very few rehabilitative services and that nursing home patients have remarkably little contact with skilled medical personnel.
Historical analyses and international comparison suggest that an average of 4 to 6% of the elderly population require or will use some type of group living arrangement (including nursing homes). The absence of family and/or the type and frequency of the services needed by some functionally disabled people make a group setting with others with similar needs practical and economical. However, there is nothing to suggest that nursing homes as we know them today are the preferred setting for all people who cannot live in their own homes. As the almshouses, boarding homes, retirement hotels, and rest homes of the past have been supplanted by nursing homes, new forms of group living arrangements -- notably congregate housing -- are emerging. They may prove to be suitable, less technically-oriented alternative settings, especially for potential nursing home residents who do not require much assistance in the activities of daily living or substantial nursing and therapeutic services.
The quality of long-term care institutions continues to be problemmatic. As long-term care services are extended into different community settings, quality assurance will become even more complex. These difficulties stem in part from the complexity of the long-term care mission. Long-term care institutions have been expected to rehabilitate the chronically ill, shelter the homeless, entertain the bored, and provide for the total psychosocial needs of people living and dying among strangers. In the absence of clearly defined goals and well-understood means of achieving them, it is difficult for institutions, largely staffed by semi-skilled workers, to evaluate successes and failures and to "improve." The results of federal efforts to encourage and ensure quality within the long-term care system reflect those inherent difficulties.
After more than fifteen years of direct federal efforts to upgrade nursing homes -- largely through a process of standards, certification, and inspections -- some progress has been made in the provision of clean and safe physical environments. The federal government has little authority over board and care facilities. Anecdotal evidence suggests that even minimum physical standards have not been achieved in that segment of the long-term care system.
Considerable problems remain in the assurance of quality care, regardless of setting. Quality of care objectives are more difficult to achieve than custodial goals because the elements of quality care are so poorly understood and there is no well-defined technology for either producing or evaluating quality care in long-term care settings. Nevertheless, some problems are striking and require redress: high rates of staff turnover in LTC facilities; repeated, if anecdotal, evidence of abuse; inadequate recognition that LTC facilities -- unlike hospitals -- are places where people live for long periods and hence should be designed, run, and financed accordingly -- as places for living.
These problems call for innovative and diverse approaches to quality assurance. Reliance on the regulatory methods emphasized to date appears to have produced only limited success.
C. Working Paper #4: Programs and Financing for Long-Term Care Services
Federal, state, and local governments fund a number of long-term care services. There are at least 80 Federal programs which benefit the disabled (and able) elderly, either directly or indirectly through cash assistance, in-kind transfers, or the direct provision of goods and services; Another source lists 150 programs which assist the handicapped by providing health, education, rehabilitation, income and housing.
The DHHS programs which fund the majority of long-term care services are funded by Medicare, Medicaid, and Title XX of the Social Security Act, and Title III of the Older Americans Act. None of them was designed to meet long-term care needs or targeted on the long-term care population per se.
Additional programs include:
- housing programs administered by the Department of Housing and Urban Development, the Veterans Administration, the Farmers Home Loan Administration, and individual municipalities;
- institutional care programs administered by a number of agencies in DHHS, by VA, and the States; and
- social, cane unity residential and health service programs administered by DHHS, VA, CSA, the States, and local jurisdictions.
In addition, there are supplemental income programs such as Disability Insurance (DI) and Supplemental Security Income (SSI) which provide income to people too disabled to work and to the very low income elderly. Benefit levels range from a monthly average of $322 for the DI program to $357 for families ($238 for individuals) in the SSI program (including optional state supplementation). While these programs are designed to cover basic living expenses, they are not intended to cover the special service requirements of the long-term care population.
Eligibility for these programs is defined by age (Medicare, OAA), income (Medicaid, Title XX, SSI), condition (Medicare, DI, SSI) or a combination (e.g., Medicaid ICF/MR) even though the need for long-term care is more broadly defined. As a result, there are both gaps and overlaps in eligibility under present programs.
Since the range of services which provide assistance to the chronically disabled is broad, it is difficult to isolate how much is actually spent on long-term care from all sources, public and private. Nor is it possible with existing data to substantiate some widely held beliefs, namely, that spending for health services is much greater then spending for social services, and that spending for nursing home care is substantially larger than spending for non-institutional care.
Some evidence can be cited in support of those conclusions. For example, total federal expenditures for nursing home care were over ten times the expenditures for home health in 1978. Further, the entire federal share of Title XX, including the costs of all social programs, was only about half of the federal share of nursing home costs in the same year. Nevertheless, the conclusions commonly drawn from such isolated facts cannot be substantiated for total public and private spending.
One problem is that the indirect use of public dollars provided through the Social Security program for long-term care services in institutional or community settings cannot be calculated. Further, some services financed under health care programs are actually "basic living services." For example, money spent on nursing home care pays for food and housing as well as nursing. Finally, the extent to which the patterns of expenditure are appropriate is difficult to judge without more detailed analyses of population needs and service effectiveness.
Where expenditures can be clearly related to long-term care, it is clear that costs are high and are rapidly increasing.
-
Expenditures for nursing home care totalled $15.8 billion in 1978 or 8 percent of all health care expenditures. Over half (54%) of this spending is derived from public sources. In that same year, 39 percent of all Medicaid benefits were for nursing home expenditures.
-
Medicaid nursing have expenditures rose 22% per year from 1974 to 1978.
-
Medicare have health expenditures rose 44.6% per year from 1975 to 1979.
This inflation in the nursing home sector (along with even more rapid inflation in home health services) has serious implications for the public and private role in financing long-term care. First, more rapid inflation in nursing home services than in the general economy means fewer people can pay for services privately, placing increasing pressure on public budgets. Rapidly increasing costs increase the probability that Medicaid will have to pay the nursing have bill. Also, available data indicate that although nursing home care costs per resident were approximately $8,011 in 1975, average per capita income for those over 65 was only $5,349. While the majority of nursing home patients initially use private funds, a substantial proportion convert to public sources of payment after exhausting personal resources during the first year.
This diminution of private ability to finance LTC services is a matter of serious concern; to the extent that the public nursing have bill absorbs additional resources, it will be more difficult to target funds on alternatives to nursing have care and other possible system changes.
D. Working Paper #5: Dynamics of the Current System
The long-term care system is extraordinarily complex, encompassing issues in the areas of health, housing, transportation, social services, income security and jobs. The long-term care population is extremely diverse in its functional disabilities, illnesses, needs, desires, personal resources and living arrangements. Poor data and rudimentary analytical methods limit our understanding of long-term care to isolated segments of the system and to short time periods.
Current evidence is inadequate to conclude that there is currently a national surplus or shortage of nursing have beds and other long-term care services and settings. With regard to nursing have beds, reports of overuse and misplacement (indications of possible surpluses) are to be contrasted with reports of long queues of people waiting to enter nursing homes (possibly indicating bed shortages). Both conditions, of course, may exist at the same time: Individuals may demand care who do not need it because of the lack of alternatives, or because of incentives to enter an institution owing to distorted price signals obtained from the public reimbursement mechanism. On the other hand, measurement of "appropriateness" of placement is still in the early stages of development, and is highly subjective; there are many determinants of nursing home need and use other than functional disability which are not captured by existing assessment methods.
Reliable data on the nation's nursing home bed supply are available only up to 1976; measurement of recent trends is impossible. The combination of wide variation in the ratio of beds to population across the States and no accepted standard of adequacy suggests the issue of a nursing home bed supply shortage or surplus is a state specific issue. Evaluation of local health plans indicates there are perceived shortages in some states and surpluses in others, perceptions being highly correlated with current availability of beds.
Even less is known about the adequacy of non-institutional services. These services have traditionally been provided by family, friends, community and private sector providers, at relatively little public expense and with little public oversight. Consequently, useful information in this area is rare.
Evidence does appear to indicate that the choices of living arrangements available to the elderly have narrowed in the past 50 years. The proportion of the elderly population in institutions grew only slightly over the first half of this century; recent, more rapid growth has resulted mainly from large recent increases in the relative numbers of "old-old" (over 75 years) and increasing rates of instititutionalization of this group. Nursing homes, formerly homes for the aged, have only recently become the predominant institution providing shelter and long-term care to the chronically ill and functionally dependent. This development has occured at the expense of other types of institutions and "near-institutions," especially once-important "group quarters." As a consequence, the spectrum of non-medical settings available to the elderly has narrowed.
The growing cost of nursing have care has prompted studies of the costs and cost-effectiveness of care delivered in alternative settings. Available studies appear to indicate that for slightly impaired people, alternatives are more economical than nursing homes; for severely impaired people the opposite is true. What is not known is the break-even point, and how to determine for which individuals which particular services and settings are cost-effective.
Some studies indicate that some alternatives tend to became additions to, not substitutes for, existing services, with very costly implications: additional costs tend to outweigh savings from reduced institutionalization. This experience is apparently replicated in Europe, where the ready availability of have based services does little to displace institutionalization. One of the most difficult research questions is the extent to which the availability of formal support services retards institutionalization without destroying the fabric of the informal support network and its willingness to provide care.
It is clear that, presently, we are less equipped than is desirable to capture the simultaneous interactions among all facets of long-term care and the dynamics of the long-term care system as a whole.
APPENDIX 1-A. The Under Secretary's Long-Term Care Task Force: Members and Program Participants
| Nathan J. Stark, ChairmanUnder Secretary | John Palmer, Vice ChairmanAssistant Secretary for Planning and Evaluation |
| Members | |
| Walter BroadnaxOffice of Assistant Secretary for Planning and Evaluation | Larry GageDeputy Assistant Secretary for Legislation (Health) |
| Manuel CarballoDeputy Assistant Secretary for Human Development Services | Elliot KirschbaumDeputy Associate CommissionerOffice for Operational Policy and ProceduresSocial Security Administration |
| Wilbert CheathamDeputy Director, Office of ProgramOffice for Civil Rights | Ernest OsborneDeputy Under Secretary for Intergovernmental Affairs |
| Earl M. Collier, Jr.Deputy AdministratorHealth Care Financing Administration | Susanne StoiberDeputy Assistant Secretary for Health Planning and EvaluationPublic Health Service |
| Alair TownsendDeputy Assistant Secretary for Budget | |
| Program Participants | |
| Robert Benedict Commissioner Administration on Aging | Robert N. Butler Director National Institute on Aging |
| STAFF TO THE TASK FORCE | |
| Maureen Steinbruner Special Assistant to the Assistant Secretary for Planning and Evaluation | Maureen Baltay Director Division of Long-Term Care Policy, Assistant Secretary for Planning and Evaluation |
| Final Report | |
| Barbara Manard - Principal Staff ASPE | John Grana ASPE |
| Kaia Gallagher ASPE | George Greenberg ASPE |
| Anne Weiss ASPE | Frances Kaplan ASPE |
| Technical Staff | |
| Jewell Griffin ASPE | Margie Anderson ASPE |
| Brenda Thorne ASPE | |
| WORK GROUP PARTICIPANTS | |
| Nursing Home Bed Supply | |
| Maureen Baltay - Chairperson ASPE | John Grana - Principal Staff ASPE |
| Barbara Manard ASPE | Virginia Hayes ASPE |
| Diane Wolman ASPE | Stephanie Hadley PHS |
| Jerry Lucas HCFA | John BjerkeHRA |
| Congregate Housing | |
| Carolyn Harmon - Chairperson ASPE | Barbara Manard - Principal Staff ASPE |
| Board and Care Homes | |
| Carolyn Harmon - ChairpersonASPE | Ron Conley - Principal Staff ASPE |
| Protection of Income and Assets | |
| Elliot Kirschbaum - Chairperson SSA | Mike Andrew - Principal Staff SSA |
| George Greenberg ASPE | Letty Wunglueck HCFA |
| Glen Dehn SSA | Jim Burr HDS |
| Irene Cox ISP | |
| Medical/Scientific Research | |
| Robert Butler, M.D. - Chairperson NIA | Don C. Gibson, D.V.M., M.P.H. - Principal Staff NIA |
| John M. Grana, Ph.D. ASPE | Barbara Manard, Ph.D. ASPE |
| Barbara Gastel, M.D., M.P.H. NCHCT | George Greenberg, Ph.D. ASPE |
| Gene Cohen, M.D. NIMH | Anne H. Cohn, Ph.D. Special Assistant to the Secretary |
| James Wixel OHA | Danielle Dunning PHS |
| Zaven Khachaturian, Ph.D. NIA | John Skinner, Ph.D. AOA |
| Health Personnel Issues | |
| Jim Stockdill - Chairperson HRA | Lyman Van Nostrand - Principal Staff HRA |
| Barbara Fallon AOA | Faye Udicello HCFA |
| Carol Zuckert PHS | Bill Robinson HRA |
| Quality Assurance | |
| Ed Kelley - Chairperson HCFA | Veronica Oestreicher - Principal Staff HCFA |
| Jim Friedman PHS | Margaret Vanamringe HCFA |
| Korbin Liu HCFA | Barbara Manard ASPE |
| Rita Chow HCFA | Linda Hamm HCFA |
| In-Home Services Benefits Coordination | |
| Jesse McCorry - Chairperson HDS | Deborah Bass Rebenstein - Principal Staff HDS |
| William Coon HCFA | Allan Menefee President's Committee on Mental Retardation |
| Mary Jane Cronin HDS | |
| Long-Term Care Services Related to Basic Living Arrangements | |
| Kathryn Morrison - Chairperson HDS | Gail Witney - Principal Staff HDS |
| Long-Term Care Services Related to Illness and Disability | |
| Tera S. Younger - Chairperson HCFA | Sylvia Steber - Principal StaffHCFA |
| Janice M. Flaherty - Principal Staff HCFA | |
| Long-Term Care Services Related to General Dependency | |
| Ronald H. Carlson - Chairperson HSA | Mark R. Meiners, Ph.D. - Principal Staff NCHSR |
| Harris Cohen, Ph.D. PHS | Elizabeth Cornelius HCFA |
| Barbara Feller NCHS | Kaia Gallagher ASPE |
| Paul Haber, M.D. VA | Connie Hirschman AOA |
| Tom Kickham, Ph.D. HCFA | Joel Levine HSA |
| Francis X. Linch HDS | Barbara Manard, Ph.D. ASPE |
| Ann McCuan NIMH | Edward Richardson, Ph.D. HDS |
WORKING PAPER #2: THE LONG-TERM CARE POPULATION
A. Introduction
The Long-Term Care Task Force adopted a broad rather than narrow definition of the long-term care population, including individuals of all ages, not just the elderly, and all persons disabled by chronic conditions, whether these conditions are physical or mental in origin. Stated briefly, the definition is as follows:
For Task Force purposes, then, the long-term care population encompasses several important subgroups: those elderly disabled by chronic conditions, the physically handicapped, the developmentally disabled, the chronically mentally ill and the mentally retarded. Although the particular combination of services required by members of each of these groups may differ, the general nature of their conditions and resulting overall service requirements appear to be similar enough to warrant efforts to integrate the development of overall program policy to the extent possible. Since the Department of Health and Human Services already had underway two planning efforts focusing particularly on the chronically mentally ill and the mentally retarded, the Task Force has not initiated separate analyses pertaining to these subgroups. Rather, an attempt has been made to include material from those planning efforts in these Working Papers.1
B. Chronic Conditions, Functional Disability, and Service Requirements
Chronic conditions are defined as those in which nonreversible pathological alterations or congenital deficits cause residual disability which requires habilitation or rehabilitation, supervision and care over a long period of time. Acute conditions, by contrast, are those which entail single episodes of fairly short duration.
The National Center for Health Statistics, for the purposes of the Health Interview Survey, uses two criteria to distinguish chronic from acute illness. First, a chronic condition is one which was noticed more than three months before the interview. Further, some conditions are always classified as chronic, including: allergy; diabetes; hemorrhoids; hernia; mental illness; missing fingers, hand, arm, toes, foot, or leg; speech defect; stomach ulcer; tuberculosis; and trouble with varicose veins.
Obviously, the type of long-term care required by schizophrenics differs from that required by diabetics. Further, there is considerable variation among people in the severity, responsiveness to treatment, and so forth of any one condition. Thus, simply knowing the number of people with various types of chronic diseases is not very useful to discussions of long-term care services.
There is widespread agreement that long-term care service "needs" are more closely related to functional disability than to chronic disease or condition, per se. Hence the Task Force adopted a framework for analysis which characterizes the long-term care population according to different levels or types of functional disability. As the data are reviewed in the following sections, two important caveats should be kept in mind:
-
The available national data are based on very imprecise measures of functional disability.
-
No matter how sophisticated the measure of functional disability, it is still difficult to relate the need for particular types or amounts of service to various levels of disability.
People who are more disabled in some sense than others may need fewer services, depending on a variety of factors. Empirically there are only very tenuous links between physical characteristics (a missing leg), physical functioning (ability to walk), and social functioning (ability to get and keep a job); it is difficult to predict any one characteristic, knowing another. Even more obscure is the relationship between any of these and the need for particular services. Further, it is difficult to define "levels" of functional disability because "disability" is less an individual characteristic than a characteristic of individual and environmental interaction: blind men may be less "disabled" in the dark than the sighted. Nevertheless, it is useful to consider estimates of the numbers of people in the long-term care population with different degrees and types of functional disability, broadly defined.
C. Estimates of the Size of the Long-Term Care Population
The Non-Institutional Population: Levels of Functional Disability
Approximately 30 million people, or more than 13% of the total U. S. population, according to the 1977 National Health Interview Survey, have some "activity limitation" as a result of a chronic disease or condition. Table I presents estimates of the size of this population according to various levels of disability.
These levels are defined as follows:
LEVEL I: (Approximately 20 million people) includes all those with some "activity limitation" due to chronic conditions, but who are still able to conduct their "major activity."
LEVEL II: (7.7 million people) refers to people who report that they are unable to conduct their "major activity" because of a chronic condition. The National Health Interview Survey defines inability to conduct major activity according to four broad categories:
- Pre-school children: inability to take part in ordinary play with other children.
- School-age children: inability to go to school.
- Housewives: inability to do any housework.
- Workers and all other persons: inability to work at a job or business.
Thus, "major activity" does not necessarily refer to a person's own perception of his or her usual, desirable, or most important activity. Instead, it refers to pre-determined categories of activity. As a measure of functional impairment it works better for adult men than for adult women. Most of those women who are not employed -- in part because of chronic conditions -- but who are able to do housework are not counted in Level II. Similarly disabled men would normally be included in this level. Problems are also encountered when the concept of major activity limitation is applied to the elderly since most of them are likely to be retired. Consequently, assessing the comparability of levels of disability between the population under and over 65 is difficult when the "major activity" criteria is used.
| TABLE I: Number (Percent) of People at Different "Levels" of Disability Due to Chronic ConditionsNational Health Interview Survey (NCHS), 1977 Non-Institutional Population1 | ||||
| Level | Total All Ages | In Thousands | ||
| 1 - 18 | 18 - 64 | 65+ | ||
| I. Some Activity Limitation due to Chronic Condition (Excludes II, below) | 20,791(100%) | 15,027(72%) | 5,764(28%) | |
| II. Unable to Conduct Major Activity | 7,655(100%) | 110(1%) | 3,706(48%) | 3,840(51%) |
| III. Needs Mobility Assistance, Basic Living Services | 3,364(100%) | N/A | N/A | N/A |
| IV. Needs Help with Personal Care2 | 1,580(100%) | 138(9%) | 524(33%) | 918(58%) |
| TOTAL US POPULATION | 212,153(100%) | 196,463(89%) | 15,690(11%) | |
N/A - Not Available. | ||||
LEVEL III: (3.6 million people) refers to people reporting a need for help getting around the house, neighborhood, or community ("mobility assistance"). Without help from family, friends, or formal community services, many people at Level III would be unable to maintain an independent household. Included in this group are those who may require such basic living services as transportation, help with meal preparation, and chore services.
LEVEL IV: (1.6 million people) refers to those who report needing help with personal care and hygiene, that is, "activities of daily living": eating, dressing, bathing, and using the toilet. This group includes those most "at risk" for institutionalization and is discussed in greater detail in Working Paper #3.
Interrelation Among The Levels Of Disability
Figure I illustrates the relationships among the various levels of disability. In general, each successively higher level of disability is a subset of the previous level. As one might expect, most people who need help with personal care (Level IV) also need help getting around the neighborhood (Level III), and are also unable to conduct their major activity (Level II). There are, however, a number of significant and interesting exceptions to this pattern. For example, a paraplegic may need help with bathing or dressing (Level IV), and may yet report no need for help getting around the house (Level III) because special aids, devices, and architectural features transform the environment, reducing the functional importance of a physical disability. Similarly, many who are dependent on others for help with the most basic elements of daily life are yet quite capable
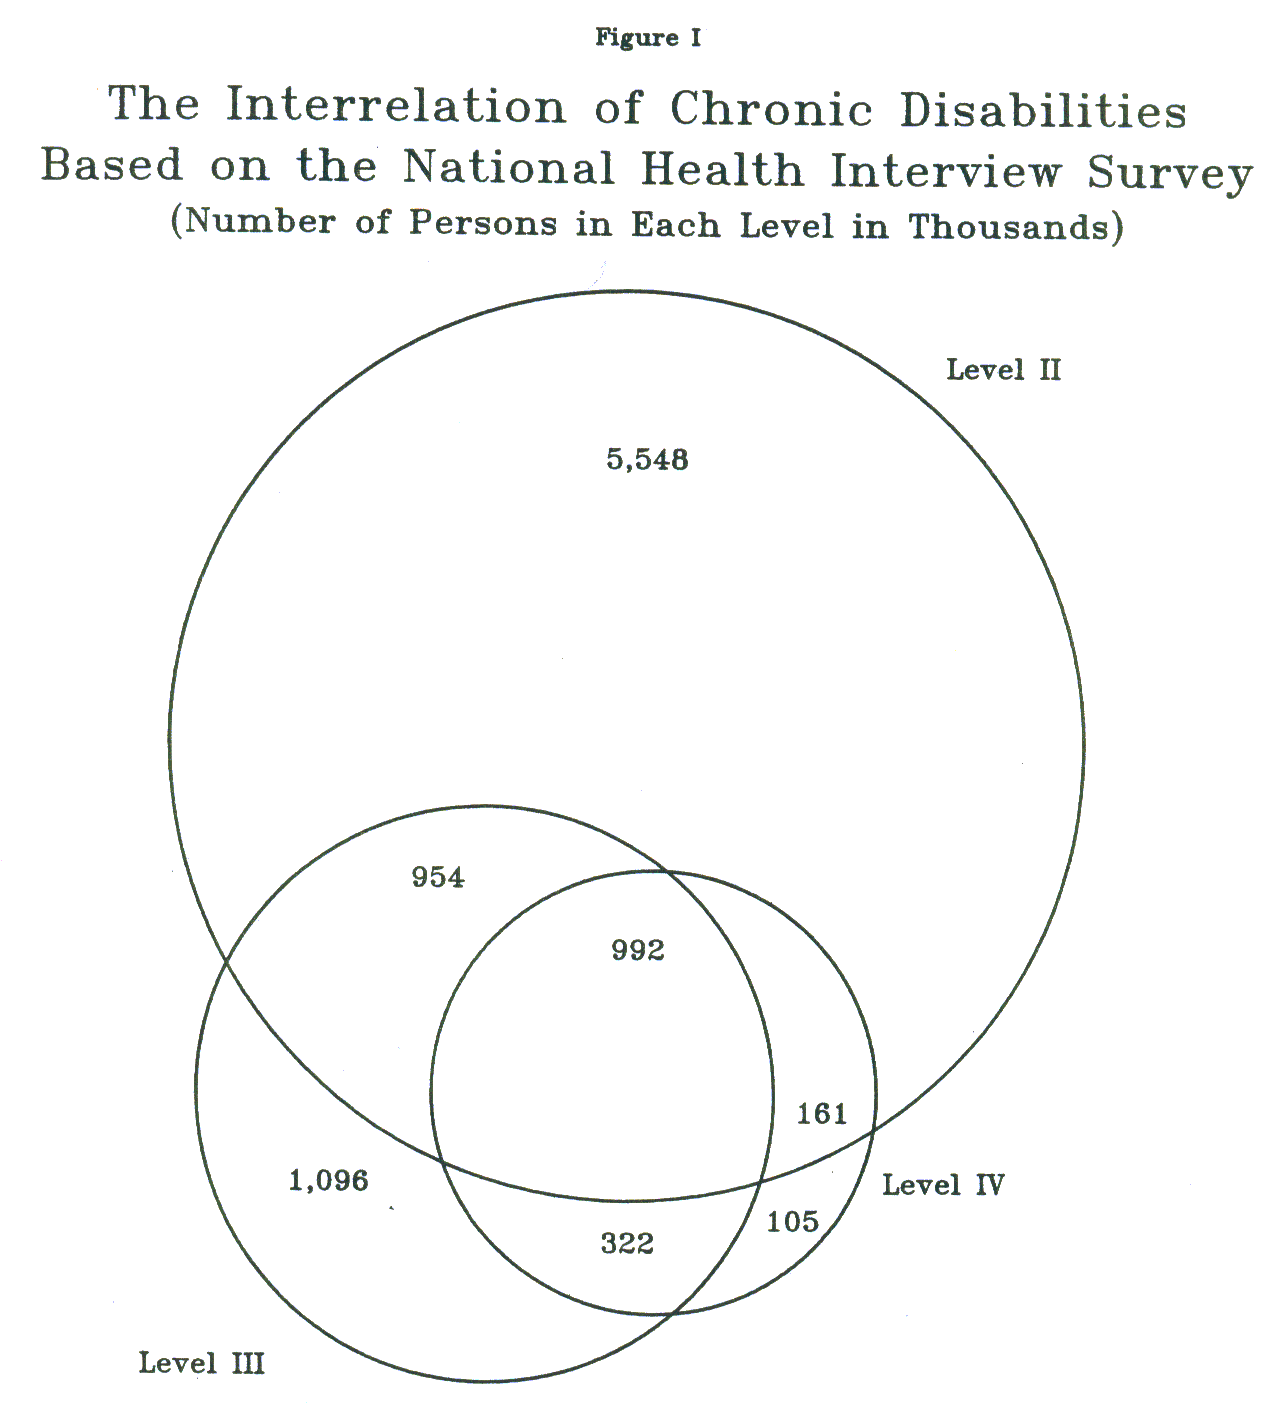
The Institutionalized Population
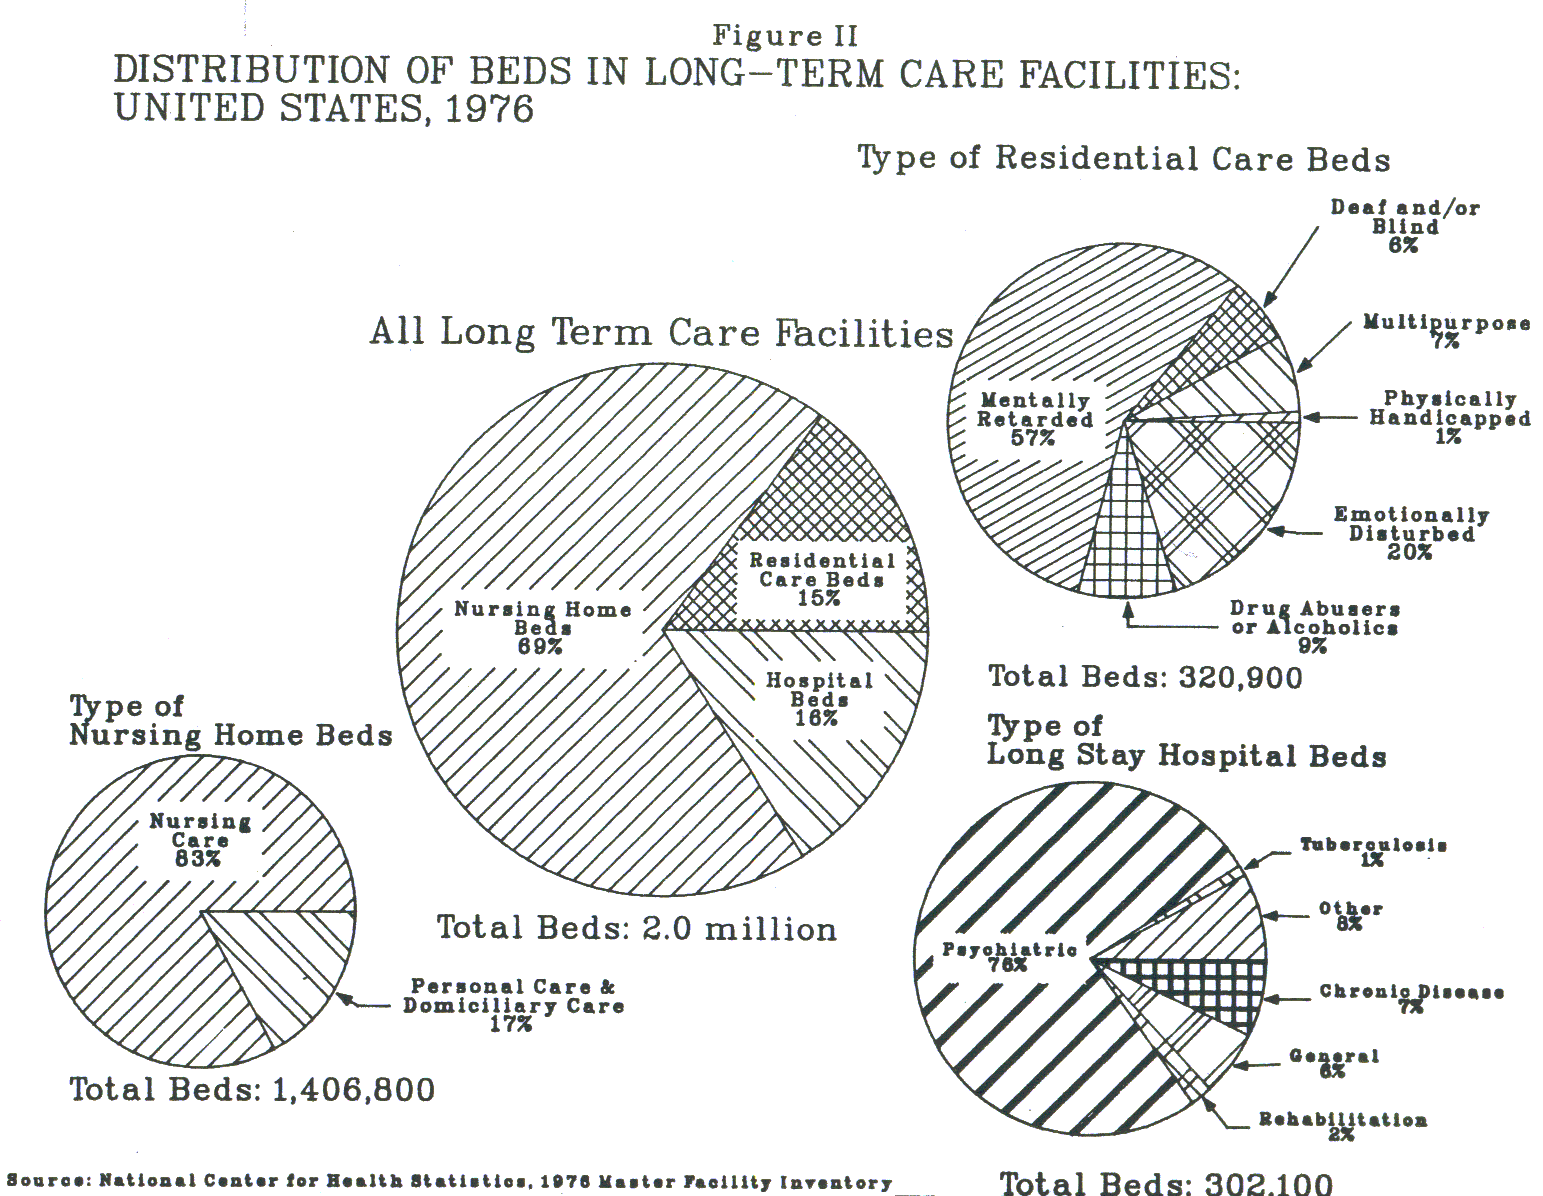
There are approximately 1.5 to 2 million individuals who are institutionalized in long-term care facilities. Figure II shows the distribution of institutional long-term care beds. As can be seen, nursing homes comprise 69% of the beds.
Under-counted Groups
The National Health Interview Survey and other sources of national data based on household samples under-represent the number of disabled people in board and care facilities and other group settings not classified as institutions. The increasing importance of these settings in long-term care has been recognized and plans for future national surveys address the problem of obtaining more accurate data.
The Core Population
Recognizing the serious need for better data, the Task Force nevertheless estimated that approximately 6 million people form the core of the long-term care population. These 6 million represent a potential target group within the larger population of disabled. They include:
- Approximately 3.6 million individuals reporting a need for help with personal care and/or mobility assistance or basic living services (Levels III or IV);
- approximately 1.8 million individuals in long-term care institutions; and
- an estimated .6 million disabled individuals living in board and care homes and other individuals not likely to have been interviewed in the NHIS.
D. Estimating the Size of Subgroups in the Long-Term Care Population
The Chronically Mentally Ill
The National Plan for the Chronically Mentally Ill defines the chronically mentally ill population as encompassing: "those persons who suffer certain mental or emotional disorders that erode or prevent the development of their functional capacities in relation to three or more of such primary aspects of daily life as personal hygiene and self-care, self-direction, interpersonal relationships, social transactions, learning and recreation and that erode or prevent the development of their economic self-sufficiency."2
The National Plan identified 1.7 million people as the CMI target population. Approximately 800,000 are individuals living in the community and unable to work. Thus, about 10% of the Level II non-institutionalized population are disabled by chronic mental conditions.3
An additional 900,000 people in institutions are counted in the CMI target population. This estimate is based on a very broad conception of "chronic mental illness" as it includes all people who have any chronic mental condition, including "senility," and all of those regardless of whether the condition is the primary reason for admission to an institution or a secondary diagnosis. By this estimate, 58% of the nursing home population is included in the CMI target group.
The Mentally Retarded and Developmentally Disabled
Mental retardation is a diagnostic classification which includes all individuals who have significantly below average intellectual functioning as measured by standardized tests. The broader concept of developmental disabilities is a functional classification, including individuals with severe chronic disabilities occurring before age 22, attributable to physical or mental impairments, and causing limitations in three or more major life activities such as self-care, learning, and economic sufficiency.4 Some, but not all people classified as mentally retarded (because they score low on an I.Q. test) are also classified as being developmentally disabled (because they are functionally limited). The National Task Force for the Definition of Developmental Disabilities estimated that there are approximately 2.8 million people with developmental disabilities. Of those, an estimated 1 million were mentally retarded. Current data do not permit classification of these populations by the levels of functional disability (Level II, III, etc.) described above. According to the 1977 National Nursing Home Survey, however, almost 80,000 or 6.1 percent of nursing home residents had a primary diagnosis of mental retardation.
Adult Physically Disabled
There is no one commonly agreed on definition of the adult physically disabled. Traditionally this group has included those who are blind, deaf, paralyzed, and otherwise "visibly" physically handicapped. Table II presents estimates from the National Health Interview Survey of those who are limited in their major activity (Level II) because of such conditions. Blindness is the most prevalent condition, followed by paralysis and impairments of the back and spine.
Increasing attention has been focused in recent years on those with "hidden" handicaps such as epilepsy and alcoholism. Once viewed principally as a moral flaw, alcoholism and other forms of substance abuse have been variously defined and redefined over the years as forms of criminal behavior, evidence of "mental illness" and -- some would argue -- "physical handicaps" with a substantially biological etiological component. However people with such conditions are classified, to the extent to which they experience functional limitations over a long period of time, they are included in the long-term care population. Approximately 1% of the total long-term care beds can be identified as serving "drug abusers or alcoholics" (Figure II). Most observers agree, however, that a substantial proportion of the institutionalized population has problems associated with chronic alcoholism.
E. The Age and Income of the Long-Term Care Population
The age and income distributions of the long-term care population are interesting, in part because these characteristics are criteria for various public benefits.
As can be seen in Table I, there are only slightly more people over age 65 than under among the non-institutionalized at Levels II and IV. Men age 75 is used as the cut-off point, there are more young people than elderly in the long-term care population. The elderly, however, are substantially more likely to be disabled. Proportionally, 17 percent of all elderly persons living in the community are disabled enough to fit within Level II, compared with only 2 percent of all persons under 65 years of age. For Level III, the relative proportions are 9 percent of those over 65 years and .8 percent for those under 65 (Appendix 2-A).
Poverty in some cases is a result of chronic illness and in all cases severely complicates the lives of those afflicted. Old age, poverty, and chronic illness can be, quite literally, a deadly combination. Both the young and the old disabled alike have lower incomes than their peers. The income disparity is far more pronounced for the working age disabled than for the elderly, as would be expected, though the aged are more likely to be both disabled and poor. Two percent of the elderly but less than one percent of all younger people have incomes below $6,000 and need personal care services (See Appendix 2-A).
F. The Future Size of the Long-Term Care Population
The number of people who will need long-term care services in the future depends on an enormous array of factors including economic conditions, demographic changes, and patterns of family organization. Scientific advances are certain to have an impact, though in ways which are unpredictable. On one hand, it may become possible to prevent or cure certain chronic conditions and hence reduce the number needing long-term care, as did the conquest of polio. Barring major breakthroughs, however, continued incremental improvements in the management of chronic conditions and further reductions in general mortality are likely to increase the size of the long-term care population.
| TABLE II: Estimates of the Prevalence of Physical Handicapping Conditions Resulting in Limitation of Major Acivity (Level II)National Health Interview Survey (NCHS), 1978 | ||||
| Limitation | In Thousands | |||
| 1 - 17 | 17 - 65 | 65+ | Total | |
| Blindness and Visual Impairments | * | 172 | 358 | 534 |
| Hearing Impairments | * | 39 | 88 | 134 |
| Speech Defects | * | 0 | 36 | 69 |
| Paralysis | * | 208 | 194 | 413 |
| Absence Major Extremities | * | 57 | 45 | 103 |
| Impairments - Back/Spine | * | 234 | 88 | 324 |
| Impairments - Upper Extremities and Shoulders | * | 56 | * | 85 |
| Impairments - Lower Extremities and Hips | * | 214 | 220 | 440 |
| * Estimate too small to be considered statistically reliable. | ||||
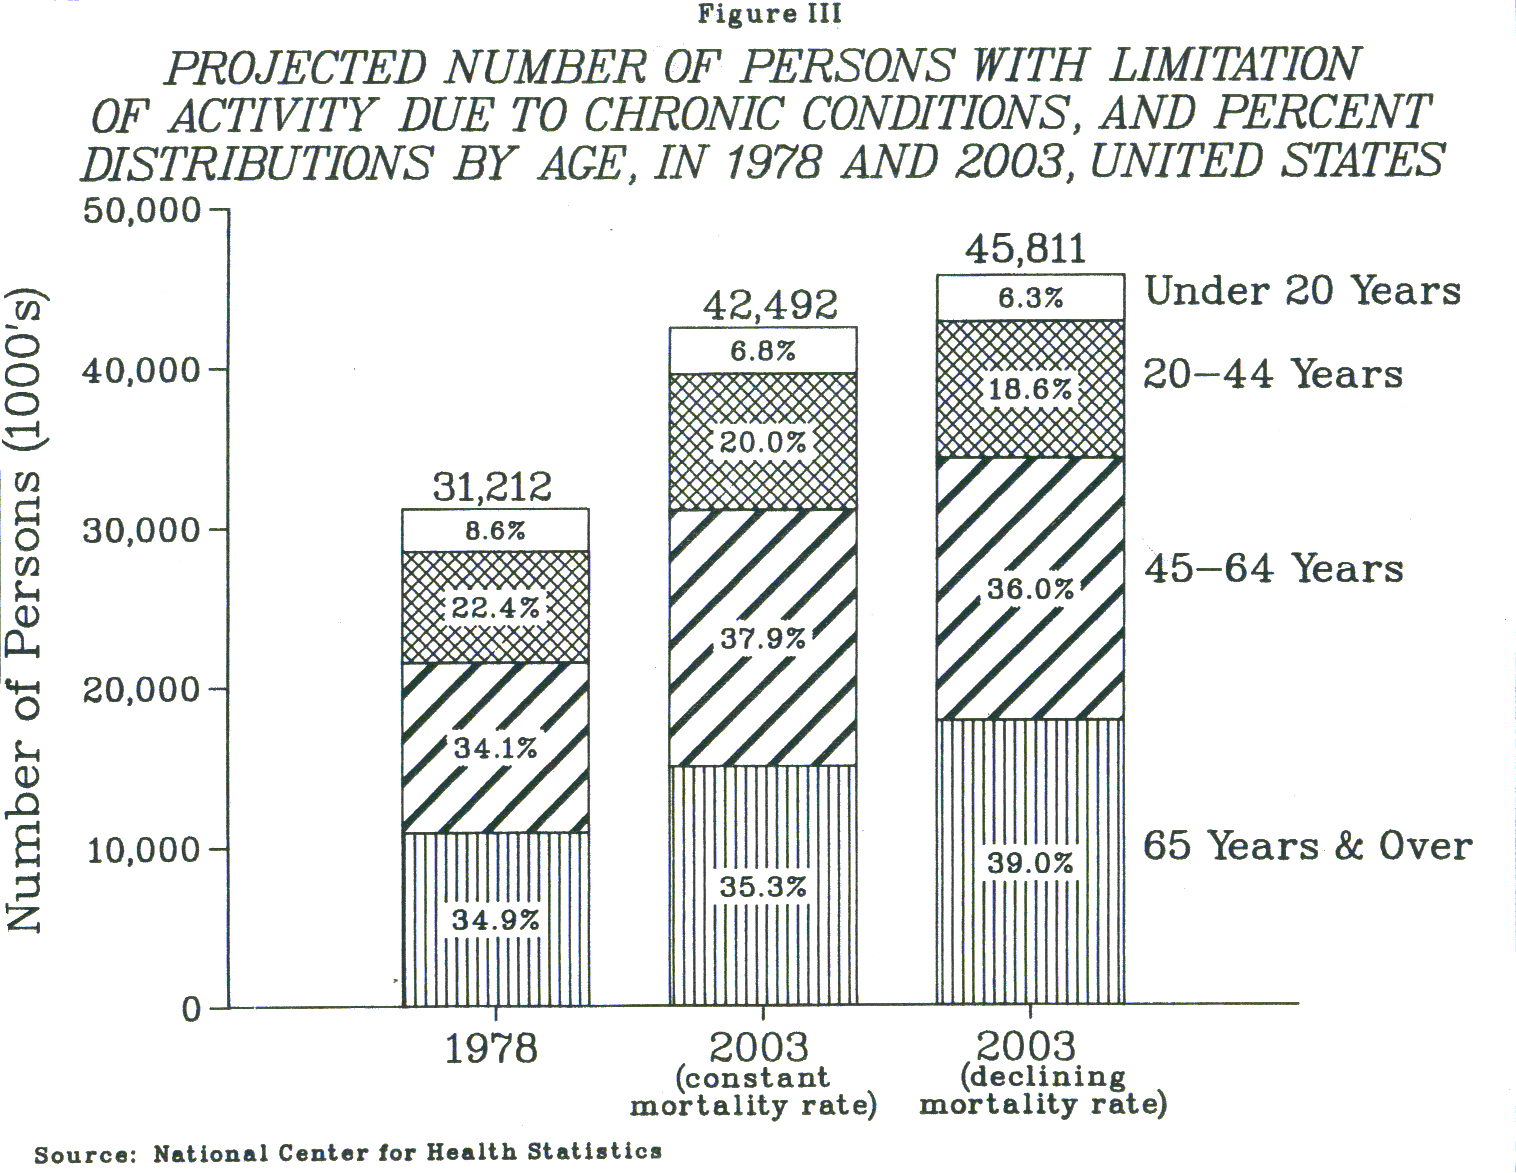
The aging of the U. S. population is both the most predictable element in future projections and the fact with the most dramatic implications for long-term care. Overall, it is expected that the percentage of persons with activity limitation due to chronic conditions will increase by 13 to 23 per cent by 1990 (the growth rates depend on different mortality assumptions). Most of this growth is projected to occur in the older age groups (Figure III).
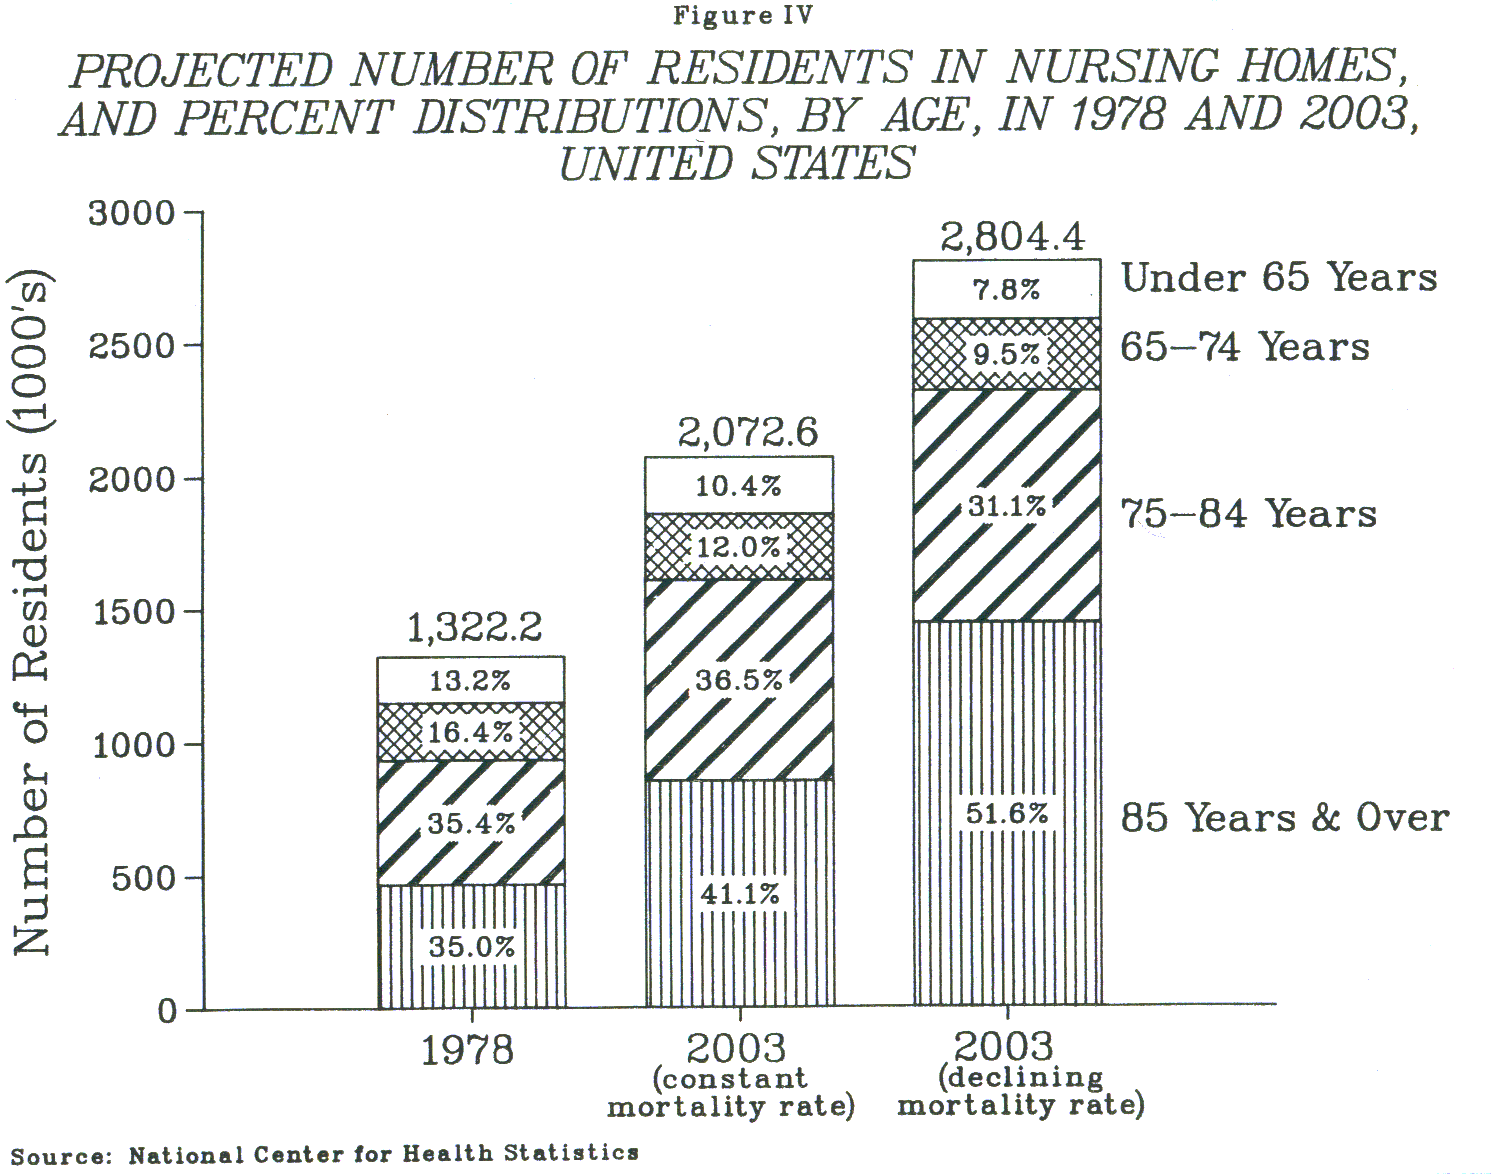
At the same time, depending on the mortality assumptions employed, the nursing home population is projected to increase by 28 to 56 percent over the next ten years if current patterns of use are continued. Increased demand for nursing home care is expected to be particularly great among persons 85 years and older (Figure IV).
Based on these projections, the Task Force has estimated that the target long-term care population could increase between 25 and 50 percent over the next decade, since this target population includes a large number of older and highly dependent members of the more general population. According to these estimates, a long-term care target population of 6 million persons in 1980 could increase to 7.5 or 9 million by 1990.
If the proportions of the long-term care population cared for in various settings remain constant, roughly a third of this projected increase would occur within the institutionalized population, with 2.5 to 3 million persons in these facilities by 1990 (provided there is a commensurate increase in the supply of institutional beds).
Over the same time period, another third of this population growth would occur among those persons currently living in the community who are potential candidates for institutional services due to disability and limited resources. This group would increase by 2.5 to 3 million persons. The remaining population increase would occur among those persons living in the community with resources sufficient enough to make institutionalization unlikely.
These changes are likely to further exacerbate current problems in the organization and financing of long-term care services.
APPENDIX 2-A.
| TABLE A2-I. Distribution of Non-Institutionalized Population by Level II Disability, Age and Income | ||||
| Income Category | Under Age 65 | Age 65 and Over | ||
| Level II Disability1 | Total Population | Level II Disability1 | Total Population | |
| Less than $3,000 | 12% | 4% | 12% | 12% |
| $3,000 - 5,999 | 24% | 9% | 32% | 27% |
| $6,000 - 9,999 | 23% | 14% | 21% | 21% |
| $10,000+ | 30% | 64% | 22% | 25% |
| Unknown | 11% | 9% | 13% | 15% |
| TOTAL(in thousands) | 100%(N=3,816) | 100%(N=189,886) | 100%(N=3,840) | 100%(N=22,266) |
SOURCE: Unpublished data, 1977, National Health Interview Survey | ||||
| TABLE A2-II. Distribution of Non-Institutionalized Population by Age, Income, and Need for Help with Personal Care | ||||
| Annual Income | Under Age 65 | Age 65 and Over | ||
| Need Help With Personal Care1 | Do Not Need Help | Need Help With Personal Care1 | Do Not Need Help | |
| Less than $3,000 | 6% | 4% | 13% | 12% |
| $3,000 - 5,999 | 23% | 9% | 28% | 27% |
| $6,000 - 9,999 | 18% | 14% | 20% | 21% |
| $10,000+ | 43% | 64% | 26% | 25% |
| Unknown | 9% | 9% | 14% | 15% |
| TOTAL(in thousands) | 100%(N=662) | 100%(N=189,276) | 100%(N=918) | 100%(N=21,348) |
SOURCE: Unpublished data from the 1977 National Health Interview Survey | ||||
| TABLE A2-III. Distribution of Non-Institutionalized Population by Age, Need for Help with Personal Care, and Living Arrangements | ||||
| Living Arrangements | Under Age 65 | Age 65 and Over | ||
| Need Help With Personal Care1 | Do Not Need Help | Need Help With Personal Care1 | Do Not Need Help | |
| Living Alone | 5% | 6% | 15% | 28% |
| Living with Non-Relatives | 2% | 2% | 4% | 2% |
| Living with Spouse | 47% | 45% | 44% | 55% |
| Living with Other Relatives | 46% | 47% | 37% | 15% |
| TOTAL(in thousands) | 100%(N=662) | 100%(N=189,276) | 100%(N=918) | 100%(N=21,348) |
SOURCE: Unpublished data from the 1977 National Health Interview Survey | ||||
WORKING PAPER #3: SERVICES AND SETTINGS
A. Introduction
Definitions of long-term care services are often tautological: long-term care services are those services used/needed by the long-term care population. There is widespread agreement, however, that the nature of chronic conditions demands a very broad view of services to include those which are 'social' as well as 'medical', those rendered informally by family and friends as well as formally by public or private agencies. The Task Force considered three generic sets of services:
-
Basic Living Services are those services associated with the maintenance of a household and participation in community life. They include have maintenance, meals, chores, transportation, and the like.
-
Personal Care Services are those services which assist functionally limited individuals with bathing, eating, dressing, using the toilet, ("activities of daily living").
-
Illness/Disability Services include the full range of diagnostic and therapeutic services directed at objectives related to the management of chronic illness. They are services needed to identify the etiology and pathology of the illness; to stabilize and manage the condition; to decrease its rate of progression; to prevent acute flare-ups and complications; and to maximize functional capacity.
The boundaries of these categories are imprecise. For example, "basic living" always includes food, but meals may also be part of a highly complex therapeutic plan. The chief virtue of the typology for Task Force purposes is that it emphasizes the distinctions among services, settings, and programs. The incremental development of the current long-term care "system" has resulted in a complicated pattern where public social services programs (e.g., Title XX) support health care services, health care programs support social services (Medicaid), some sets of services are "pre-packaged" in settings (e.g., nursing homes), while individually tailored service packages are difficult to organize in any setting.
Ultimately we would like to have a comprehensive picture of the availability, use, efficacy, costs, sources of funding and so forth of each service set. Because the framework used for Task Force analysis departs from the way public programs have been structured, reliable national data are not available. The discussion in this paper represents a preliminary exploration.
B. Types of Services
Basic Living Services
At a minimum the long-term care population needs what everyone needs: food, shelter, clothing, transportation, companionship, and assistance in time of crisis. The additional and exceptional demands of chronic disabling conditions complicate the ordinary process of living. We know very little about how most such people manage -- particularly those who never come to the attention of social service agencies -- though such information would be enormously useful. We do know that family and friends provide most of the basic help:
-
According to the National Health Interview Survey, among the chronically disabled who require help getting around the house or neighborhood (level II), 88% report that relatives provide the necessary help. Approximately 25% receive help from someone other than a friend or relative.
-
A GAO study of services for the elderly in Cleveland (1977 preliminary report) showed that 23 percent of the sample were assessed as impaired. Of those impaired, 56 percent were receiving services from family or friends. Provided on this informal basis were transportation (60%), "checking" (stopping by to look in on) (44%), homemaking (20%), administrative and legal (15%), meal preparation (13%), housing services (12%), coordination (8%), groceries and food stamps (7%), continuous supervision (6%), nursing care (3%), and general financial help (2%). When these elderly were asked if someone were available if they were sick or disabled, 87% answered "yes". Of those who did have a person who would be available, 89% named a family member.5
-
In 1977, a national probability sample revealed that the primary caretaker of the bedfast elderly was the spouse: 38% of the housework was done by spouse, 44% of the meal preparation, and 30% of the shopping.6 Children within and outside of the household were the next helping source. Formal social service agencies were infrequently mentioned.
While the importance of family, community networks, and informal services in long-term care cannot be overly stressed, little is known about the relationship between these and formal services or public programs. It has been argued that the development of respite care, adult day care, and similar services may relieve some stress on families of the disabled and enhance their ability and willingness to continue caring for the aged and dependent. On the other hand, some fear that public subsidies for community-based services may encourage the substitution of formal for informal services. Research to date is very limited and inconclusive.
Personal Care Services
A considerable amount of information is available on the need for personal care services among the institutional and non-institutional population. The 1977 National Health Interview Survey (NHIS), the 1977 National Nursing Home Survey, and numerous local studies use cannon elements of the index of Activities of Daily Living developed by Dr. Sidney Katz to assess functional capacity, which allows profitable comparisons. The index is based on an evaluation of the functional independence of patients in bathing, dressing, using the toilet, transferring (i.e. moving from bed to a chair) continence, and feeding. Independence means without supervision, direction, or active personal assistance. Ratings are given based on the actual performance of the patient, regardless of his/her ability; refusal to perform an activity is judged the same as incapacity. Thus, the Katz Index of ADL also provides an indirect measure of psychological status.
The Non-Institutional Population: About 1.4 million (4.8%) of non-institutionalized chronically ill and functionally dependent population need help in bathing, 1.0 million (3.6%) need help in dressing, 0.5 million (1.9%) need help in going to the toilet, and 0.3 million (1.1%) need help in eating. With the 4 ADL measures, a 5-level index can be specified (Table I). The vast majority (95.6%) of the 28.5 million non institutionalized chronically ill and functionally dependent do not need assistance with ADL's.
The relationship between age and functional status was discussed briefly in Working Paper #2. Table II shows this relationship in greater detail and indicates score potential problems with an age-based long-term care strategy. Although older people (particularly those over 85) are more likely than others to need personal care services, at every level of ADL dependency, there are more people who need personal care services under age 75 than over.
As with basic living services, relatives are a major source of help with all ADL Tasks. Almost 20% of those with greater dependence, however, report that help is given by a "nurse" (see Appendix 3-A).
The Institutional Population: The analysis of unpublished data from the Health Interview Survey allowed the Task Force to examine the relationship between ADL dependency and institutionalization on a national scale. Table III compares the functional dependency of the non-institutionalized long-term care population to the nursing home population. The National Nursing Home Survey used a six point ADL scale, while the Health Interview Survey used a five point scale, so comparable levels of dependency can only be approximated. Table III indicates that:
-
Nursing home residents are considerably more functionally dependent than the non-institutionalized.
- Only 5% of the non-institutionalized, but 95% of nursing have residents need ADL assistance.
- Less than 1% of the non-institutionalized, but 49% of the nursing home population and 52% of those patients over age 75 need help with all ADL activities.
-
The greater the degree of dependency, the more likely is institutionalization.
-
Among those with some, but not many ADL needs, more people live in the community than in nursing homes.
-
Elderly people who need a great deal of ADL assistance are more likely to be in nursing tonnes than in the community.
- 44% of the nursing home population is over age 75 and needs help with all ADLs.
- There are three times as many people of that age and condition in nursing homes as in the community.
| TABLE I. Number and Percent of Non-Institutionalized Chronically Ill and Functionally Dependent* According to Levels of Dependence for Activities of Daily Living by SexUnited States, 1977 | ||||||
| ADL Index | Total | Sex | ||||
| Male | Female | |||||
| Number(thousands) | Percent | Number(thousands) | Percent | Number(thousands) | Percent | |
| Total* | 28,577 | 100.0 | 14,250 | 100.0 | 14,326 | 100.0 |
| No Dependency | 27,021 | 94.6 | 13,593 | 95.4 | 13,428 | 93.0 |
| Dependent in one ADL | 607 | 2.1 | 261 | 1.8 | 346 | 2.4 |
| Dependent in bathing, and one other ADL | 421 | 1.5 | 175 | 1.2 | 246 | 1.7 |
| Dependent in bathing, dressing, and one other ADL | 243 | 1.0 | 96 | 1.0 | 147 | 1.0 |
| Dependent in all four ADL's | 266 | 1.0 | 116 | 1.0 | 150 | 1.0 |
| Non Scale | 19** | 0.1** | 9** | 0.1** | 10** | 0.1** |
| SOURCE: 1977 National Health Interview Survey (unpublished data) * Persons reporting some activity limitation due to chronic illness (Levels I and II: See Working Paper #2) ** Figures do not meet NCHS standards of reliability | ||||||
These findings indicate that the need for personal care services is a greater factor in institutionalization than has been thought. Previous research has stressed the importance of social factors such as living arrangements and marital status in determining institutionalization.7 These factors are important: when two people have similar conditions and needs for help, the person with a spouse is less likely to be institutionalized. However, the more detailed data available now make clear that a very large proportion (nearly half) of the nursing home population is so debilitated that few with similar conditions -- regardless of their social situation -- manage in a community setting.
| TABLE II. Number and Percent of Non-Institutionalized Chronically Ill and Functionally Dependent* According to Levels of Dependence for Activities of Daily Living by AgeUnited States, 1977 | ||||||||||||
| ADL Index | Total | Age | ||||||||||
| Less Than 21 | 21 - 64 | 65 - 74 | 75 - 84 | 85 and Over | ||||||||
| Number | Percent | Number | Percent | Number | Percent | Number | Percent | Number | Percent | Number | Percent | |
| Total* | 28,577 | 100.0 | 2,852 | 100.0 | 16,147 | 100.0 | 5,503 | 100.0 | 3,219 | 100.0 | 856 | 100.0 |
| No Dependency | 27,021 | 94.6 | 2,700 | 94.6 | 15,651 | 96.9 | 5,186 | 94.2 | 3,832 | 88.0 | 652 | 76.2 |
| Dependent in one ADL | 607 | 2.1 | 42 | 1.5 | 210 | 1.3 | 121 | 2.2 | 166 | 5.2 | 67 | 7.9 |
| Dependent in bathing, and one other ADL | 421 | 1.5 | 27 | 1.0 | 153 | 1.0 | 74 | 1.3 | 113 | 3.5 | 55 | 6.4 |
| Dependent in bathing, dressing, and one other ADL | 243 | 1.0 | 3.5 | 1.2 | 61 | 0.4 | 60 | 1.1 | 57 | 1.8 | 31* | 3.6* |
| Dependent in all four ADL's | 266 | 1.0 | 44 | 1.6 | 67 | 0.4 | 60 | 1.1 | 43 | 1.3 | 51 | 6.0 |
| Non Scale | 19** | 0.1** | 7** | 0.1** | 6** | 0.0** | 2** | 0.0** | 7** | 0.2** | 0** | 0.0** |
| SOURCE: 1977 National Health Interview Survey (unpublished data) * Persons reporting some activity limitation due to chronic illness (Levels I and II: See Working Paper #2) ** Figures do not meet NCHS standards of reliability | ||||||||||||
Illness/Disability ("Health Care") Services
Chronic illness accounts for a large proportion of the use of health care services. For example, only 17% of the elderly are limited in their major activity by chronic illness, but this group accounts for 30% of the physician visits and nearly 50% of the hospital days among the elderly.8
The therapeutic goals and types of health services interventions required to manage chronic illness are different from those appropriate for acute illnesses; even the management of acute episodes of illness differs for patients with chronic diseases since their recovery from the acute problem means return to the chronic illness and not full health. Generally, treatment of chronic illness is considered to require continuing management to reduce acute flare-ups, minimize complications, maximize periods of remission and maximize maintenance of functional capabilities. Because the underlying mechanisms of chronic disease are so poorly understood, medical management involves what Lewis Thomas calls a "halfway technology".9 It often involves a great deal of trial and error, multiple pharmacological and dietary approaches, and a great deal of supportive nursing. The distinctions between "medical treatment" and social support became blurred with chronic illness.
Because of the nature of the medical management of chronic illness, it is very difficult to determine the relative importance of "health care" to other services in long-term care. Two of the major public programs which serve the long-term care population (Medicare and Medicaid) are fundamentally health care programs. This has led to the conclusion that public efforts represent an "over-medicalization" of long-term care. The controversy is in large part over the appropriate locus for authority and public financing in long-term care; whether long-term care should be developed as an extension of "medical" programs, social service programs, or an all together new program. Determining the types of services being provided under these programs is a separate issue. Some argue that despite the apparent medical orientation of public long-term care programs, the health care needs of the chronically ill, particularly the elderly, are often severely neglected, particularly in nursing homes. These critics argue that nursing home residents are as isolated from high quality medical care as they are from community social life. Some evidence supports this contention.
One of the few careful examinations of what nursing homes really do is Gottesman and Burestom's study of activities in forty "elite" skilled nursing homes in Detroit (1974). They found that only 2% of the resident's time was spent receiving "skilled nursing." Contact with any staff member filled only 10% of the residents' time -- about half of this was personal care services.10 Similarly, national surveys indicate that nursing have residents see physicians an average of seven times a year -- only slightly more than the non-institutionalized elderly.11
| TABLE III. Comparisons of the Dependency Levels of Nursing Home and Non-Institutionalized Populations by AgePercent (N=X1,000) | |||
| Nursing Home Residents | Non-Institutional Population | Number of Non-InstitutionalizedPersons per 100Nursing Home Residents | |
| UNDER AGE 65 | |||
| No ADL Dependency Level 1 Level 2 Level 3 Level 4 (greatest) Other/Non-Scale TOTAL | 24%16%13%7%35%6%100% (179) | 97%1%1%.5%1%--100% (18,999) | 100: 42,677100: 789100: 913100: 738100: 179 |
| 65 - 74 | |||
| No ADL Dependency Level 1 Level 2 Level 3 Level 4 (greatest) Other/Non-Scale TOTAL | 14%17%13%7%43%7%100% (211) | 94%2%1%1%2%--100% (5,503) | 100: 17,580100: 347100: 261100: 420100: 66 |
| 75 - 84 | |||
| No ADL Dependency Level 1 Level 2 Level 3 Level 4 (greatest) Other/Non-Scale TOTAL | 7%12%12%10%50%9%100% (465) | 88%5%4%2%1%--100% (3,219) | 100: 8,429100: 290100: 207100: 127100: 19 |
| 85 - OVER | |||
| No ADL Dependency Level 1 Level 2 Level 3 Level 4 (greatest) Other/Non-Scale TOTAL | 11%9%12%9%55%--100% (449) | 76%8%6%4%6%--100% (856) | 100: 1,309100: 163100: 103100: 80100: 21 |
| SOURCE: 1977 National Nursing Home Survey and 1977 National Health Interview Survey (unpublished data) | |||
Some local studies also emphasize scanty contact with health professionals. A relatively early study of nursing homes in three states found that few facilities provided more than personal care services.12 Similarly, a recent study of 87 California SNF's found that only 10% of the residents received physical therapy, though staff believed half needed it.13 A particularly interesting finding of the California study was that only 8% of the residents of skilled nursing facilities for the "mentally disordered" received any "psychological therapy" beyond that provided on an ad hoc basis by the nursing staff. Similarly, a Texas study found that therapeutic services were generally unavailable to mental patients in nursing homes.14
The Task Force was unable to determine on a national basis the degree to which the illness/disability services needs of the long-term care population are being met. There is considerable controversy about the appropriate treatment of even single chronic diseases and disabilities. What did became clear, however, was that simple counts of the services received under health care programs, particularly for institutional care, give a very poor picture of the actual availability and use of illness/disability services in long-term care.
C. Settings: Selected Issues
Institutional and Community Services
Most people with functional dependencies due to chronic illness live "in the community." Seventy-five percent of those identified by the Task Force as the core long-term care population live in various "community" settings, from skid raw flop houses to Palm Beach condominiums. The other 1.5 million are in institutions, primarily nursing homes, though the proportion who will ever become institutionalized is considerably higher.
Much of the current public discussion of long-term care service organization focuses on this distinction between community and institutional settings. "Preventing or reducing inappropriate institutional care by providing for community-based care" is a national goal, stated as an objective of Title XX of the Social Security Act.15 The right to care in "the least restrictive environment" is increasingly sanctioned by courts. In practice, preventing unnecessary institutionalization has largely meant working to keep the elderly out of nursing homes and other mentally and physically handicapped people out of large state institutions.
Estimating the extent of inappropriate institutionalization is difficult and depends on the instrument used, the weight given to medical versus social factors in placement, and different judgments about what level of disability requires institutionalization. The Congressional Budget office's estimates of inappropriate institutionalization of the elderly (10-40%) are often cited. The report is five years old, however, and some of the studies on which the CBO estimates were based date from the 1960's. Studies based on more recent data, including the previously unpublished data in this paper, indicate that the degree of inappropriate nursing have use is probably lower than had been thought. This may be partly the result of more experience in using assessment tools and the greater prevalence of nursing home screening programs.
Among the most recent studies is the work of Beth Soldo and her colleagues. They reanalyzed data on persons age 60 and over from the 1976 Survey of Institutionalized Persons (S.I.P.) - a nationally representative sample of long-term care facilities. Scales were constructed which measured various dimensions of functional health, excluding direct indicators of cognitive ability and emotional stability for which data were not available. They found that "using the most conservative criteria that include functional dependency, need for nursing services, and the presence of other physical impairments, the estimated number of elderly for whom long-term care placement appears unnecessary approaches 100,000 persons."16 While this is a substantial number of people, it is less than 10% of the institutionalized elderly.
Although there is some indication that previous estimates of the degree of inappropriate nursing home use may not reflect the current situation, it is incorrect to assume that "the problem has been solved." Surveys of those currently in institutions do not accurately reflect the conditions of people at the point of entry, when they may be less disabled. By this line of reasoning, cross-sectional studies may under-estimate the degree of inappropriate institutionalization. Practical experience in a number of areas and demonstration projects do indicate that where people can be linked to appropriate alternative services, a significant proportion can be maintained in the community, though it is unknown for how long. For example, Virginia has a mandatory prescreening program for all Medicaid clients who apply for admission to nursing homes. Approximately 22% have been diverted, at least temporarily, to community care.17
Housing with Services
Providing care "in the least restrictive environment" is not just an issue of "institutional" versus "home" care. The characteristic which makes institutional life objectionable to so many is not the intensity of available services nor neccessarily the size of a facility, nor the fact that many people live in the same building. Rather, it is the abnormal patterning of daily life, which is in large part a function of the organization of services, and to some extent a function of architecture. Congregate housing is one mode of providing services in a large-scale "non-institutional" setting to people for whoa complete independence is inappropriate, undesirable, or too costly. (See Appendix 3-B for a description of federal housing programs, some of which include services for the disabled).
"Congregate" housing is both a programmatic and a generic term. It is officially defined in federal legislation as "low income housing which has an available central dining facility where meals can be served to residents." As a generic term, however, it most often designates a broader concept. Here, for example, is the definition adopted by a 1976 national conference on congregate housing for the elderly.
Congregate Housing is an assisted independent group living environment that offers the elderly who are functionally impaired or socially deprived, but otherwise in good health, the residential accommodations and supporting services they need to maintain or return to a semi-independent life style and prevent premature or unnecessary institutionalization as they grow older.18
Since there is no one commonly agreed upon definition of congregate housing, it is not easy to distinguish between congregate housing and other forms of group living environments (e.g., board and care homes, adult foster care). The most apparent distinction involves a subtle shading of ideological emphasis. The congregate housing concept emphasizes maximum independence through supportive services; more traditional forms emphasize the protective care of sheltered group living.
At a minimum, congregate housing/services implies that some meals (though usually not all) are shared. Additional services may be required to support the continued independence of residents, including:
-
Homemaker/chore -- cooking, shopping, housekeeping, laundry, home management.
-
Counseling -- guidance in social or emotional problems, financial and legal advice.
-
Transportation.
-
Personal care services -- bathing, toileting, feeding, other personal maintenance assistance.
-
Health --- some health services by skilled professionals, e.g., monitoring of condition, changing of dressing, evaluation, physical or speech therapy.
Common space for socialization is included in this concept, and most proponents see the provision of apartments with some kitchen facilities, rather than single rooms, as being essential to maintaining the personal independence of residents. These architectural design features distinguish current views of congregate housing from the older domiciliary care concept as much as does the emphasis on a service package which promotes independence rather than mere protection of chronically impaired residents. These distinctions have found their way into federal legislation dealing with congregate housing for the elderly (for example, 1970 and 1974 housing legislation authorized congregate living arrangements in public housing), but the language is restrictive and almost solely concerned with provision for group dining facilities. Operating funds even for this service are not authorized. By contrast, the 1978 Congregate Housing Services Act emphasizes basic services within the congregate setting for the express purpose of prolonging independence and preventing premature institutionalization, and authorizes funds for basic services when third-party funds cannot be obtained.
There have been few formal evaluations of congregate housing. However, the results of those seem promising.
HUD/Urban Systems Report - 197619: Twenty-seven congregate housing sites were studied, representing all regions of the United States, a variety of supported and non-supported facilities, a range of rental levels, and differing combinations of on-site services. Some key findings were:
-
Congregate housing fostered the maintenance of independence and an increase in activity.
-
Congregate housing counters social isolation.
-
Congregate housing appears to provide services and care on an "as needed" basis and thereby is a sensitive service delivery mechanism which allows residents to gauge the appropriate level of ser vices, support, and care that they require.
-
Congregate housing facilities financed and developed under the various federal housing finance programs, particularly Section 202 mortgage financing, have had substantially lower development costs.
-
Congregate housing has not met its full operating costs from operating income, i.e., it has required subsidies.
-
High and medium service congregate housing are cost effective alternatives to some levels of institutional care.
The Highland Heights Experiment - 197720: Highland Heights is a specially designed 14-story apartment house for low-income physically impaired and elderly persons. A wide array of social, recreational, and health services is available. A five-year study comparing residents to "matched controls" on the waiting list found that:
-
Highland Heights residents were significantly less likely to became institutionalized or to die during the study period than the nonresident controls.
-
Severely impaired persons functionally eligible for nursing home care could function successfully in the Highland Heights community living arrangement.
-
Residency in Highland Heights was economical. Based on a cost savings analysis over a three-year period, the cumulative benefit/cost ratio was 2.21, indicating that the cost of housing and care for the controls was over twice that for Highland Height's residents.
Although congregate housing has been found to be less costly than nursing home care for some chronically impaired elderly, very little is known about the cost-effectiveness of congregate housing in preventing institutionalization compared to home-based services alone or to other forms of domiciliary care. Some current and proposed demonstrations address these questions. They are described in Appendix 3-B.
D. Cross-Cutting Issues
Personnel
The Task Force Work Group on long-term care personnel explored the adequacy of current and future supplies of various types of personnel and the related issues of training and quality.
Supply-Demand Projections: Nursing homes employed about 828,000 persons in 1976, an increase of 75 percent since 1970. Nursing home employment is expected to grow by 73 percent between 1976 and 1985, reaching 1,431,000 in 1985. This represents a 6.3 percent annual rate of increase.
Nursing home industry employment has the highest ratio of service workers and the lowest ratio of professional, technical, and kindred workers of all the health industries. Nearly three employees out of four in nursing homes are classified as service workers; most of these are health service workers. Only about 10 percent of employees are classified as professional or technical workers, since the care provided in nursing have generally consists of routine tasks considered not to require professional training. The nursing have industry has fewer clerical workers and more managers/proprietors than other segments of the health economy. This reflects the lower level of paperwork due to low turnover of patients and the smaller average size of nursing homes.
Very little change is expected in the occupational distribution of nursing home industry employment between 1976 and 1985. The main exception is the relative decline of total industry employment expected for professional and technical workers (from 13.4 to 10.9 percent of the total). This is consistent with the trend to allocate routine tasks to auxiliary workers. This decline is expected to be accompanied by an increase in the total percentage of clerical workers required for the detailed paperwork required by the growing amount of government reimbursement. Detailed projections of the supply and demand for selected occupations through 1985 have been canpiled by the Bureau of Labor Statistics in conjunction with AoA. Difficulties were experienced in developing these estimates. BLS felt that no reliable supply estimates could be made for those occupations for which on-the-job training provides many of the entrants such as nurse aides and other support personnel. Further, all such projections are based upon current patterns of care provision and care providers. There is some basis for questioning whether these patterns are the most accurate models to use to project future needs. The philosophy of long-term care increasingly has been shifting from institutional and custodial management of patients to an emphasis on the care of patients in their homes. Such alternate patterns may require larger numbers of community health specialists such as geriatric nurse specialists, as well as requiring professionals to initiate mechanisms to assure quality care under such alternative arrangements.
One recent study focuses strictly on projecting the need for physician personnel to provide care for the elderly over the next 50 years. This is the Rand study on Geriatrics in the United States: Manpower Projections and Training Considerations (May 1980). Based on a number of assumptions regarding the extent of delegation to nurse practitioners and physician's assistants, and the age of the population dealt with (75 and older), the report makes a summary estimate that the country will require between 7000 and 10,300 geriatricians by 1990, with the best intermediate estimate being about 8000. This is in contrast to score 629 physicians who reported geriatrics as their primary, secondary, or tertiary specialty in 1977.
Training and Evaluation: The Federal government supports a variety of programs which train long-term care personnel. In brief, it appears that more attention has been, given to specialized training of health care practitioners than to training and education for community social service workers. Some, however, argue that it is more appropriate to focus the education of health practitioners on the needs of the chronically ill, particularly the elderly. The appropriate federal role in this is open to question.
In the field of medicine, there has already been some movement toward incorporating geriatrics into medical school curricula, according to the Rand study on geriatrics. As late as 1976, the Senate Special Committee on Aging found that only 3 of 87 schools responding to their survey had established geriatrics as a specialty within the curriculm. Based on more recent data, the Rand study concludes that:
"... by June 1979, a total of 61 U.S. medical schools offered courses in geriatrics, gerontology, or both to medical students. Of these, 4 now mandate a clerkship in geriatric medicine or psychiatry and an additional 4 include geriatrics as part of a major clinical clerkship. In addition to these 8, another 21 intersperse didactic material in geriatrics or gerontology through the pre-clinical and clinical years as part of other courses. In 55 of the 61 schools, elective courses are offered; most of then are clinical clerkships of one kind or another."
Programs for nurses also increasingly emphasize geriatrics. Of some 70 federally-supported advanced nurse training and nurse practitioner training programs, 47 had substantive geriatric content and 23 were specifically targeted to gerontology/geriatrics. Overall, more than 1000 nurse practitioners have to date been prepared in geriatrics and related fields such as family medicine or adult care.
Staff Recruitment and Retention: One personnel issue of particular concern is the difficulty experienced by nursing homes in attracting and keeping staff. A recent California study found that the turnover rate among nursing home personnel exceeded 100 percent.21 Similar results have been reported elsewhere. Staff turnover has been variously attributed to such factors as "sex, age, marital status, education, salary and benefits, hours and working conditions, local demographics, length of employment, personnel practices, morale, adequacy of training, attitude towards patients and families." The relationship between any of these factors and staff turnover is poorly understood. More important, adequate means for solving the problems have not been established, though a variety of proposals have been put forward.
Some argue that the key factor is inadequate salaries. It is true that there are differences between salaries and benefits in hospitals and nursing homes. For example, only 9.2 percent of registered nurses in nursing homes in 1977 had paid vacations and sick leave, only 11 percent had retirement programs, and only 10.8 percent had health or life insurance. By contrast, nearly all registered nurses in hospitals had paid vacations, health insurance and retirement and most had shift differential pay and paid overtime. Staff turnover in hospitals, however, is not much lower for comparable personnel than in nursing homes.22
Quality Assurance
The Federal government has played an active role in efforts to upgrade the quality of care for the LTC population for over a century, though the extent of that role has changed as a result of both growing federal financial responsibility and changing notions about effective ways of influencing quality. During the latter part of the 19th century, the Bureau of the Census -- as part of its responsibility to enumerate the numbers of inmates of institutions for the blind and "feeble minded" -- conducted a series of surveys, the results of which spurred the deinstitutionalization of the blind and the establishment of community workshops. In 1927, the Bureau of Labor Statistics undertook a complete survey of conditions in all almshouses and homes for the aged. The report of that survey, which found that conditions varied considerably but that the worst were found in large public almshouses, directly contributed to the decision to prohibit Social Security payments to inmates of public institutions.
The current federal activities in long-term care quality assurance are largely variations on these two historical approaches: (1) conducting and supporting research and (2) establishing standards for the receipt of public benefits. Research, demonstrations, and training programs constitute a major part of the federal effort. But the most visible and controversial activities relate to the certification and regulation of nursing homes.
As part of its certification program, the Department develops Conditions of Participation which facilities/agencies must meet before they can be eligible to receive reimbursement from Medicare and Medicaid. In order to ensure that the standards are met, an annual health and safety survey is conducted in each facility/agency by its respective state under a contract with the Department. The Department's Regional Offices monitor the States' survey process to make certain that standards are being enforced. For Medicare or Medicaid facilities, the Federal Regional Offices make the certification decision; for Medicaid-only facilities the States certify.
The primary purpose of the health and safety survey is to determine whether the facility has met the Conditions of Participation and therefore has the capacity for providing safe, quality care. In addition, Medicare law requires that the appropriate services delivered to patients and quality care be assured through a utilization review (UR) committee within a skilled nursing facility. Medicaid law specifies a utilization control (UC) program to assure quality care. Elements of a UC program include utilization review, physician certification and recertification of the need for patient services, and individual patient care plans. These quality assurance elements are part of the Conditions of Participation and by regulation, have been made common to both Medicare and Medicaid.
The Medicaid utilization control program additionally calls for a periodic medical review (MR) team in skilled nursing facilities and an independent professional review (IPR) team in intermediate care facilities to survey a facility at least annually. These inspection teams are composed of State employed professionals who are required to review the care being provided, the adequacy of the services available to meet current health needs, the necessity of continued placement, and the feasibility of alternate care arrangements.
PSROs are groups of physicians in 192 areas throughout the country who are organized to assure that health care services for Medicare and Medicaid patients are of a quality that meets professionally recognized standards of care, are medically necessary, and are appropriately provided in the most economical setting. PSROs have primarily been involved in reviewing care setting. PSROs stress physician and provider education as the means to improve quality of care.
By law, when PSRDs are found competent to review long-term care facilities, PSROs assume responsibility for Medicare UR, and may assume responsibility for Medicaid UC, including MP/IPR. However, monitoring UC effectiveness remains a state Medicaid agency responsibility regardless of whether review authority is assumed by a PSRO or by another agency of the state. Assessing the performance of each PSRO is the responsibility of the Department's Regional Offices.
The overall effect of all this activity is difficult to assess. There have been very few attempts to assess the quality of nursing homes over time and to relate these changes to government activities. One study concluded that the most important effect has been the "standardization" of facilities, which has an uncertain effect on quality.23 Improvements over time have been noted in the provision of clean and safe physical environments. Considerable problems, however, appear to remain in the assurance of quality care.24 Quality of care objectives are more difficult to achieve than custodial goals because there is no well defined technology for either producing or evaluating quality care in long-term care settings. Some argue that the regulatory methods emphasized to date are inappropriate approaches to quality assurance and that other methods -- including market strategies -- need to be tried.25 The problems which remain with quality assurance in institutional settings are sure to be compounded as long-term care services are expanded in the community.
APPENDIX 3-A. NUMBER AND PERCENT OF NON-INSTITUTIONAL CHRONICALLY ILL AND FUNCTIONALLY DEPENDENT BY WHO PROVIDES HELP, LIVING ARRANGEMENT, INCOME AND MARITAL STATUS
| TABLE A3-I. Number and Percent of Non-Institutionalized Chronically Ill and Functionally Dependent Persons Who Receive ADL Assistance by Who Provides HelpUnited States, 1977 (thousands) | ||||||||||||
| ADL Category | Total | Who Provides Help | ||||||||||
| Relative | Friend | Nurse | Other | Unknown | ||||||||
| Number | Percent | Number | Percent | Number | Percent | Number | Percent | Number | Percent | Number | Percent | |
| Receive Help Bathing | 1,348 | 100.0 | 1,133 | 84.0 | 121 | 9.0 | 131 | 9.7 | 154 | 11.4 | 51 | 3.8 |
| Receive Help Dressing | 1,023 | 100.0 | 875 | 85.5 | 95 | 9.3 | 109 | 10.7 | 115 | 11.2 | 44 | 4.3 |
| Receive Help Toileting | 532 | 100.0 | 463 | 87.0 | 62 | 11.6 | 92 | 17.3 | 79 | 14.8 | 95 | 1.8 |
| Receive Help Eating | 328 | 100.0 | 293 | 89.3 | 29* | 8.9* | 64 | 19.5 | 36 | 11.1 | 37 | 1.1 |
| SOURCE: 1977 National Health Interview Survey (unpublished data) * Figures do not meet standards of reliability or precision | ||||||||||||
| TABLE A3-II. Number and Percent of Non-Institutionalized Chronically Ill and Functionally Dependent According to Levels of Dependence for Activities of Daily Living by Living ArrangementUnited States, 1977 (thousands) | ||||||||||
| ADL Index | Total | Living Arrangement | ||||||||
| Alone | With Non-Relative | With Spouse | With Other Relative | |||||||
| Number | Percent | Number | Percent | Number | Percent | Number | Percent | Number | Percent | |
| Total | 28,577 | 100.0 | 4,444 | 100.0 | 592 | 100.0 | 16,274 | 100.0 | 7,267 | 100.0 |
| No Dependency | 27,021 | 94.6 | 4,278 | 96.3 | 541 | 91.4 | 15,567 | 95.7 | 6,634 | 91.3 |
| Dependent in one ADL | 607 | 2.1 | 80 | 1.8 | 21* | 3.6* | 295 | 1.8 | 211 | 2.9 |
| Dependent in bathing, and one other ADL | 421 | 1.5 | 47 | 1.1 | 18* | 3.1* | 181 | 1.1 | 175 | 2.4 |
| Dependent in bathing, dressing, and one other ADL | 243 | 1.0 | 16* | 0.3* | 8* | 1.4* | 107 | 0.7 | 112 | 1.5 |
| Dependent in all four ADL's | 266 | 1.0 | 21* | 0.5* | 3* | .6* | 115 | 0.7 | 127 | 1.7 |
| Non Scale | 19* | 0.1* | 2* | 0.0* | 0 | 0.0 | 10* | 0.1* | 7* | 0.1* |
| SOURCE: 1977 National Health Interview Survey (unpublished data) * Figures do not meet NCHS standards of reliability | ||||||||||
| TABLE A3-III. Number and Percent of Non-Institutionalized Chronically Ill and Functionally Dependent According to Levels of Dependence for Activities of Daily Living by IncomeUnited States, 1977 (thousands) | ||||||||||||
| ADL Index | Total | Income | ||||||||||
| $5,000 | $5,000-9,999 | $10,000-14,999 | $15,000-24,999 | $25,000+ | ||||||||
| Number | Percent | Number | Percent | Number | Percent | Number | Percent | Number | Percent | Number | Percent | |
| Total | 28,577 | 100.0 | 7,362 | 100.0 | 6,822 | 100.0 | 4,445 | 100.0 | 4,434 | 100.0 | 2,532 | 100.0 |
| No Dependency | 27,021 | 94.6 | 6,913 | 93.9 | 6,359 | 93.8 | 4,237 | 95.3 | 4,239 | 95.6 | 2,444 | 96.5 |
| Dependent in one ADL | 607 | 2.1 | 179 | 2.4 | 166 | 2.4 | 76 | 1.8 | 75 | 1.7 | 40 | 1.6 |
| Dependent in bathing, and one other ADL | 421 | 1.5 | 131 | 1.8 | 122 | 1.8 | 55 | 1.2 | 44 | 1.0 | 18* | 0.5* |
| Dependent in bathing, dressing, and one other ADL | 243 | 1.0 | 60 | 0.8 | 63 | 0.9 | 32* | 0.7* | 37 | 0.8 | 16* | 0.6* |
| Dependent in all four ADL's | 266 | 1.0 | 70 | 1.0 | 66 | 1.0 | 43 | 1.0 | 35 | 0.8 | 18* | 0.7* |
| Non Scale | 19* | 0.1* | 7* | 0.1* | 7* | 0.1* | 0* | 0.0* | 2* | 0.1* | 2* | 0.1* |
| SOURCE: 1977 National Health Interview Survey (unpublished data) * Figures do not meet NCHS standards of reliability | ||||||||||||
| TABLE A3-IV. Number and Percent of Non-Institutionalized Chronically Ill and Functionally Dependent According to Levels of Dependence for Activities of Daily Living by Marital StatusUnited States, 1977 (thousands) | ||||||||||||||
| ADL Index | Total | Marital Status | ||||||||||||
| Less Than 17 Years | Married - Spouse Present | Widowed | Divorced | Separated | Married - Spouse Absent | |||||||||
| Num. | Per. | Num. | Per. | Num. | Per. | Num. | Per. | Num. | Per. | Num. | Per. | Num. | Per. | |
| Total | 28,577 | 100.0 | 2,012 | 100.0 | 16,279 | 100.0 | 4,528 | 100.0 | 1,593 | 100.0 | 816 | 100.0 | 199 | 100.0 |
| No Dependency | 27,021 | 94.6 | 1,881 | 93.5 | 15,572 | 95.7 | 4,066 | 89.8 | 1,532 | 96.0 | 784 | 96.1 | 193 | 97.3 |
| Dependent in one ADL | 607 | 2.1 | 35 | 1.7 | 295 | 1.8 | 192 | 4.2 | 26* | 1.6* | 11* | 1.3 | 0 | 0.0 |
| Dependent in bathing, and one other ADL | 421 | 1.5 | 23* | 1.2* | 181 | 1.1 | 136 | 3.0 | 21* | 1.3* | 12* | 1.4* | 4* | 1.8* |
| Dependent in bathing, dressing, and one other ADL | 243 | 1.0 | 27* | 1.3* | 107 | 0.7 | 63 | 1.4 | 11* | 0.7* | 4* | 0.5* | 2* | 0.9* |
| Dependent in all four ADL's | 266 | 1.0 | 42 | 2.1 | 115 | 0.7 | 67 | 1.5 | 4* | 0.2* | 5* | 0.7* | 0 | 0.0 |
| Non Scale | 19* | 0.1* | 4* | 0.2* | 10* | 0.1* | 4* | 0.1* | 0 | 0.0 | 0 | 0.0 | 0 | 0.0 |
| SOURCE: 1977 National Health Interview Survey (unpublished data) * Figures do not meet NCHS standards of reliability | ||||||||||||||
APPENDIX 3-B. AN OVERVIEW OF FEDERAL HOUSING PROGRAMS BENEFITING THE ELDERLY AND HANDICAPPED
HUD Housing Finance and Rental Assistance Programs
Section 202, Housing Act of 1959: "was designed to provide 'independent living' for elderly and handicapped individuals whose incomes are above the public housing income limits but below the level to afford standard private sector housing."26 HUD provided a direct loan to the sponsor rather than the mortgage guarantee used in most other HUD programs. The mortgage subsidy required the sponsor to charge rents below the market rate. The program produced 335 projects with a total of about 45,000 units before it was phased out in 1969. The projects were primarily new construction, single buildings of medium to high rise, averaging 170 units, predominantly efficiency apartments. Most projects include design features to meet the special needs of the elderly, but do not accommodate the handicapped.
While most projects are well located in convenient center city neighborhoods, the facilities, amenities and services provided within each project vary widely.
For example, almost all provide recreational facilities, some provide meals and only a few offer medical care, physical therapy, or maid and linen services. The wide variation can be attributed to several factors:
-
Not all projects have appropriate facilities for services provision.
-
There is disagreement as to the desirability of on-site versus off-site service provision.
-
There is variation in tenant need or demand for services.
-
Service provision is often a function of the ability of the tenant or sponsor to afford them.27
A HUD survey conducted in 1977 of all elderly projects in six selected areas showed the frequency with which various services and amenities were provided in different types of projects.
The original Section 202 program benefited a select group of the elderly. "In accordance with its intent, the program served basically a middle income elderly group."28 Projects often had a homogenous group of white, middle class, mostly female tenants. The tenants reflected the neighborhoods in which the projects were located and the sponsors, often relatively well-established religious, occupational and fraternal organizations. There were few minority group sponsors. The geographic distribution was not even, with 71 projects in Florida and California and most of the remaining ones in large metropolitan areas in the Northeast and Midwest, and did not reflect the distribution of the elderly. There were very few projects in rural areas because of a lack of qualified sponsors and high rents relative to median income. The program was very popular among sponsors and tenants and was well received by the surrounding communities.
Section 202/8: The Housing and Community Development Acts of 1974 and 1978 revised and reactivated the Section 202 program and permit it to serve low and very low income populations through coordination with Section 8 housing assistance payments. The double subsidy of the mortgage and the rental assistance permit a wider economic range of tenants in the projects. The Section 8 tenants pay no more than 25 percent of their incomes in rent. Higher income tenants may live in the project by paying market rents. The revised program includes a mechanism for a more equitable allocation of funds geographically, but there is still a shortage of qualified sponsors in rural areas. By May, 1980, HUD had reserved funds for 90,000 housing units; 20,319 had been completed.
"Potential sponsors have expressed a need to coordinate the funding of Section 202 housing with that of supportive services provided in those projects."29 For the first time, the 1978 amendments authorized HUD to enter into contracts with local public housing agencies and project sponsors to provide congregate services to eligible project residents. (See discussion below of HUD's Congregate Housing Services Program.)
Another significant revision in 1978 set aside $50 million for Section 202 housing for non-elderly handicapped individuals. The physical facilities as well as accompanying services are to be designed specifically to meet the needs of the handicapped. Half of the loan authority will be used for demonstration (see discussion below).
Section 231, Housing Act of 1959: This program was designed to provide unsubsidized rental housing for frail but mobile elderly. The program insured loans made to profit and nonprofit sponsors. This housing was intended to be an alternative to institutionalization in a hospital or nursing home. In fact, many projects were "retirement centers," including many life-supporting services such as meals, housekeeping, hobby rooms, and full medical care of a nursing home level. Program funds went almost exclusively to urban areas. The program has 463 projects with about 63,000 units, but has fallen into disuse because sponsors prefer other forms of mortgage assistance. Cirtics claim Section 231 has a high default or foreclosure rate and that it served a relatively high income, low priority population.
Section 236E, Housing and Urban Development Act of 1968: From 1968 until its suspension in 1973, this program was a major source of funds for construction of rental and cooperative housing for low and moderate income families and the elderly. About 12 percent of the more than 450,000 units produced were occupied by the elderly. The program provided a subsidy to the mortgage that reduced the effective interest rate paid by the mortgagor to 1 percent and required low rents. In addition, supplemental rental assistance was provided for up to 40 percent of the tenants in a project with incomes too low to afford the reduced rent. This rental assistance enabled projects to serve a wider economic range than did the original Section 202 program.
Critics claim the program was attractive to speculators and did not promote continuous, service-oriented management. In fact, since the subsidy only applied to the mortgage payments, rapidly rising operating costs meant that rental income was often insufficient to cover both debt service and necessary maintenance. "The program was suspended in 1973, amid charges that the assistance was not great enough to serve very low income people, the program was too expensive and default rates were unacceptably high."30
Public Housing: Low rent public housing is the oldest (since 1937) and by far the largest program providing housing to poor families and the elderly. About 45 percent of the 1,200,000 units are occupied by the elderly and most new construction in the last 10 years has been in projects for the elderly. Public housing for the elderly is so popular because it is easier to manage than family projects and local communities prefer it to family projects.
The program is federally financed and locally operated through some 3000 public housing agencies authorized to acquire, construct, develop or lease real property suitable for low income housing. Usually the agency owns and operates its projects. Tenants pay no more than 25 percent of their adjusted income for rent and at least 20 percent of each project must be occupied by very low income tenants, those with incomes 50 percent or less of the area's median.
The 1970 Housing and Urban Development Act provided authority for congregate housing. This authority was to be used to pay for dining facilities and equipment in low-rent public housing projects. Funds for modernization of older projects can also be used to add congregate facilities. No subsidy was provided to cover the costs of the meals and other services. There has been little development of congregate facilities under this program because:
- Tenant selection would be complicated by the requirement to match tenants' housing and service needs and ability to pay with the circumstances of the particular project;
- Local housing agencies had little experience managing the necessary services;
- There was little federal encouragement and support; and
- Assurance of funds to subsidize the services on an ongoing basis does not exist.
It is generally accepted that there will have to be support from State and local service agencies if congregate housing is to be implemented nationwide.31
Section 221(d)(3): This program operated from 1954 until 1968 and provided mortgage insurance for nonprofit, cooperative and limited dividend sponsors to develop multifamily rental projects for low and moderate income families. In 1961 a Below Market Interest Rate subsidy program was added to this section, but was dropped during the housing moratorium in 1973.
Section 221(d) (4): A similar market rate program which provides mortgage insurance and 90 percent financing to profit-oriented sponsors, also is used to house the elderly.
Relatively few elderly were housed under Section 221(d)(3) until 1964 when eligibility was expanded to include single elderly individuals. The attractiveness of the program was enhanced by the coordinated use of the Rent Supplement Program, which was operated similarly to Section 8, but was phased out in 1973. In all, about 50,000 units under Section 221(d) (3) and (4) went to the elderly.
Section 8, Housing and Community Development Act of 1974: Section 8 provides a rent subsidy to lower and very low income tenants in leased housing. The tenant contributes between 15 and 25 percent of his or her income toward the rent and the housing assistance payment makes up the difference between that and the established rent paid to the owner.
HUD establishes fair market rents and the local housing agency administers the program for existing housing units. For new developments and Section 202 projects HUD contracts directly with the developer. For newly constructed or rehabilitated units for the elderly an extra 5 percent above the established fair market rent is granted to the owner. For either existing or new housing, the private owner is responsible for managing the unit.
There are several restrictions affecting the distribution of housing assistance payments:
- 20 to 25 percent of the funds must be used in non-metropolitan areas;
- 30 percent of the units must be rented initially to very low income households, including single persons who are elderly, handicapped, a remaining member of a eligible family, etc.; or
- Selection preference is given to family housing projects with not more than 20 percent of the units receiving Section 8 assistance.
That part of the Section 8 program used for existing units has the advantage of permitting an elderly renting household to remain in its own apartment, to maintain its community contacts but to receive assistance in making the rent payments. Early HUD evaluation data show nearly 90 percent of funds for Section 8 existing housing has gone to the elderly.
This program reached a peak in service to the elderly in FY 77 with nearly two thirds of all commitments for housing assistance for elderly units. More than half of the new construction developed in conjunction with Section 8 rental assistance has been for the elderly. In order to promote more new construction in rural areas, the Section 8 program is being coordinated with the Farmers Home Administration's Section 515 program (see discussion below).
Farmers Home Administration Housing Programs
Farmers Home Administration, Section 502: As shown above, the HUD programs have been less successful in rural areas than in metropolitan areas. The Farmers Home Administration is better structured administratively to deal with rural areas, but its programs are not focused exclusively on the elderly. Section 502 provides direct loans to rural low and moderate income families for construction, rehabilitation, repairs or the purchase of existing housing. The interest rate on the loan is generally below the market rate, but low income homeowners may be eligible for an extra interest subsidy. For moderate and higher income families unable to obtain a reasonable private loan there is a Guaranteed Loan Program. Even though Section 502 has been a large program with over 800,000 loans made through FY 78, less than 3 percent of them have gone to the elderly. The regulations were recently revised to permit loans for the addition of separate, independent living unit to be added onto the family dwelling for senior relatives. While the program also has the potential of facilitating repairs for elderly homeowners, who have relatively old homes, perhaps the financial burden is still too great for many to benefit.
Section 504: Direct loans of up to $5,000 are made for home repairs necessary to remove health hazards and to make the hate safe and sanitary. The terms are 1 percent interest for up to 20 years. Very low income homeowners are eligible. The loan can be combined with a grant for an applicant 62 years old or more with insufficient income to repay the full cost of the needed repair. Or a straight grant can be given to an elderly person if warranted economically. Often the loans arid grants are used for adding cooking or toilet facilities.
Since close to 80 percent of the rural elderly own their own houses, the Section 504 program could be of substantial help to them; and indeed, in most years around 60 percent of these loans have been made to the elderly.32
Section 515: Initially this program was exclusively for the elderly, but legislation in 1966 included families, also. FmHA provides direct loans for the construction, purchase or improvement of rental or cooperative housing to be occupied by low to moderate income rural families and elderly persons. Generally the financing is for multifamily units and may include appropriate recreational and service facilities. Project sponsors include individuals, consumer cooperatives, State or local public agencies, limited partnerships and profit or nonprofit corporations. Loan terms include: an interest subsidy which can reduce the effective interest rate of 1 percent for nonprofit sponsors, the regular FmHA interest rate for profit-oriented sponsors, and a repayment period of 40 years or 50 years for projects specially designed for the elderly. About 63 percent for the units have been for the elderly. This Section is being used for the FmHA congregate housing program.
The rents required under this program, even with the interest subsidy, would be more than 25 percent of income for most elderly renters, so Congress in 1974 authorized special rental assistance payments. FmHA preferred to use HUD's Section 8 program. Critics claim that coordination between the two agencies was slow initially and is more cumbersome than if the loan and rental assistance programs were run by the same department.
Nursing Home Programs
Section 232, Housing Act of 1959: This program provides insurance for mortgages of up to forty years for private nonprofit or for-profit sponsors to build or rehabilitate nursing homes and intermediate care facilities. Loan insurance is also provided for the installation of fire safety equipment. Projects may be a single health care facility or may include a combination of related facilities, but not hospitals, clinics, diagnostic or treatment centers or homes for the aging. Occupancy is not limited by age, but is restricted to individuals needing SNF/ICF care. 1,241 project have been supported by this program and provide 141,505 beds.
Hill Burton: Unlike the HUD program to finance nursing homes, the HEW program provided grants as well as loans, but only to nonprofit and public sponsors. From 1956-1976, the Hill Burton programs contributed $209,708,178 in grants for 606 nursing home projects which provided 43,120 beds. (A single nursing home facility, over a period of time, could have more than one Hill Burton project.) From 1972-1976, direct loans were available to public sponsors and guaranteed loans to private, non-profit sponsors. A total of thirty projects supported the construction, addition or modernization of 2,992 long-term care beds, either in free-standing nursing homes or in long-term care facilities attached to general hospitals. There were six direct loans totalling $5,355,000 for 317 beds. Most of the assistance, $38,957,086 went as loan guarantees to 24 private projects for 2,675 beds.
Congregate Housing Program
HUD's Congregate Housing Services Programs: In 1978 Congress recognized the limitations in HUD's bricks and mortar approach to meeting the housing needs of the elderly and the lack of coordination between the housing programs and essential social services. It authorized HUD to make 3-5 year grants to Public Housing Agencies and Section 202 borrowers under which they can then fund a package of services, including meals, personal assistance and housekeeping, for their eligible elderly and handicapped residents. Initially, a renewable 4-year program of 3-5 year grants was authorized at $120,000,000. Actual appropriations in FY 79 and FY 80 were $10,000,000 each.
In 1979, 38 projects were funded -- 28 in public housing, 10 in section 202 housing. The local housing agency or housing sponsor will receive funds up to $100,000 per year for 3 years to provide (or subcontract for) services including at least 2 meals per day, 7 days per week and other services determined by a Professional Assessment Committee to be needed by the residents. The PAC must have a medical professional and at least two other members, who can be representatives of the residents' organization of the project as well as representatives of state and local programs for the aged and/or handicapped. Only 20 percent of project residents are eligible for the whole package of services, although all can participate in the meals at cost. The 20 percent limit will be waived for existing housing and very small projects. In 1980, about 20 projects will receive 5-year grants with a maximum of $80,000 annually.
Program priorities will place about 80 percent of the service funds in existing housing projects rather than with new construction. The elderly will receive about 80 percent of the funds, the rest will go to the non-elderly handicapped.
HUD will conduct a thorough evaluation of this program to determine, among other things:
- Its efficiency and effectiveness;
- Its success in preventing unnecessary institutionalization;
- The extent to which HUD/HHS coordination is achieved; and
- The extent to which the program avoids or duplicates existing programs.
Congregate Housing Demonstration
Farmers Home Administration in coordination with the Administration on Aging is supporting congregate housing demonstration at 10 diverse sites. Projects are under development now and will begin to open for occupancy shortly. The projects average about 35-45 units each. The model facilities carbine Section 515 loans with Section 8 rental assistance and AOA non-renewable grants of $2.5 million for 3 years.
At a minimum the project must provide: full or partial meal service, housekeeping and personal care services, transportation, and social and recreational activities. The purpose of the grant is to support a project director at each site who will seek community support for necessary services and to ensure their continuation beyond the grant period, provide outreach to the community, and help match the project design with the housing and service needs of the local elderly.
HUD Program for Deinstitutionalization of the Chronically Mentally Ill
This program was initiated in 1978 and is now operating in 39 States. The demonstration uses direct loan authority reserved under Section 202 in conjuction with a set aside of Section 8 funds to cover 100 percent of the approximately 2,000 units to be constructed or rehabilitated. Small, scattered site projects, such as group homes for 12 or fewer chronically mentally ill individuals or independent living complexes of 6-10 apartment units for no more than 20 individuals are the norm. Eligible residents include individuals 18 years or older with severe and persistent emotional or mental disorders which limit their functional capacities, but could be improved by more suitable housing conditions. Alcohol and drug addicts are not included. State social service agencies select appropriate residents.
In addition to selecting residents, States are expected to coordinate implementation of the program with sponsors and appropriate State and local supportive services. No HUD funds are available for those services. The State can apply to HHS for Section 1115 waivers on behalf of project sponsors to permit a more flexible use of supportive services.
WORKING PAPER #4: PROGRAMS AND FINANCING FOR LONG-TERM CARE SERVICES
A. Introduction
Increases in the public cost of long-term care in recent years have been phenanenal:
-
Medicaid nursing home expenditures rose 22 percent per year from 1974 to 1978.
-
Medicare home health expenditures rose 44.6 percent per year from 1975 to 1979.
In a time of rapidly increasing costs and scarce resources, an understanding of who pays how much, for what services, and for whom is essential. This paper provides a review of the present system and key financing issues.
A full discussion of current long-term care financing would have to take into account a very wide variety of public and private sources of funding for services to the chronically disabled; by one count, there are at least 80 Federal programs which benefit all elderly (both disabled and non-disabled) either directly or indirectly through cash assistance, in-kind transfers, or the direct provision of goods and services.33 Another source lists 150 federal programs which assist the handicapped by providing health, education, rehabilitation, income and housing.34 Since the range of services which provide assistance to the chronically disabled is broad, it is difficult to isolate how much is actually spent on long-term care from all sources. Further, without a more specific delineation of the services which should be considered long-term care, financing issues are not easily addressed in a comprehensive manner.
A review of the financing of long-term care is further complicated by the fact that many of the federal programs which fund the provision of long-term care services have not been exclusively designed to support services for the chronically disabled, apart from other needy population groups. In fact, discussions of the financing problems in long-term care frequently center on the inability of current programs, as they are presently organized, to meet the particular needs of individuals with chronic disabilities.35
Given these constraints, the following pages focus on those aspects of long-term care financing considered most salient by the Task Force: the relative roles of the public and private sectors in funding of services; the types of services covered and their coordination under major federal funding programs; and eligibility for Federally-financed long-term care services.
As background information, a brief summary description of selected federal programs which provide support for long-term care is provided in the accompanying appendices.
B. Public and Private Roles in Long-Term Care Financing
A central issue in the development of long-term care policy is the appropriate allocation of responsibility between public and private sources for financing services for the chronically disabled. This section examines the existing public/private role in financing long-term care, including the development of Federal programs and trends in public vs. private support of long-term care.
Federal Long-Term Care Programs
Although it is popularly believed that public financing of long-term care is a relatively recent phenomenon, there has always been a significant public role in supporting care of the chronically disabled. Colonial American communities, for example, appropriated substantial funds for the foster care of disabled persons without families or resources. Prior to 1935, however, government support was largely a state and local matter.
Expansion of the scope of Federal responsibility for the aged and disabled dates from the establishment of Federal matching grants to the States for Old Age Assistance and Aid to the Blind in Titles I and X, respectively, of the Social Security Act of 1935. These pension programs for the elderly and blind provided many with the means to purchase room, board and services in private boarding homes, rest homes and homes for the aged. Because benefit payments under these programs were forbidden to "inmates of public institutions," a pattern was established under which beneficiaries of public funding programs purchased services primarily from private providers.36
Title II of the original Social Security Act established the program of social insurance retirement benefits based on employee and employer contributions, now commonly referred to as "social security." In 1956, this program of social insurance benefits was extended to severely disabled workers and adult disabled children of deceased and retired workers. Amendments in 1960 and 1967 broadened the definitions of disability and the conditions under which an individual can became eligible for disability insurance benefits.
Payment patterns to institutions under the matching grants for old age assistance and aid to the blind have changed over the years as well. Amendments to the Social Security Act in 1950 repealed the prohibition against payments to residents of public institutions, and also permitted direct payments (called vendor payments) to providers of nursing care, in addition to beneficiary payments. Dramatic growth in vendor payments to nursing homes occurred in 1960 as a result of the Kerr-Mills program, with payments increasing almost ten times by 1965.
The Medicare and Medicaid program (Titles XVIII and XIX of the Social Security Act), established in 1965, provided health insurance to aged and low income individuals for a broad range of health-oriented long-term care services in a variety of institutional and noninstitutional settings. Funding for nursing home services incorporated many of the features of the Kerr-Mills program. Under Medicare and Medicaid, vendor payments provided with federal matching funds were made available to facilities offering extended care (Medicare) and skilled nursing services (Medicaid). These services, however, were defined primarily as health rather than custodial care. Under Medicare, payments were to be made only for a period of post hospital convalescence, provided that skilled nursing services were required. Medicaid, as an expanded version of the Kerr-Mills program, continued the provision of federal matching funds on a vendor-payment basis for skilled nursing services to cash assistance recipients and, in some states, to the medically indigent.
A definition of the skilled nursing services benefit was not included in the original Medicaid legislation. Interim Medicaid standards adopted in 1967 relied on existing state standards, developed under the Kerr-Mills program. To broaden the types of facilities eligible for reimbursement in states participating in Medicaid, vendor payments for a lower skilled level of care within intermediate care facilities (ICF) were initiated in 1967 under Title XI of the Social Security Act. In 1971, funding for ICF care was transferred to Medicaid.
Intermediate care (under Title XI) was initially defined by the states to include facilities providing more than room and board, but less than skilled nursing care. The Medicaid definition of facilities offering this level of care called for the provision of health related care to individuals who did not require hospital or skilled nursing services, but who required care which could only be made available through institutional services. Subsequent legislative action has further refined the definition of skilled and intermediate levels of care and the conditions under which these services should be offered.
In addition to providing expanded coverage for nursing home care, the Medicare and Medicaid programs extended funding for have health services. Medicare home health benefits include part-time or intermittent nursing care; physical, occupational or speech therapy; medical social services; part-time or intermittent home health aide services; medical supplies; and in some cases hospital-based medical services. Originally an optional benefit under Medicaid, home health services became a required benefit in 1970. There is no legislative definition of home health services in the Medicaid legislation. Most states fund services which are similar to those provided under Medicare, although specific criteria for service eligibility are slightly broader.
In 1965, another law was passed which provided for public funding of long-term care services, the Older Americans Act. The purpose of the programs funded under this legislation has been to enable older persons to live in their own homes as independently as possible. Emphasis is placed on the planning, coordination and development of services. Funding is also provided for the direct delivery of services such as meals, chore services, home repair and transportation.
An additional component of the evolving federal role related to funding of long-term care services is the Title XX program. Developed as part of the 1975 amendments to the Social Security Act, Title XX consolidates funding for social service programs from various titles within the Social Security Act. The program operates as a grant-in-aid program under which states are able to provide a range of social services to population groups determined to be eligible under federal and state criteria. Services made available vary by state and include a number of home-based and community services.
Other federal programs provide funding for long-term care services both directly and indirectly. For instance, the Veterans Administration supports a comprehensive program of long-term care benefits for veterans, and the, Department of Housing and Urban Development operates programs which provide housing assistance to the elderly and the disabled. Taken together, these programs represent a major commitment to financing long-term care. The exact magnitude of that commitment, however, cannot be determined at this time.
Public and Private Expenditures
Table I summarizes the total expenditures under the major federal programs which finance long-term care services. It is not possible to isolate the extent of long-term care spending from these data. Proportional spending for various types of services can be obtained, but relative spending for services directed specifically towards the long-term care population is not known.
For example, the figures in Table I show that the Old Age and Survivors Insurance (OASI) program represents the largest category of Federal expenditures compared with the other programs shown. Not all OASI beneficiaries, however, are disabled by chronic conditions. Of those who are, many probably rely on the social security insurance benefits to purchase certain long-term care services. As another example, both persons who are and those who are not chronically disabled obtain funding for health services from the Medicare and Medicaid programs.
It is even more difficult to assign a dollar figure to total private spending for LTC than to public support, for two reasons: existing data collection systems are oriented towards Federal and State programs rather than private sources and a significant source of long-term care is services provided to disabled individuals by friends and family, the costs of which are usually hidden because they are not translated into money transactions.
| TABLE I. Service Expenditures for Selected Federal ProgramsFY 1978 (in millions of dollars) | ||||||||
| Social Security | Older Americans Act3 | Veterans Admin.1 | ||||||
| Title XVIII(Medicare)1 | Title XIX(Medicaid)1 | Title II | Title XVI(SSI)2 | Title XX3 | ||||
| Old Age Survivors2 | Disability Insurance2 | |||||||
| INCOME MAINTENANCE | $53,255 | $10,315 | $6,552 | |||||
| BASIC LIVING SERVICES | ||||||||
| TransportationHousing Meals Chore Services (Homemaker/Health Aide) | $71$28$22$481 | $19$3$247$17 | ||||||
| DEPENDENCY SERVICES | ||||||||
| Day Care Home Health | $548 | $160 | $34 | |||||
| ILLNESS/DISABILITY SERVICES | ||||||||
| Nursing Home Care Physician ServicesHospital Services | $396$5,548$18,275 | $7,246$2,054$6,854 | $281$57$4,141 | |||||
| TOTAL ALL PROGRAM EXPENDITURES | $24,918 | $18,365 | $53,255 | $10,315 | $6,552 | $3,725 | $439 | $4,943 |
| ||||||||
However, it is possible to identify some significant trends in the relationship between Federal programs and private expenditures for long-term care by examining the case of nursing homes. Private payments for nursing home care were 65 percent of all payments in 1965. As shown in Table II, the private proportion of nursing home care costs in relation to public expenditures declined steadily until the mid-70's, but has remained relatively stable at 42-43 percent in recent years.
| TABLE II. Expenditures for Nursing Home Care (millions of dollars) | ||||||||
| 1972 | 1973 | 1974 | 1975 | 1976 | 1977 | 1978 | 1979 | |
| Total Payments | 6,457 | 7,217 | 8,567 | 10,105 | 11,390 | 12,810 | 15,102 | 17,807 |
| Private Payments | 3,418 | 3,581 | 3,960 | 4,424 | 5,054 | 5,478 | 6,463 | 7,705 |
| Public Programs | 3,039 | 3,636 | 4,607 | 5,681 | 6,366 | 7,332 | 8,639 | 10,102 |
| % Private | 52.9% | 49.6% | 46.2% | 43.8% | 44.4% | 42.8% | 42.8% | 43.4% |
| Input Price Index | 0.681 | 0.719 | 0.799 | 0.877 | 0.939 | 1.000 | 1.090 | 1.195 |
| Real Total Payments | 9,482 | 10,038 | 10,722 | 11,522 | 12,130 | 12,810 | 13,855 | 14,901 |
| Real Private Payments | 5,091 | 4,981 | 4,956 | 5,045 | 5,382 | 5,478 | 5,929 | 6,447 |
| SOURCE: Office of Research, Demonstration and Statistics, HCFA; 1980. | ||||||||
Growth in public expenditures has occurred both because of an increase in the number of persons receiving benefits under public programs, and because of increases in payments per recipient. Between 1973 and 1977, the Medicaid program has accounted for between 78-85 percent of all public expenditures for nursing have care. As indicated in Table II, Medicaid expenditures for nursing have care more than doubled in the four years between 1973 and 1977. This was due in part to an average annual increase in payments per recipient of over 15 percent. In real terms, Medicaid payments grew 48 percent over this period, relative to real growth in private expenditures of only 10 percent over the same period.
This inflation in the nursing home sector (along with even more rapid inflation in home health services) has serious implications for the public and private role in financing long-term care. First, more rapid inflation in nursing home services than in the general economy means fewer people can pay for services privately, placing increasing pressure on public budgets. Rapidly increasing costs increase the rates at which individuals exhaust private resources and increase the probability that Medicaid will have to pay the nursing home bill. Also, available data indicate that although nursing have care costs per resident were approximately $8,011 in 1975, average per capita income for those over 65 was only $5,349. While the majority of nursing have patients initially use private funds, a substantial proportion convert to public sources of payment after exhausting personal resources during the first year.
This diminution of private ability to finance LTC services is a matter of serious concern; to the extent that the public nursing home bill absorbs additional resources, it will be more difficult to target funds on alternatives to nursing home care and other possible system changes.
C. Coverage and Coordination of LTC Programs
In order to begin to identify needs for long-term care policy change, it is necessary to understand certain key characteristics of the present group of programs which finance long-term care--specifically,
- what is the range of types of services covered;
- do program design requirements pranote or inhibit coordination of services to meet individual needs?
These questions are addressed in this section.
Range of Services Covered
As shown in Table III, selected major Federal long-term care programs address each of the three identified types of services: illness/disability services; mobility assistance/basic living; and personal care. However, the extent to which specific services are available in a variety of settings and the types of services supported within these broad categories is less clear.
The categories incorporate less skilled assistance provided in the bane as well as formally organized services offered in specialized settings. Meals, for example, can be delivered to community residences or can be provided in congregate dining facilities. Monitoring, as another example, can include sitter services, respite care or check-in systems. It can also be part of the services automatically provided in group homes or nursing homes. Alternatively, some programs limit services to specific settings; Medicaid does pay for housing, meals, and housekeeping in nursing homes, but does not reimburse these services for individuals living in the community.
In principle, a comprehensive range of services is covered by Federal programs. In practice, actual coverage is determined by level of funding and program design features discussed below.
Two conclusions which have frequently been drawn in the long-term care literature are that:
-
Spending for health services is much greater than spending for social services.
-
Spending for nursing home care is substantially larger than spending for home health and home-based chore services.
Some evidence can be cited in support of those conclusions. For example, total federal expenditures specifically allocated for nursing home care were over ten times the expenditures specifically allocated for have health in 1978. Further, the entire federal share of Title XX, including the costs of all social programs, was only about half of the federal share of nursing home costs in the same year. Nevertheless, the conclusions commonly drawn from such isolated facts cannot be easily substantiated.
| TITLE III. Federal Programs Which Fund Long-Term Care Services | ||||||
| Social Security Act | Older Americans Act | Veterans Admin. | Congregate Housing Services Program | |||
| Medicare | Medicaid | Title XX | ||||
| ILLNESS/DISABILITY SERVICES | ||||||
| Rehabilitation Nursing Skilled Intermediate General Medical | ** X X | * X X X | * | X | X X X X | |
| INCOME MAINTENANCE | ||||||
| MOBILITY ASSISTANCE, BASIC LIVING SERVICES | ||||||
| Transportation Shelter Food Housekeeping | * * * * | X X X X | X | X X X | ||
| PERSONAL CARE SERVICE | ||||||
| Monitoring/Supervision Personal Care | ** | * | * | X X | X X | X |
| * Varies by State ** With Skilled Nursing (Adopted from a chart compiled by William Scanlon, et al., Long-Term Care: Current Experience and a Framework for Analysis, Washington, the Urban Institute, February, 1970.) | ||||||
One problem is that the indirect use of public dollars provided through the social security program for long-term care services in institutional or community settings cannot be calculated. Further, some services financed under health care programs are actually "basic living services." For example, money spent on nursing home care pays for food and housing as well as nursing. How much of the nursing have bill should then be attributed to "social service" expenditures? As a further example, more federal money was spent in 1978 on Disability Insurance than on nursing home care (Table I). Presumably the recipients spent much of this on "basic living services." Finally, the extent to which the patterns of expenditure are appropriate is difficult to judge without more detailed analyses of population needs and service effectiveness.
Coordination of Long-Term Care Programs
Since no single program funds a comprehensive array of long-term care services, the effectiveness of coordination across programs is a central issue in the consideration of policy change. Individual program service definitions, design of benefits, and interrelationships between eligibility requirements, all have implications for the appropriateness of services to individuals and cost-effectiveness of a long-term care system.
With respect to service definitions, some obvious inefficiencies are created by differences in the way programs define, for reimbursement purposes, what would appear to be the same basic service. For example, the sane provider might offer homemaker/health aide services under Medicare, Medicaid, and Title XX but allowable service components and charges will differ. Some have noted that, as a result, services offered within a broad category (e.g., home health care) are tailored to Federal/State program definitions rather than individual need.37
Other program design requirements may, also have adverse consequences for access to services. For example, since Medicare requires that have health agencies provide skilled nursing care and at least one other therapeutic service, home health agencies in certain rural areas which are not able to recruit specialized personnel are not able to receive Medicare funding.38
Improving long-term care program coordination at the Federal, State, and local levels has long been sought by the Department of Health and Human Services. However, the success of coordination efforts has been limited by the inherent difficulty in achieving a balance between uniformity in service definitions, standards and/or reimbursement procedures and flexibility at the local level to enable service providers to respond to particular needs.
D. Eligibility
General Principles
The various principles underlying eligibility for major DHHS programs which fund long-term care services may be derived from Table IV. As can be seen, eligibility is variously defined by age (Medicare, Old Age and Survivors Insurance, Title XX, SSI), condition (Medicare, Disability Insurance, SSI) or a combination (e.g., Medicaid ICF/MR). The income standards used by each state to determine eligibility for these latter programs are highly variable.
The use of age, and particularly age 65 as a criterion for long-term care benefits is increasingly being challenged. Although a greater proportion of elderly persons compared to other age groups require long-term care services, there are more young people than elderly in the long-term care population. Further, the use of any particular age as a criterion for service eligibility is arbitrary since at any age there will be, needy persons who will be too young to qualify for benefits.39
At the same time, some believe that more efficient targeting of services within older age groups is essential. Two recent reports have recommended that the focus of long-term care service delivery should center around those who are 75 and over, the so-called "frail elderly."40 As the House Select Committee on Aging has noted:
It is our contention that if this country attempts to serve all seniors equally through its fragile Aging Network, it will actually be able to serve only a few, and not very well at that. Our policy must realize that those truly in need--the 75+ population -- have first rights and must be the focus of future aging policy.41
Others have urged that entitlement for services be determined on the basis of functional disability rather than age, recognizing that current instruments for measuring levels of functional impairment or limitation need to be further developed.42
More general discussions have focused on the issue of universal entitlement with sliding fees (based on age or other criteria) vs. income-based services eligibility. Both means of eligibility determination are currently used in Federal programs. Debate has centered around expanding the role of one or the other method for financing particular services or services delivered in particular settings. To some, long-term care services are be entitled and which public financing programs should be expanded to cover, wholly or on a sliding fee basis.43 Others argue that for the most part, public funding for long-term care services should be reserved for those who are least able to obtain these services because of low income.44
Another area of debate has focused on the income levels which are most appropriate in determining income-based eligibility. For example, the variability in income standards employed by different states for Medicaid demonstrates that there is no clear consensus on the level of income below which public assistance should be provided.45 Proposals have been made to establish minimum "floors" to which all states must adhere. To date, however, none of these proposals has been adopted for program funding related to long-term care services, with the exception of the Supplemental Security Income program.
| TABLE IV. Eligibility Standards for Specific Target Groups for Titles III, XVIII, XIX, XX, and SSI, OMHC Programs | ||||||
| Title III or Older Americans Act | SSI, Title XVI of SS Act | Medicare, Title XVIII of SS Act | Medicaid, Title XIX of SS Act | Title XX of SS Act | OMHC | |
| Aged | 60+ individuals in greatest economic and social need.1 | 65+ | 65+ | Same criteria as for SSI in 35 states. | Each state defines target populations in its own way.3 | No specific emphasis or exclusion. Programs establish their own fee schedules. |
| Blind | Emphasis on vulnerable elderly.1 | Eligible if meet specific visual acuity standards. | Eligible if entitled to certain social security disability or railroad retirement benefits. | Same as above. | Same as above. | Same as above. |
| Disabled | Same as above. | Eligible if unable to work for specified time as result of disability. | Same as above. | Same as above. | Same as above. | Same as above. |
| Mentally Disabled | Same as above. | Eligible if meet specified IQ standard for levels of functioning. | Same as above. | Same as above. Special provision low-income mentally retarded. | Same as above. | Focus is on young adults. |
| Special Groups | None. | Children with impairments comparable to these specified for adults. | People requiring dialysis or kidney transplants, and in social security or railroad retirement programs. | Same as above. | Same as above. | None. |
| ||||||
Variations in Eligibility
Not only do the different Federal programs provide funding for a varying scope of long-term care services, and for different types of particular services, but eligibility requirements vary so that the same individual may have access to one needed service and not another. To make the situation even more complicated, eligibility for certain services can differ by state or community within single programs; for example, in some states, counties determine service eligibility criteria for the Title XX program, and eligibility for Medicaid varies greatly from state to state. Table V presents examples of variation in eligibility standards among selected. states for similar services.
As a consequence of such disparities, an individual who is eligible for long-term care social services under Title XX may not qualify for long-term care health benefits under Medicaid. These different eligibility criteria reflect basic strategies and purposes inherent in the various Federal programs.
| TABLE V. Title XIX and Title XX Comparison of Income Eligibility Levels (as of January 1979)* | |||
| State | Services | Medicaid-Medically Needy Levels for Family of Four | Title XX - Derived "Monthly" Eligible Income Levels for Family of Four |
| Colorado | Home Management | No Medically Needy Levels | $1,245.00 |
| D.C. | Homemaker | $325.00 | $1,032.00 |
| Idaho | Homemaker | No Medically Needy Levels | $1,107.00 |
| Kentucky | Homemaker | $316.66 | $1,084.00 |
| Louisiana | Homemaker and Chore | $233.00 | $795.00 |
| Maine | Homemaker | $450.00 | Income Maintenance Only |
| New Jersey | Homemaker-Home Health | No Medically Needy Levels | $1,427.00 |
| North Dakota | Homemaker-Home Health Aide | $443.00 | $1,534.00 |
| Ohio | Homemaker-Home Health Aide | No Medically Needy Levels | $880.00 - $1,280.00 |
| South Dakota | Home-Home Health Aide-Chore | No Medically Needy Levels | $1,105.00 |
| Iowa | Homemaker | No Medically Needy Levels | $1,045.00 |
| Indiana | Home Health Aide | No Medically Needy Levels | $797.00 |
| Texas | Health | No Medically Needy Levels | Income Maintenance Only |
| Virginia | Health | $291.66$316.66$358.33 | $802.00 |
| * For Services Containing Home Health Aide Under Title XX. | |||
In some cases, the fact that some are eligible for public funding for certain services and not for others may present no difficulties because these individuals may be able to pay for services on their own. In other situations, the result may be an unmet need for particular types of long-term care. Numerous studies have shown that clear differences in services utilization can be seen between eligible and non-eligible groups of individuals.46 Given current data, however, it is not possible to determine the full extent to which appropriate levels of long-term care services utilization have been reduced by present eligibility standards.
A related issue is whether limits on eligibility for federally-funded long-term care bias the utilization of types of services. Discussions on this topic have focused particularly on eligibility requirements for nursing homes and have health services under federal funding programs.
With regard to eligibility for nursing have services, it is argued that eligibility policies in the Medicaid and SSI programs create financial incentives for persons to enter nursing homes rather than remain within the community.47 There are various ways in which an individual can become eligible for Medicaid benefits in nursing homes while not being eligible for these benefits in the community:
- in states with medically-needy programs, or "spend down" provisions of Medicaid, individuals may qualify for Medicaid in nursing homes because the cost of their basic living needs is considered a "medical" expense and depletes their income more rapidly;48 and
- in 15 states without medically needy programs, some individuals may receive Medicaid benefits in nursing homes but not in the community because income levels for Medicaid eligibility for outpatient care are more restrictive.49
Long-term care eligibility requirements may inhibit family care of the disabled individual to an unknown extent. Program requirements which could have this effect include, e.g.:
- a dependent or spouse living with relatives may have a family income level which is too high to qualify the individual for Medicaid. When institutionalized, however, this same individual would became independently eligible for benefits; and
- cash support and Medicaid coverage is reduced if an individual lives with or receives support from family or friends who have no legal obligation to provide such support.
A second major area of concern pertains to eligibility standards for home health services.50 Under current Medicare law, eligibility for home health services is extended only to individuals who are homebound, who have a primary need for "skilled" nursing care and who require these services on a part time or intermittent basis. In many states, Medicaid programs apply the same eligibility requirements. Eligibility procedures and the scope of in-home services under Title XX vary by state. By law, in-home services under Title XX are directed more to social service needs than to health needs.
Numerous proposals have been put forth to expand the criteria for have health services eligibility. One major criticism of current program definitions of home health services eligibility is that they do not realistically cover the situations under which many individuals require such services. The Task Force has begun to examine these and other issues related to eligibility standards, eligibility determinations and the treatment of income and assets. Some states have also begun to reform their policies in this area. Continued work will be necessary to resolve questions of cost, appropriateness, and equity.
APPENDIX 4-A. SELECTED HIGHLIGHTS OF LEGISLATIVE ACTIVITY RELATED TO LONG-TERM CARE
| 1935 | SOCIAL SECURITY ACT Provided a legislative base for social insurance, public assistance and social service programs. Introduced the concept of Federal responsibility for social welfare programs. |
| 1950 | AMENDMENTS TO THE SOCIAL SECURITY ACT Expanded categories of public assistance and provided for a program of direct reimbursement (vendor payments) to hospitals and physicians for care of beneficiaries. Required participating states to establish licensing programs for nursing homes. |
| 1954 | HILL-BURTON PROGRAM AMENDMENTS Provided funding to public and nonprofit entities for the construction of nursing homes. Promoted development of nursing home standards regarding physical construction, facility design, and staffing patterns. |
| 1956 | AMENDMENTS TO THE SOCIAL SECURITY ACT Encouraged the expansion of vendor payments to nursing homes by establishing a separate Federal match for these payments. |
| 1957 | AMENDMENTS TO THE SOCIAL SECURITY ACT Established a program of cash benefits for totally disabled workers. |
| 1960 | KERR-MILLS PROGRAM Provided a more generous Federal match for vendor payments for a wide range of services including "skilled nursing have services." Established the concept of medical indigency apart from a need for old age income assistance. |
| 1965 | MEDICARE - MEDICAID PROGRAMS (P.L. 89-97) As part of broad health insurance benefits made available to those over 65 years of age through Medicare, provided an "extended care" facility benefit. To those meeting specified income criteria, offered skilled nursing have services through Medicaid. Limited home health services were also made available under Medicare for posthospital homebound patients. |
| 1965 | THE OLDER AMERICANS ACT Provided assistance for community planning, service delivery and training to assist older persons. |
| 1966 | AMENDMENTS TO THE SOCIAL SECURITY ACT (P.L. 89-713) Assured for-profit extended-care facilities a reasonable return on net equity. |
| 1967 | AMENDMENTS TO THE SOCIAL SECURITY ACT (H.R. 12080) (P.L. 90-248) Established standards to improve the efficiency and quality of services in nursing homes. Created a program of professional medical review of utilization patterns within nursing homes. |
| 1971 | AMENDMENTS TO THE SOCIAL SECURITY ACT (H.R. 10604) (P.L. 92-233) Added coverage of intermediate care facilities and institutions for the mentally retarded as optional services under Title XIX (Medicaid). |
| 1972 | AMENDMENTS TO THE SOCIAL SECURITY ACT (P.L. 92-603) Extended coverage under Medicare to the disabled. Combined Medicare "extended-care" facilities and Medicaid "skilled nursing" homes into a single service category -- the skilled nursing facility. Established Professional Standards Review Organizations. Created the Supplemental Security Income (SSI) program to provide cash assistance to the aged, blind and disabled. Required payment to skilled nursing facilities and intermediate care facilities under Medicaid on a reasonable cost related basis. |
| 1972 | AMENDMENTS TO THE OLDER AMERICANS ACT Established a nutrition program for the elderly under Title VII of the Older Americans Act. |
| 1973 | AMENDMENTS TO THE OLDER AMERICANS ACT Required state to designate Area Agencies on Aging to develop and implement area plans. |
| 1975 | MEDICARE DEADLINE AMENDMENTS (P.L. 94-182) Required skilled nursing facilities participating in the Medicare and Medicaid program to meet the 1973 Life Safety Code as opposed to the 1967 Life Safety Code. Facilities already qualified under the 1967 code or state codes did not lose their eligibility to participate in the programs. |
| 1975 | AMENDMENTS TO THE OLDER AMERICANS ACT Specified four national priorities (transportation, home services, legal and other counseling services and residential repair and renovation programs) for which states were obligated to spend a minimum amount of their allotted funds. |
| 1975 | AMENDMENTS TO THE SOCIAL SECURITY ACT (P.L. 93-647) Consolidated funding for social services into Title XX of the Social Security Act. |
| 1977 | MEDICARE - MEDICAID ANTIFRAUD AND ABUSE AMENDMENTS (P.L. 95-142) Encouraged detection and prevention of fraud and abuse in the Medicare and Medicaid programs by requiring increased disclosure of information, institution of uniform reporting systems and strengthened penalty provisions. |
| 1978 | AMENDMENTS TO THE OLDER AMERICANS ACT (P.L. 95-478) Consolidated Titles III, V and VII while providing separate authorizations for social services, congregate meals and for home-delivered meals. |
| 1980 | AMENDMENTS TO THE SOCIAL SECURITY ACT (P.L. 96-499) Authorized the Secretary to enter into agreements with snail, rural hospitals to use their beds on a "swing" basis, as acute care or long-term care, depending on the need. Also authorizes swing bed demonstrations for large and/or urban hospitals. Required reimbursement according to level of care for hospital patients awaiting nursing home placement. Authorized the Secretary to impose intermediate sanctions in lieu of decertification where nursing facilities are out of compliance with conditions of participation. Authorized the Secretary to "look behind" a State survey of an ICF or SNF where there is cause to question the adequacy of the State's determination. Eliminated the 3-day prior hospital stay requirement for Medicare patients needing home health services under Part A. Deleted the $60 deductible for home health benefits under Part B of Medicare. Provided Medicare coverage for unlimited home health visits. Included the need for occupational therapy as a qualifying criterion for home health benefits. |
APPENDIX 4-B. SELECTED FEDERAL PROGRAMS SERVING THE LONG-TERM CARE POPULATION
SOCIAL SECURITY (Social Security Administration, DHHS)
The Social Security Act, initially passed in 1935, is the foundation upon which most federal income assistance and services assistance programs are based. Persons eligible for monthly social security cash benefits include:
- Disabled insured workers under age 65.
- Retired insured workers age 62 or over.
- Spouses of retired or disabled workers entitled to benefits who:
- Are age 62 or over; or
- Have in their care the worker's child who is under 18 and entitled to social security benefits.
- Divorced spouses (in some cases) of retired or disabled workers entitled to benefits if age 62 or over and married to the worker for at least 20 years. For benefits payable after 1978, the 20 years is reduced to 10 years.
- Dependent, unmarried children of retired or disabled workers entitled to benefits, or of deceased insured workers if the child is:
- Under age 18;
- Age 18 or over but under a disability which began before age 22; or
- Age 18 - 21 and attending school full time.
- Surviving spouses (including a surviving divorced wife in some cases) of deceased insured workers if the widow or widower is age 50 - 59 and becomes disabled within the period specified in the law.
- Surviving spouses (including the surviving divorced spouse in some cases) of deceased insured workers, regardless of age, if they have in their care an entitled child of the deceased who is under 18 or disabled.
- Dependent parents of deceased insured workers age 62 or over.
The primary insurance amount paid to beneficiaries is calculated as on the basis of average wages earned.
In November, 1980, average Social Security benefits were:
- $333 a month for a retired worker alone
- $567 a month for a retired worker and spouse
- $311 a month for a aged widow
- $355 a month for a disabled worker
- $728 a month for a disabled worker, with spouse and one or more children.
OLD AGE AND SURVIVORS INSURANCE (OASI)(Social Security Administration, DHHS)
The Old Age and Survivors Insurance Program (Title II of the Social Security Act) is the retirement insurance benefit program established in 1935 under the Social Security Act. For workers with sufficient quarters of coverage, full retirement benefits are paid at age 65, or at the worker's option, permanently reduced benefits may begin at age 62. Additional benefits are provided to the dependents of retired workers. Survivor benefits are also provided to dependents of deceased workers.
As with disability insurance, benefits are determined on the basis of average covered earnings.
DISABILITY INSURANCE (DI) (Social Security Administration, DHHS)
The Disability Insurance Program (Title II of the Social Security Act) began in 1957 as a Federal program of cash benefits for totally disabled workers. For those workers who have sufficient quarters in covered employment, eligibility for benefits is based on inability to engage in any substantial gainful activity, as determined by the monetary level of income earned.
Disability must be caused by a medically determinable physical or mental impairment that has lasted or is expected to last at least 12 months or to result in death. Determinations of disability are made on the basis of the medical severity of the impairment as indicated by clinical and laboratory findings. Eligibility is also extended to the dependents of workers found to be disabled.
The states through designated agencies have responsibility for making determinations of eligibility for disability benefits.
SUPPLEMENTAL SECURITY INCOME (SSI) (Social Security Administration, DHHS)
The Supplemental Security Income Program (Title XVI of the Social Security Act) was initiated in 1974 as an income and resource-tested income maintenance program for the needy aged, blind and disabled. The SSI program replaced and consolidated earlier Federal matching grant adult assistance programs. Eligibility for SSI benefits includes all persons who are aged, blind or disabled who meet the standard for low income. As in the Disability Insurance program, disabled persons are defined as those unable to engage in any substantial gainful activity by reason of any medically determinable impairment.
Benefits provided to individuals are based on the amount of other income received, including earned and unearned income. Higher payments (one and a half times the amount for an individual) are made to couples if both spouses are either aged, blind or disabled.
As of July 1980, minimum guaranteed incomes under SSI are $238 a month for an individual and $357 a month for a couple, assuming SSI program requirements are met. In addition, states may provide supplementary payments for various types of special living arrangements, including congregate care or personal care.
MEDICARE (Health Care Financing Administration, DHHS)
The Medicare Program (Tile XVIII of the Social Security Act) began in 1966 as a Federal health insurance program for Social Security beneficiaries who are 65 years of age and older. In addition to these beneficiaries, eligibility for Mediare benefits now includes persons who are permanently disabled (receiving disability insurance benefits), dependents of the permanently disabled and persons suffering from end-stage renal disease.
The program has two separate but coordinated parts:
- Hospital insurance (Part A) -- covers inpatient hospital services; which may include semi-private room, meals, regular nursing services, operating room, special care units, drugs and medical supplies, laboratory tests, and rehabilitation services; extended care in a skilled nursing facility; and services in the home through a participating home health agency.
- Supplementary medical insurance (Part B) - optional coverage for those choosing to enroll -- covers physicians' services, outpatient hospital services, diagnostic tests, outpatient physical therapy, speech pathology services, medical equipment and supplies, and home health services.
MEDICAID (Health Care Financing Administration, DHHS)
The Medicaid Program (Title XIX of the Social Security Act) began in 1966 as a joint Federal-state program to provide medical assistance to persons with low income, including the aged, blind and disabled. Eligibility for Medicaid benefits extends at a minimum to all persons receiving cash assistance under various welfare programs (Aid to Families with Dependent Children and, with certain exceptions, Supplementary Security Income). About half of the states have opted to provide benefits to other low-income persons such as the "medically needy," those whose incomes are too high to qualify then for welfare, but too low to cover their medical expenses. (For persons in the community, but not in nursing homes; income levels can extend up to 133 percent of the state's AFDC grant adjusted for family size. For persons in nursing homes, income levels can be set up to 300 percent of the SSI payment standard.)
The program is administered by 49 of the states with Federal matching grants determined on the basis of state per capita income. The average Federal share of state Medicaid costs is 55 percent.
Services provided under Medicaid include:
- Required services -- physician, hospital and skilled nursing home care; health screenings and followup treatment for children; laboratory and X-ray services; home health care services; family planning services; and rural health clinic services.
- Optional services -- dental care, eyeglasses, clinic services, prescribed drugs, care in an intermediate care facility and services by optometrists, podiatrists, and chiropractors.
OLDER AMERICANS ACT (Administration on Aging, DIMS)
The Older Americans Act, initially passed. in 1965, was designed to encourage the development of comprehensive and coordinated social service systems for the elderly. Under this legislation, a network of area-wide agencies on aging has responsibility for planning and funding the provision of a broad range of social services. Eligibility for services under the Act is extended to all persons 60 or over, without regard to income.
A major focus of the program is the planning and coordination of services, including health, housing, labor, transportation, and social services. Direct services provided under the Act are, in-home services, congregate meals, residential repair and renovation, legal services, transportation, information and referral, escort and outreach services. Particular services available in given communities depend on funding available and locally determined service priorities.
TITLE XX (Office of Human Development Services, DHHS)
Social service programs funded under the Social Security Act were consolidated into Title XX in 1975. This program serves as a grant-in-aid program under which states are able to provide a range of social services to population groups determined to be eligible. Eligibility for services, determined at the state level, is typically based on income requirements although certain services (protective services, family planning and information/referral) may be provided universally. At least half of the population served under Title XX must be low income. Close to half (48%) of all Title XX resources in 1979 were provided to persons participating in the AFDC and SSI programs.
Title XX funds are distributed to the states as block grants on the basis of population. For all services except family planning and child day care, states are required to provide 25 percent matching. Total Title XX expenditures are currently limited by a permanent ceiling.
Services provided under Title XX vary by state. The general goals to which services must be addressed, by legislation, include:
- self support;
- self sufficiency;
- protection of children and vulnerable adults from abuse, neglect, or exploitation, and strengthening family life;
- prevention or reduction of inappropriate institutional care by providing for community-based care, home-based care, or other forms of less intensive care; and
- provision of institutional care when appropriate, and services to individuals in institutions.
Services provided can include home health aide services, homemaker services, chore services, home management services, have delivered meals, day care services, housing services and transportation.
VETERANS ADMINISTRATION (VA)
The Veterans Administration provides a full range of health benefits to certain veterans. Eligibility for services is broad, encompassing:
- veterans with injuries incurred in the line of duty;
- veterans discharged or retired for a disability incurred in the line of duty or those receiving compensation and requiring treatment for a non-service-connected condition;
- veterans who were not discharged or retired because of a service-connected condition but who are (a) unable to pay, or (b) over 65.
Wives and children of veterans with permanent, total service-connected disabilities and widows or children of veterans who have died as a result of a service-connected disability are also eligible for services.
Services are provided to veterans directly through the VA or through contract in hospitals, nursing homes, psychiatric and domiciliary facilities. Specific services provided include inpatient care, skilled and intermediate nursing care, psychiatric services, domiciliary care, social services and rehabilitation.
The Veterans Administration also provides monthly benefits to housebound and bedbound veterans for the purchase of "aid and attendance" service. Small monthly payments are also made to veterans with mobility limitations who are housebound.
VOCATIONAL REHABILITATION (VR) (Department of Education)
The Vocational Rehabilitation Program, established under the Rehabilitation Act of 1973, provides rehabilitation services to physically and mentally disabled persons in order to prepare them for work. Eligibility for services is extended to all those with physical or mental impairments who have reasonable expectation of obtaining employment as a result of vocational rehabilitation. Within this broad definition, states set their own standards for services eligibility. Fur the most part services are provided to non-elderly adults. Additional Federal' funds are available to rehabilitate beneficiaries of DI and SSI.
Services provided are comprehensive including evaluation, counseling, placement, training, physical and mental restoration services and transportation. Funding may also be provided for hospitalization, convalescent or nursing home care, prosthetic, orthotic or other assistance devices, education, attendance services, interpreter services for the deaf, and specially outfitted vehicles.
WORKING PAPER #5: DYNAMICS OF THE CURRENT SYSTEM
A. Introduction
Other Working Papers in this series deal with separate elements of the long-term care "system". In order to understand reasonably well the potential impact of programmatic changes one would ideally like to understand the dynamics of the system -- how the elements interact. Current understanding is very limited.
In order to begin focusing on the complexities of system dynamics, however, the Task Force examined two related topics: (1) the supply of selected services and settings and (2) the "cost effectiveness" of selected "alternatives."
B. The Supply of Long-Term Care Services and Settings
Need, Demand and Utilization
The relationship between need and actual resource use is not straightforward. There are many determinants of utilization other than functional disability, such as individual choice, the availability of services, and costs. The translation of functional disabilities into service needs is attenuated by personal circumstance and is highly subjective. The following definitions serve to clarify the distinction between need and utilization, and the important concept of demand:
-
Need: As generally defined by professional judgement other than that of the recipient, need is "that quantity of services which expert medical opinion believes ought to be consumed over a relevant time period in order for individuals to remain or become as 'healthy' as is permitted by medical knowledge." "Expert medical opinion" need not be rendered by a physician; further, need may not be limited to medical needs, but may encompass psychological and social needs as well.
-
Utilization: "What is actually purchased or consumed" -- Many persons purchase services who are judged to not need them, and many persons do not purchase services who might need them.
-
Demand: The number of persons who wish to purchase a service at a given price.
Clearly, needs are but one factor affecting demand. Depending on prices, preferences and incomes, two persons with identical "needs" may demand entirely different services. Thus, the need of individuals for services "is only suggestive of the potential demand."51
With regard to the supply of long-term care services and settings, analysis indicates two principal conclusions:
-
Current evidence is inadequate to conclude that there is currently a surplus or shortage of nursing home beds and other LTC services and settings; that is, whether needs are greater or less than current utilization.
-
The evidence, however, does appear to indicate that the choices of living arrangements available to the elderly have narrowed in the past 50 years.
The discussion which follows presents the evidence upon which these conclusions are based.
Is There a Surplus or Shortage of Nursing Home Beds?
Analysts who look at nursing home utilization argue that there is a surplus of nursing home beds. The major argument for this is the presence of some degree of misplacement and inappropriate use: people are in nursing homes who don't need to be there.
On the other hand, analysts who look at demand for nursing have beds conclude that there is a shortage. Many people who want to enter a nursing home bed at existing prices can't get in. Moreover, the problem of finding a bed for particular subpopulations such as Medicaid clients is often severe, creating a particular problem for the Department even if analysis concludes there is not a general shortage of beds.
These arguments are not necessarily inconsistent since many factors can generate excessive demand, for example: 1) the lack of appropriate alternatives, 2) public subsidization of nursing home care, lowering its price to the Medicaid or Medicare consumer, 3) absence of or insufficient public support for alternatives to nursing homes.
The Task Force, however, found the evidence inadequate to choose among these competing theories.
The surplus theory is not proven because:
-
The measurement of inappropriate placement is still in the early stages of development and assessment methodologies are neither agreed upon nor entirely free from subjective judgement.
-
There are many determinants of nursing home use other than functional disability, such as the lack of family and friends to care for even a mildly impaired person at home. Therefore, there may be no other place to put an "inappropriately" placed individual if "appropriateness" is determined according to medical criteria. Detailed evidence on the family situation of individuals with different levels of impairment is not currently available.
The shortage theory is not proven because:
-
It is not clear why people demand care and whether their preferences would shift if alternatives to nursing home beds were available. Available studies of demand rely on data no more recent than 1973.
-
Evidence of hospital backlogs used to suport the shortage theory is problematic. Backlog appears to be a local, not a national, issue. Moreover, backlog may be more related to adequacy of financing than to supply. A recent Department study concludes that an increase in nursing home beds would not reduce backlog since providers still would perceive reimbursement for the heavy care patients "backed up" as inadequate.52
In general, no conclusions can be drawn because the basic data are weak:
-
Reliable data on the national nursing home bed supply are available only up to 1976. Therefore it is impossible to measure recent trends. Furthermore, there is wide variation in the ratio of beds to population across the states and no accepted standard which indicates adequacy.
Until further evidence is available, therefore, the Task Force concludes that the issue whether there is a nursing home bed supply shortage or surplus is a state-specific and probably a local issue. Evaluating local perceptions indicates that generalizing about the total supply of beds on a national scale simply is not appropriate: there are shortages in some states, surpluses in others. National perspective on this issue is not very useful for policy purposes.
The Adequacy of Supply of Non-institutional Long-Term Care Services
Far less is known about the adequacy of non-institutional services, owing primarily to the fact that these services have traditionally been provided by family, friends, community and private sector providers at relatively little public expense and with little public oversight.
All caveats concerning studies of need and unmet need for institutional services also apply to such studies for non-institutional services: assessment instruments are imperfect; their application involves great subjectivity; needs are determined by many factors in addition to functional disabilities. Therefore, these studies are to be interpreted and used only with great caution.
The "family setting" is have for nearly 90% of all people unable to perform major activity.53 Not only is it home, but family members act as the primary help sources, regardless of the disability. Eighty percent of personal care services for the elderly and chronically disabled are provided by family members.
One of the most reliable studies to date on the unmet needs for social services of the non-institutionalized elderly indicates that the great majority of the elderly feel their needs for assistance in basic activities are being met.54 Among the social services studied were transportation, personal care, housekeeping, social activities, emergency assistance, food shopping, and food preparation. The majority of elderly persons (88%) reported no unmet needs. Seven percent of the elderly living with their spouse had one or more unmet needs, compared to 17% for those who lived alone, and 22% who lived with their children. The incidence of having one or more unmet needs increases with age, from 6% for the 65-69 age group to 28% for those 85 years and over. Transportation was the type of service most frequently cited as a problem . About 7% had unmet transportation needs and considered it a big problem, another 24% were somewhat restricted or had some problems with transportation, and the remaining 69% were generally self-sufficient and unrestricted.
The Adequacy of Settings
Loss of care-givers, reduction in the capacity of a care-giver, rapid depletion of income and other family resources, and physical and mental deterioration of the disabled person weaken the ability of the family to continue as the primary setting in which the disabled receive long-term care services. Such problems generally increase as the disabled person grows older.
Nursing homes, congregate homes, and shall group or domiciliary care homes provide the settings for the provision of supportive services when the family support mechanism collapses. The adequacy of nursing home services was discussed above. It is estimated that in 1976, the number of adults needing congregate housing, personal care homes and other sheltered living arrangements exceeded the number actually residing in such facilities by more than 1.1 million. By 1985, it is estimated that unmet need will approach 1.3 million.55
Nursing homes today are the principal type of institution providing shelter and long-term care to the chronically ill and functionally dependent. This is, however, a recent development. In the past, similarly dependent people were cared for in a greater variety of different types of institutions and congregate living arrangements. In order to understand recent trends in institutional supply and use, it is useful to consider their development from a longer historical perspective. Since the elderly comprise the largest segment of the long-term care population, discussion is focused on that group.
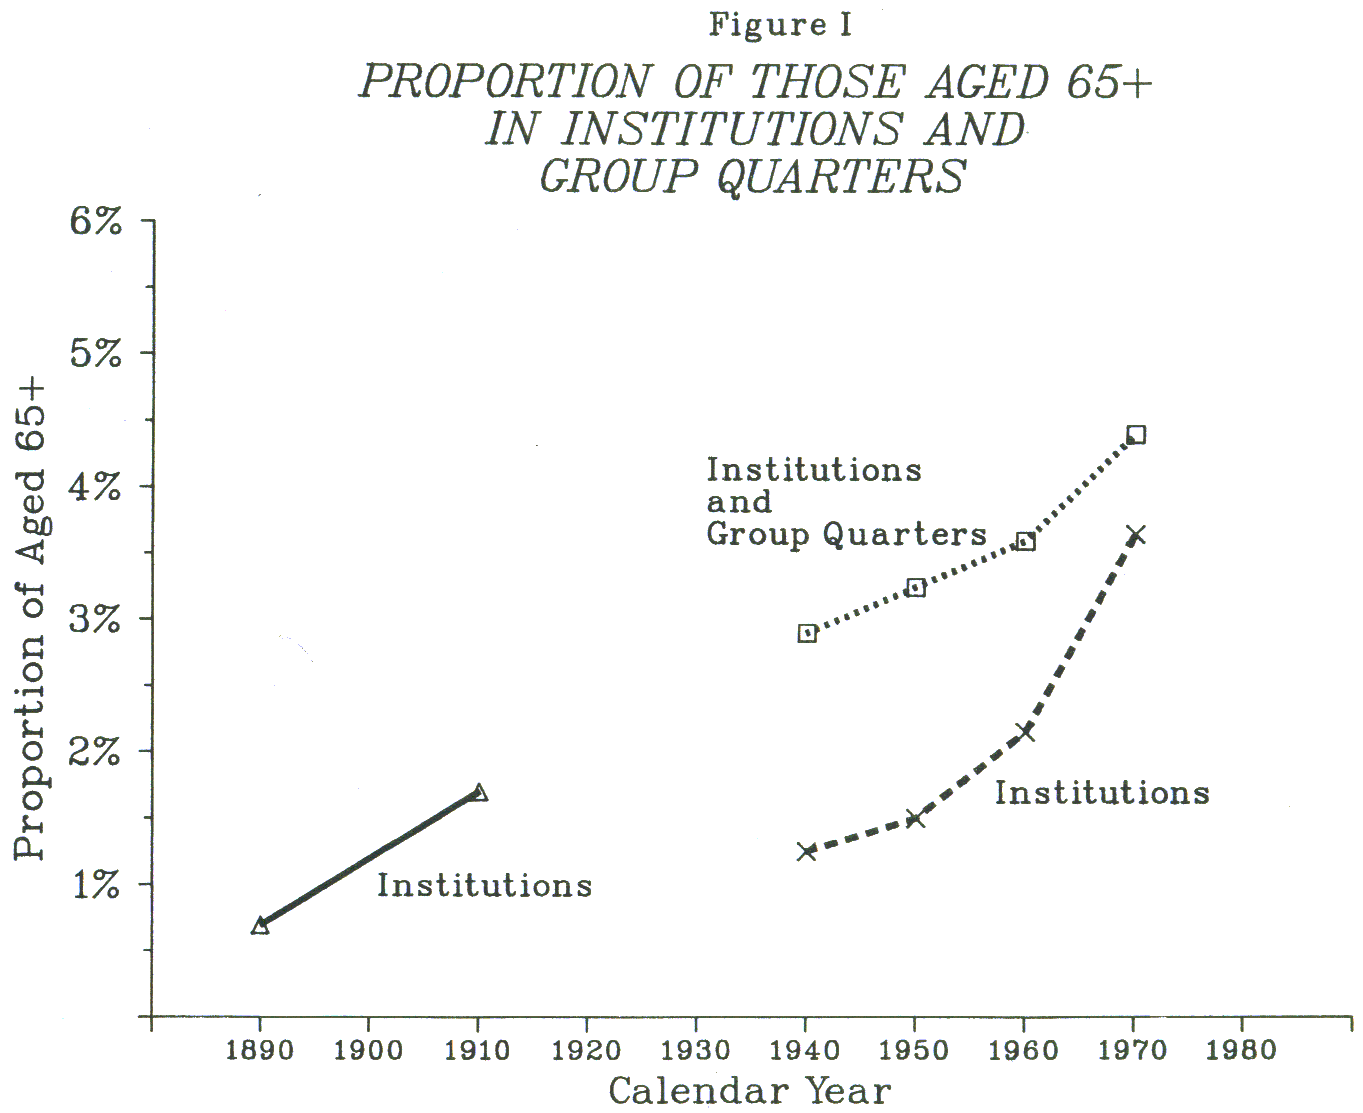
The Proportion of the Elderly in Institutions: Figure I shows the proportion of the elderly enumerated in institutions and group quarters on the day of the Census from 1890 to 1970. The gradual increase from 1.7% in 1890 to 5.5% in 1970 largely reflects changes in Census procedures and in the age structure of the population over age 65.
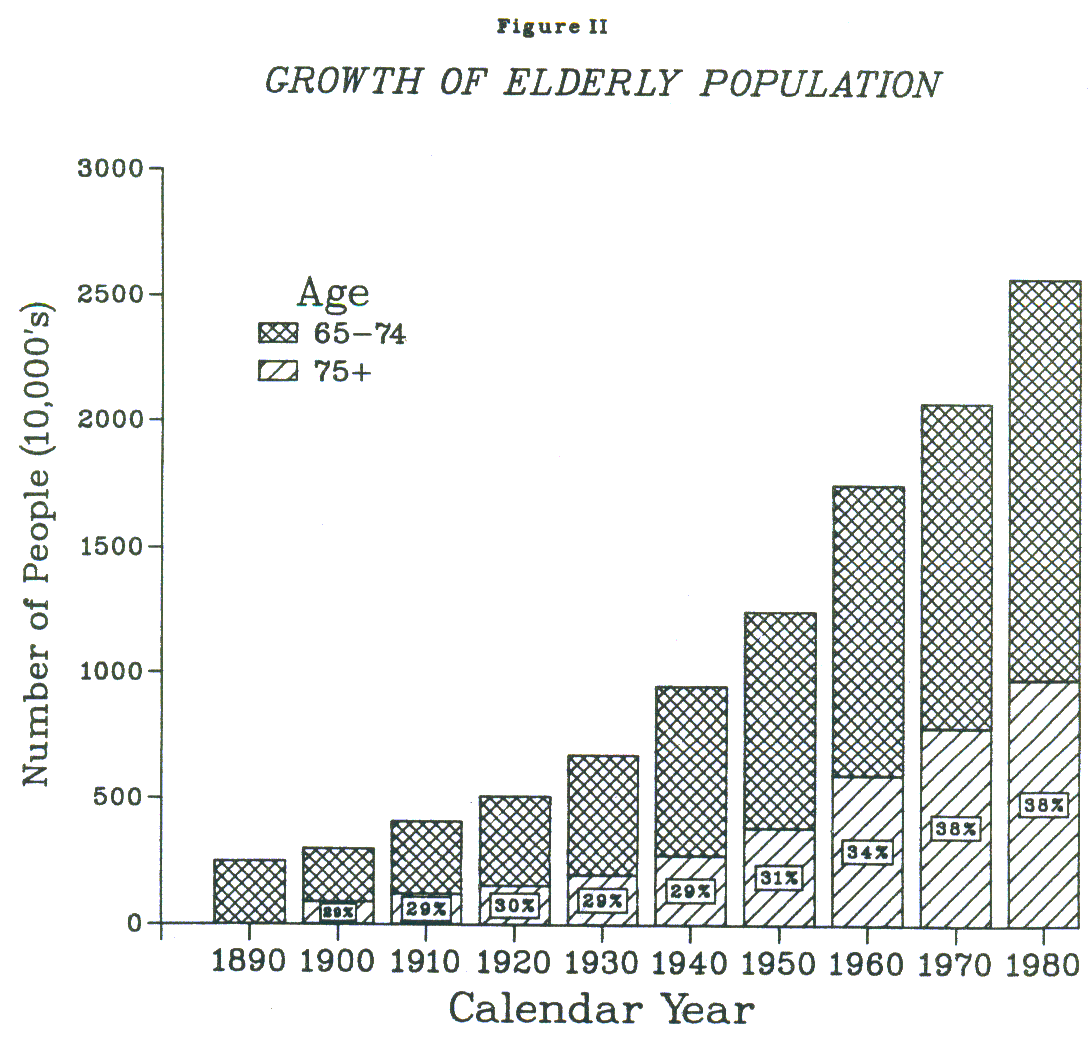
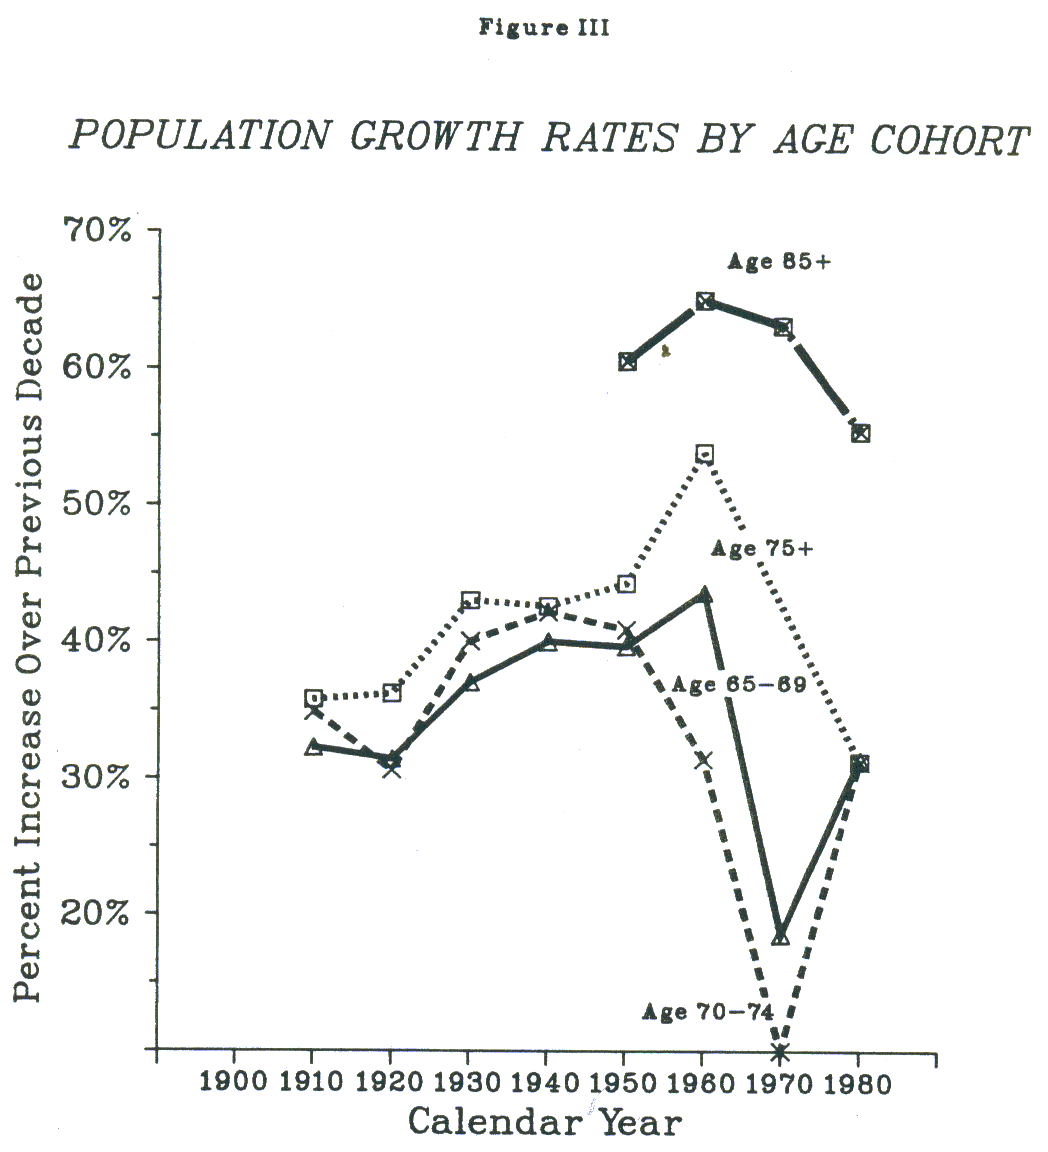
Data on the institutionalized population are relatively comparable from 1940 to 1970. The gradual increase over that period, seen in Figure I, is largely accounted for by changes in the age structure of the elderly. The older a person is, the greater the risk of institutionalization. Thus, as a greater proportion of those over age 65 are "old-old" (75 and older), the greater will be the proportion of all elderly in institutions. Figure II illustrates changes in the age structure of the elderly population from 1890 to 1980.
At each Census since 1950, there has been over a 50% increase in the oldest segment, compared to the previous decades' population. As can be seen from Figure II, the "old-old" remained a relatively constant proportion of the elderly population until 1940. Since that time, the "old-old" have comprised an increasingly larger segment. The phenomenon is further illustrated in Figure III, which shows the dramatic rate of growth of the oldest segment -- those over age 85. The rate of growth of this segment peaked in 1960; however, this growth rate has continued to surpass that of other age segments.
Table I illustrates directly the relationship between the age structure of the elderly population and rates of institutionalization. As can be seen, from 1950 to 1970, the proportion of the population aged 65-79 in institutions and group quarters has remained virtually constant. In contrast, the proportion of the population aged 80 and older experienced over 50% increases in their rates of institutionalization over the two decades. This may reflect a shift of the oldest patients out of general hospitals or family settings into nursing homes.
| TABLE I. Proportion of the Elderly in Institutions and Group Quarters by Age Cohort: 1950-1970 | ||||||
| Age Group | 1950 | 1960 | 1970 | |||
| In Institutions | In Group Quarters | In Institutions | In Group Quarters | In Institutions | In Group Quarters | |
| 65-69 | 1.8% | NA | 1.8% | 0.7% | 1.7% | 0.5% |
| 70-74 | 2.6% | NA | 2.6% | 0.7% | 2.7% | 0.5% |
| 75-79 | 4.3% | NA | 4.3% | 1.3% | 5.1% | 0.7% |
| 80-84 | 6.6% | NA | 7.8% | 1.3% | 10.2% | 0.9% |
| 85+ | 11.7% | NA | 12.6% | 1.8% | 17.9% | 1.2% |
Distribution Among Types of Institutions: While the proportion of the elderly in institutions and group quarters of all types has grown only slightly in recent years, changes in the distribution of the institutionalized have been rather dramatic. This is illustrated in Table II.
| TABLE II. Distribution of the Known Institutionalized Population, Aged 65+(One-Day Census) By Type of Institution: 1890-1970 | ||||||
| Type of Institution | 1890 | 1910 | 1940 | 1950 | 1960 | 1970 |
| Prison & Jails | 2.2% | NA | 1.3% | 0.9% | 0.7% | 0.4% |
| Almshouses | 53.9% | 33.3% | ||||
| Homes for the Aged | 23.9% | 46.9% | 33.7% | 35.2% | 49.7% | 72.4% |
| For the Mentally-Handicapped | 0.7% | 0.6% | 1.0% | |||
| Specialized Hospitals: | ||||||
| TB, Chronic Disease Mental Hospitals Other Group Quarters | 5.4%13.9%0.6% | 20.3% 0.2% | 23.5%0.9%40.5% | 2.5%22.9% 37.8% | 4.7%23.2%1.8%21.2% | 3.7%10.3% 12.3% |
| TOTAL | 100% | 100% | 100% | 100% | 100% | 100% |
As can be seen, in 1890 approximately 14% of the institutionalized elderly were in mental hospitals, over half were in almshouses, and less than a quarter were in "homes for children and adults." By 1940, the aged mental hospital population had increased to one-quarter of the institutionalized aged; by 1970 it had declined to 12% -- approximately the same as in 1890. The decline of the proportion in group quarters (boarding houses, retirement hotels, and the like) has been equally dramatic: from 41% in 1940, to 12% in 1970. The proportion in prisons and jails has gradually declined from 2.2% in 1890 to 1.2 percent in 1970. Public almshouses -- by that name at least -- have disappeared. By contrast, the proportion in homes for the aged rose from 23.9% in 1890 to 72.4%, in 1970 with the greatest increase beginning in 1950.
The Impact of Public Programs on the Distribution of Settings: Institutional types follow the public money. Efforts of reformers to close the almshouses and later to reduce the population of mental institutions led to federal programs which provided financial incentives for states and communities to accomplish those goals. The system responded predictably.
Recent federal programs also appear to have influenced the development of particular types of nursing homes and other "near" institutions. Between 1960 and 1970, the number of elderly nursing home residents more than doubled. However, the greatest rate of growth during that period was in facilities which the Census described as those "not known to have nursing care." As can be seen in Table III, while the elderly population in facilities "known to have nursing care" increased by 49%, that in other facilities increased by 150%.
Federal programs passed in the 1960s encouraged the development of facilities called "nursing homes", but did not in the early years have stringent definitions of what constituted a "nursing home." This appears to have encouraged the pattern observed in Table III.
| TABLE III. Growth Rate of the Elderly Nursing Home Population by Type of Facility 1960-1970 | ||||
| Type of Care | % Change: 1960-1970(Ownership) | |||
| Government | Private Non-Profit | Private Proprietary | Total | |
| Elderly Residents in Facilities known to have Nursing Care | +41% | -7% | +81% | +49% |
| Elderly Residents in Facilities not known to have Nursing Care | +25% | +122% | +184% | +150% |
| TOTAL | +33% | +60% | +141% | +105% |
Medical Assistance to the Aged (MAA), or the Kerr-Mills Act, was passed in 1960 and provided for payments for "skilled nursing home services." But monies were expressly prohibited for payments to or care on behalf of any individual who is an inmate of a public institution, except as a patient in a medical institution".56 Note the change from the original Social Security Act, which prohibited payments to persons in any public institution. Moreover, under MAA, states were allowed to support the aged in public mental institutions, but only "if the State plan ... shows that the state is making satisfactory progress toward developing and implementing a comprehensive mental health program, including provision for utilization of community health centers, nursing homes, and other alternatives to care in public institutions for mental disease".57
Although few states took full advantage of Kerr-Mills, and hence its effect may have been relatively marginal, certain provisions of MAA were incorporated into Medicare and Medicaid which replaced MAA in 1966. Among the more important for this discussion were the original prohibitions against payments to persons in non-medical public institutions and to persons in public mental or turberculosis hospitals.
These aspects of federal policy appear to be reflected in Table III. As can be seen, there was a 105% increase in the elderly nursing home population, swelled with elderly people both discharged and diverted from state institutions. Further, while the fastest growing segment was in non-medical private nursing homes, public facilities with nursing grew faster than public facilities without nursing. The rapid proliferation of private "nursing homes" not known to provide nursing may be a result of the lack of federal definition of a nursing facility.
Congress used the phrase "extended care facility" (ECF). to describe facilities certified for Medicare participation. Standards for ECFs required extensive professional and supportive staffs, and such facilities never comprised a large segment of nursing homes. Patients in ECFs were not originally eligible for Medicaid. The category "skilled nursing facility" was devised to provide a somewhat lower level of care at lower costs for long term convalescent and terminal patients. However, as the cost of Medicaid rapidly escalated, it was asserted that many of the publicly-supported patients in SNFs required fewer professional services. Intermediate care facilities (ICFs) were designed as a less costly alternative. However, federal standards for ICFs were not issued until January, 1974. In the absence of uniform standards, some states restricted participation to professionally-staffed facilities, while others certified non-professionally-staffed residential facilities. Many states simply licensed as ICFs those facilities which failed to meet the standards for skilled care.58 Over the past decade, however, standards of participation have been considerably augmented.
Table IV presents data from a decade of MFI surveys. It appears that the pattern of the 1960s has been reversed, and that "homes for the aged and dependent" are increasingly medically-oriented nursing homes. It is logical to conclude that the factor most responsible for this has been the large sums of public money available under Medicaid for this particular type of group facility.
| TABLE IV. Distribution of Nursing Home Beds by Type of Care | |||||
| Year | Nursing | Personal Care with Nursing | Personal Care | Domiciliary | Total |
| 1967 | 69.8% | 21.6% | 8.0% | 5.0% | 100% |
| 1969 | 74.6% | 18.5% | 6.7% | 100% | |
| 1971 | 76.4% | 16.0% | 7.3% | 3.0% | 100% |
| 1973 | 83.4% | 16.6%* | NA | 100% | |
| 1976 | 83.0% | 16.6% | NA | 100% | |
| * Two categories were collapsed in 1973 and 1976. | |||||
The growth of nursing homes may also be affected by another Federal program, the National Health Planning and Resources Development Act of 1974, which provides for a national network of state and local planning agencies which can influence the supply of institutional health services through regulation of capital expenditures.59 Certificate of Need (CON) laws, first enacted in New York in 1964, require state approval for large capital expenditures or significant changes in institutional health services. One of the penalties for disregarding CON law is loss or refusal of an operating license. Mile federal regulations define the basic tenets and minimum requirements of acceptable CON programs, each state has developed a unique program. The types of services to be reviewed, capital limit or other review trigger, criteria, review and appeals processes, and penalties vary from state to state. As of July 1980, all states except Louisiana have some type of CON legislation.
A related way to regulate service supply is provided by Section 1122 of the Social Security Act. This provision requires state approval of capital expenditures over a certain limit, $100,000 at present. Without 1122 approval, Medicare reimbursement for the institution is cut to exclude the costs of capital involved in the specific project.
While the actual review processes for 1122 and CON vary from state to state, in most states the HSA does the initial review and develops recommendations. The final decision is made at the state level. The areawide and state health plans are often instrumental in analyzing the need for the proposed project. Analysis of areawide health plans reveals that states with high nursing have bed-population ratios tend to have plans that call for reductions in the ratios, and states with low bed-population ratios call for increases in the ratios through increases in the supply of beds. Although information on CON is scarce, a small data "window" exists for the period July - December 1979, which casts some light on the CON activity of states which consider themselves overbedded or underbedded:
-
The nine "overbedded" states approved 240 new long-term care beds of the 495 proposed between July and December 1979. Adjusted for the elderly populations of these states, they added .115 bed per 1,000 persons during this time.
-
The low bed states approved an additional 2,568 beds during the last six months of 1979. 3,024 beds were proposed. Adjusted for the elderly populations of these states, .884 beds per 1,000 people aged 65 or over were added. These numbers reflect six of the eight underbedded states; no CON/1122 data were available for Arizona or the District of Columbia.
It is important to note that the health planning process does not take place in a vacuum, but within a complex health care system. There is no assumption that the planning agencies have caused specific changes in the supply of long-term care beds. Agency actions should be considered in relation to other parts of the health care system, the supply of acute care alternative types of long-term care services, reimbursement policies practices, and the political and economic environment. Yet, the results of this analysis illustrate that some health planning agencies determine whether their areas are overbedded or underbedded and develop formal goals to correct the imbalance. These goals, approved by the agency's board of consumers and providers, show the directions in which the community wishes to move.
Whether there is a shortage of congregate and other sheltered facilities cannot be determined with certainty. The total supply of congregate housing facilities is not known. HUD has identified 22,500 units which provide full meal service at a minimum, but there are no reliable data on supply of non-federally subsidized congregate housing. Also, the need for congregate housing cannot be estimated with any degree of precision. The potential demand for congregate housing is even more difficult to estimate.
Large numbers of those currently in nursing homes could probably live comfortably in the community in congregate facilities. Also, many current residents of federally assisted housing are in need of support services in order to remain there safely and comfortably.
-
"A survey by the International Center for Social Gerontology of 182 Housing Authorities with developments for the elderly built before 1970 revealed that 12.3 percent of the present residents needed basic services. It was stated over and over that the only other alternative was eviction and general reliance on the nursing home."60
-
"Recent research studies, however, have estimated current need for the elderly in public housing and Section 202 housing alone as perhaps 15 percent of the elderly individuals in residence. This could be as many as 100,000 persons in need of congregate services to enable them to remain in their own homes."61
We do not know precisely the extent of need for congregate housing and services among those elderly and handicapped currently residing in private, independent residences, but it is probably large.
-
Long waiting lists for entry into existing projects is evidence of unmet demand.
-
The fact that most elderly would prefer almost any other alternative to a nursing home, but often do not know about congregate housing, means effective demand is likely to increase as the public becomes aware and as congregate facilities become a more prevalent option.
It is impossible now to say with any precision what should be the approximate mix of congregate housing, nursing homes, and other types of service-enriched living arrangements. It is clear, however, that the lack of diversification in living arrangements for the long-term care population is a problem.
C. The Cost of Different Long-Term Care Services and Settings
The previous section considered issues of supply independently of issues of costs. Given a pattern of needs, utilization or demand, supply may or may not be adequate to meet it. However, public policy must also take into account costs, and consider whether services and settings are cost-effective while meeting needs or satisfying demand. Our discussion of cost will be divided into two parts: (1) the comparison of particular services and settings; e.g., is home health a cost-effective alternative to nursing homes; and (2) the impact on total LTC systems costs of expanding services and settings.
Introduction
Whereas individuals with similar long-term care needs may experience similar outcomes from the same services delivered in different settings, the cost of the provision of those services in different settings may be entirely different. Further, different settings may alter the requirement for services, thereby altering the cost of services for similarly affected individuals. The growing cost of nursing have care has prompted studies of the cost and cost effectiveness of care delivered in alternative settings. These studies have became the basis for several comparative' reviews.62, 63, 64, 65, 66, 67 According to a recent critique of these reviews, because of the difficulty of comparing the costs of have and institutional care, more recent reviews of empirical studies conclude that little is reliably known and that more careful research is necessary.68 The studies are commonly faulted on several grounds: patient characteristics or outcome measures are not controlled; sampling methods were thought to be inadequate; samples were too small; cost data were not sufficiently detailed; patients were followed for too short a time; questions of objectivity were raised by provider involvement in the evaluations.
Costs of Services in Different Settings
Two more recent studies which avoid many of these errors are based on the Duke OARS assessment methodology. Nevertheless, even these studies may not be generalizable beyond the particular communities in which they were conducted. The first, a study in Durham County, North Carolina69 concludes:
-
In addition to the service characteristics of most nursing homes (hotel services, food services, nursing services, personal care services, patient activities, medical treatment, and physical and occupational therapy), additional services (checking, transportation, respite care) might be needed to provide comparable care in alternative settings.
-
At the basic level of care, the estimates range from $13.72 to $20.31 per day for alternatives compared to $19.19 in nursing homes. Supplementing the basic level of care raises the costs of alternatives, and increases are particularly dramatic when the basic service of the nursing home (24 hour surveillance) is needed.
-
Nursing homes appear to be cost-effective for those who need a full range and intensity of services.
The second, a study done by the General Accounting Office in Cleveland70 concludes:
-
The services required by the most extremely impaired elderly, about 10% of the population over 65, could be delivered more economically in nursing homes. Only about one-third of this group are currently in institutions and the remainder are able to remain outside of institutions because services are provided by an informal network of family and friends. Family and friends provide equivalent services of $673 per month and agencies supply an additional $172 for a total of $845. These same services can be provided in a nursing home for $450.
Available studies seem to indicate that for slightly impaired people, alternatives are more economical than nursing homes; for severely impaired people the opposite is true. What we do not yet know is exactly where the breakeven point occurs, and how to determine for which individuals and subpopulations which particular services and settings are cost-effective.
Total System Costs
Even if a particular service provided in the home is cost-effective, the issue of who pays becomes relevant. If government provided benefits replace services that are currently provided informally by family and friends, the total bill may increase even if services are being provided more efficiently. Services provided by families, although not costless, are usually less expensive than those purchased in a formal market. Thus the substitution (if it occurs) will both increase the total proportion of GNP devoted to LTC, if the total volume of services rendered remains constant, as well as increase the size of the government budget. Even if the formal service were proven to be much more cost-effective than an equivalent volume of services provided by family and friends, these potential financing shifts might make the change undesirable.
Others have argued that rather than substitute for informal care, formal benefits can supplement family efforts and keep even the client who would eventually be institutionalized in the community longer before institutionalization becomes inevitable. It is argued that most families institutionalize relatives reluctantly as a last resort and only after considerable personal sacrifice, and after various alternative solutions have been attempted. Available evidence on the extent of substitution is limited. As Dunlop has written:
"Although common sense suggests that some families would retain their dependent elderly at home longer if certain formal support services were made available to them, there appears to be no hard, unbiased evidence to support this notion. Carefully executed studies to date provide only mixed, partial, and largely indirect findings with respect to the impact of home-based care provision on rates of institutionalization for the dependent aged population".71
The question of whether formally provided LTC benefits substitute for or further support the informal care network and under what conditions requires further investigation.
A second issue affecting total systems costs is not only whether one service is cheaper than another, but if cheaper, whether the less expensive service can effectively substitute for the more expensive service for the same populations.
A recent study by Weissert examined the costs of homemaker and adult day care services compared with the costs of nursing home care in a randomized experiment.72 Weissert found home services to be an addition to, not a substitute for existing Medicare SNF (post hospital) benefits and that costs were $3,442 per year higher for experimentals than controls. The social and mental functioning of recipients was unaffected although contentment increased. The provision of day care reduced the use of both SNFs and hospitals but total costs increased because the cost of the day care itself was much higher than the reduction in institutional costs. Costs were $2,692 per year higher for experimentals than controls. Death rates were reduced slightly but dependency, contentment, and mental and social functioning were only minimally affected.
Since the knowledge base on home based care in this country is not well developed, there may be much to learn from the experience of other countries:
"At first glance at least, the experience of European countries in reducing use of nursing homes through the ready availability of home based services does not appear encouraging. Sweden, for example, which employs more home aides per 1,000 elderly population than any other country - and where in Stockholm, have aides may be utilized by one-third of the elderly population - has an overall institutionalization rate at least as high as in this country. Moreover, there appears to be a serious shortage of nursing home beds, with perhaps as many as 30 percent of hospital beds occupied by long-term patients. Thus, as one observer of the Swedish scene has suggested, whether availability of home-based supportive services in that country reduces institutionalization remains an unanswered question. It should be noted, however, that informal supports may be especially lacking in Sweden. At least one study indicates that the elderly in Sweden have the least contact with children of any western society."73
A common problem with studies looking at the cost effectiveness of particular LTC services and settings or the impact of additional services on total systems costs is that they do not allow the time necessary for the structural changes in the delivery system to be commonly accepted so that a new "normal" routine of care can be properly evaluated. The analysis of systems dynamics, the interaction of the supply of one service on the supply of other services, and the interaction of different financing options on the availability of each is therefore critical in formulating future policy in this area.
D. Conclusion
The long-term care system is extraordinarily complex, encompassing issues in the areas of health, housing, transportation, social services, income security and employment. The long-term care population is extremely diverse in its functional disabilities, illness, needs, desires, personal resources and living arrangements. It is not surprising that our understanding of the system is rudimentary: our data are poor, our methods crude, our analytical instruments inadequate.
Owing to the complexity of the task, analysis has focused on small segments of the system rather than taken the broad view. Although important to our understanding of individual components, such analysis misses the critical implications of the interactions among all facets of long-term care. We are presently ill-equipped to capture simultaneous changes and dynamics of the long-term care system as a whole. As a consequence, in addition to ongoing work on individual segments of the system, there is need for work to begin on modeling the long-term care system, across all segments, and over time. Such efforts should yield, at the very least, perspectives on the more important problem areas, and identification of the critical leverage points in the system.
APPENDIX 5-A. LONG-TERM CARE, HEALTH PLANNING, AND CERTIFICATE OF NEED
Introduction
A national network of health planning agencies analyzes, plans, and regulates long-term care and other health services. The network consists of State agencies and areawide Health Systems Agencies (HSAs), mandated by National Health Planning and Resources Development Act of 1974, P.L. 93-641. This paper considers the role of health planning in long-term care. It examines the planning and regulatory options open to the agencies and ways in which they have been used to affect long-term care. Recent changes in long-term care on a national as well as a State level are related to health planning activities.
Background: The Health Planning Network
P.L. 93-641 created a national network for the planning and regulation of the health care system.74 The Act mandated Health Systems Agencies (HSAs) to do local or areawide planning and two State agencies to do statewide planning. The first, the State Health Planning and Development Agency (SHPDA) is a part of State government; the second, the Statewide Health Coordinating Council (SHCC) is an advisory committee made of representatives of the States' HSAs and State government.
The Act and its later amendments specify five purposes for the planning network:
- To improve health status;
- To improve the accessibility, quality, continuity, and acceptability of the health care system;
- To restrain increases in health care costs;
- To prevent unnecessary duplication of services; and
- To further competition in the health care system.75
The agencies are provided with certain tools to achieve these purposes. Their responsibilities can be grouped in three categories: planning, advocacy, and regulation. Their planning responsibilities require agencies to identify major problems of health status and the health system, goals and objectives to correct these problems, and strategies to implement the goals. The areawide agencies develop Health Systems Plans (HSPs) and Annual Implementation Plans (AIPs), while the SHPIIA combines the major points of these plans, adds State health priorities and policy considerations, and produces a State Health Plan, reviewed by the SHCC and the Governor. These plans define the effective and efficient health systems they hope to achieve. The agencies use their regulatory and advocacy roles to implement the plans.
Planning agencies can influence the supply of institutional health services through regulation of capital expenditures. Certificate of Need (CON) laws, first enacted in New York in 1964, require State approval for large capital expenditures or significant changes in institutional health services. One of the penalties for disregarding CON law is loss of or refusal of operating license. While federal regulations define the basic tenets and minimum requirements of acceptable CON programs, each State has developed a unique program. The types of services to be addressed, capital limit or other review threshold, specific review criteria, appeals procedures, and penalties vary from State to State. As of July 1980 all States except Louisiana have some type of CON legislation.76
A related way to regulate service supply is provided by S. 1122 of the Social Security Act. This provision requires State approval of capital expenditures over a certain limit, $100,000 at present. Without 1122 approval, Medicare reimbursement for the institution is cut to exclude the costs of capital involved in the specific project.
While the actual review processes for 1122 and CON vary from State to State, in most States the HSA does the initial review and develops recommendations. The final decision is made at the State level. The areawide and State health plans are often instrumental in analyzing the need for the proposed project.
Appropriateness review is a third regulatory tool. It involves analysis of existing health care services, as opposed to CON which deals with proposed changes only. A potentially powerful mechanism, appropriateness review is now being implemented.
The advocacy role of the planning agencies is more amorphous than their regulatory responsibilities. It stems from the HSA status as a community organization, comprised of health care consumers and providers who are representative of the area's population and organizations. Government, business, labor, and insurers participate as do representatives of different population groups. The HSA and the SHCC provide a forum to discuss and design health care policy. once goals and objectives are determined, the HSA and State agencies can advocate their adoption. Agencies can try to coordinate different organizations and interests and act as a catalyst in the community's health care system.
Health Planning Activities Related to Long-Term Care
Their legislative mandate requires HSAs and SHPDAs to plan for and regulate long-term care services as well as other facets of the health care system. No comprehensive analysis of what health planning has accomplished in long-term care exists. A review of selected plans from approximately 100 HSA's shows that long-term care is a primary concern of these agencies. National and State level data on CON and 1122 programs provide further evidence of this.
A. Planning and Advocacy
The Health Systems Plans examined cover an extremely wide range of long-term care services and non-institutional services for the elderly.77 Skilled Nursing Facility (SNF) and Intermediate Care Facility (ICF) bed supply and location were addressed by agencies all over the United States. Accessibility for Medicare and Medicaid patients was also widely mentioned. The plans show that there is no concensus that the United States is either overbedded or underbedded. Some plans call for increases in SNF and/or ICF beds while others call for decreases.
Another widespread topic was home health care, often considered an alternative to nursing home services. The majority of plans urged increased availability of home health services including, in some cases, more flexible reimbursement for these services. Exceptions were Florida agencies which stressed the need to control the number of home health care agencies as these agencies have proliferated in the past few years. Many plans discuss the need for other alternatives to nursing homes, including meals-on-wheels, case management programs for the elderly, and congregate living arrangements. The HSAs and SHPDAs that address these types of programs clearly have a comprehensive concept of the health care needs of their populations.
Some agencies have written and published consumer guides to nursing home and other institutional and non-institutional long-term care services in their areas. Two prominent examples are "I think I Need a Nursing Home. What Do I Do Now?" by the Metropolitan Council of Saint Paul, Minnesota and "Making Choices: Guidebook to Long-Term Care Facilities and Home Health Services" by the Illinois Central Health System Agency. The second report describes the services, staffing arrangements, and charges of the individual facilities in its area.
B. Regulation
The most direct way in which HSAs and SHPDAs influence long-term care bed supply is through COIN and 1122 decisions. These provisions allow the agencies some leverage in affecting the number and location of long-term care facilities and beds and related services. National data on the results of CON and 1122 reviews are incomplete; State level data are even more fragmented. On a national basis, an American Health Planning Association survey discovered that approximately 75 percent of proposed nursing home capital expenditures, or $1.7 billion from July 1976 through December 1978, was approved by planning agencies.78 Preliminary results of a DHHS survey reported that of 13,138 beds proposed to be added in the last six months of 1979, 86 percent, 11,290 beds, were approved.79 In some States bed removals are also reviewed. The same survey shows that 809 beds were approved for removal. This represents 113 percent of the 713 beds requested to be removed. It is important to note that both surveys are incomplete. All health planning agencies are not represented in the AHPA data. The DHHS data include preliminary data from 48 States.
The Impact of Planning on Nursing Home Supply
Aggregate information on plans and CON or 1122 decisions is difficult to interpret. Alone, these data don' t show whether CON and the planning program have a real impact on the supply of long-term care beds and other related services. They raise additional questions. If the bed supply is affected, are the changes beneficial? Are beds being added or dropped in the right places? The answers to these questions are critical in evaluating the role of CC and planning in long-term care.
While planning itself is not explicitly mentioned, the literature suggests two alternative theories of the impact of CON. In their analysis of CON and long-term care, Feder and Scanlon assure that CON has constrained supply.80 They believe CON may impede the accessibility of the old and the poor to nursing home beds. Feder and Scanlon write that alternative long-term care services that might substitute for a bed shortage have not been sufficiently developed or financed. Vladeck, on the ocher hand seems to assure that CON has not really restrained bed supply.81 He argues that CON should be used stringently to do so, while congregate housing and other services for the elderly are increased.82 Because a systematic analysis of the impact of planning agencies on long-term care has not been done, there is not yet reliable nationwide evidence to support either view.
Need for State Level Analysis
Significant variations in the ratios of long-term care beds to the aged population from area to area make analysis on a national basis difficult and potentially misleading. In 1976, the ratio of long-term care beds to population aged 65 and over ranged from less than 25/1,000 in Arizona and Florida to 118/1,000 in Nebraska.83 One ,would not expect similar long-term care planning or regulatory decisions from two States with widely different ratios.
A State level analysis of planning, CON and bed supply provides many benefits. It can consider variations in State Health Plans, CON statutes, and the supply of long-term care beds. It can determine whether beds have been approved and added in places with relatively low bed supplies or in places with high supplies. Yet, such an analysis cannot determine causal relationships; we cannot say that health planning and/or CON caused a particular situation. Further, State analysis, except with the types of detailed case studies performed by Feder and Scanlon, cannot determine whether existing nursing homes are being allocated to the people who need this level of care. Detailed information on the accessibility of the beds to the Medicaid population will not result from a caparison of State plans, CON decisions, and bed supply. While this type of analysis will not provide answers to all of our questions, it does uncover certain directions of change.
Data
The lack of up-to-date information on nursing home beds, discussed in detail in Working Paper #5, coupled with the scarcity of information on CON and 1122 decisions, influenced the scope of the analysis. The most recent reliable data on State supply of long-term care beds is the 1976 Master Facility Inventory, compiled by the National Center for Health Statistics. Some information on health plans was available from a computerized topic index developed by the Bureau of Health Planning, Health Resources Administration. Approximately 100 plans, almost all Health Systems Plans produced by HSAs in 1978, were abstracted and contained in the index. The indexed plans covered areas in almost all States, except for the District of Columbia, Rhode Island, Utah, New Mexico, and New Hampshire. The index includes one or more areas of the other States; no attempt was made to index plans from all sections of any single State. To comply with Departmental guidelines, all of these plans were supposed to address long-term care concerns. Limited information on CON decisions has also been gathered. Data on the CON and 1122 decisions by State for the six months period of July through December 1979 has been developed by the Health Resources Administration and used in this analysis.
Analysis
States were divided into three categories according to their 1976 long-term care bed-to-population ratios. The first category was composed of States with relatively few beds, less than 42 beds to 1,000 elderly. This represents a standard deviation below the national mean of 63.9/1,000. Seven States and the District of Columbia were in this category. The second category contained all States with moderate bed ratios of from 42/1,000 to 86/1,000. This category includes the mean and one standard deviation above and below it. States with high bed-to-elderly population ratios were in the third category. These nine States had ratios in excess of 86/1,000. The category each State was assigned to is shown on Table 1.
The analysis centered on those States with very high and very low ratios. Indexed plans from Health Systems Agencies in these States were examined to note differences in their long-term care goals. The State CON and 1122 decisions for the 1979 six month period were also studied and compared to the plan goals.
| TABLE A5-I. Categories of States According to Level of Nursing Home Beds | |||
| State | Category* | State | Category* |
| Alabama Alaska Arizona Arkansas California | 23122 | Montana Nebraska Nevada New Hampshire New Jersey | 23122 |
| Colorado Connecticut Delaware District of Columbia Florida | 32211 | New Mexico New York North Carolina North Dakota Ohio | 12232 |
| Georgia Hawaii Idaho Illinois Indiana | 22222 | Oklahoma Oregon Pennsylvania Rhode Island South Carolina | 22221 |
| Iowa Kansas Kentucky Louisiana Maine | 32222 | South Dakota Tennessee Texas Utah Vermont | 32223 |
| Maryland Massachusetts Michigan Minnesota Mississippi Missouri | 222312 | Virginia Washington West Virginia Wisconsin Wyoming | 22132 |
| * U.S. mean = 63.92 beds/1,000 persons aged 65 and over Categories: 1 = 41.7 2 = 41.8 - 86.1 3 = > 86.2 SOURCE: Data developed by the Health Resources Administration, U.S. DHHS using the Master Facilities Index for 1976. | |||
| TABLE A5-II. Summary of Goals and CON Actions Taken by High-Bed and Low-Bed States | |||||
| State | 1976 Bed/PopulationRatio* | Planning Goals:Cut orLimit Beds+ | Planning Goals:IncreaseBeds+ | July-December 1979 | |
| Beds Proposed | Beds Approved | ||||
| HIGH BED CATEGORY | |||||
| Alaska Colorado Iowa Minnesota Nebraska North Dakota South Dakota Vermont Wisconsin | 86.9 104.3 91.8 96.3 118.5 91.7 97.6 96.8 100.5 | X X X X X X X | 0 0 94 229 84 0 19 2 67 | 0 0 41 229 24 0 19 2 -75 | |
| LOW BED CATEGORY | |||||
| Arizona District of Columbia Florida Mississippi Nevada New Mexico South Carolina West Virginia | 25.0 40.5 23.9 34.8 34.9 35.8 36.4 26.0 | X (no plan) X X (no plan) X X | no data no data 1929 128 99 332 535 1 | no data no data 1569 128 99 236 535 1 | |
| NOTES: * Figures prepared by the Health Resources Administration/DHHS using the Master Facilities Index. Ratios show number of long-term care beds per 1,000 persons aged 65 years and older. + Goals were abstracted from approximately 100 Health System Plans indexed in Bureau of Health Planning computerized abstract system. o Data prepared by Health Resources Administration. | |||||
Results
The analysis, summarized in Table 2, revealed that States with high bed-population ratios seem to set different types of long-term care goals and approve different levels of beds than States with low ratios. Different levels of beds are applied for in States with varying bed supplies. 1979 CON and 1122 decisions seem to be consistent with the goals defined in 1978 plans. Specifically:
-
States with high ratios tended to have plans that called for actual reductions in the long-term care beds to elderly population ratio. These State recognize themselves as overbedded.
-
These nine "overbedded" States approved 240 new long-term care beds of the 495 proposed between July and December 1979. Adjusted for elderly populations of these States, they added .115 bed per 1,000 elderly persons during this time.
-
Plans from underbedded States called specifically for increases in their supplies of long-term care beds. Data were not complete; plans from the District of Columbia and New Mexico were not available from the index system. Of the six States with indexed plans, five recommended increased supply.
-
These low bed States approved an additional 2,568 beds during the last six months of 1979. 3024 beds were proposed. Adjusted for elderly populations of these States, .884 beds per 1,000 people aged 65 or over were added. These numbers reflect six of the eight underbedded States; no CON/1122 data were available for Arizona or District of Columbia.
-
The numbers of beds proposed in the high and low bed States also differed dramatically. The level of proposed expansions were considerably higher in the underbedded States.
It is important to note that the health planning process does not take place in a vacuum but within a complex health care system. There is no assumption that the planning agencies have caused specific changes in long-term care beds. Agency actions should be considered in relation to other parts of the health care system, the supply of acute care and alternative types of long-term care services, reimbursement policies and practices, and the political and economic environment. Furthermore, the distribution of beds within an area, may be as important as the supply of beds and cannot be analyzed with these data.
Yet, the results of this analysis illustrate that some health planning agencies determine whether their areas are overbedded or underbedded and develop formal goals to correct the imbalance. These goals, approved by the agency's board of consumers and providers, show the directions in which the community wishes to move. The goals and other parts of the health systems plans are published and disseminated throughout the area. Health planning statutes require CON and 1122 decisions to be consistent with the health systems plans. This analysis implies that a high degree of consistency may exist. If the trends shown in the 1979 CON and 1122 review information continue, high bed States may become less overbedded while low bed States gain beds. In these particular States, the bed-related goals specified in areawide plans seem to be coming to pass.
NOTES
-
Material on the chronically mentally ill has been obtained from the National Plan for the Chronically Mentaly Ill Final Draft, HHS National Plan Development Group, Report to the Secretary, Washington: HHS (NIMH). September, 1980. Discussions on the mentally retarded have benefitted from "Financing Community Based Care for Mentally Retarded Persons," Internal DHHS memorandum, office of Social Services Policy/OASPE, November, 1980.
-
National Plan for the Chronicaly Mentally Ill, op. cit.
-
The estimate in the National Plan of the noninstitutionalized population with chronic mental illness was obtained from the 1973 Comprehensive Needs Survey done by the Urban Institute and from the 1966 Survey of Disabled Adults done by the Social Security Administration. To check the consistency of these figures with NHIS data, figures on activity limitation by cause from the NHIS were examined. For the mental conditions specified on the NHIS condition list, 853,000 individuals in 1978 reported being unable to conduct their major activity (Level II). This figure is remarkably close to the 800,000 estimate used in the National Plan.
-
"Financing Community-Based Care for Mentally Retarded Persons", op. cit.
-
GAO, Report to Congress, "Well Being of Older People in Cleveland, Ohio," 1977.
-
Shanas, E., "The Family as a Social Support System in Old Age," Paper presented to Gerontological Society Meeting, November 1977.
-
Manard, Barbara B. et al., Old Age Institutions, D.C. Heath, Lexington, Mass., 1976. Butler, Lewis H. and Paul W. Newacheck, "Health and Social Factors Relevant to Long-Term Care Policy," Paper prepared for the LTC Symposium, Williamsburg, Virginia; Health Policy Program, University of California, San Francisco, 1980.
-
Butler and Newacheck, op. cit.
-
Thomas, Lewis, Lives of a Cell, New York, The Viking Press, 1974.
-
Gottesman, L.E., and Bourestan, N.C., "My Nursing Homes Do What They Do," The Gerontologist, 14(6): 501-506, December 1974.
-
Butler and Newacheck, op. cit.
-
Manard, Barbara B. et. al., Better Homes for the Old, D.C. Heath, Lexington, Mass., 1978.
-
Inland Counties Health Systems Agency, "Long-Term Care in Riverside County," (Mimeograph), Riverside, California, 1980.
-
Ibid.
-
Committee on Finance, U.S. Senate, "The Social Security Act and Related Laws," December 31, 1978.
-
Mossey, Jana, and William Tisdale, "Measurement and development of functional Health Indicators among the Institutionalized elderly," paper presented society, November, 1979.
-
GAO, Report to Congress, "Entering a Nursing Home--Costly Implications for Medicaid and the Elderly," November 26, 1979.
-
Carp, Frances M., "The Concept and Role of Congregate Housing for Older People," in Wilma Donahue, Marie Thompson, and D.J. Cerren (eds.), Congregate Housing for Older People: An Urgent Need, A Growing Demand, U.S. DHEW Publication No. (OHD) 77-20284, 1977.
-
Urban Systems Research and Engineering, Inc., Evaluation of the Effectiveness of Congregate Housing for the Elderly, U.S. DHUD contract #H-2255R, 1976.
-
Sherwood, Sylvia, David Geer, John Morris, Vincent Moor, "The Highland Heights Story," 1979 (Mimeograph).
-
California Health Facilities Commission, 1980.
-
"Health Personnel Issues in the context of Long-Term Care in Nursing Homes," Work Group Report, Long-Term Care Task Force, August 18, 1980.
-
Manard, Barbara B., "The Final Injustice: Inequality, Welfare Policy and Old Age Institutions," Unpublished Doctoral Dissertation, University of Virginia, 1977.
-
See for example: Bruce Vladick, Unloving Care, New York, Basic Books, 1980.
-
See for example: Beatrice, Dennis F. "Licensure and Certification in Nursing Homes," in Stuart Altman and Harvey Sapolsky (eds.), Federal Health Programs: Problems and Prospects, Lexington, Massachusetts, D.C. Health and Co., 1981.
-
U.S. Department of Housing and Urban Development. Housing for the Elderly and Handicapped. Office of Policy Development and Research, HUD-PDR-301; January, 1979; page 16.
-
Ibid, page 10.
-
Dovell, Susan and Vanhorenbeck, Susan. The Impact of Federal Housing Programs on the Elderly. Congressional Research Service, Library of Congress. August, 22, 1979; page 20.
-
Ibid, page 22.
-
Ibid, page 43.
-
Ibid, page 30.
-
Ibid, page 50.
-
Estes, Carroll, The Aging Enterprise, San Francisco: Jossey-Bass Publishers, 1980.
-
"Long-Term Care for Our Senior and Disabled Citizens," S.2809, Submitted by Senator Packwood, Congressional Record, June 11, 1980, (S6645 - S6649); Vladeck, Bruce, Unloving Care, The Nursing Home Tragedy, New York: Basic Books, 1980.
-
Vladeck, Bruce, op. cit.; Dunlop, Burton David, The Growth of Nursing Home Care, Lexington: D.C. Health and Company, 1979.
-
See Working Paper #5 for a more detailed discussion of the impact of Social Security on the institutionalization of the disabled elderly.
-
Trager, Brahna, Home Health Care and National Health Policy, Special Issue of the Home Health Care Services Quarterly, Volume 1, Number 2, Spring, 1980.
-
Scanlon, William, Elaine Difederico, Margaret Stassan, Long-Term Care: Current Experience and A Framework for Analysis, Washington: The Urban Institute, February 1979.
-
Neugarten, Bernice, "Policy for the 1980s: Age or Need Entitlement?" National Journal Issues Book, November, 1979, Washington, D.C.
-
Subcommittee on Human Services of the Select Committee on Aging, Future Directions for Aging Policy: A Human Service Mode, Washington: U.S. House of Representatives Ninety-Sixth Congress, May, 1980; Federal Council on Aging, Public Policy and the Frail Elderly, Washington: U.S. DHEW, (79-20959), December, 1978.
-
Subcommittee on Human Services of the Select Committee on Aging, op. cit., page 4.
-
Meltzer, Judith and Frank Farrow, Federal Policy Directions in Long-Term Care, Paper prepared by the Center for the Study of Welfare Policy, Washington, June, 1980.
-
Subcommittee on Human Services of the Select Committee on Aging, op. cit.
-
Meltzer and Farrow, op. cit.
-
Comptroller General, Entering a Nursing Home -- Costly Implications For Medicaid and the Elderly, Report to the Congress, Washington: General Accounting Office, November 26, 1979.
-
Donabedian, Avedis, "Effects of Medicare and Medicaid on Access to and Quality of Health Care," Public Health Reports, Volume 91, Number 4, July - August, 1976, (322 - 332); Comptroller General, op. cit.
-
Comptroller General, op. cit.
-
Under Medicaid, states have the option of extending benefits to the medically needy: those whose incomes are above the standards for public assistance but not high enough to cover their medical expenses. Eligibility for Medicaid begins when the individual in paying for medical expenses has spent down to the State's income eligibility level. The states set the income standards used for eligibility determinations. Further, the states can extend the spend-down provisions only to those who could be considered categorically needy if state standards were as liberal as allowed (option 209 b) or to a broader range of persons whose incomes place them above eligibility standards for categorical assistance.
-
In some states without medically needy programs, special-needs caps have been established to assist individuals whose incomes are too high for Medicaid eligibility but too low to pay the full cost of institutional care. Higher income standards for eligibility extended to persons in nursing homes cannot exceed 300 percent of the SSI standard payment amount. In these situations, Medicaid pays the difference between the individuals' available income and the cost of nursing home care.
-
U.S. Department of Health, Education and Welfare, "Home Health and Other In-Home Services: Titles XVIII, XIX, and XX of the Social Security Act; A Report to Congress," November, 1979.
-
Kutza, Elizabeth A., "Allocating Long-Term Care Services: The Policy Puzzle of Who Should be Served," for the Long-Term Care Symposium, Williamsburg, Va, February, 1980.
-
DHHS, "Restricted Patient Admittance to Nursing Homes: An Assessment of Hospital Backup;" Office of the Inspector General, Service Delivery Assessment; May, 1980.
-
NCHS. "Home Care For Persons 55+", Vital and Health Statistics, Series #10, No. 73, DHEW Publication HSM 72-1062, 1972.
-
Branch, L.G., Fowler, F. "The Health Needs of the Elderly and Chronically Disabled in Massachusetts," March, 1975, Boston, Massachusetts.
-
Congressional Budget Office, Long-Term Care for the Elderly and Disabled, February 1977.
-
United States Senate, The Social Security Act and Related Laws, Committee on Finance, December 31, 1978.
-
Manard, Barbara, Cary Kart, and Dirk Van Gils, Old Age Institutions, D.C. Health, Lexington, Massachusetts, 1976.
-
See Appendix 5 for a full discussion of the relationship between Health Planning and nursing home bed supply.
-
Thompson, Marie, "The Elderly in Our Environment: Yesterday and Today," Challenge! Vol. X#8, August 1979. U.S. Department of Housing and Urban Development, p.6.
-
Nachison, Jerald, "Services for Congregate Housing: A New Direction for HUD," Challenge!, op cit. p.12.
-
Robinson, N., E. Shinn, E. Adam, and F. Moore, "Cost of Homemaker-Home Health Aide and Alternatives Forms of Service: A Survey of the Literature," New York: National Council for Homemaker-Home Health Aide Services, Inc., 1974.
-
Homemaker Upjohn, "Cost Analysis: Home Health Care as an Alternative to Institutional Care," Kalamazoo, Michigan, October, 1975.
-
General Accounting Office, letter to Rep. Edward I. Koch, MWD-76-30, B-164031(3), 17 September, 1975.
-
Craig, J., "Cost Issues in Home Health Care," in Marie Callender and Judy LaVor, Home Health Development, Problems, and Potential, Washington: Disability and Long-Term Care Study, Office of the Assistant Secretary for Planning Evaluation, Department of Health, Education and Welfare, April, 1975, pp.48-55.
-
Applied Management Sciences, "Evaluation of Personal Care Organizations and Other In-Home Alternatives to Nursing Home Care for the Elderly and Long-Term Care Disabled," Final Report and Executive Summary (Revised), Contract HEW-OS-74-294, Silver Spring, Maryland: AMS, 1 May 1976.
-
Assistant Secretary for Planning and Evaluation, Department of Health, Education and Welfare, "Critical Review of Research on Long-Term Care Alternatives Sponsored by the Department of Health, Education and Welfare," Washington, D.C., June, 1977.
-
Sager, A., "Learning the Home Care Needs of the Elderly: Patient, Family, and Professional Views of an Alternative to Institutionalization," Final Report on AOA Grant No. 90-A-1026, November 1979.
-
Burton, et al., "Nursing Home Cost and Care: An Investigation of Alternatives," in Multidimensional Functional Assessment: The OARS Methodology, 2nd edition, Duke University for the Study of Aging and Human Development, 1978.
-
Comptroller General of the United States (1977). The Well-Being of Older People in Cleveland, Ohio, HRD-77-70. U.S. General Accounting Office, Washington, D.C.
-
Dunlop, Burton D. "Expanded Home-Based Care for the Impaired Elderly: Solution or Pipe Dream?" American Journal of Public Health; May, 1980.
-
Weissert, W.G., T. Wan, B. Livieratos, "Effects and Costs of Day Care and Homemaker Services for the Chronically Ill: A Randomized Experiment," NCHSR Research Report Series, DHEW, Office of the Assistant Secretary for Health, National Center for Health Services Research, February, 1980.
-
Dunlop, Burton D., op cit., 1980.
-
This act, enacted in 1974, combined comprehensive Health Planning Hill-Burton, and Regional Medical Program functions into a single law.
-
S. 1513 of P.L. 96-79, the Health Planning and Resources Development Amendments of 1979.
-
The U.S. Virgin Islands also do not have CON Procedures.
-
The actions HSAs and SHPDAs have undertaken to affect the supply and distribution of long-term care services are discussed in Health Policy Institute, "National Review of Health Systems Planning for the Elderly," Boston University Center for Health Planning, 1980.
-
American Health Planning Association. "Health Planning Agency Effectiveness Under CON and 1122: Draft Final Report," typescript, June 30, 1980.
-
Unpublished data from Bureau of Health Planning, Health Resources Administration, DHHS.
-
Judith Feder and William Scanlon. "Regulating Bed Supply in Nursing Homes," Milbank Memorial Fund Quarterly: Health and Society, Volume 58, Number 1 (Winter 1980), 54-88.
-
Bruce Vladeck. Unloving Care: The Nursing Home Tragedy. (New York: Basic Books, Inc. 1980), pp. 127-129, 218.
-
The major disagreement between Vladeck and Feder and Scanlon is that Vladeck believes nursing homes should be cut in order to motivate the growth of new alternative services, while Feder and Scanlon feel that nursing homes supply should not be cut until alternatives take hold and we are certain that patients are receiving the levels of care they need.
-
Data are from the Master Facility Inventory, National Center for Health Statistics, DHHS.
-
The plan index and CON and 1122 reporting systems reports are ongoing and are currently being expanded.
-
The process and criteria to be used in CON reviews are specified in S. 1532 of the Public Health Service Act.