
TABLE OF CONTENTS
- RESULTS
- Factors Associated with Average Monthly Facility-Level Base Charges
- Factors Associated with Monthly Charges in Residents
- LIST OF FIGURES
- FIGURE 1: Average Monthly Facility Charge by Staffing Levels, 2010
- FIGURE 2: Average Monthly Facility Charge by Admission and Discharge Policies, 2010
- FIGURE 3: Average Monthly Resident Charge by Staffing Levels of Facilities in which Residents Live, 2010
- FIGURE 4: Average Monthly Resident Charge by ADL and IADL Help Received, 2010
- FIGURE 5: Average Monthly Resident Charge by Resident Characteristics, 2010
- LIST OF TABLES
- TABLE ES-1: Components of Average Monthly Facility Charges
- TABLE ES-2: Summary of Significant Predictors of Charges at the Facility and Resident Levels
- TABLE 1: Average Monthly Facility Base Charge by Types of Living Units, 2010
- TABLE 2: Facility Characteristics and Average Monthly Charges, 2010
- TABLE 3: Average Monthly Facility Charge by Rate Structure, 2010
- TABLE 4a: Average Monthly Facility Charge by Admission Policies, 2010
- TABLE 4b: Average Monthly Facility Charge by Discharge Policies, 2010
- TABLE 5: Average Monthly Facility Charge by Characteristics of Residents Served, 2010
- TABLE 6: Multivariate Analysis: Predictors of Facility Average Monthly Charges, 2010
- TABLE 7: Average Monthly Resident Charge by Characteristics of Facilities in which They Live, 2010
- TABLE 8: Average Monthly Resident Charge by Rate Structure of Facilities in which They Live, 2010
- TABLE 9: Average Monthly Resident Charge by Characteristics of Living Units, 2010
- TABLE 10: Average Monthly Resident Charge by Resident Characteristics, 2010
- TABLE 11: Multivariate Analysis: Predictors of Monthly Charges to Resident, 2010
- TABLE 12: Summary of Significant Predictors of Charges at the Facility and Resident Levels
- TABLE A-1: Average Monthly Charge by Types of Living Units, 2010
- TABLE A-2: Creation of Average Facility Rate
ACKNOWLEDGMENTS AND DISCLAIMER
This study was funded by contract HHSP233201000021WI from the Office of the Assistant Secretary for Planning and Evaluation (ASPE)/U.S. Department of Health and Human Services (HHS). The authors gratefully acknowledge the helpful comments on this report by Emily Rosenoff of ASPE/HHS, the data assistance of Robert Krasowski of the Research Data Center of the HHS National Center for Health Statistic, and assistance with literature review by Trini Thach and of report preparation by Molly McGinn-Shapiro, both of RTI International. The views expressed in this paper are solely those of the authors and do not necessarily represent the views of HHS or of RTI International.
The following acronyms are mentioned in this report and/or appendix.
| ACRONYMS | |
|---|---|
| ADL | Activity of Daily Living |
| ADCU | Alzheimer's/Dementia Care Unit |
| ANOVA | Analysis of Variance |
| ASPE | HHS Office of the Assistant Secretary for Planning and Evaluation |
| HCBS | Home and Community-Based Services |
| HHS | U.S. Department of Health and Human Services |
| HPRD | Hours Per Resident Day |
| IADL | Instrumental Activity of Daily Living |
| LPN | Licensed Practical Nurse |
| LTC | Long-Term Care |
| LVN | Licensed Vocational Nurse |
| MSA | Metropolitan Statistical Area |
| NCHS | HHS National Center for Health Statistics |
| NF | Nursing Facility |
| NSRCF | National Survey of Residential Care Facilities |
| PCA | Personal Care Aide |
| RCF | Residential Care Facility |
| RN | Registered Nurse |
| SE | Standard Error |
| SNF | Skilled Nursing Facility |
Purpose and Research Questions
The long-term care (LTC) delivery system has historically favored institutional services, such as nursing home care, over home and community-based services (HCBS). Over the last 20 years, however, HCBS, including residential care facilities (RCFs), have grown in importance, reflecting consumer preferences. RCFs include a broad array of facilities, many of which provide similar services but go by a variety of names, including assisted living facilities, board and care homes, personal care homes, and homes for the aged. RCFs provide room-and-board plus services to persons who need assistance with activities of daily living (ADLs), such as bathing and dressing, or help with health-related services, such as managing medications. In 2010, there were 31,100 RCFs in the United States serving 733,300 residents of all ages and with a wide range of conditions.
Unlike nursing homes, most RCFs serve individuals who pay privately, and part of the appeal of these facilities is that they cost less than nursing homes. Medicaid does not pay for the room-and-board portion of RCF charges but may pay for some of the services provided. Although most residents are private pay, Medicaid pays for some LTC services in RCFs for about one-fifth of the residents. There are great variances in RCF charges, depending on locality, state Medicaid policies, facility characteristics, and resident characteristics. Existing studies provide information on average or median RCF charges for residents but offer little insight on which factors explain the variance in charges. This study addresses that gap in knowledge by addressing the following two research questions:
-
At the facility level, what factors affect the average monthly base rates that RCFs charge?
-
At the resident level, how are individual residents' total monthly residential care charges (base rate plus any additional fees) affected by their health conditions and functional status, and by the nature (e.g., amenities, services, staffing, types of living units) of the facilities in which they live?
Data and Methods
This study uses merged facility and resident data from the 2010 National Survey of Residential Care Facilities (NSRCF), which was sponsored by the U.S. Department of Health and Human Services (including the National Center for Health Statistics, the Office of the Assistant Secretary for Planning and Evaluation, and the Agency for Healthcare Research and Quality), the U.S. Department of Veterans Affairs, and other federal agencies. The survey focuses on facilities that serve older (aged 65 or older) people and younger adults (aged 18-64) with physical disabilities. Facilities that exclusively served people with severe mental illness or people with intellectual and developmental disabilities were excluded from this survey; however, facilities included in this survey may serve those populations, so people with those conditions are included among the resident sample.
Facilities vary considerably in the ways that they structure monthly charges. The NSRCF facility data report the average monthly base rate charge by the type of living quarters, which varies by the number of people for which it is intended (1, 2, 3, or more) and whether it is a single room or an apartment. Additionally, base rate charges by type of living quarter were reported separately by whether the living unit was part of a designated Alzheimer's/dementia care unit (ADCU) or a general care unit. Facilities may charge all residents the same base rate for a given type of living quarter, or the rate may be adjusted for the resident's level of disability. Further, base rates may be all-inclusive, or facilities may charge additional fees for specific types of services. Table ES-1 describes the types of services that may or may not be included in the base rate charges.
| TABLE ES-1. Components of Average Monthly Facility Charges |
|---|
Average monthly base rate, varies by type of living quarters and whether dementia specific or not. Base rates may either be flat (i.e., the same for all residents) or may be case mix adjusted.The base rate may include these services, or the facility may make them available for an additional charge:
Additionally, base rates may include a varying number of meals:
|
For analysis purposes, we created a single, average monthly facility charge variable. The overall average rate was weighted by the percentage of living quarters located in ADCUs and by the distribution of the types of living units. Details of the construction of this charge are in the Technical Appendix.
The weighted average monthly facility rate reflects the base rate only; it does not include any additional charges that may be imposed. By contrast, the resident-level charges are reported as total charges (i.e., base rate plus any additional charges) to the resident in the last month. The analyses presented in this study for average facility base charges and for the total resident-level charges present a fuller picture of the issues related to determinants of RCF charges. All data represent the amounts charged in 2010 dollars. The amounts charged may differ from the amounts actually paid, at either the resident or facility level.
Results
Several variables, capturing aspects of the facility characteristics, rate structure, staffing practices, living quarters, and types of residents served, had similar effects at the facility and resident levels (Table ES-2). Facilities that offered specialized services to people with dementia, either through an ADCU within a larger facility or as the sole focus of the RCF, had higher charges, as did facilities that charged additional fees at the time of admission. Residents who lived in dementia care units or facilities, and in facilities that charged additional fees at the time of admission, also experienced these higher monthly charges. Facilities that offer greater levels of service, as measured in hours of direct care per resident per day, and that offered more employment benefits to personal care aides (PCAs) had greater average monthly charges, and these higher charges were experienced by residents as well. The type of living quarter provided affected charges. Facilities with a greater share of rooms for two or more people had lower average monthly charges, and the individuals who lived in such quarters were charged less each month. Having greater competition for potential residents, as measured by the number of Medicare-certified nursing facility (NF) and skilled nursing facility (SNF) beds per 1,000 people in the county, had the anticipated effect of lowering charges at both the facility and resident levels. Finally, certain resident characteristics affected charges at both levels. Individuals who had any memory impairment or confusion, and facilities that served greater proportions of residents with such impairments, had higher average monthly charges. Hispanic or non-White residents had lower monthly charges, and facilities that served a greater number of Hispanic or non-White residents had lower average monthly charges.
Average facility-level charges were also affected by other factors, most of which reflect facility policies and rate structure. For-profit RCFs had higher average monthly charges. Facilities that are certified by or participate in Medicaid had lower average monthly charges. Although Medicaid does not pay for room-and-board costs, several states impose limits on what RCFs may charge Medicaid-eligible residents for room-and-board, which may lower the average charges in facilities that participate in Medicaid. Facilities that offer more services in the base rate had higher average monthly charges. Serving a broader range of resident needs, as indicated by a greater number of policies that allow admission of residents with these needs, also increased the average monthly charges. Finally, RCFs that provide services to people with intellectual or developmental disabilities, or to people with severe mental illness, had lower average monthly charges. It is likely that people with these disabilities who are served by the facilities represented in this survey1 (i.e., facilities that do not specialize in serving people with such disabilities), have relatively low care needs.
| Predictors of Average Monthly Base Facility Charge | Predictors of Total Monthly Charge to Residents | ||
|---|---|---|---|
| Facility Characteristics | |||
|
| ||
| Types of Living Units | |||
|
| ||
| Facility Rate Structure | |||
|
| ||
| Staffing Levels and Practices | |||
|
| ||
| Types of Residents Served | |||
|
| ||
| Market Characteristics | |||
|
| ||
| NOTE: "+" and "-" indicate that the variable significantly increased or decreased charges, respectively. | |||
At the resident level, other factors affecting the monthly charges included both variables that reflect the nature of the facilities in which they live, and characteristics and care needs of the residents themselves. The location of the facility in which a resident lives affects the charges the resident experiences. Residents of RCFs that are in metropolitan statistical areas (MSAs) and of RCFs that are co-located with other health care facilities experience higher monthly charges. Residents of RCFs with greater availability of activities director time had lower monthly charges. It may be that the greater rates of activity time reflect lower care needs of residents, and a substitution of that time for higher-cost nursing time, both of which contribute to lower charges. Residents of RCFs that discharged residents with a greater range of care needs, as indicated by the number of discharge policies in place, had lower monthly charges. Residents of facilities with such discharge policies are likely to be more independent (as they would otherwise be discharged), so that lower charges are understandable. Residents with greater care needs, as indicated by having a brain injury, behavioral symptoms, or greater number of ADL impairments, all experienced higher monthly charges, as did those who use a manual wheelchair. Those who were younger than 65 and those with lower incomes, as indicated by the receipt of any Medicaid-paid LTC in the previous month, had lower average monthly charges. Residents who elected a living unit with cooking amenities had higher monthly charges as well.
Discussion
This research contributes to the scant literature on charges for RCFs. It highlights the complex factors that affect charges, both at the facility and resident levels. These factors include a variety of facility characteristics, policies, and practices; resident characteristics; and market characteristics. At the facility level, the analyses offer understanding of factors affecting the average charges levied by facilities, and provide insight into policies that may be used to control charges. At the resident level, the analyses illustrate factors affecting the total monthly amount that residents are charged, and offer guidance to individuals who are considering life in an RCF.
The findings presented here highlight areas for future research. A key question concerns the role of Medicaid in facilitating access to RCF. Although Medicaid does not pay for the room-and-board costs of RCF care, it may pay for the services provided by those facilities. Additionally, several states have policies that limit the room-and-board rates that RCFs may charge to Medicaid-eligible individuals. The findings here show that RCFs that participate in Medicaid have lower average monthly charges; and individuals who are receiving Medicaid-paid LTC are charged less than those who are not. Further research could illuminate the ways in which Medicaid policies and practices affect charges and the services available to low-income individuals.
Finally, although some facilities served people with intellectual and developmental disabilities or with severe mental illness, those that served such people exclusively were excluded from the survey. The findings presented here thus are only a partial picture of the experiences of people with those types of disabilities. Additional inquiry is needed to better understand the types of facilities in which people with intellectual and developmental disabilities and mental health disabilities live, and the factors that affect the charges they experience.
The long-term care (LTC) delivery system has historically favored institutional services, such as nursing home care, over home and community-based services (HCBS). Over the last 20 years, however, HCBS, including residential care facilities (RCFs), adult day services centers, and personal care, have grown in importance, reflecting consumer preferences. Surveys also demonstrate that older Americans would prefer to be cared for in RCFs over nursing homes (Brodie & Blendon, 2001), but the increasing costs of LTC may create barriers to access for low-income and moderate-income individuals (Hawes, Phillips, Rose, Holan, & Sherman, 2003).
RCFs include a broad array of facilities, many of which provide similar services, but use a variety of names, including assisted living facilities, board and care homes, personal care homes, and homes for the aged. RCFs provide room-and-board, plus services to persons who need assistance with activities of daily living (ADLs), such as bathing and dressing, and help with health-related services, such as managing medications. In 2010, there were 31,100 RCFs in the United States serving 733,300 residents of all ages and with a wide range of conditions (Caffrey et al., 2012; Park-Lee et al., 2011). By comparison, in the same year, the United States had 15,682 nursing homes with more than 1.6 million beds, serving almost 1.4 million residents (Kaiser Family Foundation, 2012).
Unlike nursing homes, most individuals living in RCFs pay privately, and part of the appeal of these facilities is that they cost less than nursing homes and that some facilities offer a more homelike environment. For 2014, Genworth Financial (2014) estimates that the median charge for a year in a one-bedroom apartment in an assisted living facility is $42,000 compared with $87,600 for a private room in a nursing home. This price differential has been found in other surveys (MetLife Mature Market Institute, 2012). Additionally, some RCFs specialize in services for people with dementia, or may offer a unit that is dedicated to support for people with dementia; costs in these dementia care units or facilities generally are higher than in other RCFs (Zimmerman, Sloane, & Reed, 2014).
Although most residents are private pay, about one-fifth of residents have their LTC paid at least in part by Medicaid (Caffrey et al., 2012; Carlson, Coffey, Fecondo, & Newcomer, 2010; Greene, Wiener, Khatutsky, Johnson, & O'Keeffe, 2013). Medicaid cannot pay for the room-and-board portion of RCF charges but may pay for the services provided. Additionally, several states limit the amount that RCFs may charge residents for room-and-board, as part of efforts to reduce financial barriers to these facilities. In some states, such as Oregon, Washington, and Wisconsin, RCFs are an important part of state strategies to change the balance of the LTC from nursing homes to HCBS (Kane & Cutler, 2008; Wiener & Lutsky, 2001). State Medicaid programs can provide funding for residential care through Medicaid HCBS waivers, State Plan personal care, and through Section 1115 Research and Demonstration waivers (Greene et al., 2013; Mollica, 2009; O'Keeffe et al., 2010). States' interest in RCFs is motivated by a desire to offer a full array of HCBS, to address the right to HCBS embodied in the U.S. Supreme Court's Olmstead decision,2 to reduce nursing home use, and to achieve the economies of scale of a group residential setting without the undesirable institutional characteristics found in many nursing homes (O'Keeffe & Wiener, 2005).
Although recent trends exhibit a slowly expanding market for residential care and a correspondingly slow decline in private pay nursing home occupancy, little data exist on what this shift means for financing at the resident level (Grabowski, Stevenson, & Cornell, 2012). Despite the important role played by RCFs in the LTC system, little information exists on the charges for staying in these facilities. There are great variances in RCF charges, depending on locality, state Medicaid policies, facility characteristics, and resident characteristics. Existing studies provide information on average RCF charges for residents but offer little insight on which of these factors may explain the variance in charges.
Numerous factors may contribute to variation in the amounts charged by RCFs, including facility structure and policies, the services provided, the types of people served, and the local market environment. Understanding variation at this level is important to guiding future policy development. At the same time, individuals are concerned with the charges that they face. They may be interested in information that will help guide them in identifying RCFs that both meet their needs and preferences, and that are affordable to them. This study addresses the determinants of RCF charges, which will be examined at both the facility and resident level. Specifically, this report addresses the following questions:
-
How are average monthly facility-level charges affected by characteristics of the facility (e.g., ownership, location, types of living units, staffing levels, size); rate structure (e.g., number of services included in the base rate, whether the base rate varies by needs of the resident); the types of residents served; and local market conditions?
-
How do the monthly charges experienced by residents vary by the characteristics of the facilities in which they live, the rate structure of the facilities in which they live, the characteristics of the living units (e.g., size of living unit, available amenities), local market conditions, and their own characteristics (e.g., demographics, health and functional needs)?
This study uses merged facility and resident data from the 2010 National Survey of Residential Care Facilities (NSRCF), which was sponsored by the U.S. Department of Health and Human Services (including the National Center for Health Statistics (NCHS), the Office of the Assistant Secretary for Planning and Evaluation, and the Agency for Healthcare Research and Quality), the U.S. Department of Veterans Affairs, and other federal agencies (Moss, Harris-Kojetin, & Sengupta, 2011). To be eligible for the survey, facilities had to be licensed, registered, listed, certified, or otherwise regulated by a state; have four or more beds and at least one resident currently living in the facility; and provide room-and-board (at least two meals a day), round-the-clock onsite care or supervision, and help with ADLs (e.g., bathing, eating, dressing) or health-related services (e.g., medication management). Finally, this survey included only facilities that serve primarily an adult population. RCFs that exclusively serve people with severe mental illness or people with intellectual and developmental disabilities were excluded from this survey.
Because states vary in how they regulate RCFs, sampled facilities were regulated under many names, including assisted living residences, board and care homes, congregate care facilities, enriched housing programs, homes for the aged, personal care homes, adult care homes, and housing with services establishments.
The NSRCF was conducted between March 2010 and November 2010 using a two-stage probability sampling design in which RCFs were sampled first, and then, depending on facility size, 3-6 current residents from each facility were sampled. In-person interviews were conducted with facility directors and designated staff to obtain information about the facility. Information on individual residents was collected from staff knowledgeable about those residents; no interviews were conducted with residents themselves. Data were collected on 2,302 facilities and 8,094 current residents. The facility weighted response rate was 81 percent and the resident weighted response rate was 99 percent.
For the facility-level analysis, data from the facility questionnaire were merged with local market characteristics from the 2010 Area Resource File (Health Resources and Services Administration, 2012) using Federal Information Process Standards county codes. We also merged a set of state identifiers based on an RTI-developed typology. Similarly, for the resident-level analysis, data from the resident questionnaire were merged with the Area Resource File and state identifiers. In addition, select facility-level characteristics were added to the resident file to provide data about characteristics of the facilities in which individuals were living that may affect the total charges to the resident. The data merges and analyses were conducted at the Research Data Center of the NCHS, with the help of Research Data Center staff. The Research Data Center has special provisions to protect the confidentiality of respondent facilities and residents.
We conducted two sets of analyses, one at the facility level and the other at the resident level. Analyses of average monthly facility base charges were conducted using responses from the facility questionnaire, linked with the Area Resource File and state identifiers as described above. At the facility level, the dependent variable is the average monthly base charge by the facility to its residents. At the facility level, the NSRCF collects information on the average monthly base rate charged by the facility for each type of living situation, defined by the type of living unit (e.g., one-person room, two-bedroom apartment) and whether the living unit is part of an Alzheimer's/dementia care unit (ADCU) or part of a general living unit. Base charges include room-and-board, plus any services included in the base rate. These base charges are reported separately for each type of living situation offered (see Table 1). Charges varied considerably by living unit, from an average of $1,695 per person living in a three-person room in a general living unit to an average of $4,813 for a person living in a one-bedroom apartment in an Alzheimer's care unit. We used these data to construct a single weighted average monthly charge for each facility that accounts for the mix of living arrangements and types of units (Alzheimer's special care or general). This weighting procedure is described in detail in the Technical Appendix.
| Characteristics of Living Quarters | Total RCFs n=2,168% | Facility Charges for Each Type of Living Quarters(average $ per resident) | SE |
|---|---|---|---|
| Types of Living Quarters in General Care Unit | |||
| Rooms designed for 1 person | 63.1 | $2,787 | $41 |
| Rooms designed 2 persons | 59.3 | $2,430 | $42 |
| Rooms designed for 3 or more persons | 6.6 | $1,695 | $86 |
| 1-bedroom apartments | 18.3 | $3,281 | $49 |
| 2-bedroom apartments | 9.3 | $3,788 | $82 |
| 3-bedroom apartments | # | # | # |
| Studio apartments | 17.1 | $2,921 | $41 |
| Types of Living Quarters in Alzheimer's Care Unit | |||
| Rooms designed for 1 person | 9.4 | $4,085 | $113 |
| Rooms designed 2 persons | 7.4 | $3,594 | $94 |
| Rooms designed for 3 or more persons | # | # | # |
| 1-bedroom apartments | 3.3 | $4,813 | $121 |
| 2-bedroom apartments | # | # | # |
| 3-bedroom apartments | # | # | # |
| Studio apartments | 6.1 | $4,492 | $87 |
| #: Sample size is too small (n30) to report by NCHS standards. †: Estimate cannot be assumed to be reliable, Sample size is between 30 and 59 and/or the sample size is greater than 59 but has a relative SE of 30% or more. | |||
The second set of analyses was conducted at the resident level. At the resident level, the NSRCF collects data on the total amount charged to the sampled individual resident in the previous month. This amount includes the base rate plus any additional charges to that resident.3
The amounts reported by the facilities, at both the facility and resident levels, are the amounts charged, not the amounts paid. For Medicaid residents, the amount paid by Medicaid is likely to be less than the amount charged, but the NSRCF does not collect information on the amount actually paid by Medicaid for residential care services. For some other residents as well, the amount paid may be less than the amount charged. Charges are reported in 2010 dollars.
For the descriptive analyses, we analyzed the bivariate relationships between the independent variables and the dependent (charge) variables. Continuous independent variables were recoded into categorical variables. Depending on the observed distributions, these variables were recoded into two groups relative to the median value (i.e., less than or equal to the median; greater than the median), or into a greater number of categories (e.g., quartiles of the distribution). Significant differences were tested using one-way analysis of variance (ANOVA). A facility-level regression model estimated the effects of various characteristics on the average monthly facility charge.
Analyses at the resident level show both resident-level information, and facility-level information that is matched to residents in those RCFs. A resident-level regression model estimated the effects of facility, resident, and local market characteristics on the monthly charge to the resident. The distribution of facility characteristics shown in the facility-level analyses will differ from the distributions of those same characteristics in the resident-level analyses. This is because, in the latter set of analyses, the characteristics describe the facilities in which residents live. More residents live in larger facilities, and therefore the distributions of the characteristics are altered.
Bivariate analyses include only those cases that were included in the regression model (i.e., cases with no missing data on any of the relevant variables). For the facility-level analysis, our analyses included 2,168 facilities (94.2 percent of the total sample). At the resident level, our analyses included 7,256 individuals (89.6 percent of the total sample).
We follow NCHS's conventions by presenting only those estimates that are statistically reliable and have at least the minimum appropriate sample size. All analyses are conducted in SUDAAN® Software for Statistical Analysis of Correlated Data (Research Triangle Institute, 2008). The stratification variables of number of beds and census region, in addition to the final sample weights for the facilities and residents and the sampling design method, were incorporated into the SUDAAN procedures to account for the complex sampling design. Only weighted results are presented. Differences with probability of 0.05 or less are considered statistically significant and are reported in the text.
Factors Associated with Average Monthly Facility-Level Base Charges
A key policy concern is whether the variation in facility-level charges reflects meaningful differences in the characteristics of the RCFs, the ways in which they are structured, the services they provide, and the residents that they support. Our descriptive analyses focus on facility features, such as general facility characteristics (e.g., size, ownership, geographic location), rate structure, admission and discharge policies, services offered by facilities, staffing levels, and characteristics of the residents served; and the variation in average monthly charges by these features. All differences discussed were statistically significant at p0.05, unless otherwise indicated.
Facility Characteristics
Table 2 presents the average monthly facility charges in RCFs by facility characteristics. In 2010, the average monthly charge for all RCFs was $2,755, which amounts to an average annual charge of $33,060. The total charge for facilities varied significantly by size; the monthly average charge for small facilities (between 4 and 10 beds) was $2,596, compared with $2,641 for medium-sized facilities (11-25 beds), to $3,028 for large-sized facilities (26-100 beds), and $3,129 for extra-large RCFs (101 or more beds). Although the reasons for these differences are unclear, larger facilities may have more costly amenities and higher administrative costs.
There were no significant differences in facility charges by ownership status: private, for-profit facilities charged on average $2,750 compared with $2,781 for non-profit or government facilities. However, there were statistically significant differences by chain status: chain facilities charged significantly more on a monthly basis than independent facilities ($2,999 vs. $2,611).There were also significant differences in charges by location. Facilities located in Metropolitan Statistical Areas (MSAs) charged significantly more than facilities in rural, non-MSA locations ($2,800 vs. $2,562). Chain-affiliated RCFs may have administrative costs that independent RCFs do not. Those located in MSAs may face greater costs of fuel, taxes, and other public services.
RCFs vary in whether they specifically focus on residents with dementia or cognitive impairment. The majority (83.3 percent) of RCFs did not exclusively serve people with dementia or offer dementia special care units. About one in ten (10.5 percent of) facilities reported having a dementia special care unit, and 6.1 percent of facilities exclusively served residents with dementia. Because dementia units generally claim to have higher staffing and a specialized program, these types of facilities were expected to have higher charges. Charges varied significantly by dementia focus. Facilities that serve only people with dementia had the highest average monthly charges ($3,817); facilities that have a dementia care unit had average monthly charges of $3,538, averaged across all care units (general and dementia-focused). Facilities that did not have specialized dementia care programs had the lowest average monthly charge: $2,578.
| Characteristics of RCFs | Total RCFs n=2,168% | Facility Charges (average $ per resident) | SE | Significance Test p-valuea |
|---|---|---|---|---|
| Total | $2,755 | $28 | --- | |
| Facility size | --- | --- | --- | 0.0001 |
| 4-10 beds | 50.2 | $2,596 | $48 | --- |
| 11-25 beds | 16.1 | $2,641 | $49 | --- |
| 26-100 beds | 27.3 | $3,028 | $40 | --- |
| 100 + beds | 6.4 | $3,129 | $72 | --- |
| Ownership | --- | --- | --- | 0.7081 |
| For-profit | 82.4 | $2,750 | $30 | --- |
| Non-profit/government | 17.6 | $2,781 | $78 | --- |
| Part of a multifacility chain | --- | --- | --- | 0.0001 |
| Yes | 37.0 | $2,999 | $46 | --- |
| No | 63.0 | $2,611 | $36 | --- |
| Facility is located in a MSA | --- | --- | --- | 0.0008 |
| Yes | 81.2 | $2,800 | $32 | --- |
| No | 18.8 | $2,562 | $63 | --- |
| Facility has a focus on people with dementia | --- | --- | --- | 0.0001 |
| Facility serves only people with dementia | 6.1 | $3,817 | $138 | --- |
| Facility has a dementia care unit | 10.5 | $3,538 | $57 | --- |
| Facility does not have a dementia care unit | 83.3 | $2,578 | $31 | --- |
| Other types of health care facilities are located on the grounds (nursing home, rehabilitation facility, hospital) | --- | --- | --- | 0.0001 |
| Yes | 12.3 | $3,133 | $67 | --- |
| No | 87.7 | $2,702 | $31 | --- |
| Number of Medicare-certified beds in SNF or NF per 1,000 people | --- | --- | --- | 0.1286 |
| 4.06 (median) | 50.0 | $2,799 | $42 | --- |
| >4.06 (median) | 50.0 | $2,711 | $39 | --- |
--- = no data for this cell.
| ||||
Co-location with other health care facilities or providers (nursing homes, rehabilitation facilities, or hospitals) also affected the monthly charges. RCFs can be freestanding (87.7 percent) or be located on the same grounds with a nursing home, rehabilitation facility, or a hospital (12.3 percent). Co-located facilities reported significantly higher monthly charges compared with freestanding facilities ($3,133 vs. $2,702). Correlation analyses indicate that co-located RCFs are more likely to be part of multifacility chains, require additional fees at the time of admission, offer a greater number of benefits to employees, and be more likely to offer a dementia care unit (data not shown)--all factors that are associated with higher charges.
Last, we stratified RCFs into two groups: those in counties at or below the median of 4.06 nursing home beds per 1,000 individuals of all ages, and those located in counties with a nursing home bed supply greater than the median. We anticipated that a greater supply of nursing home beds might result in greater competition for potential residents, and thereby lower RCF charges. Results indicated no statistically significant difference in monthly average charges in facilities located in these two areas of interest, with average monthly charges of $2,799 and $2,711, respectively.
Rate Structure
According to the NSRCF study definition, RCFs were eligible for the survey if they provided help with ADLs (e.g., bathing, eating, dressing) or health-related services (e.g., medication management). These services could be offered as part of the base rate or made available for an extra fee. Thus, the average monthly facility charge may differ based on how RCFs structure their rates, including such factors as the types of services included, the amounts of staffing, and whether rates are adjusted by the anticipated care needs of the resident (Table 3).
More than half (51.8 percent) of RCFs indicated that the base rate charged was adjusted by the anticipated level of care needed by the resident. Surprisingly, we found no significant differences in facility charges based on whether the facility had a flat rate ($2,743) or a rate adjusted based on the level of need ($2,767). However, facilities that charged an entrance fee or required a deposit at the time of admission (44.6 percent) had a significantly higher average charge compared with those that did not ($3,057 vs. $2,512). This higher average monthly charge is in addition to the required admission fees.4
RCFs may make a number of services available to residents, either as part of the base rate or by offering them for purchase. These services include such things as assistance with ADLs, incontinence care, or transportation to appointments, as well as more medically oriented services such as skilled nursing and physical or occupational therapy. Very few RCFs (5.5 percent) do not include any of these services in the base rate; more than three-quarters of them include two or more services as part of the base rate. More than one-third (35.5 percent) of RCFs do not offer any of these services for purchase, either including them in the base rate or not offering them at all. Viewed together, these data indicate that most RCFs provide these services through a combination of services that are included in the base rate and services that are available for purchase at an extra charge. Thus, the average monthly facility charge data reported here may not fully indicate the charges to an individual for living in a particular facility. Overall, the average monthly charges increased with the number of services included in the base rate, but these differences were not statistically significant. Average monthly charges also increased with the number of services available for purchase, and these differences were statistically significant.
| Characteristics of Rate Structure | Total RCFs n=2,168% | Facility Charges (average $ per resident) | SE | Significance Test p-valuea |
|---|---|---|---|---|
| Base rate structure | --- | --- | --- | 0.6831 |
| Flat rate | 48.2 | $2,743 | $43 | --- |
| Rate adjusted by level of care | 51.8 | $2,767 | $38 | --- |
| Additional admission fees required (either entrance fee or deposit) | --- | --- | --- | 0.0001 |
| Yes | 44.6 | $3,057 | $35 | --- |
| No | 55.4 | $2,512 | $42 | --- |
| Number of services included in base rateb | --- | --- | --- | 0.2472 |
| None | 5.5 | $2,680 | $94 | --- |
| 1 | 17.4 | $2,713 | $50 | --- |
| 2 | 28.7 | $2,690 | $47 | --- |
| 3 | 31.9 | $2,762 | $51 | --- |
| 4 or more | 16.5 | $2,925 | $98 | --- |
| Number of services available for purchaseb | --- | --- | --- | 0.0001 |
| None | 35.5 | $2,624 | $55 | --- |
| 1 | 18.9 | $2,599 | $67 | --- |
| 2 | 19.2 | $2,942 | $64 | --- |
| 3 | 13.6 | $2,892 | $71 | --- |
| 4 or more | 12.9 | $2,921 | $51 | --- |
| Facility participates in Medicaid | --- | --- | --- | 0.0001 |
| Yes | 49.3 | $2,562 | $41 | --- |
| No | 50.7 | $2,943 | $39 | --- |
| Number of benefits offered to PCAs | --- | --- | --- | 0.0001 |
| Nonec | 19.8 | $2,280 | $70 | --- |
| 1 | 32.4 | $2,472 | $46 | --- |
| 2 | 7.1 | $2,695 | $89 | --- |
| 3 | 8.8 | $2,922 | $93 | --- |
| 4 | 12.3 | $3,144 | $74 | --- |
| 5 | 19.6 | $3,405 | $61 | --- |
--- = no data for this cell.
| ||||
Although Medicaid does not cover room-and-board in these facilities, states can cover services provided by RCFs. Further, as part of strategies to increase access to RCFs for people with lower incomes, some states limit the amount that RCFs may charge Medicaid-eligible residents. Facilities may choose not to participate in Medicaid, to avoid these limitations and to maximize revenues. Almost half the RCFs (49.3 percent) reported that they were "certified or registered to participate in Medicaid." The average monthly charge in facilities that participate in Medicaid was significantly lower than that in those RCFs that do not participate in Medicaid. Medicaid-participating facilities charged on average $2,562 per month, about $380 per month less than non-participating facilities ($2,943).
Charges are anticipated to vary by how RCFs are staffed. Much of the care provided in RCFs is by personal care aides (PCAs), who provide unskilled support to individuals. Charges varied by the number of benefits the RCF offered to its PCAs, and charges increased as the number of benefits offered increased (e.g., paid time off, vacation time or sick time, individual or family health insurance, pension or life insurance). The average monthly charge by facilities that did not offer any benefits was $2,280 compared with a charge of about $3,405 by those facilities offering all five benefits to PCAs.
The average facility charge also varied based on the facility's staffing level (Figure 1). The greater the number of hours of direct care provided to residents, the higher the average facility charge. Direct care hours included time provided by PCAs, together with nursing staff (registered nurses/licensed practical nurses [RNs/LPNs]) and any direct care time provided by the RCF director. The lowest quartile of facilities provided between 0 and 1.8 hours of direct care time per resident per day; among the highest quartile, facilities provided more than 5.3 hours of direct care time per resident per day. The average monthly facility charge increased with the level of staffing, from $2,504 per month in facilities with the lowest quartile of staffing to $2,924 in facilities in the top quartile. The impact of staffing levels and employee benefits on total charges is consistent with the importance of labor-related charges in other, similar care settings. For example, labor-related expenses represent nearly 70 percent of the Medicare rate for skilled nursing facilities (SNFs), and employee benefits were roughly 16 percent of that total (Medicare Program; Prospective Payment System and Consolidated Billing for Skilled Nursing Facilities for FY 2014, 2013).
FIGURE 1. Average Monthly Facility Charge by Staffing Levels, 2010

SOURCE: RTI Analysis of the 2010 NSRCF.
NOTES: Divisions represent quartiles of staffing hours. Direct Care Hours = a sum of RN, LPN/LVN, and PCA hours.
In addition to nursing staff, PCAs, and directors, some facilities offered activity staff, and the average facility charge also varied by the number of activity director hours worked per resident per day. Interestingly, the greater the number of activity director hours per resident day (HPRD), the lower the average monthly facility charge. For example, if the facility did not have an activity director (i.e., no hours worked), the average facility charge was $2,901 compared with those facilities in the highest quartile of activity director hours worked (0.9 hours or more per resident day), in which the average monthly charge was about $500 less ($2,403). It may be that the presence of an activity director indicates that residents are relatively healthy and therefore have lower care needs in other areas.
Admission and Discharge Policies
| Facility will Admit Residents Who: | Total RCFs n=2,168% | Facility Charges (average $ per resident) | SE | Significance Test p-valuea |
|---|---|---|---|---|
| Are unable to leave the facility in an emergency without help | --- | --- | --- | 0.0001 |
| Yes | 55.9 | $2,990 | $41 | --- |
| No | 44.1 | $2,456 | $37 | --- |
| Need skilled nursing care on a regular basis | --- | --- | --- | 0.0466 |
| Yes | 20.5 | $2,877 | $70 | --- |
| No | 79.5 | $2,724 | $31 | --- |
| Need daily monitoring of health conditions | --- | --- | --- | 0.1666 |
| Yes | 81.0 | $2,773 | $32 | --- |
| No | 19.0 | $2,680 | $59 | --- |
| Are regularly incontinent (feces or urine) | --- | --- | --- | 0.0001 |
| Yes | 82.8 | $2,842 | $32 | --- |
| No | 17.2 | $2,337 | $58 | --- |
| Have moderate to severe cognitive impairment | --- | --- | --- | 0.0001 |
| Yes | 55.2 | $2,979 | $41 | --- |
| No | 44.8 | $2,480 | $37 | --- |
| Need two people/Hoyer lift to help in and out of bed | --- | --- | --- | 0.0001 |
| Yes | 32.4 | $3,044 | $59 | --- |
| No | 67.6 | $2,617 | $30 | --- |
| Exhibit problem behavior | | | | 0.0001 |
| Yes | 36.2 | $2,916 | $58 | --- |
| No | 63.9 | $2,664 | $30 | --- |
| Have a history of alcohol or drug abuse | --- | --- | --- | 0.0517 |
| Yes | 45.7 | $2,817 | $46 | --- |
| No | 54.3 | $2,703 | $36 | --- |
| Require end-of-life care | --- | --- | --- | 0.0001 |
| Yes | 61.7 | $2,922 | $35 | --- |
| No | 38.3 | $2,486 | $47 | --- |
| --- = no data for this cell. NOTE: "No" category includes the following responses: "No," "No specific policy--we make decisions on a case by case basis," and "Legitimate skip."
| ||||
Many RCFs are limited in the types of needs that they are able or willing to serve. RCFs may use a combination of admission and discharge policies to restrict residents to those whose needs they can meet. To some extent these restrictions are dictated by state licensure requirements, but other restrictions are the choice of facilities and may reflect the level and type of staffing available. To the extent that facilities cannot or do not retain residents as they become more disabled, aging in place is less possible.
| Facility will Discharge Residents Who: | Total RCFs n=2,168% | Facility Charges (average $ per resident) | SE | Significance Test p-valuea |
|---|---|---|---|---|
| Are unable to leave the facility in an emergency without help | --- | --- | --- | 0.0001 |
| Yes | 14.5 | 2,276 | 55 | --- |
| No | 85.5 | 2,837 | 32 | --- |
| Need skilled nursing care on a regular basis | --- | --- | --- | 0.3127 |
| Yes | 56.7 | 2,729 | 35 | --- |
| No | 43.3 | 2,789 | 47 | --- |
| Need daily monitoring of health conditions | --- | --- | --- | 0.0669 |
| Yes | 8.2 | 2,609 | 81 | --- |
| No | 91.8 | 2,768 | 30 | --- |
| Are regularly incontinent (feces or urine) | --- | --- | --- | 0.0001 |
| Yes | 12.5 | 2,327 | 56 | --- |
| No | 87.5 | 2,816 | 31 | --- |
| Have moderate to severe cognitive impairment | --- | --- | --- | 0.0001 |
| Yes | 18.1 | 2,469 | 49 | --- |
| No | 81.9 | 2,818 | 33 | --- |
| Need two people/Hoyer lift to help in and out of bed | --- | --- | --- | 0.0001 |
| Yes | 43.8 | 2,522 | 36 | --- |
| No | 56.2 | 2,937 | 41 | --- |
| Exhibit problem behavior | --- | --- | --- | 0.0001 |
| Yes | 42.8 | 2,617 | 36 | --- |
| No | 57.2 | 2,858 | 42 | --- |
| Have a history of alcohol or drug abuse | --- | --- | --- | 0.0480 |
| Yes | 34.0 | 2,678 | 46 | --- |
| No | 66.0 | 2,795 | 36 | --- |
| Require end-of-life care | --- | --- | --- | 0.0001 |
| Yes | 8.8 | 2,052 | 102 | --- |
| No | 91.2 | 2,823 | 29 | --- |
| --- = no data for this cell. NOTE: "No" category includes the following responses: "No," "No specific policy--we make decisions on a case by case basis," and "Legitimate skip."
| ||||
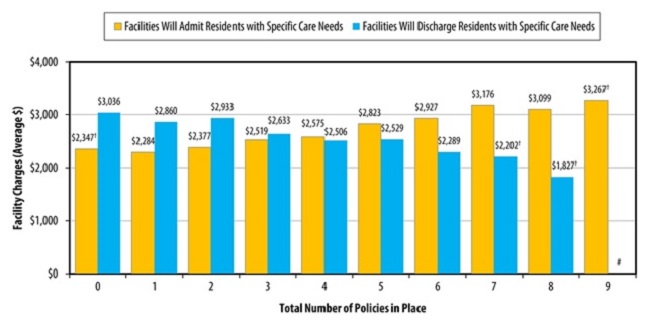
Table 4a and Table 4b present the average monthly facility charge by admission and discharge policies. Admission and discharge policies concern whether individuals are able to leave the facility in an emergency without help, whether skilled nursing is needed on a regular basis, whether daily monitoring of health conditions is required, whether the individuals are incontinent, whether individuals have moderate or severe cognitive impairment, and other similar needs. In nearly all cases, charges were significantly greater in facilities that admitted residents with these specific care needs compared with those that did not, and also were significantly greater in facilities that did not discharge residents who developed the care need. The only exceptions to this were in relation to the need for daily monitoring of health conditions, where neither admission nor discharge policies were related to average charges, and discharge policies related to the need for skilled nursing on a regular basis, which also did not affect average monthly charges. Moreover, the more of the populations that facilities admitted, the higher their average monthly facility charges (Figure 2). Average monthly charges also decreased as the number of discharge policies increased (i.e., as RCFs served fewer needs) (Figure 2). For example, facilities that admitted only one of the identified populations had average facility rates of $2,284, whereas facilities that admitted eight of the identified populations had average facility rates of $3,099. Likewise, facilities that retained all (i.e., discharged none) of the identified populations had average facility rates of $3,036, whereas facilities that discharged seven of the identified populations had average facility rates of $2,202.
FIGURE 2. Average Monthly Facility Charge by Admission and Discharge Policies, 2010
SOURCE: RTI analysis of the 2010 NSRCF.
#: Sample size is too small (n30) to report by NCHS standards.
†: Estimate cannot be assumed to be reliable, Sample size is between 30 and 59 and/or the sample size is greater than 59 but has a relative SE of 30% or more.
Characteristics of Residents Served
Table 5 shows the average monthly facility charge by characteristics of the residents served. The average monthly facility charge varied significantly by all of the demographic and health characteristics of the residents examined. Most facilities primarily served older people (85.9 percent), and these facilities had significantly higher monthly charges ($2,884 per month) than those in which less than half of the resident population was aged 65 or older ($1,969 per month), one of the largest differences in characteristics analyzed.
| Characteristics of Residents Served | Total RCFs n=2,168% | Facility Charges (average $ per resident) | SE | Significance Test p-valuea |
|---|---|---|---|---|
| Half or more of residents are age 65 or older | --- | --- | --- | 0.0001 |
| Yes | 85.9 | $2,884 | $28 | --- |
| No | 14.1 | $1,969 | $103 | --- |
| Percent of residents who are male | --- | --- | --- | 0.0001 |
| 26.0% (median) | 50.0 | $2,897 | $38 | --- |
| >26.0% (median) | 50.0 | $2,613 | $42 | --- |
| Percent of residents who are White | --- | --- | --- | 0.0001 |
| 100% (median=100%) | 48.8 | $2,605 | $40 | --- |
| =100% | 51.2 | $2,898 | $39 | --- |
| Any residents have developmental disabilities | --- | --- | --- | 0.0001 |
| Yes | 22.3 | $2,229 | $63 | --- |
| No | 77.7 | $2,906 | $31 | --- |
| Any residents have severe mental illness | --- | --- | --- | 0.0001 |
| Yes | 30.2 | $2,305 | $51 | --- |
| No | 69.8 | $2,950 | $33 | --- |
| Half or more of residents need help with one or more ADLsb | --- | --- | --- | 0.0001 |
| Yes | 53.2 | $2,993 | $42 | --- |
| No | 46.8 | $2,485 | $36 | --- |
| Percent of residents with memory impairment/confusion | --- | --- | --- | 0.0001 |
| 33.3% (median) | 47.4 | $2,419 | $37 | --- |
| >33.3% (median) | 52.6 | $3,058 | $40 | --- |
--- = no data for this cell.
| ||||
Other demographic characteristics of the facilities' residents included gender and race. Facilities with fewer male residents had significantly higher average monthly charges ($2,897 per month) compared with facilities with more male residents ($2,613 per month). Facilities with more residents who are White had significantly higher average facility charges ($2,898 per month) compared with facilities with fewer residents who were White ($2,605 per month).
The majority of the facilities did not have any residents with developmental disabilities (77.7 percent) or severe mental illness (69.8 percent). This is consistent with the design of the NSRCF, which excluded facilities that served only people with developmental disabilities or with severe mental illness. RCFs that did not have any residents with developmental disabilities had higher average monthly charges ($2,906) than did RCFs with some residents with developmental disabilities ($2,229). Similarly, those facilities without any residents with severe mental illness had significantly higher average facility charges at $2,950 per month than did RCFs with some residents with severe mental illness ($2,305 per month).
RCFs that serve greater numbers of residents requiring help with ADLs also have significantly higher average charges than those facilities that serve fewer residents with that need for help. The facilities in which at least half of the residents received assistance with one or more ADLs had significantly higher average charges ($2,993 per month) than those facilities that had fewer residents who received assistance with ADLs ($2,485 per month). Similarly, RCFs with a higher percentage of the residents with memory impairment or confusion also had significantly higher facility charges at ($3,058 per month) compared with those facilities with fewer residents who had memory impairment ($2,419 per month).
Multivariate Model for Facility-Level Charges
A regression model was estimated to better understand how various factors affected RCFs' average monthly charges (Table 6). The model included variables reflecting facility characteristics, the types of living units available, rate structure, staffing patterns, types of residents served, and market characteristics. This model explains more than 45 percent (r2=0.4606) of the variation in average monthly charges. After controlling for other variables, being a for-profit RCF was associated with a higher average monthly charge. Average monthly charges decreased as the share of living units that are rooms for two people or for three or more people increased. Additionally, having a greater share of living units that are one-bedroom apartments (compared with studio apartments) decreased the average monthly charge.5
RCFs that require extra fees on admission had significantly higher average monthly charges, as did those that include greater number of services in the base rate. RCFs that participate in Medicaid have lower average monthly charges. This may result from policies in several states that limit the rates that may be charged to Medicaid. Staffing levels and practices also affected the average monthly charge. Facilities that offered more benefits to their PCAs reported higher monthly charges, as did those that provided more direct care staffing per resident per day.
A number of characteristics of residents also increased average monthly facility charges. Facility charges increased as the number of policies permitting admission of residents with specific care needs increased; that is, as RCFs admit people whose care needs are expected to be greater, the average monthly charge increases. Average monthly charges were greater in facilities that served only residents with dementia and those that included a special care unit for residents with dementia. Average monthly facility charges also increased with the percentage of residents with memory impairment or confusion, even after controlling for the presence of a dementia care unit, and when half or more of residents needed any ADL assistance (not significant).
| Variables | Model Beta Coefficient n=2,168 | Significance Test p-valuea |
|---|---|---|
| Intercept | $1,520.73 | 0.0001 |
| Facility Characteristics | ||
| Ownership is for-profit | $158.24 | 0.0311 |
| Facility is part of a chain | $49.97 | 0.3298 |
| Facility is located in an MSA | $42.77 | 0.5214 |
| Other types of health care facilities are located on the groundsb | $111.81 | 0.1697 |
| Types of Living Units | ||
| Percent of living units that are rooms for 1 person | -$0.03 | 0.9674 |
| Percent of living units that are rooms for 2 people | -$4.22 | 0.0001 |
| Percent of living units that are rooms for 3+ people | -$8.61 | 0.0001 |
| Percent of living units that are 1-bedroom apartments | -$2.82 | 0.0119 |
| Percent of living units that are 2-bedroom or 3-bedroom apartments | -$2.75 | 0.2516 |
| Facility Rate Structure | ||
| Extra fees required upon admission | $169.56 | 0.0016 |
| Number of services included in base ratec | $117.73 | 0.0001 |
| Facility participates in Medicaid | -$247.72 | 0.0001 |
| Staffing Levels and Practices | ||
| Number of employment benefits offered to PCAs | $181.90 | 0.0001 |
| Direct care HPRDd | $48.87 | 0.0001 |
| Types of Residents Served | ||
| Number of policies that permit admission of residents with specific care needse | $51.62 | 0.0001 |
| Facility serves only people with dementia | $534.46 | 0.0001 |
| Facility has a dementia special care unit | $365.48 | 0.0001 |
| Any residents have developmental disabilities | -$245.19 | 0.0001 |
| Any residents have severe mental illness | -$183.38 | 0.0027 |
| Half or more of residents need help with one or more ADLsf | $104.56 | 0.0575 |
| Percent of residents with memory impairment or confusion | $3.70 | 0.0001 |
| Percent of residents who are male | $2.00 | 0.1071 |
| Percent of residents who are non-White | -$6.55 | 0.0001 |
| Market Characteristics and Medicaid Policy | ||
| Number of Medicare-certified beds in SNF or NF per 1,000 people | -$13.50 | 0.0404 |
| State dummy variable (p-value for the Wald-F statistic) | --- | 0.0001a |
| Model fit | r2= | 0.4606 |
--- = no data for this cell.
| ||
Several resident characteristics were found to decrease the average monthly facility charge. Charges were lower in facilities that served any residents with developmental disabilities and those that served any residents with severe mental illness. Average monthly facility charges also decreased as the percentage of residents who are non-White increased.
Market characteristics also had an impact on average monthly facility charges. Increasing numbers of Medicare-certified SNF or nursing facility (NF) beds per capita were associated with decreased average monthly facility charges, suggesting that these other facilities provide competition that reduces RCF charges. Dummy variables for states, shown in the aggregate only, also had an impact on average monthly facility charges. These state variables capture a variety of policy and market characteristics that are not measured separately.
Factors Associated with Monthly Charges to Residents
The NSRCF collected information about charges in two ways. In the previous section, we described factors associated with and predictive of average monthly facility charges, with the facility as the unit of analysis. These charges were measured as the average amount the facility charged its residents each month, for services included in the base rate only. In this section, we discuss the factors that are associated with and predictive of the total monthly charges experienced by individual residents who live in RCFs, with the individual serving as the unit of analysis. These charges include "the basic monthly charge and charges for any additional services,"6 whereas the average monthly charges at the facility level are for base charges only. This analysis examines the effects of the characteristics of the individual residents and the characteristics of the facilities in which the residents live on the charges that the individual residents incur.
Characteristics of Facilities in Which Residents Live
The overall average monthly charge for residents was $3,131, or $37,572 per year (Table 7). Ownership type was unrelated to charges, but all other facility characteristics were significantly related. Although, as seen previously, most RCFs are small, the majority of residents lived in large (26-100 bed) or extra-large (101+ beds) facilities (52.1 percent and 27.8 percent, respectively). Total charges to residents were significantly greater in larger RCFs than in smaller ones: $3,148 in 26-100 bed RCFs and $3,422 in 101+ bed RCFs, but only $2,708 in small RCFs (4-10 beds) or $2,662 in medium-sized RCFs (11-25 beds).
More than half (55.4 percent) of residents live in RCFs that are part of multifacility chains, and, those who do, experience significantly higher monthly charges ($3,354 as opposed to $2,854 for independent RCFs). Probably a result of the higher costs in urban areas, the 82.1 percent of residents who live in RCFs located in an MSA also experience significantly higher monthly charges ($3,245) than do those living in rural RCFs ($2,612).
| Characteristics of Facilities in which Residents Live | Total RCF Residents n=7,256% | Monthly Resident Charges (average $) | SE | Significance Test p-valuea |
|---|---|---|---|---|
| Total | --- | $3,131 | $36 | --- |
| Facility size | --- | --- | --- | 0.0001 |
| 4-10 beds | 10.5 | $2,708 | $56 | --- |
| 11-25 beds | 9.5 | $2,662 | $56 | --- |
| 26-100 beds | 52.1 | $3,148 | $46 | --- |
| 101+ beds | 27.8 | $3,422 | $91 | --- |
| Ownership | --- | --- | --- | 0.1751 |
| Non-profit/government | 74.3 | $3,102 | $41 | --- |
| For-profit | 25.8 | $3,217 | $74 | --- |
| Part of a multifacility chain | --- | --- | --- | 0.0001 |
| Yes | 55.4 | $3,354 | $49 | --- |
| No | 44.6 | $2,854 | $51 | --- |
| Facility is located in a MSA | --- | --- | --- | 0.0001 |
| Yes | 82.1 | $3,245 | $41 | --- |
| No | 17.9 | $2,612 | $55 | --- |
| Facility has a focus on people with dementia | --- | --- | --- | 0.0001 |
| Facility serves only people with dementia | 5.5 | $4,156 | $120 | --- |
| Facility has a dementia care unit | 29.6 | $3,820 | $75 | --- |
| Facility does not have a dementia care unit | 64.9 | $2,731 | $35 | --- |
| Other types of health care facilities are located on the grounds (nursing home, rehabilitation facility, hospital) | --- | --- | --- | 0.0001 |
| Yes | 22.3 | $3,452 | $75 | --- |
| No | 77.7 | $3,039 | $41 | --- |
| Some/all living quarters have cooking amenitiesb | --- | --- | --- | 0.0001 |
| Yes | 53.4 | $3,342 | $50 | --- |
| No | 46.6 | $2,890 | $50 | --- |
| All rooms and public areas have all safety featuresc | --- | --- | --- | 0.0001 |
| Yes | 68.9 | $3,327 | $44 | --- |
| No | 31.1 | $2,700 | $61 | --- |
--- = no data for this cell.
| ||||
Most (64.9 percent) of residents are living in RCFs that do not have a special focus on people with dementia, and they experience lower monthly charges ($2,731) than do people living in facilities that focus on people with dementia, either because they have a dementia care unit ($3,820) or because the RCF serves only people with dementia ($4,156). Note that within facilities that have a dementia care unit, the higher monthly charge represents an average across all residents whether or not they are living in the dementia care unit. As seen earlier, charges in dementia care units are greater than those in general care units.
Residents living in RCFs that are co-located with other health care facilities experience higher monthly charges ($3,452) than do the majority (77.7 percent) of residents who live in RCFs not co-located ($3,039).
Residents living in RCFs with greater access to cooking amenities and with safety features throughout individual rooms and public areas experienced significantly higher charges ($3,342 and $3,327, respectively) than did residents in facilities without those amenities ($2,890) or extensive safety features ($2,700).
Rate Structure of Facility
Table 8 describes average monthly charges to residents by the rate structure of the facilities in which they live. Slightly more than half (52.7 percent) of residents live in RCFs that charge a flat base rate, unadjusted by the anticipated level of care required by the individual. About two-thirds of all residents nationally live in RCFs that require a fee at admission (entrance fee or a deposit) in addition to the base rate charged each month. Moreover, there are also differences in what and how many services are included in the base rate or require additional charges. Almost 37 percent of residents live in facilities that include none or only one of listed services in the base rate, and 63.3 percent live in facilities that include two or more listed services in the base rate. Similarly, about 35 percent of residents live in facilities offering none or only one service for purchase, and 65 percent live in facilities offering two or more services for purchase.
The average monthly charges vary significantly by the rate structure of facilities where residents live. For example, residents who lived in facilities with a flat rate only were charged $2,978 on average whereas residents who lived in facilities adjusting their rates for the level of care were charged significantly more per month: $3,302. Similarly, residents in facilities that required an entrance fee or a deposit in addition to a base rate were also charged significantly more per month than residents in facilities without such a requirement ($3,388 vs. $2,629). Interestingly, residents in facilities that include none or only one service in the base rate were charged $3,345 on average, more than $300 per month more than residents in facilities that included two or more services in the base rate ($3,010). On the other hand, residents living in facilities in which none or only one service was for purchase were charged significantly less per month on average than residents living in facilities offering two or more services for purchase ($2, 649 and $3,384, respectively). These findings are difficult to interpret. It may be that, when fewer services are included in the base rate, individuals purchase them out of pocket so that the total average monthly charge shown here is greater.
| Rate Structure of Facilities in which Residents Live | Total RCF Residents n=7,256% | SE | Monthly Resident Charges (average $) | SE | Significance Test p-valuea |
|---|---|---|---|---|---|
| Base rate structure | --- | --- | --- | --- | 0.0001 |
| Flat rate | 52.7 | 1.4 | $2,978 | $50 | --- |
| Rate adjusted by level of disability | 47.3 | 1.4 | $3,302 | $51 | --- |
| Additional admission fees required (either entrance fee or deposit) | --- | --- | --- | --- | 0.0001 |
| Yes | 66.2 | 1.3 | $3,388 | $44 | --- |
| No | 33.8 | 1.3 | $2,629 | $57 | --- |
| Number of services included in base rateb | --- | --- | --- | --- | 0.0001 |
| None or 1 | 36.3 | 1.4 | $3,345 | $61 | --- |
| 2 or more | 63.7 | 1.4 | $3,010 | $45 | --- |
| Number of services available for purchaseb | --- | --- | --- | --- | 0.0001 |
| None or 1 | 34.4 | 1.3 | $2,649 | $55 | --- |
| 2 or more | 65.6 | 1.3 | $3,384 | $44 | --- |
| Number of benefits offered to PCAsc | --- | --- | --- | --- | 0.0001 |
| None | 5.4 | --- | $2,166 | $95 | --- |
| 1 | 14.0 | --- | $2,282 | $56 | --- |
| 2 | 6.4 | --- | $2,515 | $118 | --- |
| 3 | 9.7 | --- | $2,837 | $79 | --- |
| 4 | 22.5 | --- | $3,326 | $70 | --- |
| 5 | 42.0 | --- | $3,596 | $60 | --- |
--- = no data for this cell.
| |||||
Average charges to residents also increase with the number of employment benefits offered to PCAs. Employment benefits include health and life insurance, pension, and paid time off offered to PCAs in residential care communities. Paid time off was the most common fringe benefit offered to PCAs in residential care communities, followed in descending order by health insurance, life insurance, and pension; about half of all residential care communities offered health insurance to their PCAs (results are not presented; Khatutsky et al., in press) . Overall, in 2010, only slightly more than 5 percent of all residents lived in facilities that did not offer any fringe benefits to their personal care workers and about 40 percent of all residents lived in facilities that provided five different fringe benefits. In RCFs that do not offer any employment benefits to PCAs (including facilities that do not employ any PCAs), the average monthly resident charge was $2,166. This is more than $1,400 per month less than those RCFs that offer the most benefits to PCAs.
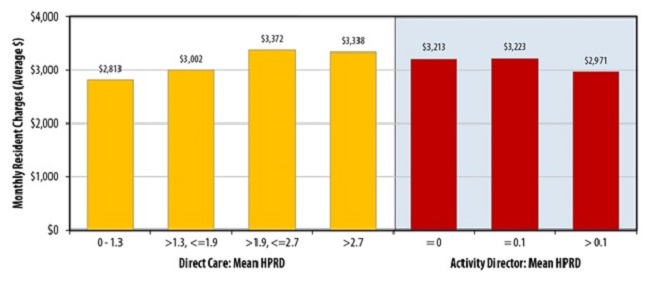
Figure 3 charts the bivariate relationship between charges and direct care staffing ratio (HPRD). As expected, the resident average monthly charges increase with each hour of direct care staffing per resident per day quartile: residents living in facilities in the bottom quartile of direct care HPRD (1.3 HPRD or less) reported average monthly charges of $2,813, increasing to $3,002, $3,372, and $3,338, respectively with each quartile increase in direct care staffing hours per resident category. Unlike the relationship between the charges and direct care staffing ratio, the relationship between charges to residents and the hours of activity director was in the opposite direction. Residents living in the roughly one-third of RCFs that did not report any activity director time were charged more ($3,213) per month than were residents of facilities with the greatest amount of activity director time ($2,971). As mentioned at the facility level, it may be that the presence of an activity director indicates a more active, less dependent resident population.
FIGURE 3. Average Monthly Resident Charge by Staffing Levels of Facilities in which Residents Live, 2010
SOURCE: RTI Analysis of the 2010 NSRCF.
NOTES: Divisions for direct care hours represent quartiles of staffing HPRD. Divisions for activity director hours represent terciles of staffing HPRD. Direct care hours = a sum of RN, LPN/LVN, and PCA hours. All differences are statistically significant (p0.0001) except for activity director HPRD.
Type of Living Unit
RCFs vary in type and size and offer different types of living arrangements to residents, including apartments, one-person rooms, and rooms designed for more than one person. Table 9 presents the total average monthly resident charge by the characteristics of the unit in which residents live. Characteristics of the units include whether a room or apartment, number of people for whom a room is designed, and whether the room or apartment is part of an Alzheimer's care unit. These include units that are in RCFs that serve only people with Alzheimer's, and living units that are part of an ADCU within a larger facility. The majority of residents (87 percent) lived in a regular, non-Alzheimer's RCF or in a regular unit; only 13 percent lived in a facility that served only people with Alzheimer's disease or a dementia care unit. For individuals living in non-Alzheimer's facilities or units, average charges to residents who lived in a one-person room were higher than average charges to residents who lived in rooms designed for two or more residents ($3,015 compared with $2,342) and average charges to residents who lived in apartments ($3,311) were higher than those charged to individuals living in rooms, regardless of the number of people the room accommodated. A similar pattern was found for apartments and rooms that are part of an Alzheimer's care unit, with the average charges per month in Alzheimer's units being greater than comparable living quarters in general population units.
| Characteristics of Units in which Residents Live | Total RCF Residents n=7,256% | Monthly Resident Charges (average $) | SE | Significance Test p-valuea |
|---|---|---|---|---|
| Types of living quarters--general | --- | --- | --- | 0.0001 |
| Rooms designed for 1 person | 26.9 | $3,015 | $45 | --- |
| Rooms designed for 2 or more persons | 23.8 | $2,342 | $57 | --- |
| Apartments | 36.7 | $3,311 | $55 | --- |
| Types of living quarters in Alzheimer's care unit/facility | --- | --- | --- | --- |
| Rooms designed for 1 person | 4.8 | $4,505 | $123 | --- |
| Rooms designed for 2 or more persons | 3.6 | $3,701 | $140 | --- |
| Apartments | 4.3 | $4,681 | $117 | --- |
| Resident lives with a family member | --- | --- | --- | 0.5490 |
| Yes | 6.0 | $3,072 | $104 | --- |
| No | 94.0 | $3,135 | $37 | --- |
| Resident's room/apartment has cooking amenitiesb | --- | --- | --- | 0.0001 |
| Yes | 43.4 | $3,296 | $50 | --- |
| No | 56.6 | $3,005 | $45 | --- |
--- = no data for this cell.
| ||||
Very few residents (6 percent) lived with a family member. It may be that family members provide supports to one another, reducing the need for paid supports from the RCF staff and thereby reducing charges. At the bivariate level, the difference is in the predicted direction but is not statistically significant.
One of the features that make RCFs feel more homelike and enable residents to maintain independence is the availability of cooking amenities in the room or apartment. Less than half of residents (43.4 percent) had cooking amenities, such as microwaves, ovens, and cooktops, in their living quarters. However, having these amenities available was costly. Residents living in rooms or apartments with this feature were charged $3,296, about $290 a month more than those whose living quarters did not have cooking amenities.
Resident Characteristics
| Characteristics of Residents | Total RCF Residents n=7,256% | Monthly Resident Charges (average $) | SE | Significance Test p-valuea |
|---|---|---|---|---|
| Resident received any Medicaid-paid LTC in last month | --- | --- | --- | 0.0001 |
| Yes | 19.1 | $2,170 | $53 | --- |
| No | 80.9 | $3,359 | $38 | --- |
| Resident's race/ethnicity | --- | --- | --- | 0.0001 |
| White, non-Hispanic | 91.1 | $3,195 | $36 | --- |
| Non-White or Hispanic | 9.0 | $2,486 | $82 | --- |
| Resident's gender | --- | --- | --- | 0.0001 |
| Male | 30.5 | $2,952 | $51 | --- |
| Female | 69.5 | $3,210 | $38 | --- |
| Resident's age | --- | --- | --- | 0.0001 |
| 65 years | 10.6 | $1,925 | $61 | --- |
| 65 years or older | 89.4 | $3,274 | $36 | --- |
| Resident's marital status | --- | --- | --- | 0.0001 |
| Married | 13.2 | $3,389 | $72 | --- |
| Unmarried | 86.8 | $3,092 | $37 | --- |
| Resident exhibited any behavioral symptoms in the last 30 daysb | --- | --- | --- | 0.0410 |
| Yes | 37.2 | $3,265 | $51 | --- |
| No | 62.8 | $3,052 | $39 | --- |
| Resident has incontinence of any type | --- | --- | --- | 0.0001 |
| Yes | 38.4 | $3,410 | $47 | --- |
| No | 61.6 | $2,958 | $42 | --- |
| Resident had a fall that caused a hip fracture or other injury | --- | --- | --- | 0.0001 |
| Yes | 15.1 | $3,420 | $71 | --- |
| No | 84.9 | $3,080 | $36 | --- |
| Resident uses a walker | --- | --- | --- | 0.0001 |
| Yes | 46.3 | $3,238 | $39 | --- |
| No | 53.7 | $3,039 | $45 | --- |
| Resident uses a manual wheelchair | --- | --- | --- | 0.0001 |
| Yes | 23.0 | $3,528 | $54 | --- |
| No | 77.0 | $3,013 | $38 | --- |
| Resident uses a motorized wheelchair | --- | --- | --- | 0.1139 |
| Yes | 5.3 | $2,986 | $96 | --- |
| No | 94.7 | $3,139 | $37 | --- |
--- = no data for this cell.
| ||||
Table 10 presents average monthly resident charges by resident characteristics. Residents who received any Medicaid-paid LTC had significantly lower average charges than did residents who did not receive any Medicaid-paid LTC in the past month; this difference was large, more than $1,100. Certain sociodemographic characteristics also had important variation in average charges. White, non-Hispanics had significantly higher charges than non-Whites or Hispanics ($3,195 vs. $2,486), as did women compared with men ($3,210 vs. $2,952) and married residents ($3,389) compared with unmarried residents ($3,092). One of the largest differences is by age: residents under age 65 have much lower ($1,925) average charges than people aged 65 or older ($3,274). Average charges also varied by the type and level of disability and by the use of assistive devices. Residents who exhibited any behavior symptoms in the past 30 days had higher average monthly charges, as did residents who were incontinent, who had a fall that caused a hip fracture or injury, who used a walker, or who used a manual wheelchair.
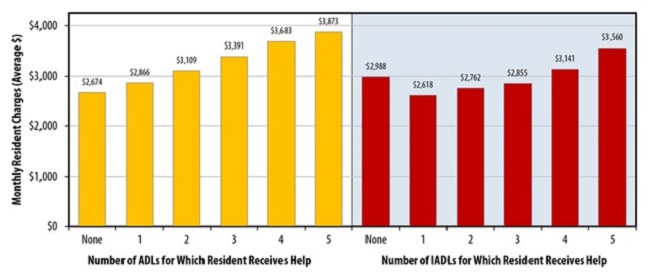
FIGURE 4. Average Monthly Resident Charge by ADL and IADL Help Received, 2010
SOURCE: RTI Analysis of the 2010 NSRCF.
NOTE: All differences are statistically significant (p0.0001).
Residents who had more ADLs and instrumental activities of daily living (IADLs) for which they received help had higher average charges than people with no or fewer disabilities (Figure 4). Residents with intellectual or developmental disabilities or with severe mental illness, had lower average monthly charges than those who did not (Figure 5), whereas residents with dementia/cognitive impairment had higher average monthly charges than those who did not have such impairment.
FIGURE 5. Average Monthly Resident Charge by Resident Characteristics, 2010
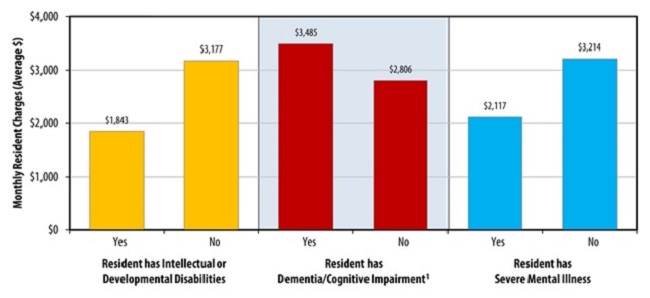
SOURCE: RTI Analysis of the 2010 NSRCF.
NOTE:
- Includes residents with a diagnosis of Alzheimer's; OR 3 or more symptoms (short-term memory impairment, long-term memory impairment, confusion, does not know location of room, does not know season, does know that living in a RCF, does not know staff member's name); OR is living in a facility that serves only people with dementia; OR is living in a dementia special care unit within a larger facility.
Multivariate Analysis: Predictors of Monthly Charges to Residents
To better understand the determinants of RCF charges at the individual resident level and controlling for various variables, a regression analysis was conducted with the resident's total monthly charges as the dependent variable. Table 11 presents the results of the regression analysis, which included characteristics of the facility and unit in which the resident lives, as well as characteristics of the resident and the local market.
Several facility characteristics were found to increase the total monthly charges experienced by a resident. Residents of RCFs located in an MSA have higher monthly charges than those living in rural RCFs. Residents of facilities that serve only people with dementia or of facilities that have dementia care units also experienced higher monthly charges than did residents of facilities that do not offer those specialized services. Living in an RCF co-located with other health care facilities increased total monthly charges for residents, as well. Residents of facilities that limit the kinds of care needs they can serve, measured as the number of policies that require discharging people with specific care needs and had lower monthly charges. Residents of facilities that charge an extra fee at admission faced higher charges that continued monthly, even after the admission fees. Having a greater number of services included in the base rate did not affect average monthly charges to the resident, after controlling for other factors.
| Variables | Model Beta Coefficient n=7,256 | Significance Test p-valuea |
|---|---|---|
| Intercept | $2,096.54 | 0.0001 |
| Characteristics of Facilities in which Resident Lives | ||
| Ownership is for-profit | $76.06 | 0.2614 |
| Facility is part of a chain | $36.99 | 0.4869 |
| Facility is located in an MSA | $144.25 | 0.0066 |
| Facility serves only people with dementia | $358.27 | 0.0003 |
| Facility has a dementia care unit | $340.62 | 0.0001 |
| Other types of health care facilities are located on the groundsb | $236.26 | 0.0016 |
| Number of policies that require discharge of residents with specific care needsc | -$80.93 | 0.0001 |
| Rate Structure of Facility in which Resident Lives | ||
| Extra fees required upon admission | $139.60 | 0.0196 |
| Number of services included in base rated | $8.00 | 0.7076 |
| Staffing Levels and Practices of Facility in which Resident Lives | ||
| Number of employment benefits offered to PCAs | $175.03 | 0.0001 |
| Direct care HPRDe | $91.36 | 0.0001 |
| Direct care hours from activities director per resident per day | -$67.53 | 0.0033 |
| Characteristics of Unites in which Resident Lives | ||
| Room designed for 1 person | -$58.13 | 0.4231 |
| Room designed for 2 persons | -$374.70 | 0.0000 |
| Room designed for 3 or more persons | -$585.64 | 0.0000 |
| 1-bedroom apartment | $83.54 | 0.2142 |
| 2-bedroom apartment | $344.70 | 0.0547 |
| Room/apartment is in an Alzheimer's care unit or facility | $518.80 | 0.0001 |
| Room/apartment has cooking amenitiesf | $164.75 | 0.0099 |
| Resident Characteristics | ||
| Resident characteristics Resident received any Medicaid-paid LTC in last month | -$732.23 | 0.0001 |
| Resident's race/ethnicity (White, non-Hispanic=0) | -$150.09 | 0.0141 |
| Resident's gender (male=0) | -$39.45 | 0.2593 |
| Resident is 65 years old | -$190.05 | 0.0015 |
| Resident is married (unmarried=0) | -$17.07 | 0.7707 |
| Resident has dementia/cognitive impairmentg | $78.53 | 0.0396 |
| Resident has severe mental illness | -$31.89 | 0.5929 |
| Resident uses a manual wheelchair | $155.36 | 0.0001 |
| Resident has a brain injury | $552.14 | 0.0020 |
| Resident exhibited any behavioral symptoms in the last 30 days | $105.05 | 0.0033 |
| Number of ADLs for which resident receives helph | $124.00 | 0.0001 |
| Number of IADLs for which resident receives help | $29.69 | 0.0756 |
| Market Characteristics and State Medicaid Policy | ||
| Number of Medicare-certified beds in SNF or NF per 1,000 people | -$19.37 | 0.0075 |
| State Dummy Variable (p-value for the Wald-F statistic) | --- | 0.0001a |
| Model fit | r2= | 0.4776 |
--- = no data for this cell.
| ||
The staffing levels and staff policies of a facility also affect the monthly charges to a resident. Residents of facilities that offer more employment benefits to PCAs are charged more per month, with an additional $175 per month for each additional employment benefit provided. Residents also experience higher charges as the number of direct care hours increases. However, greater amounts of direct care from an activities director are associated with lower monthly resident charges.
Residents experience different charges depending on the characteristic of the unit in which they live. Residents who forgo some privacy by living in rooms designed for two or more persons experience lower charges. Living in an Alzheimer's care unit or facility increases the charges that a resident experiences by more than $500 per month. Living in a unit that offers cooking amenities also increases the charge to residents.
Certain resident-specific demographic and health characteristics also significantly affect the monthly charges to a resident. Residents who received any Medicaid-paid LTC in the last month had much lower monthly charges than those who did not receive any Medicaid-paid LTC, a difference of more than $730 per month. Residents who are White and not Hispanic experienced higher average monthly charges. Residents who are younger than age 65 experienced lower monthly charges.
Higher disability levels (having dementia/cognitive impairment, having a brain injury, exhibiting behavioral symptoms) and an increased need for assistance (using a manual wheelchair, having a greater number of ADLs for which help is received) were found to increase the resident's monthly charges. Assistance for an increasing number of IADLs does not have an impact on monthly charges, but that dimension may be partly captured in the measure of cognitive impairment.
Residents of RCFs located in areas with a greater number of Medicare-certified SNF or NF beds per 1,000 people had lower charges. Other sources of variation were captured by the aggregate measure of the state in which people reside.
RCFs play an important role in state strategies to change the balance of the long-term services and supports system, because they offer care in the community and at a lower cost, factors that are appealing to many individuals. With the caution that these are charges--not actual costs--the data presented here offer the first insight into factors that affect the costs of RCFs. At the facility level, the analyses offer understanding of factors affecting the average charges levied by facilities, and provide insight into policies that may be used to control charges. At the resident level, the analyses illustrate factors affecting the total monthly amount that residents are charged and offer guidance to individuals who are considering life in an RCF.
Several variables, capturing aspects of the facility characteristics, rate structure, staffing practices, living quarters, and types of residents served, had similar effects at the facility and resident levels (Table 12). Facilities that offered specialized services to people with dementia, either through an ADCU within a larger facility or as the sole focus of the RCF, had higher charges, as did facilities that charged additional fees at the time of admission. The latter is interesting in that the higher monthly charge is exclusive of those additional fees. Facilities that offer greater levels of service, as measured in hours of direct care per resident per day, and that offered more employment benefits to PCAs had greater average monthly charges, and these higher charges were experienced by residents as well. The type of living quarter provided affected charges. Facilities with a greater share of rooms for two or more people had lower average monthly charges, and the individuals who lived in such quarters were charged less each month. Having greater competition for potential residents, as measured by the number of Medicare-certified NF and SNF beds per 1,000 people in the county, had the anticipated effect of lowering charges at both the facility and resident levels. Finally, certain resident characteristics affected charges at both levels. Individuals who had any memory impairment or confusion, and facilities that served greater proportions of residents with such impairments, had higher average monthly charges. Hispanic or non-White residents had lower monthly charges, and facilities that served a greater number of Hispanic or non-White residents had lower average monthly charges.
In addition to these variables, average facility-level charges were also affected by factors, most of which reflect facility policies and rate structure. For-profit RCFs had higher average monthly charges. Facilities that participate in Medicaid had lower average monthly charges. Although Medicaid may not pay for room-and-board charges in RCFs, it may pay for the service component of monthly charges. Additionally, several states impose limits on what RCFs may charge Medicaid-eligible residents for room-and-board, thereby lowering the average charges in facilities that participate in Medicaid. Facilities that offer more services in the base rate had higher average monthly charges. Serving a broader range of resident needs, as indicated by a greater number of policies that allow admission of residents with these needs, also increased the average monthly charges. Finally, RCFs that provide services to people with intellectual or developmental disabilities, or to people with severe mental illness, had lower average monthly charges. The NSRCF does not include RCFs that serve only people with these types of disabilities. It is likely that people with these disabilities who are served by facilities represented in this survey have relatively low care needs.
| Predictors of Average Monthly Base Facility Charge | Predictors of Total Monthly Charge to Residents | ||
|---|---|---|---|
| Facility Characteristics | |||
|
| ||
| Types of Living Units | |||
|
| ||
| Facility Rate Structure | |||
|
| ||
| Staffing Levels and Practices | |||
|
| ||
| Types of Residents Served | |||
|
| ||
| Market Characteristics | |||
|
| ||
| NOTE: "+" and "-" indicate that the variable significantly increased or decreased charges, respectively. | |||
Other factors affecting the monthly charges to residents included both variables that reflect the nature of the facilities in which they live, and characteristics and care needs of the residents themselves. The location of the facility in which a resident lives affects the charges the resident experiences. Residents of RCFs that are in MSAs and of RCFs that are co-located with other health care facilities experience higher monthly charges. Residents of RCFs with greater availability of activity director time in direct care had lower monthly charges. It may be that the greater rates of activity time reflect lower care needs of residents, and a substitution of that time for higher-cost nursing time, both of which contribute to lower charges. Residents of RCFs that discharged residents with a greater range of care needs, as indicated by the number of discharge policies in place and that therefore serve residents with less complex care needs had lower monthly charges.
Residents with greater care needs, as indicated by having a brain injury, behavioral symptoms, or greater number of ADL impairments, all experienced higher monthly charges, as did those who use a manual wheelchair. Those who were younger than 65 and those with lower incomes, as indicated by the receipt of any Medicaid-paid LTC in the previous month, had lower average monthly charges. Residents who elected a living unit with cooking amenities had higher monthly charges as well.
This study analyzes the 2010 NSRCF, which is the most comprehensive source of nationally representative data on RCFs. Although the data are the best currently available, there are limitations to this study. First, the survey was designed to analyze facilities and residents at the national level; although state licensure requirements vary by state, the NSRCF is not designed to produce state estimates. Second, the calculation of the average monthly facility charge uses a single weight for the percentage of living units that are in Alzheimer's care units to all types of living units (e.g., rooms for one person, one-bedroom apartments), given that we do not have data on the distribution of specific types of living units across Alzheimer's and general care units. It may be that these types of units are differentially distributed; therefore, the facility average charge may be imprecise. Third, facilities that exclusively serve people with severe mental illness or intellectual and developmental disabilities were excluded from the survey because of its focus on facilities that serve older people and younger people with physical disabilities. Thus, the survey does not fully represent younger people living in RCFs, and does not provide a clear guide to people with intellectual and developmental disabilities or with mental illness who are interested in understanding what factors affect the charges they may face. Fourth, the survey collected what the facility charged rather than what individuals or third-party payers like Medicaid actually paid. The limitation is particularly important for Medicaid residents, who account for about one-fifth of all residents.
The findings presented here are useful to consumers who are considering residential care and are interested in understanding the factors that may affect the charges they will face. Findings also may be useful to policy makers who are interested in making residential care an affordable option for people who need support and prefer to remain in the community.
The findings also suggest some directions for future research. Although some facilities served people with intellectual and development disabilities or with severe mental illness, those that served only such people were excluded from the survey. The findings presented here, which suggest people with these disabilities experience lower charges, thus are only a partial picture of the experiences of people with these disabilities. Additional inquiry is needed to better understand the types of facilities in which people with intellectual and developmental disabilities and mental health disabilities live, and the factors that affect the charges they experience.
Another area for future research concerns the impact of Medicaid policy on RCF charges. The decision by an RCF to participate in or be certified by Medicaid has important implications, because it both opens a facility to a larger potential market and may impose constraints on the allowable charge rate. Additional inquiry also would be of interest in the ways that Medicaid policies affect charges, and particularly access to RCF for low-income individuals. Although Medicaid is not permitted to pay for room-and-board provided in RCFs, some states impose limits on the room-and-board rates that RCFs may charge Medicaid-eligible individuals. Depending on the nature of the limitation, it may be that such policies are limiting access for residents, by setting rates below what facilities are willing to accept.
Brodie, M., & Blendon, R. (2001). National Survey on Nursing Homes. Menlo Park, CA: Kaiser Family Foundation.
Caffrey, C., Sengupta, M., Park-Lee, E., Moss, A., Rosenoff, E., & Harris-Kojetin, L. (2012). Residents Living in Residential Care Facilities: United States, 2010. NCHS Data Brief, no. 91. Hyattsville, MD: National Center for Health Statistics.
Carlson, E., Coffey, G., Fecondo, J., & Newcomer, R. (2010). Medicaid funding for assisted living care: A five-state examination.Journal of Housing for the Elderly, 24(1), 5-27. doi:10.1080/02763890903547047.
Genworth Financial (2014). Genworth 2014 Cost of Care Survey: Home Care Providers, Adult Day Health Care Facilities, Assisted Living Facilities and Nursing Homes. Retrieved from https://www.genworth.com/dam/Americas/US/PDFs/Consumer/corporate/130568_032514_CostofCare_FINAL_nonsecure.pdf.
Grabowski, D.C., Stevenson, D.G., & Cornell, P.Y. (2012). Assisted living expansion and the market for nursing home care. Health Services Research, 47(6), 2296-2315.
Greene, A.M., Wiener, J.M., Khatutsky, G., Johnson, R.E., & O'Keeffe, J. (2013). Medicaid in Residential Care. Washington, DC: U.S. Department of Health and Human Services, Office of the Assistant Secretary for Planning and Evaluation. Retrieved from http://aspe.hhs.gov/daltcp/reports/2013/FacBenDif.shtml.
Hawes, C., Phillips, C.D., Rose, M., Holan, S., & Sherman, M. (2003). A national survey of assisted living facilities. The Gerontologist, 43(6), 875-882.
Health Resources and Services Administration, U.S. Department of Health and Human Services (2012). Area Resource File (ARF).
Kaiser Family Foundation (2012). Total Number of Certified Nursing Facilities, 2010. Retrieved from http://www.statehealthfacts.org/comparemaptable.jsp?cat=8&ind=411.
Kane, R.A., & Cutler, L.J. (2008). Community-Based Care Settings as Rebalancing Vehicles: State Strategies to Make Them More like Home than like Institutions. Minneapolis, MN: University of Minnesota. Retrieved from http://www.sph.umn.edu/hpm/ltcresourcecenter/research/rebalancing/attachments/topicpapers/Topic_6_Community_Group_Residential_Settings_as_Rebalancing_Vehicles.pdf.
Khatutsky, G., Ormond, C., Wiener, J.M., Greene, A., Johnson, R., Jessup, A., Vreeland, E., et al. (in press). Residential Care Communities and Their Residents: A National Portrait. A chart book for the U.S. Department of Health and Human Services, Centers for Disease Control and Prevention, National Center for Health Statistics.
Medicare Program; Prospective Payment System and Consolidated Billing for Skilled Nursing Facilities for FY 2014. A rule by the Centers for Medicare and Medicaid Services. 78 Fed. Reg. 47935 (August 6, 2013). Pp. 47935-47978. Retrieved September 17, 2014 from https://www.federalregister.gov/articles/2013/08/06/2013-18776/medicare-program-prospective-payment-system-and-consolidated-billing-for-skilled-nursing-facilities.
MetLife Mature Market Institute (2012). The 2012 MetLife Market Survey of Nursing Home, Assisted Living, Adult Day Services, and Home Care Costs. New York, NY: Mature Market Institute and LifePlans, Inc.
Mollica, R. (2009). State Medicaid Reimbursement Policies and Practices in Assisted Living. Washington, DC: National Center for Assisted Living.
Moss, A.J., Harris-Kojetin, L.D., & Sengupta, M. (2011). Design and operation of the 2010 National Survey of Residential Care Facilities. U.S. Department of Health and Human Services, National Center for Health Statistics. Vital Health Statistics, 1(54).
O'Keeffe, J., Saucier, P., Jackson, B., Cooper, R., McKenney, E., Crisp, S., & Moseley, C. (2010). Understanding Medicaid Home and Community Services, A Primer, 2010 Edition. Washington, DC: U.S. Department of Health and Human Services, Office of the Assistant Secretary for Planning and Evaluation. Retrieved from http://aspe.hhs.gov/daltcp/reports/2010/primer10.htm.
O'Keeffe, J., & Wiener, J.M. (2005). Public funding for long-term care services for older people in residential care settings. Journal of Housing for the Elderly, 18(3-4), 51-79.
Park-Lee, E., Caffrey, C., Sengupta, M., Moss, A.J., Rosenoff, E., & Harris-Kojetin, L.D. (2011). Residential Care Facilities: A Key Sector in the Spectrum of Long-Term Care Providers in the United States. Washington, DC: U.S. Department of Health and Human Services. Retrieved from http://aspe.hhs.gov/daltcp/reports/2011/RCFkey.shtml.
Research Triangle Institute (2008). SUDAAN Language Manual (Version Release 10.0). Research Triangle Park, NC: RTI International.
Rosenbaum, S., & Teitelbaum, J. (2004). Olmstead at Five: Assessing the Impact. Retrieved from http://www.kff.org/medicaid/upload/Olmstead-at-Five-Assessing-the-Impact....
Wiener, J.M., & Lutsky, S.M. (2001). Medicaid Home and Community-Based Services for Older People and Younger Persons with Physical Disabilities in Wisconsin. Washington, DC: The Urban Institute.
Zimmerman, S., Sloane, P.D., & Reed, D. (2014). Dementia prevalence and care in assisted living. Health Affairs (Millwood), 33(4), 658-666. doi:10.1377/hlthaff.2013.1255.
The NSRCF collects data on the average monthly charge of each facility for each of several types of living units, defined by whether each was a room or an apartment, the size of each unit (i.e., number of people or bedrooms), and whether each was part of a care unit intended for people with Alzheimer's disease or other dementia. Any given facility might offer one or more of these types of living units, and might charge differently for each, thereby necessitating an approach to creating a single facility-level charge variable.
The distribution of facilities that offer each type of living unit and the average charge for each of these types is shown in Table A-1. A majority (63.1 percent) of facilities offered rooms designed for one person, in general living quarters, at an average charge of $2,787. A somewhat smaller number, but still a majority (59.3 percent), also offered two-person rooms in general living quarters, at a lower average monthly charge ($2,430). Three-person rooms were uncommon, offered by only 6.6 percent of facilities, and had the lowest average monthly charge ($1,695). Apartments were less common than were rooms, and were available for higher average charge rates. For example, the average monthly charge for a one-bedroom apartment was $3,281 as opposed to $2,787 for a one-person room.
Few facilities offered living quarters in Alzheimer's care units. Fewer than one in ten facilities (9.4 percent) had one-person rooms in an Alzheimer's care unit, and smaller numbers of facilities offered other types of living quarters in an Alzheimer's care unit. For each type of living unit, the monthly charge was greater if it was in an Alzheimer's care unit than if it was in a general living unit. For example, the average monthly charge for a one-person room in an Alzheimer's care unit was $4,085, much greater than the charge for a comparable room in a general unit ($2,787).
These differences in distribution and charges for different types of living units required that we create a single, average monthly charge for each RCF. We used a two-step process to do so (see Table A-2). First, for each type of living unit (e.g., one-person room, studio apartment), we created an average of the monthly charges for general care and Alzheimer's care living units, weighted by the distribution of living quarters in each type of care unit. In the second step, we created an average of these charges, weighted by the distribution of type of living quarters in the facility as a whole.
This approach gave us a single, weighted average monthly facility charge, which was used in all facility-level charge analyses. At the resident level, the charge variable represents the total charge in the last month for the person to live in the facility, including the monthly charge plus charges for any additional services, as reported by a knowledgeable staff member.
| Characteristics of Living Quarters | Total RCFs n=2,168% | Facility Charges for Each Type of Living Quarters(average $) | SE |
|---|---|---|---|
| Types of Living Quarters | |||
| Rooms designed for 1 person | 63.1 | $2,787 | $41 |
| Rooms designed 2 persons | 59.3 | $2,430 | $42 |
| Rooms designed for 3 or more persons | 6.6 | $1,695 | $86 |
| 1-bedroom apartments | 18.3 | $3,281 | $49 |
| 2-bedroom apartments | 9.3 | $3,788 | $82 |
| 3-bedroom apartments | # | # | # |
| Studio apartments | 17.1 | $2,921 | $41 |
| Types of Living Quarters in Alzheimer's Care Unit | |||
| Rooms designed for 1 person | 9.4 | $4,085 | $113 |
| Rooms designed for 2 persons | 7.4 | $3,594 | $94 |
| Rooms designed for 3 or more persons | # | # | # |
| 1-bedroom apartments | 3.3 | $4,813 | $121 |
| 2-bedroom apartments | # | # | # |
| 3-bedroom apartments | # | # | # |
| Studio apartments | 6.1 | $4,492 | $87 |
| #: Sample size is too small (n30) to report by NCHS standards. †: Estimate cannot be assumed to be reliable; sample size is between 30 and 59 and/or the sample size is greater than 59 but has a relative SE of 30% or more. | |||
| TABLE A-2. Creation of Average Facility Rate | ||
| Create a weighted average of base rates for each type of living quarter, using percentage of total living quarters in special care units as a weight. Then create a weighted average charge for the facility by weighting the average charge per type of living quarter by the percentage of total living quarters it represents for the facility. | Ci = (Cia * Pa) +(Cig +* (1-Pa)), where Ci = Weighted average charge for living quarters type i, Cig = Charge for living quarters type i for general units, Cia = charge for living quarters type i for Alzheimer's units, and Pa = percent of total living quarters a located in Alzheimer's special care units. Average facility charge = (Σ(Ni * Ci))/ΣNi, where Ni = number of units of living quarters type i, and Ci = weighted average charge for type of living quarter i. | Ci Avg1bd Avg1rm Avg2bd Avg2rm Avg3bd Avg3rm Avgstu Cig COST1BD COST1RM COST2BD COST2RM COST3BD COST3RM COSTSTU Cia COST1BDA COST1RMA COST2BDA COST2RMA COST3BDA COST3RMA COSTSTUA Pa = PERDEMBED2 (percent of beds in Alzheimer's/dementia special care unit Ni APTONEN NUM1ROOM APTWON NUM2ROOM APTHREEN NUM3ROOM STUDION |
-
Facilities that exclusively serve people with intellectual or development disabilities or people with severe mental illness were not included in the NSRCF.
-
The movement toward more HCBS programs was bolstered by the 1999 ruling of the U.S. Supreme Court in Olmstead vs. L.C. & E.W. (521U.S.581, 119S.St.2176). Interpreting the Americans with Disabilities Act, the court ruled that states must make reasonable modification in their long-term services and supports programs to make HCBS available to those with disabilities (Rosenbaum & Teitelbaum, 2004).
-
The Resident Questionnaire asks "For last month, what was the total charge for [RESIDENT INITIALS] to live in this facility? Include the basic monthly charge and charges for any additional service."
-
The NSRCF collected data on whether a facility charged either of two types of admission fee (a security deposit or an entrance fee) but did not collect information about the amount of such a fee.
-
See the Technical Appendix for information about the types of living units and impact on average monthly charges.
-
2010 NSRCF Resident Questionnaire.
ANALYSIS AND DISSEMINATION OF FINDINGS FROM THE NATIONAL SURVEY OF RESIDENTIAL CARE FACILITIES
This report was prepared under contract #HHSP23320095651WC between the U.S. Department of Health and Human Services (HHS), Office of Disability, Aging and Long-Term Care Policy (DALTCP) and the Research Triangle Institute. For additional information about this subject, you can visit the DALTCP home page at http://aspe.hhs.gov/office_specific/daltcp.cfm or contact the ASPE Project Officer, Emily Rosenoff, at HHS/ASPE/DALTCP, Room 424E, H.H. Humphrey Building, 200 Independence Avenue, S.W., Washington, D.C. 20201. Her e-mail address is: Emily.Rosenoff@hhs.gov.
Reports Available
- Do Services and Staffing in Residential Care Facilities Vary With Residential Needs?
- Executive Summary http://aspe.hhs.gov/daltcp/reports/2013/ResNeedes.shtml
- Full HTML Version http://aspe.hhs.gov/daltcp/reports/2013/ResNeed.shtml
- Full PDF Version http://aspe.hhs.gov/daltcp/reports/2013/ResNeed.pdf
- Medicaid in Residential Care
- Executive Summary http://aspe.hhs.gov/daltcp/reports/2013/FacBenDifes.shtml
- Full HTML Version http://aspe.hhs.gov/daltcp/reports/2013/FacBenDif.shtml
- Full PDF Version http://aspe.hhs.gov/daltcp/reports/2013/FacBenDif.pdf
- What Factors Affect Residential Care Facility Charges?
- Executive Summary http://aspe.hhs.gov/daltcp/reports/2014/RCFchargees.cfm
- Full HTML Version http://aspe.hhs.gov/daltcp/reports/2014/RCFcharge.cfm
- Full PDF Version http://aspe.hhs.gov/daltcp/reports/2014/RCFcharge.pdf
- What is the Effect of Dementia on Hospitalization and Emergency Department Use in Residential Care Facilities?
- Executive Summary http://aspe.hhs.gov/daltcp/reports/2014/RCFdementiaes.cfm
- Full HTML Version http://aspe.hhs.gov/daltcp/reports/2014/RCFdementia.cfm
- Full PDF Version http://aspe.hhs.gov/daltcp/reports/2014/RCFdementia.pdf
U.S. Department of Health and Human ServicesOffice of Disability, Aging and Long-Term Care PolicyRoom 424E, H.H. Humphrey Building200 Independence Avenue, S.W.Washington, D.C. 20201FAX: 202-401-7733Email: webmaster.DALTCP@hhs.gov