
U.S. Department of Health and Human Services
Report to the Secretary on Private Financing of Long-Term Care for the Elderly
Technical Work Group on Private Financing of Long-Term Care for the Elderly
November 1986
PDF Version: http://aspe.hhs.gov/daltcp/reports/pfltce.pdf (243 PDF pages)
This paper was prepared by U.S. Department of Health and Human Services (HHS), Office of Social Services Policy (now Office of Disability, Aging and Long-Term Care Policy (DALTCP)) and the Brookings Institution. For additional information about this subject, you can visit the DALTCP home page at http://aspe.hhs.gov/_/office_specific/daltcp.cfm or contact the office at HHS/ASPE/DALTCP, Room 424E, H.H. Humphrey Building, 200 Independence Avenue, S.W., Washington, D.C. 20201. The e-mail address is: webmaster.DALTCP@hhs.gov. The Project Officer was Paul Gayer.
The opinions and views expressed in this report are those of the authors. They do not necessarily reflect the views of the Department of Health and Human Services, the contractor or any other funding organization.
TABLE OF CONTENTS
CHAPTER 1. INTRODUCTION
A. Background of the Report
B. Structure of the Report
CHAPTER 2. AN OVERVIEW OF LONG-TERM CARE
A. Long-Term Care and Catastrophic Costs
B. The Long-Term Care Population and Its Service Needs
C. Growth of the Elderly Population and the Demand for Long-Term Care Services
D. Characteristics of the Long-Term Care Services System
E. Long-Term Care Expenditures and Financing
F. Public Long-Term Care Financing Programs
G. The Impact of Health, Social, and Economic Trends on the Demand for Long-Term Care
CHAPTER 3. ANALYSIS OF PRIVATE MECHANISMS FOR FINANCING LONG-TERM CARE OF THE ELDERLY
A. Introduction
B. General Approaches to Private Financing of Long-Term Care
C. Analysis of Specific Financing Mechanisms
D. Special Analysis of IMAs, Long-Term Care Insurance, and Combination Approaches
CHAPTER 4. THE RELATIONSHIP OF MEDICAID TO PRIVATE FINANCING OF LONG-TERM CARE
A. Medicaid Eligibility for Long-Term Care
B. Implications of Medicaid for Private Financing Mechanisms
C. Possible Areas for Medicaid Reform
APPENDICES
APPENDIX 1: Description of National Surveys Related to Long-Term Care
APPENDIX 2: Examples of Long-Term Care Insurance Policies
APPENDIX 3: Home Equity Conversion
APPENDIX 4: Induced Demand
APPENDIX 5: Description of Brookings/ICF Microsimulation Model
LIST OF FIGURES
FIGURE 2-1: Personal Health Care Expenditures for the Elderly by Type of Service -- 1984
FIGURE 2-2: Out of Pocket Health Care Expenditures for the Elderly by Type of Service -- 1984
FIGURE 2-3: Nursing Home Expenditures by Source of Payment -- 1984
FIGURE A5-1: Brookings/ICF Long-Term Care Financing Model
FIGURE A5-2: PRISM Flowchart
FIGURE A5-3: Flowchart for Utilization of Long-Term Care Services
LIST OF TABLES
TABLE 2-1: U.S. Population 65 Years of Age or Over and Percent of Total Population: Selected Years and Projections 1950-2030
TABLE 2-2: Percent Increases in U.S. Population for 10-year Intervals, by Age Groups: Selected Years and Projections 1950-2010
TABLE 2-3: Projections of Long-Term Care Population in Nursing Homes and in the Community
TABLE 2-4: Percent Distribution of Helpers and Helper Days, by Sex and Relationship to Individuals 65 Years of Age or Over with Limitations in Activities of Daily Living
TABLE 2-5: U.S. Total Expenditures for Nursing Home Care and Annual Percent Change: Calendar Years 1960-84
TABLE 2-6: Long-Term Care as Percent of Total Federal and State Medicaid Expenditures, by Type of Service: Fiscal Years 1974-84
TABLE 2-7: Medicaid Long-Term Care Expenditures and Percent Change, by Type of Service: Fiscal Years 1977-84
TABLE 2-8: Actual and Projected Growth of the Older Population: United States, 1990-2040
TABLE 2-9: Probability of Selected Medical Conditions as the First Reported Cause of Chronic Disability among Disabled Persons, 85 Years and Older: United States, 1982
TABLE 2-10: Average Incomes of the Elderly and Nonelderly, 1969 and 1984
TABLE 2-11: Median Per Capita Income for the Elderly by Sex and Marital Status: 1984
TABLE 2-12: Median Per Capita Income of the Elderly by Age, Race, and Sex: 1984
TABLE 2-13: Percent of Older Persons in Poverty by Age and Sex: 1984
TABLE 2-14: Percent of the Elderly Below Poverty by Race, Sex, and Living Arrangements: 1984
TABLE 2-15: Percentage Distribution of Income by Source For Elderly in Different Income Groups, 1984
TABLE 2-16: Asset Holdings, by Type of Asset and Age of Family Head; United States: 1983
TABLE 2-17: Home Equity Among the Elderly: 1984
TABLE 2-18: Annual Expenditures as a Percentage of Income, by age of Householder and Budget Item: United States: 1982-1983
TABLE 2-19: Projections of Average Income of Elderly Families and Singles By Age Group: Baseline
TABLE 2-20: Projections and Income Distribution for Families and Singles Aged 65 to 71: Baseline
TABLE 2-21: Projections of Number and Income Distributions for Families and Singles Aged 72 and over: Baseline
TABLE 2-22: Projections of Elderly with Inadequate Income, by Family Status and Age: Baseline
TABLE 3-1: Tax Returns with IRA Contributions by Adjusted Gross Income Class, 1984
TABLE 3-2: Tax Returns with Maximum IRA Contributions as a Percentage of all Tax Returns with IRAs by Total Positive Income Class, 1983
TABLE 3-3: Summary of Services Offered by CCRCs: Percent of CCRCs Including Services in Fees
TABLE 3-4: Combined Annual Rate of Interest for a 70-year-old Borrower When Initial Home Value Equals $70,000
TABLE 3-5: Estimated Initial Annual Savings to Pay for Expected Nursing Home Utilization, by Age
TABLE 3-6: Projections of Persons 65 & Over Who Would Have Contributed $3,000 to an IRA in One or More years, and Rates of Contribution, By Sex, Marital Status, and Homeownership, 1986, 2000, 2018
TABLE 3-7: Projections of Population in Nursing Homes by Age 1986, 2000, & 2018
TABLE 3-8: Projections of Total Nursing Home Expenditures for the Elderly For Two Different Assumptions in the Rate of Specific Inflation, 1986, 2000 and 2018
TABLE 3-9: Inflation and Payment Source for Nursing Home Expenditures for the Elderly in 2018
TABLE 3-10: Base Case Projection: Total Nursing Home Expenditures for the Elderly, by Source of Payment in Years 1986, 2000, 2018
TABLE 3-11: Expanded IRA Projection: Total Nursing Home Expenditures for the Elderly by Source of payment In Years 1986, 2000, 2018
TABLE 3-12: Impact of Expanded IRAs: Total Nursing Home Expenditures for the Elderly By Source of Payment In 2018
TABLE 3-13: Impact of IMAs: Total Nursing Home Expenditures for the Elderly by Source of Payment in 2018
TABLE 3-14: Premium Estimates for a Level Premium, Level Benefit Indemity Policy
TABLE 3-15: Premium Estimates for a Indexed Premium, Indexed Benefit Indemnity Policy Index Rate: 5% per year
TABLE 3-16: Estimated Unisex Contribution/Premium Rates for Nursing Home Coverage Starting at Age 65 of $50 Daily Coverage Indexed by 5.8 Percent After Year of Issue With Contributions Indexed by 5.8 Percent After Year of Issues: Assumed Antiselection/Induced Demand = 37%
TABLE 3-17: Estimated Unisex Contribution/Premium Rates for Nursing Home Coverage Starting at Age 65 of $50 Daily Coverage Indexed by 4.4 Percent After Year of Issue With Contributions/Indexed by 4.4 Percent After Year of Issue: Assumed Antiselection/Induced Demand = 37%
TABLE 3-18: Annual Premium at Issue for Nursing Home Coverage of $50 per Day Starting at Age 65 with 90-Day Elimination Period, 5.8 Percent Annual Indexing of Coverage and Lifetime Premiums After Issue, and Waiver of Premium for Nursing Home Residents Over Age 64
TABLE 3-19: Projections of Total Nursing Home Expenditures for the Elderly by Source of Payment and Insurance Option in 2018
TABLE 3-20: Potential Effect of Induced Demand on Nursing Home Expenditure Patterns in 2018: One Percent of Income Option
TABLE A2-1: Long-Term Care Insurance Examples: Policy Features of Insurance Companies
TABLE A2-2: Annual Premium Rates per $100 Monthly Benefits for Firemans Fund Policies Original Policy
TABLE A2-3: Annual Premium Rates for Federated American Policy
TABLE A2-4: Annual Premium Rates for Massachusetts Indemnity Policies
TABLE A2-5: Annual Premium Rates for Great Republic Policy
TABLE A2-6: Annual Premium Rates for United Equitable Policies
TABLE A2-7: Annual Premium Rates per $5 Daily Benefits for Health Insurance Corporation Policy
TABLE A2-8: Annual Premium Rates for Equitable Life Policies
TABLE A2-9: Annual Premium Rates for Transport Life Insurance Company
TABLE A2-10: Annual Premium Rates for Kemper Group Policies
TABLE A2-11: Annual Premium Rates for Merchants and Manufactures Policy
TABLE A2-12: Annual Premium Rates for National Foundation Life Insurance Policy
TABLE A2-13: Annual Renewal Premium Rates for Mutual Protective/Medico Life Insurance Company Policies
TABLE A2-14: Annual Premium Rates per $10 a Day for Columbia Life Insurance Company
TABLE A2-15: Annual Premium Rates for Blue Cross of North Dakota Policies
TABLE A4-1: Assumed Induced Demand Levels for Various Levels of Nursing Home Insurance Coverage
CONTRIBUTORS TO THE REPORT
Steven A. GrossmanChairmanTechnical Work Group on Private Financing of Long-Term Care for the Elderly
Public Health Service
John Marshall, Ph.D.
James O. Mason, M.D., Dr.P.H.T.
Franklin Williams, M.D.
Gene D. Cohen, M.D., Ph.D.
Miriam Davis, Ph.D.
James Friedman
Marcy Lynn Gross
James Kaple, Ph.D.
Mark Meiners, Ph.D.
Jay Moskowitz, Ph.D.
James Scanlon
Amy Taylor, Ph.D.
Joan Van Nostrand
Health Care Financing Administration
Bartlett S. Fleming
Pam Doty, Ph.D.
Thomas Gustafson, Ph.D.
Office of the Assistant Secretary for Planning and Evaluation
Arnold Tomkins
Michele Adler
Robert Clark
Paul Gayer
Mary Harahan
Office of the General Counsel
Terry Coleman
Office of Human Development Services
Carol Fraser Fisk
G. Sandra Fisher
Social Security Administration
Bruce Schobel
Stephen Goss
Michael Staren
Support Staff
Joan Carr
With the Assistance of: Van Jewell Graham Peggy Rohrbaugh Carol Sweeney Sandra Tolpin
Contractors
Brookings Institution
Joshua Weiner, Ph.D.
Duke University
Kenneth Manton, Ph.D.
ICF, Inc.
David Kennell
Project Hope
Burton Dunlop, Ph.D.
Joe Kutzin
Sandra Yamishiro
Urban Institute
Korbin Liu, Ph.D.
EXECUTIVE SUMMARY
INTRODUCTION
The economic welfare of older persons in 1986 is better than at any point in our history, and most older persons can expect their senior years to be healthy and independent. However, the next 50 years will see the number of people age 65 and over almost double as a proportion of the population--reaching over 21 percent in the year 2030. The number of very old--people age 85 and over--will almost quadruple. Since the incidence of chronic health problems and disabling conditions which require long-term care significantly increases with age, few believe that the current system of financing and delivering long-term care services is adequate for the challenge ahead.
The great majority of older persons who need long-term care receive the support they need from friends and family members. Nevertheless, in 1985 the Nation spent over $35 billion a year on nursing home care, about 75 percent of that on the elderly. Nursing home care represents about 8 percent of total health care expenditures, and it is the leading cause of catastrophic out-of-pocket expenditures for the elderly. This is true for several reasons:
-
The lifetime risk of needing nursing home care is between 20 and 45 percent. While only about half of those who enter nursing homes will stay over 90 days, for this subgroup the average stay is over two years. Despite the improved economic status of older persons, few can afford the high cost of an extended nursing home stay (averaging $22,000 per year).
-
Unlike acute health care, there is virtually no private insurance for long-term care. Consequently, there are only two significant sources of payments--out-of-pocket payments by the elderly and/or their families, and the Medicaid program.
-
Although the Medicaid program provides public financing for nursing home care, it is a welfare-based system that does not provide assistance to individuals until all other financial resources have been consumed. Approximately half of all Medicaid recipients in nursing homes were not initially poor, but "spent down" their income and resources as a result of their nursing home stay.
On February 4, 1986, President Reagan directed the Secretary of the Department of Health and Human Services, Dr. Otis Bowen, to report to him by the end of the year on how Government and the private sector can work together to address catastrophic health care needs in the United States.
The purposes of this report are to:
- Describe the characteristics of elderly people who need long-term care and how these characteristics will change over time;
- Assess the potential of private financing mechanisms to lessen the catastrophic impact of nursing home and home care expenses which can wipe out individual and family savings; and
- Develop actions that would increase the availability and use of private financing mechanisms for the long-term care of older persons.
This report addresses only one critical part of the problem of long-term care, albeit a highly neglected part. The focus on private financing strategies is not to deny the very real needs of persons who must rely on public programs to provide their long-term care because they cannot afford private alternatives. Such persons are and will continue to be the legitimate concern of government.
However, Federal, State, and local governments are already significant partners in sharing the costs of long-term care--paying almost half of all costs through Medicaid and other programs. The direct, out-of-pocket resources of individuals pay almost all the rest. The protective mechanisms relied upon for other types of health care expenses, such as private insurance and charitable sources, pay less than 2 percent of costs. There need to be suitable, effective and widely available private financing mechanisms for the elderly who want to protect themselves at a reasonable cost against the high costs of long-term care.
The findings of this report are based on a review of the existing literature, as well as analyses undertaken specifically for this report.
For the purposes of this report, the terms "elderly" and "older persons" refer to persons aged 65 and older. It is recognized, however, that these terms do not adequately reflect the diversity of this population.
OVERVIEW
Long-Term Care and Catastrophic Expenses. Long-term care refers to a wide range of medical, health related, and social services for persons who, because of chronic mental or physical illness and disability, need personal assistance in caring for themselves over an extended period of time. While long-term care services can be provided in a variety of formal and informal settings, the majority of all long-term care is provided in the recipient's own home by family and friends.
A number of factors play a role in determining whether or not the need for long-term care will result in catastrophic expenses. These factors include: the severity of a person's disability; the type and duration of services needed; the living arrangements and the availability of family support; the source of payment (i.e., whether insurance or government will pay for services or whether they must be paid out-of-pocket); and the level of personal resources (income and assets) that are available; and the cumulative financial effect of previous acute or chronic care expenses.
Most people who require long-term care do not experience a catastrophic financial burden. This is because the greatest portion of long-term care (71 percent) is provided in the home or community, rather than in the higher cost setting of a nursing home; and most home and community care (about 70 percent) is provided totally without payment by family members and friends. Among the disabled elderly living in the community who do receive some combination of formal (paid) and informal home and community care services, only a small percentage incur any significant out-of-pocket expense for their care.
High out-of-pocket expenditures for long-term care are most strongly associated with nursing home care. However, even when nursing home care is used, it is important to note that approximately one-half of those who enter a nursing home will stay less than 90 days, and about 38 percent will stay less than 30 days.
The Long-Term Care Population and Service Needs. Approximately five percent (1.4 million) of the 65 and over population resides in nursing homes. In addition, about 16 percent (4.6 million) of the elderly are disabled and living in the community. The great majority (3.7 million) of such disabled persons in the community need assistance because of limitations in what are termed "Activities of Daily Living (ADLs)": eating, using the toilet, mobility, bathing, and dressing. The rest have less severe limitations but need assistance with activities such as shopping, cooking and performing chores.
The number of older persons, and therefore the demand for long-term care, is expected to grow significantly in the future. In 1984, there were about 28 million persons age 65 or older in the U.S. By the year 2030, this number will grow to almost 65 million. In addition, the elderly population is itself becoming older. Between 1980 and 1990, the 75 to 84 year age group will increase twice as fast as the 65 to 75 year age group; and, in the subsequent two decades, the group 85 years and over will increase three to four times as fast as the general population. Since the likelihood of needing nursing home care increases with advancing age (as well as with being female, and with living alone), these demographic changes are likely to translate into significant increases in the demand for long-term care services.
Although it is difficult to estimate lifetime risks, most recent studies indicate that an individual's chance of spending some time in a nursing home during his or her life ranges between 20 and 45 percent. The average length of stay in a nursing home is estimated to be 456 days. However, the nursing home population is a mix of short-term stayers, i.e., terminally ill patients, convalescent or rehabilitative patients who return to the community, and long-term stayers, i.e., patients with chronic illnesses such as Alzheimer's disease, who often remain in a nursing home for many years.
If advances from medical research and changes in prevention and treatment do not decrease the proportion of the population that becomes disabled, the number of elderly in nursing homes is projected to grow to 1.6 million by 1990, 2.1 million in the year 2000, and 4.4 million in 2040. Similarly, the number of older persons with ADL limitations living in the community will rise to 4.2 million by 1990, 5.1 million by the year 2000, and 10.2 million by 2040.
Long-Term Care Expenditures. Total health care expenditures for persons aged 65 and older exceeded $119 billion in 1984. The largest category was hospital care (45 percent), followed by nursing home care (21 percent). However, in terms of direct out-of-pocket expenditures, nursing home care constituted the largest single expense category for the elderly, accounting for about 42 percent of total out-of-pocket health care expenditures. In contrast, hospital care accounted for only 5.6 percent of total out-of-pocket payments.
Separate estimates of the cost of home and community care services for the long-term care of the elderly are not currently available. However, 1983 industry estimates put home care costs for the elderly in the approximate range of $3.0 billion.
Institutional Long-Term Care. In 1984, $32 billion were spent for nursing home care for persons of all ages, accounting for 8.3 percent of total national health expenditures. Detailed information for 1985 is not yet available, but preliminary estimates indicate that 1985 total nursing home expenditures were $35.2 billion, about three-fourths of which was for nursing home services for the elderly. The 1984 nursing home care expenditures were almost equally divided between public and private sources. Approximately $15.8 billion of the $16.3 billion spent in 1984 from private sources was out-of-pocket; and $13.9 billion of the $15.7 billion spent in.1984 from public sources was spent by Medicaid.
Home Health and Community-Based Services. According to the 1982 Long-Term Care Survey, 1.1 million of 4.6 million disabled elderly living in the community received some formal services from paid caregivers. Of these, about 600,000 individuals (12 percent) were estimated to have paid for some of their home care directly out-of-pocket, with median expenses being $40 a month and the average being $164 per month. Approximately 10 percent of the persons who had any out-of-pocket expenditures (i.e., 60,000 persons), had payments for home care services of over $400 per month.
Public Financing Programs. While personal, family and private charitable resources are an essential and often dominant element of the long-term care system, Federal, State and local government programs also have a major effect on the nature, availability and costs of such services. In addition to Medicaid and Medicare, long-term care services and/or support are provided by the Veterans Administration (VA), the Office of Human Development Services (OHDS), and numerous State and local programs.
THE IMPACT OF HEALTH, SOCIAL AND ECONOMIC TRENDS
Trends in Chronic Disease and Disability. The diseases which cause chronic disability are generally not those which lead to high mortality. About three-fourths of all disability is caused by dementia, arthritis, peripheral vascular disease, cerebrovascular disease and hip and other fractures. Conversely, the major killers, such as heart disease and cancer, cause less than two percent of chronic disability.
As mentioned previously, if current age-specific rates of disability continue, the number of disabled Americans with ADL limitations living in the community will grow from 3.7 million persons in 1984 to about 10.2 million persons in 2040. For example, with respect to Alzheimer's disease, it is estimated that perhaps only 1 percent of those under 65 have the disorder, while 15 percent of those over 85 are afflicted. In the absence of major treatment and prevention breakthroughs, the combination of chronic mental and physical disabilities will significantly increase the need for long-term care as the population ages.
Continuing technological advances may help to limit the impact of disabilities often associated with the need for long-term care services. Technological advances are currently under development in such areas as accident prevention, hip replacement, prevention of hearing loss, urinary incontinence devices, and assistance-summoning devices.
Societal Changes. In addition to increased longevity, several other societal factors also may affect the future demand for long-term care. Between 1960 and 1984, the proportion of noninstitutionalized elderly living alone has increased from 19 percent to 30 percent. The majority of these people are older women who have outlived their spouses.
The major source of long-term care support for these widowed elderly is their children. While the increase in childbearing occurring over the past decade is expected to continue in the short-term, when the baby boom generation nears age 65 (around the year 2010), fewer elderly women are likely to have children to care for them. Another factor which affects the availability of family care is the geographic proximity of the parent and child. Between the 1960s and the 1970s, the number of elderly moving from one State to another increased by 50 percent.
The willingness of adult children to provide support to their elderly parents is a major issue in projecting the need for formal long-term care. The increasing participation by women in the work force suggests that middle-aged daughters may have less time to provide assistance to their elderly parents. Nevertheless, the research that is available has found that middle-aged daughters who also work will make considerable personal sacrifice to care for elderly parents and that the commitment of young women to care for their parents remains strong.
Economic Status of the Elderly. The economic status of the elderly has improved dramatically over the past two decades. The proportion of elderly living below the poverty line has decreased from 25 percent to 12 percent. However, a significant number of the elderly are "near-poor" and are highly vulnerable to being poor. Poverty rates remain higher among elderly women, persons who live alone, the oldest old (85+) and minority populations, some of the very groups at highest risk for long-term care. In 1984, the average income of elderly families was $26,000; for unrelated elderly individuals, average income was $10,800.
Social Security benefits were the largest source of income for the elderly in 1984, averaging 37.6 percent of income for couples and 44.5 percent for individuals. Money from assets (savings, IRAs and stocks) was the second largest source of income for the elderly, averaging 27.6 percent for couples and 30.6 percent for individuals. Earnings and pensions also are significant sources of income for the elderly.
Home equity is the largest asset of older persons. In 1984, 75 percent of older persons owned their homes, and about 83 percent of this group owned them free and clear. The most recent figures from the U.S. Census indicate that the average home equity for persons aged 65 and over was $54,700 in 1984.
ANALYSIS OF PROVIATE FINANCING MECHANISMS FOR LONG-TERM CARE OF THE ELDERLY
Although there are several ways in which individuals can use their private resources to protect against the high costs of long-term care, the existing options for private financing are neither well developed nor widely used. It is the underlying premise of this report that private financing options for long-term care can play a larger role in our society than is currently the case.
General Approaches to Private Financing. This report considers three basic approaches to the financing of care: cash accumulation, risk pooling and resource mobilization techniques. The strengths and weaknesses of various caregiver support strategies are also considered. Lastly, the report presents the results of special analyses which explore the potential of combinations of approaches.
Cash accumulation strategies refer to savings mechanisms that encourage individuals to increase the resources available for future long-term care needs. The principal cash accumulation strategy examined in this report is the long-term care Individual Medical Account (IMA), which would provide Federal or State tax advantages for savings deposited in accounts earmarked for long-term care expenses.
Risk Pooling refers to mechanisms which pool the resources of a large group of individuals at risk to pay for long-term care services which will be needed by a relatively small but unknown subset of the group. Three types of risk pooling mechanisms are examined:
- Long-term care insurance, which pools the premiums of a group of beneficiaries to cover the risk of needing extended nursing home care, intermediate care or home health services
- Social health maintenance organizations (SHMOS), which use the pre-paid, capitated (i.e., set fee per person), case management approach of health maintenance organizations to provide long-term care benefits to groups of individuals
- Continuing care retirement communities (CCRCs), which typically provide older persons with a package of benefits that includes residential, health, social and custodial services, in return for an entrance fee and monthly charges
Resource mobilization refers to financing mechanisms that enable individuals to convert non-liquid resources to cash, thus enhancing an individual's ability to pay for long-term care services. Two types of resource mobilization approaches are considered:
-
Home equity conversion (EEC) plans allow a homeowner to convert the equity in a home into a stream of income without having to move or make immediate repayment.
-
Employee benefit options for retirees refer to the addition of long-term care benefits as an option in the package of pension or health benefits offered employees.
Caregiver support strategies refer to mechanisms designed to strengthen and expand the existing informal network of long-term care provided by families in the home and in the community. This network is essential to the success of private financing mechanisms because home and community-based services usually are provided at no cost to the patient and because it keeps disabled older persons with their families, where most persons would prefer to be. Two types of caregiver support strategies are examined:
- Tax allowances for home care, which provide special tax credits, deductions, or cash subsidies to assist family members in providing home care services for an elderly dependent
- Volunteer systems, in which organizations and individuals assist others in providing unpaid long-term care services to older persons in the community
- Combination financing approaches are designed to improve the effectiveness of one financing mechanism by blending its attractive features with that of another. This report analyzes the potential of a variety of combinations, including the development of long-term care IMAs that have a risk pool feature.
ANALYSIS OF SPECIFIC PRIVATE FINANCING MECHANISMS
Long-Term Care Individual Medical Accounts (IMAs)
A variety of proposals have been advanced which would permit individuals to establish tax-favored accounts dedicated, in whole or in part, to the purchase of long-term care health services. In May 1986, Colorado became the first State to enact legislation creating a tax-favored IMA and is in the process of implementing its planned program.
Because IMA proposals are new, analysts assessing the potential impact of various IMA proposals have used the Federal experience with Individual Retirement Accounts (IRAs) as a base for estimating the number of persons likely to establish an IMA if given an opportunity (i.e., the participation rate) and for estimating the amounts likely to be saved.
Although participation rates varied considerably by income level, only 15.4 percent of all tax returns showed a contribution to an IRA in 1984. About 9.5 percent of all taxpayer returns contributed the maximum tax-favored amount. The Treasury Department estimates revenue losses of $14.4 billion in 1986 from IRAs, some of which will be recovered in later years as future withdrawals are taxed.
Most analysts consider the IRA participation and savings rates to be an upper limit on a voluntary IMA program. This is because IMA proposals place more restrictions on the use of funds by the saver and, therefore, are less flexible and less attractive to the public as a savings device. The financial incentives of IMA proposals will be altered by the tax reform legislation. The legislation affects deductions for medical expenses and IRA contributions, as well as overall rates of taxation.
A critical issue in considering IMA proposals is the amount a person must save to pay for future long-term care should it be needed. Individual savings must be sufficient to cover the high costs of nursing home care (which averaged $22,000 in 1984). The problem is compounded by inflation rates, which are rising faster in the nursing home sector than in the general economy. A significant amount must be saved every year if a person wishes to accumulate sufficient funds to cover the average nursing home stay. Yet, the majority of persons are likely to need no paid long-term care services.
Because of this latter phenomenon, called "target inefficiency", IMA proposals which have a risk pooling dimension (such as that proposed by Bowen and Burke in Federation of American Hospitals Review, December 1985) are somewhat more promising. As discussed below, such combinations lower the amount individuals need to save.
Freestanding Long-Term Care Insurance
Freestanding long-term care insurance is insurance that provides payment for long-term care services in an institution or a person's home. The policy covers chronic care services needed for an extended period of time, rather than the acute, recuperative or rehabilitative care covered by Medicare and medigap policies. Beneficiaries are free to select their own provider within general qualifying guidelines.
The market for long-term care insurance is still in an early stage of development. According to the American Health Care Association, there were about 25 long-term care insurance products being sold in 1986, many of which were new entries into the market. Most policies have been sold on an individual rather than a group basis. Estimates of the total number of policies sold range from 50,000 to 300,000.
Although there is considerable diversity among the long-term care insurance products, all focus on nursing home care, with only limited (or no) custodial and home care benefits. Benefits are structured as indemnity plans, paying fixed amount per day (usually not indexed for inflation), with waiting periods before coverage begins and coverage from two to six years.
Products have traditionally been sold to persons of retirement age, although marketing for a few newer products has been expanded to earlier age groups. Premiums differ substantially among companies. According to a Money Magazine article that appeared in March 1986, a 65 year old person could pay from $174 to $1,451 for policies that cover differing ranges of skilled and custodial care.
The principal strengths of freestanding insurance as a mechanism for financing long-term care include: 1) long-term care insurance addresses the major cause of catastrophic expense among the elderly by focusing primarily on the nursing home risk; 2) long-term care insurance provides affordable protection for many individuals; and 3) long-term care insurance can potentially relieve upward cost pressures on Medicaid by slowing or eliminating the spend-down process for insured persons.
The weaknesses of the mechanism include: 1) existing products reinforce the bias toward institutional care, a bias that is both costly and contrary to the preference of most older persons for home care services; 2) the insurance does not provide complete catastrophic coverage and generally pays fixed benefits that can be eroded by inflation; 3) at present, the premium levels for complete coverage are higher than many older persons can afford; 4) the freestanding product, which separates long-term care from acute care, reduces the incentive to manage the total spectrum of care and leads to the marketing of two insurance products, with possible overlap and confusion for purchasers; and 5) marketing to individuals rather than groups raises premium costs and can more easily lead to adverse selection.
Research indicates that there is substantial room for growth in the long-term care insurance market. Two major studies have estimated the number of persons over age 65 who could afford long-term care insurance. One placed the number in the range of 4.7 million elderly, and the other placed the number in the range of about 7.0 million elderly. However, because neither study factored in the effects of inflation over time, the estimates may be high. Various linkages have been proposed to enhance the marketability of long-term care insurance including:
- Medicare Super Supplements that include both acute and long-term care benefits and create an opportunity to coordinate benefits
- Medicare-HMOs in which HMOs integrate an optional long-term care insurance package with their traditional acute care services for Medicare beneficiaries and provide appropriate case management for all services
- Medicare Vouchers under which Medicare beneficiaries would have the option of receiving a voucher covering the Medicare part of the cost of purchasing private insurance that not only covers Medicare acute care services but could include long-term care benefits
- Retirement Community Reinsurance with CCRCs establishing joint ventures with insurance carriers to underwrite the CCRCs' chronic care guarantee
- Continuing Care at Home models that enable participants to buy into a long-term care risk pool that has a managed care component
- Combined Life and Long-Term Care Insurance to balance different lifetime risks and encourage the purchase of long-term care protection at younger ages
Several States including Washington, California and Colorado, have initiated programs which help consumers select long-term care insurance protection. Developing an appropriate regulatory environment has been difficult for States because of the unfamiliarity of long-term care insurance, which combines features of both health and life insurance. Efforts to protect consumers have sometimes inadvertently worked to stifle the market. A recent study by the National Association of Insurance Commissioners may help clarify issues and serve as a basis for model laws and regulations.
Social Health Maintenance Organizations
A social health maintenance organization (SHMO) is a managed system of health and long-term care services in which a single provider entity assumes responsibility for a full range of acute and chronic care under a fixed budget that is prospectively determined. At present, development of the SHMO concept is highly experimental, being tested by the Health Care Financing Administration (HCFA) in four demonstrations that began operation in March 1985. The demonstrations, selected to represent different organizational possibilities, includes sites in Portland, Oregon; Brooklyn, New York; Minneapolis, Minnesota; and Long Beach, California.
The benefit package offered includes all Medicare benefits, plus a range of long-term care and other supplemental benefits. Copayments for long-term care services are required and long-term care benefits are subject to annual dollar maximums which range from $5,000 to $12,000. The financing arrangements of the demonstrations vary but include capitated payments (which are pooled) from Medicare (for all enrollees), Medicaid (for eligibles) and private enrollees (for non-Medicaid enrollees).
Although SHMOs may have the potential of reaching a large target population, they are still in the early stages of development and can only be operated by explicit statutory waivers of existing program requirements. An independent evaluation of the SHMO demonstration program is being conducted by the University of California, San Francisco and will be completed in 1990.
Continuing Care Retirement Communities
The continuing care retirement community (CCRC) is a financially self-sufficient residential community for the elderly that offers medical and nursing services in specialized facilities. It is based on a lifetime contract between the CCRC and each resident that defines each party's financial and service obligations.
Ordinarily, one of the requirements for admission to a CCRC is that the resident be covered by Medicare and own a medigap insurance policy. As a consequence, nursing home care is the key service added and guaranteed as part of the basic CCRC arrangement. Most CCRCs have their own nursing home facilities within the community. Increasingly, however, CCRCs are contracting with outside facilities to provide needed nursing home care. CCRCs are also beginning to contract with private insurance companies to insure or reinsure nursing home services.
The number of CCRCs is relatively small, with estimates ranging from 300 to 400 communities, serving 100,000 to 200,000 persons. The industry is growing rapidly, with the potential of developing 1,500 more communities by 1990, housing a total of 500,000 persons or two percent of the older population.
Entrance fees range from $15,000 to $175,000, depending in part on the size of the residential unit and the extent of the health care services guaranteed. Monthly service fees range from $300 to upwards of $2,000. Some CCRCs offer contracts in which fees are totally or partially refundable to residents who leave or to their heirs upon death.
CCRCs have attracted the middle class almost exclusively, often former professionals with pensions. Research indicates that 10 to 20 percent of older persons could afford CCRC residence.
Many of the early CCRCs guaranteed total health care for life to residents and were known as "life care communities". Due to inflation, high interest rates and poor actuarial estimates, the costs of providing such guaranteed health care exceeded revenues and led to financial problems in a number of CCRCs, as well as to a few bankruptcies. Although the terms "life care community" and CCRC often are used interchangeably, the newer CCRCs guarantee a more limited range of health care services, with additional services being billed separately.
A number of States have developed legislation aimed at defining life care communities, regulating contracts between communities and residents, and requiring financial disclosure. States without specific life care legislation often review requirements for nursing home beds to be built in CCRCs or implement other State health planning requirements. In addition, the American Association of Homes for the Aging, which represents the predominant non-profit sector, is developing rigorous accreditation standards to safeguard the quality and financial integrity of CCRCs.
Home Equity Conversion Plans
Home equity conversion (HEC) plans are designed to allow a homeowner to convert the equity in a home into a stream of income, without having to move or make immediate repayment. HEC plans differ from home equity loans, which require the homeowner to begin repayment immediately. The assets freed through the HEC plan can be used for any purpose, including the purchase of long-term care services. Although HEC plans have been available since 1961, in 1985 fewer than 1,000 bank or mortgage company financed HEC loans are thought to exist nationwide.
The equity held is usually the older persons most important financial asset, yet it may be difficult to use without having to sell and move from the home. Seventy-five percent (13.4 million) of households headed by older persons in 1984 were homeowners, and most (83 percent) owned their homes free of debt. According to the Census Bureau, the average home equity for persons aged 65 and over was $54,700 in 1984. The aggregate home equity held by the elderly is estimated at $700 billion.
There are three basic types of HEC plans in use. Open term reverse mortgages, the most common commercial type, pay monthly cash advances to the homeowner until he or she dies, reaches age 100 or moves. The effective annual interest rate for this type of mortgage depends on how long the borrower lives in the home and the home's rate of appreciation. In general, the interest rate is very high for loans repaid after a short term but tends to decline the longer the borrower is able to remain in the home.
The second type of HEC mechanism is the sale plan, which enables the owner to sell his home while retaining occupancy rights. The city of Buffalo, New York has been a major public developer of a life estate form of sale plan. Under Buffalo's program, elderly homeowners sell their house to a non-profit entity established by the city in return for a monthly cash annuity for life or lump sum payment. The entity also rehabilitates, maintains and pays the taxes on the house until the owner's death. Through 1985, the program had undertaken about 650 contracts.
Special purpose loans are a third type of HEC plan used by a number of States to provide older homeowners with low interest home equity loans that do not have to be repaid until the borrower dies or sells the home. As used to date, the loans have been designed to help older persons remain in their homes, rather than to pay for long-term care expenses or insurance.
Research findings on the utility of HEC mechanisms for long-term care needs are mixed. One major study by researchers at ICF, Inc. concluded that annuities paid out by HEC plans are not sufficient to generate substantial increases in the number of elderly able to afford long-term care insurance. A study by Jacobs and Weissert in 1983, which adopted different assumptions, concluded that about 5.1 million homeowners could pay for insurance with their home equity payments. Preliminary analyses by Manton and Liu indicate that HEC payment levels would pay the out-of-pocket home care costs for a large number of disabled elderly.
From the point of view of financing long-term care, a major weakness of HEC mechanisms is that is that use of the funds is entirely discretionary (except special purpose HEC loans) and may not end up being used for long-term care expenses. In addition, the mortgage arrangements are complex for both lender and homeowner and older persons have demonstrated strong reluctance to borrow against their home.
Employee Benefit Options for Retirees
The addition of long-term care coverage as a option in the package of pension or health insurance benefits offered to retirees has been suggested as one approach to private financing of long-term care for the elderly. A majority of workers are covered by an employer-sponsored pension plan and a significant number of companies provide health insurance after retirement.
Few companies are now offering long-term care benefits. While there is some suggestion of corporate, employee and labor interest in changing this situation, major barriers exist and a combination of legal, accounting and statutory changes will probably be necessary before many companies will get involved.
The barriers to progress in this area are several. First, employers are increasingly concerned about their large and unfunded liabilities for retiree health and welfare benefits. Benefits are not only becoming a significant percent of payroll but, due to an accounting change under consideration, may soon be required to be disclosed as unfunded liabilities on the financial disclosure statement of companies. Adding to the reluctance to expand benefits are recent court rulings indicating that employers may not be permitted to terminate or cut back on any defined health benefit promised to retirees.
These factors combine to make employers wary of adding any new benefit for long-term care, where demand and costs are expected to grow substantially in the future, unless it is pre-funded. However, recent policy changes under the Deficit Reduction Act of 1984 eliminated the tax advantages of pre-funding retirement health benefits by subjecting investment earnings on retirement health plan assets to current income taxation.
Despite these very real problems, employers could develop long-term care insurance options for retirees. For example, insurance for long-term care could be provided by employers as an additional fringe benefit choice, or employers could simply help form a group so that interested employees could purchase insurance. In this regard, the Federal Government might well be in a position to provide leadership through its Federal Employees Health Benefits Program.
The principal immediate strength of employer-based groups for long-term care financing lies in its potential to expand the market for long-term care insurance. Insurance offered through employer groups would be likely to carry significantly lower premiums, since the risk of adverse selection and marketing costs are minimized in this approach.
Employers could also establish programs which help support employees caring for disabled family members or which help retirees obtain the services they need. A restructuring of pension payout plans to allow for lump sum withdrawals is another way of assisting retirees meet their long-term care expenses.
Tax Allowances for Family Caregiving
Currently, family caregivers provide most of the long-term assistance given to functionally disabled persons living in the community. Public policy support for family caregivers is advocated on the grounds that it can prevent costly institutionalization by reducing the incidence of family "burnout"; relieve the excessive financial and emotional burden on caregivers; and ease the conflicts between work and caregiving responsibilities.
Subject to a number of restrictions, current federal tax policy provides three tools for targeting subsidies to taxpayer households in which dependent elderly persons are living: 1) a $1,000 exemption permitted for each elderly dependent supported by the taxpayer; 2) deductions for medical expenses of dependents if expenses exceed 7.5 percent of income; and 3) a tax credit given employed taxpayers for the care expenses of a disabled spouse or dependent, under the Child and Dependent Care Credit provisions of the current tax code.
None of these tools are widely used by taxpayers nor, as presently structured, are they considered very influential on a family's decisions about whether or not to institutionalize an elderly person. Social and emotional factors typically weigh more heavily than the financial burden in such decisions.
There are numerous Congressional proposals pending which propose further tax benefits for family caregivers. Most build on the child and dependent care credit and attempt to remove or reduce some of the limitations such as the requirement that all taxpayers in the household must be gainfully employed.
Some of the more substantial ideas for assisting family caregivers through the tax system have been developed by the States. Arizona has adopted an unusual variation which permits taxpayers to deduct eligible medical expenses for any elderly person, whether or not they are a relative, living in the State.
Tax subsidy approaches typically assist working caregivers, rather than persons who drop out of the workforce in order to provide another's care. The caregivers who leave or reduce their employment pay a price in foregone earnings and probably also in lower future earnings, both of which will lower his or her later Social Security benefits. To offset this, proposals have been put forward to allow family caregivers to deduct those years in which they provided care from the usual total earning period (35 years) mandated for other Social Security beneficiaries.
Family caregiving may also be assisted by changes in employment policies. More flexible work and leave policies, counseling programs and work-based caregiver support groups have started to attract the attention of business and other groups. A 1985 study by Traveler's Insurance Company found that about 1 in 5 of all company employees over aged 30 had caregiving responsibility for an elderly relative. Other research indicates that the conflict between work and caregiving responsibilities shows up in greater tardiness, lower productivity, and more depression.
Volunteer Systems and Service Exchange
Volunteer work is work or assistance performed without compensation except for expenses incidental to performing the volunteer role, such as supervision, training costs or assistance with transportation. Volunteerism is an important component of the Nation's public and private services systems. Surveys indicate that almost half of all Americans do some sort of volunteer work. Many of these volunteers are over age 65 and the number of older volunteers is expected to increase at twice the rate of growth for the older population itself.
Although many charitable organizations assist with the needs of the elderly, the continuum of long-term care is not a traditional focus for most organized volunteer services. In attempting to envision how volunteers can play an increasing role in meeting the long-term care needs of the dependent elderly, several principles emerge:
-
Volunteer approaches will vary widely because they need to be developed and supported by individuals and community organizations to fit community needs.
-
Volunteers serve to complement paid staff and cannot replace the specialized expertise of professional caregivers.
-
Additional knowledge is needed to support the widespread involvement of volunteers in long-term care, e.g., to identify appropriate assignments and to strike a proper balance between paid staff and volunteers.
-
Volunteer efforts cost time and money, especially those done well. While the value of volunteer efforts can far exceed operational costs, financial assistance is needed for coordination, training and other related costs.
-
Future approaches need to build on existing organizations and systems, rather than create new ones. There are a number of volunteer programs providing services for the disabled elderly, with national, State and local sponsors.
Special Analysis of Individual Medical Accounts (IMAs). Long-Term Care Insurance and Combined Financing Strategies
In March 1986, the Department initiated a series of special analyses designed to assess the potential of IMAs, long-term care insurance and insurance combinations for protecting consumers against the expenses of nursing home care. A total of seven financing prototypes and scenarios were developed and their likely future impact on out-of-pocket and Medicaid expenditures was explored using economic simulations and projections up to the year 2018. The following approaches and scenarios were examined:
- an expansion of the current limit on IRAs to include dedicated savings for long-term care;
- replacement of current IRAs with IMAs;
- long-term care insurance based on an existing private market policy;
- IMAs combined with an insurance (i.e., risk pool) feature;
- long-term care insurance on a wide scale, provided as an employee (pension) benefit;
- limited coverage long-term care insurance purchased by medigap policyholders; and
- varying coverage long-term care insurance, with premiums targeted to 1 percent of income.
It is emphasized that the work performed in developing these projections was highly experimental and the findings should be viewed accordingly.
The special analyses were limited to study of nursing home care expenditures only, primarily because nursing home care is the major cause of catastrophic health expenditures for the elderly. In addition, however, there are no national data on home care expenditures by source of payment to provide a reasonable base for prototype assumptions.
In order to assess the future impact of financing proposals, several prototypes were designed with specific features incorporated. Assumptions were made about who would participate, how much it would cost for what kind of coverage, and how factors such as inflation and induced demand would be factored. To the extent that these assumptions ultimately prove realistic, the simulation findings may be a valid approximation of the possibilities of each proposal.
It should be noted, however, that several of the prototypes and simulations were designed for exploratory purposes only and were not designed to test "realism". Rather, they were intended to give the researchers a general indication of the "upper bound", or maximum, limits of a particular approach. Further analysis of more realistic variations was undertaken only when the upper bound results showed promise.
The micro-simulation model used to estimate the impact of the various financing approaches was developed by the Brookings Institution and ICF, Incorporated. The model is based on data and assumptions that allow the user to estimate patterns of earnings, asset accumulation, and disability, and the effect of these factors on the utilization and financing of long-term care over the years 1986 to 2020. One significant limitation of the model is that it does not cover the likely peak disability Years of the "baby boom" generation born between 1945 and 1960. Some important simplifying assumptions included in the model are:
-
Supply is assumed to adjust to demand. Trends in the supply of nursing home beds have been erratic and no readily available methods exist to forecast supply. This assumption is thought to be fairly reasonable for the long modeling period used;
-
The findings discussed below assume a 5.8 percent per year increase in nursing home charges, the same as given in the Old Age Survivors and Disability Insurance and Health Insurance (OASDI and HI) Trustees Reports, Alternative II-B. The general inflation rate assumed is 4.0 percent per year, again the same estimate used in the OASDI and HI Trustees Report;
-
The age-specific rates of utilization of nursing home services were held constant, with only minor adjustments to the 1977 data used to develop the rates.
-
The model assumes that persons will first spend their current income for long-term care-then their assets, and finally will draw on Medicaid. No divestiture of assets to others to qualify for Medicaid is assumed.
The baseline estimates, which provide the basis for comparing the results of the options analyzed, project nursing home expenditures for the elderly as follows (in 1987 dollars):
| Total 1986 expenditures | $29.7 billion |
| Medicaid | $12.9 billion |
| Out-of-pocket | $16.1 billion |
| Total 2018 expenditures | $98.1 billion |
| Medicaid | $46.2 billion |
| Out-of-pocket | $50.3 billion |
FINDINGS OF THE SPECIAL ANALYSES
Expanded IRA Prototype Under this option, the tax-favored savings limit of current IRAs would be increased by $1,000, raising the maximum contribution to $3,000 for an individual and $6,000 for a working couple.
- The additional $1,000 is treated as an individual medical account for nursing home expenses;
- After age 65, funds may be withdrawn from the IRA to pay for nursing home expenses without payment of taxes. Withdrawals for other purposes would continue to be taxed at current marginal rate;
- The requirement that individuals begin withdrawals from their IRA savings by age 70 1/2 is removed and contributions are permitted indefinitely;
- It is assumed that all those who save the additional $1,000 would leave it untouched until the need for long-term care arises, or until death;
- It is assumed that 90 percent of those who saved the maximum in 1983 would save to the new maximum of $3,000.
Projected Impact
- Some IMA funds would be held by 28 percent of persons aged 65 and over by the year 2018;
- Additional IMA savings would pay for about 3.0 percent ($2.9 billion) of total nursing home costs by 2018;
- Out-of-pocket spending would be reduced by 4.3 percent compared to the base case;
- Medicaid spending would be reduced by 1.3 percent.
Replacement IMA Prototype This prototype was developed as a gross "upper bound" model, to explore the possibilities of IMAs in the event that Congressional tax reform actions eliminate IRAs for those with pensions. It is considered useful only as an general order-of-magnitude probe.
- Assumes that IRAs are eliminated entirely;
- IMAs for long-term care would be established, with a maximum contribution of $2,000 per year tax deduction;
- Assumes that everyone who currently participates in IRAs would contribute the same amount to an IMA;
- Tax treatment of contributions and earned interest is unchanged;
- The amounts saved would be tax free if used for long-term care purposes after age 65.
Projected Impact
- IMA savings would pay for 8.5 percent ($8.4 billion) of total nursing home expenditures by the year 2018;
- Out-of-pocket expenditures would be reduced by 11.9 percent;
- Medicaid expenditures would be reduced by 3.9 percent.
Long-Term Care Insurance--Private Market Policy This option modeled a new policy recently issued by Fireman's Fund which offers 6 years of long-term care coverage, with an optional inflation-adjusted benefit. Other features include a 100 day deductible, $50 per day benefit, and a three day prior hospitalization requirement. A very limited home benefit is included. The annual premium charged at age 65 is $506.
- Persons were assumed to buy the insurance if they could afford it for less than 5 percent of their income and if they have $10,000 or more in assets;
- It is assumed that, in 1986, persons aged 67 to 81 will purchase the policy. After 1986, policies will be purchased at age 67.
- No one who is disabled will be allowed to purchase the policy. Persons who become disabled will continue to hold the policy;
- Once a policy is purchased, coverage is continued as long as premiums are less than 7 percent of income and the person has $10,000 in assets;
- Induced demand is reportedly factored into premiums but, due to proprietary considerations, the rate is not known.
Projected Impact
- About 23 percent of those age 65 and over would own the Fireman's Fund policy in the year 2018;
- About 7 percent of total nursing home expenditures would be paid by insurance by 2018;
- Out-of-pocket expenditures would decline by about 12 percent;
- Medicaid expenditures would decline by less than 2 percent.
IMA Combined with a Risk Pool (Insurance) Feature Under this option, a variation of the Bowen-Burke proposal, IMAs would be established with all contributions deposited into an individual account, along with one-half the interest earned. The other half of the interest is placed in a pooled fund and is used to pay a $50 per day benefit to persons with long-term care needs who have exhausted their own account. All interest on the pooled fund remains in the pooled fund. Amounts remaining in the account at death go to the estate.
- It is assumed that 90 percent of all persons who contributed the IRA maximum in 1983 will contribute an additional sum to the IMA;
- Without an induced demand factor, the initial annual contribution necessary for a person age 40 would be $943, and for a person age 60 would be $2,628, over and above the IRA maximum.
- If induced demand is factored in (37 percent), the initial annual contribution necessary for a person age 40 would be $1,497 and, for a person age 60 would be $3,603, over and above the IRA maximum;
- The level of necessary contributions would rise at the rate of inflation, currently estimated at 5.8 percent for the nursing home sector;
- The level of contributions necessary to assure solvency of the pooled fund were calculated by the Department's Office of the Actuary;
- Contributions are waived while an individual is in a nursing home at age 65 or older.
Projected Impact
- About 29 percent of those age 65 and over would have a combination IMA account in 2018;
- Funds saved in the combination accounts would pay about 8 percent of total nursing home expenditures in 2018;
- Out-of-pocket expenses would be reduced about 11 percent;
- Medicaid expenditures would be reduced about 4 percent.
Long-Term Care Insurance Linked to Pension Benefits This scenario linking insurance to pension benefits was developed as a preliminary upper bound test of significantly broader-based participation than is now the case for long-term care insurance models. It is not considered 'realistic, in the near term because of the barriers to broadening pension benefits discussed earlier in the analysis.
- It was assumed that, beginning in 1987, all persons aged 65 and older who start to receive pension benefits of $1,000 or more per year would receive a long-term care insurance policy. The policy would cover a 2 year nursing home stay, have a 90 day deductible period and pay $50 per day in 1986 dollars for nursing home care;
- One half of the cost of the insurance is deducted from the pension;
- Induced demand is not factored into premium estimates.
Projected Impact
- Under these assumptions, about 35 percent of those age 65 and over would have a long-term care insurance policy in the year 2018;
- Insurance would pay about 11 percent of total nursing home expenditures in 2018;
- Out-of-pocket expenditures would decline by 11 percent;
- Medicaid expenditures would decline by nearly 8 percent.
Limited Coverage Long-Term Care Insurance Purchased by Medigap Policyholders This prototype investigated the impact of limited coverage long-term care insurance if purchased by persons who have already demonstrated a willingness to supplement their acute care coverage, i.e., medigap policyholders. Surveys indicate that the percentage of older persons who purchased one or more medigap policies ranged from about 53 percent for persons just above the poverty level, to 77 percent for upper income groups.
- It is assumed that, beginning in 1987, persons aged 67 and over who had purchased a medigap policy, also purchased a 1 year long-term care insurance policy with a $50 per day benefit and 90 day deductible;
- Induced demand is not factored into premiums.
Projected Impact
- About 55 percent of those aged 65 and over would have a one year policy in the year 2018;
- Insurance would pay about 18 percent of total nursing home care expenditures;
- Out-of-pocket expenditures would be reduced about 12 percent;
- Medicaid expenditures would be reduced about 18 percent.
Varying Coverage Long-Term Care Insurance with Premiums Targeted at 1 Percent of Income Assuming some long-term care insurance coverage might be better than no protection, this prototype simulates the impact of providing persons with varying levels of insurance, depending on what they could purchase with 1 percent of income.
- It is assumed that, beginning in 1987, persons age 30 and over purchase the maximum coverage available (1 to 6 years or unlimited) that costs no more than 1 percent of their income. Policies would pay $50 per day benefit, with a 90 day deductible period;
- If premium exceeds 2 percent of income for three consecutive years while under age 65, the coverage is dropped by 2 years (or from no limit to 6 years;
- Persons aged 65 or over in 1987 are assumed to purchase the longest coverage that costs no more than 3 percent of income, if assets are $10,000 or more. If premiums exceed 5 percent of income for three consecutive years, then the coverage is dropped by 2 years;
- Induced demand is not factored into premiums.
Projected Impact
- Under these assumptions, about 63 percent of those aged 65 and over would own an insurance policy in 2018;
- Insurance would pay about 17 percent of total nursing home expenditures in the year 2018;
- Out-of-pocket expenditures would decline by about 18 percent;
- Medicaid expenditures would decline by about 12 percent.
The Effect of-Induced Demand on Projected Impacts
Experience has shown that when the direct cost of a health service is reduced for a consumer, either due to lower costs or increased payment by a third party (insurance), demand for that health service increases. Although the decision to enter a nursing home is generally considered a 'last resort, decision, it is reasonable to assume that financial considerations play some role. Should nursing home insurance (public or private) become more widely available, the financial barriers will be reduced and entry into nursing homes will be facilitated. Utilization rates for nursing homes can be expected to rise.
The problem for researchers and insurance companies is, "What level of additional induced demand will be generated by widespread use of long-term care insurance mechanisms?" No reliable data are available for the precise determination of what the rate should be.
Most persons agree that induced demand in the nursing home sector will be less than has been the case with acute care, because of the biases against entering a nursing home. The level will also be affected by the broadness of the coverage offered, i.e., the cost to the consumer of using the policy. Factors such as up-front deductibles (elimination periods) and copayments (benefits may cover all or only part of the daily cost) can be expected to significantly affect the induced demand factor.
The factors used in this report are based on the expert judgement of the Office of the Actuary (Social Security Administration) and could arguably be more or less. Detail concerning the effect of induced demand on premiums or contributions is provided in the full report.
An example of the effect of induced demand can be seen by comparing the results of the last option cited above (Long-Term Care Insurance/Premiums Targeted at 1 Percent) with the projected impact of the same option when induced demand is factored at 11 percent. When induced demand is considered, overall expenditures for nursing home care increase by 2.3 percent. The amount of total nursing home expenditures paid by insurance is 15 percent, rather than 17 percent; out-of-pocket expenses are reduced by 14 percent, rather than 18 percent; and, Medicaid expenditures are reduced by about 9 percent, rather than 12 percent.
THE RELATIONSHIP OF MEDICAID TO PRIVATE FINANCING MECHANISMS
Medicaid was established in 1966 as a joint Federal-State program to provide medical assistance to certain groups of low-income individuals. About half of total Medicaid expenditures in 1984 were for long-term care, including skilled, intermediate, home care, and mental health services as well as services for the mentally retarded.
Medicaid is a welfare-based system. Medicaid eligibles include the low-income aged, the blind, the disabled and those eligible for Aid to Families with Dependent Children (AFDC). States may also cover benefits for "medically needy" individuals and nursing home residents with incomes up to 300 percent of the Supplementary Security Income (SSI) payment level.
There has been some concern that Medicaid acts as a disincentive to the purchase of private protection. The issue has two related aspects: that because Medicaid is available, people will not give serious attention to long-term care insurance and other privately financed protection; and that people with resources will "game" the system by passing their assets along to others or protecting them in a trust, thus becoming eligible for Medicaid benefits.
A recent critique of these issues concludes that these concerns may be considerably overemphasized. The analysis presented in Chapter 4 of the report suggests that while incentives for people to alter their behavior to qualify for State-supported benefits do exist, it is not at all clear that significant numbers of people are responsive to such incentives.
First, the public's understanding of how long-term care is paid for and what coverage people actually have is very poor. A recent national survey of members of the American Association of Retired Persons revealed that 79 percent of those who expected at some point to have an extended nursing home stay, thought that Medicare would pay for all or part of this care. About one-third of those with private medigap insurance coverage incorrectly believed that their policies would cover extended nursing home care.
A second consideration in evaluating Medicaid's impact on private financing mechanisms is evidence that middle-class people are generally not disposed to rely on a welfare-based program for long-term care expenses. For example, a recent study by the National Center for Health Services Research of 4,000 older persons in six states found that only 19 percent said they would not purchase long-term care insurance because they viewed Medicaid and other welfare coverage as adequate.
The degree to which the elderly are aware of and willing to use methods of circumventing Medicaid's asset restrictions is also unknown. However, asset protection requires considerable advance planning and an awareness of Medicaid eligibility rules and, in general, is both difficult and expensive to accomplish.
The considerations mentioned above suggest that Medicaid is not currently a significant barrier to private financing of long-term care. However, this does not preclude the possibility that changes in Medicaid could have a positive impact on private financing mechanisms. As a consequence the report describes, but takes no position on the merits of, several approaches which would make it more difficult for persons who can afford to pay for their own long-term care costs to become eligible for Medicaid. These proposals would:
- Severely restrict Medicaid eligibility to prevent persons from qualifying for Medicaid benefits if they could once have afforded to provide for long-term care insurance in a prior period;
- Permit States to require spouses of Medicaid recipients to contribute to the cost of their spouse's care;
- Allow States greater flexibility in use of liens imposed on recipients, property before death; and
- Require States to restrict Medicaid eligibility of people with assets sheltered in trusts.
Another approach currently receiving some attention (but not advocated by the report) would waive Medicaid spend-down requirements for persons who financed their own care for a fixed period, e.g., one or two years. Medicaid would pay for the full costs after the consumer paid the front-end long-term care costs. The point of this would be to increase the marketability of private financing strategies such as insurance.
This approach would build on the fact that there is a significant effect on the affordability of insurance premiums when the period of coverage is limited. For example, a two year, $50 a day nursing home policy purchased at age 65 costs approximately $650 per year. A lifetime policy (no limit on nursing home coverage) purchased at the same age would cost about $1400.
One critical issue is whether the increased affordability of a limited nursing home policy, in combination with waiving spend-down, would expand participation under an insurance option enough to offset the drain on Medicaid. The intuitive answer is that it would not. The analyses done to date suggest that the people who would purchase long-term care insurance are not the people who end up on Medicaid. Therefore, picking up the Medicaid costs for everyone at the end of one or two years would end up increasing Medicaid costs over current projections. If one factors-in induced demand, the problem for Medicaid is worse.
Another major problem with this proposal is the issue of equity. Persons at higher income levels who could afford insurance would have their assets protected. Persons at lower income levels who could not afford insurance would lose everything. In essence, such a proposal would create a new Federal long-term care benefit, but only for those who are already well-off.
CONCLUSIONS
Federal, State and local governments pay almost half the costs of long-term care services received by older persons in the United States. Almost all the rest is paid directly by individuals or families who are largely unprotected by insurance or other types of mechanisms that shield the individual from catastrophic health expenses. It is evident that the vast majority of older Americans would greatly benefit if suitable and effective private financing mechanisms for long-term care were more widely available, at a reasonable cost.
This report has analyzed the feasibility and effectiveness of a broad range of private financing strategies which can assist persons in paying for long-term care. Of particular interest has been the extent to which these strategies can be expected to attract broad participation and help limit the out-of-pocket expenditures for individuals.
Clearly, the private financing strategies discussed in this report cannot solve all of the problems associated with catastrophic long-term care costs, especially for those at the low end of the income scale. There will continue to be a need, regardless of the potential of private solutions, for a public role in assisting people who need formal long-term care services and who cannot afford private means of protection. Further, there will continue to be a need to assist those individuals and families who, despite advance planning and private financial protection, encounter long-term care expenses that are well beyond ordinary means.
Nevertheless, private financing mechanisms can help a substantial number of individuals protect themselves and their families against the high costs of nursing home and other long-term care expenses. However, these options for private financing are neither well-developed nor widely known. This report is intended to serve as both a summary of what is presently known about the need for and costs of long-term care, as well as to promote a better understanding of the potential of private financing mechanisms and of how their use might be further developed.
The report has determined that the potential for expanding private financing mechanisms is significant and should be carefully nurtured. The analysis has demonstrated the potential of private mechanisms. However, the analysis also indicates that, while the economic status of the elderly is improving, one of the central problems in realizing the potential is the affordability of the private financing approaches.
The report also stresses that the great majority of elderly will not require extended nursing home stays during their lifetime. Those that do, encounter expenses that can easily deplete the savings of a lifetime. The challenge to private financing mechanisms is to bring the cost of protection within the means of a wider segment of the older population. This will enable the elderly to translate their resources into protection from financial ruin.
Analysis suggests that several of the options could provide protection to large numbers of the elderly, especially those in the middle and upper income ranges. Private long-term care insurance and combinations of insurance and other mechanisms show the greatest promise. In particular, insurance combined with alternate delivery approaches (e.g., CCRCs and SHMOs) and with supportive funding sources (e.g., IMAs and HECs), offer the opportunity to mass market insurance and to reduce concerns over adverse selection.
The report also indicates that, for the older persons who can afford the regular monthly fees, CCRCs provide an appealing alternative. Other mechanisms such as SHMOs are exciting in concept, but are just too new for analysts to assess with confidence.
Family and community-based care are the bulwark of the long-term care system. Even though most research suggests that the addition of home care does not significantly deter nursing home use, the informal care network should be encouraged and supported because it is humane and reflects what most of the elderly and their families desire.
The report suggests that volunteers represent an under-utilized resource for long-term care that could provide valuable services to elderly disabled and their families. Volunteerism is an important component of the Nation's public and private service system.
The report's focus on long-term care tends to isolate the discussion from the other essential components of care. In the judgement of many, the greatest potential for creating savings in total health care expenditures, as well as for fostering improvements in the appropriateness and satisfaction in care rendered, is in development of health systems which encourage a comprehensive approach to care. For this reason, special attention is drawn in the report to those private financing mechanisms which foster a comprehensive care approach.
Foremost in promoting the expansion of any of these mechanisms is the need for consumer education. This report has cited surveys which clearly demonstrate that older persons do not fully appreciate their vulnerability with respect to catastrophic nursing home care costs. They do not recognize that nursing home costs, hot hospital or physician costs, constitute the highest out-of-pocket expenditure for persons over age 65. Nor do older persons understand that neither Medicare nor private supplemental insurance offers much coverage in this regard. Once these facts are widely appreciated, then the opportunity for achieving the potential of any of the private financing approaches is significantly enhanced.
Governments can continue to assist the process through further research and development and by helping to educate the public as to both risks and options. Flexible regulatory policies and close collaboration among all levels of government and the private sector are also essential.
Private options are not certain to have a large impact in the immediate future. They are only now emerging, mostly on a trial basis, and they have not begun to touch the lives of most of the population at risk for having long-term care needs. Yet, their potential for expansion is significant and should be carefully nurtured.
CHAPTER 1. INTRODUCTION
A. BACKGROUND OF THE REPORT
In the middle of this century, aging policy was dominated by issues of poverty and economic disadvantage. The concern was well founded, for in the 1950s over a third of older persons had incomes below the poverty line. However, as America moves toward the 21st century, the economic well-being of the average older person is improving dramatically.
Since 1981, the poverty rate for people over the age of 65 has been less than the poverty rate for the general population. This strengthened economic security comes at a point in our history when the aging policy debate is shifting emphatically to concerns about how the health and long-term care needs of a rapidly growing elderly population can best be met.
Within 50 years, the number of people age 65 and over will more than double. The number of people living to age 85 or over will almost quadruple from 2.2 million in 1980 to 8.6 million by 2030.
The majority of these older people can expect most of their senior years to be healthy and independent ones. Nonetheless, the incidence of acute medical problems and chronic disabling conditions which require long-term care increases with age. For example, about 90 percent of nursing home residents are elderly and almost one-quarter of persons over the age of 85 are institutionalized.
This situation foreshadows sizeable increases in the need for long-term care and points the way towards a new policy challenge. The current system of financing and delivering long-term care services is strained. The system is heavily oriented toward institutional care, yet the vast majority of elderly people who need long-term care prefer to remain in their own homes. It is expensive--the Nation's nursing home bill has soared to over $35 billion a year and is projected to reach $56 billion by 1990. it can be dehumanizing when it results in the impoverishment of middle income people who cannot afford the average cost of $22,000 a year that nursing homes now charge private pay patients.
The cost of long-term care is borne almost entirely by patients and their families or by Medicaid. Unlike the financing for acute care, there is almost no participation by the private sector in long-term care financing. As a result, individuals wishing to plan to meet their own long-term care needs have very limited options.
Clearly, it is time for new directions. On February 4, 1986, President Ronald Reagan directed the Secretary of the Department of Health and Human Services, Dr. Otis Bowen, to examine catastrophic health care needs in the United States and to report to him by the end of the year on how government and the private sector can work together to address this problem. Long-term care is a major portion of this effort because it is considered the leading cause of catastrophic health care expense in those age 65 and above.
In keeping within the general mandate, this report focuses upon private financing strategies to help ameliorate the high public and out-of-pocket costs resulting from the current long-term care system. The report has three objectives:
- To describe the characteristics of elderly people who need long-term care and how these characteristics will change over time;
- To assess the potential of private financing mechanisms to lessen the catastrophic impact of nursing home and home care expenses that can wipe out individual and family savings; and
- To develop actions that would increase the availability and use of private financing mechanisms for the long-term care of older persons.
Because the elderly population, particularly the very old, is by far the largest population group that is truly vulnerable to the need for long-term care, the scope of this report is limited to private financing of the elderly's long-term care needs. Other parts of the catastrophic initiative address the long-term care needs of the nonelderly, with special emphasis on younger sub-populations (e.g., developmentally disabled persons, the mentally retarded, and the chronically mentally ill).
For purposes of this report, the terms "elderly" and "older persons" refer to those individuals who are age 65 and above. It is recognized, however, that these terms do not adequately reflect the diversity of this population.
B. STRUCTURE OF THE REPORT
The report is organized as follows:
-
Following this introductory chapter, chapter two provides an overview of the elderly population which needs long-term care and the characteristics of the current long-term dare delivery system--including its structure, costs, and financing. A discussion of health status, social and economic trends and their potential impact on the future need for long-term care is included.
-
Chapter three evaluates the potential, now and in the future, of a variety of private long-term care financing approaches, including their feasibility, affordability, and marketability, and the extent to which they might have an impact on the catastrophic costs of long-term care now borne by individual consumers and Federal and State Governments.
-
Chapter four discusses the central role of the Medicaid program in public long-term care financing, how it is perceived to affect the growth of private financing mechanisms, and possible modifications for encouraging greater private sector participation in long-term care financing.
CHAPTER 2. AN OVERVIEW OF LONG-TERM CARE
A. LONG-TERM CARE AND CATASTROPHIC COSTS
Long-term care refers to a wide range of medical, health-related, and social services for persons who, because of chronic illness or disability, need personal assistance in caring for themselves over an extended period of time (Doty, Liu and Weiner, 1985). The cause of the chronic illness or disability may be physical or mental, or both.
Long-term care services are provided in a variety of settings--in hospitals, nursing homes, and in a person's own residence. They can also be provided either formally--by individuals or agencies paid for their services--or informally--by relatives and friends who are not paid. In fact, about 70 percent of all long-term care in the community is provided voluntarily by family members and friends (Liu, Manton and Liu, 1985).
Even though long-term care has been acknowledged as the leading cause of catastrophic expenses among the elderly (CBO, 1977), the majority of people who experience long-term care needs do not experience catastrophic expenses. Thus, the need for long-term care does not inherently lead to catastrophic expenses. Whether or not it does depends on a variety of factors that are often interrelated. These factors include: the degree of impairment; living arrangements and family supports; the type and duration of services and the setting in which it is provided; the source of payment; the availability of out-of-pocket resources; and the cumulative financial effect of previous illness.
Degree of Impairment. Most people, as they age, will acquire one or more chronic diseases and experience some decline in their ability to perform daily tasks. In many cases, this can be accommodated by simple and relatively inexpensive life style adjustments (e.g., the use of memory jogging techniques) or neighborly assistance (e.g., help with snow shoveling). At the other extreme are those persons who, because of physical and mental disabilities, are totally dependent in their basic personal care, such as eating and using the toilet. Such dependency is associated with high expense levels or extraordinary family or voluntary agency support or both.
Living Arrangements and Family Support. Two individuals with identical limitations in their capacity for self-care may require very different amounts of paid assistance depending on the availability and capacity of their informal caregiving network of family and friends. Most care provided to impaired older people who live in the community comes from this informal network. Even a moderately impaired person, who lives alone without family members or friends nearby, must either purchase care or receive assistance from other formal systems (e.g., community programs).
The Type and Duration of Services and the Setting in which it is Provided. There is tremendous variation in the costs of long-term care services, depending on the type, duration, and setting of services required. For example, supervision and companionship are less costly than skilled nursing care when the latter is not the primary need. In-home care is generally less costly than nursing home care unless 24-hour supervision is required.
A relatively small proportion of out-of-pocket expenditures for long-term care is used to purchase community services. High out-of-pocket expenditures for long-term care are most often the result of the purchase of nursing home care. However, nursing home stays are not inherently catastrophic since estimates show that a large proportion (38 percent) of nursing home admissions include short-term stays of 30 days or less (Liu and Manton, 1983).
Source of Payment and the Availability of Out-of-Pocket Resources. If private insurance or government pays the bill, the patient avoids most out-of-pocket expenses, although total costs may be higher because cost-saving activities may not be undertaken. Income and assets, including equity in a home, provide the resources with which individuals pay their long-term care bills. The level of these resources, as well as the flexibility with which they can be accessed, are important considerations.
Cumulative Financial Effect of Previous Illness. Long-term care typically becomes costly to the individual when it involves extended need for services. Long-term care services may not be especially costly in themselves, but they are beyond the normal expenses of daily living and their cumulative effect may result in a catastrophic expense. Such expenses may often occur following, or in conjunction with, a series of acute care episodes in hospital and outpatient settings. The expenses associated with acute care may have already eroded the patient's resources and hastened the point at which long-term care expenses become catastrophic.
Elsewhere in this report, the range of costs (total and out-of-pocket) associated with long-term care are described, both alone and in relation to various approaches to private financing. The range of costs and approaches, overlaid upon the factors outlined in this section, means there are many possible ways to define (and also ameliorate) catastrophic expenses for long-term care.
B. THE LONG-TERM CARE POPULATION AND ITS SERVICE NEEDS
The need for long-term care is difficult to estimate. It is not necessarily identified with any particular medical diagnosis because the mere Existence of a chronic condition does not mean that a person cannot adequately care for himself or herself. For example, one half of the noninstitutionalized elderly population has one or more chronic conditions or impairments, yet the majority of these people manage with little or no assistance. As a result, an individual's need for long-term care is defined by the prevalence of major activity limitations which may result from chronic conditions, be they physical or mental.
Of the elderly living in the community in 1984, about 16 percent (4.6 million) have a need for assistance due to one or more activity limitations. About 3.7 million have limitations in Activities necessary for Daily Living (ADL) (eating, using the toilet, mobility, bathing, and dressing). Another 900,000 individuals have limitations in Instrumental Activities necessary for Daily Living (shopping, cooking, performing chores). Finally, an additional five percent of the elderly (about 1.4 million) reside in nursing homes and are assumed to have one or more ADL limitations (Manton and Liu, 1984).
The prevalence of activity limitations which require assistance dramatically increases with age. For example, only 2.6 percent of persons aged 65-74 need assistance with personal care, compared with 31.6 percent of those 85 years of age and over (HCFA, 1981). Among those aged 85 and over living in the community, 43.8 percent of the women and 31.0 percent of the men need daily help from another person.
C. GROWTH OF THE ELDERLY POPULATION AND THE DEMAND FOR LONG-TERM CARE SERVICES
The number of-older persons, and therefore the demand for long-term care, is expected to grow significantly in the future.
The population aged 65 and above increased more rapidly from 1950 to 1980 than the U.S. population as a whole. As shown in Table 2-1, the elderly population doubled from 12.3 million persons in 1950 (8.1 percent of the U.S. population) to 25.5 million persons in 1980 (11.3 percent of the U.S. population).
In 1984, there were about 28 million persons age 65 or older in the U.S. By the year 2030, this number should more than double to about 64.6 million, and those over 65 and over will be about 21.2 percent of the population.
Perhaps more importantly, the elderly population is itself becoming older (Table 2-2). Between 1950 and 1980, the population 75 years of age or over--those most at risk of chronic disease, disability, and institutionalization in a nursing home--increased more rapidly than the population 65 to 74 years of age. Between 1980 and 1990, the 65 to 74 age group will increase by 13.8 percent, while the 75 to 84 age group will increase by 26.6 percent and the group 85 years and older will increase by 20.1 percent. In the subsequent two decades, 1990 to 2010, the group 85 years of age or over will increase three to four times as fast as the general population.
These projections have the potential to translate into major increases in the demand for long-term care. By 1990, about 4.2 million older Americans living in the community are projected to have one or more ADL limitations, assuming current age and sex adjusted rates (Table 2-3). By the year 2000, the number is expected to increase to 5.1 million, and by 2040, the number is projected to grow to 10.2 million elderly (Manton and Liu, 1984).
Similarly, the elderly nursing home population is projected to grow to 1.6 million by 1990, to 2.1 million by the year 2000, and to 4.4 million by the year 2040 (Manton and Liu, 1984) (Table 2-3).
D. CHARACTERISTICS OF THE LONG-TERM CARE SERVICES SYSTEM
Long-term care services are extremely heterogeneous. The information below illustrates the range of institutional, community-based, and informal services used by the long-term care population, as well as how many and what types of impaired older people used particular services.
1. Institutional Care
Long-term care institutions include:
- Nursing homes (primarily skilled nursing and intermediate care facilities);
- Institutions for the mentally retarded (including intermediate care facilities for the mentally retarded and private community-based residences); and
- Residential care facilities (e.g., board and care homes, personal care homes, domiciliary care facilities) and long-stay hospitals (including psychiatric hospitals).
Because the utilization of nursing homes is more likely to be associated with catastrophic long-term care costs for the elderly, this report focuses on this type of long-term care institution.
In 1984, about 1.4 million Americans who were age 65 years and older were residents of nursing homes. At any given time, estimates from the 1977 National Nursing Home Survey indicate that about 5 percent of the elderly are in nursing homes; in any given year about 8 percent of the elderly are estimated to experience a nursing home stay. Compared to other industrialized nations, the U.S. has among the lowest long-term care institutionalization rates for the elderly (Doty, in press).
The risk at age 65 of ever entering a nursing home during the remainder of one's life (i.e., the lifetime risk) is difficult to estimate. Studies suggest that the lifetime risk may range from 20-45 percent (LaPorte and Rubin, 1979; McConnel, 1984; Cohen et al., 1986); however, this range combines individuals with short nursing home stays (about 50 percent of residents) and those with lengthy stays of greater than 90 days. (The figures on length of nursing home stays are discussed in more detail later in this section.)
According to the 1977 National Nursing Home Survey, the median age of nursing home residents was 81 years. Ninety two percent of residents were white, and this figure reflects the overall proportion of whites in the elderly population. About 71 percent were female. Sixty-two percent were widowed, 19 percent were never married, 12 percent were married, and about 7 percent were divorced or separated. (Results of the 1985 National Nursing Home Survey were not available at the time this report was prepared).
These data indicate that advancing age, being female, and lacking a spouse are strongly associated with institutionalization. These are, of course, not separate categories since women have longer life expectancies than men and, thus, are overrepresented among those of advancing age and without spouses. Other major variables associated with institutionalization include: mental and cognitive disorders (such as dementia) and severe functional dependencies (especially the need for assistance with using the toilet, eating, or incontinence).
However, it is important to note that, at present, there is limited information on the characteristics of persons at the point they enter nursing homes. Consequently, it has proven extremely difficult to predict which people with the above types of characteristics will actually enter nursing homes and which will remain in the community. While the institutionalized population is generally more disabled than dependent persons living in the community, for every nursing home resident there are estimated to be two times as many people living in the community with similar care needs (GAO, 1979; Shanas, 1979; Soldo, 1983).
According to the 1977 National Nursing Home Survey, about one-third of elderly nursing home residents entered the nursing home directly following an acute hospital stay. There is some evidence (Harkins, 1985) that institutionalization is more likely when moderate to heavy long-term care needs develop as the result of an acute condition creating a sudden, sharp drop in functional ability rather than a slow decline in functioning. This may be because the family does not have time to develop or adjust its capacities to provide informal support to a previously independent or only mildly impaired elderly person who suddenly requires extensive support.
A recent analysis of data from the 1982 Long-Term Care Survey of the noninstitutionalized disabled elderly living in the community (Soldo and Manton, 1985) found that those who had applied for nursing home entry and were awaiting a vacancy differed significantly from those not seeking nursing home placement. The distinguishing features were their greater likelihood of previous nursing home stays, hospital use during the previous 12 months, extreme ADL dependency, having more than one caregiver, and use of paid providers to supplement informal caregiving.
Another study among persons being screened for nursing home admission examined the factors precipitating family decisions to stop providing home care and seek institutional placement (Arling and McAuley, 1983). Those being screened were all currently residing in the community and would require public financing either immediately or within three months of nursing home entry.
In 68 percent of the cases in which institutional placement was deemed appropriate, family members cited a decline in the older person's health as the primary reason for placement, and as the second most important reason in 18 percent of cases. Changes in the informal support system causing a reduced capacity for care were cited as the most important reason by 20 percent and the second most important reason by 28 percent. The next most frequently cited reasons were a physician's recommendation, followed by concern about the elderly person's ability to live independently (only 19 percent of those applying for nursing home entry were living alone). Financial considerations were cited by only four percent of family members and then only as the second most important reason for seeking placement.
Based on a "simulated" cohort of nursing home admissions from the 1977 National Nursing Home Survey, the average length of stay in nursing homes is estimated at 456 days (Liu and Manton, 1984). However, this estimated average masks important differences in the mix of the nursing home population.
About 52 percent of the admissions had stays of less than 90 days, and only 18 percent stayed for two years or longer. About 46 percent of those who stayed less than 30 days were discharged to the community, compared to 8 percent of those who stayed more than one year. The expected length of stay for those already in for 90 days was 831 days. These estimates illustrate the mix of the nursing home population among long-term residents, the terminally ill, and those individuals in the nursing home for relatively short periods of convalescence.
As noted earlier, institutionalization rates increase dramatically with age. In the 1977 National Nursing Home Survey, only two percent of the elderly 65 to 74 years of age were in nursing homes, compared to six percent of the elderly 75 to 84 years of age and 23 percent of those 85 years of age and older. Only 24 percent of the elderly 65 to 84 years of age with ADL dependency resides in institutions, but by 85 years of age, 61 percent of those with ADL dependency are in nursing homes.
Although nursing home use rates have increased greatly over the past 35 years, overall institutionalization rates for the elderly (including mental hospitals and non-medical homes for the aged) have not increased except among the very old (80 and older, particularly persons 85 and older).
Two factors are generally believed to be responsible for the rising rates of institutionalization among the elderly who are 80 and older. First, advances in medical science have increased the survival rates of individuals who have severe chronic disease and disability. Second, elderly women suffer from more chronic illness and disability than men (Verbrugge, 1984) and are overrepresented in the 80 and older group. This overrepresentation is due to differences in longevity between men and women (e.g., as of 1977, white females aged 65 could anticipate on average another 18.5 years of life as compared to 13.9 years for white males).
2. Home and Community Based Care
While 29 percent of the elderly long-term care population resides in an institutional setting (e.g., nursing homes), 71 percent resides in the community (Doty, 1986a). Thus, the vast majority of impaired older persons receive all of their care in the community.
According to the 1982 Long-Term Care Survey, 11 percent of these disabled elderly persons lived alone, 39.5 percent lived with their spouses only, 36 percent lived with their children, and 14 percent lived in other arrangements. In addition, about 60 percent were female and 40 percent were male; 51 percent were married; 41 percent were widowed; and the remainder were divorced, separated, or never married. Approximately 33 percent of the disabled elderly living in the community were poor, 62 percent low to middle income, and 5 percent high income. Their mean age was 78 years (Stone, Cafferata and Sangl, 1986).
The long-term care services received by this community population can be roughly divided between formal services furnished by paid providers and informal services provided by family and friends.
Formal sources of care (paid providers) provide a small minority of the home and community-based long-term care services used by' the functionally disabled elderly. In 1982, formal services accounted for less than 15 percent of all "helper days of care" in the community (Table 2-4) (Liu and Manton, 1984). Only a small minority (9 percent in the 1979 Health Interview Survey, 5 percent in the 1982 Long-Term Care Survey) receive all their care from paid providers. The remainder receive all of their care informally or through some combination of formal and informal services.
Home and community-based long-term care is generally thought of as encompassing the following types of services: service-enriched sheltered housing; home-delivered professional nursing and therapy services; non-professional home health aide and personal care services; homemaker/chore services; day-care for the elderly or mentally ill; habilitation services for the mentally retarded or developmentally disabled; home delivered and congregate meals; case management, assessment, and referral services; home adaptations; transportation; friendly visiting; and surveillance services.
Service-Enriched Sheltered Housing. Often referred to as "congregate care," this type of service is typified by apartment-style dwelling specially designed to accommodate the functionally impaired elderly. Often such housing has a common dining facility where residents are expected to take at least one meal per day. Individual units are typically equipped with special devices which make it easy for the elderly to call for help if needed. Additional services such as laundry, housekeeping assistance, and personal care or nursing services may or may not be available. Service-enriched sheltered housing for the elderly is much more common in certain European countries (Great Britain, the Netherlands, Sweden) than it is in the United States.
Professional Home-Delivered Nursing and Therapy Services. This includes visits to the home by licensed (RN or LPN) nurses, physical, occupational, or speech therapists, and medical social workers. These services are reimbursable under Medicare so long as the beneficiary is determined to require "skilled nursing care" as defined under Medicare's coverage rules. Since the need for skilled care is usually part of an acute illness, this kind of Medicare-financed service is generally inapplicable to those with long-term care needs. (Subsequent sections contain more lengthy discussions of the circumstances under which these services may be reimbursed under Medicare and Medicaid.)
Non-professional Home Health Aide and Personal Care Services. These typically include assistance with Activities of Daily Living (bathing, dressing, eating, toileting, mobility) and supervision of mentally impaired persons to prevent them from wandering or otherwise endangering themselves or others. If supervision is all that is required, the service is often termed "companion" care.
Homemaker/Chore Services. This includes assistance with instrumental activities of daily living, i.e., cooking, shopping, housekeeping, laundry, and errands.
Adult Day Programs. These may be primarily "social," involving structured activities programs and opportunities to socialize, or they may involve medical and nursing services, in which case they resemble a day nursing home or hospital. Day programs for the mentally retarded/developmentally disabled usually involve habilitation; i.e., teaching skills to increase functional independence.
"Meals on Wheels". Hot meals may be home-delivered to the homebound or provided in group settings (such as senior citizens, centers or congregate care facilities).
Case Management, Assessment, and Referral Services. These provide professional help in determining a disabled person's long-term care needs, in formulating a plan of care, and in helping the person locate or obtain providers of services and, in some cases, financing for the services. Case management is a continuing process, responsive to the disabled person's changing needs over time.
3. Informal Care Giving
About 70 Percent of the elderly disabled living in the community receive all their care informally from family and friends. About 2.2 million "caregivers," who are most often spouses, daughters, or daughters-in-law, are responsible for 1.2 million moderately to severely impaired elderly persons. About 80 percent of these caregivers report spending an average of four hours per day on caregiver tasks over and above their normal household work (Stone, Cafferata and Sangl, 1986). The mean age of these family caregivers is about 57 years. Seventy-four percent live with the disabled elderly person. Only 16.8 percent work, a statistic which reflects the high percentage of spouse caregivers (over one-third) and the older age of the caregivers, about one-third of whom are over 65.
The tasks which family caregivers most frequently report providing are shopping and transportation (86 percent provide these services) and housekeeping (80 percent). About 67 percent of caregivers report giving help with bathing, dressing, eating, or using the toilet; and 46 percent report helping the elderly get in and out of bed or helping them move around indoors. Approximately 53 percent help administer medications and 49 percent help manage finances (Stone, Cafferata and Sangl, 1986). According to one study (Harkins, 1985), by the time family caregivers actively seek institutional placement for their elderly disabled relatives, only very substantial amounts of supportive care by paid providers (on the order of 20 or more hours per week) are seen as making continued home care possible.
E. LONG-TERM CARE EXPENDITURES AND FINANCING
1. Total Health Care Expenditures of the Elderly
In 1984, total health care expenditures by those aged 65 and older, regardless of source of payment, exceeded $119 billion (Waldo and Lazenby, 1984). The largest expenditure category was hospital care ($54.2 billion), followed by nursing homes ($25.1 billion), and physicians ($24.8 billion). All other care accounted for $15.8 billion (Figure 2-1).
Direct out-of-pocket health care expenses for the elderly averaged $1,059 per person in 1984, about 15 percent of the elderly's median income in that year (U.S. Senate, 1986). The majority of these expenses were for nursing home care, physician visits, and services not covered by Medicare, Medicaid, or private insurance.
Out-of-pocket expenses for nursing home care amounted to 41.6 percent of total out-of-pocket personal health expenses of the elderly in 1984. Thus, nursing home care represents the elderly's second largest expenditure category, but it is their largest out-of-pocket expenditure (Figure 2-2).
2. Nursing Home Charges and Expenditures
According to the American Health Care Association, nursing homes currently charge private patients an average of about $22,000 a year. Daily rates average $55 to $60, with the range from $30 to $100 per day. Medicaid reimbursement rates are lower than those charged to private payers: Medicaid reimbursement rates for Fiscal Year 1983 averaged $38 per day (or almost $14,000 per year) for care in a skilled nursing facility (SNF) and $27 a day or $10,000 a year for care in an intermediate care facility.
In calendar year 1984, $32 billion were spent for nursing home care, accounting for 8.3 percent of total national health expenditures. In 1985, total nursing home expenditures are estimated at $35.2 billion (Lazenby et al., in press). These estimates include nursing home expenditures for all ages. Nursing home expenditures for the elderly population account for about 75 percent of total expenditures.
Expenditures for nursing home care increased about five-fold between 1972 and 1984 (Table 2-5). As a percentage of total national health expenditures, nursing home expenditures increased by almost 17 percent (from 6.9 percent to 8.3 percent) between 1972 and 1984. Nursing home expenditures are expected to increase to $56.3 billion by 1990 (Arnett et al., 1986).
In 1984, expenditures on nursing home care were almost equally divided between public and private sources (Figure 2-3).
-
Approximately $15.8 billion of the $16.3 billion spent from private sources was out-of-pocket. Insurance payments accounted for about one percent ($300 million) of the total national nursing home expenditures.
-
Medicaid is the major public source of payments for nursing home care, accounting for $13.9 billion of the $15.7 billion spent from public sources (43.4 percent of the overall national total of $32 billion) in 1984.
-
Medicare spent about $545 million for skilled nursing facility (SNF) services in Fiscal Year 1984. Medicare SNF expenditures accounted for only 2 percent of total national expenditures for nursing homes and one percent of total Medicare expenditures.
3. Out-of-Pocket Expenditures for Nursing Home Care
At present, there are no nationally representative data on out-of-pocket expenditures by nursing home residents. The only large scale systematic data come from a recent analysis of a subset of the elderly long-term care population which participated in the National Long-Term Care Channeling Demonstration (Kemper et al., 1986; Wooldridge et al., 1986). The Channeling demonstration was an initiative of the Department of Health and Human Services. The demonstration's purpose was to test whether case-managed, community-based care could serve as a cost-effective alternative to institutionalization.
The total Channeling sample of 6,300 elderly and functionally disabled persons was not selected to be representative of the general elderly population or, for that matter, the disabled elderly population living in the community. In general, the Channeling sample members were older, poorer and more functionally impaired. In addition, prior hospital and nursing home admission rates were significantly higher for the Channeling sample. Nonetheless, data from the demonstration reveal the out-of-pocket expenditure burden for nursing home care for 1,800 frail elderly persons from the "control group" of the study (i.e., those who did not receive special services through the Channeling demonstration).
The key data on out-of-pocket expenses of the control group", based on in-house HHS staff analysis, suggest that, while a relatively small percentage of the frail, poor elderly actually experience nursing home stays, those who do face exceedingly high out-of-pocket expenses relative to their current income.
-
About 15 percent of the "control group" had a nursing home stay in the six months following the baseline interview. For the seven to 12 month period, the figure was 14 percent. The average number of days of care received by those with any stay was 75 for the first six months. This average was 119 days in the second six months. Thus, even though a smaller percentage of the sample was admitted in months seven through twelve, the average number of days of care increased. (Note: the estimates for the two six month periods were developed independently and, therefore, are not additive.)
-
Out-of-pocket expenditures as a percent of income (exclusive of assets) over six months comprised an average of 80 percent for those with any nursing home stay in months one through six. For months seven through twelve, the average figure was 102 percent, indicating that those with nursing home stays had to rely on more than their income (e.g., savings or other assets, or Medicaid) over the second six month period to meet expenses.
4. Home and Community-Based Service Expenditures
Medicare Home Health Spending. Medicare home health payments were $1.9 billion in Fiscal Year 1984 and accounted for 3.1 percent of total Medicare expenditures in that year. Home health agencies are reimbursed by Medicare on a reasonable cost basis, subject to limits. Even though home health expenditures constitute only about three percent of overall Medicare costs, they are growing rapidly. From 1974-1980, Medicare expenditures for home health increased at an annual rate of 34 percent. Since 1980, Medicare home health expenditures have doubled from $772 million in 1980 to $1.5 billion in 1983, at an annual compound rate of 26 percent.
Only about one-third of the Medicare expenditure increases for home health care from 1976-1980 were due to price inflation. The other factors accounting for increased expenditures were:
- An increased proportion of beneficiaries using home health services, which accounted for almost half of the growth in expenditures;
- The growth in the number of Medicare beneficiaries, which accounted for 10 percent of increased expenditures; and
- Increased visits per person served, which accounted for eight percent of the growth in expenditures.
Medicaid Home Health Spending. Medicaid home health expenditures of $765 million accounted for 2.3 percent of total Medicaid payments in Fiscal Year 1984. Approximately three-quarters of Medicaid home health expenditures were for personal care services. Three-quarters of all Medicaid personal care expenditures for home health were made in New York.
Private Out-Of-Pocket Expenditures. According to the 1982 Long-Term Care Survey, about 1.1 million (24 percent) of the 4.6 million disabled elderly living in the community received some formal services from paid caregivers. (This figure of 4.6 million includes individuals with ADL limitations and also those with limitations in instrumental activities of daily living, e.g., the need for assistance with shopping and cooking.)
However, only about 600,000 individuals (12 percent) are estimated to have paid out-of-pocket, in whole or in part, for their care, with the average being $164 per month out-of-pocket and the median amount being $40 per month. Two-thirds of this spending was for homemaker-chore types of services rather than for nursing and personal care services. The average is heavily weighted by the approximately 10 percent of respondents reporting payments of over $400 per month.
From these figures, it is possible to estimate total out-of-pocket spending by the disabled elderly on home and community-based services (excluding amounts spent on durable medical equipment) of approximately $1 billion per year (Liu, Manton and Liu, 1985).
Elderly persons with above average out-of-pocket payments had especially high rates of prior nursing home use, had three times the rate of payments for "nursing" as opposed to other types of assistance, and had substantially higher rates of use of Medicare and Medicaid home health benefits. They were also twice as likely as the average disabled elderly to have cognitive impairments and were more likely to be older and unmarried (Liu, Manton and Liu, 1985).
Further analysis of data on out-of-pocket spending for home care from the 1982 Long-Term Care Survey was commissioned for this report (Liu and Manton, 1986). The analysis indicates that the variable most strongly related to any out-of-pocket spending on home care is living alone. With all other-variables held constant, an elderly-disabled person living alone has a 172 percent greater likelihood of paying out-of-pocket for home care services than one who is living with others.
Other variables which are significantly related to the likelihood of any out-of-pocket payments for home care are (in order of predictive power):
- Prior nursing home stay (107 percent greater likelihood);
- ADL 5-6 (dependent on all "activity of daily living" measures including eating and using the toilet--85 percent greater likelihood);
- ADL 3-4 (mobility dependent and needs help with bathing and dressing--54 percent greater likelihood);
- ADL 1-2 (bathing, dressing dependent only--34 percent greater likelihood);
- Prior hospital use within the past 12 months (24 percent greater likelihood); and
- Incontinence (20 percent greater likelihood).
The number of days of informal caregiving support per week and being male were weakly associated with a decreased likelihood of spending out-of-pocket for home care.
Among those who had any out-of-pocket spending for home-care, income was the variable most strongly Predictive of a high dollar amount of out-of-pocket spending for home care. Also predictive, but to a lesser extent, were a dependency score of ADL 5-6, dementia, and--in a negative direction--the number of days of informal caregiving received per week. Extreme ADL dependency and dementia are among the same variables that are most strongly predictive of nursing home use.
With income and other factors held constant, an individual who is dependent on 5 or 6 ADL measures would be projected, on the basis of average monthly payments, to spend $3,270 more out-of-pocket for home care in a year than a less dependent person. An individual with dementia paying out-of-pocket for home care also would be projected to spend $3,270 more than a person who was not demented. The amounts are additive. Thus, a person who has a dependency score of ADL 5-6 and who is demented would be projected to spend $6,540 more per year on home care than a disabled elderly person paying for home care who does not have these characteristics.
Projected spending amounts for home care tend to be reduced if there is informal support available. For each 11caregiver day" of informal support available per week, it is estimated that the annual amount of out-of-pocket spending for formal home care will be reduced by $388 (or $2,265 if daily informal support is available).
Out-of-Pocket Expenses as a Proportion of Income. According to data taken from the 1982 Long-Term Care Survey, it is quite rare for those 4.6 million disabled elderly living in the community to spend a high percentage of income on formal home care. About 88 percent have no out-of-pocket expenditures and another 9 percent spent less than 10 percent of their monthly income on home care services. Only 3 percent spent more than 10 percent of their monthly income on home care, and under I percent spent over 20 percent of monthly income on home care.
It is quite striking that even among the 4.6 million disabled elderly living in the community with high levels of impairment (5 - 6 ADLs) and with comparatively high incomes (over $1,025 per month), 81 percent reported no out-of-pocket spending on formal home care services.
The relationship between income and out-of-pocket spending on home care comes across most strongly in the findings that, of the relatively few persons spending $140 or more per month (regardless of ADL level), 42 percent had monthly incomes of $1,025 or more; and at ADL 5-6, 45 percent of those spending $140 or more per month had at least $1,025 in monthly income. Thus about half of those spending $140 per month or more had comparatively high incomes.
The Relationship between Home Care Expenditures and Prior Hospital and Nursing Home Use. Use of formal home care services is strongly related to prior hospital use within the previous year, particularly longer than average hospital stays. Thirty-eight percent of the elderly disabled living in the community had a prior hospital stay in the previous year: of those who had prior hospital stays of 13-25 days, 38 percent used formal services; and of those who had hospital stays over 25 days, about half used formal home care services. In contrast, among the disabled elderly who had no hospital stay in the previous year, only 14 percent used formal home care services.
Most of the formal home care services used were Medicare-financed. Thus, only 15 percent of functionally disabled elderly with long prior hospital stays reported out-of-pocket payments for home care, as compared to 12 percent of those without a prior hospital stay in the previous year,
Prior nursing home use is even more strongly related to out-of-pocket payments for home care than is a prior hospital stay. However, prior nursing home use is quite rare: only about 8 percent of the functionally disabled living in the community reported prior nursing home stays. About 27 percent of those with prior nursing home stays had out-of-pocket payments for home care, compared to 12 percent of those without prior nursing home stays. About 17 percent of persons spending $40 or more per month had prior nursing home stays.
Duration of Out-of-Pocket Payments. High out-of-pocket payments over an extended period of time were extremely rare among the respondents to the 1982 Long-Term Care Survey. Although over 50 percent of those paying $140 per month or more had been receiving paid care for one year or more, the survey estimates indicate that there were only 8,000 such cases in the U.S., out of a total of 4.6 million functionally disabled elderly living in the community.
F. PUBLIC LONG-TERM CARE FINANCING PROGRAMS
While personal, familial, and private charitable resources continue to be an essential and often dominant element of long-term care services, Federal, State, and local government programs also have a major effect on the nature, availability, and financing of long-term care services. The bulk of public dollars expended, primarily through Medicaid, is for institutional services. Yet, the variety of public programs and their impact upon home and community-based services should not be underestimated.
1. Medicare
As originally enacted, the Medicare law was intended to support only acute care needs. This purpose has never been altered, Accordingly, Medicare's skilled nursing facility and home health benefits are not for long-term care, but rather are designed to be part of the continuum of care for an acute episode, either following hospital care or as a less costly substitute for an extended acute care hospital stay. Since there is a strong incentive under Medicare's prospective payment system to discharge patients from the hospital earlier than in the past, Medicare utilization of and costs for skilled nursing facilities and home health agencies can be expected to increase in the future.
Skilled Nursing Home Facilities (SNFs). The Medicare skilled nursing benefit covers only short-term, post-acute care (3 days prior hospitalization required) for persons needing skilled nursing or rehabilitative services in an inpatient setting. The Medicare SNF benefit, as mandated by statute, sets specific and relatively stringent requirements for the levels of skilled care necessary for Medicare coverage.
The Medicare SNF benefit is relatively small both as a percentage of Medicare expenditures and as a proportion of total national nursing home revenues. In 1980, the average Medicare coverage of a SNF stay was 30 days, much less than the average of 456 days for all nursing home patients. Medicare SNF expenditures totaled $545 million in Fiscal Year 1984.
Home Health. Since the home health care benefit under Medicare is designed to be part of the continuum of care for an episode of acute illness, it is generally unavailable for long-term care needs which persist over a period of time. The Medicare law permits payment for home health services to those beneficiaries whose conditions are of such severity that the individuals are under the care of a physician, confined to their homes (homebound), and in need of part-time skilled nursing care or physical or speech therapy on an intermittent basis.
Under the Medicare home health benefit, the following types of services may be covered in certain situations: part-time or intermittent nursing care provided by or under the supervision of a registered professional nurse; physical, occupational, or speech therapy; medical social services which contribute significantly to the treatment of a patient's health condition; part-time or intermittent services from a home health aide; and medical-supplies (other than drugs and biologicals) and medical appliances.
Passage of the Omnibus Reconciliation Act (P.L. 96-499) in 1981 expanded the home health benefit by removing the limit on the number of covered home health visits, eliminating the requirement for a prior hospital stay, eliminating the deductible, and allowing more proprietary home health agencies to participate in the Medicare program.
In 1984, Medicare home health expenditures totaled $1.9 billion. About 50 enrollees per 1000 received home health benefits, and the average number of home health visits provided to recipients in 1984 was 27 visits.
2. Medicaid
Medicaid is a joint Federal-State program established in 1966 to provide medical assistance to certain groups of low-income individuals. About one-half of Medicaid expenditures nationwide for 1984 were for long-term care. There is, however, wide variation among States in the proportion of Medicaid expenditures devoted to long-term care services, the types of long-term care services which are available, and the characteristics of recipients. This inter-State variation is the direct result of the very structure of the Medicaid program, which permits States considerable flexibility to determine who participates, what is covered, and how services are reimbursed.
Eligibility. Eligibility for Medicaid is based on a welfare orientation which requires people to meet poverty standards before assistance can be obtained. Medicaid eligibles include the low-income aged, the blind, the disabled, and those eligible for Aid to Families with Dependent Children.
However, most State Medicaid programs have expanded the traditional welfare definitions of poverty to permit the provision of Medicaid services to persons who, because of severe medical impairments, need more than the ordinary levels of income provided by welfare programs. Thirty States have exercised this "medically needy" option which encompasses long-term care services. Other States, while not having a medically needy provision, permit higher income persons to "spend down" to Medicaid levels if they face medical bills beyond their means.
The term "spend down" refers to the process of exhausting one's income and assets (including savings) in the course of paying for medical expenses (including nursing home expenses), thus becoming eligible for Medicaid coverage. Finally, some States without medically needy provisions have elected to cover persons who exceed Medicaid income restrictions if they are in an institution. (A more extensive discussion of "medically needy" and "spend down" is contained in Chapter 4.)
It is estimated that approximately half of all Medicaid recipients in nursing homes were not initially poor, but "spent down" their income and resources as a result of the high cost of nursing home care (an average annual cost of $22,000). All Medicaid nursing home recipients must contribute all of their income to the cost of their care except for a small personal-needs allowance ($25 per month in most States).
Coverage. For eligible individuals, States must cover services provided in Skilled Nursing Facilities for persons 21 years of age or older. In addition, States may cover the following optional services: Intermediate Care Facilities (ICFs), a less intensive form of nursing home care (49 States and the District of Columbia); and Intermediate Care Facilities for the Mentally Retarded (ICFMRs) (48 States and the District of Columbia); and Institutions for Mental Diseases for persons 65 years of age or over (41 States and the District of Columbia).
In addition, for eligible adults, States must cover home health services. States may also cover the following optional services: private-duty nursing (25 States and the District of Columbia), and personal care (25 States and the District of Columbia).
Growth in Medicaid Long-Term Care Expenditures. Medicaid long-term care (SNF, ICF, ICFMR, mental hospital, and home health) expenditures were $16.7 billion in Fiscal Year 1984, accounting for 49 percent of total Federal and State Medicaid vendor payments (Table 2-6 and Table 2-7). Medicaid long-term care services are overwhelmingly for institutional care. The proportion of Medicaid expenditures attributable to long-term care varies substantially from State to State, from a low of 18 percent in the District of Columbia to a high of 73 percent in New Hampshire.
The rate of growth of Medicaid long-term care expenditures has historically been a major concern to Federal and State officials because it has risen faster than the expenditure growth rate for Medicaid acute care. The rate of increase has moderated in recent years.
For Fiscal Years 1974-1980, the average compound rate of growth for Medicaid long-term care services was 17 percent per year, compared to 15 percent for all Medicaid services. This higher rate of increase is largely due to expenditures for ICFMRs (Table 2-7). Without ICFMR's the annual rate of increase for Fiscal Years 1974-1980 was 15 percent.
The rate of increase for total Medicaid long-term care services for Fiscal Years 1980-1984 was 11 percent, compared to 9.8 percent for total Medicaid services. Without ICFMRs the Medicaid long-term care rate of increase was only 8.5 percent.
Preadmission Screening Programs. At least 34 States and the District of Columbia have some form of preadmission screening requirement for Medicaid recipients applying for nursing home admission. Some of these States also require preadmission screening on all applicants who would likely qualify for Medicaid within 180 days of their admission. Minnesota, for example, expanded its preadmission screening program in 1985 to include all applicants to nursing and certified boarding care homes, and in 1986, passed a law requiring these homes to help finance the cost of the preadmission screening program for these non-Medicaid applicants.
No comprehensive evaluation of preadmission screening programs has been conducted since 1981; hence, little can be stated conclusively about the effect of these programs in reducing inappropriate placements or on saving Medicaid expenditures.
Home and Community Waivers. As part of optional home health care services, States have been granted waivers to provide various forms of noninstitutional long-term care services of a nonmedical nature (e.g., case management, homemaker/chore, adult day care). The home and community-based waiver program, started in 1981, allows funding only for noninstitutional long-term care services targeted to persons who would otherwise require Medicaid-financed nursing-home care. Importantly, average per capita costs with the waiver must not exceed average per capita costs without the waiver. States have generally proceeded cautiously with their initial waiver applications.
There were a total of 91 active approved Medicaid waivers in 42 States as of February, 1986. Thirty-six States had active approved waivers to provide benefits to the aged and disabled. Thirty-four States had active approved waivers to provide benefits to the MR/DD population. Three States had active approved waivers to provide benefits to the mentally ill. (Since some States have separate waivers to cover the different populations, the figures are not additive.)
Forty-one of the 91 active approved waiver programs are targeted to provide services statewide. The most frequently provided service is case-management (provided under 77 waivers), followed by respite care (60), homemaker/home health aide (45), adult day care (40), personal care (40), home modifications (32), and transportation (31). For waivers targeted to the MR/DD population, habilitation services are the most frequently provided service (34).
In FY 1984, about $96.8 million in expenditures were reported by States under the home and community-based waiver program. An evaluation is now underway of the impact of the waiver program in November 1986 substituting community care for nursing home care.
3. Other Federal and Federal-State Programs
Older Americans Act Programs. Under Title III of the Older Americans Act, the Administration on Aging (AOA) provides financial assistance to the States to develop greater capacity and to foster the development and implementation of comprehensive and coordinated service systems to serve older individuals. Specifically, the programs goals are to: 1) secure and maintain maximum independence and dignity in a home environment for older individuals capable of self-care with appropriate supportive services; 2) remove individual and social barriers to economic and personal independence for older individuals; and 3) provide a continuum of care for the vulnerable elderly.
In Fiscal Year 1985, three separate allocations were made to States for 1) supportive services and senior center operations ($265 million); 2) congregate nutrition services ($336 million); and 3) home-delivered meals ($67.9 million). State Units have the authority to transfer limited amounts of funds among the three Title III allotments in order to better reflect their local needs and priorities. States are required to match these funds by at least 15 percent--from State and local sources, philanthropic sources, and/or charges and donations from clients.
Supportive services under Title III (Part B) are designed to provide assistance to those older persons in need. Most supportive services fall in four broad categories:
-
Access services are transportation, outreach, and information and referral.
-
In-home services are usually housekeeping, personal care, chore and visiting, and telephone reassurance.
-
Community and neighborhood services include legal services, residential repair, escort services, health services, physical fitness programs, pre-retirement and second career counseling, and other services. Most social services and congregate meals are provided at multipurpose senior centers, many of which have been designated as community focal points.
-
Services to individuals in long-term care institutions include ombudsman services for complaint resolution, transportation to activities outside the institution, and "individual friendly visiting" and counseling.
In-home services represent an expenditure priority for the Title III program. According to the National Data Base on Aging in 1984, about one-quarter of funds (including Older Americans Act funds as well as non-Older Americans Act funds) controlled by area agencies were directed at in-home services.
Services delivered under the Title III (Part B) program are currently reaching an estimated 9 million elderly clients. Data are not available to determine what proportion of these services are focused on the impaired elderly. In Fiscal Year 1984, 18 percent of all participants were racial and ethnic minorities, and 47 percent were low income.
Social Services Block Grant. The Social Services Block Grant provides funds to States for social services. These social services must be directed at the goals of achieving economic self-sufficiency; preventing or remedying neglect, abuse, or exploitation of children or adults; preventing or reducing inappropriate institutionalization; and securing referral for institutional care, where appropriate. Typical services include protective services for children and adults, home-based services, and day care. Each State determines the eligibility requirements for services and the type and scope of services it provides.
In Fiscal Year 1985, Federal funding for social services under the Social Services Block Grant (SSBG) amounted to $2.7 billion. At their discretion, States may match these funds with their own monies. However, since there is no required match rate and few reporting requirements, no reliable data are available on the total amount of State social services funding.
According to data compiled by the American Public Welfare Association under its Voluntary Cooperative Information System, home-based services were provided in 1983 to 11 percent of total SSBG service recipients, or about 307,000 persons of all ages. These services accounted for about 14 percent of total expenditures, or $555 million (out of a total estimated amount of Federal and State funds of $4 billion). Utilization and expenditure figures for services provided specifically to the elderly are not available.
The principal long-term care service funded under the SSBG is "home-based services". These include any or all of the following (at State option): homemaker, chore, home health, companionship, or home maintenance services. Fifty-five States and independent jurisdictions included these services in their Fiscal Year 1985 plans. Twenty-six States also planned to offer adult day care and 24 States planned to offer home-delivered or congregate meals.
Veterans Administration. The Veterans Administration (VA) finances several different types and levels of nursing home care and home health care for veterans--both veterans with service-connected disabilities and elderly veterans. VA nursing home benefits for elderly veterans without service-connected disabilities are limited to 6 months. The VA also finances a cash disability program that serves veterans (many of whom are 65 and older) with service-connected disabilities.
In Fiscal Year 1985, VA nursing homes served 20,442 veterans at a total cost of about $395 million and an average per them payment, per beneficiary of $113.52. Community nursing homes (private facilities with which the VA contracts) served 38,907 veterans at a total cost of about $265 million and an average per them of $63.48. State-run nursing homes served 13,540 veterans at a total cost of about $48 million, with an average per them payment of $16.64 contributed by the VA. (VA per them subsidies are established by statute and do not necessarily reflect the total per them costs.)
Domiciliary care, that is, non-medically oriented residential care, was provided to 13,126 veterans at a total cost of about $96 million, and an average per them rate of $34.89 in VA-run facilities. State-run facilities provided care to 8,440 veterans for a total cost of about $12 million at an average per them of $7.30.
The VA also financed hospital-based home care for 9,851 veterans, at a total cost of about $14 million, and an average per them of $13.07. Although the VA has recently developed an adult day care program, the program is so new that data on utilization and expenditures are not yet available. Finally, the VA paid families to care for their disabled members. In 1985, such payments were received on behalf of 220,000 veterans.
4. State Programs
This section contains a brief review of selected long-term care programs initiated by the States. The goals of these diverse programs are to: support families in order to prevent exhaustion of resources; prevent or delay institutionalization; check inappropriate placement of individuals in nursing homes; promote private financing of long-term care; and create special programs for victims of Alzheimer's disease.
Tax Incentives for Care of the Elderly at Home. At least four States provide tax subsidies to families who care for their elderly relatives at home. Oregon, Idaho, Arizona, and Iowa permit state individual income tax deductions, credits, or exemptions for taxpayers who pay more than a certain amount towards the cost of caring for elderly relatives at home. For example, in Oregon, if family care at home prevents a nursing home admission, a tax credit can be taken of $250 or 8 percent of incurred allowable expenses (whichever is less).
In other States, direct subsidies to families are utilized to encourage family care of chronically ill elderly. Florida, under its Home Care for the Elderly program, provides subsidy payments to persons who care for elderly relatives/friends in their homes. In California, under its In-Home Support Services program, funded by Title XX of the Social Security Act and Community Services Block Grant funds, family members can be paid for providing homemaker and chore services to eligible elderly.
There are many questions regarding the effectiveness of direct payments to families, particularly with respect to their impact on delaying institutional placement and the administrative burdens imposed by having to determine care responsibilities. Previous studies suggest that caregivers strongly prefer services such as respite or subsidized care for their family members rather than tax or other financial incentives (Doty, 1986a).
State Activities in Encouraging Private Financing of Long-Term Care. Long-term care insurance and other private financing options are increasingly viewed by States as a promising approaches for easing both the public and out-of-pocket burden of financing long-term care. For example, States have devoted attention in the past two years to encourage or mandate insurance carriers to cover skilled nursing and home health care. By the end of 1985, at least four States (West Virginia, Colorado, Georgia, and New York) had laws requiring insurers to provide optional riders on group policies covering nursing home stays or home health care. At least five other States had legislatively authorized studies on private options for financing long-term care (Georgia, Illinois, North Dakota, Texas, and Virginia) with many other States conducting similar studies through gubernatorial or executive branch task forces (e.g., Alaska, Arizona, Connecticut, Florida, and Ohio).
In 1986, several States passed or are considering legislation requiring their own studies of the need for alternative options to stimulate the development of private long-term care insurance. Kentucky passed a law requiring health insurance companies to offer long-term care insurance, and Washington enacted a law establishing minimum standards for private long-term care insurance policies and their marketing. Colorado enacted two laws this session: one reduces the premium tax of long-term care insurance policies which conform to minimum standards and allows a tax deduction for purchasers of qualifying policies; and a second law--the first State law of its kind--permits the interest on Individual Medical Accounts (IMAs) to be exempt from Colorado State taxes.
Demonstration and Statewide Community Care Programs. States have been involved in the enactment or funding of a number of alternatives to institutionalization since the late 1970s, initially through demonstration programs. Many State programs establish eligibility criteria to target low-income elderly and many programs require the clients served to be "at risk" of entering a nursing home.
Legislatively created programs include such approaches as volunteer credit programs providing respite and chore services for homebound or disabled elderly (Missouri, Florida); respite programs providing relief for full-time caregivers at home or in community-based settings such as adult day care centers (e.g., Michigan, Washington, Arizona); case management services which provide help in coordinating the numerous services a disabled or chronically ill aged person needs to remain at home (e.g., Georgia, Maryland, New Jersey, California); residential housing assistance or boarding home care (e.g., Arizona, Ohio); and a variety of other comprehensive service programs designed to delay or prevent institutionalization (e.g., New York's Nursing Home Without Walls, Vermont's Independence Fund). At this point, many of the original demonstration programs have been integrated into the States' ongoing health, aging, or social services programs.
Alzheimer's Disease. Beginning in 1984, many States have enacted legislation intended to help the victims of Alzheimer's disease. California and Illinois have been particularly active in enacting legislation. For example, California established an Alzheimer's Disease Task Force in 1984 to guide the development of training programs, program and research priorities, and public education efforts. In the same year, California also appropriated $1 million to create diagnostic and research centers. In 1985, California legislators requested a study on the feasibility of making private insurance coverage available to Alzheimer's disease patients and their families in need of respite care.
Illinois enacted a package of laws in 1985 establishing a State task force, making Alzheimer's disease patients eligible for State-funded home and community-based care and respite programs, providing incentive payments to nursing homes which develop specialized Alzheimer's disease programs, creating regional comprehensive diagnostic and treatment centers projects, permitting contributions to a special Research Fund through tax return checkoffs, and establishing a pilot program to determine the feasibility of authorizing Medicaid payments for the diagnosis and treatment of Alzheimer's disease. Many other States, including Massachusetts, Virginia, Delaware, Kansas, and Connecticut have legislatively established special commissions or task forces. Florida, Wisconsin, and Texas allocated funds to support research projects, training and information centers, or support and education programs.
A larger number of bills and laws have been proposed or passed in 1986. For example, in Maryland, legislation was enacted covering the complete spectrum of issues, from insurance coverage to specialized curricula. One of the laws requires health insurers to offer an optional rider for care related to Alzheimer's disease. Arizona, Missouri, Nebraska, and Tennessee legislatively established special advisory committees or task forces. California and Kansas created additional programs and services. No doubt the trend will continue even as State health departments initiate their own special projects and services within existing programs (e.g., Connecticut, Maine).
G. THE IMPACT OF HEALTH, SOCIAL, AND ECONOMIC TRENDS ON THE DEMAND FOR LONG-TERM CARE
As noted earlier, population projections for older persons highlight three trends: an impressive increase expected in the absolute number of older persons; an increasing proportion of the total population which is age 65 and over; and increasing growth (in absolute numbers and proportionality) of the population which is age 75 and above (Table 2-8).
But demographic trends are not the entire story. The health status, the social environment and the financial status of the elderly are undergoing change. These factors, and their impact on the nature and demand for long-term care, are discussed in this section.
1. Trends in Chronic Disease and Disability
Those diseases which cause disability, and thus may require long-term care, are generally not the diseases which lead to high mortality. Over 30 percent of persons aged 85 and older report disabling conditions (defined as limiting one or more daily activities). The major reported causes (totaling over 72 percent of disability) are dementia, arthritis, peripheral vascular disease, cerebrovascular disease (strokes), and hip and other fractures. Conversely, major killers, such as ischemic heart disease and cancer, cause less than two percent each of the chronic disability (Table 2-9).
If current age specific rates of disability continue into the next century, the numbers of disabled Americans living n the community will almost triple. In absolute numbers, there is projected to be an increase from an estimated 3.7 million in 1984 to an estimated 10.2 million disabled individuals in 2040. These numbers are actually underestimates of the true level of disability as they rely on available statistics which reflect disability levels only in noninstitutionalized elderly.
Trends in the Prevalence of Mental and Behavioral Disorders
The profound impact of mental disorder on the long-term care needs of older adults is not well appreciated. In addition to being a potentially disabling force by itself, the mental status or emotional state of elderly individuals can determine how well they are able to manage serious physical disability and can determine how long such management continues in the home or community. Often this represents the difference between persons living in the community who receive skilled nursing care and those residing in nursing homes.
The results from NIMH's Epidemiological Catchment Area studies (Myers et al., 1984) reveal high prevalence rates (approximately 20 percent) of mental disorder among the population as a whole. This prevalence of chronic mental illness appears at least constant into early old acre, and then rises because of gradually increasing cases of dementia associated with more advanced aging.
While precise prevalence rates for Alzheimer's disease (the most common cause of dementia) are difficult to establish due to the difficulty of diagnosis, the best general approximation based on a review of several important studies is four to eight percent among those 65 years of age and older (Katzman, 1986). With a more narrow age-specific focus, reports that have been confirmed by NIMH's Epidemiological Catchment Area study indicate that the percentage of persons at age 65 with the disorder is very low (around one percent), whereas by age 85 approximately 15 percent are believed to suffer from Alzheimer's disease (although other studies suggest these figures may be higher).
With a nearly four-fold increase during the next 40 years in the percentage of those who are 85 and older, the percentage as well as absolute numbers of those with severe cognitive impairment will soar in the absence of important research and clinical developments. Further, dementing disorders account for a disproportionately large percentage of long stay nursing home residents. Should there become available a means of preventing or curing dementia, this would substantially reduce the need for long-term care, especially in institutions.
A growing body of research has also been documenting the high degree of reactive depression in those families with Alzheimer's disease victims (Brody, 1985). The impact of such family stress is to lower the capacity of this informal support system in the provision of long-term care, with consequent shifts to demands for formal system interventions. Improved understanding of family stress and research on better interventions for this problem should enhance family capacity to deal with Alzheimer victims.
Trends in Diagnosis, Treatment and Prevention
Over the next 50 years, there is likely to be continuing significant progress in diagnostic techniques for major diseases. For example, noninvasive techniques of detecting atherosclerotic plaques may permit the identification of persons at high risk of developing symptomatic coronary artery disease or peripheral vascular disease. New techniques of measuring bone density, including dual beam photon absorptiometry and computerized tomography, may permit early detection of osteoporosis. New techniques in evaluating neuromuscular function may allow identification of older persons prone to falling, a major contributor to hip fractures among the elderly. Substantial progress is being made in methods of diagnosing Alzheimer's disease in its early stages.
The health impact of these diagnostic improvements is still uncertain. Many technical and practical problems remain to be solved before most of them can be translated into conventional clinical practice. Even if this occurs, it is not known whether, and to what extent, earlier detection and treatment will reduce the prevalence and severity of disabling chronic disease. Further, similar advances with regard to high-mortality diseases may actually increase the prevalence of chronic disease.
Nonetheless, improved management of chronic disease is expected to lessen disability. Perhaps the most dramatic example is the continuing decline in stroke incidence which has resulted, at least in part, from improved control of hypertension. The increasing emphasis on tighter control of plasma glucose levels in diabetic patients should lead to lower incidence of retinopathy and other disabling complications of diabetes.
There is evidence that attention to health maintenance by older persons can lower the risk for diseases of later life. For example, moderate exercise and adequate intake of calcium appear to have a protective effect against osteoporosis in some older women. Stopping cigarette smoking, even after age 60, lowers the risk of heart attacks. Maintaining a balanced, nutritionally adequate diet lessens the risk of infections and other serious illnesses among older persons. The continuing decline in cigarette consumption and increasing attention to exercise and diet should lead to some reduction in morbidity from the above diseases.
Though such information is encouraging, more firm data a re needed on which to base recommendations for health maintenance for older persons.
Prospects for Technological Improvements in Medical Devices
Technological advances in medical devices have led to increases in life expectancy. Continuing technological advances provide a means for dealing with the disabilities often associated with aging and which frequently lead to the need for long-term care.
For example, accidents, including falls, are one of the leading causes of death and disability in older persons. It is estimated that one out of every three persons over age 65 falls each year, and fractures resulting from falls are estimated to cost approximately $7 billion a year in medical care. Devices to reduce the impact of falls and/or to eliminate them are being developed. Such devices can extend and complement caregivers in the home or nursing home, reduce medical costs arising from such injuries, improve patient mobility, and promote the patient's sense of independence and confidence.
Hearing loss is another one of the health problems which contributes to significant disability. Self-reported hearing loss in the elderly was documented in the Established Populations for Epidemiologic Studies of the Elderly Project. At the East Boston site, the prevalence of hearing loss rose from 6.8 percent in those 65-69 to 27 percent in those 85 and older (Cornoni-Huntly et al., 1986). In absolute numbers, these statistics project a rise in the number of elderly with severe hearing loss from 2.4 million in 1980 to 7.8 million in 2040.
The traditional device for hearing problems has been the hearing-aid, which has not been entirely satisfactory. With the utilization of new technologies, such as implanted electrodes, there is promise of better treatments for hearing impairments. Some implants use electrodes in the cochlea (inner ear), while others use electrodes on or near the middle ear to conduct electrical signals into the cochlea.
Urinary incontinence is another major problem for many elderly people which may result in the need for long-term care. It contributes to much excess disability and is a significant risk factor for institutionalization. Until recently, this condition received little attention from medical researchers. However, within the last several years, technological advances have given rise to the development of a number of devices for the treatment of urinary incontinence. These devices and techniques range from behavioral therapies (such as "prompted voiding," exercises, and biofeedback training for voluntary control of sphincter and detrusor muscle contraction) to the insertion of prosthetic urethral valves which are controlled by the patient's voluntary elevation of bladder pressure, thus releasing urine. Another recently developed device for treating urinary incontinence is a magnetic seal which is placed over the proximal bladder opening, and voiding is controlled by the wearer through movement of a magnet over the abdominal surface to unseat the seal.
Several Federal agencies with programs in aging and the National Aeronautics and Space Agency have joined in a collaborative effort to utilize technologies developed for aerospace to meet the needs of the elderly. One planned activity is to develop a memory aid device for wandering behavior, because of the number of older people with memory deficits and the incidence of wandering behavior within these groups. The device will also have the capacity for add-on components to aid other aspects of memory deficits, such as scheduling and performance of activities, taking medication, or periodic prompting to use the bathroom. Other goals are to use existing technology to develop devices to deal with deficits in vision, hearing and mobility.
2. Societal Changes
Current and future changes in a number of important societal factors have implications for the need and demand for long-term care. These include:
- Living arrangements of the elderly;
- Availability of family support;
- Educational attainment of the elderly;
- Participation of women in the labor force; and
- Increased longevity and its impact on the health of the elderly.
Living Arrangement. One of the most striking societal shifts in the last twenty-five years is the growth in the number of elderly who live alone. Between 1960 and 1984, the proportion of noninstitutionalized elderly living alone has increased from 19 to 30 percent.
The overall figure of 30 percent is unequally distributed by gender: Forty-one percent of elderly women were living alone compared with only 15 percent of men (U.S. Census, 1985). The major reason for this disparity is the longer life expectancy of women and that they are thus much more likely than men to be widowed. For example, in 1980, there were 67 men for every 100 women age 65 and over, and only 43 men for every 100 women age 85 and over.
Living alone can mean independence for the elderly. It can also mean that the functionally disabled elderly have no one to provide personal assistance with crucial personal and instrumental activities of daily living on an as-needed basis.
The trend in elderly living alone can be expected to continue and perhaps to expand, at least in absolute numbers. This has important implications for the demand for long-term care because this group of elderly is at higher risk of needing nursing home care (NCHS, 1981) and is five times more likely to use formal long-term care services (NCHS, unpublished). Further, as indicated earlier, living alone is the strongest predictor of having out-of-pocket expenditures on home care.
Family Support. As noted previously, families are the major source of assistance to older members needing long-term care. Over the past few decades, there have been major changes in the availability of the family to provide informal support, so future trends bear close watching.
Major sources of family support are spouse and children. For older women who are widowed, support from children increases in importance. Two gross measures of potential availability of such support are (1) rate of childlessness and (2) the number of children ever born to women with children.
With regard to childlessness, about 12 percent of white women and 25 percent of all other women aged 65-69 were childless in 1985. The drop in childlessness during the past decade is expected to continue for the next few decades. By 2000, less than 8 percent of white women and less than 15 percent of all other women aged 65-69 will be childless. However, when the baby boom generation starts reaching age 65, around 2010, indications are that there will be a new rise in childlessness among elderly women.
For those elderly women with children, the number ever born is a gross measure of the amount of informal assistance potentially available. In 1975, the average number of children ever born to women aged 65-69 was at its lowest level. White women had an average of 2.2 children and all other races of women averaged 2.5 children. Since then, the average number of children per elderly women has been rising sharply. It will continue to rise through the turn of the century when white women age 65-69 will average 3.1 children and all other women 3.8 children. A sharp decline is projected after 2000 because of the small family sizes of the 1970's.
The availability of children to provide informal support is also affected by their geographic proximity to their elderly parents. In 1975, for those elderly with surviving children, about one of every three had children who were within 10 minutes travel time (Administration on Aging, 1983). This trend of close geographic proximity may be changing, perhaps as much because of the elderly as their families. Between the 1960's and the 1970's, the number of elderly moving from one State to another increased by 50 percent (Center for Social Research in Aging, 1984).
The willingness of available children to provide support to their elderly parents who require assistance with activities of daily living is a major issue in projecting the need for formal long-term care. Women, especially those in their forties and fifties, have traditionally contributed their time to volunteer community service and to informal support of the elderly in their families. This tradition is changing, at least insofar as women age 45-64 have, since 1980, been increasingly participating in the labor force. This trend is projected to continue, especially for women in the age 45-54 group. In 1984, 62 percent of women aged 45-54 and 42.percent of women aged 55-64 participated in the labor force. This trend suggests that middle aged daughters may have less time to provide assistance to their elderly parents.
Families indicate that a major factor in the decision to admit their elderly parents into a nursing home is that none of them is available during the work day to provide assistance. Nonetheless, some small scale research has found that motivation to care for elderly parents is strong (Brody, 1981). Middle-aged daughters who also work will make considerable personal sacrifices to care for their elderly parents as well as their children. Young women indicate their intention to care for their parents as the need arises.
In summary, societal trends concerning family support are mixed. Until the turn of the century, more children will be available to provide support. The percent of childless women is declining and average number of children ever born is increasing. These trends will change when the baby boom cohort turns age 65, mainly because of their lower birth rate (office of Human Development Services, 1985). Children may be less available to provide care than they do now. Children and parents may not be close geographically. More middle aged women will be working and will not be available to provide assistance during the work day. In contrast, the commitment of daughters, including younger women, to assist their elderly parents remains strong.
One consequence may be an increase in the demand for formal long-term care, either in institutions or in the community--especially adult day care and similar services. Another consequence may be an increased demand for private sector approaches to long-term care financing as children fulfill all or part of their commitment by using their income to purchase various long-term care services for their parents.
Educational Attainment. Over the next 30 years, there will be a significant rise in the educational attainment of the elderly. Elderly with no high school education will decrease from 35 percent to under 10 percent (Federal Council on the Aging, 1981; U.S. Senate, 1986). The percent of elderly with a high school diploma will rise from 50 to 78 percent. Less than 20 percent of today's elderly have some college education. In thirty years, the figure is projected to increase to 37 percent.
This trend of increasing education of the elderly may result in decreasing the need for long-term care. Better educated persons may emphasize health promotion Aspects in structuring their life style. This may decrease the prevalence of chronic disease, its severity, and the accompanying disability. Increased education could lead to increased demand for private long-term care financing. Better educated elderly will have a greater understanding of their risk for catastrophic expenditures for long-term care. Better educated persons tend to have higher paying jobs, and thus may have more resources to pay for long-term care.
Participation of Women in the Labor Force. Since 1950, there has been a dramatic increase in the participation of women in the work force. The proportion has risen from 34 percent to 53 percent in 1984 (U.S. Census, in press). Increases have occurred for all age groups. In the second quarter of 1984, the proportion of women in the work force was 70 percent for those age 25-44 and 63 percent for those age 45-54. The proportion dropped to 42 percent for women age 55-64. Mothers with young children were also-major participants in the work force. In 1983, 57 percent of mothers with children under 18 worked.
The extent of participation in the work force has also changed. In 1982, 46 percent of employed women worked full time and year round. This was an increase of about 6 percent over the 1974 figure. In 1981, 26 percent of employed women had worked for 10 or more years. This is an important milestone because it is usually the point at which an employee becomes vested in a retirement plan.
This trend toward greater participation by women in the work force has major implications for long-term care. On the one hand, as earlier noted, the availability of women to provide daily assistance to elderly family members is reduced. This reduction is crucial for those elderly with personal care needs or cognitive impairments that require protective oversight and continuous care. On the other hand, increased full time, year round employment and longer work histories suggest that women, because they have income and pensions, may have more resources to contribute to their parent's long-term care needs, as well as eventually to pay for their own long-term care needs.
Increased Longevity and its Impact on the Health of the Elderly. A crucial question in forecasting the need for long-term care is: will the health of the elderly improve in the future? Specifically, will a 75-year-old in the year 2025 be healthier than a 75-year-old is today? This is a comparison of someone born in 1911 when average life expectancy was about 52 years to someone born in 1950 when average life expectancy had increased to nearly 70 years (NCHS, 1985). The issue of whether adding years to life means a healthier old age has been hotly debated in the literature.
One position is that the elderly are going to be healthier and less disabled in the future (Fries, 1980). Fries predicts a compression of morbidity, i.e., the average elderly person will remain vigorous longer, will have a very short span of disability and then will die around the age of 85.
A different view of the future is that the elderly will be less healthy in the future than they are today (Schneider and Brody, 1983). When these investigators analyzed national data on the health of the elderly, they found that over the past ten years there had been basically no changes in the health of the elderly. They predict that the prevalence of chronic disease among the elderly will increase in the future and emphasized the increasing importance of the management of chronic disease to minimize disability.
These radically different views on future underscore the complexity inherent in interpreting current data and making assumptions for projections of the future health of the elderly and their need for long-term care.
3. Trends in the Economic Status of the Elderly
The economic well-being of the elderly has improved dramatically over the last two decades. Overall, the proportion of elderly living below the poverty line was cut in half in fifteen years--from one in four elderly in 1969 to one in eight in 1984. Even after adjusting for inflation, the income of elderly families increased nearly 18 percent between 1969 and 1984.
This section describes the economic status of the elderly both as a whole and, whenever possible, on the diverse sub-groups which comprise the older population. As will be noted, many differences among these groups exist, and economic gains have not been equally distributed. The information in this section refers only to the elderly living in the community because data on the economic characteristics of individuals residing in institutions, when available, are generally unreliable.
For purpose of analysis, the Census Bureau categorizes living arrangements in the community as either living in a family or living as an unrelated individual. The elderly in families live either with their spouse as a married couple (where one or both spouses are elderly) or without their spouse, but with other relatives (for example, an elderly widow living with her daughter's family.). The vast majority of the elderly who live as unrelated individuals live alone, but a few live with non-relatives.
Trends in Income. Over the past 15 years, the mean income before taxes of families with elderly members more than tripled (from $7,800 in 1969 to $26,000 in 1984) and increased proportionally compared to the non-elderly (Table 2-10). The mean income of elderly unrelated -individuals also more than tripled during that period from $2,800 in 1969 to $10,800 by 1984. Economic improvements for the elderly are attributed to periods of rapid economic growth (particularly from 1949 to 1969 when savings accumulated), the indexation of Social Security benefits in 1972, and the implementation of the Supplemental Security Income (SSI) program in 1974 (Ross et al., 1986).
Large increases in prices during this period can make comparisons of dollar amounts misleading. However, after adjusting for inflation, increases for the elderly were still greater than for the non-elderly. The average inflation adjusted income of elderly families increased nearly 18 percent from 1969 to 1984 compared to 2 percent for nonelderly families, while the average income of elderly unrelated individuals rose 34 percent compared to 13 percent for the nonelderly. Finally, because most of the income of the elderly is not subject to income and payroll taxes, the elderly made further gains over younger persons than these figures suggest (Gordon, 1986).
Income Differences by Sex, Marital Status, and Race. Substantial differences exist in the per capita incomes of elderly men and women. Elderly women, like younger women, have considerably lower incomes than men. In 1984, the median income for elderly women was $6,020, or 58 percent of that of elderly men, whose median income was $10,450 (Table 2-11).
However, the distribution is not evenly distributed by marital status. Divorced, widowed, and never married elderly men (22 percent of elderly men) and women (60 percent of elderly women) have roughly similar income. However, married elderly men (78 percent of elderly men) have significantly higher income, and married elderly women (40 percent of elderly women) have by far the lowest.
To some extent, these differences in the median incomes of married older men and women are attributed to women's pattern of lifelong dependency on men's income. Perhaps, as a result of that income shifting to the women at the husbands' death, widowed elderly women have 80 percent higher median incomes than elderly married women. But as more and more married women enter the labor force, economic projections indicate that the income gap between men and women is closing.
There are significant economic differences among the elderly population by race, with white males having the highest per capita incomes and black females the lowest. Table 2-12 shows the 1984 median incomes by race and sex for ages 65 to 69 and for 70 and over. In general, whites had the highest incomes, followed by Hispanics, and then, blacks.
Poverty. Poverty rates for the elderly have dropped over the last fifteen years. The proportion of elderly individuals who lived in poverty was cut in half, falling from 25.3 percent in 1969 to 12.4 percent in 1984. At the same time, the poverty rate for the nonelderly was 10.8 percent in 1969 and 14.2 percent in 1984. However, the elderly are currently more likely than the nonelderly to have incomes right above the poverty line: In 1984, 21.2 percent of elderly versus 19.2 percent of nonelderly had incomes at 125 percent of the poverty line. For the elderly, poverty and near poverty increase with advancing age (Table 2-13).
Poverty rates for the elderly mirror the same racial and gender patterns seen in the rest of the population. Elderly whites--at 10.7 percent--are the least likely to be poor, followed by Hispanics--at 21.4 percent--and blacks--at 31.7 percent. Within every racial group, elderly women are more likely to be poor than elderly men.
Living arrangements have a profound effect on the level of poverty for all races and both sexes. Elderly persons living in families are much less likely to be poor than unrelated individuals, the vast majority of whom live alone. In the elderly white population, unrelated individuals have four times the poverty rates of persons living in families; for Hispanics, poverty rates are three times as high for unrelated individuals as for those in families; and, for blacks, unrelated individuals are two and one half times more likely to live in poverty as persons in families (Table 2-14).
Since 1979, the Census Bureau has supplemented its traditional definition and measurement of poverty (which uses only cash income) with newer approaches which include non-cash sources, such as Food Stamps, Medicare, and Medicaid. Compared to the 1984 poverty rates for the aged of 12.4 percent (when the calculations were based only on cash income), poverty rates for the elderly in 1984 using three approaches to measure non-cash benefits ranged from: 2.6 percent using the market value approach; to 7.3 percent using the recipiency value approach; to 7.6 percent using the poverty budget share approach.
Distribution of Sources of Income. At the end of 1984, Social Security benefits were paid to 25 and a half million retired workers and their dependents at an annual cost of almost $158 billion dollars. As a result, Social Security was the largest source of income for the elderly in 1984--an average of 37.6 percent of income for elderly couples and 44.5 percent for elderly individuals (Table 2-15).
Money from assets (such as savings accounts, IRAs, and stocks) was second only to Social Security as an overall source of income for the elderly (couples and individuals). Asset income comprised nearly a third of the income received by elderly couples (27.6 percent) and by elderly individuals (30.6 percent). Not surprisingly, assets, as a share of total income, were most important for the wealthiest elderly and least important for the poorest.
Pensions from private employers or from Federal, State or local governments were the third largest source of income for all elderly: 16.2 percent of the income for elderly couples and 12.5 percent for elderly individuals were from pensions.
Earnings, as the fourth largest component of income for all elderly in 1984, had the most differential effect on total income. For example, the median income of elderly men who worked full-time year round during 1984 was $26,450 compared to the $10,450 median income of all elderly men. Similarly, the figure for elderly female full-time workers was $15,230. However, most elderly do not work, especially after age 70, and of those that do, about half work part time.
Welfare, primarily from SSI or public assistance, was the smallest major component of income for the elderly and was received by only the lowest quintiles of income.
Pensions. Pension plans all have the same basic goal of providing retirement income to long time workers (and dependents), but differ considerably in benefit amounts and coverage. The major sources of pensions are, in descending order of total recipients and in ascending order of average monthly benefits: private pensions from companies or unions, State and local Government employee pensions, Federal Government employee pensions, and U.S. Military pensions.
Pension programs have grown rapidly since the 1940s and now cover almost half of the labor force as compared to Social Security which covers over 90 percent of the labor force. A significantly higher proportion of male workers (48 percent) were covered than female workers (33 percent).
Employee pensions provided about 15 percent of income for the elderly in 1984. This share has remained fairly constant over the last twenty years. Private pensions are more likely now to be received by the elderly than in the past.
However, pensions are a primary source of income for only a few elderly. In 1981, two percent of the elderly population depended on them for at least half of their total income, and private pensions represented over half the income for only seven percent of those who actually received private pensions.
Private pensions have an average first-year value of about $6,800, while the overall average monthly pension check in 1984 was $360. Monthly income from pensions varies more than benefits from Social Security, and is considerably higher for men than for women. In 1984, more than four-fifths of private pensioners also received income from Social Security.
Assets. Financial assets tend to be more valuable for the elderly, reflecting the financial accumulation of a lifetime. The role of assets as a share of income for the elderly is growing, but the value of these assets rises and falls with fluctuations in the market place and changing interest rates.
The proportion of households by age with specific types of assets is shown in Table 2-16 along with median amounts of these assets for those household which own assets. Most households, including elderly ones, held some type of liquid assets--usually a checking or savings account. The elderly were more likely than younger persons to have their money in certificates of deposit or money market accounts and far less likely to have an IRA or Keogh. The median value of liquid assets held by the elderly tended to be greater than those for younger ages. Except for home equity, the median value of all other assets listed in Table 2-16 was higher for the elderly than the nonelderly.
Home Equity. Home equity (the current market value of the property minus the amount of first mortgage debt) is the largest asset for many elderly homeowners. Estimates of home equity, presented in Table 2-17, show that the mean figure for elderly householders is $54,667.
Almost three-fourths of the elderly own homes compared to 64 percent of the total population. Of this group, 83 percent of elderly householders aged 65 to 74, and 95 percent of those aged 75 or older, owned their homes free and clear in 1984, according to the Annual Housing Survey of 1983. There is some burden for those older persons who still have a mortgage or for those with an older home in need of expensive repairs. (A more extensive discussion of home equity is contained in Chapter 3, section C.5).
Net Worth. Net worth--a balance sheet approach--is defined as the value of all assets covered minus any debts. In general, people follow what is called the "life-cycle" pattern of net worth, in which asset holdings increase during younger working years and decrease after retirement. Although substantial variations existed by age and living arrangements among elderly households, the average net worth of elderly households was greater than that of the general population.
The mean net worth, including home equity, of elderly married couples ($156,391) and elderly men who lived without a spouse ($90,055) was greater than that for the general population ($78,734). Elderly women living without a spouse are the only subgroup of the elderly with a lower net worth ($67,778) than the general population (U.S. Census, 1986). It must be noted, however, that the statistical significance of these differences has not been determined.
Expenditures of the Elderly. According to the 1982-1983 Consumer Expenditure Survey (CES), conducted by the U.S. Bureau of Labor Statistics, elderly households spent 91 percent of their income, leaving 9 percent available for savings or investment (Table 2-18).
All households spent the largest share of their income on housing, but the greatest share -- 30 percent -- was spent by elderly households and those headed by a person under age 25. However, the distribution of housing costs differed for elderly households, with only half of housing costs going for shelter and one-third for fuel, utilities, and public services. This reflected both the fact that many elderly have paid off their homes and, thus, spend less on shelter costs, and that their homes tend to be more expensive to maintain, because of the older average ages of their homes.
After housing costs, elderly households spent the next greatest amounts on food, transportation, and health care, in that order. These four items constituted 70 percent of all expenditures for elderly households.
Health care expenditures, at 9 percent of household expenditures, were far greater than the percentage spent by other age groups. For example, the next largest proportion was four percent spent by households with a head aged 55 to 64. However, while the share of income spent by the elderly on health care is relatively great, nearly two-thirds of the total health care per capita costs for the elderly is covered by Medicare and Medicaid.
Projections of Income. Projections of income into future years are inherently difficult to make and depend on economic, social, and demographic forces influencing the economic status of the elderly as well as rapidly changing conditions in the general economy which are difficult to predict. Consequently, reliable projections are difficult to make. One set of general purpose projections of the income of the elderly through the year 2005 and is shown for illustrative purposes in Table 2-19, Table 2-20, Table 2-21 and Table 2-22 (Olson, Caton and Duffy, 1981). A set of specialized projections of the income and assets of the elderly were developed independently for Chapter 3 of this report.
The projections indicate that:
- The income of the elderly will increase;
- Gains will be greater for those aged 72 or over than for those aged 65 to 71;
- The gap between the incomes of men and women will lessen;
- Fewer elderly will be clustered at the lower end of the income scale.
In the 25 years from 1980 to 2005, the average incomes of elderly women living as unrelated individuals are projected to experience the greatest increase (31 percent), but the average incomes of these women will still be less than the average income for older men living in similar circumstances or for elderly families.
Women aged 72 or over are projected to show the greatest gains by 2005. The average income for these women in 1980 was $6,255, but it is projected to increase 36 percent by 2005 to $8,528.
However, these women are likely to continue to have lower average incomes than men, younger elderly women, or the elderly living in families. In contrast, increases in income for this period are projected to be 21 percent for single men over age 72, and 26 percent for families headed by a person over age 72. Income increases are expected to be lower for the elderly aged 65 to 71: 23 percent for single women, 21 percent for single men, and 24 percent for families.
Elderly women who live alone are among the poorest elderly. According to the projections, their incomes will catch up with the overall average for the elderly, although their income will still be less than that of older men or the elderly living in families. In 1980, single elderly women had an average income 15 percent lower than that of an elderly single man. By 2005, their income is expected to be 9 percent lower.
Projections suggest that the proportion of elderly with inadequate incomes (less than $10,000 in constant 1980 dollars) will fall (Table 2-22). The greatest drop is expected for single women aged 72 or over, where the proportion with incomes under $10,000 is projected to decrease from 59 percent in 1979 to 38 percent in 2005. Overall, while 54 percent of elderly individuals had inadequate incomes in 1979, 38 percent are projected to be in this range in 2005. Similarly, there are expected to be fewer elderly families with inadequate incomes, with the proportion falling from 35 percent in 1979 to 23 percent by 2005.
Conclusions. Economically, the elderly are much better off now than in the past and their economic status will improve in the future. However, these gains have not reached some segments of the elderly population, and it is not clear if these economic gains can offset the rising costs of long-term care as the population ages.
The income of the elderly is not only rising, but, it is becoming more complicated as assets play a greater role in determining wealth. The wealthiest elderly have many types of financial assets, for example, and receive income from more than one source, not just Social Security. It is not clear if trends towards more diversified financial holdings for the elderly will continue or if the accumulation of these assets will begin at younger ages. Persons in their fifties and early sixties may have the best opportunity to accumulate financial assets to pay for long-term care, because they are still working, and the heavy financial burden of raising a family may be over.
The elderly population ranges from the wealthiest to the poorest Americans. Special attention will need to be paid to those most at risk for institutionalization and most economically vulnerable: women, those over age 85 and persons who live alone. While economic forecasts seem to indicate that these groups will fare better financially by the turn of the century, they will continue to have the lowest incomes among the elderly and will be least able to pay for their own care.
| FIGURE 2-1: Personal Health Care Expenditures for the Elderly by Type of Service -- 1984(Total -- $120 Billion) |
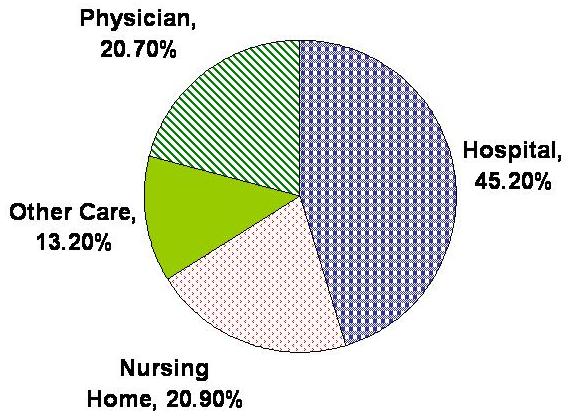 |
| SOURCE: Waldo and Lazenby, 1984. |
| FIGURE 2-2: Out of Pocket Health Care Expenditures for the Elderly by Type of Service -- 1984(Total -- $30.2 Billion) |
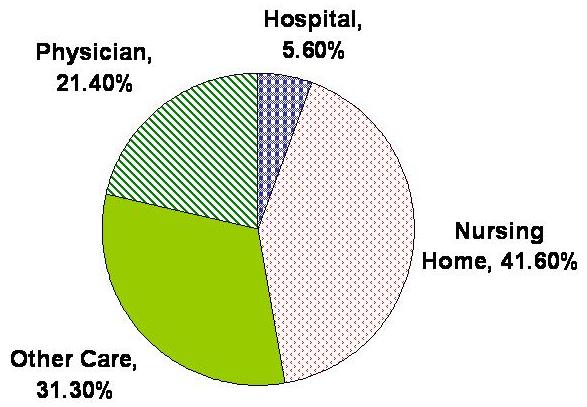 |
| SOURCE: Waldo and Lazenby, 1984. |
| FIGURE 2-3: Nursing Home Expenditures by Source of Payment -- 1984(Total -- $32 Billion) |
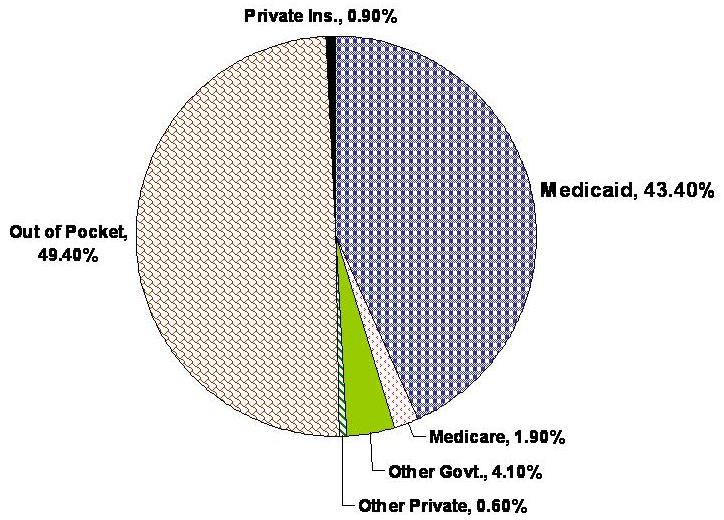 |
| SOURCE: Levit et al., 1985. |
| TABLE 2-1: U.S. Population 65 Years of Age or Over and Percent of Total Population: Selected Years and Projections 1950-2030 | ||
| Year | Population 65 Years or Over in Thousands | Percent of U.S. Population |
| 1950 | 12,270 | 8.1 |
| 1970 | 19,980 | 9.8 |
| 1980 | 25,544 | 11.3 |
| 2000 | 34,921 | 13.0 |
| 2010 | 39,195 | 13.8 |
| 2020 | 51,422 | 17.3 |
| 2030 | 64,581 | 21.2 |
| SOURCE: U.S. Bureau of the Census. | ||
| TABLE 2-2: Percent Increases in U.S. Population for 10-year Intervals, by Age Groups: Selected Years and Projections 1950-2010 | ||||
| Year | All Ages | 65-74 Years | 75-84 Years | 85 Years or Over |
| 1950-1960 | 18.7 | 30.1 | 41.2 | 59.3 |
| 1960-1970 | 13.4 | 13.0 | 31.7 | 52.3 |
| 1970-1980 | 8.7 | 23.4 | 14.2 | 44.6 |
| 1980-1990 | 10.0 | 13.8 | 26.6 | 20.1 |
| 1990-2000 | 7.1 | -2.6 | 15.6 | 29.4 |
| 2000-2010 | 6.2 | 13.3 | -2.4 | 19.4 |
| SOURCE: U.S. Bureau of the Census. | ||||
| TABLE 2-3: Projections of Long-Term Care Population in Nursing Homes and in the Community(in thousands) | |||
| Year | Nursing Home Residents Age 65 and Above | LTC Population in the Community | |
| IADL* Only | ADL** 1-6 | ||
| 1980 | 1,187 | 1,465 | 3,161 |
| 1985 | 1,411 | 1,666 | 3,659 |
| 1990 | 1,623 | 1,870 | 4,152 |
| 1995 | 1,861 | 2,061 | 4,652 |
| 2000 | 2,081 | 2,198 | 5,064 |
| 2020 | 2,805 | 3,085 | 7,033 |
| 2040 | 4,354 | 4,241 | 10,174 |
| SOURCE: 1977 National Nursing Home Survey, Social Security Administration Projections, and the 1982 Long-Term Care Survey (Adapted from Manton and Liu, 1984). * Instrumental Activities of Daily Living Only. ** Activities of Daily Living -- Individuals in this group have one or more of the six ADLs and may have IADLs as well. | |||
| TABLE 2-4: Percent Distribution of Helpers and Helper Days, by Sex and Relationship to Individuals 65 Years of Age or Over with Limitations in Activities of Daily Living(percent) | ||||
| Age and Relationship | Helpers | Helper Days | ||
| Male | Female | Male | Female | |
| ALL PERSONS 65 YEARS OR OVER | ||||
| Spouse | 37 | 10 | 53 | 17 |
| Offspring | 24 | 34 | 19 | 37 |
| Other relative | 23 | 35 | 18 | 30 |
| Formal | 16 | 21 | 11 | 16 |
| 65-74 YEARS | ||||
| Spouse | 45 | 18 | 61 | 31 |
| Offspring | 21 | 29 | 15 | 27 |
| Other relative | 21 | 33 | 15 | 28 |
| Formal | 13 | 20 | 9 | 14 |
| 75-84 YEARS | ||||
| Spouse | 35 | 8 | 53 | 14 |
| Offspring | 23 | 35 | 18 | 38 |
| Other relative | 25 | 36 | 18 | 32 |
| Formal | 17 | 21 | 11 | 15 |
| 85 YEARS OR OVER | ||||
| Spouse | 20 | 2 | 31 | 3 |
| Offspring | 34 | 39 | 31 | 47 |
| Other relative | 27 | 36 | 22 | 30 |
| Formal | 19 | 23 | 16 | 19 |
| SOURCE: Preliminary data from the 1982 National Long-Term Care Survey, Department of Health and Human Services, 1982. | ||||
| TABLE 2-5: U.S. Total Expenditures for Nursing Home Care and Annual Percent Change: Calendar Years 1960-84 | ||
| Year | Expenditures in Billions | Annual Percentage Change |
| 1960 | $0.5 | -- |
| 1965 | 2.1 | 64.0 |
| 1970 | 4.7 | 24.7 |
| 1971 | 5.6 | 19.1 |
| 1972 | 6.5 | 16.1 |
| 1973 | 7.1 | 9.2 |
| 1974 | 8.5 | 19.7 |
| 1975 | 10.1 | 18.8 |
| 1976 | 11.3 | 11.9 |
| 1977 | 13.0 | 15.0 |
| 1978 | 15.1 | 16.2 |
| 1979 | 17.4 | 15.2 |
| 1980 | 20.4 | 17.2 |
| 1981 | 23.9 | 17.2 |
| 1982 | 26.9 | 12.6 |
| 1983 | 29.4 | 9.3 |
| 1984 | 32.0 | 10.2 |
| SOURCE: Health Care Financing Administration, Office of Financial and Actuarial Analysis. | ||
| TABLE 2-6: Long-Term Care as Percent of Total Federal and State Medicaid Expenditures, by Type of Service: Fiscal Years 1974-84 (Percent) | ||||||
| Fiscal Year | Total LTC | SNF | ICF-Other | ICFMR | Mental Hospital | Home Health |
| 1974 | 40.2 | 2.0 | 13.8 | 20.0 | 4.1 | 0.3 |
| 1975 | 42.3 | 19.9 | 15.4 | 3.1 | 3.3 | 0.6 |
| 1976 | 42.6 | 17.6 | 15.7 | 4.5 | 3.8 | 1.0 |
| 1977 | 43.1 | 16.6 | 16.2 | 5.6 | 3.6 | 1.1 |
| 1978 | 46.2 | 17.4 | 17.3 | 6.6 | 3.7 | 1.2 |
| 1979 | 47.3 | 16.5 | 18.4 | 7.3 | 3.8 | 1.3 |
| 1980 | 47.0 | 15.8 | 18.0 | 8.5 | 3.3 | 1.4 |
| 1981 | 47.2 | 14.8 | 16.6 | 11.0 | 3.2 | 1.6 |
| 1982 | 48.8 | 15.1 | 16.9 | 11.8 | 3.3 | 1.7 |
| 1983 | 46.8 | 13.4 | 16.1 | 12.2 | 2.8 | 1.8 |
| 1984 | 49.2 | 14.2 | 17.2 | 12.5 | 3.1 | 2.3 |
| NOTES: LTC - long-term care SNF - skilled-nursing facility ICFMR - intermediate-care facilities for the mentally retarded ICF - intermediate-care facility | ||||||
| TABLE 2-7: Medicaid Long-Term Care Expenditures and Percent Change, by Type of Services: Fiscal Years 1977-84 | ||||||||
| Fiscal Year | Total Expenditures in Millions | Percent Change | Long-Term Care | SNF | ICFMR | |||
| Expenditures in Millions | Percent Change | Expenditures in Millions | Percent Change | Expenditures in Millions | Percent Change | |||
| 1974 | $9,983 | -- | $4,023 | -- | $2,002 | -- | $203 | -- |
| 1975 | 12,242 | 22.6 | 5,174 | 28.6 | 2,434 | 21.6 | 380 | 87.2 |
| 1976 | 14,091 | 15.1 | 5,983 | 15.6 | 2,476 | 1.7 | 635 | 67.1 |
| 1977 | 16,239 | 12.0 | 7,011 | 13.5 | 2,691 | 6.9 | 917 | 34.2 |
| 1978 | 17,992 | 10.8 | 8,296 | 18.3 | 3,125 | 16.1 | 1,192 | 30.0 |
| 1979 | 20,472 | 13.8 | 9,681 | 16.7 | 3,379 | 8.1 | 1,488 | 24.8 |
| 1980 | 23,311 | 13.9 | 10,983 | 13.4 | 3,685 | 9.1 | 1,989 | 33.7 |
| 1981 | 27,204 | 16.7 | 12,843 | 16.9 | 4,035 | 9.5 | 2,996 | 50.6 |
| 1982 | 29,399 | 8.1 | 14,343 | 11.7 | 4,427 | 9.7 | 3,467 | 15.7 |
| 1983 | 32,351 | 10.0 | 15,611 | 8.8 | 4,621 | 4.4 | 4,079 | 17.7 |
| 1984 | 33,895 | 4.8 | 16,697 | 7.0 | 4,810 | 4.0 | 4,256 | 4.3 |
| ACRG 1974-80 | 14.5 | 17.4 | 10.3 | 44.1 | ||||
| ACRG 1980-84 | 9.8 | 11.0 | 6.9 | 21.0 | ||||
| Fiscal Year | ICF-Other | Psychiatric Hospital | Home Health | |||||
| Expenditures in Millions | Percent Change | Expenditures in Millions | Percent Change | Expenditures in Millions | Percent Change | |||
| 1974 | $1,381 | -- | $406 | -- | $31 | -- | ||
| 1975 | 1,885 | 36.5 | 405 | -0.3 | 70 | 125.8 | ||
| 1976 | 2,209 | 17.2 | 529 | 30.6 | 134 | 91.4 | ||
| 1977 | 2,637 | 15.2 | 586 | 8.5 | 180 | 26.6 | ||
| 1978 | 3,104 | 17.7 | 665 | 13.5 | 210 | 16.7 | ||
| 1979 | 3,373 | 21.6 | 778 | 17.0 | 263 | 25.2 | ||
| 1980 | 4,202 | 11.4 | 775 | -0.4 | 332 | 26.2 | ||
| 1981 | 4,507 | 7.3 | 877 | 13.2 | 428 | 28.9 | ||
| 1982 | 4,979 | 10.5 | 974 | 11.1 | 496 | 15.9 | ||
| 1983 | 5,381 | 8.0 | 933 | -4.2 | 597 | 20.4 | ||
| 1984 | 5,823 | 8.2 | 1,043 | 11.8 | 765 | 28.1 | ||
| ACRG 1974-80 | 19.5 | 10.9 | 46.1 | |||||
| ACRG 1980-84 | 8.5 | 7.7 | 23.2 | |||||
| SOURCE: Health Care Financing Administration, Bureau of Data Management and Strategy. NOTE: ACRG - annual compound rate of growth. | ||||||||
| TABLE 2-8: Actual and Projected Growth of the Older Population: United States, 1900-2040(numbers in thousands) | |||||||||
| Year | Total Population: All Ages | 65 Years and Over | 65 to 74 Years | 75 to 84 Years | 84 + Years | ||||
| Number | Percent of Total | Number | Percent of 65+ | Number | Percent of 65+ | Number | Percent of 65+ | ||
| 1900 | 76,303 | 3,084 | 4.0 | 2,189 | 71.0 | 772 | 25.0 | 123 | 4.0 |
| 1920 | 10,571 | 4,933 | 4.7 | 3,464 | 70.2 | 1,259 | 25.5 | 210 | 4.3 |
| 1940 | 131,669 | 9,019 | 6.8 | 6,375 | 70.7 | 2,278 | 25.3 | 365 | 4.0 |
| 1960 | 179,323 | 16,560 | 9.2 | 10,997 | 66.4 | 4,633 | 28.0 | 929 | 5.6 |
| 1980 | 226,505 | 25,544 | 11.3 | 15,578 | 61.0 | 7,727 | 30.2 | 2,240 | 8.8 |
| 2000 | 267,990 | 35,036 | 13.1 | 17,693 | 50.5 | 12,207 | 34.8 | 5,136 | 14.7 |
| 2020 | 296,339 | 51,386 | 17.3 | 29,769 | 57.9 | 14,280 | 27.8 | 7,337 | 14.3 |
| 2040 | 307,952 | 66,643 | 21.6 | 29,168 | 43.8 | 24,529 | 36.8 | 12,946 | 19.4 |
| SOURCE: U.S. Bureau of the Census, Decennial Censuses of Population, 1900-1980 and U.S. Bureau of the Census, Current Population Reports, Series P-25, No. 922, Projections of the Population of the United States: 1982 to 2050 (Advance Report), U.S. Government Printing Office, Washington, D.C. 1982. | |||||||||
| TABLE 2-9: Probability of Selected Medical Conditions as the First Reported Cause of Chronic Disability among Disabled Persons, 85 Years and Older: United States, 1982 | |
| Condition | Percent |
| Dementia | 19.43 |
| Arthritis | 16.75 |
| Peripheral Vascular Disease | 14.88 |
| Cerebrovascular Disease | 12.86 |
| Hip & Other Fractures | 8.81 |
| Ischemic Heart Disease | 1.88 |
| Hypertension | 1.38 |
| Diabetes | 1.01 |
| Cancer | 0.91 |
| Emphysema & Bronchitis | 0.26 |
| SOURCE: Health Care Financing Administration, 1982 National Long-Term Care Survey | |
| TABLE 2-10: Average Incomes (Before Taxes) of the Elderly and Nonelderly, 1969 and 1984 | |||
| Family Income* | Family Income Per Capita | Income of Unrelated Individuals | |
| 1969 | |||
| Elderly | $7,800 | $3,000 | $2,800 |
| Nonelderly | 11,500 | 3,500 | 5,600 |
| Ratio, Elderly to Nonelderly | 0.68 | 0.87 | 0.50 |
| 1984 | |||
| Elderly | $26,000 | $10,900 | $10,800 |
| Nonelderly | 33,300 | 11,100 | 18,000 |
| Ratio, Elderly to Nonelderly | 0.78 | 0.99 | 0.60 |
| SOURCE: Congressional Budget Office calculations based on March 1985 Current Population Survey (Gordon, 1986). * Elderly families consist of families with two or more people that include at least one person age 65 or older. Elderly individuals include people age 65 and older who are living alone or with people to whom they are not related. | |||
| TABLE 2-11: Median Per Capita Income for the Elderly by Sex and Marital Status: 1984 | ||
| Men | Women | |
| MARITAL STATUS | ||
| All Persons | $10,450 | $6,020 |
| Married | 11,317 | 4,866 |
| Divorced | 6,991 | 6,777 |
| Widowed | 7,936 | 8,568 |
| Never Married | 6,833 | 8,654 |
| % BY MARITAL STATUS | ||
| All Persons | 100.0% | 100.0% |
| Married | 77.8 | 39.8 |
| Divorced | 3.1 | 4.2 |
| Widowed | 14.0 | 50.5 |
| Never Married | 5.0 | 5.6 |
| SOURCE: Developments in Aging, Volume 3, Special Committee on Aging, United States Senate. February 28, 1986. | ||
| TABLE 2-12: Median Per Capita Income of the Elderly by Age, Race, and Sex: 1984 | ||||
| Race | Men | Women | ||
| 65 - 69 Years | 70 + Years | 65 - 69 Years | 70 + Years | |
| All Races | $12,292 | $9,407 | $6,229 | $5,950 |
| White | 12,749 | 9,853 | 6,527 | 6,225 |
| Black | 7,545 | 5,679 | 4,446 | 4,304 |
| Hispanic | 8,778 | 5,705 | 4,342 | 4,825 |
| SOURCE: Developments in Aging, Volume 3, Special Committee on Aging, United States Senate. February 28, 1986. | ||||
| TABLE 2-13: Percent of Older Persons in Poverty by Age and Sex: 1984 | ||||
| Sex | Age | All Ages 65+ | ||
| 65 to 74 | 75 to 84 | 85+ | ||
| BOTH SEXES | ||||
| Under Poverty | 10.3% | 15.2% | 18.4% | 12.4% |
| Under 125% of Poverty | 17.3 | 26.4 | 31.5 | 21.2 |
| BOTH SEXES | ||||
| Under Poverty | 7.1 | 11.0 | 15.4 | 8.7 |
| Under 125% of Poverty | 12.7 | 19.0 | 25.4 | 15.2 |
| BOTH SEXES | ||||
| Under Poverty | 13.8 | 17.7 | 20.0 | 15.0 |
| Under 125% of Poverty | 24.5 | 31.1 | 34.7 | 25.9 |
| SOURCE: Developments in Aging, Volume 3, Special Committee on Aging, United States Senate. February 28, 1986. | ||||
| TABLE 2-14: Percent of the Elderly Below Poverty by Race, Sex, and Living Arrangements: 1984 | |||
| Race | Living Arrangements of Persons Below Poverty | Total | |
| In Families | Unrelated Individuals | ||
| ALL RACES | 6.7% | 24.2% | 12.4% |
| Men | 6.1 | 20.8 | 8.7 |
| Women | 7.2 | 25.2 | 15.0 |
| WHITES | 5.5 | 21.4 | 10.7 |
| Men | 5.2 | 17.3 | 7.2 |
| Women | 5.8 | 22.5 | 13.1 |
| BLACKS | 20.3 | 52.5 | 31.7 |
| Men | 19.1 | 43.3 | 26.0 |
| Women | 21.3 | 56.6 | 35.5 |
| HISPANICS | 14.9 | 39.8 | 21.5 |
| Men | 15.5 | 40.0 | 20.7 |
| Women | 14.8 | 39.0 | 22.1 |
| SOURCE: Developments in Aging, Volume 3, Special Committee on Aging, United States Senate. February 28, 1986. | |||
| TABLE 2-15: Percentage Distribution of Income by Source For Elderly in Different Income Groups, 1984 | ||||||
| Income Source | Income Quintiles (in percents) | |||||
| Lowest 20 | 20 to 39 | 40 to 59 | 60 to 79 | 80 to 100 | ||
| All Income Groups | Elderly Couples* Income Range (in dollars) | |||||
| Less Than 10,100 | 10,100-14,449 | 14,450-20,099 | 20,100-30,099 | 30,100 and Above | ||
| Social Security | 37.6 | 82.2 | 69.2 | 55.5 | 37.4 | 17.8 |
| Government Pensions | 8.5 | 1.8 | 4.7 | 5.7 | 10.5 | 10.4 |
| Private Pensions | 7.7 | 2.9 | 7.7 | 11.5 | 9.9 | 6.2 |
| Income from Assets | 27.6 | 6.1 | 10.4 | 17.9 | 26.7 | 38.4 |
| Earnings | 16.9 | 2.2 | 6.0 | 7.9 | 14.7 | 25.7 |
| Means-Tested Cash Transfers | 0.3 | 3.3 | 0.6 | 0.1 | 0.0 | 0.0 |
| Other Income | 1.3 | 1.5 | 1.4 | 1.4 | 0.8 | 1.5 |
| Total | 100 | 100 | 100 | 100 | 100 | 100 |
| All Income Groups | Elderly Individuals** Income Range (in dollars) | |||||
| Less Than 4,200 | 4,200-5,799 | 5,800-8,049 | 8,050-13,699 | 13,700 and Above | ||
| Social Security | 44.5 | 75.0 | 81.6 | 74.2 | 52.9 | 21.7 |
| Government Pensions | 7.8 | 0.6 | 1.1 | 3.6 | 7.9 | 11.1 |
| Private Pensions | 4.7 | 0.4 | 1.0 | 4.2 | 7.4 | 5.0 |
| Income from Assets | 30.6 | 3.5 | 4.7 | 10.0 | 21.6 | 48.5 |
| Earnings | 8.1 | 0.6 | 1.3 | 2.5 | 7.1 | 12.3 |
| Means-Tested Cash Transfers | 2.3 | 17.8 | 7.2 | 3.1 | 0.2 | 0.0 |
| Other Income | 2.1 | 2.1 | 3.1 | 2.4 | 2.9 | 1.4 |
| Total | 100 | 100 | 100 | 100 | 100 | 100 |
| SOURCE: Congressional Budget Office calculations based on the March 1985, Current Population Survey. * Elderly couples include those in which the older spouse is age 65 or older and the younger spouse is age 62 or older. ** Elderly individuals include all unmarried people age 65 or older. | ||||||
| TABLE 2-16: Asset Holdings, by Type of Asset and Age of Family Head; United States: 1983 | ||||||
| Percent of Families with Specific Asset Type | ||||||
| All Ages | Less Than 35 | 35-44 | 45-54 | 55-64 | 65 and Over | |
| LIQUID ASSETS | ||||||
| Checking Account | 79.0% | 72.0% | 83.0% | 81.0% | 83.0% | 80.0% |
| Savings Account | 62.0 | 63.0 | 68.0 | 65.0 | 58.0 | 53.0 |
| Certificate of Deposit | 20.0 | 9.0 | 16.0 | 18.0 | 30.0 | 37.0 |
| Money Market Account | 14.0 | 8.0 | 16.0 | 12.0 | 18.0 | 18.0 |
| IRA or Keogh Account | 17.0 | 9.0 | 19.0 | 25.0 | 33.0 | 8.0 |
| NONLIQUID FIN. ASSETS | ||||||
| Savings Bonds | 21.0 | 20.0 | 27.0 | 23.0 | 21.0 | 14.0 |
| Stocks | 19.0 | 13.0 | 22.0 | 22.0 | 25.0 | 21.0 |
| Bonds | 3.0 | 1.0 | 3.0 | 3.0 | 5.0 | 4.0 |
| Nontaxable Holdings | 3.0 | 1.0 | 3.0 | 3.0 | 5.0 | 5.0 |
| Trusts | 4.0 | 4.0 | 4.0 | 6.0 | 4.0 | 3.0 |
| HOME EQUITY | 60.0 | 34.0 | 66.0 | 75.0 | 73.0 | 70.0 |
| PROPERTY | 19.0 | 10.0 | 20.0 | 22.0 | 30.0 | 20.0 |
| BUSINESS ASSETS | 14.0 | 7.0 | 13.0 | 11.0 | 12.0 | 7.0 |
| Median Amount of Assets by Age Group (1983 dollars) | ||||||
| All Ages | Less Than 35 | 35-44 | 45-54 | 55-64 | 65 and Over | |
| LIQUID ASSETS | ||||||
| Checking Account | $500 | $300 | $500 | $600 | $995 | $987 |
| Savings Account | 1,151 | 500 | 1,194 | 1,400 | 1,588 | 2,412 |
| Certificate of Deposit | 8,000 | 4,388 | 6,000 | 15,250 | 7,400 | 11,156 |
| Money Market Account | 10,000 | 4,000 | 8,717 | 8,250 | 12,255 | 19,892 |
| IRA or Keogh Account | 4,000 | 2,000 | 3,000 | 3,790 | 4,000 | 6,000 |
| NONLIQUID FIN. ASSETS | ||||||
| Savings Bonds | 325 | 200 | 300 | 330 | 750 | 846 |
| Stocks | 4,016 | 1,200 | 3,300 | 3,623 | 7,250 | 10,150 |
| Bonds | 10,000 | 7,511 | 5,272 | 8,400 | 12,500 | 20,500 |
| Nontaxable Holdings | 14,125 | 2,747 | 8,673 | 16,500 | 17,500 | 21,932 |
| Trusts | 10,000 | 2,957 | 8,000 | 10,000 | 15,500 | 20,791 |
| HOME EQUITY | 41,261 | 25,985 | 40,600 | 50,000 | 55,000 | 41,857 |
| PROPERTY | 35,000 | 25,000 | 40,000 | 27,000 | 40,000 | 40,000 |
| BUSINESS ASSETS | 50,000 | 13,500 | 40,000 | 52,500 | 55,000 | 83,202 |
| SOURCE: Emily S. Andrews, The Changing Profiles of Pensions in America, Table V.7, p. 126-127. (Washington, D.C., Employee Benefit Research Institute), 1985. | ||||||
| TABLE 2-17: Home Equity Among the Elderly: 1984 | |
| Age | Mean Home Equity |
| 65+ | $54,667 |
| 65-69 | $56,747 |
| 70-74 | $56,812 |
| 75+ | $51,374 |
| SOURCE: U.S. Census, Current Population Reports Series P-70, No. 7: Household Wealth and Asset Ownership: 1984. U.S. GPO, Washington, D.C., 1986. | |
| TABLE 2-18: Annual Expenditures ad a Percentage of Income, by Age of Household and Budget Item: United States: 1982-1983 | ||||||
| Budget Item | Age of Householder (in years) | |||||
| Under 25 | 25 to 34 | 35 to 44 | 45 to 54 | 55 to 64 | 65 and Over | |
| Income | $11,537 | $28,835 | $29,718 | $31,198 | $24,450 | $13,583 |
| Total Expenditure | 101% | 67% | 82% | 79% | 80% | 91% |
| Food | 16 | 10 | 14 | 13 | 14 | 17 |
| Alcoholic Beverages | 3 | 1 | 1 | 1 | 1 | 1 |
| Housing | 30 | 22 | 25 | 22 | 22 | 30 |
| Shelter | 19 | 14 | 15 | 12 | 11 | 15 |
| Fuel, Utilities and Public Service | 6 | 5 | 6 | 6 | 7 | 10 |
| Household Operations | 1 | 1 | 1 | 0.7 | 0.9 | 2 |
| House Furnishings | 4 | 3 | 3 | 3 | 3 | 3 |
| Apparel and Services | 7 | 4 | 5 | 4 | 4 | 4 |
| Transportation: Gasoline and Motor Oil | 6 | 4 | 4 | 5 | 5 | 4 |
| All Other Transportation* | 16 | 10 | 12 | 11 | 10 | 10 |
| Health Care | 3 | 2 | 3 | 3 | 4 | 9 |
| Other Expenditures** | 14 | 8 | 11 | 12 | 11 | 12 |
| Life Insurance | 0.6 | 0.7 | 1 | 1 | 1 | 1 |
| Retirement Pension, | 6 | 5 | 6 | 7 | 7 | 2 |
| Personal Taxes | 11 | 10 | 11 | 13 | 11 | 6 |
| SOURCE: U.S. Bureau of Labor Statistics, Consumer Expenditure Survey: Interview Survey, 1982-1983, bulletin 22246, 1986. Totals may not sum due to rounding. * Includes other private and public transportation. ** Entertainment, personal care, reading, education, tobacco and smoking supplies, cash contributions, and miscellaneous expenditures. | ||||||
| TABLE 2-19: Projections of Average Income of Elderly Families and Singles by Age Group: Baseline (real 1980 dollars) | ||||||
| Age Group | 1980 | 1985 | 1990 | 1995 | 2000 | 2005 |
| MEN | ||||||
| 65 to 71 | 8,369 | 8,697 | 9,078 | 9,369 | 9,780 | 10,094 |
| 72 and Over | 7,454 | 7,754 | 8,101 | 8,375 | 8,750 | 9,042 |
| All Elderly | 7,850 | 8,169 | 8,537 | 8,822 | 9,214 | 9,517 |
| WOMEN | ||||||
| 65 to 71 | 7,297 | 7,646 | 7,989 | 8,276 | 8,676 | 8,998 |
| 72 and Over | 6,255 | 6,464 | 6,885 | 7,392 | 7,981 | 8,528 |
| All Elderly | 6,658 | 6,916 | 7,303 | 7,724 | 8,240 | 8,703 |
| FAMILIES | ||||||
| 65 to 71 | 18,019 | 19,032 | 19,925 | 20,637 | 21,549 | 22,270 |
| 72 and Over | 14,984 | 15,878 | 16,675 | 17,314 | 18,186 | 18,874 |
| All Elderly | 16,608 | 17,585 | 18,452 | 19,144 | 20,037 | 20,746 |
| SOURCE: Olson, L., Caton, C. and Duffy, M. The Elderly and the Future Economy, Lexington Books, 1981. | ||||||
| TABLE 2-20: Projections and Income Distribution for Families and Singles Aged 65 to 71: Baseline (percentage within real 1980 income classes) | ||||||
| Income Distribution | Families of Two or More | Singles | ||||
| 1980 | 1990 | 2005 | 1980 | 1990 | 2005 | |
| $0 to $2,500 | 0.236 | 0 | 0 | 6.589 | 2.008 | 0 |
| $2,500 to $5,000 | 5.918 | 2.250 | 0.288 | 40.251 | 39.958 | 32.737 |
| $5,000 to $7,500 | 12.268 | 9.936 | 5.977 | 21.610 | 22.955 | 25.976 |
| $7,500 to $10,000 | 13.594 | 12.979 | 11.461 | 11.348 | 12.168 | 13.998 |
| $10,000 to $20,000 | 38.099 | 39.936 | 41.679 | 15.268 | 16.818 | 19.528 |
| $20,000 and Over | 29885 | 34.628 | 10.595 | 4.935 | 6.092 | 7.760 |
| Number (thousands) | 4,618,359 | 5,487,917 | 5,872,101 | 3,140,664 | 3,879,170 | 4,269,474 |
| SOURCE: Olson, L. Caton, C. and Duffy, M. The Elderly and the Future Economy, Lexington Books, 1981. | ||||||
| TABLE 2-21: Projections of Numbers and Income Distributions for Families and Singles Aged 72 and over: Baseline (percentage within real 1980 income classes) | ||||||
| Income Distribution | Families of Two or More | Singles | ||||
| 1980 | 1990 | 2005 | 1980 | 1990 | 2005 | |
| $0 to $2,500 | 0 | 0 | 0 | 8.109 | 2.530 | 0.144 |
| $2,500 to $5,000 | 8.790 | 3.428 | 0.225 | 46.093 | 46.783 | 31.713 |
| $5,000 to $7,500 | 19.702 | 17.388 | 11.591 | 22.002 | 23.588 | 30.160 |
| $7,500 to $10,000 | 17.289 | 17.881 | 17.652 | 10.238 | 11.128 | 14.906 |
| $10,000 to $20,000 | 34.833 | 38.494 | 43.055 | 10.403 | 12.099 | 17.616 |
| $20,000 and Over | 19.387 | 22.809 | 27.477 | 3.155 | 3.872 | 5.461 |
| Number (thousands) | 4,014,170 | 4,548,314 | 4,784,306 | 4,771,709 | 6,022,728 | 6,747,424 |
| SOURCE: Olson, L. Caton, C. and Duffy, M. The Elderly and the Future Economy, Lexington Books, 1981. | ||||||
| TABLE 2-22: Projections of Elderly with Inadequate Income, by Family Status and Age: Baseline (percent) | |||
| Age/Status Group | 1979 | 1990 | 2005 |
| INDIVIDUALS | |||
| Men, 65-71 | 44.6% | 42.1% | 36.4% |
| Women, 65-71 | 49.6 | 45.8 | 38.8 |
| Men, 72 and Over | 49.8 | 46.6 | 39.3 |
| Women, 72 and Over | 59.0 | 52.1 | 38.1 |
| All Elderly Individuals | 53.7 | 48.7 | 38.3 |
| FAMILIES | |||
| Head, 65-71 | 29.1 | 24.1 | 18.6 |
| Head, 72 and Over | 41.4 | 35.5 | 28.5 |
| All Elderly Families | 34.8 | 29.3 | 23.0 |
| SOURCE: Olson, L. Caton, C. and Duffy, M. The Elderly and the Future Economy, Lexington Books, 1981. | |||
Chapter 3 through References
TABLE OF CONTENTS
CHAPTER 3. ANALYSIS OF PRIVATE MECHANISMS FOR FINANCING LONG-TERM CARE OF THE ELDERLY
A. Introduction
B. General Approaches to Private Financing of Long-Term Care
C. Analysis of Specific Financing Mechanisms
D. Special Analysis of IMAs, Long-Term Care Insurance, and Combination Approaches
CHAPTER 4. THE RELATIONSHIP OF MEDICAID TO PRIVATE FINANCING OF LONG-TERM CARE
A. Medicaid Eligibility for Long-Term Care
B. Implications of Medicaid for Private Financing Mechanisms
C. Possible Areas for Medicaid Reform
LIST OF TABLES
TABLE 3-1: Tax Returns with IRA Contributions by Adjusted Gross Income Class, 1984
TABLE 3-2: Tax Returns with Maximum IRA Contributions as a Percentage of all Tax Returns with IRA’s by Total Positive Income Class, 1983
TABLE 3-3: Summary of Services Offered by CCRC’s: Percent of CCRC’s Including Services in Fees
TABLE 3-4: Combined Annual Rate of Interest for a 70-year-old Borrower When Initial Home Value Equals $70,000
TABLE 3-5: Estimated Initial Annual Savings to Pay for Expected Nursing Home Utilization, by Age
TABLE 3-6: Projections of Persons 65 & Over Who Would Have Contributed $3,000 to an IRA in One or More years, and Rates of Contribution, By Sex, Marital Status, and Homeownership, 1986, 2000, 2018
TABLE 3-7: Projections of Population in Nursing Homes by Age 1986, 2000, & 2018
TABLE 3-8: Projections of Total Nursing Home Expenditures for the Elderly For Two Different Assumptions in the Rate of Specific Inflation, 1986, 2000 and 2018
TABLE 3-9: Inflation and Payment Source for Nursing Home Expenditures for the Elderly in 2018
TABLE 3-10: Base Case Projection: Total Nursing Home Expenditures for the Elderly, by Source of Payment in Years 1986, 2000, 2018
TABLE 3-11: Expanded IRA Projection: Total Nursing Home Expenditures for the Elderly by Source of payment In Years 1986, 2000, 2018
TABLE 3-12: Impact of Expanded IRA’s: Total Nursing Home Expenditures for the Elderly By Source of Payment In 2018
TABLE 3-13: Impact of IMA’s: Total Nursing Home Expenditures for the Elderly by Source of Payment in 2018
TABLE 3-14: Premium Estimates for a Level Premium, Level Benefit Indemity Policy
TABLE 3-15: Premium Estimates for a Indexed Premium, Indexed Benefit Indemnity Policy Index Rate: 5% per year
TABLE 3-16: Estimated Unisex Contribution/Premium Rates for Nursing Home Coverage Starting at Age 65 of $50 Daily Coverage Indexed by 5.8 Percent After Year of Issue With Contributions Indexed by 5.8 Percent After Year of Issues: Assumed Antiselection/Induced Demand = 37%
TABLE 3-17: Estimated Unisex Contribution/Premium Rates for Nursing Home Coverage Starting at Age 65 of $50 Daily Coverage Indexed by 4.4 Percent After Year of Issue With Contributions/Indexed by 4.4 Percent After Year of Issue: Assumed Antiselection/Induced Demand = 37%
TABLE 3-18: Annual Premium at Issue for Nursing Home Coverage of $50 per Day Starting at Age 65 with 90-Day Elimination Period, 5.8 Percent Annual Indexing of Coverage and Lifetime Premiums After Issue, and Waiver of Premium for Nursing Home Residents Over Age 64
TABLE 3-19: Projections of Total Nursing Home Expenditures for the Elderly by Source of Payment and Insurance Option in 2018
TABLE 3-20: Potential Effect of Induced Demand on Nursing Home Expenditure Patterns in 2018: One Percent of Income Option
CHAPTER 3. ANALYSIS OF PRIVATE FINANCING MECHANISMS FOR LONG-TERM CARE OF THE ELDERLY
A. INTRODUCTION
The general lack of private financing mechanisms which can protect elderly individuals against the catastrophic costs of long-term care is a major deficiency of the Nat-ion's health care system.
Chapter 2 of this report focused on defining the long-term care population and the types of needs associated with long-term care illness, and on describing the current long-term care delivery system in terms of expenditures and financing. Trends highlighted include:
-
The need for long-term care is defined by limitations in activities of daily living which require a need for personal human assistance. These limitations increase with age.
-
Not all elderly need long-term care. About five percent of the elderly resides in institutions at only one time. Of the elderly living in the community, about 13 percent have limitations in activities of daily living.
-
Even though the majority of the elderly long-term care population prefers to remain in the community, financing in the long-term care system is heavily oriented to institutional care.
-
The strains of individual and public financing are certain to increase because of the demographic trends indicating an ever increasing number of elderly.
-
The average income of the elderly has increased over the past two decades and this trend is expected to continue. While the elderly as a group do have the resources that could potentially be applied to private financing mechanisms, the cost of individually financing several years of nursing home care is beyond the reach of most elderly persons.
-
Current public programs for institutional long-term care are directed at the poor. Others become eligible for these programs only after impoverishment.
1. Proposals for Reform of Federal Financing
In contrast to the goal of this report, a variety of proposals have been advanced over the past several years to alter and expand Federal long-term care financing. These proposals principally focus on altering Medicare to cover extended custodial services, including personal care and nursing home care benefits (Somers, 1982; Davis and Rowland, 1985; Blumenthal et al., 1986). Proposals also have been advanced for expanding Medicaid coverage of long-term care. While such proposals attempt to address deficiencies in the current system, they also raise serious issues because they would substantially alter the role of the Federal Government in this area. In addition, such proposals would contribute to Federal budget difficulties and/or significantly raise taxes.
Another major dilemma facing proponents of reform is how to craft new financing policies which do not encourage a whole new group of beneficiaries to enter the public system--people who previously relied on the informal network of family and friends that currently provides about 70 percent of all long-term care services in the community.
In addition, the hopes of many that the widespread introduction of in-home services would offset a significant proportion of current nursing home costs (including public costs) have simply not materialized. Fifteen years of research, the most recent being the National Long-Term Care Channeling Demonstration sponsored by the Department of Health and Human Services, have shown the difficulty of targeting in-home services to persons who would have otherwise entered nursing homes. The absence of effective targeting mechanisms means that introduction of in-home services is more likely to increase than to decrease program costs.
Other approaches to public policy reform have taken a different tack. While acknowledging the need for more flexible service delivery, they are embedded in the need to control public costs. In Administration legislative proposals for FY 87, for example, States would be given additional flexibility to design and operate their Medicaid programs, subject to a cap on Federal Medicaid expenditures that would be indexed to the medical care component of the Consumer Price Index.
Other areas of Medicaid reform address the interrelationship between private financing and Medicaid and focus on adjusting eligibility for nursing home care coverage. Motivation for such options arises from the unsubstantiated belief that the future of private financing mechanisms is significantly affected by the availability of Medicaid, and from the desire to ensure that Medicaid resources are directed to those most in need. A number of such approaches are discussed in detail in Chapter 4.
2. The Need-for Private Financing Mechanisms
Although there are several ways in which individuals can use their private resources to protect against the high costs of long-term care, the existing options for private financing are neither well-developed nor well-known nor widely used.
It is the underlying premise of this analytic effort that private financing options for long-term care can play a larger role in our society than is currently the case. There need to be suitable, effective and widely available private financing mechanisms for the elderly who want to protect themselves at a reasonable cost against the high expenses of long-term care.
This chapter evaluates a variety of emerging mechanisms for private financing of long-term care. The critical strengths and weaknesses of each are discussed, and the barriers which appear to be impeding further development are identified. Where possible, affordability and participation are estimated. For Individual Medical Accounts, long-term care insurance, and insurance combinations, a special analysis was conducted and impacts on public and private costs were simulated.
This analysis is limited to private financing and the manner in which public programs may influence the growth of private options. It does not address the very real needs of persons who must rely on public programs because they cannot afford private alternatives. It is not intended to serve as a thorough reappraisal of the strengths and deficiencies of the public financing programs which now provide benefits to that population. In addition, the analysis does not deal with problems in the long-term care system other than financing, e.g., access to, and availability of, services and quality of care.
Finally, for purposes of analysis, it is assumed that the supply of needed long-term care services will expand as private financing options are increasingly available to a larger segment of the elderly.
B. GENERAL APPROACHES TO PRIVATE FINANCING OF LONG-TERM CARE
Most mechanisms for private financing of long-term care are based on three conceptual types: cash accumulation, risk pooling, and resource mobilization. In addition to these mechanisms, there are possible strengths to combined financing mechanisms as well as various types of caregiver support strategies intended to assist the vital "informal network" of care which exists in homes and communities.
Cash Accumulation. Cash accumulation strategies refer to savings mechanisms that encourage individuals to increase the resources available for future long-term care needs.
The most widely discussed example of this approach is the long-term care IRA, which provides tax advantages (e.g., deductions or credits) for savings deposited in accounts earmarked for long-term care use. Although seldom provided by companies, prefunded long-term care accounts provided as employee benefits also function as cash accumulation mechanisms.
Risk Pooling. Risk pooling refers to mechanisms which pool the resources of a large group of individuals who are potentially at risk in order to pay for the actual services that will be needed by an unidentifiable and relatively small subset of the group. In the case of long-term care, the risk is that of needing extended care for chronic illnesses in a nursing home, home, or other community setting.
Three basic risk pooling mechanisms will be examined in this chapter: long-term care insurance, social health maintenance organizations (social HMOs), and life care and continuing care retirement communities (CCRCs). Each differs in terms of the comprehensiveness of the benefit package, how risks are managed, and organizational structure.
-
Long-term care insurance pools the premiums of a large group of beneficiaries to cover a relatively smaller risk of an extended period of need by an individual for nursing home, intermediate care or home health services.
-
Social-HMOs use the pre-paid, capitated, case-management approach of health maintenance organizations (HMOs) to extend long-term care benefits to groups of individuals.
-
Continuing care retirement communities typically provide for elderly individuals lifetime benefits including a range of residential, health, social and custodial services, in return for some combination of an entrance fee and monthly charge.
Resource Mobilization. This refers to financing mechanisms which enable individuals to convert non-liquid resources to cash, thus enhancing their ability to pay for long-term care.
Two models of this approach are considered in this chapter:
-
Home equity conversion plans convert the home ownership assets of individuals into a stream of income that can be used to purchase long-term care services.
-
Employee benefit plans include the addition of long-term care coverage as an option in the package of pension or health benefits offered employees.
Combination Financing Mechanisms. Several of the financing mechanisms under review may be more efficient and effective in tandem than alone. For instance, because direct payment for long-term care may involve very large expenses, individuals using a pure cash accumulation mechanism must save what many consider to be an inordinate amount of money in order to be fully protected against the relatively small probability of very large expenses. It might be more efficient to have available a mechanism which combines features of both cash accumulation and risk pooling approaches as, for example, by developing long-term care IRAs earmarked for long-term care insurance rather than for the direct purchase of services. In addition to exploring the potential of an IRA-insurance link, this chapter will also discuss insurance-pension benefit combinations and acute-chronic care insurance links. These combined strategies are analyzed as part of the special analysis section of this chapter.
Caregiver Support Strategies. Caregiver support strategies are designed to strengthen and expand the informal network of long-term care services provided in the home and in the community. This network is essential to the success of private financing mechanisms: it affects the affordability of long-term care services and helps to keep the elderly at home rather than in costly nursing homes.
Two types of caregiver support strategies will be examined: tax allowances for family caregiving and volunteer systems.
-
Tax allowances for home care include a variety of tax credits or deductions for services which assist family caregivers in providing home care for an elderly dependent.
-
Volunteer systems assist organizations and individuals in providing unpaid long-term care services to older persons in the community.
C. ANALYSIS OF SPECIFIC FINANCING MECHANISMS
1. Long-Term Cars Individual Medical Accounts
Definition
An Individual Medical Account (IMA) is a cash-accumulation approach which would permit individuals to establish special purpose, tax-favored savings accounts dedicated, in whole or part, to the purchase of health care services. A long-term care IMA is intended to encourage individual savings throughout a person's productive years for the long-term care services which some persons will need later in life, usually well after retirement. Like the existing Individual Retirement Accounts (IRAs), most proposed long-term care IMAs would permit individuals to shelter savings from Federal (or State) income taxes in the special purpose accounts. Unlike IRAs, the IMA proposals normally permit tax-free withdrawals from the account only if needed for long-term care purposes.
Current Experience and Research Findings
This section of the report reviews development of the concept of long-term care IMAs. A much more detailed special analysis of IMA and insurance approaches was undertaken by the Department specifically for this report and is presented in Section D. That special analysis includes an assessment of the potential impact of a range of IMA options on total, out-of-pocket, and Federal expenditures for long-term care.
Historical Background. In recent years, several proposals based on the IRA model have been advanced to use tax-sheltered savings for special purposes. Some of the proposals have focused on savings for education while others have focused on savings for medical expenses, both acute care and long-term care.
The IRA model was first established in 1974 as part of the Employment Retirement Income Security Act (ERISA) and was designed to provide a means for persons not covered by private pension plans to save for their retirement years. In 1981, the Economy Recovery Tax Act expanded eligibility to all workers. One purpose of Congress in broadening the availability of the IRAs was to increase the overall rate of consumer savings, with accompanying benefits to the general economy.
In 1982, during deliberations over approaches to resolving the pending insolvency of the Social Security Trust Fund, proposals were advanced (Ferrara, 1982 and 1983) to use tax sheltered savings accounts to lessen individuals' dependence on social Security, with tax credits for savings of up to 20 percent of the Social Security payroll tax (employer and employee contribution combined). These initial proposals, developed in the context of Social Security reform, were limited to cash benefits, but it was recognized that the concept was also applicable to the Medicare Trust Fund. The proposals featured voluntary participation, and urged guarantee of Social Security benefits to current retirees and protection during the transition period. Future retirees would have reduced benefits, with the reductions dependent on the extent of participation in the IRA plan. Withdrawals from the IRA accounts during retirement years would not be taxed.
As a compromise plan for eliminating deficits in the Social Security Trust Fund gained acceptance, attention turned to the impending insolvency of the Medicare Trust Fund. There were two IRA-type plans advanced as part of the report of the 1982 Secretary's Advisory Council on social security, issued in March 1984. One of them, proposed by Rahn (1984), was essentially modeled on the Ferrara proposals for Social Security. It proposed a 30-year phase-in period; refundable tax credits available to participants, and deductions for voluntary additional contributions; voluntary participation with individual accounts; and an increase in the Medicare deductible in proportion to IRA participation, until the only Medicare benefits for individuals who had participated fully would be catastrophic coverage.
An IRA-type account was also proposed by Burke (1984) in the same report, with mandatory participation and with contributions used to buy catastrophic medical coverage. Coverage would be means-tested, with catastrophic expenses defined as those above 15-20 percent of income. Balances in the account at death would be divided, with the principal remaining in the estate, but interest transferred to a pooled government account to pay catastrophic medical expenses of individuals who had exhausted their IMA savings. Thus, this proposal had significant elements of risk-pooling supplementing its cash-accumulation approach.
The initial proposal to use IMA's to cover long-term care expenses for the elderly, rather than acute care expenses currently covered by Medicare, appeared in an article in the Federation of American Hospitals Review in the fall of 1985. It was written by Otis R. Bowen, M.D., who chaired the Advisory Council on Social Security from 1982-84, and is currently Secretary of the Department of Health and Human Services, and Thomas R. Burke, who was Executive Director of the Council under Bowen and is currently Chief of Staff in the Department.
The article, among other things, proposed an IMA for long-term care expenses linked to a risk pool concept. Individual accounts would be permitted for individuals who are covered by Medicare or who are age 40 and over. Savings up to certain limits and interest earned would be tax-sheltered. Some percentage of the interest earnings would go to a pooled fund and be used to pay long-term care expenses of those who have exhausted their individul accounts on necessary long-term care expenses. Withdrawals would be tax-free when used for long-term care expenses; any other use would be taxed at marginal rates and subject to penalty. Individuals who contribute less than the limit could only receive a portion of their long-term care expenses from the pool.
Current Legislative Activity. At the Federal level, several bills extending the IMA concept to savings for catastrophic medical care expenses (including long-term care expenses) have been proposed. One bill, proposed by Representative D. French Slaughter (H.R. 3505), offers a 60 percent tax credit to workers and employers who contribute to a "health IRA" for the worker. The maximum contribution under this proposal would equal the annual joint employer-employee Medicare payroll tax (currently 2.9 percent of earned income). Workers who opted to make the contributions would have a higher deductible for Medicare, but would have catastrophic coverage for both acute and long-term care expenses under Medicare.
Another bill, introduced by Representative Ralph Regula (H.R. 4349), would provide for a "health IRA" similar to current IRAs, except that funds used to purchase long-term care insurance or to pay long-term care out-of-pocket expenses would be taxed at a lower rate. Penalties would be imposed on withdrawals before age 59 1/2 or for use other than for qualified health expenses.
State Action. In May 1986, Colorado became the first State to create a medical savings account for individuals. The Colorado legislation, entitled "The Individual Medical Account Act of 198611 (House Bill No. 1102, General Assembly of Colorado), permits individuals to establish a trust which can be used to pay the eligible medical, dental and long-term care expenses of the account holder after age 59 1/2. Thus, the legislation is inclusive of, but not focused on, the long-term care expenses of the elderly. Features of the legislation include:
-
The individual can make annual contributions of up to $2,000 each for the account holder and spouse, as well as up to $1,000 for each dependent child.
-
The interest earned on the account will be exempt from Colorado income tax.
-
If mutually agreed, an employee may have his employer contribute to the IMA, or the employee may continue to make contributions to the existing health insurance policy or program.
-
The trustee is responsible for purchasing major medical coverage for each account holder to cover all medical, dental, and long-term care expenses in excess of $10,000 annually, as well as for paying the direct expenses of the account holder.
-
There is a penalty for early withdrawal (before age 59 1/2), regardless of the purpose, and any remaining principal and interest are taxed as part of the decedent's estate.
The Experience with IRAs. Since no experience with IMA's exists, the IRA experience provides the best basis for assessing the IMA concept and the likely levels of participation and savings. However, since IMAs have more restricted use than do general-purpose IRAs and, thus, are less attractive, the experience with IRAs is probably only instructive as an upper limit for the potential of IMAs. The latest information on IRA savers is for 1984 and is shown in Table 3-1, "Tax Returns with IRA Contributions by Adjusted Gross Income Class, 1984". As Table 3-1 indicates, the proportion of tax returns with IRA contributions in 1984 was relatively low--only 15.4 percent. The proportion rose sharply with income, from 2.1 percent in the lowest income group to 71.4 percent for those with Adjusted Gross Incomes (AGIs) of $100,000-200,000 and 63.6 percent of those with incomes over $200,000. Thus, IRAs have been used by a much higher proportion of the wealthy than those of moderate and low incomes.
Despite this difference in rates of Participation, most IRAs are held by those with moderate incomes, due to the larger number of people in moderate income brackets. Almost 40 percent of the tax returns with IRAs had AGIs of $30,000 or less in 1984, and about three-quarters had AGIs of $50,000 or less.
Overall, almost 9.5 percent of tax returns in 1983 had maximum IRA contributions. The group of persons who are already saving the maximum allowed in IRAs is an important one for consideration of IMAs. IRAs have an inherent advantage over IMAs--both IRAs and IMAs can be used for long-term care, but IRAs also can be used for any other purpose. Hence, taxpayers who do not have IRAs or who contribute less than the maximum are very unlikely to have any interest in IMAs.
Existing data show that the probability that the taxpayer will contribute the maximum amount rises with income. Table 3-2, Tax Returns with Maximum IRA Contributions, 1983 shows that only about eight percent of tax returns with IRAs are at the maximum contribution for those with under $5,000 in Total Positive Income (TPI--a somewhat broader concept than AGI which includes tax-sheltered income). In contrast, over 80 percent of the tax returns with IRAs which reported incomes above $100,000 contributed the maximum amount. Most taxpayers who save the maximum amounts have TPIs over $30,000 a year.
IMA proposals frequently call for funds withdrawn from IRAs for long-term care expenses to escape taxation entirely. It may be argued that this additional tax-favored treatment would result in some persons choosing IMAs over IRAs. However, the incomes of most people who have long-term care expenses are low enough that the tax advantages at current tax rates would be small or nonexistent, since such people are unable to work and their income and savings are rapidly depleted by the expenses of the long-term care. In addition, nursing home expenses above five percent of income are already deductible if the taxpayer itemizes, although this figure may rise under the tax reform bills currently being considered in Congress.
An indication of the potential revenue loss from IMAs can be obtained from the experience with IRAs. The Treasury estimates revenue losses of $14.4 billion from IRAs in Fiscal Year 1986. (These estimates do not account for future revenue gains from taxation of the eventual IRA withdrawals.
How Much Must Be Saved? A critical issue in development of pure IMA proposals (i.e., with no risk-pooling component) concerns how much a person must save to pay for future long-term care should it be needed. Consideration of this question involves examination of the current costs of long-term care services together with the effect of inflation estimates on both personal income and nursing home costs. The issues are discussed briefly here and in much greater detail in the special analysis, Section D, of the report.
The latest data available indicate that in Fiscal Year 1983, Medicaid reimbursements for care in skilled nursing facilities ranged from about $22 to $105 per day ($8,000 to $38,000 per year), depending on the State in which the facility is located, and averaged about $41 per day, or $15,000 per year. Services in intermediate care facilities are known to be lower in cost.
Current data on nursing home costs for private-pay patients (i.e., patients who paid their own bills with private resources) will not be available until later this year, when the National Nursing Home Survey of 1985 is completed. In general, however, private-pay patients are thought to pay 20 to 30 percent more for services than Medicaid does. Thus, after adjusting for inflation, costs for a private-pay patient in a skilled nursing facility would average about $21,400 to $25,000 per year. This is consistent with data from the American Health Care Association indicating that nursing home care averages $22,000 per year.
The amount to be saved also has to factor in inflation rates, since IMA savers will be saving for an event that is many years in the future. At present, nursing home costs are rising at a faster rate than the general inflation rate. Nursing home stays can range from fewer than 30 days to more than 10 years. The average stay in a nursing home is 456 days, (Liu and Manton, 1983), and the expected length of stay for someone who has already been in the nursing home for 90 days is 831 days. In general, then, sizeable savings would be needed to cover even an average stay, and larger amounts of savings would be needed for those exceeding the average.
High costs compounded by inflation make an individual savings approach to financing long-term care very difficult. Even if a person is able to save enough to pay out-of-pocket for an average length nursing home stay, the savings is likely to be too little for long stay patients, and far too much for those who never need nursing home care or who need very limited amounts of care. This problem suggests that savings approaches might be more effective when combined with risk-pooling approaches, such as insurance. A variety of plans linking the IMA concept to long-term care insurance are discussed in the special analysis, Section D.
Strengths of Long-Term Care IMAs
-
Individuals would be encouraged to save to take personal responsibility for their own and their spouse's long-term care expenses.
-
IMAs would provide those needing care with maximum flexibility in purchasing services.
-
Those who chose to participate will have greater resources in their later years to pay for needed long-term care services.
-
The costs borne by the Medicaid program for long-term care of middle and upper income persons might be reduced and might provide a partial offset to foregone tax revenues.
-
IMAs would encourage savings rather than consumption, thus providing potential funds for investment.
Weaknesses of the Long-Term Care IMA
-
If experience with IRAs is a valid predictor, participation rates would be low, especially among low and lower-middle income persons and families.
-
The tax-sheltering of the savings and interest would represent a significant loss of tax revenues. Under many MA proposals, the losses would not be offset by tax revenues when the funds are withdrawn for long-term care expenses.
-
If use of the accounts is restricted to nursing home expenses (the major cause of catastrophic expense), a large portion would pass to heirs, rather than being used for long-term care of the saver. This is because the majority of older persons are unlikely to spend any time in a nursing home. Further, such a restriction would also perpetuate the bias many see in the current system toward high cost, institutional care over home-based services.
-
If expenditures for home and community-based care were covered (reducing the portion passing to heirs and the bias toward institutionalization), this would significantly dilute the catastrophic protection provided. Also, if home and community care is included, it may be difficult to restrict the use of savings to legitimate, critical services.
-
It would be difficult to restrict the accounts to the payment of long-term care expenses. Those with large acute-care needs could be expected to press for opening up the accounts for those expenses also.
Tax Credits as Incentives for Saying
A possible enhancement of the IMA approach might be to offer a tax credit for savings for nursing home expenditures, rather than a deduction as with the current IRAs. Tax credits are generally more appealing to low and middle income persons than are tax deductions. Under current law, a tax credit for a $1,000 contribution is worth a $500 tax break to someone in a 50 percent tax bracket but only $100 to someone in a 10 percent bracket. The greater value of the tax credit to lower income persons could help to broaden the participation rate among those more likely to spend down to Medicaid if the need for long-term care arises.
However, tax credits for this purpose have some weaknesses. A major problem concerns affordability. While consumers in the lower tax bracket are clearly better off with the tax credit approach, it is not so clear whether lower-income taxpayers can or will afford the sizeable reduction in disposable income.
It is possible that tax credits might increase participation enough to have an appreciable effect on spending for Medicaid. However, the inherent target inefficiency of IMA plans (i.e., that many persons save but relatively few require the services) would almost certainly mean that the Treasury cost of revenues foregone would be much greater than the possible Medicaid savings. At present, there are no data on which to base an estimate of potential participation in a tax credit approach.
General Assessment
-
Feasibility and Practicality. Experience with IRAs indicates that savings institutions are likely to be quite willing to establish IMA accounts, and to promote them widely with newspaper and television advertisements. However, despite the ease of access to savings outlets and the promotion, a considerable amount of disposable income is required, and the overall proportion of taxpayers who have availed themselves of IRAs has remained low (about 15.4 percent of tax returns in 1984). Still fewer have saved the maximum amount permitted. Therefore, as previously discussed, IMAs are likely to have even lower participation rates, since they are less attractive than IRAs.
-
Improvement of the Quality of Life and Dignity of the Individual. To the extent that individuals participate and are able to save significant amounts of money toward future long-term care expenses, IMAs would improve the quality of life for persons in their later years. Persons would be able to exercise better control over the choice of care they received and retain the dignity that comes with taking responsibility for fulfilling one's own needs.
-
Strengthening the Family Unit. Freedom from financial stresses and the ability to maintain independence will help preserve the bonds between the individual and adult children.
-
Assuring System-wide Efficiency. IMA proposals that permit savings to be spent on either nursing home or home and community care services would encourage individuals to use less intensive, lower cost services, thus diminishing the current bias towards institutional care. The fact that individuals can choose their provider would work towards increasing competition in the market place and development of efficient providers.
-
Provision of Financial Security. As indicated by the earlier discussion, even in an IMA, it is difficult to save sufficient funds to cover long nursing home stays. Thus, IMA options tend to protect persons with minimal-to-moderate long-term care needs and leave vulnerable those persons with above average long-term care costs. Proposals to combine IMAs with risk-pooling approaches (primarily insurance) are directed at remedying this imbalance.
-
Containment of Public Expenditures. The impacts of long-term care IMAs on public programs would be two-fold: The tax shelter would reduce Treasury revenues, thereby impacting other Federal and State programs to some degree. However, the sheltered funds are available to pay for long-term care, possibly reducing the need for Medicaid funds to be used. As discussed in the later special analysis, Section D, the projected savings in Medicaid expenditures is modest.
The Public Role in Stimulating Growth
The review included in this section suggests that pure IMA approaches to directly financing long-term care are likely to be limited in effectiveness and efficiency. The inherent target inefficiency of individual tax shelter approaches for future nursing home care would probably make the cost much greater than the gain. However, when savings are combined with risk-pooling approaches, such as insurance, it is possible that a much greater target efficiency can be obtained. On these grounds, approaches that encourage tax favored savings for long-term care insurance may well be worth considering. A variety of such plans, linking the IMA concept to long-term care insurance, are discussed in the Special Analysis, Section D.
2. Freestanding Long-Term Care Insurance
Definition
Broadly defined, freestanding long-term care insurance is insurance that provides payment for chronic care in an institution, in the community, or in an individual's residence when the policy holder is not constrained to use a particular provider system.
Two important features are implicit in this definition:
-
The care covered by the policy is for chronic illness rather than acute illness or post-acute recovery. The benefits address the need for personal assistance with basic activities of daily living (often termed intermediate or custodial care) in addition to skilled nursing and therapeutic services.
-
The care covered may be needed for an extended period of time, often for the remainder of a person's lifetime, although use may be intermittent.
These key features distinguish long-term care insurance from the nursing home and home care benefits in Medicare and medigap insurance, which are intended to cover short-term recuperative or rehabilitative care in association with an acute care episode. The freedom of beneficiaries to select their own providers within general Qualifying guidelines distinguishes this-risk pooling model from others (e.g., social HMOs and CCRCs), which typically require the use of specified providers.
The Current Experience and Research Findings
The market for freestanding long-term care insurance is only beginning to receive serious attention. Until recently, insurance was generally perceived as not workable for long-term care.
A variety of barriers has inhibited development of this form of insurance (Meiners, 1983). Concern that policies would be bought disproportionately by those most likely to need care and that the availability of coverage might encourage its use, along with the custodial nature of much long-term care, have made insurers hesitant to enter the market. Questions of affordability and marketability also arise, considering the high costs of nursing home care and the widespread failure of older persons to appreciate the financial risks they face for long-term care needs.
The State regulatory climate in which insurers must operate varies significantly from State to State, placing insurance companies in the difficult position of having to develop multiple, State-specific marketing strategies. Some State regulators are relatively uninformed about the differences between the newer long-term care policies and more traditional insurance products, while others have established highly specific, very restrictive regulations which govern the structure, coverage, and other details of long-term care insurance products which may be offered in their State.
Medicaid, which has become a major payor for long-term care nursing home expenses even among middle-class elderly, is also thought by some, perhaps incorrectly, to discourage development of the market. (Chapter 4 of this report discusses in greater detail the relationship of Medicaid policies to private financing options.)
Another barrier has been a lack of data and analysis to clarify the issues involved in insuring long-term care. Until recently, little information has been available on the characteristics of persons receiving long -term care and patterns of service use. While better data is now available on the use of community services, there are still major gaps in the information base on nursing home use and related expenditures.
While many of these barriers remain significant concerns today, there is evidence that the climate for long-term care insurance is improving.
In the past few years, research results have supported the case for development of long-tern care insurance (Meiners, 1983, ICF, Inc., 1985), and an increasing number of insurers are actively involved in selling such coverage (Meiners, 1984; Lane, 1986). Data have become available to examine alternative prototype benefits (Meiners and Trapnell, 1984; Meiners, 1985; NAIC, 1986) and interest among consumers has increased (Meiners and Tave, 1984; Brickfield, 1985). Although the market is still in its infancy, these factors have encouraged a more positive attitude about the feasibility of a private market for long-term care insurance.
The Current Market. According to the American Health Care Association, as many as 25 long-term care insurance products are now being sold, and many of these products have entered the market in the past year (Lane, 1986). Available policies offer mostly nursing home benefits. Estimates of the total number of policies sold range from 50,000 to 300,000.
Several factors make it difficult to get accurate, up-to-date information on market development:
-
Because the market is still at an early stage of development, policies are subject to rapid adjustments and revisions which are difficult to track.
-
Insurance is regulated at the State level. However, State approval of a product does not necessarily mean that a company is actively selling that product. A company may have sought approval in order to lay the groundwork for a long-term care policy it thinks it may wish to sell at a later date; policies are sometimes approved before a company's agent network is in place and before the company is ready to promote its product; and, according to some reports, a company may be only nominally offering a long-term care product (usually at very high cost) because the State requires them to do so to be eligible to sell other types of insurance in the State.
- Proprietary concerns have precluded systematic monitoring of market development.
Most long-term care policies have been sold on an individual basis. Group marketing has been very limited. The minimal marketing to groups that has been done typically has involved sales on an individual basis to members of groups such as churches, associations of retired persons or credit unions. Employment-based groups have not yet been prominent in this market.
Until recently, most of the long-term care insurers were small companies such as United Equitable and Fireman's Fund, which have marketed long-term care insurance for roughly a decade. More recently, however, several larger companies have entered the market. Some of the newer entries include AIG, Aetna, Metropolitan Life and Prudential. Other companies that reportedly are involved in developmental efforts include All State, CIGNA, Travelers, John Hancock, Safeco, and Mony (Lane, 1986). The Blue Cross Association is also actively assisting its plan members with research and actuarial analysis of alternative approaches.
Appendix 2 of this report, Features and Premiums for Long-Term Care Insurance Policies, shows the range of features and premium structures of long-term care insurance policies identified by the National Center for Health Services Research (Meiners, 1984). A more up-to-date comparison is being compiled by the National Association of Insurance Commissioners (NAIC) and should be available by the end of 1986.
Specific features of the available long-term care insurance products differ but there are common aspects:
-
Policies focus on nursing home care at the skilled and intermediate level. Some offer custodial and home health care benefits, but usually such benefits are more limited in their length of coverage and in the amount paid. Sometimes custodial and home care benefits require selection of an optional rider.
-
Benefits are structured as indemnity plans, paying fixed amounts per day, and have waiting periods from 0-100 days before benefits begin and a coverage period of 2-6 years.
Insurers use a variety of techniques to control or limit risk, including:
-
Use of specific service definitions to determine benefit amount.
-
Prior hospitalization requirements (usually 3 days), together with stipulations that the covered illness or injury must be the same that caused the hospital stay.
-
Requiring physicians to recommend and review the continuing need for care.
-
Screening of sales for pre-existing health conditions and prior hospital or nursing home stays.
-
Exceptions to coverage for such items as mental disorders without demonstrable organic cause (which might have the effect of excluding Alzheimer's disease.)
-
Providing for the possibility of premium adjustments.
-
Not providing a guarantee of renewability.
The premiums for long-term care policies vary by age, usual with the rate fixed at the time of purchase. Fixed rate policies require some accumulation of reserves to cover the higher risk as people age. A few policies are structured as term policies in which the premium increases every year to reflect the increasing risk.
Most of the earliest products were designed to be sold to people who were already at retirement age, with some products marketed to people in their eighties. New and revised products have expanded marketing to earlier age groups, with greater interest in pre-retirement purchasers. Anecdotal evidence, however, suggests that many of the initial sales are to people in their mid to late 70's (Phillips, 1984).
Actual premium rates vary widely among products depending on the age at time of purchase, the features of the policy, the actuarial assumptions underlying the marketing strategy, and the overhead charged by the insurer. A recent review of several of the available products published in Money magazine (March, 1986) indicated that a 65 year old purchaser could pay from $174 to $1,451 a year for policies that cover skilled and custodial care (Topolnicki, 1986). By age 75, the range for the same products is $252 to $3,244.
The wide range of premiums suggests a lack of standardization and the need for consumers to be well informed. Based on questions raised in the Money magazine article, the following analysis was produced for this report. It conveys the complexity of the situation for consumers about available long-term care insurance policies:
-
Is the whole spectrum of nursing care covered? Personal assistance with basic activities of daily living that do not have to be performed by highly trained nursing personnel, usually referred to as custodial care, is frequently not covered; policies are often limited to skilled or intermediate level care.
-
How generous is the daily benefit? Consumers should be aware of the cost of care in their area. A $50 per day benefit in a $60 per day nursing home involves cost-sharing by the beneficiary of 17 percent. The benefits are typically not indexed for cost increases, so inflation will erode the purchasing power over time.
-
How long do benefits last? About eighty percent of all nursing home stays that start at age 65 and older last less than three years, while 90 percent last less than five years. Accordingly, policies of comparable length could be expected to protect consumers against the risk of all except an extraordinarily long stay. Some policies are much more limited in their coverage of custodial care than skilled care, although it is more likely that custodial care will be needed for an extended period.
-
Do the premiums escalate over time? Most policies fix the premium at the time of purchase, implicitly requiring overpayment in the early years to compensate for underpayment in later years when the risk is higher.
-
When do benefits begin? Often insurers offer a choice of "elimination periods" (e.g., 20 days or 100 days), during which the insured must pay for their own care. The longer the elimination period, the lower the premium, because 30 to 50 percent of nursing home patients have short stays. Elimination periods are used by insurers to control insurance-induced demand (that is, demand for benefits that would not arise in the absence of insurance coverage).
-
Do benefits hinge upon prior hospitalization? Insurers frequently use a prior hospitalization requirement to limit coverage to medically related conditions and to control induced demand. Such screens can significantly limit the number of people who collect benefits.
-
Are any illnesses or injuries excluded from coverage? Some policies exclude coverage of mental conditions unless there is evidence of an organic cause. This exclusion may prevent coverage in the case of Alzheimer's disease if the criterion is strictly enforced, because while many Alzheimer's patients need long-term care, the organic nature of the disease cannot be verified until after death.
-
What are the restrictions on preexisting conditions? Waiting periods for medical conditions diagnosed prior to the purchase of the insurance range from 90 days to 1 year.
-
Are home health care services covered? Insurers have been reluctant to offer home and community care benefits for personal-care needs because they do not have a reliable way to control insurance-induced demand. A few, however, have begun to offer such benefits, frequently with limitations such as a requirement that the beneficiary must first be institutionalized. This approach could relieve the incentive to remain in the nursing home simply because the bills are paid there but not in the home. In practice, most insurers offer home care benefits only after an extended nursing home stay, but few patients requiring an extended nursing home stay are discharged back to the community.
Strengths of the Freestanding Long-Term Care Insurance Mechanism
Freestanding long-term care insurance has captured much of the initial interest in the insurability of long-term care. This approach to risk pooling has the following strengths:
-
By focusing primarily on the nursing home risk, the freestanding products address the major cause of catastrophic health care expenses among the elderly.
-
It is affordable to many individuals who wish to take personal responsibility for their own long-term care expenses.
-
A freestanding type of product, by focusing on the long-term care risk alone, simplifies some complexities involved in identifying the insurable risk.
-
Policies can be marketed as a new product rather than a modified Medicare supplement policy that must compete against the cheaper medigap policies, which about two-thirds of the elderly already own. However, as discussed later, there is a potential market for combined long-term care/medigap policies that may provide marketing advantages.
-
In addition to providing protection of personal income and assets, the freestanding products help beneficiaries gain access to nursing homes and maintain their status as private-pay patients. The limited supply of nursing home beds tends to limit access for patients who enter nursing homes on Medicaid and for those who quickly spend-down to Medicaid.
-
The insurance products have the potential to relieve some of the pressure on Medicaid by slowing or eliminating the spend-down process for insured persons.
-
A larger private pay clientele will relieve nursing homes of some of the administrative burden and reimbursement uncertainty associated with Medicaid, possibly encouraging them to offer patients preferred provider arrangements that help keep costs down.
-
Long-term care insurance is a new line of business for insurers that has substantial growth potential.
Weaknesses of the Long-Term Care Insurance Mechanism
The freestanding approach to long-term care insurance also has weaknesses:
-
By focusing primarily on the nursing home risk, the freestanding products perpetuate the institutional orientation that prevails in our public programs for long-term care. This focus also complicates marketing because potential purchasers generally prefer home care to nursing home care.
-
Often the personal-care benefits (in the nursing home or at home) are more limited in duration and dollar payout than the skilled-care benefits, even though the typical long-term care patient needs more of the lower level of care benefits.
-
Separating long-term care from acute care benefits reduces the opportunities and incentives to manage care across the continuum of need. This may result in higher overall expenses, because lower-cost chronic care services are less likely to be substituted for higher-cost acute care services. Combined long-term care/medigap policies may lessen this potential weakness.
-
Marketing two or more separate products to the elderly, rather than one merged product, increases the chances for confusing overlaps in benefits and duplications in sales efforts and expenses.
-
Marketing on an individual basis rather than to groups also makes the freestanding products more expensive. In addition, group sales can reduce the potential for adverse selection.
-
Because freestanding products typically pay a fixed amount per day, with no adjustment for cost increases, benefits can be significantly eroded by inflation or cost-increasing changes in technology.
-
Nursing homes might tend to shift more toward private-pay patients, making it more difficult for the elderly poor to gain access to care.
-
The freestanding products do not provide complete catastrophic insurance protection even for nursing home care.
-
At present, premium levels for the more complete coverage are such that only a relatively small portion of the current elderly population can afford the freestanding products.
What is the market potential for long-term care insurance?
Little is known about the market potential for long-term care insurance. However, research suggests that there is substantial room for growth. Key considerations of market growth are affordability and marketability.
Affordability. One study, using income cut-offs of $10,000 for individuals and $15,000 for couples, estimated that about 7 million people over age 65 (about one-fourth of elderly persons) could have afforded long-term care protection in 1980 (Meiners, 1983). Another analysis estimated that there were 4.7 million older persons for whom a standard annual premium would be less than 5 percent of cash family income in 1980 and 10.1 million older persons for whom a premium would be less than 10 percent (ICF, 1985).
Several studies have shown that cash income substantially underestimates the elderly's real income potential, which tends to be clustered in non-liquid assets such as home equity (Moon, 1983; Meiners, 1983; Winklevoss and Powell, 1984; Jacobs and Weissert, 1984; ICF, 1985). Linking strategies such as home equity conversion or IRAs to' insurance programs may enable more elderly to afford long-term care insurance with discretionary income.
In addition, the likely trends in the sources of income of the elderly also will provide an improved future situation, In constant dollars, the proportion of elderly families with incomes of more than $15,000 is projected to grow from 23 percent in 1985 to 35 percent in 1995, 52 percent in the year 2005, and 59 percent in the year 2015 (ICF, 1985).
Marketability. Product development is underway to overcome some of the weaknesses previously noted, as well as to make long-term care insurance more appealing. Further, increased recognition of long-term care as an insurable risk has encouraged the development of new linkages to create more comprehensive coverages that provide the opportunity of managed care and offsetting risks. Meiners and Greenberg (1986) suggest the following examples of linkages that may serve to broaden the market appeal of long-term care insurance.
Medicare “Super Supplements" -- Medicare supplemental policies that include long-term care benefits create the opportunity to coordinate benefits and perhaps encourage substitution of lower cost, chronic care services for higher cost, acute care services. There could also be economies in marketing one product rather than two and the combination could simplify the decisionmaking process for the consumer. For current owners of medigap policies, a merged product makes a great deal of sense, particularly if it can be purchased at a cost that is less than the two products sold separately. Also, a lower cost combination which trades some of the first-dollar acute care coverage for long-term care benefits might help expand the market.
One example of an expanded Medicare supplement policy is marketed by Blue Cross of Southern California. It includes several home health services that are designed to cover long-term personal care needs beyond what Medicare allows. The policy operates as a HMO-type plan with all services authorized by the physicians in the participating medical group, which allows for careful case management.
Medicare-HMOs -- Possibly foreshadowing the potential interest of Medicare-HMOs in adding long-term care benefits, Group Health Cooperative of Puget Sound, Washington, is responding to an unexpectedly large outpouring of member interest in long-term care insurance through a joint venture with Metropolitan Life to offer long-term care insurance on a test basis. The product being contemplated is an indemnity product, paying a fixed amount per day for nursing home care and a percentage of that amount for home and community benefits. It will focus on catastrophic cost but allow for price sensitivity by offering a choice of elimination periods (30-90 days) and length of coverage (3-5 years). It will be underwritten to avoid adverse selection.
An important feature is that the long-term care insurance package will be integrated with the traditional acute care benefits. This will permit lower-cost home and community services to be substituted for hospital and nursing home care where appropriate, with access to services controlled by a case management system. For selected services, Group Health will use its group purchasing power to negotiate preferred provider discounts for its members.
Under current regulations Medicare-HMOs have a strong negative incentive to offer long-term care benefits if, as might be expected, such benefits would attract the participation of the chronically-impaired elderly. This is because the current Medicare reimbursement formula does not reflect characteristics associated with chronic care needs. The Metropolitan Life-Group Health venture can price benefits appropriately by offering insurance as a separate package.
Medicare-Vouchers -- Opportunities for integrating long-term and acute care insurance packages would be enhanced by legislation recently introduced in the Senate to broaden the type of health plans that would qualify as alternatives to traditional Medicare coverage. The legislation is intended to give Medicare beneficiaries more flexibility in choosing insurance protection, in particular to take advantage of merging their Medicare benefits directly with health plans they participated in as employees.
As the Medicare voucher plan develops, private insurers could consider including long-term care benefits in the insurance packages offered. Researchers at Northwestern University studying consumer preferences for various vouchers found strong interest in plans covering custodial long-term care at home or in a nursing home (LaTour, Friedman and Hughes, 1986).
Retirement Community Reinsurance -- Relatively few continuing care retirement communities (CCRCs) offer an unlimited chronic care guarantee. Often a more limited guarantee is related to the difficulties of insuring the long-term care risk, especially with the small pool that most communities represent.
Developers of these communities are aware of difficulties that some communities experienced in meeting their long-term care obligations in the 1970s, and the commitments they are least comfortable with are chronic care guarantees. At the same time, developers recognize the importance of such guarantees to the marketing of CCRCs as a means of assuring a continuum of the services needed by elderly people. Growing interest in long-term care on the part of insurers suggests a possible solution to this dilemma.
Some CCRCs (which are discussed more fully in a later section) are actively exploring joint ventures designed to move responsibility for long-term care coverage to an established insurance company. An example of this is the Metropolitan Life long-term care benefit package recently developed with Williamsburg Landing, a CCRC in Virginia. In the Metropolitan Life-Williamsburg Landing package, benefits are available for all levels of nursing home care at a rate calculated to pay the actual cost. Home care benefits are available as a substitute for nursing home benefits and there is a 60 day waiting period before benefits begin, but no hospital stay is required. Under this arrangement, Metropolitan reserves the right to review the care needed, and the contract is structured to permit readjustments to reflect actual experience.
This type of arrangement eliminates the need for the community to act as its own small insurance company. Further, CCRCs present an opportunity to market long-term care insurance protection on a group basis, with all parties working together in a managed care environment to control the risk.
A variation of the CCRC-insurance link, which provides insurance for continuing care at home, is currently under development by the Health Policy Center at Brandeis University and the Friends for the Aging in Philadelphia and is expected to be available by mid-1986.
Under this concept, participants join a risk pool that has a managed care component, paying membership fees either directly from income and savings or from home equity. Insurance would protect members against catastrophic costs associated with long-term care while the case management component would ensure access to an efficient and comprehensive system of care.
Unlike traditional CCRCs, enrollees would not be required to move to a campus setting. By eliminating the housing costs, retirement security would be achieved at a lower cost, making it affordable to more people. In addition, this alternative may appeal to persons who prefer to remain in their home.
Combined Life and Long-Term Care Insurance -- Packaging life insurance with long-term care insurance is particularly appealing because it allows for the balancing of different lifetime risks (ICF, 1985). As people get to retirement age their need for protection from premature death declines compared to their need for protection against the cost of unexpected long-term care. Combining the two benefits encourages the purchase of long-term care protection at younger ages by a broad range of individuals.
Combining long-term care insurance with casualty or disability insurance has also been suggested as a way to help focus consumer attention on the long-term care risk. For example, the benefits in the typical freestanding policy could be marketed as a rider to home insurance as a way to pay extra living expenses for a person whose spouse needs to be institutionalized (Ericson, 1985).
The Public Role in Encouraging the Long-Term Care Insurance Market
The market potential for long-term care insurance can be improved by public policy actions in a number of important areas.
Consumer Education and Protection. Recent surveys have shown that consumers generally do not recognize their need for long-term care protection (Brickfield, 1985). Typically, they have not had a reason to think about the risk or have chosen to deny it exists. To the extent that the risk is recognized, most elderly persons incorrectly assume that Medicare or medigap policies will cover their needs.
States can and have taken the lead in helping elderly consumers select insurance protection. One program of note is the Senior Health Insurance Benefit Advisory (SHIBA) program in the State of Washington. This eight year old program is operated by the insurance commissioner's office, which recruits, trains, and supports volunteers at the local level to help elderly consumers. California has recently initiated a similar program and a number of other States are considering programs.
State Regulatory Approaches. State regulation is often cited by insurance companies as one of the potential barriers to development. Freestanding long-term care insurance is essentially a hybrid product combining elements of life insurance, disability insurance, and health insurance. While it is often grouped with medigap insurance for the purposes of regulation, it does not fit well with current guidelines for Medicare supplements.
Confusion about what long-term care insurance is or should be has prompted an aggressive approach to consumer protection in some States. Standards relating to the minimum package of benefits policies must include in order to be marketed is a frequently-used device for protecting consumers.
Though this approach may be well intended, it can backfire. The case of Wisconsin is illustrative. The Wisconsin State Insurance Commissioner's Office did a careful evaluation of the difficulties involved in assuring that the protection offered in many nursing home policies would be meaningful. After this review, Wisconsin established a broad set of minimum benefit standards, requiring insurance policies to cover custodial as well as skilled and intermediate care. Unfortunately, this action effectively eliminated the sale of such policies in the state (Meiners, 1983).
Although Wisconsin is currently in the process of considering revisions to its original standards, in the hope of creating an environment more conducive to product development, other States are considering implementing their own standards containing similar provisions requiring extensive benefit packages.
Because long-term care insurance is new, States are clearly faced with the difficulty of regulating an unfamiliar product in their attempts to protect consumers. To help clarify the issues, the National Association of Insurance Commissioners is conducting a study of long-term care insurance to serve as the basis for model laws and regulations (National Association of Insurance Commissioners, 1986) Other studies underway include a survey by the Massachusetts Insurance Commissioners Office which addresses possible trade-offs to be dealt with by regulators in helping to keep long-term care insurers solvent while also assuring that consumers are purchasing meaningful benefits (Kirsch and Robertson, 1985).
Medicaid as a Barrier. It has been asserted that the availability of Medicaid may act as a disincentive to the purchase of long-term care insurance. The issue has two related concerns: that because Medicaid is available as a "safety net," people will not give serious attention to long-term care insurance; and, that people with resources will 'game' the system by passing their assets along to others or protecting them in a trust, thus becoming eligible for Medicaid benefits.
A recent critique of these issues, however, concludes that many of these concerns can be refuted (Doty, 1986b). At the current time people are probably equally uninformed about their opportunities to use Medicaid as they are about the risk they face of having catastrophic long-term care expenses. As consumers become more educated about their risk of needing long-term care, they are likely to view long-term care insurance at least as appealing as the complexities, costs, and uncertainties involved in asset divestiture. Nonetheless, examination of Medicaid estate recovery provisions suggests that there is substantial room for States to reinforce the incentives for individuals to choose an insurance option. (A more complete discussion of Medicaid issues is provided in Chapter 4 of this report.)
The Government as Reinsurer. One way for the government to foster private market development of long-term care insurance is to establish a government-insured secondary market for long-term care policies. In some senses, Medicaid already serves a reinsurance role for individuals although it does not prevent financial loss.
Reinsurance for current long-term care insurance products would primarily protect insurance companies against the risk that the insurer's actual risk pool is more disabled than had been estimated in establishing the premiums.
Until recently, the general attitude in the insurance industry has been that reinsurance, whether provided by government or privately, is not a major consideration in their decision to enter the long-term market.
Because the insurance specifications, marketing, and claims administration tend to be structured narrowly, the need for reinsurance has been perceived to be small.
If insurance specifications and other factors were broadened, reinsurance might become more of an issue. For example, if insurers were to offer policies which pay for specified services regardless of cost, or offer policies with minimal health status screening, the need for reinsurance would be greater. In fact, even with the indemnity (fixed benefit) products, interest in reinsurance is now emerging as a way to overcome insurer hesitancy about rapid market expansion.
With the growing recognition among consumers about the risk of long-term care and the availability of insurance to protect against that risk, sales are occurring at a more rapid rate than had been anticipated for some insurers, often exceeding target sales goals. This has caused slowing of sales efforts to guard against overextending the business beyond manageable company limits. Reinsurance may be a way to reduce such limits to market expansion.
3. Social Health Maintenance organizations and Other Capitated Mechanisms
Definition
A social health maintenance organization (SHMO) is a managed system of health and long-term care services. A single provider entity assumes responsibility for a full range of acute inpatient, ambulatory, rehabilitative, extended care, home health, and personal care services, under a fixed budget that is prospectively determined. In short, a SHMO extends the customary health maintenance organization (HMO) concept to cover long-term care services.
The Current Experience and Research Findings
At present, SHMOs are very much in their infancy. In the early 1980s, the Health Care Financing Administration (HCFA) and private foundations sponsored a project at Brandeis University to develop the SHMO concept. This planning activity led to initiation of demonstration projects at four sites. The projects, which began operations in March 1985, are phasing in enrollment and will gradually absorb more risk over a three and one-half year period.
The SHMO demonstrations include a number of innovative features:
-
Voluntary enrollment will include a broad cross-section of the elderly population. Development of waiting lists for certain types of persons (queuing) may be necessary to prevent adverse selection.
-
Pooled financing comes from Medicare, Medicaid, and private sources.
-
Medicaid recipients, including those at risk of institutionalization, are included in the project.
-
Health and social services are consolidated under central case management in a single delivery system.
-
All types of services, including long-term care services, are provided to beneficiaries within capitated rates. Long-term care services are available, however, only up to specific limits.
The four sites now in operation were selected to represent different organizational possibilities:
-
Kaiser-Portland Health Plan, Oregon (Medicare Plus II): an established HMO that will develop and/or contract for long-term and community care services.
-
Metropolitan Jewish Geriatric Center, Brooklyn, New York (Elderplan): a community-based long-term care agency contracting with a newly formed gerontological medical group and community hospitals for medical services.
-
Ebenezer Society-Group Health Plan, Minneapolis, Minnesota (Seniors Plus): a long-term care agency in partnership with an established HMO for medical services.
-
Senior Care Action Network, Long Beach, California (SCAN Health Plan): a community case management brokerage agency that contracts with a large group practice and a community hospital.
The four demonstration projects, while differing in organizational arrangements, are similar in overall design, including such major elements as benefit packages, financing arrangements, enrollment procedures, and so forth. Major common elements are as follows:
Benefit package--The benefit package used in the demonstration includes the total Medicare benefit package, plus additional long-term care and other supplemental benefits. The long-term care benefits include additional skilled nursing facility care or equivalent intermediate care facility services; in-home support services, such as homemaker, personal health aide, medical transportation, medical day treatment, or respite care; and coordination of other services such as additional transportation needs. Each site covers a different package of these long-term care services. Copayments are required, and benefits are subject to annual dollar maximums which range from $5,000 to $12,000.
Financing--Reimbursement from Medicare (for all enrollees), Medicaid (for eligibles), and private enrollees (for non-Medicaid eligibles) will be pooled by the SHMOs. Medicare pays SHMOs according to the cost of Medicare services if purchased from fee-for-service providers. Medicaid financing arrangements vary in each State. Private enrollee payments will be made through monthly premiums in the $29 to $40 range.
Risk sharing--The SHMO model is a major departure from previous HMO experience, and consequently there is insufficient data (e.g., about costs, selection risk, and provider performance) to support reliable initial cost estimates. HCFA and the States involved have therefore agreed to share in the risk during the first two years of the demonstration. Only in the third year will all sites be-at full risk.
Enrollment--Ideally, enrollment would be on a first-come, first-served basis. However, older persons with current chronic care needs may be disproportionately attracted to the plans. To avoid this problem, the demonstrations sites are permitted to queue applicants based on their level of functional disability and/or personal care needs. Plans will serve high-risk applicants; the queuing procedure is intended to permit each plan to enroll a membership with a distribution of expected chronic care needs comparable to that of the entire population in the local area.
Legal authority and waiver of program requirements--The demonstrations were mandated by Section 2355 of the Deficit Reduction Act of 1984. They are conducted under authority of various demonstration provisions of the Social Security Act. Operation of the demonstrations requires waiver of various legal and regulatory requirements of Medicare and Medicaid. Waived requirements relate to reimbursement methods; coverage limitations; statewide availability of services for Medicaid eligibles; comparability of amount, duration, and scope of services for Medicaid eligibles; free choice of providers; and composition of enrollment in HMOs.
Appraisal of HCFA Demonstrations--SHMOs are far from being a regular part of the Medicare and Medicaid programs. They are still highly experimental, and they can only be operated at all by explicit statutory waivers of a large number of existing program requirements. An independent evaluation is being conducted by the University of California at San Francisco, but the final report is not scheduled to be available until the spring of 1990.
Strengths of the SHMO Mechanism
-
Within the same organization, a SHMO includes acute and long-term care services, and case management applicable to both. This arrangement permits a unified approach to delivery of care and gives enrollees one place to go to obtain services that are otherwise delivered in a fragmented fashion and that may be difficult for individuals with multiple needs to arrange. Case management helps to insure access to appropriate services and controls inappropriate utilization.
-
A SHMO provides an insurance mechanism for long-term care, pooling risk among plan members.
-
SHMOs combine financing from various sources, including private financing in the form of copayments and premiums charged to non-Medicaid eligibles.
-
Prepaid financing gives SHMOs strong incentives for cost-effective service delivery.
Weaknesses of the SHMO Mechanism
-
In the present demonstrations, coverage of long-term care services is quite limited; the protection falls far short of catastrophic and does not necessarily compare favorably with that afforded by other mechanisms. It remains to be seen whether SHMOs will be able to adequately manage the risks involved to make it possible and attractive to offer more extensive long-term care benefits.
-
The service-delivery arrangements involved in a SHMO are very complex. Combining providers of both acute and long-term services generally requires coordination of organizations that are likely to be quite different. Any such arrangement takes time and resources to develop; widespread diffusion of SHMOs should not be expected to be quick, even in the best circumstances.
-
It is unclear whether SHMOs can be developed without some, perhaps considerable, government sponsorship and without considerable revision of Medicare and Medicaid law.
-
Because SHMOs, like HMOs, involve terminating relationships with providers that may be of long standing, it can be expected that SHMOs suffer somewhat by comparison to other mechanisms that do not require changes in providers.
Assessment
-
General feasibility and practicality
Attractiveness and marketability -- SHMOs appear able to provide financial protection in a manner that should be attractive to the elderly, but the actual level of enthusiasm for SHMOs is still under test. The on-going demonstrations have been slow in meeting enrollment targets, but the reasons for this interim outcome are not yet clear.
SHMOs appear to have the potential of reaching a large target population. A rapidly-growing fraction of the elderly are in HMOs, and this group should provide a natural market for SHMOs should they become widely available.
The financial protection for long-term care expenses offered by the demonstration SHMOs is distinctly limited. Unless such limits can be increased, the relatively shallow coverage for chronic care needs may put SHMOs at somewhat of a disadvantage in the market, compared, for example, to private long-term care insurance. On the other hand, case management should make them effective gate-keepers for home health services.
Flexibility -- SHMOs have considerable flexibility to tailor services to the needs of individual enrollees. On the other hand, they offer little flexibility in response to individual financial circumstances. At least in the demonstration model, SHMOs provide consumers with little choice of service delivery modes or location.
Administrative ease -- SHMOs are not easy or quick to set up. While future SHMOS may require substantially less lead time than was necessary for the demonstrations, they still require thorough planning and development of an extensive set of arrangements with various providers.
As with any provider, quality of care must be a particular concern, and care must be taken to be sure adequate devices for insuring quality and appropriate access are in place.
-
Contains public expenditures
As long as public programs do not bear the cost of more extensive service packages than would otherwise be offered, SHMOs should not increase public expenditures. In fact, the case management function should help insure that expensive levels of care for chronic conditions are used only when appropriate, which may help reduce public expenditures by comparison with what they would be in the absence of SHMOs.
-
Improves quality of life and dignity of the individual
SHMOs should be effective at maintaining and improving the quality of life of enrollees, though continued attention will be needed to insuring quality of care.
-
Strengthens the family unit
SHMOs, because of the flexibility of their chronic care service package, can tailor services to support family caregiving, thus helping to keep the elderly at home.
-
Ensures system-wide efficiency and effectiveness
SHMOs have substantial potential for helping promote system-wide efficiency. Case management, a capitated approach, and the extensive nature of the service package should mean that decisions about appropriate services will be made in a comprehensive, coordinated, and efficient fashion.
SHMOs mesh well with Medicare, Medicaid, and the acute care financing system in general.
Related Capitated Mechanisms
It is worth noting that SHMOs are only one way of utilizing prepaid capitated case management mechanisms for long-term care services. In addition to continuing care retirement communities (discussed in the next section), ordinary HMOs may be vehicles for expanded coverage of chronic illness.
As a result of the Tax Equity and Fiscal Responsibility Act (TEFRA) of 1982, Medicare regulations were changed to allow HMOs to provide prospective reimbursement on a capitated, at-risk basis for services to Medicare beneficiaries. This change has encouraged an increasing number of HMOs to market their care packages to Medicare beneficiaries (Iverson and Polich, 1985). As of December 1985, about 710,000 Medicare enrollees were members of HMOs, including both risk-based contracts and cost-based contracts (Iverson and Polich, 1985).
TEFRA regulations require that if the HMO can provide the Medicare acute care service package at lower cost than their capitated reimbursement, the HMO must use any surplus for extra services or to lower premiums. Either lower premiums or increased services can be viewed as possible incentives for HMOs to consider adding long-term care benefits to their package. Lower premiums could free up resources for purchasing long-term care insurance or other protection, and any added services could be those that address chronic illness. One HMO that plans to offer long-term care insurance to members on a test basis is the Group Health Cooperative of Puget Sound (described in the preceding section on long-term care insurance).
The limitation on this approach is that, in many cases, savings on acute care may not be sufficient to provide more than modest increments of long-term care. Further, there is concern that HMOs may not find this policy attractive, since offering expanded long-term care services may attract a disproportionate number of applicants with high needs for acute care.
As a separate matter, HMOs could also offer group long-term care insurance to their members, by establishing arrangements with insurance companies. One advantage is that such insurance would escape many Federal and State regulatory requirements on HMOs, some of which might interfere with management of the risks faced by HMOs offering chronic care benefits (e.g., HMOs must be open to all applicants regardless of medical condition, but separate insurance can be restricted to individuals meeting medical standards, such as pre-existing condition exclusions).
Further, HMO enrollees may present insurance companies with appropriate groups of potential customers, allowing long-term care insurance to be offered at favorable rates. This approach might also be favorably viewed by insurance companies because HMOs' role as case managers may make them effective partners in controlling induced demand.
4. Continuing Care Retirement Communities
Definition
The continuing care retirement community (CCRC) is a financially self-sufficient residential community for the elderly that offers medical and nursing services in specialized facilities that are typically on the premises. Its distinguishing feature -- and the basis of its existence and operations -- is a lifetime contract between the community and each resident that defines each party's financial and service obligations. The resident pays a lump sum accommodation feel prior to occupancy and a monthly fee thereafter (Cohen, 1980).
As described by Rose (1983), the CCRC generally consists of three components:
-
Housing units specifically designed for the elderly to permit them to live independently, with features such as guardrails and emergency call systems to help the resident cope with functional disabilities and frailty but without the "institutional" atmosphere characteristic of the old-fashioned "home for the aged."
-
Dining facilities and auditorium, arts-and-crafts room, game room, library, beauty and barber shop, etc. Typically, residents contract to take at least one meal per day in the dining center and unplanned absence triggers a check to make sure the resident is all right, one of the various low-key protective service features of CCRC living.
-
A care center encompassing a clinic to meet routine health needs and inpatient facilities (usually encompassing skilled and intermediate level nursing home care and non-medical personal care).
Seen slightly differently, Curran (1983) has defined the CCRC as an "amalgam of four businesses":
- A hotel, offering apartment rental, utilities, food and maid service
- A health care facility that provides skilled or custodial nursing services
- A social club
- An insurance underwriter
Current Experience and Research Findings
Background. The number of continuing care retirement communities in existence is relatively small, with estimates ranging from 300-600 communities housing approximately 100,000 residents (Glenn, 1984) to 1100 communities housing approximately 200,000 residents (Los Angeles Times, 1986). However, the industry is undergoing rapid growth, with an optimistic potential by 1990 estimated to be up to 1,500 more communities, housing a total of 2 percent of the elderly population (more than 500,000 persons) (Williams, 1984; Rose, 1984).
All but a very small percentage are sponsored by nonprofit entities, although approximately one-third of the non-profits are managed under contract by for-profit contract managers (Williams, 1984). In 1983, the average CCRC held 286 residents and had capacity for 59 nursing home beds (Rose, 1984).
Residents of CCRCs on average are 78 years of age at entry. Virtually all CCRCs require that entrants be functionally independent and in relatively good health. Because the entrance fee and monthly service fees are substantial, CCRCs have attracted the middle-class almost exclusively, often former professionals with solid pension incomes.
Specifically, entrance fees range from $15,000 to $175,000--depending, in part, on the size of the residential unit and the extent of the service guarantee--while monthly service fees range from $300 to $2,000 or more (Topolnicki, 1985; Winklevoss and Powell, 1984). However, approaches are being studied to make lifecare arrangements feasible for persons with fewer resources, e.g., the Brandeis "Life-Care at Home" project described earlier in Section 2, Freestanding Long-Term Care Insurance.
Typically, the contract between the CCRC and the resident has provided that upon the death of the resident the entrance fee will vest in the community, regardless of the value of services received. However, an increasing number of CCRCs are offering contracts under which fees may be totally or partially refundable to the resident who leaves or to heirs upon the resident's death. In addition, developers are now experimenting with new types of arrangements, including condominiums and membership plans.
Services. Ordinarily, one of the requirements for admission to a CCRC is that the resident be covered by Medicare and own a medigap insurance policy. Thus, payment for acute care services usually is provided by Medicare and private health insurers (Lane, 1986).
As a consequence nursing hone care is the key service added and guaranteed as part of the basic CCRC arrangement. Typically, CCRC contracts stipulate that residents can move to the nursing or personal care units without an increase in monthly fees.
However, a significant number of CCRCs -- especially the newer ones -- do not guarantee nursing home care for "as long as necessary" within the same fixed monthly fee that all residents pay. Rather, they guarantee care at the monthly rate for a short period of time (10 to 180 days) after which only access to nursing home care is guaranteed. There is an extra charge for the care itself and charges may be increased at any time.
Nearly half of all nursing facilities in CCRCs are Medicaid-certified. Although those CCRCs that guarantee nursing care typically will pay the costs of those who can no longer afford the monthly fee out of a charitable pool, the facilities that only guarantee access to nursing care at extra cost tend to expect those who can no longer afford the extra nursing care charges to apply for Medicaid.
Most CCRCs have their own nursing home facilities within the community. About three-quarters will also admit individuals from outside the CCRC directly into the nursing home, most often on the same paying basis as any other nursing home (Winklevoss and Powell, 1984). A relatively recent but growing variant of the CCRC concept is one in which the CCRC contracts with outside facilities to provide nursing home care to those CCRC members who require it.
Some CCRCs contract with private insurance companies to insure or re-insure the nursing home care required by residents, whether provided in the CCRC's own facilities or in outside nursing homes. This can also be combined with added financial Protection for acute care services. For example, both Metropolitan Life Assurance and Johnson and Higgins in partnership with Provident Life and Accident Insurance are marketing combined "medigap" and long-term care insurance policies to CCRCs. The policy premiums are factored into the CCRC's monthly fee structure.
A few CCRCs contract with health maintenance organizations to provide acute health care services. One CCRC has its long-term care services being provided by an HMO on an experimental basis. So far, the long-term care services being offered are quite limited.
CCRC residents live longer (up to 20 percent longer) and use fewer acute health care services than their peers (Williams, 1984). Also, CCRC residents exhibit higher nursing home admission rates but shorter lengths-of-stay than the general Medicare population. However, it is not certain that these improved outcomes are due to CCRC residence. In part, they may be due to the fact that individuals of higher socioeconomic status (like CCRC residents) tend to have longer and healthier lives than others.
Financing. Many of the early CCRCs offered guaranteed total health care for life to their residents and were known as "life care communities." Due to inflation and high interest rates and poor actuarial estimates, the costs of providing such guaranteed health care greatly exceeded revenues and reserves in a number of such communities and financial problems and bankruptcies resulted.
Although the term "life care community" is still frequently used interchangeably with that of "continuing care retirement communities." the newer CCRCs guarantee a more limited range of health services within the terms of the basic lifetime contract; additional services are billed separately. Table 3-3 (Winklevoss and Powell, 1984) shows the percentage of CCRCs offering various types of services covered under basic fees.
The most common errors in setting up and managing CCRCs include: 1) misjudging number of deaths and transfers to the nursing facility that will occur among residents; 2) failing to maintain reserves adequate enough to cover such misjudgments plus other contingencies such as inflation; and, 3) hesitancy in raising monthly fees to make up for earlier miscalculations (Williams, 1984:3).
To address these and related problems, the American Association of Homes for the Aging (AAHA) (which represents the non-profit CCRC sector) is well into development of a rigorous accreditation process for CCRCs. AAHA is developing quality standards, guidelines for actuarial planning and marketing and feasibility studies, and accreditation programs to safeguard the financial soundness and reputation for quality of the continuing care industry. The process is expected to be adopted by late 1986.
Governmental Activities. Federal legislation has been proposed to define life care centers as well as to provide guidance to the contracts for lifecare. In October 1985, the Real Estate Financing Bill (H.R. 2475) was passed and included provisions which clarified that refundable entrance fees of up to $90,000 were exempt from taxation. In other developments, the pending reauthorization bill for the Federal Trade Commission contains provisions which call for a two-year study of CCRC marketing and contracting practices.
While Federal legislation remains at the proposal stage, about 14 to 16 States have developed lifecare legislation. In general, the definitions of life care centers vary by State. Most but not all of the definitions specify that a residence will be provided; they also specify the age group, and emphasize the need to establish contracts between the communities and their residents.
The agency responsible for implementing lifecare legislation also varies according to the State, although the State Insurance Commission is responsible in most States. In other States, the responsible organizational component may be the Department of Social or Human Resources or the State Office on Aging. Life care centers in Minnesota are regulated under the securities legislation and no particular implementing agency is identified. None of the States with lifecare legislation have identified their Departments of Health as regulatory agencies for life care communities.
Generally, State life care center legislation requires financial disclosure. Arizona also has a recovery clause for life care centers to insure client protection.
The role of State and local health planning agencies in life care communities also varies and is not limited to States with specific life care legislation. Some States have identified specific review requirements for nursing home beds to be built in life care communities, while in others, agencies have developed specific plan development sections covering nursing facilities in life care center (Health Resources and Services Administration, 1986).
Strengths of the CCRC Mechanism
-
Traditional CCRCs are based on the philosophy that maintaining the independence of residents is critical to their well-being. This philosophy, together with the fact that the CCRC is responsible for providing the resident with most or all of the health care needed, create incentives to provide the lowest cost care possible, in the least restrictive environment.
-
Those CCRCS which have a full range of health services and nursing home care available provide an opportunity for one provider to manage the resident's care in the most efficient, least costly manner.
-
Research indicates that CCRC residents live longer and use fewer acute health care services than their peers (Williams, 1984). Studies also indicate that older persons residing in congregate settings (such as a CCRC), which allow them independence and control over their lives, experience a greater sense of well-being and better health than persons living in more restricted settings (Noelker and Harel, 1978). This may be attributable to the benefits of a congregate setting, to initial socioeconomic differences between residents and non-residents, or to the initial selection factors of the CCRC. The frequent social interaction and friendships which evolve in these situations also have been linked to higher self-esteem and better mental health as well as improved health status (Carp, 1977; Fillenbaum, 1986).
One study specifically of lifecare communities (Fillenbaum, 1986) found that lifecare residents had higher functional independence and greater capacity for self-care than persons with comparable health status living in the general community.
-
In financially stable CCRCs which offer a broad range of health care services, health care costs are more predictable, relieving a source of substantial anxiety and stress for most families. Further, assets beyond the entrance and monthly service fees are protected.
-
Elderly residents are freed from the many responsibilities of maintaining a home and their families are largely relieved of the burden of direct care-giving and brokering the provision of formal care services.
-
When nursing home care is located on campus, the trauma and resulting increased morbidity and mortality often associated with relocation from home to unfamiliar surroundings is lessened.
-
The CCRC may provide those elderly who have weak family supports (e.g., the never-married or childless widows and widowers) with "surrogate families" they would not have developed in a less structured environment.
Weaknesses of the CCRC Mechanism
-
CCRCs appeal only to older persons who find an age-segregated, congregate living environment to their taste.
-
Most CCRCs are currently affordable only to middle and upper income elderly. ICF, Inc. (1984) has estimated that only 10-20 percent of older persons can afford CCRC residence. While the Robert Wood Johnson Foundation has funded researchers at Brandeis University to work on CCRC models that would be affordable to a broader spectrum of elderly, these are in the conceptual stage of development.
-
It is difficult for the average consumer to assess the long-term financial stability of a CCRC that he/she may be considering. Residents in facilities that encounter financial difficulties may face higher fees or in extreme cases, may lose their entire investment. The AAHAIS effort to establish accreditation standards may help provide consumers with an initial screen. Also, the trend of CCRC sponsors to be more conservative in what they promise to provide residents should reduce the incidence of financially troubled CCRCs.
- CCRCs that do not promise nursing home care within the fixed monthly fee no longer have the same strong economic incentives to substitute lower cost services whenever possible. Indeed, the limited arrangements may create incentives for the sponsor to fill beds in the nursing home facility at extra charge which also frees up residential space for new members who contribute new entry fees. Similarly, in limited care arrangements, the sponsor is likely to try to maximize use of Medicare or other insurance covered services such as hospital care in order to minimize use of CCRC covered care.
Assessment
-
Feasibility and Practicality. CCRCs are already in place and serving a population of approximately 100,000 to 200,000 elderly persons. As indicated in the discussion, the population that enters a CCRC has: a) liquid assets of at least $15,000, usually more; b) substantial pensions or assets providing annuities which provide a source of monthly payments; and, c) a desire to live in an age-segregated, congregate residential setting. The last characteristic will always limit the appeal of this option to some degree.
The entry fee requirement could be met by many elderly if they were willing to sell their houses. Meeting the monthly payments, however, presents the greater practical hurdle, although future generations of older persons, on average, are expected to have better pensions than the present generation.
Finally, sponsorship of CCRC arrangements is constrained by the large capital investment required. To date, non-profit CCRCs have had difficulty in securing attractive loans. Bond offerings have been used, but the principal source of capital is the initial entrance payment from prospective residents. The marketing effort required is time-consuming, sometimes taking several years before the accumulation of capital is sufficient to initiate construction.
-
Improvement of Quality of Life and Dignity of the Individual. Traditionally, CCRC sponsors have been committed philosophically to the principal of maintaining maximum independence for the older person, which has been shown to foster good mental and physical health. A CCRC arrangement may also alleviate anxiety among residents and families which often comes from the unpredictability of health care costs and having to move to unfamiliar surroundings when illness strikes. The sense of financial security experienced by residents probably varies by sponsor; but the risks of the "self-insured" arrangement should be carefully evaluated before signing a contract.
-
Strengthening of the Family Unit. The impact of CCRCs on intergenerational relationships is unclear. The CCRC may lessen feelings of responsibility among adult children; but it also may reduce stress significantly, thereby freeing both generations to develop and strengthen the emotional bond between them.
-
Assuring System-wide Efficiency. In theory at least, the CCRC arrangement integrates the provision of acute and long-term care. To the degree that philosophical commitment to maximizing independence among residents is carried out in care provision and to the extent that informal support networks which develop serve to augment formal care provision, less intensive and expensive care should be substituted for the more intense and costly kind wherever that is beneficial for the elderly resident.
-
Provision of Financial Security. As indicated above, for residents whose confidence in the financial and managerial acumen of those who manage their community is justified, the financial security provided may be high.
-
Containment of Public Expenditures. The extent to which CCRC arrangements do or could lessen public expenditures is an empirical question yet to be addressed in rigorous fashion. As mentioned earlier, nursing home lengths-of-stay as of 1984 were shorter for CCRC residents than for the Medicare population as a whole; however, the number of admissions was higher, perhaps offsetting any savings from reduced length-of-stay. The pattern of utilization of hospital care is uncertain.
As for Medicaid, it is entirely unknown whether existing CCRC residents would have, if they remained outside of a CCRC, spent-down to Medicaid eligibility or divested their assets in order to qualify for coverage of their long-term nursing home stays.
Even if CCRC residents do become eligible for Medicaid, however, whatever income they do have still is applied toward expenses and Medicaid only picks up the difference between income and charges. The monthly income of a typical resident is likely to be high enough to cover most of the Medicaid charge. Thus, savings to Medicaid are likely to be quite small. If a way is found to make a life-care arrangement feasible for persons with fewer resources, as is being studied in the Brandeis "Life-Care at Home" project mentioned earlier, savings to Medicaid may be considerably greater.
Potential Government Actions to Promote the CCRC Option
Actions that the Federal Government might take to promote consideration of this financing option include funding rigorous research on the health impacts of CCRCs, specifically including those on health status, health care utilization and on subsequent cost implications for Medicaid and Medicare. Along these lines, the Health Care Financing Administration is currently sponsoring a large-scale, three year evaluation of CCRCs, involving 20 CCRCs in four States. CCRC residents will be compared to elderly residents living in the community at large with respect to quality of life and health, service costs, and utilization.
There are a number of other research and survey questions which could be usefully explored, including:
-
Who manages the care of CCRC residents and what are the respective roles of the CCRC medical director and the resident's personal physician?
-
Does the greater number of nursing home admissions more than counterbalance any savings in length of stay?
-
Are Medicare savings on nursing home stays realized or would Medicare benefits typically have "run out" by the time patients are discharged anyway?
-
How much spend-down to Medicaid eligibility would have occurred among CCRC residents if they had not been in the CCRC? and
-
To what extent would the income of residents cover nursing home charges to Medicaid, should they become eligible?
The Federal Government also could encourage further development and experimentation with variations of the traditional CCRC arrangement which would make this pooled risk arrangement affordable for a larger population, preferably in partnerships with States or the private sector.
Finally, if there is to be a substantial expansion of CCRCs of any variety, States which restrict the addition of nursing home bed capacity through "certificate of need" legislation or moratoria would need to re-examine these restrictions, with a view toward removing undesirable regulatory barriers.
Relationship of Private Financing Alternatives to Current Systems
Public Programs. As discussed earlier, CCRCs interface well with public programs and appear to neither increase nor decrease public expenditures to a substantial extent.
Private Insurers and the Financial Sector. Most CCRCs, in effect, self-insure. Some have formal contracts with nursing homes and hospitals to admit and provide care for their residents, but even here it appears that the CCRCs assume all liability risks and simply reimburse the contractor on a fee-for-service basis. This could change, however, as major health insurance companies begin to tap the potential of the group market that CCRCs represent, particularly for long-term care insurance. Because most CCRCs require entrants to have medigap coverage, CCRCs probably already function to spur demand for this product, although the current number of CCRC residents is too small to have a major impact on demand.
As indicated earlier, CCRCs typically are capitalized through the sale of memberships and the sale of bonds. In the past, sponsors have been not for-profit entities which have attracted few investors. Within the past three or four years, however, for-profit CCRCs have emerged in pursuit of both profit and tax benefits from real estate depreciation (Williams, 1984:2). Two of the most recent major entrants, ARA and Marriott, are principally food and hotel service providers.
-
Providers of Long-Term Care. To the extent that new CCRCs contract out for nursing home services rather than build their own, existing nursing homes can be expected to welcome the resulting increased demand for their beds.
-
For Profit Enterprises. Any fast-paced expansion of the CCRC industry is likely to come from for-profit enterprises with internal capital availability. Non-profit entities, which must raise capital in more expensive and time-consuming ways, are likely to lose some of their market share. Given extensive waiting lists typical of the more established CCRCs, older CCRCs are unlikely to be hurt by the increased presence of more for-profit providers in the near-term; however, non-profit ventures now operating at less than full capacity may be.
Many non-profit sponsors are opposed to the entrance of for-profit sponsors into the field, believing that the profit- maximizing motive presents too many threats to quality of service. This belief, and the "threat" presented by for-profit entry into the field, have provided additional impetus for the efforts of the AARA to establish a private accreditation process.
-
Consumer and Out-of-Pocket Costs. Under a traditional CCRC arrangement, care costs are largely predictable. This is an important part of their attractiveness to consumers. Costs, of course, are the most predictable in those CCRCs which charge the same monthly fee regardless of whether the resident occupies an apartment unit or a nursing home bed.
An increase in monthly payments over the long-haul is an unpredictable feature of virtually all CCRCs. Most sponsors do guarantee continued residence to residents even if, at some future point, the monthly charge exceeds their income. Often a voluntary “charity” fund is established by residents to cover this exigency.
The resident's responsibility for deductibles and co-insurance is clear if enrollees are well-informed about the Medicare program changes and their private insurance policy provisions. The level of responsibility (total out-of-pocket costs), however, may depend on how well the CCRC operators manage the residents' total cars.
Definition
Home equity conversion (HEC) mechanisms allow a homeowner to convert the equity in a home into cash, without having to move or rake immediate repayment. HEC plans differ from home equity loans, which require the homeowner to begin repayment immediately.
The Current Experience and Research Findings
Most older homeowners have little or no debt outstanding against their homes. The equity held is usually the homeowners most important financial asset, yet it may be difficult to use without having to sell and move. HEC plans allow older persons to tap their home equity for income to meet everyday living expenses or for any other purpose.
In theory, the potential impact of HEC for improving the economic well-being of older homeowners is substantial:
-
Of the 17.9 million households headed by older persons in 1984, 75 percent were owners (13.4 million households). Of these older homeowners, in 1983 about 83 percent (11.1 million households) owned their homes free of debt (AARP and AOA, 1985).
-
Among the elderly poor, three out of five households were owner occupied.
-
Home equity accounts for 70 percent of the total assets held by elderly homeowners. The average home equity for persons age 65 and older was $54,700 in 1984 (U.S. Census Bureau, 1986).
-
The aggregate net home equity held by the elderly is approximately $700 billion.
The first entrants into the home equity market were savings and loan associations, led by Deering Savings and Loan of Portland, Maine, in 1961. Although other savings and loan institutions and several banks followed suit, the programs declined in the late 1970s. High interest rates were one major factor. Through the 1970s, it is estimated that about 40 pilot programs were tried, most of which have now failed.
The most successful current effort is thought to be that of the American Homestead Mortgage Corporation, a mortgage bank first licensed in the State of New Jersey and now operating in six States. American Homestead has invested an estimated $50 million in six States and has about 450 HEC mortgages.
Although it is very difficult to get accurate figures, analysts indicate that less than 1,000 bank or mortgage company financed HEC mortgages exist in the United States at the present time.
Major Types of HEC Options
Reverse mortgages are the most commonly used type of HEC mechanism and are of two types, fixed term and open term.
Fixed term reverse mortgages provide a series of monthly loan advances to a homeowner, with repayment of all interest and principal deferred until some agreed upon future time (usually 5 to 10 years). The prospective borrower is deemed creditworthy based on the amount of home equity held rather than on income earned.
Under fixed term loan arrangements, monthly loan advances reflect the borrower's equity, but usually do not cover more than 80 percent of the home's value. Interest accrues slowly in the early years, then more rapidly in the later years, which is the opposite of conventional home mortgages. Fixed term reverse mortgages are not appropriate for most Persons who wish to remain in their homes indefinitely, since the homeowner rust repay-the loan or move at the end of the loan period. However, they are potentially ideal for the more elderly cohort who would not expect to stay in their homes longer than the fixed term.
An open-term reverse mortgage was introduced in the early 1980s by the American Homestead Mortgage Corporation mentioned earlier. Known as the Century Plan, or IRMAs (Individual Retirement Mortgage Accounts), the open-term reverse mortgage loan pays monthly cash advances similar to a fixed term mortgage. However, the borrower receives these advances every month until he or she dies, reaches age 100 or moves. There is no obligation to make any repayments as long as the borrower is alive and living in the house.
Under the Century Plan open-term reverse mortgage, two types of interest are charged: the first type "fixed interest" is interest in the conventional sense and is charged on the monthly payment and added to the outstanding loan balance. As of August of 1986, the fixed interest rate being charged was 11.5 percent.
In addition, at the time of the loan's initiation, the borrower agrees to pay "additional interest" equal to a percentage of appreciation in the home's value at the time of repayment. This percentage is equal to the percentage of equity which the homeowner decides to borrow against, i.e., if the reverse mortgage is against 80 percent of the home's value, then 80 percent of the accrued appreciation is the "additional interest" due the lender at repayment. This percentage rate cannot be determined at the time the loan is initiated, but can only be calculated when the home is resold.
If the home has decreased in value or the amount of repayments collected is higher than the value of the house at the time of death, the borrower's estate is required to repay up to 94 percent of the sale price of the house. The Century Plan is described further in the analysis section which follows.
Sale Plans. Another HEC mechanism involves selling the home while retaining occupancy rights. There are two basic forms of sale plans: sale leasebacks and life estates.
In a sale leaseback, the homeowner sells the home to an investor who immediately leases it back to the seller for life. In effect, the seller becomes a renter in the home he or she just sold. The investor can be an individual, a limited partnership or an institution.
The sale leaseback contract spells out all the rights and responsibilities of each party. Typically the new owner takes over all expenses such taxes, repairs, and insurance. The seller gets a down payment plus regular monthly payments through a land contract or deed of trust.
Sale leasebacks involve complex legal and financial arrangements: the key contract provisions are inter-related and open to negotiation; and the long-range costs and benefits of specific transactions are difficult to gauge because of the inherent uncertainty of the homeowner's life expectancy and future repair costs, property tax increases, inflation and property appreciation.
Two-party sale leasebacks have been made on an ad hoc basis for years, especially within families. There is a sale leaseback guide and model documents package for buyers, sellers, and attorneys who wish to negotiate such transactions (see Appendix 3). In the past, many of these transactions were designed to gain tax advantages for a family member-buyer. More recently, however, the IRS has removed some of the tax incentive by requiring that the purchase price paid by the buyer and the rent paid by the seller be a fair market value.
A life estate plan preserves the seller's total ownership rights until death, at which time the home becomes the property of the buying party, which purchased a "remainder interest." This division of ownership rights into two parts is sometimes termed a "split equity" arrangement.
The first and largest plan of this type was developed in Buffalo in the early 1980s as an effort to conserve housing and preserve older neighborhoods. The city incorporated a nonprofit entity called Home Equity Living Plans (HELP) to establish a life estate sale plan program for elderly citizens. It was initially financed through $1.3 million in HUD block grants.
Under the program, the homeowner sells his house to the city. In return, the homeowner receives immediate rehabilitation of the property, a lifetime maintenance contract, payment of all property taxes and either a monthly cash annuity for life or a one-time, lump sum cash payment. Through 1985, the Buffalo HELP program had undertaken about 650 contracts, although it reportedly is no longer accepting new contracts.
Special Purpose Loans. Older homeowners frequently cannot afford the cost of maintaining their homes so that they are safe and comfortable, and are often reluctant to borrow money for these purposes because of an inability to repay installment loans from current income. States have found special purpose loan programs a means for helping the elderly overcome this difficulty. Such programs provide older homeowners with home equity loans that do not have to be repaid until the borrower dies or sells the home.
The proceeds from special loans rust be used for the special purposes designated by the State, such as weatherization or modifications to the house (e.g., ramps, elevators) that make it possible for the older person to continue to live there. A number of local housing agencies have used them effectively and there is a State-financed program in Wisconsin which targets low-income, older homeowners in specific neighborhoods.
In general, special purpose loan programs are administratively simple and can be efficiently delivered through existing loan channels. However, since these programs are designed to cover a "special-purpose" need, the loans made are usually for more modest amounts than other programs.
A variation of the special loan program used in many States establishes home equity payment accounts for older homeowners. In these programs, home equity is used to pay for regular, periodic expenses such as property taxes. The cost of these expenses is charged to an account; while the charges plus interest may be paid at any time, they are not due until the homeowner dies or sells the home.
At present there are programs for tax deferral in the following States: Alaska, California, Colorado, Florida, Georgia, Illinois, Iowa, Massachusetts, New Hampshire, Oregon, Tennessee, Texas, Utah, Virginia, Washington, and Wisconsin. A similar plan of payment for in-home services has been operating for several years in Mushashino, a suburb of Tokyo.
How Reverse Annuity Mortgages Work
Reverse annuity mortgages are complex and intricate financial instruments for both consumers and lenders. The following examples illustrate some of the complexities, costs, benefits and risks of these instruments.
The San Francisco Development Fund. The San Francisco Development Fund assisted in arranging for home equity conversion loans through demonstration programs in the San Francisco area and several other locations. In all, 15 banks and savings and loans participated in the program.
Generally the lending institutions agreed to limit the loan origination fee to 1 percent and to loan up to 80 percent of the value of the house. The borrower had to pay the usual types of fees involved in closing a home loan including an appraisal fee, credit reports, title search, and recording fees.
The total closing costs on an $80,000 loan ($100,000 house) averaged $2,000-2,500, including the loan origination fee. These costs were paid up front at the time of closure. If the individual did not have the funds to pay them, they were made part of the loan.
Interest rates varied among the participating banks but were generally 1 percent below the market rate, although there was no assurance that below market rates would be charged in the future. Generally when interest rates rose above 14 percent (as they did in the 170s) borrowers did not find it advantageous to choose home equity conversion loans. The average loan under the program was paid off in 7 years. No penalty was assessed for early pay-off (Ralya, 1986).
The Century Plan. The Century Plan is an open term reverse mortgage offered by American Homestead Mortgage Corporation. The borrower is not obligated to make any loan repayments until he or she dies, moves or reaches age 100. Interest is charged on the monthly advances and added to the loan balance. The current interest rate is 11.5 percent and does not change during the loan term.
The borrower also agrees to pay "additional interest" at the end of the term equal to some percentage of any appreciation in the home's value during the term of the loan. The percentage of appreciation to be paid to the lender is equal to the percentage of home value a borrower chooses to convert to income.
In addition to the percentage of home equity and appreciation being committed, other factors that influence the amount of the monthly advance are the borrower's age, the fixed rate of interest, the number of borrowers (that is, sole or joint ownership), and the home's value. Monthly advances are fixed throughout the term of the loan; they do not increase or decrease. There is no loan origination fee charged. The borrower is responsible for the usual costs of closing a home loan such as an appraisal, recording fees, termite inspection, etc. These costs may be incorporated into the loan to avoid out of pocket expenses for the borrower.
When the loan term is over (i.e., in most cases, the house is sold), the total cost of the loan can be calculated. This is done by adding all of the fixed interest to all of the additional interest (appreciation) now owed by the borrower. The total amount of interest is then compared to the total amount of all monthly advances made to the home owner. The result is a "combined" interest rate - the annual rate that would have produced the total amount of interest (fixed and additional) now owed by the borrower. In other words, the "combined" interest rate blends the fixed interest and the additional interest into one overall annual percentage rate (APR).
The effective interest rate paid by the borrower depends on how long the borrower lives in the home, and how much the home increases in value during that time. Table 3-4 shows the combined interest rate at various appreciation rates for a 70 year old borrower on loan terms ranging from 3 to 24 years. In this table, it is assumed that the borrower converts 100 percent of home value (and thus appreciation).
Clearly, the combined rate is very high for loans repaid after a short term, even at moderates rates of appreciation. For example, a 70 year old borrower who repays the loan after three years in which the home value increases at 5 percent per year would pay a combined annual interest rate of 50.4 percent. (If the property appreciates at only 3 percent each year, the effective rate would still be very substantial - 38 percent per year).
The combined interest rate goes down as the term of the loan gets longer, and it is smaller when the appreciation rate is lower. The combined interest rate actually drops below the fixed interest in certain circumstances. Because the combined interest rate cannot be known in advance, borrowers can only evaluate the general pattern of costs.
The general pattern includes the following elements:
-
Short term loans are very expensive, except when there is virtually no increase in property value.
-
When the loan term equals the borrower's life expectancy and the annual average appreciation rate is 5 percent, the result is a combined interest rate which ranges from 13 percent to 16 percent depending on the age of the borrower.
-
When the loan term exceeds the borrower's life expectancy and the appreciation rate falls below 5 percent, the result is combined interest rate below conventional long-term, fixed-rate mortgage rates, and in some cases below any market rate of interest (National Center for Home Equity Conversion, 1984).
Analysis of the Potential of HEC Mechanisms
Annuities produced by home equity conversion plans are likely to pay out in increments over extended periods of time. Thus, home equity conversion plans are generally not suitable to pay for extended nursing home care directly, which averages $22-000 per year. The following discussion focuses therefore, on the potential of home equity conversion plans for the purchase of long-term care insurance or for the direct purchase of home care.
ICF's 1985 analysis concluded that amounts available from home equity conversion do not increase the income available to elderly households sufficiently to generate substantial increases in the percentages of elderly who could afford to purchase long-term care insurance. ICF assessed the potential marginal contribution of home equity conversion to the affordability of long-term care insurance. They first ascertained what percentage of elderly families could pay the premium for the model long-term care policy ($450 per person, per year, in 1980 dollars) with less than 10 percent, and then with less than 5 percent, of their current cash income. The ICF researchers then added the income derived from home equity and recalculated these percentages.
At best, under the four different reverse annuity mortgages plans ICF simulated, up to 3 percent more married couples could purchase long-term care insurance with less than 5 percent of their income, while up to 4 percent more single individuals could purchase long-term care insurance after home equity conversion. At best, under four different sale/leaseback plan options analyzed, up to 5 percent more married couples and up to 7 percent more singles could afford to purchase long-term care insurance with less than 5 percent of their income, following home equity conversion.
In contrast to the ICF analysis, Jacobs (1985) concluded, based on an earlier analysis (Jacobs and Weissert, 1984) that the potential impact of home equity conversion on the affordability of long-term care insurance was quite favorable.
Rather than focus, as ICF did, on only the marginal contribution of HECs, Jacobs suggests asking instead how many elderly homeowners could use some of their home equity payments to cover the insurance premium without having to spend any of their current cash income. This approach more realistically reflects how an elderly person might view affordability, although it probably overvalues the role of HECs for the financially better-off elderly. (In contrast ICF's analysis probably undervalues the potential usefulness of HECs for those who are less well off).
According to Jacobs and Weissert's analysis of the 1983 Annual Housing Survey data, using American Homestead's Century Plan as the model home equity conversion instrument, approximately 5.1 million homeowners could pay for long-term care insurance solely with their home equity payments without having to use other income. Counting spouses over age 64, the number of elderly people thus covered under long-term care insurance would come to approximately 7.2 million or 28 percent of the community resident population. Jacobs further notes that, of this group, 4.5 million would need to use less than one half of their home equity loan to pay for the model Long term care insurance plan (like ICF, Jacobs and Weissert use the existing Fireman's Fund policy as their prototype for purposes of simulation).
Since the older the homeowner, the higher the annual reverse mortgage payments would be, 54 percent of the elderly aged 75-79 and 74 percent of the elderly 80 or older would receive at least $2,000 from a home equity conversion instrument. Indeed, almost one third of the elderly 80 or older would receive $5,000 or more annually from such a plan.
Moreover, for the older cohorts, it would be possible to take out a fixed term loan for a fairly short period without any substantial probability that the owners would outlive their equity, further boosting payment rates. For example, for-low income singles over 75 (defined as persons with income less than 150 percent of the official poverty line), the median annual payment from a five year fixed term reverse mortgage would be $3,900.
This suggests the potential advantages of the elderly waiting until they actually have a high level of need for long-term care services before "cashing in" home equity and then using the income generated to pay directly for home based services as an alternative to institutional placement.
The question then becomes: would payment rates at these levels be sufficient to cover the direct costs of home care?
Preliminary analyses by Korbin Liu, Kenneth Manton, and Barbara Liu (1985) of out-of-pocket costs for home care currently being paid by disabled elderly living in the community indicate that, at current prices, these HEC payment levels would be sufficient to cover the costs of home care for large numbers of such disabled elderly, including many of those currently living in the community whose characteristics and care needs indicate high risk for nursing home entry.
Data show that among the disabled elderly living in the community paying for care, only 25 percent paid more than $135 per month out-of-pocket ($1,610 per year) for ADL assistance and only 10 percent paid more than $400 per month ($4800 per year). The median monthly cost of home care for persons with four ADLs (Activities of Daily Living) who were receiving all their care from paid providers was $183 monthly or $2096 annually. Nursing services are more expensive, but these are used by less than 25 percent of elderly disabled living in the community who pay for care and, of these private pay nursing services users, only 25 percent spent more than $400 monthly on these services.
In sum, while home equity payment alone would be unlikely to cover the cost of intensive home nursing services, the vast majority of elderly persons living in the community and currently paying for home care are using much less expensive personal care and homemaker chore services. These services probably could be financed in large measure by home equity conversion payments.
Strengths of Home Equity Conversion Mechanisms
-
HEC mechanisms provide a means for the elderly to meet some of their long-term care needs (or protect against the risk) by using what is for many their most valuable asset. Buying long-term care insurance or direct payment of home care needs are economically feasible with expected levels of HEC income.
-
HEC mechanisms provide a means for the elderly to preserve their independence, which survey after survey show to be a high-priority goal for significant numbers of older people.
-
HEC mechanisms provide additional housing alternatives for the elderly.
-
HEC mechanisms help protect neighborhoods from deterioration and urban decay.
Weaknesses of Home Equity Conversion Mechanisms
-
Elderly homeowners have complete discretion in the use of funds from HEC loans and may not be interested in purchasing long-term care services or insurance.
-
The "dissaving" plan characteristics of HEC mechanisms are not appealing to many elderly. Borrowing money conflicts with the fundamental beliefs and values of many in the current generation of elderly who were raised during the Depression era and taught to live frugally, save, and avoid debt. For many, the effect of disinheriting their heirs may make the mechanism especially unappealing.
-
Banks and other investors fear the potential for negative public relations in the event of foreclosure actions against elderly clients, as for instance, may be necessary when fixed-term reverse mortgages reach maturity but the elderly homeowner refuses to sell the home.
-
HEC contracts involve highly complex agreements, which are difficult for lenders to arrange and for consumers to understand without fairly extensive financial counseling. The general lack of independent counseling services inhibits both banks and potential clients from entering the field. Banks have not found it economically feasible to offer potential borrowers the necessary counseling programs.
-
For financial institutions, the lack of a secondary market and insurance program for HEC loans may be the single biggest barrier to entering the market.
Assessment
-
General Feasibility and Practicality. It is important to be cognizant of the key role that the banking and lending industry must play if the HEC concept is to be more readily available to serve those elderly who can benefit. Without the willingness of the lending industry to enter the market and offer flexibile and appropriate products, HECs (particularly reverse mortgages) will remain a small and insignificant approach, serving only a handful of people. By all appearances this will not happen until demand is at least somewhat stronger.
As earlier noted, another barrier for lenders is the absence of the type of secondary market which is so critical in traditional mortgage lending. Mortgage insurance is essentially a guarantee to the lender against default by the borrower. To date, neither public nor private mortgage insurance has been offered to holders of reverse mortgages. It is of note that the State of Florida recently passed legislation creating an insurance fund for reverse mortgages, but the actual operation of the State's fund has not been implemented. The U.S. Department of Housing and Urban Development is also studying the issue of insurance for reverse mortgages and expects to issue a report.
Caution must also be exercised not to oversell the HEC concept to consumers. HEC is not for everybody and should not be viewed as a panacea. A determination of whether a given transaction makes sense can only be made after careful analysis of the financial and social factors in each case. It is crucial that adequate counseling and disclosure be provided.
-
Quality of Life and Dignity of the Individual. HEC would appear to improve the quality of life and dignity of the individual, as well as improve the standard of living for the elderly. While data on the reasons HEC loans are secured by the elderly is generally lacking, some information is available on 48 cases (4 pending) in Nassau County, N.Y. and Tucson, Arizona. Multiple reasons were frequently cited by borrowers. In 35 cases (72.9 percent), assistance in meeting daily living expenses was cited. Seventeen borrowers (35.4 percent) cited rehabilitation work on the home and 15 (31.2 percent) cited health and medical reasons.
-
Strengthens the Family Unit. HEC can contribute to maintaining the elderly in their homes and neighborhoods which are frequently near friends and family members. Family members who live near by can assist the elderly when the need arises.
-
Ensures System-Wide Efficiency. By providing additional income to the elderly, self-determined needs and priorities can be better met. If the number of banks and lenders who enter the market increases, the natural forces of competition and diversity would occur.
-
Contains Public Expenditures. Given sufficient volume, the additional income made available to the elderly under HECs could lessen the strain on local, State and Federal resources for health and social services expenditures.
Implications for Government
Although the first home equity conversion transaction was made more than twenty years ago, the concept has yet to create a surge of support from that segment of the American population which can benefit most, elderly homeowners.
As noted earlier, the wider adoption of HEC approaches by the elderly could have a significant impact on their general economic well-being. The potential for Federal, State and local governments is that the growth in their expenditures for health care and social service needs would be reduced. On a cautionary note, it is important to remember that elderly homeowners generally have complete discretion in the use of funds from HEC loans and may not be interested in using funds to purchase Long term care insurance or otherwise meet their Long term care needs.
Reducing Barriers to use of HEC Mechanisms. The Federal Government and State and local governments, as well as leading institutions, foundations, businesses, and the voluntary sector can each contribute to the development of HEC options. Among the possibilities are:
- Establishing demonstration programs to provide consumers with up-to-date information on HEC mechanisms and counselors who are knowledgeable about HEC financing options, financial analysis and gerontological issues;
- Reviewing legal and regulatory barriers e.g., restrictive State regulatory codes, that may impede development of HEC plans, maintaining only those rules necessary to protect consumers against unfair and fraudulent business practices;
- Providing technical assistance to lenders and making available materials on establishing reverse mortgage and other HEC plans;
- Sponsoring conferences to spur interest among consumers and lenders; and
- Supporting demonstration programs which provide insurance and purchase programs backed by the State.
States that wish to focus HEC resources on the purchase of long term care insurance might do so by revising the rules for State medical assistance programs to clearly exclude HEC derived income from eligibility determinations, when such income is used to pay the premium on a long-term care policy. Because there are few precedents under the Medicaid program, a State would need to seek clarification or a waiver of Federal rules to implement this approach.
6. Employee Benefit Options for Retirees
Definition
Long-term care employee benefit options are options which could be offered as part of a company’s pension or health insurance package and could be designed to help retirees meet the financial liabilities associated with long-term care.
Employment-related long-term care benefits for retirees could take several forms and be paid for by the employer, the employee, or by sharing the cost. For example, insurance for long-term care could be provided by employers as an additional fringe benefit choice, or employers could simply help form a group and interested employees could purchase this type of insurance through their employee group. Also, there are important, but less far-reaching possibilities such as firms which are considering working with retirees to set up volunteer caregiving networks. This section focuses primarily on the potential for long-term care insurance as a retiree benefit.
Current Experience and Research Findings
With regard to employer-sponsored benefits there exists a marked contrast. On the one hand, a majority of workers today are covered by an employer-sponsored pension plan and a significant number of companies provide health insurance after retirement. On the other hand, based on what little empirical data exists, there appears to be virtually no similar provisions for long-term care. (A Business Roundtable survey this year on retiree benefits may provide additional information, but there is no reason to think this will reveal any substantial movement toward long-term care benefits.)
While there may be few companies offering long-term care benefits now, there is credible, albeit anecdotal, evidence of corporate, employee, and labor interest in changing this situation. However, the current experience is that substantial barriers exist and that some combination of legal, accounting, and statutory changes will probably be necessary before very many companies will get involved.
Premium Structure/Vesting/Portability. There are two basic approaches an employer can take in costing out the premium for a long-term care insurance benefit. Insurance premiums in an employee group can be set to reflect the increasing risk of needing long-term care as workers near retirement. Much like term life insurance, a worker at 30 might pay half the premium of a worker of 50. The advantage of this approach is that it makes each employee's premium cost self-contained with no cross-subsidization. Vesting and portability, while significant administrative details, can probably be easily arranged. An employer interested in sponsoring a voluntary group policy open to all employees but without company subsidy would probably need to utilize this approach. Otherwise younger workers would not participate.
Alternatively, the premiums could reflect the lifetime risk of needing long-term care, with employees of all ages paying the same amount. If this approach is taken and current employees are asked to pay premiums that reflect the risk of needing long-term care in their later working and retirement years, consideration must be given to issues of vesting, portability and conversion rights. The reason for this is that this type of premium structure implicitly assumes the accumulation of reserves that will be used to pay for the increasing risk in later years.
For employees to be willing to participate in such a plan, they must have a reasonable expectation of being able to continue their insurance into retirement at premiums that reflect the fact that they or their company have prepaid some of the risk.
Pay-As-You-Go Versus Pre-Funding. For almost all firms offering retirement health insurance today, employer payments for retiree health coverage are treated as operating expenses for the year in which the benefits are paid. As a consequence employers are increasingly concerned about their large and growing unfunded liability for retiree health and welfare benefits. Despite this, few companies offering retiree health coverage pre-fund their obligations.
Given the future liability which long-term care benefits would impose, and the expectation that the ratio of retirees to active workers will increase sharply in the future, for many companies pre-funding will be important if these benefits are to be offered. If retiree benefits continue to be funded on a pay-as-you-go basis, their costs as a percent of payroll will increase, perhaps leading to problems for employers in the future.
Barriers to Increased Pay-As-You-Go and to Pre-Funding. It is becoming more difficult for companies to fund benefits on a pay-as-you-go basis. One reason is recent court rulings that indicate that employers may not be permitted to terminate or cut back on any defined health benefit promised to retirees. As a result companies may be reluctant to commit to the uncertain liability of a defined long-term care benefit plan which promises specific coverage characteristics in the future, regardless of cost increases for this coverage.
An alternative approach is a defined dollar or defined contribution plan, which requires certain levels of current employer contributions, but does not guarantee specific insurance coverage in the future. From the employer's perspective, this approach is safer because the liability is fixed and not subject to the uncertainties of changes in the health care market. If the contribution is designed to cover the expected cost of insurance, this approach is a way of sharing the risk with employees that would currently be borne solely by the employer.
Another evolving difficulty for pay-as-you-go is that the Financial Accounting Standards Board is considering a requirement that employers' unfunded liabilities for retirees health and welfare benefits be disclosed in their financial statement.
The most important deterrents to pre-funding are the recent policy changes under the Deficit Reduction Act of 1984 (DEFRA) that eliminated the tax advantages of pre-funding retirement health benefits. As a result of this Act, investment earnings on retirement health plan assets will be subject to current income taxation. Also, in funding retirement benefits, employers will be prohibited from assuming an increase in medical costs in the future in determining the amount that can be put into the fund tax free. Thus, the overall impact on employee benefits of the DEFRA provisions is to discourage pre-funding.
Use of Trusts for Pre-funding. An alternative approach to pre-funding long-term care for retirees is to include such benefits as part of a pension plan. Section 401(h) of the tax code allows tax-exempt employer contributions and accumulation of reserves for health insurance benefits for retirees and their families, provided that such benefits are subordinate to the retirement benefits provided by the plan. This means that contributions to provide medical benefits and contributions for life insurance cannot exceed 25 percent of the aggregate contributions made to the plan from the date medical benefits are first included. In addition, a separate account must be established and maintained for these benefits.
Currently there is very little experience with 401(h) plans. However, given the tax law changes under the Deficit Reduction Act (DEFRA) that discourage the pre-funding of health benefit plans, more employers may consider 401(h) trusts in the future.
For most employers, though, the limit on contributions to these plans is too low to accumulate sufficient funds for retiree health benefits, thus making expansion of benefits to cover long-term care more difficult. In addition, setting up the 401(h) plan would increase the administrative burden of the pension plan. Finally, employees in companies that do not offer pension plans, almost half of all employees, cannot benefit from this approach.
General Climate
As companies begin to understand the need for pre-funding and the extent of retiree benefit obligations, the climate for retirees' health benefits including long-term care, has become less encouraging. Not surprisingly, employers are reluctant to make further commitments for 30 to 40 years in the future, particularly for long-term care services where the potential liabilities are large and unknown. Further, the principle that retirees have a right to a benefit plan promised in the past may make employers especially reluctant to add new coverage for long-term care, where demand and costs are expected to grow substantially in the future. Despite this, several insurance companies have indicated they are talking with interested companies.
As will be discussed more below under subsection e., encouraging employers to expand their obligations to include long-term care will require incentives to the private sector to provide and fund these benefits.
Strengths of Employee Benefit Mechanisms
-
Employer-based long-term care benefits would substantially expand the market for insurance protection against the risk of long-term care expenses, thus lowering premium costs and stimulating more companies to enter the market.
-
Risk of adverse selection under long-term care insurance policies would be minimized if all employees participate as a group.
-
Employer-sponsored insurance, because it can be offered on a group basis, would reduce marketing and administrative costs, so that premiums could be lower.
-
Substantially greater awareness and support would exist for individuals to buy long-term care insurance.
Weaknesses of Employee Benefit Mechanisms
-
It is unlikely that many employers will provide paid long-term care benefits for retirees in the current environment without changes in policy.
-
Recent court cases, changes in tax laws and accounting standards have tended to discourage the expansion of employer provided health benefits.
-
Adding long-term care insurance for current retirees would be extremely expensive and prefunding for long-term care would require many years of phasing in.
-
Any additional spending by employers would entail tax deductions for business expenses and thus tax revenues would decrease.
Actions Which Might Promote Employee Benefit Plans for Long-Term Care
Businesses are now recognizing long-term care as an area for concern. It is important that public policy help create an environment that will encourage them to participate in this area.
Retiree health benefits are currently paid largely (95 percent) on a pay-as-you-go basis. This makes it particularly difficult for employers to afford to commit themselves to paying for a new fringe benefit such as long-term care insurance for retirees. Easing of the defined benefit rule and favorable accounting treatment would make it easier for companies to be involved in "pay-as-you-go" or partial pre-funding.
In order to encourage employers to provide long-term care benefits on a pre-funded basis, it will be important to restore the tax advantages of pre-funding health benefits that were eliminated by the Deficit Reduction Act of 1984.
Long-term care benefits could be included as an option for retirees even if employers did not pay the full cost of this insurance in addition to their payments for other health benefits. Such an approach could be voluntary or it could be mandated that all employers with a retirement health plan (or pension plan) offer long-term care insurance as an option to their retirees. Retirees could be asked to pay the full cost of this insurance if they chose to take it, or employers could make a contribution to long-term care insurance instead of paying for other health benefits. In the latter case, the retiree could have a choice of which benefits to take.
For current employees, long-term care benefits might also be included as one of the choices in a cafeteria plan. Many people over age 64 might prefer to be insured against the catastrophic costs of long-term care rather than have the front-end coverage of many Medigap policies.
The Federal Government, in its national leadership role and as the nation's largest employer, might consider some form of retiree benefit plan for long-term care. Currently, the Federal Employees Health Benefits Program, like most employer sponsored health care programs, is oriented towards disease prevention and the treatment of acute illness. Federal workers and retirees, like most Americans, have no special coverage for expenses related to chronic illness and long-term care in a non-hospital setting. In this context, the Federal Government could set an example by offering a long-term care option as part of its retiree benefit plan. All retirees might be given a choice of the health insurance benefits currently offered or long-term care insurance, with similar government contributions to each plan. If a person wanted both types of coverage, this could be made available for an additional premium, paid for all or in part by the retiree.
There are also other ways that employers can provide assistance to the elderly with chronic illnesses. For example, some employers have set up programs that offer informal help to their retirees in a variety of ways, including retiree clubs or the provision of direct services to the chronically ill and disabled, such as transportation to the doctor or information about medicine. An increase in pension funds, or restructuring of pension payout plans to allow for lump sum withdrawals could also be helpful in meeting long-term care expenses. Employers can also give support to workers who care for chronically disabled or incapacitated family members such as an elderly spouse or parent.
Overall, employers can play an important role in the area of long-term care for their retirees. Consideration should be given to incentives that would encourage the development of long-term care benefits for retirees such as those described in this section.
7. Tax Allowances for Home Cars and Other Public Policies to Support Family Caregiving
Definition
This section discusses methods of sustaining and further encouraging family members to provide home care services to dependent elderly persons. Approaches examined include establishing special tax allowances, preferential rules in calculation of Social Security benefits, and flexible employment policies.
Family caregivers provide well over 80 percent of the long-term care assistance given to elderly functionally disabled persons living in the community and over 50 percent of all long-term care services (i.e., including the nursing home portion of long-term care) (Doty, Liu, and Wiener, 1985).
In recent years, there has been growing advocacy of public policies to support and sustain family caregiving. Three rather different arguments are employed to make a case on behalf of this viewpoint.
-
To Prevent Costly Institutionalization. It is often argued that, without support, families are more likely to experience "burn-out" due to the financial and emotional stresses of caregiving and decide to institutionalize the elderly person rather than to continue to provide at-home care. According to this view, the monies spent -- either directly via publicly-funded supportive services programs or indirectly via tax subsidies -- will be recouped through savings brought about by decreased use of publicly funded institutional care.
-
To Relieve Excessive Burden on Caregivers. Others see relieving excessive burden on family caregivers as valuable in and of itself, even if there is no impact on nursing home use or public monies saved. According to this view, families who provide informal home care to disabled elderly relatives deserve support for taking on a time-consuming and stressful task that they might have chosen to avoid.
-
To Ease the Conflicts between Work and Caregiving Responsibilities. This argument holds that female labor force participation will erode the family's ability to provide informal long-term care in the future. Consequently, more families are likely to institutionalize elderly relatives who require large amounts of help or supervision rather than allow caregiving responsibilities to interfere with work. Family support policies to help alleviate the burden of family caregiving are, therefore, essential if future female caregivers are to be able to balance the requirements of work with the goal of maintaining elderly disabled relatives at home as long as possible.
Current Experience and Research Findings
Current Federal Tax Policy. Three basic tools are currently available in the Federal income tax system for targeting subsidies to taxpayer households in which elderly, dependent persons are living (La Jolla, 1985).
-
Exemptions -- Taxpayers are permitted an exemption of $1,000 for each dependent. Taxpayers whose elderly kin live with them may claim them as dependents if: 1) the claimed dependent has income of less than $1,000 for the taxable year; and 2) over half the dependent's support is furnished by the taxpayer. Few family caregivers now qualify for this exemption, since most elderly kin have annual income in excess of $1,000.
-
Deductions -- Some long-term care expenditures on behalf of a dependent that qualify as medical expenses may presently be deducted if these expenditures amount to 5 percent or more of taxable income. The dependent for whom medical expenses are claimed must meet the same dependency criteria as required for the taxpayer to claim an exemption.
-
Tax credits -- The major current tax allowance available to taxpayer households with elderly dependents is the Child and Dependent Care Credit. Until 1982, this credit could only be applied to expenses for the care of a child under 15 years of age. Under the Economic Recovery Tax Act of 1981, expenditures for noninstitutional care of disabled spouses or other dependents also became eligible for the credit.
All of the following conditions must be met in order for the taxpayer to claim the credit:
- The disabled spouse or elderly dependent must regularly spend at least eight hours a day in the taxpayers home;
- The dependent must be physically or mentally incapable of caring for him or her self;
- All taxpayers in the household must be gainfully employed; and
- Only expenses up to a maximum of $2,400 per dependent are eligible for the credit. This is equal to $200 in dependent care expenses per month, or about $50 per week.
The Child and Dependent Care Tax Credit is progressive in its impact; that is, households with lower incomes can claim a higher percentage of their dependent care expenses than those with higher incomes. The amount of the subsidy ranges from 20 to 30 percent of total expenses, up to the maximum of $2,400 per dependent. Thus, the maximum amounts of tax subsidy would be $480 to $720 per year.
Analysis of Current Tax Subsidies
Neither the provisions for claiming a dependent exemption nor deductions for medical expenses on behalf of a dependent are widely used by family members caring for the elderly. IRS data indicate that only 1.8 percent of taxpayers claim this exemption. This appears to result from the following factors:
-
Few taxpayers can claim dependent exemptions on behalf of elderly relatives living with them because very few elderly have incomes under $1,000 a year and many have sufficient income such that family caregivers cannot legitimately claim to be providing over 50 percent of their support.
-
Due to Medicare or Medicaid or both, few older persons living outside institutions have sufficient out-of-pocket medical expenses coupled with sufficient economic dependency on relatives to enable family caregivers to take medical deductions on their behalf. Data collected by IRS is not sufficiently precise to make an estimate of how many taxpayers may be claiming medical deductions on behalf of elderly relatives.
In principle, the Child and Dependent Care Tax Credit has the greatest potential for use among the three tax allowances currently available to families providing care at home to the elderly disabled.
Although the tax return does not require taxpayers to specify on whose behalf they are claiming the Child and Dependent Care Tax Credit, the Department of the Treasury has estimated that at most only about 10 percent of the projected annual cost of the Child and Dependent Care Tax Credit (S1.3 billion in 1981) is for dependent as opposed to child care. Also, many low income households do not take advantage of the credit because they have no tax liability (and thus nothing to credit against), or do not know about the credit, or do not understand how to use it.
It is possible to estimate those taking the credit for home care expenses for relatives over 65 only by eliminating all those claiming the credit who are also claiming extra exemptions for children or for younger adult dependents. Although this method still leaves open some possibilities for both under and overcounting, it should yield something quite close to the true figure. On this basis, it is estimated that only 1.5 percent of those taking the Child and Dependent Care Tax Credit are claiming expenditures for the care of older persons.
Some advocates of tax allowances for family caregivers argue that the current maximum amount that may be claimed under the Child and Dependent Care Tax Credit is not sufficient. However, according to analysis of the 1982 Long Term Care Survey (Doty, 1986), family caregivers who reported, out-of-pocket payments for formal caregivers reported spending, on average, $373 annually. This is considerably less than the current $2,400 maximum in expenses that can be claimed.
A more difficult problem is that the Dependent Care Tax Credit may only be claimed by families in which all taxpayers, including the primary caregiver are working. According to analysis of the 1982 Long-Term Care Survey, Caregiver Supplement (Stone, Cafferata and Sangl, 1986) only 16.8 percent of primary caregivers work. This reflects, in part, the high percentages of spouse caregivers (slightly over one-third of all family caregivers) and caregivers over 65 (also roughly one-third of all family caregivers). Even among adult child caregivers, 56 percent of the daughters and 45 percent of the sons are not employed.
Working caregivers are somewhat more likely, however, to have made expenditures for care. This is because they employ more paid helpers than nonworking caregivers, who are more likely to have no assistance or only informal help.
Some proponents of family support policies believe that current tax provisions discriminate against those family members who leave or stay out of the workforce in order to provide care and who provide care themselves rather than hiring formal providers.
According to the 1982 Long Term Care Survey (Stone, Cafferata and Sangl, 1986) 14 percent of female primary caregivers report having quit their jobs to provide home care. Such persons cannot benefit from the current tax provisions even though the elderly they care for are more severely impaired and even though they spend more hours providing care than other working and nonworking caregivers.
Finally, current tax code provisions require taxpayers to reside with the care recipient in order to claim tax credits. Although the great majority of caregivers do live with those they are caring for, nearly one-quarter of working female caregivers (principally daughters) do not live with the elderly care recipient.
Taking into consideration the various criteria that must be met in order to claim a dependent care tax credit on behalf of an elderly relative (i.e., all taxpayers in the household must be working and the elderly person must reside with the taxpayer), analysis of the 1982 Long Term Care Survey Caregivers Supplement indicates that only 5 percent of the estimated 2.2 million caregivers caring for the moderately to severely dependent elderly living in the community would qualify to claim the tax credit for any out-of-pocket expenses they might have. The existing provisions do not benefit caregivers who choose to provide all care themselves, nor do they benefit those caregivers who leave the labor force or who choose to remain at home to provide care, even though these persons may be caring for more severely impaired relatives and may also be paying expenses for formal help.
Congressional Proposals to Expand Tax Allowances for Informal Caregiving to the Elderly. A variety of legislative proposals has been introduced in Congress to provide tax allowances for home care. Most proposals build on the existing Dependent Care Tax Credit in order to remove or reduce some of the limitations on who can claim benefits.
Among the legislation that would permit the broadest expansion are those which do not require elderly dependents to be functionally disabled in order for family members to claim the tax credit, those which make the credit refundable, and those which eliminate the work-related requirement. Examples are outlined below.
One bill proposes a $400 refundable tax credit for any household which maintains an elderly relative 65 or older for more than six months in a year. There is no specific disability requirement, nor is there a specific requirement for out-of-pocket expenditures on medical or long-term care services, though there is a general requirement that the taxpayer must provide for over half the support of the elderly relative.
Another proposal would more narrowly limit the number of taxpayers who could potentially claim the dependent care tax credit but it would offer those who are eligible more financial support. This proposal would eliminate the work-related requirement. The elderly relative could not, however, have income in excess of $15,000. The elderly relative would have to live with the taxpayer and be at least 75 years of age. No qualifying medical or disability conditions would be required, but elderly persons under age 75 could qualify if they had a diagnosis of Alzheimer's disease. The maximum amount of expenses which could be claimed under the credit would be increased to $3,500 per elderly dependent, but could not exceed $7,000 per household. Households with incomes greater than $50,000 would not be eligible for the credit, but for low income households, the credit would be refundable (i.e., paid to the taxpayer if the credit exceeded tax liability). The subsidy level would be 30 percent for households with incomes of $10,000 or less down to 20 percent for households with incomes above $28,000.
Another bill is similar to the previous proposal, but includes the following modifications: the age requirement for the elderly dependent would be dropped to 70 years of age (still with no age requirement for Alzheimer's patients, however), a disability requirement based on Social Security definitions would be added, and payments for nursing home care for Alzheimer's patients could be claimed. In addition, the income standards for subsidy levels would be charged: taxpayers with incomes up to $25,000 would be eligible for the 30 percent subsidy, and the 20 percent subsidy floor would not be applied until the taxpayer's income surpassed $43,000. The maximum amount of expenses which could be claimed would increase to $5,000 per elderly relative, up to $10,000 per taxpayer. However, this bill would not make the credit refundable.
Another bill would simply drop the "work-related" requirement for the current Dependent Care Tax Credit. Similar bills have been proposed which are specifically targeted to households in which there are elderly Alzheimer's patients.
State Tax Initiatives Supporting Family Caregiving. Since 1979, four States -- Oregon, Idaho, Iowa, and Arizona -- have enacted legislation providing tax allowances for family caregivers. Each State has taken a different approach:
Oregon provides for a tax credit of up to 8 percent of expenses for the care of an elderly dependent -- up to a maximum credit of $250. Only households with incomes below $17,500 are eligible to claim the credit. Extensive documentation of disability and risk of institutionalization is required and must be certified by the State Human Service agency. Due to these restrictions, very few Oregon taxpayers have claimed the credit.
Idaho allows households that maintain an elderly relative (over 65 years) and provide over half the relative's support to take a standard tax deduction or credit on their State tax return. Taxpayers may choose between a $1,000 deduction to gross income, or a refundable tax credit of $100. (It is unclear, however, why taxpayers would ever choose the $1,000 deduction, since the maximum tax rate is 7.5 percent or a maximum of $75 per year.) No disability requirement is imposed. Taxpayers may not claim a deduction or credit for more than three qualifying persons.
The Idaho tax allowance is being studied by the Center for Health and Social Services Research (Pasadena, California) under a grant from the Health Care Financing Administration. Preliminary results indicate that in 1982, more than 700 taxpayers claimed elderly care deductions or credits. Cost to the State was an estimated $65,000 in lost revenue, or about $93 per claimant.
According to the study, the typical elderly dependent is the claimant's widowed mother or mother-in-law, over 80 years of age, with one or more chronic health conditions, and would likely be dependent on public assistance if the informal support system was disrupted. Claimants are generally married, with beginning health problems of their own, somewhat older than the average Idaho population, and nearing retirement age. Claimants had above average education and income.
Over 80 percent of the dependents cared for had incomes of less than $1,000 in 1981. Many in this low income group would have been eligible for the Federal SSI benefit, although only 3 percent were claiming it. This suggests that, when the elderly disabled move in with relatives, the family not only provides long-term care that government might otherwise have to pay for, but saves other public assistance costs. While more than half the claimants did not contribute to paying for medical bills (presumably because the elderly person was able to afford the Medicare co-payments), over 60 percent of claimants spent over $1,000 on their elderly relative's non-medical living expenses.
Iowa permits taxpayers to deduct up to $5,000 in eligible expenses from income, separate from the standard or itemized deductions. Eligible expenses include any cost directly attributable to the care of an elderly dependent living in the same household, such as food, clothing, transportation, and medical expenses not deducted elsewhere on the return.
In order for the caregiver to claim the deduction, the care recipient must either be a Medicaid enrollee or Medicaid eligible. In addition, on the first return on which a deduction is taken and every third year thereafter, taxpayers must attach a statement from a qualified physician certifying that the recipient is unable to live independently.
Since Iowa's tax rate is progressively structured, the value of deductions are greater for households with higher incomes. For an Iowa household with a median income of about $23,000, the maximum of $5,000 in eligible deductions would receive a tax subsidy of about $300.
Arizona permits taxpayers to deduct eligible medical expenses for any elderly person that the taxpayer cares for, whether or not the care recipient is a relative. The tax benefit is designed to take into account the fact that many elderly have recently moved to Arizona and do not have family there; they may, however, develop "surrogate families" among friends and neighbors. Taxpayers who have eligible deductions in excess of $800 per year for elderly non-relatives are also permitted to claim a "bonus" in the form of an additional dependent exemption an their State tax return, a benefit worth about $48 (La Jolla, 1985).
Effectiveness of Tax Subsidy Approaches
Are Tax Subsidies Likely to Prevent Institutionalization?
There is little evidence that tax allowances affect families, decisions about whether or not to bring a functionally dependent older person into a relative's home or how long to continue with home care versus seeking institutional placement.
-
For example, attitude surveys carried out by Sussman (1977, 1979) found that neither tax incentives nor any other specific type of government financial or service program assistance was likely to change the minds of individuals who said that they would not bring an elderly relative to live with them. On the other hand, persons who said they would bring an elderly relative into their home indicated that, while they would appreciate government assistance, such incentives would not affect their willingness to provide care at home.
-
The financial burden of family caregiving is rarely cited as a major reason for the decision to place an elderly relative in a nursing home. Rather, a decline in the elderly person's health status to the point where family caregivers feel that more care is required than they can provide is the reason most often given for choosing institutionalization (Arling and McAuley, 1983; Smallegan, 1983, 1985).
-
Social and emotional factors typically outweigh all others in causing family caregivers to decide home care is not feasible or cannot be continued (Sangl, 1983; Clark and Rakowski, 1983). Precipitating factors can include anxiety associated with having sole responsibility for the safety and care of a disabled relative; stress and loss of freedom when caring for someone who cannot be left alone; interpersonal tensions with either the care recipient or between the care recipient and other members of the family; and frustrations in coping with confusion, forgetfulness, and behavioral problems.
-
By the time family caregivers actively seek institutional placement for their elderly disabled relatives, many are already employing supplemental paid providers. Only very substantial amounts of additional care by paid providers (on the order of 20 or more hours per week) are seen as making continued home care possible (Harkins, 1985). This suggests that the limited amounts of paid care generally thought of as providing "respite" for family caregivers are affordable to many even without tax subsidies, but that the amounts of paid care needed to prevent institutional placement are not widely affordable even with tax subsidies.
Can Tax Subsidies Reduce Excessive Burden on Caregivers? Tax subsidies can make the services of formal providers more affordable. Recent research on the Department's National Long-Term Care Channeling Demonstration program has found that provision of formal services to supplement and provide respite for informal caregivers can improve the morale of primary caregivers on several dimensions. Family caregivers receiving the supplemental formal services reported feeling less worried about their ability to meet the care needs of the disabled elderly person. They also were less likely to report that they experienced serious problems with restricted privacy and limitations on social life due to their caregiving responsibilities (Christianson, 1985).
Can Tax Subsidies Reduce Conflict Between Work and Caregiving Responsibilities? Analysis of the 1982 Long Term Care Survey (Stone, Cafferata and Sangl, 1986) has found somewhat greater use of paid assistance by working caregivers who reported experiencing various kinds of conflicts between work and caregiving responsibilities. This suggests that current tax allowances may be helping those who are experiencing work/caregiving conflicts by making supplemental he12 more affordable.
Nevertheless, relatively few working--caregivers make use of formal providers, despite the fact that 36 percent of all female primary caregivers in the 1982 Long-Term Care Survey reported having experienced conflict between work and caregiving. It may be that most family caregivers do not believe that formal assistance, or at least the amount of formal assistance that is affordable to them, will resolve their conflicts between work and caregiving. In the channeling demonstrations, formal support services were provided either free or at very low cost, but were found to have no effect on family caregivers' perceptions of their employment limitations or their earnings and family incomes (Christianson, 1985).
Strengths of Tax Subsidy Approaches
-
Tax subsidies are viewed as attractive because of their comparative simplicity of administration. They require no new organizational structure to administer.
-
Tax subsidy approaches maximize the family's control over how much formal care, and of what type, to employ -- as compared with publicly funded service programs in which professionals make the decisions as to how much assistance, and of what type, the family will receive.
Weaknesses of Tax Subsidy Approaches
-
Because tax subsidies are "self-administered" by the taxpayers who claim them, subsidies are pore likely to be used by higher income taxpavers who are more knowledgeable and sophisticated in making use of advantageous tax provisions. Subsidies also have potential for fraud and abuse.
-
Tax allowances are difficult to target to the neediest groups, not only in terms of lower income groups, but also in terms of calibrating benefits to the degree of impairment of the person cared for and lack of an available informal support system.
-
Many caregivers do not benefit from tax subsidies (unless they are a refundable credit) because they do not file income tax returns or because they do not have sufficient tax liability. For example, about one-third of all family caregivers are themselves elderly and retired.
Other Public Policies to Support Family Caregiving
Social Security "Dropout Year" Credits. One criticism of tax subsidy approaches is that, since they are typically oriented toward paying the costs of hiring formal providers and can only be claimed by working caregivers, the subsidies do not benefit the caregivers who drop out of the workforce in order to provide another's care. These caregivers pay a price in foregone earnings and probably also in lower future earnings even after they return to work. As a result, when they themselves become elderly, the caregiver's Social Security pension will be lower than it otherwise would have been.
A proposal that would partially offset this is to allow persons who drop out of the workforce to provide home care to elderly relatives to have their Social Security benefits calculated so as to leave out the years when they were providing care, thus increasing the caregiver's entitlement. Instead of dividing total earnings by the 35 year working period mandated for other Social Security beneficiaries, family caregivers would be able to deduct those years during which they provided care to an elderly relative.
The chief drawback of this approach is that it could be perceived as inequitable unless it included individuals providing home care to children under school age and disabled family members of any age. However, under that configuration, it would probably be very expensive to the Social Security Trust Funds.
Encourage Flexible Employment Policies. A 1985 survey of elderly caregiving responsibilities carried out by the Traveler's Insurance Company resulted in an estimate that about 1 in 5 of all the company's employees aged 30 and over had caregiving responsibility for an elderly relative. As a result of the publicity given to this study and its findings, the question of employment policies as they impact on family caregiving and the need for employee counseling programs or work-based caregiver support groups has started to attract the attention of business and other groups.
The American Association of Retired Persons has embarked on a survey of corporate employees and employers regarding work/caregiving conflicts and employer policies that exacerbate or mitigate such conflicts. The Department's Office of Human Development Services has also funded two studies of these issues. Although findings from these studies are not yet available, a recent Conference Board report summarized the existing literature and reported on the findings of an informal survey of New York City businesses. According to senior research associate Dana Friedman, "by 1999, when about 5 million Americans will be over 85, caring for the aged will be a bottom-line business concern." Already, conflict between work and caregiving responsibilities is showing up in greater tardiness, lower productivity, and more depression among employees caring for elderly relatives (New York Times, 1986).
One response to this is a legislative proposal introduced in the U.S. House of Representatives. The bill would mandate employers of 15 or more workers to allow as much as 18 weeks of unpaid leave to workers following the birth of their child and to workers wishing to take time off to care for a seriously ill child or dependent parent. Workers would be guaranteed the rigbt to return to their job.
Given the relatively new appreciation of what is likely to be a growing problem, the issue is one deserving of further research. Developing employment policy designed to help reduce work/caregiving conflicts will require considerable initiative by the business community in the years ahead.
8. Volunteer Systems
Definition
For the purpose of this section, volunteer work is defined as work or assistance performed without compensation except for expenses incidental to performing this volunteer role, such as supervision or training costs, or assistance with transportation.
The Current Experience and Research Findings
Volunteerism is an important component of America's public and private services systems. Volunteer efforts, both informal and organized, provide a complex and diverse range of needed services to many persons who might otherwise not receive assistance.
A Gallup survey on volunteers indicated that 48 percent of all Americans aged 14 or older had done some volunteer work in the 12 months prior to the survey. Women volunteered more often than men (55 versus 45 percent, respectively), and people under the age of 50 volunteered more frequently than those older than 50 (51 versus 24 percent, respectively).
Nonetheless, older persons represent a significant segment of the total number of volunteers in this country. A survey conducted in 1981 by the National Council on Aging and Louis Harris, which counted only volunteer work done through group organizations, indicated that 23 percent (5.8 million persons) of the over-65 population provided volunteer services. A national Gallup survey conducted that same year, which included informal volunteer work as well as work done through group organizations, found that a total of 37 percent (9.4 million persons) of the over 65 population did volunteer work. In the 1985 Gallup survey on volunteers, 43 percent of those interviewed between the ages of 65-74 participated in volunteer activity.
Projections of the number of future older volunteers indicate a large and dramatically growing number of older volunteers between now and the end of the century. The number of older volunteers is estimated to increase at twice the rate of growth of the older population itself (reference to be supplied).
The President's Task Force on Private Sector Initiatives reported that the traditional areas of service which have attracted volunteers include the operation of cultural programs, public safety, maintenance of parks and recreation, and care efforts for the elderly and children. The 1985 Gallup survey on volunteers indicated that the areas in which the largest percentages of volunteer time were invested included religious activities (23 percent); informal activities not done as part of a group (19 percent); education (13 percent); and, general fund-raising (11 percent). The earlier 1981 Harris Survey on volunteers found that older volunteers spent more time in providing informal services (49 percent); religious work (38 percent); and health-related activities (27 percent), such as hospital work, mental health clinics, and rescue squads.
Estimating the costs associated with the use of volunteers (recruiting, training, supervision, and other factors) is a highly complicated and imprecise task. Typically, such information is not easily gathered and is unavailable from many organizations which utilize volunteers.
Attributing an estimated value to the contributions of volunteers, although also complicated, is an effort which has been more frequently undertaken in the voluntary sector. A Gallup survey on volunteers in 1981 indicated that 47 percent of all adult Americans (76 million persons) each volunteered an-average of 102 hours during the preceding 12 months. This represented a total of 7.8 billion hours of volunteer time with an estimated value of $62.2 billion.
Volunteers and Long-Term Care--Some Principles
In attempting to construct a vision of how volunteers can play an increasing role in meeting the elderly's long-term care needs, certain principles emerge:
-
Volunteering in the United States is an activity in the private domain. The decision to volunteer is a private decision. Therefore, any discussion of the role of government at any level is predicated on the assumption that the proper role of government is to assist and work in partnership with private organizations in volunteer endeavors.
-
Volunteering is essentially a community activity, developed, managed, and supported by individuals and community organizations to fit the needs of the individuals and organizations which make up the community. Therefore, community approaches to the involvement of volunteers vary widely, even though there may be certain essential processes which are common.
-
There are unique opportunities for volunteer involvement in long-term care which can further the caring ethic in America. The increase in the older population, and particularly those who face a daily challenge in coping with functional and chronic conditions, is causing major adjustments in various facets of American society. Just as the extent and degree of care-taking presents a new and different role for family members, so too, is there a new challenge to the volunteer community.
-
Volunteers serve to complement paid staff. Although volunteers cannot be expected to replace the often specialized expertise of professional caregivers (e.g., health care providers), there is a wide variety of important uncompensated roles which volunteers can fill in addressing the long-term care needs of the elderly and their families. These include, but are not limited to, the following voluntary service roles:
- Health outreach (bridging the gap between hospitals and discharged patients);
- Visiting with the older person and family;
- Respite care for primary family caregivers;
- Assistance to those agencies and professionals providing homemaker and home health services;
- Home repair and upkeep activities, such as weatherproofing, yard upkeep, and general maintenance;
- Facilitating services, i.e., helping to link elderly persons needing assistance with the community and government agencies that provide services;
- Transportation and errand services;
- Assistance with grocery and other shopping;
- Accompanying older persons to medical appointments;
- Financial counseling services; and
- Individual and family counseling.
-
Volunteer assistance to older persons and their families can take place in both home settings and in a wide-range of institutional settings and group living arrangements.
-
Volunteer efforts cost time and money, especially those done well. The value of volunteer efforts usually far exceeds the costs associated with operating the effort. Costs associated with volunteer programs are usually borne by the community or the individual volunteer. However, there are many areas in which partial government financial assistance has been provided (RSVP, hospice, use of entitlement reimbursements for volunteer director salaries in nursing homes, State and local government funding). In these cases, cost is usually borne by a mix of community, individual and public sources.
-
Additional knowledge is needed in a variety of areas to support the widespread involvement of volunteers in long-term care. Among other considerations, it will be important to identify inappropriate assignments as well as appropriate ones. The degree of care, attention, or time commitment which is appropriate for paid staff, rather than volunteers, must be identified and will be important to the recruitment, placement, and proper supervision of volunteers. Given the nature of volunteer service, the best method for finding answers to these and other questions is by operating programs and formulating conclusions based on program design and actual results, as well as by reviewing existing volunteer programs in long-term care settings.
-
Future approaches need to build on existing organizations and systems (rather than the creation of new ones). Without discounting the potential value of service credit programs, brokered arrangements, or the earning of volunteer hours for "repayment" to oneself later in life, more volunteerism in long-term care can be generated by building on our existing, highly successful volunteer system.
Volunteers and Long-Term Care--Principles in Action
In every part of the country there are programs, large and small, mostly community-based, that provide volunteer services for homebound and frail elderly persons and, in many cases, for their families.
While it is impossible to describe the full variety of these programs, activities, and services, the following volunteer programs--with national, State and local sponsors--provide an illustration of these efforts.
-
Retired Senior Volunteer Program (RSVP)
RSVP, a program sponsored by the Federal ACTION agency, has an estimated 750 community projects in 1986. These projects will utilize 965,000 older volunteers and provide more than 67 million hours of services.
In-home care is a major program emphasis area. This includes activities involving personal care, respite care, companionship, emergency caregiving, and support groups for stroke and Alzheimer's Disease.
There are several features to RSVP community program design which have been critical to involving and supporting large numbers of volunteers in services to vulnerable older persons and their families: a community-wide approach to recruitment and placement of volunteers; provision for rotation of assignment; assignments tailored to the volunteers' interests and abilities; matching of volunteers with the unique needs of community agencies and their clientele; and a well-developed system of staff and peer support for volunteers.
Older persons who volunteer for RSVP usually serve one day per week on a regular basis. They are not compensated, but some are assisted in areas such as transportation and lunch incidental to volunteer services.
-
National Council of Catholic Women (NCCW) Respite Program
The NCCW Respite Program is a national program based in Washington, D.C. which utilizes approximately 4,000 volunteers in 60 dioceses to provide respite services for families who care for an elderly member at home. This program, which is in its third year, targets a frail elderly population except that it is not designed to address the needs of persons with Alzheimer's Disease.
Individual dioceses are responsible for the recruitment of volunteers, mainly through local congregations. Each volunteer is trained by health professionals in the skills needed to provide companionship and care to an elderly person in the home.
Respite volunteers serve as a companion to an elderly person for three to four hours a day, once a week or several times a month, providing the family with a break from their constant caregiving.
-
Iowa Care Review Committees
A State nursing home ombudsman program in Iowa operates a statewide volunteer network of Care Review Committees (CRCs) mandated under State legislation for each licensed long-term care facility. The system presently consists of nearly 700 volunteer committees and includes approximately 2,800 volunteers. The turnover rate for volunteers is a fairly low 15 percent annually.
CRCs serve the residents of long-term care facilities and their families as the first line of access for assistance in dealing with complaints, focusing on resolution at the local level rather than through litigation in the courts. The CRC system serves all long-term care facilities, not just those serving the elderly.
-
Ruth Taylor Geriatric Institute Volunteer Program
The Ruth Taylor Geriatric Institute, a component of the Westchester County Medical Center in Valhalla, N.Y., utilizes volunteers to provide a wide range of services, including pastoral activities, recreational activities, and one-to-one companionship for nursing home residents. The institute also runs an innovative program called Employee-Adopt-A-Patient (EAAP) in which employees who wish to participate adopt an individual patient and are allotted a certain amount of worktime to provide them with special attention.
Volunteers are recruited through agencies, such as the Retired Senior Volunteer Program, as well as by current and previous volunteers, media coverage, and organizations (i.e., fraternal, religious and corporate). Each volunteer receives an orientation and training. At present, there are approximately 40-45 persons who volunteer time at least once a week, an additional 30 groups of people (With 10-25 persons per group) who provide assistance on a bimonthly to annual basis, and groups of school children who are recruited on a seasonal basis.
-
Hospice Movement
The recent rapid spread of the hospice movement, which utilizes volunteers extensively, can provide important insight and understanding regarding the recruitment, training, and utilization of volunteers.
The 1984 hospice census, conducted by the National Hospice Organization, indicated that approximately 45,000 volunteers provided 315,000 hours of services to nearly 100,000 patients, a large proportion of them elderly persons in home settings. Volunteers provide direct supportive services, including respite care, transportation, or personal care to the patient or family. Some hospice programs are volunteer-intensive, i.e., almost entirely managed by volunteers, including physicians, nurses, and social workers.
A New Approach: Volunteer Service Credit
In 1985, Florida passed legislation establishing a computerized service credit program that allows individuals who are 60 years of age or older to earn credit for volunteer services provided to other older persons who have been determined to need such care. Volunteers earning credits provide respite care, homemaker care, and related services. In return, the volunteers can draw upon these credits when they are determined to need the services included in the service credit program. In effect, service credits are a medium of exchange that enables the elderly to help themselves by devoting blocks of time to helping others.
To date, only $50,000 has been allocated by the Florida Legislature for program administration and implementation in a few limited demonstration sites. Current funding is scheduled to end in 1986. From its inception, the program was expected to encounter budgetary problems because of a contingency requirement written into the enabling legislation. Essentially, if no volunteer is available to provide services to an individual who earned service credits, then the State is required to either provide the services or to pay for their provision. Program staff have estimated that $7 million in program debt could be accrued by the end of five years.
Although innovative, the volunteer service credit approach for the frail elderly has many potential long-range problems. These include liabilities on the part of the administering organization, the need to maintain large data banks in perpetuity, and potential conflicts concerning the use of "earned" credit hours. Additionally, this approach departs from the traditional volunteer concept in the U.S. in which one receives volunteer help simply because it is needed and not because it is "deserved" or $learned-" Clearly, these potential problems will need close attention as new programs are tested.
Volunteers and Long-Term Care--A Possible Model
Nursing homes and other care-giving entities often find it more efficient to work with community organizations which specialize in providing volunteer services rather than recruit individuals directly. Some nursing homes may work with several volunteer groups, drawing from one which specializes in young volunteers, another (such as RSVP) providing older volunteers, perhaps also drawing on educational institutions, to obtain an intergenerational mix of volunteers to serve residents. The Volunteer Bureaus and Voluntary Action Centers, located in many communities throughout the country, are among the many clearinghouses and information and referral centers for volunteers.
Given the needs of individuals and families who must cope with chronic problems over a period of months and years, it may be appropriate to develop a community volunteer system which specifically complements long-term care services. The system should be self-sustaining within the community.
The following are elements necessary to a community system for volunteer support of long-term care:
-
A community organization which will take on responsibility for the organization and management of the long-term care volunteer system in the community. Such an organization needs to be respected in the community and have the capacity to undertake a complex endeavor crossing two fields--long-term care and volunteers.
Responsibilities would include working with the agencies in the community which provide long-term care services to collaboratively develop appropriate assignments for volunteers; and working with the volunteer service agencies on the recruitment and effective involvement of volunteers. The brokering organization might also nee to provide orientation and periodic training for agency supervisors in the effective use of volunteers in long-term care.
-
Method(s) for financing ongoing services in a manner consistent with the unique needs of a particular community must be developed and program assistance, provided.
Few communities have used volunteers in the long-term care arena in any organized way, i.e., with a community-wide focus attuned to the use of community-wide resources. Innovative financing strategies and a period of program development will be necessary to build the system, during which time information and expert assistance can be provided to interested communities.
-
Organizations where volunteers serve must make a commitment to a high quality effort and demonstrate a willingness to provide visibility for the volunteer effort within the organization. In effect, volunteers in a successful program must be viewed as "part of the team" and the agency's director of volunteers or other staff person in charge of the volunteer effort must be able to carry out the activity effectively and with the support of top management.
-
There must be a methodology for the development of volunteer assignments. recruitment, orientation and training of volunteers, supervision, and recognition which creates and reinforces a high retention rate among volunteers, a positive esprit de corns and high quality volunteer support to older persons and their families. The methodology should address the issue of the dependability of volunteers, which is particularly important in long-term care situations; effective ways of avoiding burnout among volunteers; and other aspects of program operations in long-term care which depart from the usual approaches to recruitment and placement of volunteers. Additionally, thought needs to be given to transportation and other needs of volunteers providing services, especially the older volunteers, as well as to liability issues and insurance.
The system described above, carefully organized and supported, has the capacity to yield very large numbers of volunteers in a given community. Encouraging the development of any significant number of such systems across the country would require a sustained and phased effort over a 3 to 4 year period. The following approaches would help realize the proliferation of community volunteer systems in long-term care:
-
A major leadership effort would be joined between government and the private sector.
-
A quick study would be made of several respected programs in which volunteers are used in long-term care to gain immediate information on what makes for success, and to draw on the experience of those individuals who have been managing volunteer efforts in long-term care settings for a number of years. This investment could pay dividends in formulating an approach which would be practical and gain the support of government and private sector leaders.
-
Pilot systems in various regions of the country would be developed which use basic principles of good volunteer program development and administration, modified to anticipate differences inherent in the use of volunteers in long-term care. It is important for the success of such efforts that an interest and commitment from diverse organizations be generated in communities where these pilot efforts are implemented.
A broadening of the pilot effort could be achieved by providing the opportunity for other communities to learn from staff and volunteers who are associated with the pilot systems. The pilot programs would also incorporate an ongoing method for studying the successes and difficulties of each as a basis for learning by other communities.
The financing for the initial pilots, for the study of successes and difficulties, and for expansion are presumed to be from a mix of government and private resources at national, State and local levels.
The approach outlined above has the advantage of going beyond discussion and information sharing to encompass a more active, longer-term leadership commitment by the Federal and State governments and the private sector. The approach would facilitate the expansion and development of volunteer systems that impact more directly on the long-term care service needs of the frail elderly and their families.
This strategy also provides support for communities which are actively revising their service systems in order to be more responsive to vulnerable older persons and their families. Although this alternative would involve some Federal financial investment, it is likely to be extremely modest. Even in the short-term, the estimated value of volunteer services is likely to far exceed the costs associated with program development and administration.
Strengths of Using Volunteers
The use of volunteers in the provision of long-term care services to the elderly has many potential strengths and benefits, including the following:
- The economic and social contribution of volunteers to the larger society is substantial and there are vast numbers of volunteers who are potentially available at the current time;
- The potential cost-effectiveness of services provided by volunteers versus conventional/traditional forms of care is highly favorable, as has been demonstrated in HCFAs national hospice evaluation study (Greer et al., 1985);
- Volunteers could potentially reduce premature or unnecessary institutionalization of some elderly persons, particularly those with functional disabilities, if used more broadly in concert with professional staff.
- Volunteer services provide opportunities for intergenerational cooperation and involvement; and,
- Volunteering in long-term care settings provides opportunities for younger Americans to prepare more effectively for their own aging through direct experiences.
Weaknesses of Using Volunteers
The use of volunteers to provide long-term care services to the elderly also has potential weaknesses, including the following:
- It is uncertain as to whether, and the extent to which, individuals will move to meet the sustained needs of fellow citizens who need help in old age. Americans have a long history of volunteering, but there is little experience in the long-term care arena;
- Provider agencies are sometimes resistant to the commitment of staff time and funds required to capitalize on the contributions of volunteers;
- There is a general perception that volunteers are unable or unwilling to perform many of the roles and services which right be required in the long-term care of the elderly (e.g., some types of personal care such as bathing and using the toilet);
- The service needs of the long-term care population may be seen by some provider agencies as requiring primarily technically-oriented services from professional caregivers, thus excluding the use of volunteers in other supportive or complementary roles; and
- There are legal issues related to the liability of volunteers and their sponsoring organizations in providing services to the elderly and their families.
Assessment
-
General Feasibility and Practicality. Volunteerism, as a broad system of services, is characterized by inherent flexibility in that it permits a matching of the skills and interests of the volunteers with the needs of those receiving services. There are many models of volunteerism in the U.S. as well as in Europe, particularly England, which may be adaptable to many of the needs of the long-term care population in the U.S. volunteer systems have the potential to link effectively with acute care systems (e.g., in hospital and other institutional settings) and can also play an important ancillary role in long-term care services (e.g., providing some types of in-home supportive services) which may be needed by elderly persons or their families.
-
Quality of life/dignity of the individual. Volunteerism can help promote the quality of life for both the elderly requiring long-term care services as well as their primary caregivers. The flexibility inherent in volunteer systems, as opposed to more traditional systems of care, which are often rigidly structured, may be an efficient and highly beneficial way of meeting many of the individual and personal care needs of the elderly and their families. Hospice volunteers, for example, are trained to be available and sensitive to the changing needs of service recipients and their families. This flexibility can help to ensure that those needing services receive assistance where and when it is most needed and helpful.
-
Strengthening the Family Unit. Volunteers can serve to strengthen the family unit by providing important respite care and other personal services to primary caregivers which may, in turn, give a level of support needed by families to continue care for an elderly person over a longer period of time than might otherwise be possible. Such services may also help to prevent unnecessary or premature institutionalization of some older persons particularly those with functional impairments. The use of volunteers may also serve to ease some of the financial burdens on families in caring for the elderly through the provision of unreimbursed volunteer service rather than the purchase of a paid service.
-
Public Expenditures. Although available cost information is limited, it suggests that volunteer activities and services can potentially be a highly cost effective approach to providing many in-home, rather than institutional services, e.g. in-home hospice services. In many cases, the use of volunteers may require minimal, if any, governmental financial support. The vast majority of volunteer services are provided without direct governmental financial support. There are also some volunteer activities in which the source of support is mixed, i.e., both public and private sector investments are made to support volunteer program development, administration, and implementation.
D. SPECIAL ANALYSIS OF IMAS, LONG-TERM CARE INSURANCE AND COMBINATION APPROACHES
In March 1986, the Department initiated a series of special analyses designed to assess the potential of IMAs and long-term care insurance as mechanisms for protecting consumers against the catastrophic expenses often associated with long-term care. The analyses included the development of IMAs and insurance prototypes to explore features and costs, and the design and assessment, using a microsimulation model, of the impact of IMA and insurance models. In addition, the potential of several combinations of insurance with other approaches, such as IMAs, was explored.
1. Special Analysis of Individual Medical Accounts
Approach to Analysis
As a first step in detailed assessment of IMA proposals, prototype IMA proposals were outlined, exploring possible features and costs. Development of these prototypes involved decisions along six basic dimensions:
Who can save in an IMA? For the analysis described later in this section, it was decided that everyone would be allowed to save, whether or not the individual was a wage earner, and whether or not the person had taxable income in a given year. Similarly, no limits were specified on the age of the saver.
Who can they save for? For this section's IMA analysis, it was assumed that individual accounts would be established, with married couples allowed to have two. Accounts could be spent only on the saver. A more expansive alternative might permit spending on the long-term care needs of spouses, parents, step-parents, parents-in-law, adoptive and foster parents.
What can the savings be spent on? Proposals modeled in this section were limited to coverage of nursing home care or long-term care insurance as a basic model. An expansion of the basic prototype might permit spending on home and community-based care. Contributions for an expanded model would be higher and impacts on nursing home expenses would be smaller, accordingly, than those described below.
How can it be assured that the savings are spent on long-term care? Proposals modeled in this section are limited to coverage of nursing home care or long-term care insurance for which documentation is relatively easy to obtain. Simple forms of documentation that could be validated for tax purposes would be much more difficult to develop if expenditures for home and community-based care were included as well.
How much can be saved and sheltered from taxes? Estimates for a range of options are possible, depending on what types of care or insurance the savings are intended to cover, the estimates of inflation, and the projected loss to the Treasury.
What tax treatment will the savings receive? Most proposals treat IMAs like the current IRAs for taxation in the year contributions are made. The age of mandatory withdrawal of funds is generally removed or delayed since the need for long-term care increases in the older age groups and one wants to encourage holding funds until needed. Another possible variation would not tax withdrawals after age 65 unless expenses exceed an established threshold, such as $20,000 per year.
While the IMA analysis in this section examines options which offer tax deductions, credits are also possible. Offering tax credits rather than deductions will affect the desirability of an IMA for various income groups. Credits generally are more attractive to lower and moderate income populations.
What happens to savings that are not needed for long-term care? Unspent IMA savings are generally treated as part of the estate upon the account holder's death. However, it is possible to require that some of the account revert to a pool to cover catastrophic expenses of account holders, as is the case with the Bowen-Burke proposal analyzed later in this section.
Development of IMA Specifications
Specifications for two possible IMA options were developed. For both, estimates of the amount that would have to be contributed to assure that sufficient funds would be available when needed were provided by actuaries at the Social Security Administration (SSA). Participation rates (i.e., the percentage of people who would contribute any funds if the option were available) were estimated, based on 1984 tax return information on IRA deductions, as compiled by the Internal Revenue Service.
The net impact of each IMA proposal on out-of-pocket and Medicaid expenditures for long-term care services was then projected by using a micro-simulation econometric model developed jointly by researchers at ICF, Inc., and the Brookings Institution. As indicated above, the premium estimates and contribution assumptions used in the Brookings/ICF model estimates were provided by the Department.
Combination IMA/Insurance Prototype
The possible impact of combining the IMA concept with long-term care insurance was also assessed. Under this combination option, the projected impact of tax-favored accounts which set aside funds for the purchase of long-term care insurance (rather than for the direct purchase of long-term care services) was estimated.
As noted earlier, the combination of IMAs and long-term care insurance is attractive for two reasons. First, relatively few people will require extended nursing home stays. As a result, much of the tax-favored savings accumulated in a "pure" IMA would never be spent on long-term care, but would simply pass to heirs or beneficiaries when the account holder died. Second, those who will need nursing home care have to save a very large amount of money in an IMA to pay for such services from their individual savings.
A combined approach requires an individual to save far less to obtain protection--only the cost of insurance--since the risk is pooled with other individuals. The results of the analyses of the IMA/insurance proposals are reported later in this section, along with a discussion of other types of insurance combination strategies.
Amounts to be Saved
In order to estimate how much needs to be saved in an IMA, a variety of data were considered. As noted earlier, Medicaid reimbursements for care in skilled nursing facilities ranged from about $8,000 to $38,000 per year in FY 1983 (the latest data available), depending on the State in which the facility is located, and averaged about $15,000 per year. Services in intermediate care facilities are known to be lower in cost.
In general, private-pay patients are thought to pay 20 to 30 percent more for services than Medicaid does. Thus, after adjusting for inflation, costs for a private-pay patient in a skilled nursing facility would average about $21,400 to $25,000 per year. This is consistent with data from the American Health Care Association indicating that nursing home care averages $22,000 per year.
The cost of home care varies even more widely, since such costs depend on what combinations of services are needed and which of those needed services must be paid for and which are available from family members and other unpaid caregivers. Round-the-clock professional nursing care is much more expensive than nursing home care; on the other hand, homemaker's services for a few hours a day might cost half or less of nursing home costs, even for five-day a week assistance. The basic IMA prototype focused only on nursing home care, in part, as observed earlier, because so little data were available on which to base reliable utilization and expenditure estimates for home and community based care, and, in part, because extended nursing home stays are the major contributor to catastrophic expenses for long-term care.
Features of A Prototype IMA for Long-term Care
Features of the prototype developed for the analysis include the following:
-
Individuals contribute to individual accounts through age 64 only.
-
Contributions must be capable of accumulating a fund at age 65 sufficient to provide the inflation indexed coverage amount for a nursing home stay equal to the expected average amount of time spent in a nursing home.
As developed by the actuaries for this analysis, expected future nursing home use after the age of 65 was estimated as: 2.2 years, 2.1 years, 2.0 years, and 1.9 years, on average, for persons who begin contributing at ages 30, 40, 50, and 60, respectively in 1986. These estimates are based on nursing home population counts from the 1977 National Nursing Home Survey, adjusted to reflect a 37 percent increase due to induced demand (See Appendix 4 for a discussion of induced demand adjustments). The higher expected utilization for younger ages reflects expected increases in life expectancy.
-
All unused funds pass on to the decedent's estate or beneficiary at death.
The estimates developed by the SSA actuaries identified the amount which an individual would need to save each year through age sixty-four for this nursing home coverage. The contribution estimates are based on the assumption that no interim withdrawals are made from the accounts for any reason--hence, that all interest accumulates free of Federal income tax.
Table 3-5 shows the amount that a person would have to save each year to accumulate enough money by age 65 to meet the expenses of a nursing home stay. Two amounts are estimated, each using a different assumption about the future rate of inflation in the cost of nursing home care. Historically, inflation in the nursing home sector has been higher than general inflation.
The first estimate assumes inflation at the rate of increase of employee compensation, which is the inflation rate for the cost of nursing home care included in the intermediate (i.e., alternative II-B) assumptions of the Old Age, Survivors, Disability Insurance and Health Insurance (OASDI and HI) Trustees Reports. A second estimate is also included, with inflation lower than the II-B assumptions in the Trustees Reports but at ten percent above the Consumer Price Index (CPI). The second estimate is included because of the inherent uncertainty in projecting impacts for long periods, as necessary for this project, and because it is possible that cost-saving developments in nursing home technology could reduce the rate of inflation in nursing costs relative to general inflation.
The IMA prototype developed would limit contributions to the amounts shown in Table 3-5. Persons who save the maximum amount would accumulate enough funds to pay for the expected length of stay in a nursing home, under the assumption of a 6.08 percent rate of return on savings, the alternative II-B assumptions in the Trustees Report. The contribution rates include an adjustment for adverse or anti-selection and induced demand.
The Effect of Inflation on Contributions
As Table 3-5 indicates, the effect of higher inflation for nursing home costs is very substantial. The higher inflation assumption adds 47 percent to the savings needed starting at age 50; 58 percent at age 40; and 72 percent at age 30. (The younger the age, the more years the differential inflation rate has to affect the savings needed). The age of the person when he/she begins to save also has a major effect: the necessary savings rates for persons beginning at age 50 are more than double those who begin at age 30. This is because the older person has fewer years in which to accumulate necessary savings.
The Experience with IRAs
To estimate the probable participation rates and effects of IMAs, a distribution of potential savers, by age, sex and income levels, must be assumed. A distribution of the amount saved must also be assumed, since not all savers can be expected to save the maximum amounts. The best prior experience on which to base estimates of IMA savings is the experience with IRAs, which have been available to all wage earners and their spouses since 1982. The latest information on IRA savers is for 1984, and was discussed earlier in Section C.1.
IMA Options Analyzed
IMA options could take several forms ranging from an expansion of current law IRAs to include IMAs, to the establishment of separate IMAs in addition to or in place of current law IRAs. Two basic IMA options were examined in this analysis:
-
Expand Current IRAs:
-
This option was designed to have maximum appeal.
-
The limits of current IRAs would be increased by $1,000, raising the maximum contribution to $3,000 for an individual and $6,000 for a working couple.
-
The extra $1,000 is treated as an individual medical account for nursing home expenses.
-
Individuals would be permitted to withdraw funds from the IRA to pay for nursing home expenses without payment of taxes after age 65. Withdrawals for other purposes would continue to be taxed at the individual's current marginal tax rate.
-
Remove the requirement that individuals begin withdrawals from their IRA savings by age 70 1/2 as well as the restrictions on contributing to the account after the age of 59 1/2.
-
Assume that all those who save the additional $1,000 would leave it untouched until the need for long-term care arises, or until death, whichever comes first.
It was originally planned that the analysis would continue by examining the potential of completely separate IMAs for long-term care in addition to retaining the existing IRA's. However, the system-wide effects of the expanded IRA option were very small, and it seemed clear that the effects of additional, separate IMAs dedicated to long-term care would be even smaller. Hence, the decision was made not to pursue this option.
To explore further the possibilities of IMAs, and in the light of possible Congressional tax reform action eliminating IRAs for those with pensions, a second IMA option was analyzed. It is emphasized that the second option is clearly an upper bounds estimate for the possibilities of IMAs. It is used only for exploratory purposes. The option assumes that IRAs are eliminated, and that all those who now save in IRAs will do so in IMAs, in the same amounts as in their IRAs. The option is outlined below.
-
-
Replace IRAs with IMAs:
-
Current IRAs would be eliminated.
-
IMAs for long-term care would be established in the tax code with a maximum contribution of $2,000 per year.
-
Assume that everyone who currently participates in IRAs would contribute to the new IMAs, and in the same amounts.
-
Tax treatment of contributions and earned interest is the same as that for IRAs.
-
The amounts saved would be used for long-term care expenses as needed after age 65 and would be tax free if used for that purpose.
-
Estimating the Effects of IMAs
A model recently developed by the Brookings Institution and ICF Incorporated was used to estimate the potential of IMAs to protect consumers against catastrophic expenses associated with the need for nursing home care. The model is a micro-simulation model designed specifically to provide estimates of long-term care utilization and expenditure patterns. The model is based on data and assumptions that allow the user to estimate patterns of earnings, asset accumulation, and disability, and the effect of those factors on the utilization and financing of long-term care over the years 1986 to 2020. The model includes the probability of disability and of institutionalization, length of stay in an institution, and probability of use of noninstitutional services.
The model is the best currently available for long-term care financing projections, and it builds on previous modeling efforts. The model is summarized in Appendix 5. Details of the model are described in a draft documentation report (ICF, 1986).
As with any model, it can only attempt to simulate reality, and there are some simplifying assumptions which are necessary. Most important for these estimates are the following:
-
Supply is assumed to adjust to meet demand. Because trends in the supply of nursing home beds have been erratic and unpredictable, no readily available methods exist to forecast supply. The assumption is fairly reasonable for the long modeling period used.
-
General inflation, as measured by the Consumer Price Index (CPI), is assumed to follow the course of the estimates in the OASDI and HI Trustees Reports (Alternative II-B). As discussed earlier, there are different views on the possible level of future inflation in nursing home daily charges, so two estimates were used. One assumed that inflation would be ten percent above the CPI, the other that it would be the same as the Medical Care inflation estimates in the Trustees Reports, which were projected at the expected rate of increase of wage-earners compensation. As will be seen, the assumption on specific inflation is very important in the findings.
-
Age-specific rates of utilization of nursing home services were estimated using the National Nursing Home Survey of 1977 (the latest data available), with some adjustments for changes believed to have occurred since then. These age-specific rates are held constant in the model. Hence if there is a trend toward a more disabled population in the future (as some disabled persons live longer) or toward a less disabled population (if cures or palliative treatments are found for some disabling conditions), these estimates will be high or low, accordingly.
-
The model assumes that persons will first spend their current income for long-term care (after exhausting whatever Medicare benefits they are eligible for), then their assets, and finally will draw on Medicaid. Thus, no divestiture of assets to others to qualify for Medicaid is assumed.
-
Even the last five-year period covered by the model (2016-2020) does not capture the anticipated peak of long-term care utilization of the "baby boom" generation, thus, perhaps, underestimating the impacts of private financing approaches somewhat for long-term care utilization beyond 2020.
Who will participate in IMAs?
Expanded IRA Option. As indicated above, almost all persons who will save in IMAs are those who are already contributing the maximum in IRAs. Not all of them would contribute to an IMA, and not all of those who do would contribute the maximum. For purposes of estimating the first option (the expanded IRA), however, it was assumed that 90 percent of those who saved the maximum in an IRA account in 1983 would save to the new maximum amount of $3,000. This is an optimistic assumption. The second option (replacing IRAs with IMAs) assumes that rates of IMA saving by income are similar to those of IRA contributors in 1983, and therefore have similar characteristics to those shown in the review of IRAs.
With the rise in income over time, the proportion of contributors is also projected to rise, reaching the level of 28 percent by 2018. (Projections from the Brookings/ICF model are presented as five year averages. The year 2018 is the mid-point of the period 2016-2020.) The proportion also rises over time because of variation in income -- persons who cannot contribute the maximum in one year may be able to do so in another, and the total who have ever contributed rises. However, even by 2018 less than a third of the elderly population would have ever contributed the extra amount above the present $2,000 limit in a given year, and the proportion is only 40 percent for those with incomes of $50,000 or more.
The likelihood of contributing the maximum is also related to sex, marital status, and whether or not the person is a homeowner. Table 3-6 shows the proportion projected to hold accounts over time classified by those variables. Males are much more likely than females to hold accounts in which they have deposited the $3,000 maximum at least once, both because income for males is higher than income for females, and because most current husband-wife households decide to put the maximum in the account of the husband before that of the wife. By 2018, almost half of all elderly males are projected to have contributed the $3,000 maximum to an IRA in one or more years.
Married persons and homeowners are also somewhat more likely to contribute the maximum than those who are not married or who do not own their own homes, but the differences grow much smaller by 2018.
Projections of Nursing Home Utilization by the Elderly
As described earlier in this report, nursing home use by the elderly is projected to rise over the next several decades in response to the rapid growth of the elderly population, particularly the very old. Table 3-7 shows the total expected elderly population and the population in nursing homes, by age, for 1986, 2000, and 2018 based on projections from the Brookings/ICF Long-Term Care Financing Model. The projections are similar to those discussed in Chapter 2 of this report.
The projected proportion of the elderly who will be in nursing homes rises from 7.0 percent to 8.8 percent between 1986 and 2000, and then falls to 8.0 percent by 2018. This pattern is not due to increases in age-specific nursing home use, but to the effects of relatively large cohorts from the high birth rates of the 1920s and the post-World War II period, and a small cohort from the-low birth rates of the 1930s and war years. In raw numbers, the nursing home population will double over the 32 years.
The rise in the proportion of the nursing home population which is 85 and over is due to the projected decrease in mortality -- a much larger proportion of the elderly population will be in the oldest group in 2018 than currently and rates of nursing home use for those 85 and over are much higher than for the age groups 65-74 and 75-84.
Inflation and Projections of Aggregate Nursing Home Charges
Projections from the Brookings/ICF model indicate that aggregate nursing home charges for the elderly will increase sharply over the next 32 years to about $98 billion in constant (1987) dollars in 2018, even if there are no changes in present long-term care financing policy (that is, no increase in IRA limits, other than those needed to offset general inflation, and no special IMAs established for long-term care). These projections are based on demographic and inflation assumptions (alternative II-B) included in the Medicare Trustees Report. The increase is partly due to the projected increase in the nursing home population described above, and partly due to specific inflation in nursing home charges. As shown in Table 3-8, over the 32-year modeling period being examined, the difference in estimates between the two inflation assumptions is large.
Total nursing home charges would be almost fifty percent higher in real terms (measured in dollars at 1987 prices) under the employee compensation assumption and, by 2018, will be over three times as large as the $30 billion spent by the elderly on nursing homes in 1986. At the lower inflation rate, they will be a little over twice as large as in 1986.
The different inflation rates also produce differences in the sources of funds for payment of the nursing home expenditures. Table 3-9 shows the sources of funds in 2018 under the two different assumptions about nursing home inflation rates and the percent difference between the effects of the two rates.
The impact of the additional charges from the higher inflation assumption among sources of payment is quite uneven in 2018. The increase in payments from current income is quite small (2.7 percent), as few patients in nursing homes had additional current income they could spend above the amount required to meet charges at the lower inflation level. The increase in the amount coming from patients' assets, 57.1 percent, is greater than the increase in total charges, 48.4 percent. More patients use up more of their assets at the higher level of inflation. The total effect is an increase in out-of-pocket spending of $9 billion, or about 22 percent, under the higher inflation assumption.
The impact of the higher inflation rate on projected Medicaid spending is quite severe, with increases about double the rate of increase of total charges. Medicaid spending is almost twice as high at the higher inflation level than at the lower, and is almost four times as high in real terms as in 1986 at that higher inflation level, nearly $50 billion.
Effects of IMA's on Out-of-Pocket Costs and Medicaid Costs
In order to assess the effects of the IMA options over a long period of time, it was first necessary to project nursing home expenditures over the next 32 years assuming no changes from the present laws or regulations. The Brookings/ICF model includes the necessary demographic characteristics, and they can be accurately predicted for cohorts of persons already born. It also includes the alternative II-B assumption on inflation in the OASDI-HI Trustees Report. Table 3-10 shows the sources of payment for nursing home expenditures for this initial set of projections. These projections provide a set of baseline estimates, referred to as the "base case", against which the effects of various policy changes can be compared. It should be noted that these estimates include nursing home expenditures only for the elderly. Expenditures for those under age 65 are not included in the simulations.
When the model is run again with a specific policy option, such as the expanded IRAs, the differences in projected policy variables, such as source of payment for nursing home expenses, provide a measure of the effect or impact of the option in selected years.
Impact of Expanded IRA's
After establishing the base case, the model was used to project future aggregate nursing home charges according to source of payment under the assumption that the expanded IRA was in effect. The features of the expanded IRA option include: increase IRA limits by $1,000 and eliminate the requirement to begin withdrawals at age 70 1/2. Table 3-11 shows total nursing home expenditures by source of payment for this option.
The differences between Table 3-10 and Table 3-11 represent the effect of adding the additional $1,000 to the IRAs, and removing the requirement of drawing the money out beginning at age 70 1/2, under the higher inflation assumption. Projections are shown in constant dollars (1987) for comparability. Total nursing home expenditures are expected to increase slightly over the base case in 2000 and 2018 under the expanded IRA option. This increase is a result of a small shift in payment source from Medicaid to the IRA at higher, private pay rates. The effects of the expanded IRA option by 2018 are summarized in Table 3-12.
As one measure of impact, the additional IRA savings would pay for about 3.0 percent of total nursing home costs by 2018 almost $3 billion in constant dollars. The availability of the IRA savings would reduce other out-of-pocket spending by 4.3 percent compared to the base case, most of it from the current incomes of high income persons.
Medicaid would save about $400 million by 2018, split between State and Federal spending--about 1.3 percent of projected Medicaid spending in that year. The low Medicaid savings result from the fact that almost all of the additional IRA savings would be held by persons wealthy enough to pay for nursing home care almost entirely from their current incomes, without tapping their assets. As a result, they never spend down to Medicaid eligibility levels. This finding implies that nursing home charges do not represent a catastrophic expense to them.
At the lower inflation level (not shown), the conclusions are similar. Medicaid savings are even lower, about 0.7 percent, or $200 million.
Impact of IMA's
Under the second option, current IRAs are assumed to be eliminated and IMA's are assumed to be established in their place. All who currently participate in IRAs are assumed to contribute to IMAs, and in the same amounts.
This option was developed to explore the "upper bound" estimate of the maximum possible effects of IMAs. It is extremely unlikely that the IMA option would attract the savings that IRAs do, even if IRAs were eliminated, since their use would be restricted to nursing home expenses, while IRAs can be used for any purpose after age 59 1/2. "Upper bound" impacts are instructive for their order of magnitude, but they should not be considered to be the likely impact of such an option. With this consideration in mind, the estimated impacts in 2018 of this IMA option as compared to the base case are summarized in Table 3-13.
As expected, the IMA option has a considerably larger effect than the expanded IRA option. While total charges still rise only a small amount above the base case (due to some Medicaid payers who shift to private pay at a higher rate from their IMAs), Medicaid costs are about $2 billion or 3.7 percent less than the base case. Most of the impact is on out-of-pocket costs, however, with dependence on current income reduced by over $4 billion, and on assets by $1.5 billion.
Conclusions
Based on this analysis, the potential of pure IMAs to reduce Medicaid costs appears to be very limited, even before tax losses to the Treasury are considered. The potential for providing catastrophic protection also appears limited, since the IMA substitutes principally for other income or savings.
If experience with IRAs is a valid predictor, affordability is a major problem and participation rates are likely to be low, especially among low and lower middle income persons and families.
In addition to affordability, a major difficulty inherent in individual savings approaches to financing long-term care directly is the fact that even if a person were to save enough to pay out-of-pocket for the average nursing home stay, the savings would be insufficient for long stays and far too much for those who never needed nursing home care or who needed very limited amounts of care. Further, the inherent target inefficiency of individual tax shelter approaches for future nursing home care would probably make the cost much greater than the gain. However, it is possible that, when savings approaches are combined with risk-pooling approaches, such as insurance, a much greater target efficiency can be obtained. On these grounds, approaches that encourage tax favored savings for long-term care insurance may well be worth considering. A variety of such plans, linking the IMA concept to long-term care insurance, are discussed below.
2. Special Analysis of Long-Term Care Insurance and Insurance Combinations
In this section, the findings of a series of new analyses are presented on the costs, affordability, and impact of a number of alternative insurance approaches as well as specific policy features, several of which have never been tested in the marketplace.
The first part of this special analysis examined the effect of various policy features on premium levels. Since current offerings in the long-term care insurance market are fairly limited, it was necessary to develop and test a series of prototype or hypothetical policies to understand the effects of a wide range of policy features.
The second part of the analysis involved specifying selected policies and premiums, and developing assumptions about affordability in the population. These specifications were then used in the Brookings/ICF micro-simulation model to estimate the effect on out-of-pocket and public expenditure patterns for long-term care that would result from alternative hypothetical specifications of those factors.
In addition to testing the possible impact of insurance approaches, the potential of several combination strategies also was explored, including:
- Linking long-term care insurance to savings vehicles such as IMAs;
- Linking long-term care insurance to pension benefits; and
- Exploring the linkage of long-term care insurance with Medigap insurance policies.
Design and Analysis of Prototype Insurance Policies
Premium rates for long-term care insurance are complex and depend on the interplay of a number of different factors. The marketability of insurance is influenced by the size of premium rates as well as the features of the policy.
To assess the influence of specific insurance features on premiums, estimates were made of prototype long-term care insurance policies with the following alternative specifications:
Issue age of purchasers: for ages 30, 40, 50, 60, and 65 years.
The estimates assume that the premium structure for starting ages 30, 40 and 50 is designed so that enrollees will be paid up in the year after turning age 65. For these ages, the enrollee is responsible for paying premiums until the year in which he or she has a 65th birthday, after which premiums are waived. For issue ages 60 and 65, the premiums are designed to be paid over the insurer's lifetime.
Premium levels: level premiums or indexed at 5 percent per year.
Waiver of premium: after 90 days in nursing home.
It was assumed that the policy provides for a waiver of premiums for persons who stay in a nursing home beyond 90 days.
Benefit levels: for level benefits, $50 per day nursing home payment and $25 per home health visit; for indexed benefits, starting at $50 per day for nursing home payments and $25 per home health visit, with premiums increasing by 5 percent each year.
Benefit period: 4 years, after meeting deductible.
Deductible: 30 days or 90 days in a nursing home before covered services (either nursing home or home health) begin. This period is also known as the "elimination period".
For estimation purposes, it was assumed that persons who pass into a benefit period will use up all benefits they are entitled to receive. Thus, it was assumed that a person staying in a nursing home for two years after the deductible period and then discharged, would also use two years of home health care at three visits per week if those services were covered under the policy as well. Similarly, a person discharged from the nursing home directly after meeting the deductible period would use four years of home health services.
Pre-hospitalization requirement: 3 days or none.
Most existing nursing home policies require a 3 day prior stay in a hospital before any nursing home stay can be counted towards the deductible. For analytic purposes, a second set of premium estimates was developed for policies without any prior hospitalization requirement.
Selection criteria: "select" or "group".
The select premium estimates are based upon the assumption that the insurer would be enrolling individuals who are significantly better risks than the general population. Select premium estimates assume that the groups of people enrolled will have lower utilization rates (i.e., will be better risks) in the early years of the policy but that their rates become very similar to those of the general population over time. Group premium estimates reflect general population utilization patterns.
The select rate premiums assume high marketing and administrative costs associated with individual policies. The group rate assumptions include lower marketing and administrative costs associated with group policies.
The premiums for select turn out to be higher than for groups because the effect of the higher marketing and administrative costs outweigh the advantage of insuring a lower risk group.
Guaranteed interest on reserves: starting at 7.5 percent and leveling at 5 percent.
Taxation on interest earned: zero percent or fully taxed.
The premium estimates were made using a revised version of the premium estimation model developed for the National Center for Health Services Research by Actuarial Research Corporation (ARC) (Meiners and Trapnell, 1984). The premium estimates are for hypothetical private market long-term care insurance products. Actual product prices will probably be different, reflecting the assumptions of the company offering the insurance. The estimates only approximate the relative order of magnitude of variation that might occur with different insurance features found with such products.
Table 3-14 shows the premiums for a level premium, level benefit product. The premiums for a product where both the premiums and benefits are indexed for inflation at 5 percent each year are shown in Table 3-15. These estimates provide a basis for an initial assessment of various insurance features and their relationship to affordable premiums for long-term care insurance. Selected highlights are described below.
The Effect of the Prior Hospitalization Requirement on Premiums
The requirement that the beneficiary have an immediately prior hospital stay of 3 days or more is a major limitation of most existing policies. This is because the chronic illnesses associated with the need for nursing home care are often not preceded by a hospital stay.
The ARC estimates suggest that removal of the 3-day hospital stay requirement increases premium rates by 40 to 70 percent, depending on issue age and other policy features. Comparing these estimates to an existing policy, a recently issued policy being marketed by Aetna, at issue age 65, costs about 43 percent more when the 3-day hospital stay requirement is removed. The substantial premium increases necessary are due in part to an anti-selection factor, i.e., to account for the fact that higher risk individuals are more likely to choose this option.
The Effect of Taxation of Interest on Reserves on Premiums
Most current policies use a premium rate structure that is fixed at issue age, at a rate that remains level over the life of the policy. Because the risk of using services increases as people age, this feature implicitly involves the accumulation of reserves by the company. Accumulated reserves are currently taxed at the corporate rate (which averages 46 percent).
One possible strategy for encouraging the market is to allow accumulated reserves to be tax free. If such tax savings were passed along to the consumer in lower premium rates, the estimates indicate that premiums at issue age 65 could be reduced by about 16 percent. If the policy were purchased at age 50 with contributions leading to paid up coverage at 65, the premium would be reduced by about 47 percent.
It is also interesting to note that this type of a tax change favors earlier purchase of the insurance. For example, the cost of an inflation-indexed policy--90-day deductible, no prior hospital stay required--is about 44 percent less per year when begun at age 40 than when begun at age 50. With taxes on reserves, the same policy would cost only 28 percent less per year at age 40.
The Effect of Inflation Adjustments on Premiums
As noted, most current long-term care insurance products do not adjust for inflation. Incorporating an adjustment, however, involves more than just straight indexing of premiums and benefits. Because the benefits are paid, on average. much later than the premiums, an upward adjustment of the whole beginning premium structure is necessary to accommodate the future inflation costs. Therefore, both premiums and benefits must take inflation into account. This adjustment affects premiums dramatically.
The estimates indicate that, at older issue ages, the beginning premium for a 5 percent inflation assumption is in the range of 30 to 40 percent higher (Table 3-14 compared to Table 3-15). At younger issue ages the necessary adjustment is dramatically higher--by a factor of between 4 to 6 times greater--making the attractiveness of prefunding substantially less than is often assumed. This analysis reveals why insurers are hesitant to offer inflation adjusted products. Without such adjustments, however, the value of coverage will erode substantially over time.
Premium Estimates for Long-Term Care Insurance and Insurance Plans Linked with Savings Vehicles--IMA Insurance Prototypes
As noted earlier in the section on Individual Medical Account strategies, proposals to combine a dedicated, tax-favored savings account with long-term care insurance were viewed as promising options worthy of further analysis. Estimates of the contributions and premiums necessary for several combination approaches were developed by actuaries from the Social Security Administration. In order to assure consistency between the assumptions and data used to make the premium and contribution estimates, as well as to facilitate analysis of combined approaches, the SSA actuaries (rather than ARC) provided both sets of estimates.
The combined IMA and long-term care insurance estimates were developed to cover nursing home care only, in part because the need for nursing home care is the major contributor to catastrophic expenses associated with long-term care. In addition, however, the data on the costs and utilization of home and community care services are not readily available and it was felt that any estimates that included such services would be highly unreliable.
Estimates were developed for annual contribution and premium rates that would be required for six different plans, all of which provide nursing home coverage starting at age 65. The six plans represent a continuum of options from pure IMA to pure insurance. These plans formed the basis for choosing which combinations of IMAs and insurance would be examined further with the Brookings/ICF simulation model.
Features of the Six IMA-Long-term Care Insurance Plans for which Estimates Were Developed
Except for Plan 1, which is a pure IMA design, all of the plans for which estimates were developed have an insurance feature. Plan 4 was designed to incorporate features of a long-term care plan first outlined in 1985 by Bowen and Burke (1985).
Plan 1: Pure IMA: This plan was discussed in the earlier section on IMAs. In summary, individuals contribute to individual accounts through age 64 only, accumulating a fund at age 65 sufficient to provide the specified indexed coverage amount for a nursing home stay of average length after reaching age 65. All funds are untaxed until death, at which time they are taxed as part of the estate.
The nursing home utilization rate estimated for this analysis is: 2.2 years, 2.1 years, 2.0 years, and 1.9 years, on average, for persons who begin contributing in 1986 at ages 30, 40, 50, and 60, respectively; and 2.6 years, 2.5 years, 2.4 years, and 2.3 years for those who begin contributing in 2021 at ages 30, 40, 50, and 60, respectively.
Plan 2: IMA Contributions Split 2/3, 1/3: Individual contributions each year are split, 2/3 to an individual account, 1/3 to a pooled fund. Each fund retains its own interest. For nursing home use at age 65 and over, the individual account is exhausted first. Thereafter, additional use is covered from the pooled fund. Any remaining amount accumulated in the individual account at death goes to the estate. Contributions are waived while in a nursing home at age 65 or older.
Plan 3: IMA Contributions Split 1/2, 1/2: Same as Plan 2 except funds are split half and half between the individual account and the pooled fund. Each fund retains its own interest.
Plan 4: IMA Interest Split 1/2, 1/2: All contributions are deposited into an individual account, along with one-half the interest on the individual account. The other half of the interest goes into the pooled fund. All interest on the pooled fund remains in the pooled fund. Any remaining amount accumulated in the individual account at death goes to the estate. Contributions are waived while in a nursing home at age 65 or older.
Plan 5: IMA/Insurance with Modified Return of Premium: Accumulated contributions/premiums are returned only if death occurs before age 65. Starting at age 65 all nursing home use is covered at the indexed coverage amount. Premiums are waived while in a nursing home at age 65 or older.
Plan 6: Pure Insurance: No funds are returned at death. Starting at age 65, all nursing home use is covered at the indexed coverage amount. Premiums are waived while in a nursing home at age 65 or older.
Table 3-16 and Table 3-17 present the estimates of annual premiums and contributions for the six plans based on different rates of inflation. Estimates are given for plans beginning in years 1986 and 2021, for issue ages 30, 40, 50, and 60. The estimates are provided for both 1986 and 2021 so that the effect of declining mortality during the years covered by the Brookings/ICF model will be reflected. Each plan is shown both with contributions and premiums paid-up by age 65 and with contributions and premiums to be paid for life.
Assumptions Which Underlie the Premium and Contribution Estimates
Coverage is assumed to be $50 per day at issue, indexed thereafter. Average nursing home rates for private pay patients were about $60 in 1986, so this amount reflects about a 17 percent co-payment. The contributions and premiums are for the issue year and are also indexed after issue.
The difference between the estimates in Table 3-16 and Table 3-17 is the rate of indexing of annual nursing home coverage and premium amounts. As noted earlier, the rate of indexing of nursing home coverage has an important effect on the estimated premium levels.
For Table 3-16, both contributions/premiums and coverage are indexed at 5.8 percent annually, consistent with the "ultimate" intermediate (alternative II-B) assumed rate of increase in medical service costs for the 1986 OASDI and HI Trustees Reports. (This rate equals the assumed rate of increase in employees compensation.) Table 3-17 shows estimates with indexing at 4.4 percent, reflecting a much more modest rate of indexing for nursing home coverage.
All contributions and premiums are computed assuming that each participant makes a payment every year, as required by the plan. It is assumed that contributions and premiums for plans 1 through 5 are made at the end of each year. For plan 6, premiums are assumed to be paid at the beginning of each year.
Nursing home utilization rates are based on data from the 1977 National Nursing Home Survey and were adjusted to reflect expected antiselection and induced demand for those who would voluntarily choose to purchase nursing home coverage. Induced demand adjustments reflect the judgment that increased insurance for the costs of nursing home care will increase the demand for nursing home care by those insured. The adjustment factor for induced demand is 37 percent, as indicated on the tables, and its calculation and rationale are described in Appendix 4: Induced Demand.
Mortality rates used in calculating contributions and premiums are the intermediate (alternative II-B) assumptions of the 1986 OASDI and HI Trustees Reports. The "unisex" figures provided in Table 3-16 and Table 3-17 are based on the assumption that equal percentages of the male and female population will participate. If participation were larger for females, contributions and premiums would be much higher because of the greater life expectancy of women.
The interest rate assumed for all estimates is 6.08 percent, the "ultimate" value included in the intermediate (alternative II-B) assumptions of the 1986 Trustees Reports.
All estimates include a 1.8 percent administrative cost factor, the same as for SSA's HI program. If insurance is provided on a substantially smaller scale by private companies, with their usual sales commission and profits, the administrative expense factor would be higher.
Analysis of the Results of Premium Estimates
Analysis of the results presented in Table 3-16 and Table 3-17 indicates that the longer one waits to begin contributions to any of the options, the more expensive they are on an annual basis. The effect is especially dramatic when the concept of pre-payment of premiums by age 65 is applied. The lifetime premium approach lowers the pure insurance starting premiums (plan 6 - 5.8 percent) by 30 percent at issue age 30 and by 50 percent at issue age 50 compared to the paid-up approach.
The least expensive option is pure insurance. The benefits of risk pooling are evident even with the three combination plans. Plan 3 is less expensive than plan 2 because more of the funds are directed to the insurance pool.
The difference between plans 3 and 4 is not quite as straight forward but the principle is the same. The more the funds are directed into the risk pool, the less the necessary contributions. In plan 4, earlier participation results in more of the funds being directed into the insurance pool. For early issue ages, this effect is enough to offset the fact that only half the interest earnings each year are contributed to the insurance pool.
The importance of the inflation assumption is seen again in the estimates in Table 3-16 and Table 3-17. The higher the expected inflation, the higher the necessary starting premiums. The required inflation adjustment is higher with the paid-up by age 65 approach than when lifetime payments are assumed.
The alternative inflation assumptions also provide a rough indication of the effect of underestimating the inflation factor. For the pure insurance approach, with lifetime premium payments starting at age 30, the premium will be underfunded, on average, by about 36 percent if a 4.4 percent nursing home inflation factor is assumed when in fact the real rate of inflation is 5.8 percent.
The effect of underestimating the inflation factor is lower with older issue ages. For issue age 60, the comparable figure is about 17 percent. These figures are somewhat misleading as indicators of the degree of the problem because they reflect only the average rate of underfunding. The degree of underfunding increases over time and is highest in the later years when use is most likely.
The final conclusion to be drawn from these results is that the premium rates even for the least costly pure insurance approach are still quite high. One reason for this is the lengthy coverage of the plans tested.
In order to determine the extent to which the use of deductible periods and limits on the years of coverage could further reduce the premiums, additional estimates were made. Approaches which include paid-up premiums by age 65 were not used because of their high cost. Rather, the lifetime premium payment approach is used.
Table 3-18 presents issue-age premiums for nursing home insurance covering $50 per day starting at age 65, with various possible lengths of coverage. All estimates assume a 90-day deductible period, and both the lifetime premiums and coverage are indexed at 5.8 percent per year after issue. Waiver of premiums is assumed for nursing home residents over age 64. Selection criteria are assumed to limit new issue ages over 54 to non-disabled persons and limit new issues at ages under 55 to persons not residing in nursing homes.
The premiums are essentially structured as if the policy achieved universal coverage among the general population. The selection criteria is substantially less restrictive than is generally assumed in products currently on the market. The estimates assume no 3-day hospital requirement. All reserves are assumed to accumulate an a tax-free basis. (As shown previously by the ARC estimates, if the reserves are taxed the necessary premiums would be higher--substantially so for early issue ages.)
The premiums are based on the same data and assumptions used for the estimates in Table 3-16 and are comparable to the pure insurance estimates (Plan 6). The premiums are reduced because of the addition of the 90-day deductible and varying lengths of coverage. The estimates include a factor for induced demand on the part of those individuals who voluntarily chose to purchase the coverage. The lowered out-of-pocket cost of entering a nursing home after insurance has been purchased is assumed to influence utilization. The assumed increase -in premiums ranges from 10 percent to 23 percent for coverage ranging from one year to unlimited years.
A comparison of the estimates in Table 3-18 and Table 3-16 indicates that the 90-day elimination period reduces starting premiums by about 20 percent, regardless of issue age. Cutting back from full coverage (with the 90-day deductible) to four-year coverage reduces premiums by 28 percent. A two-year policy is 35 percent less than a four-year policy. The effect does not vary substantially by age.
Prototype Analysis--Conclusions
The preceding prototype analysis provides several insights useful for the simulations of the potential impact of various insurance and combination options on nursing home expenditure patterns. The importance of inflation adjustments clearly emerged as a dominant consideration.
Premium contributions beginning as early as is practical and continuing over the beneficiaries lifetime will help this type of coverage be affordable, as will longer deductible periods before benefits begin and limits on the length of coverage. This is turn suggests the need for a reasonable level of disposable income to pay the deductible and co-payments. The SSA premium estimates are higher than current market rates for existing policies, in part because they assume that insurers will be less able to be as selective as they are now once policies are widely sold. If the SSA estimates accurately reflect the general magnitude of rates that will be necessary, then affordability concerns indicate that consideration needs to be given to more limited coverage approaches.
Estimating the Effects on Public and Private Expenditures of Insurance and Combination Approaches
The Brookings/ICF Inc. model was used to estimate the potential of various insurance options to protect consumers against catastrophic expenses associated with the need for nursing home care.
The model as specified does not adjust for induced demand: that is, if insurance for nursing home care makes people more likely to enter nursing homes, or encourage longer stays because financing is available, the model does not reflect that increased likelihood. Therefore, the results presented in this section do not reflect the potential effect of induced demand. However, special adjustments of the results for the last option presented in this section were made to approximate the effect of induced demand as an example of the impact of this concern. These results are discussed at the end of this section.
Private Market Policy Simulation
The estimates focused on a new policy recently issued by Fireman's Fund. The new Fireman's Fund policy was chosen because it reflected the most recent thinking of a company that has been marketing long-term care insurance for an extended period of time.
The policy reflects some major changes from earlier offerings. Most significant is the extension of benefits from 4 to 6 years and the introduction of an optional inflation-adjusted benefit and premium structure. The Fireman's Fund inflation adjustment is significantly more limited than assumed in the SSA estimates presented earlier. It covers only 10 years (rather than lifetime) beyond purchase, and the 5 percent annual increase is not compounded over that period. Nonetheless, it reflects a real world policy that attempts to deal with inflation.
Other features of the policy include a 100 day deductible period, $50 per day benefit, and a three day hospital stay requirement. The policy also includes a very limited home health benefit tied to the use of nursing home care paid by the policy. At age 65, the annual premium charged for this policy is $506.
To simulate the effect of a market for this policy, the following assumptions were made:
-
To initiate the model in 1986, persons age 67-81 will be eligible to purchase the policy. After 1986, policies will be purchased starting at age 67.
-
Individuals and couples were assumed to buy the insurance if they could afford it for less than 5 percent of their income and if they have $10,000 or more in assets. The asset provision reflects both the amount needed to pay the deductible as well as the assumption that insurance will only be purchased if there are at least minimal assets to protect.
-
No one who is disabled will be allowed to purchase the policy. Individuals who become disabled after they have policies will continue to hold the policy.
The 3-day hospital requirement will result in only 75 percent of those policy holders who enter the nursing home receiving benefits.
-
If an individual's income declines after purchasing the policy so that the premium is no longer less than 5 percent of income, it is assumed the individual will keep purchasing the policy as long as the premiums are less than 7 percent of income and the individual has $10,000 in assets.
Under these assumptions, about 23 percent of those age 65 and over would own the Fireman's Fund Policy in the year 2018. Table 3-19, second and third columns, shows the effect on nursing home expenditure patterns for that year. Compared to the base case which assumes no insurance, these assumptions indicate that about 7 percent of the total nursing home bill is paid by insurance. The major change in expenditure patterns is with out-of-pocket expenses which decline by about 12 percent. Medicaid expenditures decline by less than 2 percent.
Combined IMA and Insurance Plans
A simulation of plan 4--the interpretation of the Bowen-Burke concept--from Table 3-16 was also conducted. The simulation was done by assuming that, starting in 1987, individuals age 30-60 can set aside funds in a special account designed to shift one-half the interest earnings every year into an insurance pool (see earlier details).
Participation rates assume that 90 percent of persons contributing the IRA maximum ($2,000) will contribute the amount shown on Table 3-16, less the indicated amount of induced demand. (This is clearly an expansive assumption, since it implies that a 60 year old would contribute $2,628 ($3,603 with induced demand adjusted premiums) for life to this account, in return for a $50 dollar per day benefit (in 1986 dollars)).
Under these assumptions, about 29 percent of those age 65 and over would have such an account in 2018. The effect on nursing home expenditure patterns are shown in the fourth and fifth columns of Table 3-19. By 2018, the combination account pays about 8 percent of the total nursing home bill. Relative to the base case, in which the combination account does not exist, out-of-pocket expenses are reduced about 11 percent and Medicaid is reduced 4 percent. The fact that this option did better with Medicaid is probably because some lower and middle income people were assumed to contribute unusually large amounts to the account by virtue of the participation rate assumption.
Pension Benefit Link
The previous simulations clearly produced very limited effects on out-of-pocket and public payments in spite of what appear to be optimistically high assumptions about rates of participation. To examine the potential effect of more broad based participation assumptions, several other ideas were examined.
The first of these options tested was to include long-term care insurance as part of an employee benefit package. To simulate this option, it was assumed that starting in 1987, individuals age 65 who start to receive pension benefits of $1,000 or more per year receive a 2-year long-term care insurance policy. The policy has a 90-day deductible period and pays $50 per day (in 1986 dollars) for nursing home care. Using SSA estimates without the induced demand factor, one-half of the cost of the insurance is deducted from the pension.
Under these assumptions about 35 percent of those age 65 and over would have a two-year policy in 2018. The effect on nursing home expenditure patterns are shown in the sixth and seventh columns of Table 3-19. By 2018, insurance is projected to pay about 11 percent of the total nursing home bill. Out-of-pocket expenditures decline by about 11 percent relative to the base case, very similar to the previously discussed options. Medicaid expenditures, however, decline by nearly 8 percent suggesting that the link with pensions does a better job of getting insurance protection to those who are more likely to need Medicaid to pay for nursing home care.
Medigap Link
A second broad based option tested the idea that those who purchased medigap insurance would also buy insurance for long-term care. To simulate this option, it was assumed that, starting in 1987, individuals age 67 and over purchased a 1 year long-term care insurance policy in accordance with their propensity to purchase medigap policies. The 1 year policy was used because it was assumed that purchasers were unlikely to be able to afford more coverage, when using the SSA premium estimates for a $50 per day policy (in 1986 dollars) with a 90-day deductible even with induced demand factored out.
The proportion of persons assumed to purchase these policies varies by family income and was assumed to be identical to the percentage found for Medigap purchase in the 1977 National Medical Care Expenditure Survey -- 53.5 percent for those with income 125 to 200 percent of the poverty level, 75.4 percent for those with income 2-4 times the poverty level, and 77.1 percent for those with income greater than 4 times the poverty level.
Under these assumptions, about 55 percent of those age 65 and over would have a one year policy in 2018. The effect on nursing home expenditure patterns in that year are shown in the eighth and ninth columns of Table 3-19. By 2018 insurance was found to be paying about 18 percent of the total nursing home bill. The major effect is on Medicaid which declines 18 percent relative to the base case. The reduction in out-of-pocket expenses is about 12 percent, a decline very much on the order of the other options. These results suggest that important savings in Medicaid could be achieved even when only very limited coverage is purchased by a relatively large number of low income people. It would appear that the relatively smaller effect on out-of-pocket expenses relative to Medicaid expenditures is due to the low income and asset level of persons with medigap coverage. This issue will require closer scrutiny.
Percent of Income Criteria
The final simulation to test broader participation was designed to address the problem of the "all or nothing" affordability criteria used in previous options. It seems likely that insurance policies will be available that are priced for sale to various income groups. For some people limited coverage will be viewed as better than none.
Starting in 1987, individuals age 30 and over are assumed to purchase the longest coverage that costs no more than 1 percent of their income in year of issue. Persons could purchase from 1 to 6 years of coverage or unlimited years of coverage, depending on what they could afford, with the premium costs as shown in Table 3-16, without induced demand.
Policies tested would pay $50 per day and have a 90-day deductible period. If the premium exceeds 2 percent of income for three consecutive, subsequent years while under age 65, the coverage is dropped by 2 years (or from no limit to 6 years).
Persons age 65 or over in 1987 are assumed to purchase the longest coverage that costs no more than 3 percent of income, if assets are $10,000 or more. The asset criteria reflects both the amount needed to pay the 90 day deductible as well as the assumption that insurance will be purchased only if there is some minimal level of assets to protect. If the premium exceeds 5 percent of income for 3 consecutive, subsequent years while 65 or older, then the coverage is dropped by 2 years (or from no limit to 6 years).
Under these assumptions, about 63 percent of those age 65 and over would own an insurance policy in 2018. The effects on nursing home patterns are presented in the last two columns of Table 3-19. By 2018 insurance is projected to pay about 17 percent of the total nursing home bill. This is about the same as had been found to occur with the medigap link assumption. The major change with this simulation occurs not with Medicaid, although Medicaid did decline by about 12 percent relative to the base case, but rather with out-of-pocket expenses. Out-of-pocket expenses are shown to decline by nearly 18 percent, by far the largest decline in this pavor category of any of the simulations.
The Effect of Induced Demand
As mentioned earlier, the estimates presented in Table 3-19 do not reflect the potential effect of induced demand. To provide a basis for understanding this issue, adjustments to the model output were made to approximate the effect of induced demand on the results of the percent of income option. This option was chosen because it had the highest take-up rate of any of the options examined.
Adjusting for induced demand influences the estimates in two ways. Premiums are increased to reflect the increased demand. This reduces the number of people who could afford the insurance, which in turn reduces expenditures because those paying with insurance are assumed to pay the higher private pay rate. Those who can afford the insurance, however, are assumed to use more nursing home care than they would have in the absence of insurance. The net effect of these factors are reflected in the expenditure estimates presented in Table 3-20.
Overall expenditures with induced demand increased by only 2.3 percent compared to the estimate without induced demand. The relatively small net effect occurs because most of those using nursing home care in 2018 are able to afford only limited benefits, so the induced demand factor averaged a modest 11 percent. Induced demand had little effect on the relative percentage of the total bill paid by the different sources. Insurance pays about 15 percent of the bill under the induced demand assumption compared to about 17 percent when no induced demand was assumed. Introducing the effect of induced demand also reduces the effect that the insurance option had on other expenditures. Out-of-pocket expenses are reduced by 14 percent (compared to 18 percent without induced demand) and Medicaid expenditures are reduced by 9 percent (compared to 12 percent without induced demand). From these results, it can be concluded that the net effect of induced demand is to reduce the influence of insurance in relieving pressure on both out-of-pocket and Medicaid expenditures.
Micro Simulation Analysis--Conclusions
The results of the simulations must be considered suggestive of general directions rather than conclusive. They indicate that the market for long-term care insurance and the impact of that market will be highly dependent on assumptions about affordability--the proxy measure used in the absence of reliable information on demand. The market and its impact will also depend on the types of coverage that are offered.
The Fireman's Fund assumptions and the 1 percent of income assumptions, for example, provide estimates of the extremes in terms of the market take-up rate. By the year 201S, only 23 percent are projected to own the Fireman's Fund product compared to 63 percent who owned a policy under the 1 percent criteria. These results suggest the importance of early purchase and flexible benefits for encouraging a broad-based market.
To have an effect on Medicaid, however, the market must extend into low and middle income groups, as is suggested by the Medigap simulation. This simulation indicates that even limited coverage can have a noticeable effect on Medicaid if it is affordable to low and middle income persons.
Even under the rather favorable assumptions concerning the marketability of long-term care insurance, the impact by year 2018 is more limited than might be expected. Clearly the problem of affordability is a central concern. One of the other reasons for this finding may be that the model covers a period of time which does not capture the peak, nursing home utilization age for the "baby boom" generation. Those who are 40 in 1986 will be only 74 in the year 2020. Substantial increases in the rate of nursing home utilization occur well after this age. As a result, the expected impact of purchase of long-term care insurance in a "steady state" environment beyond 2020 could not be determined.
The results are also influenced significantly by the assumption about the inflation rate in nursing home costs. The simulations presented use a 5.8 percent inflation assumption, a rate that is nearly 50 percent above the 4.0 percent general inflation rate assumed for the economy as a whole in the model. A lower inflation assumption would substantially change the results because it makes the inflation adjusted insurance products less costly and therefore more affordable. Under a 4.4 percent nursing home cost inflation assumption, for example, 33 percent could have afforded the Fireman's Fund policy in 2018 (compared to 23 percent under the 5.8 percent assumption). Out-of-pocket expenditures would have been reduced by 16.3 percent and Medicaid by 2.2 percent compared to 11.7 and 1.5 percent, respectively, under the 5.8 percent inflation assumption. While the correct assumption is debatable, it is clear that the rate of increase in nursing home costs will be a critical factor in the costs and marketability of long-term care insurance.
| TABLE 3-1: Tax Returns with IRA Contributions by Adjusted Gross Income Class, 1984 | |||||
|---|---|---|---|---|---|
| AGI Class ($000) | Tax Returns | Tax Returns with IRAs | IRA Returns as a Percent of All Tax Returns | ||
| (000) | Percent | (000) | Percent | ||
| Less than $10 | 33,659 | 33.8 | 714 | 4.6 | 2.1 |
| 10-15 | 14,081 | 14.1 | 952 | 6.2 | 6.8 |
| 15-20 | 11,522 | 11.6 | 1,286 | 8.4 | 11.2 |
| 20-30 | 16,486 | 16.6 | 2,968 | 19.3 | 18.0 |
| 30-40 | 11,105 | 11.1 | 3,155 | 20.5 | 28.4 |
| 40-50 | 5,996 | 6.0 | 2,306 | 15.8 | 38.5 |
| 50-100 | 5,733 | 5.8 | 3,267 | 21.3 | 57.0 |
| 100-200 | 771 | 0.8 | 550 | 3.6 | 71.4 |
| 200 and over | 252 | 0.3 | 160 | 1.0 | 63.6 |
| Total | 99,605 | 100.0 | 15,359 | 100.0 | 15.4 |
| SOURCE: Department of the Treasury, Office of Tax Analysis, from the Statistics of Income 1984 Advanced Data. | |||||
| TABLE 3-2: Tax Returns with Maximum IRA Contributions as a Percentage of all Tax Returns with IRAs by Total Positive Income Class, 1983 | |||||
|---|---|---|---|---|---|
| Total Positive Income Class ($000) | Tax Returns with IRAs | Tax Returns with Maximum IRAs | Ret. w/Max. as a Percent of Returns With IRAs | ||
| (000) | Percent | (000) | Percent | ||
| Less than $5 | 40 | 0.3 | 3 | * | 7.6 |
| 10-15 | 248 | 2.0 | 102 | 1.3 | 41.1 |
| 15-20 | 543 | 4.8 | 264 | 3.4 | 48.6 |
| 20-30 | 817 | 8.8 | 418 | 5.4 | 51.2 |
| 30-40 | 2,178 | 15.4 | 1,209 | 15.6 | 55.5 |
| 40-50 | 4,675 | 31.1 | 2,660 | 34.3 | 56.9 |
| 50-100 | 3,276 | 61.1 | 2,421 | 31.2 | 73.9 |
| 100-200 | 608 | 75.7 | 511 | 6.6 | 84.0 |
| 200 and over | 207 | 74.6 | 170 | 2.2 | 82.2 |
| Total | 12,592 | 15.4 | 7,758 | 100.0 | 61.6 |
| SOURCE: Based on Galper and Byce, 1986. * Less than 0.05 percent. | |||||
| TABLE 3-3: Summary of Services Offered by CCRCs: Percent of CCRCs Including Services in Fees | |||
|---|---|---|---|
| Services | Guarantee | ||
| All CCRCs | Extensive | Limited | |
| Apartment cleaning | 83.1% | 91.6% | 83.5% |
| Bed and bath linen | 71.0 | 81.0 | 67.8 |
| Community’s own physician | 32.4 | 45.9 | 17.6 |
| Dental care | 6.8 | 6.4 | 4.3 |
| Emergency call physician | 88.9 | 94.5 | 90.7 |
| Garage/carports | 25.6 | 24.8 | 27.2 |
| Health maintenance organization | 4.3 | 5.5 | 2.2 |
| Hearing aids | 3.4 | 2.7 | 1.1 |
| Home health care | 28.5 | 41.1 | 16.3 |
| Hospitalization | 25.6 | 39.8 | 9.3 |
| Illness or accident away from community | 20.3 | 34.3 | 4.7 |
| Kitchen appliance | 84.1 | 88.1 | 79.3 |
| Occupational therapy | 36.3 | 50.0 | 23.0 |
| Parking | 85.5 | 84.4 | 85.9 |
| Personal laundry facilities | 78.7 | 85.3 | 79.1 |
| Physical exams | 26.1 | 38.5 | 10.1 |
| Physical therapy | 35.3 | 48.1 | 21.6 |
| Podiatry | 10.6 | 7.3 | 4.3 |
| Prescription drugs | 15.9 | 28.7 | 3.4 |
| Private room in nursing care center | 25.1 | 20.2 | 16.3 |
| Recreational therapy | 72.0 | 84.4 | 61.8 |
| Referred specialist | 23.7 | 30.3 | 9.8 |
| Replacement of apartment equipment | 86.0 | 88.9 | 80.4 |
| Resident’s physician | 22.2 | 2.1 | 26.2 |
| Social services | 83.6 | 89.0 | 85.1 |
| Special diet | 83.6 | 92.5 | 81.6 |
| Special duty nurses | 9.2 | 11.9 | 5.4 |
| Storage | 81.5 | 87.1 | 72.3 |
| Telephone | 32.4 | 42.2 | 16.3 |
| Therapy for psychiatric disorders | 15.5 | 25.5 | 2.3 |
| Tray service | 56.5 | 73.3 | 43.2 |
| Treatment for preexisting conditions | 29.5 | 35.3 | 25.6 |
| Transportation | 72.5 | 84.9 | 57.4 |
| Utilities | 91.3 | 95.3 | 96.6 |
| SOURCE: Howard Winklevoss and Alwyn Powell: Continuing Care Retirement Communities: An Empirical, Financing, and Legal Analysis, 1984. | |||
| TABLE 3-4: Combined Annual Rate of Interest* for a 70-year-old Borrower** When Initial Home Value Equals $70,000 | |||
|---|---|---|---|
| Loan Payoff at End of Year | Combined Interest Rate Pay by Borrower at Various Appreciation Rates | ||
| 0% | 5% | 10% | |
| 3.0 | 12.1% | 50.4% | 73.2% |
| 6.5 | 12.1 | 27.4 | 38.2 |
| 10.0 | 12.1 | 20.5 | 27.4 |
| 13.5** | 5.6 | 13.7 | 20.7 |
| 17.0 | 2.0 | 10.3 | 17.2 |
| 20.5 | -0.1 | 9.7 | 15.3 |
| 24.0 | -1.7 | 7.3 | 14.1 |
| SOURCE: National Center for Home Equity Conversion, 1984. * The combined interest rate includes all fixed interest and additional interest (appreciation) expressed as a single annual percentage rate (APR). | |||
| TABLE 3-5: Estimated Initial Annual Savings to Pay for Expected Nursing Home Utilization, by Age | ||
|---|---|---|
| Age Savings Begin | Rate of Inflation of Nursing Home Charges | |
| 4.4 Percent * | 5.8 Percent ** | |
| 30 | $603 | $1,036 |
| 40 | 892 | 1,418 |
| 50 | 1,510 | 2,222 |
| SOURCE: Office of the Actuary, Social Security Administration, 1986. NOTE: The figures are for the starting year. When projecting forward, the figures need to be adjusted upward to account for inflation. * Inflation in nursing home charges assumed to be ten percent above that in the CPI. | ||
| TABLE 3-6: Projections of Persons 65 & Over Who Would Have Contributed $3,000 to an IRA in One or More years, and Rates of Contribution, By Sex, Marital Status, and Homeownership, 1986, 2000, 2018 | |||||||||
|---|---|---|---|---|---|---|---|---|---|
| Category | 1986 | 2000 | 2018 | ||||||
| Total Persons (000) | Per. w/ $3000 IRA (000) | Percent | Total Persons (000) | Per. w/ $3000 IRA (000) | Percent | Total Persons (000) | Per. w/ $3000 IRA (000) | Percent | |
| Total | 31,202 | 162 | 0.5 | 37,011 | 4,032 | 10.9 | 50,253 | 14,171 | 28.2 |
| Male | 12,365 | 155 | 1.3 | 14,283 | 3,184 | 22.3 | 20,453 | 9,534 | 46.6 |
| Female | 18,937 | 7 | * | 22,668 | 848 | 3.7 | 29,799 | 4,632 | 15.5 |
| Married | 16,795 | 140 | 0.8 | 19,223 | 2,721 | 14.2 | 27,106 | 7,975 | 29.4 |
| Unmarried | 14,507 | 22 | 0.2 | 17,729 | 1,311 | 7.4 | 23,147 | 6,191 | 26.7 |
| Own home | 24,686 | 149 | 0.6 | 30,344 | 3,588 | 11.8 | 42,083 | 12,251 | 29.1 |
| Don’t own | 6,616 | 13 | 0.2 | 6,608 | 444 | 6.7 | 8,170 | 1,915 | 23.4 |
| SOURCE: Projections for the DHHS, using the Brookings/ICF Long-Term Care Financing Model. * Less than 0.5 percent. | |||||||||
| TABLE 3-7: Projections of Population in Nursing Homes by Age 1986, 2000, & 2018 (thousands of persons) | ||||||
|---|---|---|---|---|---|---|
| 1986 | 2000 | 2018 | ||||
| Total Elderly Population | 29,999 | 36,193 | 50,260 | |||
| Elderly in Nursing Homes | 2,099 (7.0%) | 3,201 (8.8%) | 4,021 (8.0%) | |||
| Elderly Population in Nursing Homes by Age | Number | Percent | Number | Percent | Number | Percent |
| Total | 2,099 | 100.0 | 3,201 | 100.0 | 4,021 | 100.0 |
| 65-74 | 380 | 18.1 | 435 | 13.6 | 659 | 16.4 |
| 75-84 | 840 | 40.0 | 1,193 | 37.3 | 1,295 | 32.2 |
| 85 and over | 879 | 41.9 | 1,573 | 49.1 | 2,067 | 51.4 |
| SOURCE: Projections for the DHHS, using the Brookings/ICF Long-Term Care Financing Model. | ||||||
| TABLE 3-8: Projections of Total Nursing Home Expenditures for the Elderly For Two Different Assumptions in the Rate of Specific Inflation, 1986, 2000 and 2018 (millions of 1987 dollars) | |||
|---|---|---|---|
| Specific Nursing Home Inflation Assumption | 1986 | 2000 | 2018 |
| Ten percent above general inflation (+4.4 percent) | $29,682 | $38,386 | $66,095 |
| Wage-Earner Compensation Increase (+5.8 percent)* | 29,682 | 57,287 | 98,117 |
| SOURCE: Projections developed for the DHHS, using the Brookings/ICF Long-Term Care Financing Model. * This is the expected rate of inflation in nursing home costs used in the Medicare Trustees reports. | |||
| TABLE 3-9: Inflation and Payment Source for Nursing Home Expenditures for the Elderly in 2018 (millions of 1987 dollars) | |||
|---|---|---|---|
| Specific Nursing Home Inflation Assumption | |||
| 4.4 Percent | 5.8 Percent* | Percent Difference | |
| Total Expenditures | $66,095 | $98,117 | 48.4% |
| Medicaid | 23,597 | 46,192 | 95.8 |
| Medicare | 1,065 | 1,612 | 51.4 |
| Total Out-of-Pocket | 41,431 | 50,311 | 21.4 |
| Income | 27,154 | 27,888 | 2.7 |
| Assets | 14,277 | 22,423 | 57.1 |
| SOURCE: Projections developed for the DHHS, using the Brookings/ICF Long-Term Care Financing Model. * This is the expected rate of inflation in nursing home costs used in the Medicare Trustees reports. | |||
| TABLE 3-10: Base Case Projection: Total Nursing Home Expenditures for the Elderly, by Source of Payment in Years 1986, 2000, 2018 (millions of 1987 dollars) | |||
|---|---|---|---|
| 1986 | 2000 | 2018 | |
| Total Expenditures | $29,682 | $57,287 | $98,117 |
| Total Medicaid | 12,914 | 28,368 | 46,192 |
| Medicare | 653 | 967 | 1,612 |
| New IRA/IMA | --- | --- | --- |
| Total Out-of-Pocket | 16,114 | 27,955 | 50,311 |
| Income | 9,562 | 15,115 | 27,888 |
| Assets | 6,552 | 12,840 | 22,423 |
| SOURCE: Projections for the DHHS, using the Brookings/ICF Long-Term Care Financing Model. Base Case: Assumes no increase in IRA limits except for inflation, no Individual Medical Accounts for long-term care. Assumes 5.8 percent specific nursing home inflation, which is the expected rate of inflation for nursing home costs used in the Medicare Trustees reports. | |||
| TABLE 3-11: Expanded IRA Projection: Total Nursing Home Expenditures for the Elderly by Source of payment in Years 1986, 2000, 2018 (millions of 1987 dollars) | |||
|---|---|---|---|
| 1986 | 2000 | 2018 | |
| Total Expenditures | $29,682 | $57,289 | $98,352 |
| Total Medicaid | 12,914 | 28,360 | 45,616 |
| Medicare | 653 | 967 | 1,612 |
| Expanded IRA | --- | 84 | 2,925 |
| Other Out-of-Pocket | 16,114 | 27,876 | 48,199 |
| Income | 9,562 | 15,056 | 26,373 |
| Assets | 6,552 | 12,820 | 21,826 |
| SOURCE: Projections for the DHHS, using the Brookings/ICF Long-Term Care Financing Model. Assumes 5.8 percent specific nursing home inflation, which is the expected rate of inflation for nursing home costs used in the Medicare Trustees reports. | |||
| TABLE 3-12: Impact of Expanded IRAs: Total Nursing Home Expenditures for the Elderly by Source of Payment In 2018 (millions of 1987 dollars) | |||
|---|---|---|---|
| Base Case | Expanded IRA | Percent Change | |
| Total Expenditures | $98,117 | $98,352 | 0.2% |
| Total Medicaid | 46,192 | 45,616 | -1.3 |
| Medicare | 1,612 | 1,612 | no change |
| Expanded IRA | --- | 2,925 | N/A |
| Other Out-of-Pocket | 50,371 | 48,199 | -4.3 |
| Income | 27,888 | 26,373 | -5.4 |
| Assets | 22,483 | 21,826 | -2.9 |
| SOURCE: Projections for the DHHS, using the Brookings/ICF Long-Term Care Financing Model. Assumes 5.8 percent specific nursing home inflation, which is the expected rate of inflation for nursing home costs used in the Medicare Trustees reports. | |||
| TABLE 3-13: Impact of IMAs: Total Nursing Home Expenditures for the Elderly by Source of Payment in 2018 (millions of 1987 dollars) | |||
|---|---|---|---|
| Base Case | IMA Option | Percent Change | |
| Total Expenditures | $98,117 | $98,868 | 0.8% |
| Total Medicaid | 46,192 | 44,486 | -3.7 |
| Medicare | 1,612 | 1,612 | no change |
| IMA Option | --- | 8,367 | N/A |
| Other Out-of-Pocket | 50,371 | 44,401 | -11.9 |
| Income | 27,888 | 23,407 | -16.1 |
| Assets | 22,483 | 20,994 | -6.6 |
| SOURCE: Projections for the DHHS, using the Brookings/ICF Long-Term Care Financing Model. Assumes 5.8 percent specific nursing home inflation, which is the expected rate of inflation for nursing home costs used in the Medicare Trustees reports. | |||
| TABLE 3-14: Premium Estimates for a Level Premium, Level Benefit Indemity Policy | |||||||
| Issue Age | Tax Status | Selectivity | Provision for Paid Up | A | B | C | D |
| 30 | None | Select | Paid up at 65 | $138 | $125 | $198 | $179 |
|---|---|---|---|---|---|---|---|
| 30 | None | Group | Paid up at 65 | 100 | 90 | 150 | 133 |
| 30 | Fully | Select | Paid up at 65 | 256 | 229 | 396 | 353 |
| 30 | Fully | Group | Paid up at 65 | 201 | 178 | 318 | 282 |
| 40 | None | Select | Paid up at 65 | 213 | 192 | 320 | 286 |
| 40 | None | Group | Paid up at 65 | 158 | 141 | 244 | 217 |
| 40 | Fully | Select | Paid up at 65 | 368 | 328 | 580 | 516 |
| 40 | Fully | Group | Paid up at 65 | 288 | 255 | 463 | 410 |
| 50 | None | Select | Paid up at 65 | 391 | 348 | 609 | 541 |
| 50 | None | Group | Paid up at 65 | 289 | 256 | 459 | 406 |
| 50 | Fully | Select | Paid up at 65 | 618 | 550 | 994 | 882 |
| 50 | Fully | Group | Paid up at 65 | 473 | 418 | 771 | 682 |
| 60 | None | Select | Not paid up | 429 | 381 | 696 | 617 |
| 60 | None | Group | Not paid up | 343 | 303 | 560 | 494 |
| 60 | Fully | Select | Not paid up | 520 | 460 | 856 | 758 |
| 60 | Fully | Group | Not paid up | 426 | 376 | 705 | 623 |
| 65 | None | Select | Not paid up | 553 | 490 | 923 | 817 |
| 65 | None | Group | Not paid up | 446 | 393 | 747 | 659 |
| 65 | Fully | Select | Not paid up | 639 | 566 | 1074 | 951 |
| 65 | Fully | Group | Not paid up | 526 | 464 | 887 | 783 |
| SOURCE: Actuarial Research Corporation, June 1986. A: Policy has a 30-day deductible and requires a 3-day prior hospital stay. B: Policy has a 90-day deductible and requires a 3-day prior hospital stay. C: Policy has a 30-day deductible and no prior hospital stay. D: Policy has a 90-day deductible and no prior hospital stay. | |||||||
| TABLE 3-15: Premium Estimates for a Indexed Premium, Indexed Benefit Indemnity Policy Index Rate: 5% per year | |||||||
|---|---|---|---|---|---|---|---|
| Issue Age | Tax Status | Selectivity | Provision for Paid Up | A | B | C | D |
| 30 | None | Select | Paid up at 65 | $563 | $497 | $934 | $824 |
| 30 | None | Group | Paid up at 65 | 479 | 421 | 798 | 703 |
| 30 | Fully | Select | Paid up at 65 | 1288 | 1132 | 2154 | 1898 |
| 30 | Fully | Group | Paid up at 65 | 1124 | 987 | 1884 | 1659 |
| 40 | None | Select | Paid up at 65 | 720 | 635 | 1196 | 1056 |
| 40 | None | Group | Paid up at 65 | 600 | 528 | 1001 | 882 |
| 40 | Fully | Select | Paid up at 65 | 1473 | 1296 | 2466 | 2174 |
| 40 | Fully | Group | Paid up at 65 | 1258 | 1106 | 2113 | 1862 |
| 50 | None | Select | Paid up at 65 | 1076 | 949 | 1792 | 1583 |
| 50 | None | Group | Paid up at 65 | 858 | 755 | 1436 | 1266 |
| 50 | Fully | Select | Paid up at 65 | 1962 | 1727 | 3291 | 2903 |
| 50 | Fully | Group | Paid up at 65 | 1601 | 1408 | 2694 | 2374 |
| 60 | None | Select | Not paid up | 616 | 544 | 1035 | 914 |
| 60 | None | Group | Not paid up | 521 | 459 | 877 | 774 |
| 60 | Fully | Select | Not paid up | 757 | 667 | 1276 | 1126 |
| 60 | Fully | Group | Not paid up | 653 | 575 | 1103 | 973 |
| 65 | None | Select | Not paid up | 719 | 634 | 1220 | 1078 |
| 65 | None | Group | Not paid up | 606 | 533 | 1030 | 909 |
| 65 | Fully | Select | Not paid up | 842 | 743 | 1430 | 1263 |
| 65 | Fully | Group | Not paid up | 723 | 636 | 1228 | 1084 |
| SOURCE: Actuarial Research Corporation, June 1986. A: Policy has a 30-day deductible and requires a 3-day prior hospital stay. B: Policy has a 90-day deductible and requires a 3-day prior hospital stay. C: Policy has a 30-day deductible and no prior hospital stay. D: Policy has a 90-day deductible and no prior hospital stay. | |||||||
| TABLE 3-16: Estimated Unisex Contribution/Premium Rates for Nursing Home Coverage Starting at Age 65 of $50 Daily Coverage Indexed by 5.8 Percent After Year of Issue With Contributions Indexed by 5.8 Percent After Year of Issues: Assumed Antiselection/Induced Demand = 37% | |||||||
|---|---|---|---|---|---|---|---|
| Year of Issue | Issue Age | Plan | |||||
| 1 | 2 | 3 | 4 | 5 | 6 | ||
| 1986 | |||||||
| Contributions/Premiums to Age 64 | 30 | $1,034 | $2,094 | $1,590 | $1,399 | $1,034 | $867 |
| 40 | 1,418 | 2,916 | 2,212 | 2,082 | 1,418 | 1,202 | |
| 50 | 2,222 | 4,691 | 3,550 | 3,644 | 2,222 | 1,917 | |
| 60 | 6,515 | 14,391 | 10,923 | 12,230 | 6,530 | 5,896 | |
| Contributions/Premiums Until Death | 30 | --- | 1,484 | 1,129 | 1,111 | 712 | 610 |
| 40 | --- | 1,842 | 1,420 | 1,497 | 867 | 753 | |
| 50 | --- | 2,369 | 1,798 | 2,132 | 1,085 | 956 | |
| 60 | --- | 3,542 | 2,690 | 3,603 | 1,574 | 1,416 | |
| 2021 | |||||||
| Contributions/Premiums to Age 64 | 30 | 1,227 | 2,447 | 1,881 | 1,632 | 1,227 | 1,043 |
| 40 | 1,685 | 3,406 | 2,617 | 2,415 | 1,685 | 1,447 | |
| 50 | 2,698 | 5,588 | 4,287 | 4,266 | 2,699 | 2,362 | |
| 60 | 7,939 | 17,058 | 13,121 | 14,141 | 7,954 | 7,226 | |
| Contributions/Premiums Until Death | 30 | --- | 1,703 | 1,311 | 1,272 | 829 | 719 |
| 40 | --- | 2,104 | 1,618 | 1,697 | 1,008 | 883 | |
| 50 | --- | 2,732 | 2,097 | 2,419 | 1,275 | 1,135 | |
| 60 | --- | 4,015 | 3,081 | 3,969 | 1,825 | 1,650 | |
| SOURCE: Office of the Actuary, Social Security Administration, July 15, 1986. | |||||||
| TABLE 3-17: Estimated Unisex Contribution/Premium Rates for Nursing Home Coverage Starting at Age 65 of $50 Daily Coverage Indexed by 4.4 Percent After Year of Issue With Contributions/Indexed by 4.4 Percent After Year of Issue: Assumed Antiselection/Induced Demand = 37% | |||||||
|---|---|---|---|---|---|---|---|
| Year of Issue | Issue Age | Plan | |||||
| 1 | 2 | 3 | 4 | 5 | 6 | ||
| 1986 | |||||||
| Contributions/Premiums to Age 64 | 30 | $603 | $1,216 | $923 | $799 | $603 | $503 |
| 40 | 892 | 1,828 | 1,386 | 1,293 | 892 | 753 | |
| 50 | 1,510 | 3,182 | 2,408 | 2,462 | 1,510 | 1,300 | |
| 60 | 4,754 | 10,499 | 7,968 | 8,918 | 4,765 | 4,301 | |
| Contributions/Premiums Until Death | 30 | --- | 951 | 723 | 688 | 461 | 392 |
| 40 | --- | 1,281 | 974 | 1,004 | 609 | 525 | |
| 50 | --- | 1,795 | 1,362 | 1,576 | 828 | 728 | |
| 60 | --- | 2,922 | 2,216 | 2,916 | 1,302 | 1,175 | |
| 2021 | |||||||
| Contributions/Premiums to Age 64 | 30 | 705 | 1,401 | 1,077 | 920 | 705 | 597 |
| 40 | 1,044 | 2,106 | 1,617 | 1,479 | 1,044 | 894 | |
| 50 | 1,803 | 3,728 | 2,859 | 2,835 | 1,803 | 1,575 | |
| 60 | 5,794 | 12,232 | 9,409 | 10,136 | 5,705 | 5,181 | |
| Contributions/Premiums Until Death | 30 | --- | 1,082 | 832 | 773 | 533 | 459 |
| 40 | --- | 1,451 | 1,116 | 1,128 | 701 | 612 | |
| 50 | --- | 2,048 | 1,573 | 1,765 | 963 | 856 | |
| 60 | --- | 3,275 | 2,527 | 3,175 | 1,496 | 1,356 | |
| TABLE 3-18: Annual Premium at Issue for Nursing Home Coverage of $50 per Day Starting at Age 65 with 90-Day Elimination Period, 5.8 Percent Annual Indexing of Coverage and Lifetime Premiums After Issue, and Waiver of Premium for Nursing Home Residents Over Age 64 | ||||||
|---|---|---|---|---|---|---|
| Year of Issue | Issue Age | Years of Coverage | ||||
| 1 | 2 | 4 | 6 | No Limit | ||
| 1986 | 30 | $127 | $228 | $350 | $412 | $486 |
| 40 | 156 | 280 | 431 | 507 | 599 | |
| 50 | 199 | 356 | 546 | 644 | 760 | |
| 60 | 294 | 525 | 806 | 950 | 1,123 | |
| 65 | 362 | 647 | 991 | 1,166 | 1,398 | |
| 70 | 468 | 843 | 1,294 | 1,519 | 1,785 | |
| 75 | 621 | 1,127 | 1,736 | 2,026 | 2,369 | |
| 80 | 824 | 1,517 | 2,341 | 2,713 | 3,135 | |
| 2021 | 30 | 148 | 268 | 412 | 485 | 574 |
| 40 | 182 | 328 | 505 | 595 | 704 | |
| 50 | 234 | 421 | 647 | 763 | 903 | |
| 60 | 338 | 609 | 937 | 1,105 | 1,309 | |
| 65 | 412 | 742 | 1,141 | 1,342 | 1,586 | |
| 70 | 526 | 952 | 1,467 | 1,723 | 2,033 | |
| 75 | 688 | 1,256 | 1,939 | 2,268 | 2,665 | |
| 80 | 909 | 1,680 | 2,600 | 3,021 | 3,516 | |
| SOURCE: Office of the Actuary, Social Security Administration, July 25, 1986. NOTE: Includes induced demand factors of 10, 11, 14, 16, and 23 percent for coverages of 1,2,4,6, and unlimited years of coverage, respectively. | ||||||
| TABLE 3-19: Projections of Total Nursing Home Expenditures for the Elderly by Source of Payment and Insurance Option in 2018 (5.8 percent nursing home inflation assumption) | |||||||||||
|---|---|---|---|---|---|---|---|---|---|---|---|
| Source of Payment | Base Case | Fireman’s Fund | Combined IMB/Insurance | Pension Benefit Link | Medigap Link | % of Income | |||||
| Percent Distribution | Percent Distribution | % Change from Base | Percent Distribution | % Change from Base | Percent Distribution | % Change from Base | Percent Distribution | % Change from Base | Percent Distribution | % Change from Base | |
| Total | 100.0 | 100.0 | +0.5% | 100.0 | 0.8% | 100.0 | 1.6% | 100.0 | 3.6% | 100.0 | 2.4% |
| Medicaid | 47.1 | 46.1 | -1.5% | 44.8 | -4.2% | 42.7 | -7.8% | 37.1 | -18.4% | 40.3 | -12.4% |
| Medicare | 1.6 | 1.6 | No Change | 1.6 | No Change | 1.6 | No Change | 1.6 | No Change | 1.6 | No Change |
| Out-of-Pocket | 51.3 | 45.1 | -11.7% | 45.5 | -10.7% | 44.8 | -11.3% | 43.7% | -11.8% | 41.2 | -17.8% |
| Insurance | --- | 7.1 | N/A | 8.1 | N/A | 10.9 | N/A | 17.6 | N/A | 16.9 | N/A |
| SOURCE: Projections developed for DHHS Long-Term Care Financing Project, from the Brookings/ICF Long-Term Care Model. | |||||||||||
| TABLE 3-20: Potential Effect of Induced Demand on Nursing Home Expenditure Patterns in 2018: One Percent of Income Option (millions of 1987 dollars) | ||||||
|---|---|---|---|---|---|---|
| Source of Payment | Expenditures Without Induced Demand | Expenditures With Induced Demand | ||||
| Expenditures | Percent Distribution | Percent Change from Base Case | Expenditures | Percent Distribution | Percent Change from Base Case | |
| Total | $100,470 | 100.0% | 2.4% | $102,821 | 100.0% | 4.7% |
| Medicaid | 40,465 | 40.3% | -12.4% | 41,896 | 40.7% | -9.3% |
| Medicare | 1,612 | 1.6% | No change | 1,659 | 1.6% | 2.9% |
| Out-of-Pocket | 41,411 | 41.2% | -17.8% | 43,489 | 42.3% | -13.6% |
| Insurance | 16,978 | 16.9% | N/A | 14,774 | 15.3% | N/A |
| SOURCE: Projections developed for the DHHS Long-Term Care Financing Project, from the Brookings/ICF Long-Term Care Model. | ||||||
CHAPTER 4. THE RELATIONSHIP OF MEDICAID TO PRIVATE FINANCING OF LONG-TERM CARE
Long-term care is currently the one remaining catastrophic health care expense for which there has been virtually no insurance protection available. As a result, about half of all nursing home costs are paid out-of-pocket and almost all the rest are paid for by Medicaid. In the absence of other options, the process seems inexorable: estimates indicate that 50 percent of nursing home residents receiving Medicaid-financed care were originally private pay patients (Doty, Liu, and Wiener, 1985).
Medicaid is a welfare-based system: benefits are available only to those who are poor or have such high medical bills they are threatened with impoverishment. Recipients of the major cash-transfer programs, Aid to Families with Dependent Children (AFDC) and Supplemental Security Income (SSI) for the aged, blind, and disabled, are generally automatically eligible for Medicaid; most Medicaid recipients come from these groups. In addition, many middle-class people wind up receiving benefits as a result of incurring devastating medical expenses, mostly for long-term institutional care.
Medicaid is a payor of last resort. For example, if a beneficiary's medical expenses are partly covered by private health insurance, the private insurance pays first and Medicaid fills in the gaps, at least within limits on amount, duration, and scope of services established by t-he States.
This chapter discusses: how Medicaid ends up subsidizing the majority of those people who are in nursing homes for an extended period; whether Medicaid eligibility policies are a significant barrier to private financing of long-term care; and modifications to the Medicaid program which might, if deemed necessary and appropriate, promote the expansion of private financing mechanisms.
A. MEDICAID ELIGIBILITY FOR LONG-TERM CARE
Medicaid eligibility for those who are not welfare recipients is established largely through one of two optional elements of State Medicaid plans: the medically needy option and special needs standards for the institutionalized.
1. The Medically Needy
States may, at their option, provide Medicaid to the aged (and certain other groups) with substantial medical bills who would otherwise qualify for Medicaid in the State except that they have too much income or resources. In 1985, approximately 30 States had medically needy programs applicable to the aged.
In FY 1985, Medicaid served nearly 3.5 million medically needy recipients at a cost to the Federal and State governments of $10.3 billion. Medically needy recipients comprised 15.7 percent of all recipients and accounted for 27.6 percent of total Medicaid costs.
The medically needy face both income and asset limits. They cannot receive benefits if they have assets above specified ceilings. States typically set the same limits for the medically needy as for the AFDC or SSI programs, though the medically needy limits may be higher. The cash-transfer programs exempt certain resources, most importantly the home, from the asset limits. Any amount of resources in excess of the State defined limits cause ineligibility, though the exclusion of the home exempts the largest asset of most elderly from consideration.
If income exceeds limits, the applicant can "spend-down" to eligibility. If income is above allowable limits, medical expenses sufficient to bring remaining disposable income below the limits can qualify a person for assistance. Individuals or families with any amount of gross income may be able to qualify if their medical expenses are high enough.
Only "excess" medical expenses are covered. Under the spend-down procedure, applicants receive no benefits until they have incurred medical bills equal to the amount by which their incomes exceed allowable income levels. Until the income limit is reached, medical bills remain the responsibility of the applicant. Medicaid pays subsequent bills if they are for services covered under the State's plan and to the extent that they are not covered by a third party. An individual receiving Medicaid benefits for nursing home expenses must apply all of his or her monthly income (e.g., social security and private pension payments) toward the nursing home bill, with the exception of a small personal needs allowance.
Spend-down is an ongoing process. An individual who has spent-down receives Medicaid benefits only for a certain period, usually a month. For the individual to receive benefits in subsequent months, he or she must spend-down again.
2. Special Income Limits for Persons in Medical Institutions
Apart from medically needy programs, States may also extend Medicaid to persons residing in medical institutions, including nursing homes, whose gross incomes do not exceed 300 percent of the current full benefit rate under SSI. With the current SSI level at $336 per month, States may set their special income limits for the institutionalized as high as $1,008 per month.
In 1985, this option enabled 20 States without a medically needy program for the aged, blind, or disabled to assist approximately 408,700 persons to pay the cost of long-term institutional care.
Once eligible, these individuals use what income they have, minus certain amounts that they may retain for specified personal uses, to pay for the cost of their care. Medicaid pays only the remainder, up to the Medicaid payment rate for such care, plus any other medical services used by the individual and covered under the State's plan.
This option is similar to the medically needy option. Asset limits and the spend-down process work in parallel fashions. This option applies only to people in institutions and offers assistance only for those with incomes below specified limits. Individuals with higher incomes cannot qualify for benefits, regardless of the size of their medical expenses.
3. Whose Income and Resources Matter?
The spend-down process under both options considers the income and resources of a "filing unit" that is not necessarily identical with a family. SSI rules--which govern various aspects of eligibility, including spend-down, for the elderly--assume that the income of a spouse or parent is available to meet the needs of other family members if the family lives together. If family members live apart, they are considered to be in separate households, and the financial status of each household is evaluated without regard to the status of other family members living elsewhere. Once a person is in an institution for 30 days, he or she is treated as a separate filing unit, and the income or resources of relatives still at home are irrelevant for eligibility for benefits.
This process, logical in the context of cash-transfer programs, frequently permits institutionalized members of families with substantial incomes or resources to qualify for Medicaid benefits in spite of the financial resources potentially available. States cannot deny benefits in these circumstances, but they may try to recover expenses from other family members. Such recoveries are not widely or extensively attempted, partly because enforcement difficulties make cost-effectiveness dubious in many cases.
4. Restrictions on Transfer of Assets
Otherwise eligible persons may be barred from Medicaid if they have given away or otherwise disposed of assets for less than fair market value. States may, at their option, consider transfers that occurred up to two years before a person applies for Medicaid and count the uncompensated value of such assets as if the person still had those assets. States may presume that the transfer took place for the purpose of establishing Medicaid eligibility, although individuals are allowed to rebut that presumption.
States may also deny eligibility to institutionalized persons who transferred ownership of their homes without receiving adequate compensation. Their period of ineligibility depends on the uncompensated value of the property, compared to the number of months of institutional care that the person could have paid for had he or she sold the home for full market value and used the proceeds to pay for care.
B. IMPLICATIONS OF MEDICAID FOR PRIVATE FINANCING MECHANISMS
The provisions discussed above are the major features of Medicaid eligibility policy that affect people not on SSI or AFDC who actually or potentially need long-term care. These features clearly create, in some cases inadvertently, incentives for people to alter their behavior to qualify for State-supported benefits. They, therefore, also affect incentives for people to provide for their own financing of long-term care.
How responsive people are to these incentives, however, is far from clear. Obviously, the mere existence of an incentive tells nothing about the magnitude of its effect, because people may not be aware of its existence or of its importance, and because various other incentives and attitudes also influence behavior.
One consideration in evaluating Medicaid's impact on private financing of long-term care is that the public's understanding of how long-term care is paid for and what coverage people actually have is very poor. Many people, even Medicare beneficiaries, believe that Medicare covers long-term care. Others believe that Medicare and a medigap policy in combination do so, although this is very unlikely to be the case.
This point is borne out by a recent national survey of members of the American Association of Retired Persons (who are, arguably, better informed than the general public) that revealed that 79 percent of those who believed that they would at some point have extended stays in nursing homes believed that Medicare would pay for all or part of this care. Thirty-five percent of those with private insurance coverage said that their policies included extended care nursing home coverage, though most of these policies were with companies known not to offer such coverage.
People also appear to be poorly informed about the risk they face of requiring long-term care. Further, many people appear to want to avoid any consideration of future nursing home needs and thus avoid any planning for long-term care.
A second consideration in evaluating Medicaid's impact on private financing of long-term care is evidence that middle-class people are generally not disposed to rely on a welfare-based program for long-term care expenses. In a survey of 4,043 elderly in six States, researchers at the National Center for Health Services Research found that only 19 percent of those surveyed said that they would not purchase private long-term care insurance because they viewed Medicaid and other welfare coverage as adequate. This result, compatible with findings elsewhere in this report, suggests that many people faced with catastrophic medical expenses may wind up on Medicaid for lack of a better alternative.
A third consideration in evaluating Medicaid's impact on private financing of long-term care is whether the elderly are aware of and willing to use methods of circumventing Medicaid asset restrictions. One method, noted earlier, is based on Medicaid eligibility rules not affecting substantial assets given to heirs (or sold to them for less than market value) more than two years prior to application. Another method is to place assets in an irrevocable trust with restrictions designed to prevent any expenditure of income or principal on medical expenses. Under current law, elderly individuals can use either of these methods to preserve their estates for their heirs while obtaining Medicaid benefits for themselves. Evaluating the extent to which they actually do so, or might do so in the future, however, is very difficult.
Both methods require extensive pre-planning. Trusts are difficult and expensive to set up. Transferring assets as a strategy for acquiring Medicaid coverage requires substantial confidence in the predictability of future events, while the elderly are usually thought to be, in general, quite cautious in their orientation toward the future.
The sum of all these considerations suggests that the future of private financing mechanisms is not likely to be significantly affected by the availability of Medicaid. However, this conclusion is untestable, at least until private financing mechanisms are more widespread and accessible and there is a higher level of public knowledge about how Medicare, medigap insurance, and Medicaid interact with long-term care needs.
C. POSSIBLE AREAS FOR MEDICAID REFORM
Although the preceding section suggests that Medicaid is not a significant barrier to private financing of long-term care, this observation does not preclude the possibility that changes in Medicaid could have a positive impact on private financing. In this regard, a variety of possible actions are often discussed, all intended to make it more difficult for persons who can afford to pay for their own long-term care costs to become eligible for Medicaid. It should be noted that many such proposals are advocated quite independent of any impact on private financing of long-term care, even though they are discussed here only in that context.
1. Restrict Medicaid Eligibility
Medically needy coverage and the spend-down process could be severely restricted to prevent individuals from qualifying for Medicaid benefits if they could once have afforded (say ten years previously) to provide for long-term care by insurance or other means. Such a change would certainly provide a strong incentive for people to provide for financing long-term care on their own. A phase-in period (perhaps of many years because of the current sparseness of private mechanisms) and extensive efforts to insure consumer awareness would be necessary.
Several factors, however, argue against a very substantial tightening of policy in this area. First, many people with sufficient means to pay for long-term care insurance may be refused coverage, because of pre-existing condition restrictions, or may fail to seek insurance because of irrational denial of the risks.
Second, such a step would be the first of its kind in social welfare policy in this country. On the basis of a long ago individual failure to plan, it would impose severe consequences on persons who have become destitute and who may be unable to obtain necessary medical care despite severe disability.
Third, even if an elderly individual had purchased (and continued to pay for) insurance, he or she might not have enough to cover long-term care expenses, since most policies are indemnity policies without an inflation adjustment.
Fourth, if Medicaid were not available for such persons, the alternatives would be to fund their care through State or county programs, to expect providers to furnish free care, or to turn them out of the nursing home. None of these possibilities is attractive.
2. Permit States to Require Spouses of Medicaid Recipients to Contribute to the Cost of Their Spouses' Care
As explained in the first section of this chapter, institutionalized individuals from even well-to-do families can now become eligible for Medicaid with no financial support required from their spouses.
States could be permitted to require the spouses of institutionalized recipients to contribute to the costs of care as a condition of eligibility. For example, States might set contribution amounts up to 20 percent of that part of the family's income that exceeds 200 percent of poverty. No contributions would be permitted for those with incomes below 200 percent of poverty (currently $22,000 per year); a family with income of $50,000 would pay no more than $5,600.
Proposing to increase family financial responsibility for long-term care is likely to be controversial. Federally-set maximum limits on the percentage of family income that may be required as a contribution, however, would assure that families would not be impoverished.
Although States would have the authority to waive the requirements in hardship situations, refusal of the spouse to contribute would lead to the loss of eligibility. The severity of this consequence provides the incentive for the spouse to pay the required support amount and might prospectively encourage planning for long-term care needs through private mechanisms.
A variant on this proposal would require adult children to help pay for the nursing home care of their parents. Such an idea raises very different and much more controversial issues of public policy. Among them is the philosophical issue of the extent to which individuals who, though related, are not generally held to be legally responsible for each other can be required to pay for each other's care. This variant also raises the possibility of increasing elder abuse, with elder family members mistreated at home rather than placed in nursing homes.
In 1983, the Administration announced that States were permitted, under certain limited circumstances, to impose such requirements on children of Medicaid recipients. The announcement was followed by widespread and strenuous public criticism. Only one State briefly undertook and then dropped plans to implement such a policy. This response suggests a pronounced lack of public support for this concept at this time.
3. Provide Incentives for Private Financing of Long-Term Care by Waiving Medicaid Spend-down
A number of variants of a proposal have been put forth that would, in effect, waive Medicaid spend-down requirements for the elderly who pay for two (or three or four) years of long-term care out of their own resources (e.g., insurance, assets, medical IRA). Since it would be illogical for government to try to limit this favored situation to those who meet long-term care expenses only through certain vehicles, e.g., insurance or medical IRAs, this discussion will treat the proposal in terms of care paid for by any source other than a public program.
Such a proposal has some clear and very appealing advantages. First, it would help provide catastrophic coverage--people who met the standards for coverage would have protection for their income and assets. Second, it would provide an incentive for expanded private financing.
Third it might save money for Medicaid. Whether or not it would depends on whether additional private financing attributable to this source outweighs the effects on Medicaid of the loss of spend-down for the long-staying cases. Whether it saves money is not evident; actuarial analysis would be necessary on this point.
Further analysis of this proposal, however, reveals a number of major problems. First, this proposal would create something close to a social insurance benefit for long-term care. It would resemble social insurance in that the benefits would be available without any means test on income or assets: benefits would be available without regard to how needy the person was. In this respect, it would resemble Medicare, in which benefits are available to all who have filled certain requirements (in Medicare's case, those who have made contributions for a minimum time and are over a certain age), but where benefits are not related to financial circumstances at time of receipt.
Unlike social insurance, however, this system would have no requirement of premium payments or other contributions in order to qualify for benefits. It would simply have a very high deductible. Once you met the deductible (with no help from Medicaid), you would qualify for benefits. Payments would be from general revenues.
It is not clear, however, that anyone would ever set out to design a social insurance benefit in this fashion. First, a social insurance benefit would probably have participants paying either contributions or premiums or both, rather than relying on general revenues for funding. Second, it might not appear appropriate to have a social insurance benefit tied to Medicaid limits on reimbursement and on amount, duration, and scope of services.
Another major problem with the proposal is that the requirement of paying for a large amount of care on your own, whether through insurance or otherwise, appears to set up two different classes of people: those who can afford fairly substantial payments for long-term care on their own and those who cannot. The result would be to make a benefit available only to those who are already well off, a questionable social policy.
Further, this proposal is not supportive of informal care-giving, since special treatment goes to those who pay for care and (presumably) not to those who receive it from friends and relatives. This situation may be perceived as inequitable. (If, in response, the proposal were broadened to encompass informal care, it would become very costly and probably virtually impossible to administer.)
Finally, the proposal would present various implementation difficulties. What expenses would be considered as meeting the requirements? Would a medically necessary standard be imposed? Home services present particular problems, since standards would need to insure credit was not given for maid service. Documenting that applicants have in fact met the qualification requirements will be administratively cumbersome, particularly if the period of care required for qualification is long.
4. Increase Eligibility Penalties Against Individuals Who Transfer Assets for Less Than Fair Market Value
States are now permitted to deny Medicaid for a period of time to persons who give away or transfer assets for less than fair market value. States may consider transfers occurring up to two years before a person applies for Medicaid.
This proposal would require States to impose minimum penalties for such assets transfers, and would allow States to consider transfers occurring up to five years before a person applied.
5. Allow States Greater Flexibility in Use of Liens
States, use of liens is severely circumscribed by current law. States can impose liens on recipients' property before death only under limited circumstances: if the recipient is institutionalized, is unlikely to ever return home, and is without a spouse, child, or sibling residing in the home. Only one State (Alabama) has elected to use liens.
This proposal would remove these restrictions and increase the States' ability to impose liens on the property of institutionalized Medicaid recipients, further facilitating State efforts to recover from the estates of Medicaid beneficiaries.
Once commonly used by States, particularly on the homes of welfare recipients, liens fell out of favor because they discouraged people in genuine need from applying for benefits. In Medicaid, such an effect could conceivably lead to inadequate care. However, the provision would be limited to persons in institutions who are presumably so disabled that the question of foregoing care does not arise.
6. Require States to Restrict Medicaid Eligibility of People with Assets Sheltered in Trusts
Currently, individuals can appear to be poor enough to quality for Medicaid if they have assets sheltered in a trust beyond their direct and immediate control. Under this proposal, States would be required to treat assets held in a trust for a Medicaid applicant or recipient the same as if the assets were in an ordinary savings account or other liquid holding.
The use of irrevocable trusts t o qualify for Medicaid benefits while sheltering assets has received some attention in both the popular press and in law journals and the like, but it does not appear to have become widespread practice yet. The proposal would forestall future use of trusts for this purpose; grandfathering could protect the few current trust beneficiaries.
REFERENCES
Administration on Aging: National survey of the aged. DHHS Publication No. (OHDS) 83-20425, United States Government Printing Office, Washington, D.C., 1983.
American Association of Retired Persons and Administration on Aging: A profile of older Americans, 1985.
Andrews, Emily S.: The changing profile of pensions in America. Employee Benefits Research Institute, Washington, D.C., 1985.
Arling, G., and McAuley, W.J.: The feasibility of public payments for family caregiving. Gerontologist 23: 300-6, 1983.
Arnett, R., McYusick, D., Sonnefield, S., and Cowell, C.: Projections of health care spending to 1990. Health Care Financing Review 7(3): 1-36, 1986.
Blumenthal, D., et al.: Special report: The future of Medicare. New England Journal of Medicine, pp. 722-728, March 13, 1986.
Bowen, O. and Burke, T.: Cost neutral catastrophic care proposed for Medicare recipients. Federation of American Hospitals Review, November-December, pp. 42-45, 1985.
Brickfield, Cyril F.: Long-term care financing solutions are needed now. American Health Care Association 11(6): 11-15, October 1985.
Brody, E.M.: Women in the middle and family help to older people. The Gerontologist 21 (5): 471-480, 1981.
Brody, E.M.: Parent care as a normative family stress. The Gerontologist 25: 19-29, February 1985.
Burke, T.: Alternative long-term proposal for restructuring Medicare. In Report of the 1982 Advisory Council on Social Security, pp. 94-96, 1984.
Carp, F.: Effects of improved housing on the lives of older people. In Weogarten, B. (Ed.): Middle age and aging. University of Chicago Press, Chicago, 1968.
Center for Social Research in Aging: The Retirement Migration Project. The University of Miami, 1984.
Chollet, Deborah J.: Employer provided health benefits: Coverage provisions and policy issues. Employee Benefit Research Institute, Washington, D.C., 1984.
Christianson, Jon B.: Channeling effects on informal care: Channeling evaluation report 85-12. Preliminary findings. Mathematica Research, Inc., Princeton, New Jersey, July 1985. [http://aspe.hhs.gov/daltcp/reports/informes.htm]
Clark, N.M. and Rakowski, W.: Family caregivers of older adults: Improving coping skills. The Gerontologist 23: 637-42, 1983.
Cohen, D.L.: Continuing-care communities for the elderly: Potential pitfalls and proposed legislation. University of Pennsylvania Law Review 128(4): 828-849, 883-936, 1980.
Cohen, Marc A., Tell, Eileen J., and Wallack, Stanley S.: The lifetime risks and costs of nursing home use among the elderly. Forthcoming in Medical Care, December 1986.
Congressional Budget Office: Long-term care for the elderly and disabled. U. S. Government Printing Office, Washington, D.C., 1977.
Cornoni-Huntly, J., Brock, B., et al. (Eds.): Established population for epidemiology studies of the elderly. Resource Data Book, National Institute on Aging. NIH 86-2443, United States Government Printing Office, 1986.
Curran, M.S.: Lifetime promises to residents: Can they be kept? In Laventhol and Horwath: Lifecare Industry. Philadelphia, 1983.
Davis, K. and Rowland, D.: Medicare policy: New directions for health and long-term care. The John Hopkins University Press, Baltimore, Maryland, 1986.
Doty, P.: Family care of the elderly: The role of public policy. Milbank Quarterly 64(l): 34-75, 1986a.
Doty, P.: Medicaid: Is it a deterrent to private long-term care insurance? Working Paper, Office of Health Policy, Health Care Financing Administration, 1986b.
Doty, P.: Long-term care for the elderly provided within the framework of health care schemes. Presentation at the International Social Security Association, September, 1986 Montreal, Report of the Permanent Committee on Medical Care and Sickness Insurance, in press.
Doty, P., Liu, K., and Weiner, J.: An overview of long-term care. Health Care Financing Review 6 (3): 69-78, 1985.
EBRI Issue Brief: Employer-Paid Retiree Health Insurance. The story and prospects for growth. Employee Benefits Research Institute, Washington, D.C., 47: October 1985.
EBRI Issue Brief: Financing long-term care. Employee Benefits Research Institute, Washington, D.C., 48: November 1985.
Employer-Sponsored Retiree Health Insurance. Report prepared by the Office of Policy and Research, Pension and Welfare Benefits Administration, U.S. Department of Labor, May 1986.
Ericson, Arthur: Presentation at conference, Private long-term care insurance: The emerging market. San Francisco, California, 1985.
Federal Council on the Aging: The need for long-term care information and issues. DHHS Publication (OHDS) 81-20704, United States Government Printing Office, Washington, D.C., 1981.
Ferrera, P.J.: Social Security reform: The family plan. Heritage Foundation, 1982.
Fillenbaum, Gerta: Quality of life among lifecare facility and community residents: A comparison. U.S. Health Care Financing Administration Cooperative Agreement 18-C-98630/4-01. Duke University Medical Center. Durham, North Carolina, February 1986.
Fries, J.F.: Aging, natural death and the compression of morbidity. New England Journal of Medicine 303: 130-135, July 1980.
General Accounting Office: Entering a nursing home -- costly implications for Medicaid and the elderly. Report PAD-80-12. Washington, D.C., 1979.
Glenn, K.: Long-term care alternatives: Perspectives. Washington Report on Medicine and Health, March 12, 1984.
Gordon, N.: Statement Before the Subcommittee on Health and the Environment: Committe on Energy and Commerce: United States House of Representatives, March 26, 1986.
Greer, D.S., et al.: National hospice evaluation study final report: Executive study. Funded by the Health Care Financing Administration (Grant 99-P-97793/1-0) and grants from the Robert Wood Johnson Foundation and the John A. Hartford Foundation to Brown University, 1985.
Harkins, E.: Family support and costs of services for the frail elderly: Final Report. HCFA grant 18-P-98080/3. Virginia Center on Aging, Virginia Commonwealth University, 1985.
Health Care Financing Administration: Long-term care: Background and future directions. Health Care Financing Administration Publication 81-20047, 1981.
Health Resources and services Administration, Bureau of Resources Development, Office of Health Planning, Division of Analysis and Assistance: Life care centers: An alternative delivery system for the elderly. Rockville, Maryland, June 1986.
Horowitz, Amy and Shindleman, Lois: Social and economic incentives for family caregivers. Health Care Financing Review 5: 25-33, 1983.
ICF, Incorporated: Private financing of long-term care: Current methods and resources: Phase I and Phase II. Unpublished final report submitted to the Office of the Assistant Secretary for Planning and Evaluation, U.S. Department of Health and Human Services, June, 1984 and January 1985. [http://aspe.hhs.gov/daltcp/reports/prvfines.htm, http://aspe.hhs.gov/daltcp/reports/prvfin2es.htm]
Iverson, Laura Himes, and Polich, Cynthia Longsett: The future of Medicare and HMO's. Interstudy, 1985.
Jacobs, B.: The national potential of home equity conversion. Report prepared for the U.S. Senate Special Committee on Aging and the U.S. House Select Committee on Aging, 1985.
Jacobs, B. and Weissert, W.: Home equity financing of long-term care for the elderly. In Feinstein, P.H., Gornick, M. and Greenberg, J.N. (Eds.): Long-term care financing and delivery systems: Exploring some alternatives. Conference Proceedings. Health Care Financing Administration Publication No. 03174, Washington, D.C., 1984.
Jazwiecki, Tom: Financing options for long-term care services. Business and Health, April 1986.
Katzman, R.: Alzheimer's disease. NEJM 314: 964-973, April l0, 1986.
Kemper, P., et al.: Evaluation of the national long-term care demonstrations: Final report. Final Report prepared for DHHS under Contract Number HHS-100-80-0157, Mathematica Policy Research, Inc., 1986. [http://aspe.hhs.gov/daltcp/reports/chanes.htm]
Kirsch, Lawrence J. and Robertson, Peter: A preliminary reconnaissance of long-term care insurance. Report to Commissioner, Division of Insurance, Commonwealth of Massachusetts, March 1985.
La Tour, S.A., Friedman, B., and Hughes, E.F.X.: Medicare beneficiary decision making about health insurance: Implications for a voucher system. Forthcoming in Medical Care, 1986.
La Jolla Management Corporation (Clinksdale, R., Burwell, B., Brudevold, C., et al.): Financial incentives for family care. Draft Final Report. HCFA Contract No. 500-83-0056, Rockville, Md. May 17, 1985.
Lane, Lawrence F.: Companies providing long-term care insurance coverage. American Health Care Association Memorandum, January 3, 1986.
Lane, Laurence F.: The potential of private long-term care insurance. Pride Institute Journal 4(3): 15-24, 1985.
La Porte, V. and Rubin, J.: Reform and regulation in long-term care. Praeger Publishers, New York, 1979.
Lazenby, H., Levit, K., Waldo, D.: National health expenditures, 1985. Health Care Financing Review, in press.
Levit, K., Lazenby, H. Waldo, D. and Dandoff, L.: National health expenditures, 1984. Health Care Financing Review 7(l): 1-35, 1985.
Liu, K. and Manton, K.: The characteristics and utilization pattern of an admission cohort of nursing home patients. The Gerontologist 23(l): 92-98, 1983.
Liu, K. and Manton, K.: The characteristics and utilization pattern of an admission cohort of nursing home patients (II). The Gerontologist 24(l): 70-76, 1984.
Liu, K. and Manton, K.G.: Special analyses of the 1982 long-term care survey. Performed for the Department of Health and Human Services, 1986.
Liu, K., Manton, K.G., and Liu, B.M.: Home care expenses for the disabled elderly. Health Care Financing Review 7(2): 51-5s, 1985.
Manton, K.G. and Liu, K.: The future growth of the long-term care population: Projections based on the 1977 national nursing home survey and the 1982 long-term care survey. Paper presented at the Hillhaven Foundation's Third National Leadership Conference on Long-Term Care Issues: The Future World of Long-Term Care, Washington, D.C., March 7-9, 1984.
McConnel, C.E.: A note on the lifetime risk of nursing home residency. Gerontologist 24(2): 193-198, 1984.
Meiners, Mark R.: The case for long-term care insurance. Health Affairs 2(2): 55-79, Summer 1983.
Meiners, Mark R.: The state of the art in long-term care insurance. In Feinstein, P.H., Gornick, M. and Greenberg, J.N. (Eds.): Long-term care financing and delivery systems: Exploring some alternatives. Conference Proceedings. Health Care Financing Administration Publication No. 03174, Washington, D.C., 1984.
Meiners, Mark R.: Data requirements for long-term care insurance. Paper prepared for National Research Council Panel on Statistics for an Aging Population, November 1985.
Meiners, Mark R. and Greenberg, Jay: Improving the role of private markets in financing long-term care services. Draft Background Research paper prepared in association with Committee for Economic Development Project on the Role of Market Initiatives in Improving U.S. Health Care, April 1986.
Meiners, Mark R. and Tave, Arlene K.: Consumer interest in long-term care insurance: A survey of the elderly in six States. U.S. Department of Health and Human Services: National Center for Health Services Research, 1984.
Meiners, Mark R. and Trapnell, Gordon R.: Long-term care insurance premium estimates for prototype policies. Medical Care 22(10): 901-911, October 1984.
Moon, Marilyn: Private capacity to finance long-term care. Project to Analyze Existing Long-term Care Data. Urban Institute, volume IV, pp. 227-279, 1984. [http://aspe.hhs.gov/daltcp/reports/privcap.htm]
Myers, J.K., et al.: Six-month prevalence of psychiatric disorders in three communities. Arch Gen Psychiatry 41: 959-967, October 1984.
National Association of Insurance Commissioners: Long-term care: An industry perspective on market development and consumer protection. Exposure draft, June 8, 1986.
National Center for Health Statistics: Characteristics of nursing home residents, health status, and care received, 1977. Vital and Health Statistics 13(51). DHHS Publication (PHS) 81-1712, United States Government Printing Office, Washington, D.C., 1981.
National Center for Health Statistics: Health, United States: 1984. DHHS Publication (PHS) 85-1232. United States Government Printing Office, Washington, D.C., 1985.
National Center for Home Equity Conversion: A financial guide to the century plan, 3rd Edition. September 1984.
Office of Human Development Services: Social Services in the year 2000. United States Government Printing Office, Washington, D.C., 1985.
Olsen, L., Caton, C., and Duffy, M.: The elderly and the future economy. Lexington Books, 1981.
Phillips, Robert F.: The Fireman's Fund's experience. In Feinstein, P.H., Gornick, M. and Greenberg, J.N. (Eds.): Long-term care financing and delivery systems: Exploring some alternatives. Conference Proceedings. Health Care Financing Administration Publication No. 03174, Washington, D.C., 1984.
Pies, Harvey: Life care communities for the aged--An overview. In Feinstein, P.H., Gornick, M. and Greenberg, J.N. (Eds.): Long-term care financing and delivery systems: Exploring some alternatives. Conference Proceedings. Health Care Financing Administration Publication No. 03174, Washington, D.C., 1984.
Rahn, R.W.: Long-term proposal for restructuring Medicare. In Report of the 1982 Advisory Council on Social Security, pp. 90-93, 1984.
Ralya, D.: San Francisco Development Fund, July, 1986.
Reynolds, John D.: Retirement plans and health insurance. Employee Benefits Report 12(7): 5, March 1986.
Rose, A.M.: Continuing care retirement centers: An expansion opportunity. In Laventhol and Horwath (Eds.): Lifecare Industry, Philadelphia, 1983.
Rose, A.M.: Entrepreneurs reshaping life cars. Modern Health Care, July 1984.
Ross, C., Danziger, S., and Smolensky, E.: Interpreting changes in the economic status of the elderly, 1949 - 1979. Institute for Research on Poverty, Draft Discussion Paper, University of Wisconsin, May 1986.
Ryse, Charles J.: Retiree medical plans - today's issues. Topics on Health Care Financing, 12(4): 52-60, Summer 1986.
Sangl, J.A.: The family support system of the elderly. In Vogel, R.J. and Palmer, H.C. (Eds.): Long-term care: Perspectives for research and demonstrations. Health Care Financing Administration, pp. 307-36, Washington, D.C.
Schneider, E.L. and Brody, J.A.: Aging, natural death and the compression of morbidity: Another view. New England Journal of Medicine 309: 854-855, October 6, 1983.
Shanas, E.: The family as support system in old age. The Gerontologist 19: 169-174, 1979.
Smallegan, M.: How families decide on nursing home admission. Geriatric Consultant, pp. 21-24, March-April, 1983.
Smallegan, M.: There was nothing else to do: Needs for care before nursing home admission. The Gerontologist 25: 364-69, 1985.
Soldo, B.: The home care population: National prevalence rates, select characteristics, and alternative sources of assistance. Urban Institute, Washington, D.C., May 1983.
Soldo, B. and Manton, K.G.: Health status and service needs of the oldest old: Current patterns and future trends. Milbank Memorial Fund Quarterly/Health and Society 63: 286-319, 1985.
Somers, Anne R.: Long-term care for the elderly and disabled, a new priority. New England Journal of Medicine 307(4), July 22, 1982.
Somers, A.: Medicare and long-term care. Perspectives on Aging, March-April, 1983.
Stone, Robyn, Cafferata, Gail Lee, and Sangl, Judith: Caregivers of the frail elderly: A national profile. National center for Health Services Research, U.S. Department of Health and Human Services, Rockville, Md., 1986. A
Sussman, Marvin: Incentives and family environments for the elderly. Final Report to the Administration on Aging, Grant No. 90-A-316, Unpublished, 1977.
Sussman, Marvin: Social and economic supports and family environments for the elderly. Final Report to the Administration on Aging, Grant No. 90-A-316 (03), 1979.
The Travelers Insurance Company: A survey of caregiving responsibilities of travelers employees for older americans. June 1985.
The New York Times: Corporate Eldercare. June 22, 1986.
Topolnicki, D.M.: When a nursing home becomes your poorhouse. Money, pp. 175-182, March 1986.
Topolnicki, D.M.: The broken life-care. Money, pp. 150-157, April 1985.
U.S. Bureau of the Census: Marital status and living arrangements: March 1984. Current Population Reports, Series p-20, No. 399. United States Government Printing Office, Washington, D.C., 1985.
U.S. Bureau of the Census: Household wealth and asset ownership: 1984. Current Population Reports Series P-70, No.7: U.S. Government Printing Office, Washington, D.C., 1986.
U.S. Bureau of the Census: Women in the american economy. Current Population Reports, Series P-23, in press.
U.S. Senate, Special Committee on Aging: Aging America: Trends and pojections, 1985-86 edition. United States Government Printing Office, Washington, D.C., 1986.
Verbrugge, L.: A health profile of oleder women with comparisons to older men. Research on Aging 6(3): 291-322, 1984.
Waldo, D. and Lazenby, H.: Demographic characteristics and health care use and expenditures by the aged in the United States: 1977-1984. Health Care Financing Review 6 (1): 1-29, 1984.
Washington Business Group on Health: Post-retirement medical benefits: Survey Report. Institute on Aging, Work and Health, June 1985.
Williams, S.: Long-term care alternatives: Continuing care retirement communities. Alpha Centerpiece, January 1984.
Winklevoss, Howard E. and Powell, Alwyn: Continuing care retirement communities: An empirical, financial, and legal analysis. Richard D. Irwin, Inc., Homewood, Illinois, 1984.
Wooldridge, J., et al.: Evaluation of the national long-term care demonstration: Channeling effects on hospitals, nursing homes, and other medical seniors. Prepared for DHHS under Contract Number HHS-100-80-0157 by Mathematica Policy Research, Inc., 1986. [http://aspe.hhs.gov/daltcp/reports/hospites.htm]
Appendices
TABLE OF CONTENTS
APPENDIX 1: Description of National Surveys Related to Long-Term Care
1982 Long-Term Care Survey
1984 Long-Term Care Survey
National Health Care Expenditures Study (NHCES)
National Health Interview Survey
National Long-Term Care Channeling Demonstration
1977 National Nursing Home Survey
Consumer Expenditure Survey
Current Population Survey
APPENDIX 2: Examples of Long-Term Care Insurance Policies
APPENDIX 3: Home Equity Conversion
APPENDIX 4: Induced Demand
Rationale
Baseline Assumption
Varied Coverage Levels
Application
APPENDIX 5: Description of Brookings/ICF Microsimulation Model
Pension and Retirement Income Simulation Model (PRISM)
Simulation of Long-Term Care Utilization and Financing
Assumptions
LIST OF FIGURES
FIGURE A5-1: Brookings/ICF Long-Term Care Financing Model
FIGURE A5-2: PRISM Flowchart
FIGURE A5-3: Flowchart for Utilization of Long-Term Care Services
LIST OF TABLES
TABLE A2-1: Long-Term Care Insurance Examples: Policy Features of Insurance Companies
TABLE A2-2: Annual Premium Rates per $100 Monthly Benefits for Fireman’s Fund Policies Original Policy
TABLE A2-3: Annual Premium Rates for Federated American Policy
TABLE A2-4: Annual Premium Rates for Massachusetts Indemnity Policies
TABLE A2-5: Annual Premium Rates for Great Republic Policy
TABLE A2-6: Annual Premium Rates for United Equitable Policies
TABLE A2-7: Annual Premium Rates per $5 Daily Benefits for Health Insurance Corporation Policy
TABLE A2-8: Annual Premium Rates for Equitable Life Policies
TABLE A2-9: Annual Premium Rates for Transport Life Insurance Company
TABLE A2-10: Annual Premium Rates for Kemper Group Policies
TABLE A2-11: Annual Premium Rates for Merchant’s and Manufactures Policy
TABLE A2-12: Annual Premium Rates for National Foundation Life Insurance Policy
TABLE A2-13: Annual Renewal Premium Rates for Mutual Protective/Medico Life Insurance Company Policies
TABLE A2-14: Annual Premium Rates per $10 a Day for Columbia Life Insurance Company
TABLE A2-15: Annual Premium Rates for Blue Cross of North Dakota Policies
TABLE A4-1: Assumed Induced Demand Levels for Various Levels of Nursing Home Insurance Coverage
APPENDIX 1. DESCRIPTION OF NATIONAL SURVEYS RELATED TO LONG-TERM CARE
1982 Long-Term Care Survey
The survey was conducted by the Census Bureau under the co-sponsorship of two components of the Department of Health and Human Services: the Health Care Financing Administration and the Assistant Secretary for Planning and Evaluation. A nationally stratified sample of functionally impaired elderly Medicare beneficiaries living in the community were the subjects of the survey. An initial screening of about 36,000 persons resulted in interviews of 6,088 who met the project criteria of problems performing any Activities of Daily Living (ADL, e.g., eating, toileting) or Instrumental Activities of Daily Living (IADL, e.g., shopping, cooking) for a period of at least three months.
Those who met the survey criteria were asked questions about the following subjects: demographic characteristics, housing characteristics, household composition, children of sample person not living in the household, paid and unpaid caregivers, type of care provided by caregivers, extent of ADL and IADL limitations, medical expenses, income (individual and family members living in household), source of income, mental status, and other variables that might affect their ability to live in the community.
1984 Long-Term Care Survey
The 1984 survey builds on the 1982 Long-Term Care Survey described above. The 1984 survey is the first nationwide, longitudinal tracking of functionally impaired elderly persons (whether they are living in the community or in institutions). In addition to following up on all of the people in the 1982 survey, the 1984 survey includes a new sample of elderly who were not yet age 65 in 1982.
All functionally impaired elderly living in the community were asked similar questions in 1982 and 1984. Data gathered from the institutionalized elderly (1984 survey) included: problems with activities of daily living and instrumental activities of daily living, source of payment, and demographic characteristics. For those persons who died since the 1982 survey, a proxy respondent was asked about place of residence at time of death and other pertinent questions.
National Health Care Expenditures Study (NHCES)
This survey is sponsored by the National Center for Health Services Research and Health Care Technology Assessment and the National Center for Health Statistics; it is conducted by three subcontractors. The survey is designed to provide a comprehensive statistical picture of how health services are used and financed by the civilian, noninstitutionalized population in the U.S.
The survey is a one-time panel sample of about 14,000 randomly selected households. Respondents were interviewed six times over an 18-month period during 1977 and 1978. The survey was complemented by additional surveys of physicians and health care facilities providing care to household members during 1977 and of employers and insurance companies responsible for their insurance coverage.
Data collected include: expenditures and sources of payment for all major forms of medical care, sociodemographic and economic characteristics of respondents, insurance coverage of respondents, information from medical providers about respondents, and access to medical care.
National Health Interview Survey
The National Center for Health Statistics has conducted the National Health Interview Survey, a principal source of information about the health of the civilian, noninstitutionalized population in the U.S., annually since 1957. The "core" survey remains virtually unchanged from year to year. Special supplements on topical issues are added each year.
Data are collected from about 42,000 households on the incidence of illness and accidental injuries, prevalence of chronic diseases and impairments, disability, physician and dental visits, hospitalizations, other health topics, and on the relationship between demographic and socioeconomic characteristics and health characteristics.
National Long-Term Care Channeling Demonstration
Several components of the Department of Health and Human Services (Office of the Assistant Secretary for Planning and Evaluation, Health Care Financing Administration, and Administration on Aging) conducted a national demonstration project from 1982 to 1985 to channel those individuals over 65 at risk of institutionalization into appropriate community based services. The demonstration tested whether and to what extent the long-term care needs of elderly impaired persons could be met in a cost-effective way through a community based system of comprehensive needs assessment, care planning, and case management. Jurisdictions in 10 States (Kentucky, Maine, Maryland, New Jersey, Texas, Florida, Massachusetts, New York, Ohio, and Pennsylvania) took part in the project.
Applicants judged appropriate for the demonstration were randomly assigned to either a client or a control group. The experimental design permitted a direct comparison of the impact of the demonstration on participants with the outcomes of the control group members who receive their services through the conventional delivery system. Data collection for both client and control groups included an initial baseline assessment and follow-up interviews. Information was gathered about health, quality of life, use of formal and informal services, and expenditures for services (including Medicare and Medicaid).
1977 National Nursing Home Survey
The National Center for Health Statistics collected data from a nationwide sample of all nursing homes in the continental U.S. (including homes not certified by Medicaid or Medicare. This is the second of three National Nursing Home Surveys; the first was conducted in 1973-1974. A 1985 National Nursing Home Survey is in progress. In the 1977 survey, all levels of care were included, e.g., skilled, intermediate, and custodial. The sample included 1,451 nursing homes, 7,033 current residents of these homes 5,142 discharged residents and 13,634 staff from these homes. There were five questionnaires: current resident, discharged resident, facility, expense, and staff.
Data collected about current reside include: demographic characteristics, impairments, therapy services, previous living arrangement and household composition, expected date of discharge, expected household arrangement after discharge, if the patient receives medication, frequency of physician visits, primary diagnosis, and primary reasons resident entered the facility.
Data collected about discharged reside include: demographic characteristics, impairments, whether discharged dead or alive, where resident stayed after discharge and typo of facility, primary diagnosis at admission, use of aids, if the patient saw a physician during the last stay, and what services were received during the seven days prior to discharge.
Data collected about facilities include: whether or not the facility is a distinct nursing home unit of a hospital, another health institution or a retirement center; number of beds in the entire facility; type of ownership, physical, and structural characteristics of the building; level of certification, number of beds at each certification level, and total number of inpatient days of care by certification level; reimbursement mechanisms authorized by Medicare; Medicare and Medicaid certification; admission policy, staffing and services.
Data collected about expenses include: revenues from patients and non-patients, and enumeration of numerous categories of expenses.
Data collected about staff include: type of tasks performed by the staff, and other personnel items.
Consumer Expenditure Survey
The Consumer Expenditure Survey (CES), sponsored by the Bureau of Labor Statistics through a contract to the Bureau of the Census, gathers information on the consumer expenditures and socioeconomic characteristics of American families. This ongoing national survey has two parts: a Diary Survey with 5,000 respondents who keep a diary of their expenditures and an Interview Survey with 5,000 respondents who are interviewed five times at quarterly intervals. Information is collected on demographic characteristics, type and amount of expenditures, income and assets. The most recently published CES results are from the 1982-1983 survey.
Current Population Survey
The Current Population Survey (CPS), sponsored by the Bureau of Labor Statistics and carried out by the U.S. Bureau of Census, provides monthly national estimates of employment and unemployment. A national sample of about 59,000 addressees (representing the civilian noninstitutionalized labor force) is interviewed each month. The CPS has been ongoing since 1942.
In addition to employment data, monthly supplements on special topics such as income, work experience, school enrollment, pension plans, etc. are asked. The CPS provides much information on the demographic and economic characteristics of Americans and is the leading source of data for annual poverty estimates.
APPENDIX 2. EXAMPLES OF LONG-TERM CARE INSURANCE POLICIES
| TABLE A2-1: Long-Term Care Insurance Examples: Policy Features of Insurance Companies | |
|---|---|
| BLUE CROSS OF NORTH DAKOTA Skilled care covered: Yes. Intermediate care covered: Yes. Custodial care covered: No. Home care covered: No. Indemnity benefit: Yes. Choice of up to $50 per day. Waiting/elimination deductible period: 100 days. Length of coverage: Choice offered of nursing home care for 2 to 5 years. Sales screened for health status: Yes. Specific questions asked about illnesses and institutionalizations. Preexisting condition period: 180 days. Prior hospitalization required: No. Use must be recommended and reviewed by physician: Yes. Covers mental and nervous disorders: Yes. Guaranteed renewable: No. Company can change premiums: Yes. | BLUE CROSS OF SOUTHERN CALIFORNIA -- ULTRACARE Skilled care covered: Yes, but limited to Medicare gaps. Intermediate care covered: No. Custodial care covered: No. Home care covered: Yes. Indemnity benefit: No. Waiting/elimination deductible period: No. Length of coverage: Nursing home benefit covers days 20-100, home health benefits as needed. Sales screened for health status: No. Preexisting condition period: No. Prior hospitalization required: Yes, for nursing home. No, for home health. Use must be recommended and reviewed by physician: Yes Covers mental and nervous disorders: Yes Guaranteed renewable: No. Company can change premiums: Yes. |
| COLUMBIA LIFE INSURANCE COMPANY Skilled care covered: Yes. Intermediate care covered: Yes. Custodial care covered: Yes. Home care covered: No. Indemnity benefit: Yes. Choice of up to $50 per day. Waiting/elimination deductible period: Choice offered: 0, 20, 60 or 100 days. Length of coverage: Skilled care, 5 years. Intermediate or custodial care, 6 or 12 months. Sales screened for health status: Yes. Specific questions asked about illnesses and institutionalizations. Preexisting condition period: 6 months for conditions appearing in previous 5 years, plus some conditions specifically excluded. Prior hospitalization required: Yes. Confinement must begin within 14 days after hospitalization of 3 or more days. Use must be recommended and reviewed by physician: Yes. Physician must certify that patient needs no greater or lesser care and physical exam can be required at company's expense. Covers mental and nervious disorders: No. Guaranteed renewable: No. Nonrenewable statewide. Company can change premiums: Yes. | EQUITABLE LIFE AND CASUALTY INSURANCE COMPANY Skilled care covered: Yes. Intermediate care covered: Yes. Custodial care covered: Yes. Home care covered: Yes. Indemnity benefit: Yes. Choice of up to $60 per day for skilled care, $30 per day for intermediate care, $15 per day for custodial care, $7.50 per day for home care. Waiting/elimination deductible period: Choice offered 0, 20, or 100 days. Length of coverage: 24 months for skilled care, 12 months for intermediate care, 6 months for custodial care, and 30 days for home confinement with a $90,000 lifetime maximum benefit. Sales screened for health status: Yes. Detailed list of condition information requested. Preexisting condition period: 6 months for conditions appearing in previous 5 years. Prior hospitalization required: Yes. Confinement must begin within 14 days after hospitalization of 3 or more days. Use must be recommended and reviewed by physician: No explicit statement, but physical exam can be required at company’s expense. Covers mental and nervous disorders: Yes, if demonstrable organic disease. Guaranteed renewable: Yes. Company can change premiums: Yes. |
| FEDERATED AMERICAN LIFE INSURANCE COMPANY Skilled care covered: Yes. Intermediate care covered: Yes. Custodial care covered: Yes. Home care covered: No. Indemnity benefit: Yes. Choice of up to $30. Waiting/elimination deductible period: 20 days. Length of coverage: 4 years. Sales screened for health status: Yes. General questions asked about institutionalization and physician care in previous 12 months and ability to perform daily activities. Preexisting condition period: 30 days. Prior hospitalization required: Yes. Confinement must begin within 90 days after hospitalization of 3 or more days. Use must be recommended and reviewed by physician: Yes. Confinement must be recommended by physician and physical exam can be required at company’s expense. Covers mental and nervous disorders: Yes, if demonstrable organic disease. Guaranteed renewable: Yes. Company can change premiums: Yes. | FIREMENS FUND AMERICAN LIFE INSURANCE COMPANY Skilled care covered: Yes. Intermediate care covered: Yes. Custodial care covered: Yes. Home care covered: Yes. Indemnity benefit: Yes. Choice of up to $60 per day for nursing home. $30 per day for home care. Waiting/elimination deductible period: Choice offered, 20 or 100 days. Length of coverage: 4 years for any nursing home confinement. 180 days for home health. Sales screened for health status: Yes. General questions asked about institutional and physician care in previous months and ability to perform daily activities. Preexisting condition period: 90 days. Prior hospitalization required: Yes. Confinement must begin within 90 days after hospitalization of 3 or more days. Use must be recommended and reviewed by physician: Yes. Confinement must be recommended by physician and physical exam can be required at company’s expense. Covers mental and nervous disorders: Yes, if demonstrable organic illness. Guaranteed renewable: No. Nonrenewable statewide. Company can change premiums: Yes. |
| GREAT REPUBLIC LIFE INSURANCE COMPANY Skilled care covered: Yes. Intermediate care covered: Yes. Added as optional rider. Custodial care covered: Yes. Added as optional rider. Home care covered: Yes. Private duty nurse. Indemnity benefit: No. Pays actual charge up to $20 per day for days 1-100; $40 for days 101-1095 for skilled care; $25 per day for private duty nurse at home. 70% of actual charge up to $40 per day for intermediate or custodial care. Waiting/elimination deductible period: None for skilled nursing home care or private duty nurse. 90 days for intermediate and/or custodial care benefit. Length of coverage: 3 years for skilled nursing home care and private duty nurse. 2 years for intermediate or custodial care benefit. Sales screened for health status: Yes. Specific questions asked about illnesses and institutionalizations. Preexisting condition period: 1 year for conditions appearing in previous year. Prior hospitalization required: Yes. Confinement must begin within 28 days after hospitalization of 3 or more days. Use must be recommended and reviewed by physician: Yes. Confinement must be recommended by physician and physical exam can be required at company’s expense. Covers mental and nervous disorders: No. Guaranteed renewable: Yes. Company can change premiums: Yes. | HEALTH INSURANCE CORPORATION Skilled care covered: Yes. Intermediate care covered: Yes, by rider. Custodial care covered: Yes, by rider. Home care covered: No. Indemnity benefit: Yes. Intermediate and custodial care paid at one-half of rate chosen for skilled care. Waiting/elimination deductible period: None. Length of coverage: 1 year for care in a skilled nursing facility. Care in an intermediate and custodial facility is subject to the amount of skilled care received on a 2- for 1-day basis for up to 730 days. Sales screened for health status: No. Preexisting condition period: 12 months. Prior hospitalization required: Yes. Confinement must begin within 30 days after hospitalization of 3 or more days. Use must be recommended and reviewed by physician: Yes. Confinement must be recommended by physician and physical exam can be required at company’s expense. Covers mental and nervous disorders: No. Guaranteed renewable: No. Nonrenewable statewide. Company can change premiums: Yes. |
| KEMPER GROUP Skilled care covered: Yes. Intermediate care covered: Yes, but very limited. Custodial care covered: Yes, but very limited. Home care covered: Yes, private duty nurse. Indemnity benefit: Yes. $20 per day for days 1-100, $40 per day for days 101-1095, $10 per day for less than skilled care, $25 per day for private duty nurse at home. Waiting/elimination deductible period: None for skilled nursing home care or private duty nurse. Length of coverage: 3 years for skilled nursing home care and private duty nurse. 2 years for intermediate or custodial care benefit. Sales screened for health status: Yes. Specific questions asked about illnesses and institutionalizations. Preexisting condition period: 12 months. Prior hospitalization required: Yes. Confinement must begin within 28 days after hospitalization of 3 or more days. Nonskilled care must also follow 20 days of covered care in a skilled nursing facility. Use must be recommended and reviewed by physician: Yes. Confinement must be recommended and reviewed by physician. Covers mental and nervous disorders: No. Guaranteed renewable: Yes. Company can change premiums: Yes. | MASSACHUSETTS INDEMNITY AND LIFE INSURANCE COMPANY Skilled care covered: Yes. Intermediate care covered: Yes. Custodial care covered: No. Home care covered: No. Indemnity benefit: Yes. $50 per day for skilled care or $40 per day for intermediate care. Waiting/elimination deductible period: 60 days. Length of coverage: $75,000 lifetime maximum benefit allows 4.9 years of skilled care or 5.9 years of intermediate care. Sales screened for health status: Yes, but limited evaluation to those hospitalized or in a skilled nursing home in prior 12 months. Preexisting condition period: 12 months. Prior hospitalization required: Yes. Confinement must begin within 28 days after hospitalization of 3 or more days. Use must be recommended and reviewed by physician: Yes. Confinement must be recommended by a physician and must be recertified every 30 days. Covers mental and nervous disorders: Yes, if demonstrable organic disease. Guaranteed renewable: No. Nonrenewable on group basis. Company can change premiums: Yes. |
| MERCHANTS AND MANUFACTERERS INSURANCE COMPANY Skilled care covered: Yes. Intermediate care covered: Yes. Custodial care covered: Yes. Home care covered: Yes, private duty nurse. Indemnity benefit: Yes. Up to $40 per day for all nursing home care, up to $50 per day for private duty nurse at home. Waiting/elimination deductible period: None. Length of coverage: 4 years for skilled nursing home and home health benefit. 2 years for intermediate or custodial care. Sales screened for health status: Yes. Specific questions asked about illnesses and institutionalizations. Preexisting condition period: 6 months. Prior hospitalization required: Yes. Confinement or home care must begin within 14 days after hospitalization of 3 or more days. Use must be recommended and reviewed by physician: Yes. Physician must certify at least once a month that beneficiary needs no greater or lesser care. Covers mental and nervous disorders: No. Guaranteed renewable: Yes. Company can change premiums: Yes. | MUTUAL PROTECTIVE/MEDICO LIFE INSURANCE COMPANY Skilled care covered: Yes. Intermediate care covered: Yes, but very limited. Custodial care covered: Yes, but very limited. Home care covered: Yes, but very limited. Indemnity benefit: Yes. 2 plans. Skilled care, $6/$12 for days 1-20, $20/30 for days 21-100, $40/$60 for day 101 to 4 years. Intermediate care, $10/$20 per day. Custodial care, $5/$10 per day. Home care, $5/$10 per day. Waiting/elimination deductible period: None. Length of coverage: Skilled care, 4 years. Intermediate care, 180 days. Custodial care, 180 days. Home Care, 30 days. Sales screened for health status: Yes. Specific questions asked about illnesses and institutionalizations. Preexisting condition period: 6 months for conditions appearing in previous 5 years. Prior hospitalization required: Yes. Confinement must begin within 14 days after a hospitalization of 3 or more days. Use must be recommended and reviewed by physician: Yes. Confinement must be recommended by a physician; for skilled care the physician must certify once a month that care the physician must certify once a month that care is needed and received. Covers mental and nervous disorders: Yes, if demonstrable organic condition. Guaranteed renewable: No. Nonrenewable statewide. Company can change premiums: Yes |
| NATIONAL FOUNDATION LIFE INSURANCE COMPANY Skilled care covered: Yes. Intermediate care covered: Yes. Custodial care covered: Yes, but very limited. Home care covered: Yes. Separate, limited policy. Indemnity benefit: Yes. Choice of $20-$50. Waiting/elimination deductible period: None. Length of coverage: 3 years for skilled and intermediate care. 90 days for custodial care. Sales screened for health status: Yes. Specific questions asked about illnesses and institutionalizations. Preexisting condition period: For persons 64 and over, 6 months (2 years for other ages) for condition appearing in previous 5 years. Prior hospitalization required: Yes. Confinement must begin within 14 days after hospitalization of 3 or more days. Use must be recommended and reviewed by physician: No specific statement. Covers mental and nervous disorders: Yes, if demonstrable organic disease. Guaranteed renewable: Yes. Company can change premiums: Yes. | TRANSPORT LIFE INSURANCE COMPANY Skilled care covered: Yes. Intermediate care covered: Unclear. Custodial care covered: Yes, but very limited. Home care covered: No. Indemnity benefit: Yes. Choice of up to $60 per day for skilled care, up to $15 per day for custodial care. Waiting/elimination deductible period: None for individual policy. 0 or 100 days for group policy. Length of coverage: 3 years for skilled nursing care. 120 days for custodial care. Group policy limits skilled nursing care to 2 years. Sales screened for health status: Yes. Specific questions asked about illnesses and institutionalizations. Preexisting condition period: 6 months for conditions appearing in previous 12 months. Prior hospitalization required: Yes. Confinement must begin within 90 days after hospitalization or 3 or more days. Use must be recommended and reviewed by physician: Yes. Confinement must be medically necessary. Covers mental and nervous disorders: No. Guaranteed renewable: Yes. Company can change premiums: Yes. |
| UNITED AUTO WORKERS Skilled care covered: Yes. Intermediate care covered: Yes. Custodial care covered: No. Home care covered: Yes. Indemnity benefit: None. Waiting/elimination deductible period: Direct tradeoff of nursing home days (2 for 1) and home visits (3 for 1) with hospital days. Length of coverage: No. Sales screened for health status: No. Preexisting condition period: No. Prior hospitalization required: No. Use must be recommended and reviewed by physician: No specific statement. Covers mental and nervous disorders: Yes, but only up to 90 days. Guaranteed renewable: As long as employed. Company can change premiums: Not applicable employee benefit. | UNITED EQUITABLE INSURANCE COMPANY Skilled care covered: Yes. Intermediate care covered: Yes. Custodial care covered: Yes. Home care covered: No. Indemnity benefit: Yes. Choice of up to $40 for skilled care benefit, one-half chosen rate for intermediate or custodial benefit. Waiting/elimination deductible period: Choice offered 0, 20, or 100 days, intermediate or custodial benefit must follow at least 20 days in skilled nursing care. Length of coverage: 4 years for skilled care benefit. Choice offered of 6 or 12 months coverage for intermediate or custodial care. Sales screened for health status: Yes. Asks for detailed information about illnesses, institutional care in previous 6 months, and activity restrictions. Preexisting condition period: 180 days. Prior hospitalization required: Yes. Confinement must begin within 30 days after hospitalization of 3 or more days. Use must be recommended and reviewed by physician: Yes. Confinement must be recommended by physician and physical exam can be required at company’s expense. Covers mental and nervous disorders: Yes, if demonstrable organic disease. Guaranteed renewable: Yes. Company can change premiums: Yes. |
| TABLE A2-2: Annual Premium Rates per $100 Monthly Benefits for Firemans Fund Policies Original Policy | ||||
|---|---|---|---|---|
| Age | 2-Year Benefit | 4-Year Benefit | ||
| 1st Day | 21st Day | 1st Day | 21st Day | |
| 50-64 | $41 | $26 | $48 | $30 |
| 65-71 | 48 | 34 | 57 | 40 |
| 72-79 | 57 | 46 | 63 | 51 |
| Current Policy* -- Annual Premiums per $100 Monthly Benefit | ||||
| Age | 21st Day | 101st Day | ||
| Under 64 | $25 | $20 | ||
| 60-65 | 30 | 23 | ||
| 70 | 42 | 32 | ||
| 71 | 44 | 34 | ||
| 72 | 47 | 36 | ||
| 73 | 50 | 39 | ||
| 74 | 53 | 41 | ||
| 75 | 58 | 45 | ||
| 76 | 63 | 49 | ||
| 77 | 58 | 52 | ||
| 78 | 73 | 56 | ||
| 79 | 78 | 60 | ||
| 80* | 78 | 60 | ||
| 81* | 78 | 60 | ||
| * Only available if spouse is insured for like or greater amount and under age 80. | ||||
| TABLE A2-3: Annual Premium Rates for Federated American Policy | |
|---|---|
| Age | $30 Daily Benefit, 4 Years Coverage, 20 Day Waiting Period |
| 50-64 | $170 |
| 65-71 | 290 |
| 72-84 | 440 |
| TABLE A2-4: Annual Premium Rates for Massachusetts Indemnity Policies | ||
|---|---|---|
| Age | $50 SNF Benefit -- $40 ICF Benefit -- 60 Day Waiting Period -- $75,000 Maximum Benefit | |
| Minnesota | Other States | |
| 18-39 | $55 | $75 |
| 40-54 | 75 | 105 |
| 55-64 | 135 | 185 |
| 65-69 | 260 | 310 |
| 70-74 | 465 | 550 |
| 75-79 | 600 | 715 |
| 80-84 | 795 | 940 |
| 85+ | 1,055 | 1,245 |
| TABLE A2-5: Annual Premium Rates for Great Republic Policy | ||
|---|---|---|
| Age | Skilled Nursing Home Care Policy | Intermediate and Custodial Care Rider |
| 55-69 | $195 | $130 |
| 70-74 | 227 | 180 |
| 75-79 | 295 | 260 |
| 80-84 | 295 | 330 |
| TABLE A2-6: Annual Premium Rates for United Equitable Policies | ||||||
|---|---|---|---|---|---|---|
| Age | Intermediate and Custodial Benefit | |||||
| 6 Month Benefit Period | 12 Month Benefit Period | |||||
| Benefits Begin | Benefits Begin | |||||
| 1st Day | 21st Day | 101st Day | 1st Day | 21st Day | 101st Day | |
| 62-69 | $260 | $212 | $100 | $340 | $292 | $180 |
| 70-74 | 420 | 340 | 156 | 548 | 468 | 284 |
| 75-79 | 602 | 492 | 238 | 782 | 672 | 418 |
| 80-84 | 774 | 640 | 336 | 998 | 864 | 560 |
| Annual Premium | ||||||
| Age | Wisconsin Policy | |||||
| 65-69 | $860 | |||||
| 70-74 | 1,070 | |||||
| 75-79 | 1,300 | |||||
| 80-84 | 1,500 | |||||
| TABLE A2-7: Annual Premium Rates per $5 Daily Benefits for Health Insurance Corporation Policy | ||
|---|---|---|
| Age | Skilled Benefit Only | Skilled, Intermediate and Custodial Benefit |
| Through 80 | $38.00 | $66.50 |
| 81 and over | 47.50 | 83.00 |
| TABLE A2-8: Annual Premium Rates for Equitable Life Policies | ||||||
|---|---|---|---|---|---|---|
| Age | $45,000 Maximum, $30 Per Day Skilled Benefit | $90,000 Maximum, $60 Per Day Skilled Benefit | ||||
| Benefits Begin | Benefits Begin | |||||
| 1st Day | 21st Day | 101st Day | 1st Day | 21st Day | 101st Day | |
| 50-70 | $216.65 | $186.65 | $138.32 | $433.29 | $373.303 | $276.64 |
| 71-75 | 341.63 | 293.30 | 216.65 | 683.27 | 586.61 | 433.29 |
| 76-80 | 499.95 | 433.29 | 314.97 | 999.90 | 866.58 | 629.94 |
| 81-85 | 656.60 | 576.61 | 419.96 | 1313.20 | 1153.22 | 839.92 |
| TABLE A2-9: Annual Premium Rates for Transport Life Insurance Company | ||||
|---|---|---|---|---|
| Age | Individual Plan -- $60 Daily Benefit | Group Plans -- $60 Daily Benefit | ||
| 1st - 730th Day | $30 1st - 730th Day | 101st - 730th Day | ||
| 60-64 | $405.00 | $329.00 | $270.00 | $207.00 |
| 65-69 | 450.00 | 365.40 | 292.00 | 230.40 |
| 70-74 | 705.00 | 572.40 | 468.00 | 361.80 |
| 75-79 | 930.00 | 756.00 | 617.40 | 477.00 |
| 80-84 | 1,170.00 | 950.40 | 774.00 | 599.40 |
| TABLE A2-10: Annual Premium Rates for Kemper Group Policies | |||
|---|---|---|---|
| Age | Hospital Indemnity Add On | Medicare Supplement Add On | Skilled Nursing Home |
| 50-59 | --- | --- | $219 |
| 60-64 | --- | --- | 263 |
| 65-69 | $200 | $186.25 | 305 |
| 70-74 | 270 | 228.75 | 370 |
| 75-79 | 330 | 278.75 | 461 |
| 80-84 | 380 | 321.25 | 552 |
| TABLE A2-11: Annual Premium Rates for Merchants and Manufactures Policy | |||
|---|---|---|---|
| Age | Daily Benefit | ||
| $20 | $30 | $40 | |
| 65-69 | $442.11 | $687.67 | $937.23 |
| 70-79 | 464.74 | 734.94 | 1,005.14 |
| 80-85 | 680.88 | 1,005.50 | --- |
| TABLE A2-12: Annual Premium Rates for National Foundation Life Insurance Policy | ||||
|---|---|---|---|---|
| Age | Daily Benefit | |||
| $20 | $30 | $40 | $50 | |
| 18-34 | $20 | $35 | $50 | $65 |
| 35-44 | 48 | 68 | 88 | 108 |
| 45-54 | 97 | 127 | 157 | 187 |
| 55-64 | 168 | 208 | 248 | 288 |
| 65-84 | 289 | 339 | 389 | 439 |
| TABLE A2-13: Annual Renewal Premium Rates for Mutual Protective/Medico Life Insurance Company Policies | |||
| At Attained Ages | Plan 1 | Plan 2 | |
| Basic Rate | 18-69 | $164.00 | $268.00 |
|---|---|---|---|
| 70-79 | 202.00 | 334.00 | |
| 80-84 | 219.00 | 362.00 | |
| With one condition | 18-69 | $244.00 | $398.00 |
| 70-79 | 300.00 | 496.00 | |
| 80-84 | 324.00 | 536.00 | |
| With two conditions | 18-69 | $324.00 | $528.00 |
| 70-79 | 398.00 | 658.00 | |
| 80-84 | 429.00 | 710.00 | |
| TABLE A2-14: Annual Premium Rates per $10 a Day for Columbia Life Insurance Company | |||
|---|---|---|---|
| All Rates Include 60 Months Benefit Period for Skilled Nursing Care | |||
| Issue Age | Elimination Period No. of Days | Intermediate and Custodial Care Optional Benefit Period of: | |
| 6 Months | 12 Months | ||
| 60-64 | 0 | 44.00 | 63.00 |
| 20 | 38.00 | 58.00 | |
| 60 | 31.00 | 50.00 | |
| 100 | 25.00 | 43.00 | |
| 65-69 | 0 | 61.00 | 86.00 |
| 20 | 53.00 | 78.00 | |
| 60 | 43.00 | 67.00 | |
| 100 | 34.00 | 58.00 | |
| 70-74 | 0 | 91.00 | 127.00 |
| 20 | 79.00 | 115.00 | |
| 60 | 64.00 | 99.00 | |
| 100 | 50.00 | 85.00 | |
| TABLE A2-15: Annual Premium Rates for Blue Cross of North Dakota Policies | |||||
|---|---|---|---|---|---|
| Attained Age | Base Policy | Increase Days to 1000 | Paid up at 80 | Addition $1.00 per Day | |
| Male | Female | ||||
| 55-59 | $298 | $90 | $25.86 | $42.83 | $8.50 |
| 60-64 | 347 | 105 | 45.64 | 72.95 | 10.00 |
| 65-69 | 404 | 122 | 88.64 | 134.85 | 11.50 |
| 70-74 | 437 | 132 | 206.33 | 294.08 | 12.50 |
| 75-79 | 505 | 153 | --- | --- | 14.50 |
| 80+ | 600 | 181 | --- | --- | 17.00 |
| Original Policy ($35 SNF/$30 ICF daily benefit for days 101-730) | |||||
APPENDIX 3. HOME EQUITY CONVERSION
The National Center for Home Equity Conversion (NCHEC) has several reference materials available for purchase at cost. A sampling of some of these materials includes:
-
Home-Made Pension Plans - Overview of the HEC concept, analytical perspectives summary of specific plans, etc.
-
National Directory and Sourcebook - Up-to-date listing o HEC Programs in operation and under development throughout the country.
-
Analyzing RAM and HELP - Detailed analysis of first 3.50 transactions completed by San Francisco RAM program and the Buffalo HELP program.
-
Sale Leaseback Guide and Model Documents - Provides guidance to sellers, buyers, attorneys and brokers. Legal analysis explains model documents including sale leaseback agreement, secured promissory note, deed of trust, lease and memorandum of lease.
For more information on the products available, call or write:
NCHEC - Room 622
110 East Main Street
Madison, Wisconsin 53703
(608) 256-2111
The American Bar Association, Commission on Legal Problems of the Elderly bas developed an "Attorney's Guide to Home Equity Conversion”.
The guide can be used to facilitate research by attorneys on legal issues involved with HEC. It examines the three most widely used plans, highlights the Federal law framework for each, suggests provisions which should be included in documents governing the transaction and suggests issues that may arise under State law. For more information write or call:
Commission on Legal Problems of the Elderly
American Bar Association
1800 M. Street, N.W.
Washington, D.C. 20036
(202) 331-2297
The Bureau of Maine’s Elderly, Department of Human Services, developed “A Consumer’s Guide to Home Equity Conversion". The intent of the guide is to provide elderly consumers with a basic understanding of the HEC concept to help them decide if it is an appropriate choice. For more information call or write:
The American Association of Retired Persons (AARP) is developing a series of publications on HEC which will be available sometime in 1986. They include Guides for Attorneys, Bankers, Accountants and Consumers. They are also planning to publish model sale leaseback documents, model reverse mortgage documents and state specific brochures on deferred payment loans/property tax deferral. For more information write:
AARP - Consumer Affairs
1909 K Street, N.W.
Washington, D.C. 20049
APPENDIX 4. INDUCED DEMAND
Premium/contribution estimates in this report produced by the actuaries from the Social Security Administration reflect the judgement that increased third party payments (insurance) for the cost of nursing home care will significantly increase the demand for nursing home care by those insured. The balance of this appendix explains the rationale for the details of this assumed induced demand.
Rationale
Both economic theory and experience indicate that, with very few exceptions, reducing the price of a good or service will result in an increase in demand for that good or service. Health services are no exception to this principle. Past experience has shown that whenever the out-of-pocket price to the consumer of a health service is reduced, either due to lower costs for the provider or increased payment by a third party (insurance), demand for that health service increases.
Data presented in this report indicate that there are at least as many elderly persons with limitations in Activities of Daily Living who are not in nursing homes as there are in nursing homes. The decisions not to enter a nursing home for such persons is based, at least in part, on the very high out-of-pocket expense of residing in a nursing home. Should nursing home insurance (private or public) become more widely available, this barrier to receiving nursing home care will be greatly reduced for many, with the result that entering a nursing home will become relatively more attractive for those insured than is now the case.
Baseline Assumption
Nursing home prevalence rates, by age group, derived from the 1977 National Nursing Home Survey, form the basis for projected nursing home utilization under the current policy (base) cases presented in this report. It is assumed that nursing home insurance policies developed for study would be widely marketed to a diverse group of persons for whom nursing home utilization, in the absence of insurance, would be about the same as for the general population.
For the broadest level of coverage considered, that is, (1) no elimination period, (2) no limit on number of years of nursing home care for which payments would be made, and (3) reimbursement at an annual rate of $25,000 per year ($68.50 per day) in 1986 dollars, average utilization is assumed to be 50 percent higher than would be expected in the absence of such insurance. In other words, induced demand is assured at 50 percent.
The baseline assumption of 50 percent induced demand for broad coverage is based on informal judgement after consulting with experts in the area of health utilization experience under both private and private insurance programs. No reliable data are available for the precise determination of this baseline assumption. The actual level of induced demand that would occur for such broad coverage could easily be somewhat less or much more than 50 percent.
Varied Coverage Levels
In order to readily compute reasonable and consistent induced demand levels for nursing home insurance with various levels of coverage, a formula was developed which reflects four basic assumptions: (1) the baseline induced demand level for broad coverage (described above) is So percent, (2) induced demand drops as the elimination period is increased, (3) induced demand drops as the number of years of coverage is decreased, and (4) induced demand drops as the annual dollar amount of coverage is decreased.
The formula which was developed is as follows:
Induced Demand = [(9-a / 2) x (12+2b / 3) + 2] x (c / 25,000
where
a = 1 for 0-day elimination period
a = 2 for 30-day elimination period
a = 3 for 60-day elimination period
a = 4 for 90-day elimination period
a = 5 for 180-day elimination period
a = 6 for 365-day elimination periodb = the maximum number of years of coverage, 12 is used for unlimited coverage,
and c = the annual dollar amount of coverage provided in 1986 dollars.
The table below presents examples of the results of this induced demand formula.
| TABLE A4-1: Assumed Induced Demand Levels for Various Levels of Nursing Home Insurance Coverage | ||||
|---|---|---|---|---|
| Coverage Amount | Maximum Number of Years of Coverage | Elimination Period (in days) | ||
| 0 | 90 | 365 | ||
| $25,000 | 1 | 21% | 14% | 9% |
| 6 | 34 | 22 | 14 | |
| no limit | 50 | 32 | 20 | |
| 18,262 ($50/day) | 1 | 15 | 10 | 7 |
| 6 | 25 | 16 | 10 | |
| no limit | 37 | 23 | 15 | |
Application
The induced demand assumptions described above presume that an increased nursing home bed supply will be available to satisfy the increased demand for insured individuals. For insurance plans which cover only a minority of the elderly population, this presumption is easily met because relatively few additional beds would be required by the insured population. Even if the total supply of beds did not increase, the insured population would be better able to pay nursing home costs and would thus likely displace some uninsured persons.
If nursing home insurance coverage were to become universal, either through a public program or mandated private coverage, the supply of nursing home beds would likely rise to satisfy the additional demand because of the enhanced ability to pay for such care. If, however, universal nursing home insurance coverage was accompanied by no increase in the supply of nursing home beds (as compared with the number of beds available in the absence of such coverage), then no induced demand would be realized. Projections of the impact of nursing home insurance which includes no induced demand are applicable only in this last case, where universal coverage is met with no increase in the supply of nursing home beds.
Office of the Actuary
Social Security Administration
September 5, 1986
APPENDIX 5. DESCRIPTION OF BROOKINGS/ICF MICROSIMULATION MODEL
Simulations of the potential impact of various private financing mechanisms were conducted using an econometric model developed by staff of ICF Incorporated and the Brookings Institution. The Brookings/ICF Long-Term Care Financing Model is a “microsimulation” model. For a representative sample of individuals, the Brookings/ICF Long-Term Care Financing Model simulates for each of these individuals in each year from 1986 to 2020: 1) their sources and levels of income; 2) their utilization of long-term care services; and 3) their sources and levels of payment for long-term care services.
The Brookings/ICF Long-Term Care Financing Model was developed rising components of two models: 1) the ICF Pension and Retirement Income Simulation Model (PRISM) which simulates the future family structure, income, and assets of a representative sample of individuals; and 2) the ICF Long-Term Care Financing Model which simulates long-term care utilization and the sources of financing for long-term care for individuals age 65 and over.
As shown in Figure A5-1, the Brookings/ICF Long-Term Care Financing Model consists of six major components:
-
Population Data Base--Using enhanced data from the May 1979 Current Population Survey, this data base contains data on a representative sample of individuals of all ages in 1979. The 1977 database was selected because it had been enhanced by the Social Security Administration so as to contain Social Security earnings histories for each individual.
-
Income Simulator--Using PRISM, the second part of the model simulates labor force activity, family structure, income, and assets for each individual. The model is linked to macroeconomic forecasts so that its long-term estimates of labor force participation and wages are consistent with economic trends. The model estimates retirement income not only from private sector, defined benefit pension plans, but also public pension plans, private sector defined contribution plans, IRAs, and Keoghs. The model also simulates the assets of individuals, including the value of home equity. These estimates are made for each year for each individual until the individual dies.
-
Disability of the Elderly--The third part of the model uses probabilities estimated primarily from the 1982 National Long-Term Care Survey and the 1977 National Nursing Home Survey to simulate the disability of persons age 65 and over. This part of the model simulates entrance to disabled status and recovery from disability.
-
Utilization of Long-Term Care Services--The fourth part of the model uses a set of probabilities to simulate the likelihood of entering a nursing home and length of stay. For non-institutionalized persons, it also simulates the likelihood of using non-institutional services.
-
Sources and Levels of Payment--The fifth part of the model simulates- the sources of payment and the level of expenditures for each individual receiving institutional or non-institutional long-term care services. This part of the model incorporates the provisions of Medicare and Medicaid and models the spend-down of individuals onto Medicaid.
-
Aggregate Expenditures and Utilization--The sixth part of the model accumulates Medicare, Medicaid, and private expenditures and utilization for the simulated individuals for each year of the simulation.
This model operates on individual records from the population data base. It simulates changes in the status of each individual in the data base in each year using estimated probabilities. The output of the model is a longitudinal data file for each individual, which contains data for each year on marital status, labor force activity, income, assets, disability status, and use of long-term care services.
The model uses a Monte Carlo simulation methodology. This approach simulates changes in each individual's marital, employment, retirement, and disability status from one year to the next using probabilities which depend upon the demographic and economic characteristics of the individual. Each of these changes in status are called “events”. PRISM simulates each of these events for an individual by drawing a random number between zero and one and comparing it to the probability of that event occurring for an individual with his or her socioeconomic characteristics. For example, assume the probability of death for a 53 year old male is .01 (i.e., one out of every 100 men age 53 is expected to die). If the random number drawn for a 53 year old man is less than or equal to .01, then the individual is assumed to die. If the number drawn lies between .01 and 1.0, then the individual is assumed to live.
The following section presents a brief overview of the key features of PRISM and the other parts of the Brookings/ICF Long-Term Care Financing Model.
Pension and Retirement Income Simulation Model (PRISM)
The ICF Pension and Retirement Income Simulation Model (PRISM) is a dynamic microsimulation model which simulates the distribution of income from both public and private sources for families through the year 2030. The sources of income modeled by PRISM include earnings from employment, social security, private and public employer retirement plans, individual retirement accounts (IRAs), and the Supplemental Security Income (SSI) program. PRISM also calculates State and Federal income taxes to estimate disposable income levels. A flow chart of the model is shown in Figure A5-2.
PRISM simulates the distribution of the sources and levels of retirement income for a representative sample of the population. The model's primary objective is to simulate how income from these sources will be distributed among households of various socioeconomic groups. This allows analysts to simulate not only the distribution of income under current policy, but also the impact that policy changes or economic trends may have on various segments of the population.
The model is designed so that it can easily accommodate a wide range of changes in policies or economic trends, such as changes in social security benefits, real wage growth, or labor force participation. One of PRISM's unique features is that it can be linked with macroeconomic forecasts to ensure that its estimates of labor force participation and earnings (on an age/sex basis) are consistent with the projected aggregate growth of the economy.
Simulation of Long-Term Care Utilization and Financing
As shown in Figure A5-3, the Brookings/ICF Long-Term Care Financing Model simulates disability of the elderly, their utilization of institutional and non-institutional services, and the methods of financing these long-term care services.
To simulate long-term care utilization, the model first simulates disability for persons age 65 and over using probabilities developed primarily from the 1982 National Long-Term Care Survey and the 1977 National Nursing Home Survey. Using these probabilities and probabilities of recovery from disability, the model simulates disability for different age, sex, and marital status groups.
The model then uses Monte Carlo simulation techniques to simulate on an annual basis whether or not each individual enters a nursing home or starts using non-institutional services. If an individual is simulated to enter a nursing home or use non-institutional services, the model probabilistically simulates the length of stay or the length of time the individual uses non-institutional services.
The model then simulates the sources and levels of payment for long-term care services using the simulated utilization patterns. For example, for each individual who enters a nursing home, this part of the model simulates whether: 1) Medicare will pay for any services; and 2) whether the individual will pay for nursing home services using Medicaid private resources, or both. This part of the model also accumulates long-term care costs by source of payment.
Assumptions
The model is based on a large number of assumptions concerning demographic and economic trends which are described in detail in a draft documentation report (ICF, 1986). Virtually all of the key assumptions relevant to the simulations discussed in this report are consistent with the Alternative 11-B assumptions of the Annual Report of the Board of Trustees of the Federal Old Age and Survivors insurance and Disability Insurance Trust Funds. Major assumptions are discussed in the context of simulation results in the body of this report in Section D: Special Analysis, of Chapter III.
| FIGURE A5-1: Brookings/ICF Long-Term Care Financing Model |
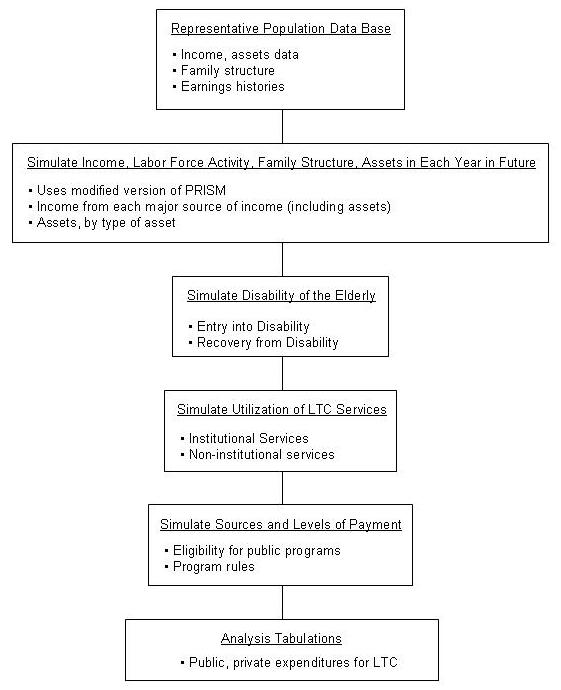 |
| FIGURE A5-2: PRISM Flowchart |
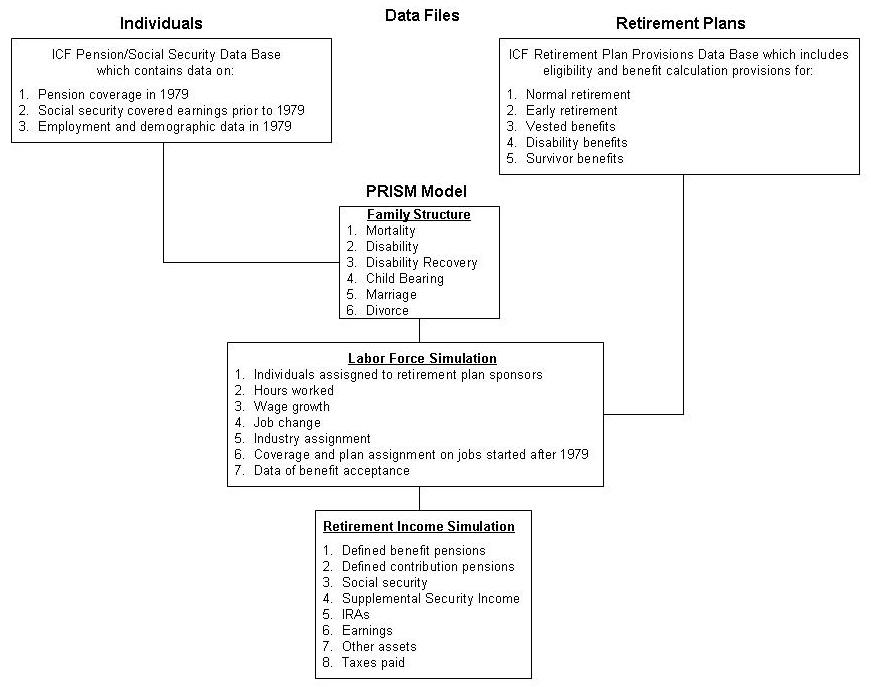 |
| FIGURE A5-3: Flowchart for Utilization of Long-Term Care Services |
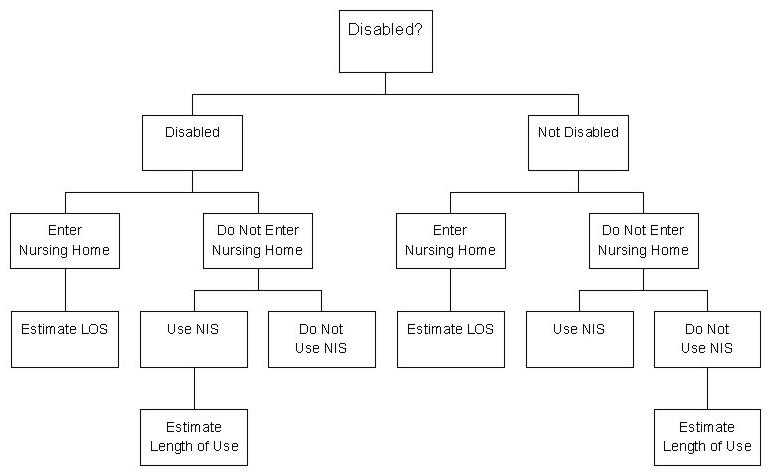 |
| HTML FILES FOR THIS REPORT: Cover through Chapter 2: http://aspe.hhs.gov/daltcp/reports/pfltce.htm |