
U.S. Department of Health and Human Services
An Exploratory Analysis of the Medicaid Expenditures of Substance Exposed Children Under 2 Years of Age in California
Marilyn Rymer Ellwood, E. Kathleen Adams, William H. Crown and Suzanne Dodds
SysteMetrics
September 1993
This report was prepared under contracts #PHS-282-92-0047, #HHS-100-88-0041, #HCFA-90-0045 between the Department of Health and Human Services (HHS) and SysteMetrics. In addition to HHS's Office of Social Services Policy (now the Office of Disability, Aging and Long-Term Care Policy), additional funding was also provided by the Health Care Financing Administration (now CMS). For additional information about this subject, you can visit the ASPE home page at http://aspe.hhs.gov. The Project Officer was Laura Feig.
The authors would like to express their appreciation to Sharman Stephens and Laura Feig of the Office of the Assistant Secretary for Planning and Evaluation, and Marilyn Hirsch of the Health Care Financing Administration's Office of Research for the leadership and direction they provided for this study. In addition, Samira Al-Qazzaz of California's Medi-Cal program was an enormous asset to the project team in helping us understand the State's Medicaid data and reviewing the study results.
TABLE OF CONTENTS
- METHODOLOGY
- Study Cohort Selection
- Comparison Group Selection
- Final Study Cohort and Comparison Group for The Descriptive Analysis
- File Merger with California Vital Statistics
- Other Methdological Issues
- Study Limitations
- DESCRIPTIVE FINDINGS
- Identification of Substance Exposed Children in the Medicaid Population
- Incidence of Substance Exposed Children in the Medicaid Population
- Personal Characteristics and Medicaid Enrollment Patterns
- Information on Mothers
- Medicaid Health Care Utilization Patterns
- Medicaid Expenditure Patterns
- Sensitivity Analyses
- SUBGROUP ANALYSES OF SUBSTANCE EXPOSED COHORT
- Self-Identified Children Versus Mother-Identified Children
- Foster Care Children Versus Non-Foster Care Children
- Children with Continuous Versus Non-Continuous Medicaid Enrollment
- High Cost Children Versus Other Children
- MERGER WITH CALIFORNIA VITAL STATISTICS DATA
- Study Cohort/Control Group Comparisons
- Study Cohort Characteristics by Birth Weight
- Control Group Characteristics by Birth Weight
- MULTIVARIATE ANALYSES
- Multinomial Logit Models of Low and Very Low Birth Weight
- Multiple Regression Model of Medicaid Expenditures
- EXHIBITS
- EXHIBIT 1. ICD-9-CM Diagnosis Codes and Short Doyle Service Codes for the Identification of Substance Exposed Children
- EXHIBIT 2. Preliminary Study Cohort by Source of Study Identification and Medicaid File Linkage Status
- EXHIBIT 3. Preliminary Study Cohort and Comparison Group by Medicaid File Linkage Status
- EXHIBIT 4. Final Study Cohort and Comparison Group by Medicaid File Linkage Status
- EXHIBIT 5. Final Study Cohort and Comparison Group by Vital Statistics Merger Status
- EXHIBIT 6. Proportion of Substance Exposed Children by ICD-9-CM Diagnosis Code and Source of Identification
- EXHIBIT 7. Other Findings Related to Study Identification by Diagnosis Codes
- EXHIBIT 8. Timing of Substance Related Diagnoses Among Mothers of Study Cohort
- EXHIBIT 9. Incidence of Substance Exposed Children by Year of Birth Compared to Overall Enrollment of Children Under Age 1 in Medi-Cal by Year
- EXHIBIT 10. Personal Characteristics and Enrollment Information on Study Cohort and Comparison Group
- EXHIBIT 11. Information on Mothers of Children in the Study Cohort and Comparison Group
- EXHIBIT 12. Service Utilization Data for Children in Study Cohort and Control Group By Selected Time Periods
- EXHIBIT 13. Distribution of Diagnoses for Inpatient Hospital Admissions Study Cohort and Comparison Group
- EXHIBIT 14. Comparison of Hospital Discharge Rate and Average Stay for Children Under Age 1 in General Population and Study Cohort and Comparison Group
- EXHIBIT 15. Medicaid Expenditure Data for Children in Study Cohort and Control Group By Selected Time Periods
- EXHIBIT 16. EPSDT and Delivery Expenditure Data for Study Cohort and Control Group
- EXHIBIT 17. Sensitivity Analyses: Medicaid Expenditure Data for Children in Study Cohort and Control Group
- EXHIBIT 18. Selected Data Comparing Substance Exposed Children by Source of Study Identification
- EXHIBIT 19. Selected Data Comparing Foster Care Children to Non-Foster Care Children in the Substance Exposed Group
- EXHIBIT 20. Selected Data Comparing Continuously Enrolled Children to Non-Continuously Enrolled Children in the Substance Exposed Group
- EXHIBIT 21. Distributional Analysis of Medicaid Expenditures for Substance Exposed Cohort
- EXHIBIT 22. Selected Data Comparing High Cost Children* to Other Children in the Substance Exposed Group
- EXHIBIT 23. Selected Data Comparing High Cost Children* to Other Children in the Comparison Group
- EXHIBIT 24. Distributions of Selected Variables for the Merged California Tape-to-Tape and Vital Statistics File
- EXHIBIT 25. Distributions of Selected Explanatory Variables for Study Cohort and Control Group
- EXHIBIT 26. Distributions of Selected Explanatory Variables by Birth Weight Category: Study Cohort
- EXHIBIT 27. Distributions of Selected Explanatory Variables by Birth Weight Category: Control Group
- EXHIBIT 28. Multinomial Logit Model of Very Low and Low Birth Weight
- EXHIBIT 29. Multiple Regression Model of Log-Transformed Medicaid Costs
EXECUTIVE SUMMARY
This project was designed to explore the utilization and expenditures to Medicaid of substance exposed children, using data on the experience of children born in California in 1986,1987 and 1988. The Medicaid experience of these children in their first two years of life was the focus of the analysis. The study also included a randomly sampled comparison group of Medicaid children in California without identified substance exposure problems. The analysis was conducted in two phases. In the first phase, data from the Medicaid Tape-to-Tape data set for California were analyzed. Tape-to-Tape is a multi-State Medicaid data base developed by the Office of Research and Demonstrations at the Health Care Financing Administration (HCFA). In the second phase of the analysis, the Medicaid Tape-to-Tape data were merged with California Vital Statistics data (birth records). This merger enabled the analysis of factors (substance exposure and others) associated with low birth weight among Medicaid infants, as well as the subsequent impacts of low birth weight, substance exposure, and other factors upon Medicaid expenditures.
There are numerous problems with identifying substance exposed infants. For example, physicians are reported to be reluctant to identity children as having substance exposure problems. Pregnant women are also reported to be hesitant to seek treatment for their substance abuse problems during pregnancy. They fear losing custody of their children or other legal problems if their substance abuse is known. Finally, many treatment programs refuse to treat pregnant women.
To identity a study cohort of young children with a potential drug/alcohol exposure problem, a broad definition of substance exposure was used. The inpatient and outpatient claims files of all women who delivered under Medicaid from 1986-1988 were searched for the two years prior to delivery and six months post delivery to see if there were diagnoses indicating drug or alcohol abuse problems. The rationale for going beyond the immediate period of pregnancy was that if there was substance abuse in the period preceding pregnancy or immediately after delivery, there was a reasonable probability that abuse (and thus exposure for the child) occurred during the period of pregnancy. The claims files of all Medicaid children born in 1986-1988 in California were also searched to identity children with a direct diagnosis code indicating drug or alcohol exposure problems.
With this approach, 8,862 children under age 2 with diagnoses related to substance exposure were identified in preliminary study data. Of these, 74.3% were identified solely through some indication of drug/alcohol abuse in their mothers' files. Another 21.4% were identified solely through diagnoses related to drug or alcohol exposure problems in their own Medicaid files. A final 4.2% had indications of drug/alcohol problems in both their mothers' files and their own files. There were 15,814 children in the randomly selected comparison group sample.
The study methodology did not identity nearly as many substance exposed children in the Medicaid population as other researchers have suggested. The final study cohort of 7,802 children represented 1.4% to 1.9% of the children born in 1986, 1987 and 1988 who were enrolled in California's Medicaid program.1 However, without direct testing, the study methodology was limited in its ability to identity children with substance exposure. Other researchers have found that the identification rate of substance exposed infants is increased from 3 to 5 times if direct testing is utilized. There were also limitations regarding the diagnosis coding in California Medicaid claims data.
Nevertheless, the number of substance exposed children enrolled in the California Medicaid program increased substantially over the three year study period. The number of substance exposed children identified from Medi-Cal data was 3,113 for those born in 1988, compared to 2,159 for those children born in 1986. This represented an increase of 44.2%. The number of substance exposed children was growing at a faster rate than the overall enrollment of children under age 1 in California's Medicaid program. From 1986 to 1988, the number of child enrollees under age 1 on Medicaid grew by only 8.8%.
There were differences between the substance exposed cohort and the control group in the distribution of children by Medicaid eligibility group. The most striking difference is the higher proportion of substance exposed children in foster care. About 24% of children in the study cohort were in foster care, compared to 2% in the control group. Other researchers have also reported a high proportion of substance exposed children in foster care.
Substance exposed children showed a stronger attachment to the Medicaid program in their first two years of life than children in the control group. Children in the study cohort averaged about 18 months enrollment over a 24 month period, compared to 13 months for children in the control group. Over half the study cohort children were enrolled for 22-24 months, compared to only about 30% of the control group.
An important study question was whether or not substance exposed children have greater health care needs and thus higher rates of Medicaid utilization than other Medicaid children in the first two years of life. Generally, study data showed that substance exposed children were more likely to be inpatient hospital users in both the first and second years of life than other children on Medicaid. Adjusting study data for length of enrollment only did not change this basic pattern.
Substance exposed children also had higher use rates for physician/ambulatory care services, and they averaged more visits per user than children in the control group. However, this difference was reduced in the first year of life and disappeared in the second year of life, using data adjusted for length of enrollment.
Generally, study data indicated that substance exposed children were considerably more expensive to the Medicaid program than other Medicaid children of the same age. The average Medicaid expenditure per substance exposed child over the first two years of life was $2,285, compared to $1,551 for the control group. This represents a difference of about 47%. However, much of this expenditure difference is attributable to longer average lengths of enrollment for the study cohort. With adjustments for enrollment, the Medicaid expenditure per child year of enrollment was $1,664 for the study cohort, compared to $1,472 for the control group. This represents a difference of about 13%, or $192 per person year of enrollment ($384 for two years).
Thus, substance exposed children had greater utilization and expenditures under Medicaid than other children. However, much of this difference was attributable to longer length of enrollment, not greater health care needs. This result is important because some anecdotal information has implied that thy long-term health care needs (and expenses) of substance exposed children far exceed those of other children. Study data over a two year period do not support this conclusion, when a broad definition of substance exposure for children is used.
As with most insured groups, a majority of children did not have expenditures nearly as great as the average. The median expenditure per substance exposed child was $465 over the two year study period, compared to a median expenditure of $240 per child for the control group. Related to this result, 10% of the children in the study cohort accounted for 73% of the total Medicaid expenditures for the substance exposed group. Similarly, 10% of the children in the comparison group accounted for 79% of that group's total Medicaid expenditures.
The sensitivity of study data was tested, using more conservative definitions of substance exposure. One analysis focused on only those children with direct diagnoses of substance exposure in their own claims records. With this approach, the expenditure difference between substance exposed children and other Medicaid children was substantially greater. Children who were directly diagnosed with substance exposure problems had expenditures almost twice the rate of other Medicaid children in the first two years of life, even with adjustments for length of enrollment. Due to their high costs, this group of children with direct diagnoses of substance exposure in their records may be good candidates for case management under State Medicaid programs.
As mentioned earlier, study results confirmed both the growing numbers and high proportion of substance exposed children in foster care. Further, substance exposed children in foster care had higher Medicaid expenditures than other substance exposed children. The higher Medicaid costs of the substance exposed foster care subgroup, coupled with their costs in foster care payments, add a growing burden on a system already under financial pressure.
One unexpected study finding was that many of the substance exposed children had mothers with strong attachments to the Medicaid program. Mother and child Medicaid files were linked for 87% of the study cohort, indicating that these infants had Medicaid-covered deliveries. Generally, the mothers of substance exposed children were older than mothers of the control group children, and the study cohort mothers showed longer enrollment on Medicaid prior to delivery. For example, over one-quarter of the study cohort mothers had been on Medicaid for the entire two years preceding delivery, compared to only 14% of the comparison group mothers. This result reinforces the need for Medicaid treatment services directed to adults with substance abuse problems.
To examine the effects of substance exposure on birth outcomes, the 1986, 1987, and 1988 California Tape-to-Tape data for the study cohort and control group were linked to California Vital Statistics data for the same years. Approximately 77% of the originally identified children were successfully matched with the Vital Statistics Data. There were two main reasons for unsuccessful matches. First, not all children who were enrolled in California Medicaid sometime during their first two years of life were born in California. Second, the Vital Statistics file contained only the mother's last name. For common last names, this limited the ability to match Vital Statistics and Tape-to-Tape records.
The California Vital Statistics data provided information on a number of variables not available in the Tape-to-Tape data, including the race/ethnicity and marital status of the mother, pregnancy and delivery histories, and birth outcomes. Substantial differences in the race/ethnicity compositions of the study cohort and control groups were found. Mothers of children in the study cohort were much more likely to be Black than mothers of children in the control group; the converse was true for mothers of Hispanic origin. Thirty percent of the mothers in the study cohort were Black--twice the percentage for the control group. Twenty-six percent of the mothers in the study group were of Hispanic origin compared to 41.5% of the mothers in the control group.
Mothers in the study cohort were also more likely to have had previous pregnancy terminations, pregnancy complications, and complications with delivery. In addition, more than 74% of the mothers in the study cohort had previously given birth, compared to about 60% of the control group.
One of the most significant findings pertained to the relationship between substance exposure and premature birth and low birth weight. Over 19% of the study group infants were premature (or very premature) versus 12.4% of the control group infants. Moreover, these figures probably underestimate the actual incidence of premature births because gestational age was not available for 7.9% of the study cohort and 5.5% of the control group.
The incidence of low birth weight among the study cohort was even more striking. Over 18% of the infants in the study cohort had a birth weight of less than 2,500 grams; the same was true of only 7.7% of the control group.
In addition to substance exposure, a number of other factors were found to be associated with low birth weight. For both the study and control groups, mothers of very low birth weight infants (under 1,500 grams) were more likely to be Black than to be members of other race/ethnicity groups. Study cohort mothers of low birth weight infants (1,500 to 2,499 grams) were also more likely to be Black, but this was not true of low birth weight infants in the control group.
In the study cohort, mothers of low (or very low) birth weight infants were more likely to be age 30 or older. The percentage of control group mothers age 30 or older was substantially lower than for the study cohort in each birth weight category (e.g., 15.8% of mothers of very low birth weight infants in the control group were age 30 or older, compared to 38.7% of mothers in the study cohort).
Finally, for both the study cohort and the control group, mothers of low or very low birth weight infants were more likely to have experienced previous pregnancy terminations, complications with pregnancy, or complications with delivery. Mothers of low or very low birth weight infants were also more likely to live in urbanized counties, especially in the study cohort.
The descriptive findings demonstrated that substance exposed children had higher average Medicaid expenditures and were more likely to have low birth weights than other Medicaid children. The link between low birth weight and Medicaid expenditure levels has been well-established in the literature. Consequently, it seemed plausible that substance exposure might affect Medicaid expenditures both directly and indirectly through low birth weight. For several reasons, however, the relationship between substance exposure and Medicaid costs was complex. First, the demographic characteristics of the study cohort and control group were very different. Second, study group membership increased the likelihood of having an underweight birth, but low (and very low) birth weight was also related to other factors, such as the demographic characteristics of the mother. Thus, to the extent that substance exposure influenced Medicaid costs, some of this effect might be explained by demographic characteristics, low birth weight, and other factors.
To examine the effects of substance exposure on Medicaid expenditures, controlling for the effects of other variables, a two-step multivariate analysis was conducted. The first step examined the factors associated with the probability of under weight births. This analysis confirmed the descriptive findings. The probability of low (or very low) birth weight was found to be associated with the race/ethnicity of the mother, mother's marital status, age, pregnancy and delivery history, length of Medicaid enrollment, and the sex of the infant. After controlling for all of these other factors, substance exposure was found to have a strong additional positive influence on the probability of an under weight birth.
The second stage of the analysis examined the predictors of Medicaid expenditures (adjusted for length of enrollment). As expected, under weight births were found to be an important predictor of higher Medicaid expenditures. In addition, Medicaid expenditures were influenced by the age and race/ethnicity of the mother. One or more congenital malformations, cesarean delivery, child foster care status, and male children were also associated with higher expenditures. A mother's history of previous live births (still living), urban county of residence, child medically needy status, and the dummy variable for 1988 were all associated with lower Medicaid expenditures. After controlling for all of these influences, substance exposure was found to have a separate and identifiable effect of increasing Medicaid expenditures.
The research indicated that the effects of substance exposure on Medicaid expenditures were extraordinarily complex. For example, the indirect effect of substance exposure on Medicaid expenditures, through the influence on low birth weight, was examined in this study. But it is reasonable to expect that there are similar interactions of substance exposure with race, foster care status, and other variables. More research on these interactions is necessary for a fuller understanding of the Medicaid expenditure impacts and policy implications of substance exposed children.
INTRODUCTION
In recent years, a new social problem has developed--the growing numbers of children born to mothers who are substance abusers (Slutsker, Smith, Higginson and Fleming, 1993; Gomby and Shiono, l99l). Preliminary research suggests that these children experience higher than expected problems of few growth and development during the perinatal period (Phibbs, Bateman and Schwartz, 1991; Zuckerman, 1991). There are also anecdotal reports that they have medical problems which are long-term, although definitive information is still lacking on this pattern. The potential health care costs of substance exposed children are a concern to both the Federal government and States (Phibbs, 1991). While the abuse of alcohol and other drugs affects women at all income levels, a disproportionate share of substance abuse is believed to occur among low-income women, leading to higher costs for public programs. For example, California officials have estimated that three-quarters of the medical care costs for drug exposed infants is paid by the Medicaid and California Children's Services Programs (State of California, Office of Legislative Analyst, 1989).
This project was designed to explore the utilization and expenditures to Medicaid of substance exposed children, using data on the experience of children born in 1986, 1987 and 1988 who were enrolled in California's Medicaid program (often referred to as Medi-Cal) sometime during their first two years of life. The Medicaid experience of these children in their first two years of life was the focus of the analysis. The study also included a randomly sampled comparison group of Medicaid children in California without identified substance exposure problems.
The methodology by which these children could be identified and the issues of utilization and expenditures which could be explored were dependent on the data that are included in California's Medicaid files. Key issues that could be analyzed for the study cohort of substance exposed children included:
-
Identification of Substance Exposed Children. How feasible is it to identity children with drug and alcohol exposure problems using Medicaid administrative data? What are the limitations of such an approach? How many children had direct diagnoses in their records which indicate substance exposure problems? How many additional children were identified as potential substance exposure victims by searching their mothers' records before, during and after pregnancy for diagnoses indicating substance abuse? How many children were identified by specific diagnosis?
-
Incidence. What was the incidence of drug and alcohol exposed children in California's Medicaid program in 1986, 1987 and 1988? Did the proportion of Medicaid children with such problems increase over time? How do study data on incidence compare with estimates by other researchers?
-
Personal Characteristics and Medicaid Enrollment Patterns. What were the personal characteristics of substance exposed children? To what extent were study children concentrated in California's major urban areas, such as Los Angeles, San Diego, San Francisco, San Jose, Long Beach and Oakland? What was the distribution of the study cohort by length of enrollment in Medicaid in the 24 months following birth? What proportion were born into the Medicaid program, i.e. had Medicaid-covered deliveries? What Medicaid eligibility groups did they quality under? How many were in California's foster care program?
-
Information About Their Mothers. How old were the mothers of study children at the time they gave birth? How long had they been enrolled in Medicaid (looking back 24 months prior to delivery)? How many were covered under Medicaid during the entire pregnancy? What proportion received AFDC cash assistance? How many had multiple deliveries during the 3 year study period?
-
Medicaid Utilization and Expenditures. What were the user rates for inpatient hospital care and physician/ambulatory services during the first and second years of life? What was the distribution of Medicaid expenditures for study children? Was the pattern of expenditures highly skewed? What proportion of expenditures was for inpatient hospital care? Did the pattern of expenditures change over time?
As mentioned earlier, the substance exposed study cohort was compared to a control group of Medicaid children without drug/alcohol exposure. Of particular interest was the extent to which substance exposed children were more expensive to Medicaid than other enrolled children.
In addition to an overall analysis of substance exposed children, various subgroups of substance-exposed children were investigated, including:
- Children directly identified as substance exposed compared to children whose identification for inclusion in the study was based on problems of drug or alcohol exposure in their mothers' Medicaid records;
- Foster care children;
- Children with continuous enrollment in Medicaid in the two years following birth compared to those with non-continuous enrollment; and,
- Children with high Medicaid expenditures.
Finally, the California Medicaid data were linked to the Vital Statistics birth records for California. This enabled the analysis of the effects of substance exposure on birth outcomes and of birth outcomes on Medicaid expenditures. In addition, the Vital Statistics data contained information on mothers' pregnancy and delivery histories, marital status, race, and prenatal care. These factors have been shown to be important predictors of birth weight and Medicaid cost in other studies, so it was important to control for them when attempting to isolate the effects of substance exposure on birth weight and Medicaid expenditures.
Key Issues that could be analyzed with the linked data set included:
-
Factors Associated with Low and Very Low Birth Weight. Are the factors associated with the risk of low birth weight the same as those associated with the risk of very low birth weight? Is substance exposure a statistically significant predictor of low birth weight and/or very low birth weight?
-
Factors Associated with Medicaid Expenditures. What factors are associated with Medicaid expenditures? If substance exposure has an influence on low or very low birth weight, and if birth weight, in turn, influences Medicaid expenditures, does substance exposure have an additional effect on Medicaid expenditures over and above its indirect effect through the risk of low birth weight?
California was chosen as the State for this study of substance exposed children for two reasons. Most important, longitudinal California Medicaid data were readily available for research (discussed in greater detail below). Second, California had the second largest State Medicaid program nationwide (behind New York) both in numbers of recipients and expenditures in 1988. At that point, California accounted for approximately 17% of recipients and 11 % of expenditures under Medicaid (HCFA, unpublished Form 2082 data). However, it was recognized that California was not representative of many State Medicaid programs. During the period of the study, California had elected to include more of the optional eligibility groups for coverage of children than many other States, and California had the highest income thresholds for Medicaid eligibility within the contiguous States. As a result, the study findings have to be interpreted with caution with regard to their applicability to other State Medicaid programs.
METHODOLOGY
The analysis undertaken in this study consisted of two phases. In the first phase, data from the Medicaid Tape-to-Tape data set for California were analyzed. Tape-to-Tape is a multi-State Medicaid data base developed by the Office of Research and Demonstrations at the Health Care Financing Administration (HCFA). The Tape-to-Tape data set includes every Medicaid enrollee and every claim processed on California's Medicaid Management Information System (MMIS) since 1980. These data have been subject to extensive editing, code mapping, and reformatting to produce uniform, person-based Medicaid records suitable for research. The Tape-to-Tape data used for this study cover the period from 1984 through 1989 to allow observation prior to delivery for the mothers and after delivery for the children. In the second phase of the study, the Tape-to-Tape data were merged with birth records from the California Vital Statistics file for 1986, 1987 and 1988.
Study Cohort Selection
To identify a study cohort of children with a potential drug/alcohol exposure problem, the following methodology was used. First, all women with a delivery diagnosis code or an ancillary care or accommodation code related to delivery in the California Medicaid inpatient claims files in 1986-1988 were identified. This file included 440,155 women. Their inpatient and outpatient claims for the two years prior to delivery and six months post delivery were then searched to see if there was any indication of drug or alcohol abuse problems. Limiting the time period to only the 9 months of pregnancy would have seriously constrained the study. Many women are reported to be reluctant to seek treatment for their substance abuse problems during pregnancy. They fear losing custody of their children or other legal problems it their substance abuse is known. Also, many treatment centers refuse to treat pregnant women (Horgan, Rosenbach, Ostby and Butricia, 1991; Dicker and Leighton, 1991). The rationale for going beyond the immediate period of pregnancy was that if there was substance abuse in the period preceding pregnancy or immediately after delivery, there was a reasonable probability that abuse also occurred during the period of pregnancy.
Exhibit 1 shows the ICD-9-CM diagnosis and service codes used to identity women with substance abuse problems. These codes were selected after a review of other research efforts directed to the identification of substance abusers and substance exposed children (GAO, 1990; Dicker and Leighton, 1991). Since there is some debate about the appropriateness of some of the codes (for example, the inclusion of accidental drug poisoning codes in E850-EB60), sensitivity analyses omitting several of the questionable codes were undertaken as part of the study. Analyses were also undertaken that limited the time period during which the substance abuse by mothers occurred to only the 9 months of pregnancy. The detailed results of these sensitivity analyses are reported later, but it seems appropriate to note here that they did not change the direction of the study findings.
As a second step, all children born in 1986-1988 were identified in the California Medicaid enrollment files. This file included 425,715 children. Using the same codes shown in Exhibit 1, the inpatient and outpatient files for these children were searched to identity children with a diagnosis code indicating drug or alcohol exposure problems.
| EXHIBIT 1. ICD-9-CM Diagnosis Codes and Short Doyle Service Codes for the Identification of Substance Exposed Children | |
| Diagnosis Code | Label |
| 291.0-291.9 | Alcoholic psychoses |
| 292.0-292.9 | Drug psychoses/withdrawal syndrome |
| 303.0 | Acute alcoholic intoxication |
| 303.9 | Other and unspecified alcohol dependence |
| 304.0 | Opioid type dependence |
| 304.1 | Barbiturate dependence |
| 304.2 | Cocaine dependence |
| 304.3 | Cannabis dependence |
| 304.4 | Amphetamine dependence |
| 304.5 | Hallucinogen dependence |
| 304.6 | Other type drug dependence |
| 304.7 | Combination opioid with others |
| 304.8 | Combination drug dependence excluding opioid |
| 304.9 | Unspecified drug dependence |
| 305.0 | Alcohol abuse |
| 305.2 | Cannabis abuse |
| 305.3 | Hallucinogen abuse |
| 305.4 | Barbiturate abuse |
| 305.5 | Opioid abuse |
| 305.6 | Cocaine abuse |
| 305.7 | Amphetamine abuse |
| 305.8 | Antidepressant type abuse |
| 305.9 | Other, mixed or unspecified drug abuse |
| 357.5 | Alcoholic polyneuropathy |
| 357.6 | Polyneuropathy due to drugs |
| 648.3 | Drug dependence in the mother complicating pregnancy/childbirth |
| 655.4 | Suspected damage to fetus from other disease in the mother (including alcohol addiction) |
| 655.5 | Suspected damage to fetus from drugs |
| 760.7 | Noxious influences affecting fetus via placenta or breast milk (i.e., substance abuse and other drugs) |
| 779.5 | Drug withdrawal syndrome in newborn |
| 965.0 | Poisoning by opiates and related narcotics |
| 967.0 | Poisoning by barbiturates |
| 967.1 | Poisoning by chloral hydrate group |
| 967.2 | Poisoning by paraldehyde |
| 967.3 | Poisoning by bromine compounds |
| 967.4 | Poisoning by methaqualone compounds |
| 967.5 | Poisoning by glutethimide group |
| 967.6 | Poisoning by mixed sedatives, not elsewhere classified |
| 967.8 | Poisoning by other sedatives and hypnotics |
| 967.9 | Poisoning by unspecified sedative or hypnotic |
| 969.0-969.9 | Poisoning by psychotropic agents |
| 970.0 | Poisoning by analeptics |
| 970.1 | Poisoning by opiate antagonists |
| 970.8 | Poisoning by other specified central nervous system stimulants |
| 970.9 | Poisoning by unspecified central nervous system stimulant |
| E850 | Accidental poisoning by analgesics, antipyretics and antirheumatics (includes heroin, methadone and other opiates) |
| E851 | Accidental poisoning by barbiturates |
| E852 | Accidental poisoning by other sedatives and hypnotics |
| E853 | Accidental poisoning by tranquilizers |
| E854 | Accidental poisoning by other psychotropic agents |
| E855 | Accidental poisoning by other drugs acting on central and autonomic nervous system |
| E856 | Accidental poisoning by antibiotics |
| E857 | Accidental poisoning by other anti-infectives |
| E858 | Accidental poisoning by other drugs |
| E860 | Accidental poisoning by alcohol, not elsewhere classified (i.e., alcoholic beverages) |
| E935 | Adverse drug effect: analgesics, antipyretics and antirheumatics |
| E937 | Adverse drug effect: sedatives and hypnotics |
| E939 | Adverse drug effect: psychotropics |
| E940 | Adverse drug effect: stimulants |
| Service Codes | Label |
| 20-29 | Short-Doyle methadone maintenance |
| 50-59 | Short-Doyle naltrexone treatment |
| 80-89 | Short-Doyle outpatient drug-free |
Third, the files were searched to find the children in the California Medicaid Tape-to-Tape file who were born to the mothers with substance abuse problems, linking mothers and babies by case number, date of birth/delivery date and name. A similar approach was used to find the mothers of the children identified as having drug or alcohol exposure problems. Thus, mothers were matched to their children and children to their mothers. In some instances, matches from mother to child were not possible, because the children were never enrolled in the Medicaid program (presumably due to a variety of causes such as the pregnancy outcome being a miscarriage, stillbirth, abortion, or infant death; failure of the mother to enroll the child in Medicaid; or ineligibility of the child and mother for Medicaid coverage shortly following birth). There is also the possibility that the indication of delivery was a false positive (for example, the mother might have been in false labor). Child to mother matches were also not achieved in some instances. This was expected since some children with drug or alcohol exposure problems are not enrolled into Medicaid until they are several months old, and their mothers may never be enrolled in the program.
Approximately 2,200 children were excluded from the study cohort. Three broad groups were excluded: (1) children with any enrollment under Medi-Cal capitated programs or other special county initiatives during the study period; (2) any children with "shared" Medi-Cal individual identification numbers (i.e. identification numbers which appear to have been used by more than one person); and (3) children who appeared to have more than one Medicaid identification number. Children were also excluded if their mothers had shared identification numbers. The capitated and special initiative children were excluded since complete claims data were not available on their Medicaid utilization and expenditures. Children and mothers with shared identification numbers as well as children with multiple identification numbers were excluded since their utilization and expenditure records were contaminated by the presence of multiple persons. The number of excluded children was proportionate with the extent to which these groups occurred in the overall population of Medicaid children in California.
Exhibit 2 below depicts the preliminary study cohort by source of identification for the study (i.e. child's files, mother's files, or both) and Medicaid file status (linked mother/child files, child only files and mother only files). Some 8,862 children were identified in preliminary study data for inclusion in the study cohort. Of these, 6,588 (74.3%) were identified solely through some indication of drug/alcohol abuse in their mothers' files. Another 1,899 children (21.4%) were identified solely through some identification of drug or alcohol exposure problems in their own Medicaid files. A final 375 children (4.2%) had indications of drug/alcohol problems in their mothers' files and their own files.
Both mother and child Medicaid files were linked for 6.768 children, 76.4% of the preliminary study cohort. For another 1,034 children (1 1.7% of the preliminary study cohort), only the children's files could be identified. For the final 1,060 children (12.0% of the preliminary study cohort), only the mothers' records were available. Unfortunately, it is not possible with Tape-to-Tape data to determine whether all the children in this latter group were ever born. All that is known was that there is an indication of delivery in the mothers' Medicaid files.
| EXHIBIT 2. Preliminary Study Cohort by Source of Study Identification and Medicaid File Linkage Status | ||||
| Source of Study Identification | ||||
| Children Identified by Mothers' Claims | Children Identified by Own Claims and Mothers' Claims | Children Identified by Own Claims | Subtotal | |
| Linked Mother/Child Files | 5,528 | 375 | 865 | 6,768 |
| Child Only Files | --- | --- | 1,034 | 1,034 |
| Mother Only Files | 1,060 | --- | --- | 1,060 |
| Total Files | 6,588 | 375 | 1,899 | 8,862 |
Comparison Group Selection
A comparison group of children without drug or alcohol exposure diagnoses was drawn from the California Medicaid files. However, the magnitude of the population required that a sample be used. The size of the comparison group sample was set larger than the study cohort for two reasons. First, preliminary analysis showed that there was a higher proportion of "child only" records among the comparison group. Thus, a larger sample was needed to insure there were a sufficient number of linked mother/baby cases in the comparison group. Second, since the data were to be linked with California birth records, it was important that the size of the comparison group be set large enough to support planned analyses with this data. In particular, one objective was to detect small differences in the percentage (1.5 percentage points) of low birth weight infants between the study and comparison groups.
In the California Medicaid program, enrollees are assigned both an individual identification number and a case number. The case number is used to link family members together. The case number is a 7 digit number imbedded in the 13 digit individual identification number. Since mothers and children share a common case number, this number was used to select the comparison group sample from the two rosters of delivering mothers and children born in 1986, 1987 and 1988. This gave both delivering mothers and children an equal chance of being selected for the comparison group. The last two digits of the case number in California are randomly distributed across all counties. Two random numbers from 1 to 99 were selected. Then all women who delivered in 1986, 1987 and 1988 with a case number ending with the selected digits were identified, as were all children born in 1986, 1987 and 1988 who were enrolled in the Medicaid program at some point during their first 24 months of life with case numbers ending with the selected numbers. Then mothers and children were matched. Omitted from the comparison group were any mother/child pairs which were selected for the substance exposed study cohort. The comparison group was also subject to the same exclusions used for the study cohort (see page 7). Just over 3,000 children were excluded.
Exhibit 3 below shows the study cohort and the comparison group cohort by Medicaid file status (linked mother/child files, child only files and mother only files). Some 18,106 children were identified for inclusion in the preliminary comparison group. Mother and child Medicaid files were linked for 10,383 children, 67.3% of the preliminary comparison group. This compares to 76.4% of the study cohort with linked files. Thirty percent of children in the comparison group could not be linked to their mothers, compared to only 11.7% of children among the study cohort. About 12% of the records in both groups consisted of mother only files. The larger proportion of child only files among the comparison group occurred because many newborns in California are enrolled in Medicaid soon after birth without their mothers being enrolled at all. It appears that the first contact these mothers have with the Medicaid program is at delivery, i.e. they have not had any prenatal coverage under Medicaid. Only the children are enrolled in Medicaid, not their mothers. In some instances, the delivery charges are assigned to the children's Medicaid files.
| EXHIBIT 3. Preliminary Study Cohort and Comparison Group by Medicaid File Linkage Status | ||||
| Study Cohort | Comparison Group | |||
| Number | Percent | Number | Percent | |
| Linked Mother/Child Files | 6,768 | 76.4% | 10,383 | 57.3% |
| Child Only Files | 1,034 | 11.7% | 5,431 | 30.0% |
| Mother Only Files | 1,060 | 12.0% | 2,292 | 12.7% |
| Total Files | 8,862 | 100.0% | 18,106 | 100.0% |
Final Study Cohort and Comparison Group for The Descriptive Analysis
In the study cohort and comparison group analyses which are reported in this paper, mothers without children were not included in the data. Since the focus of the study is on the Medicaid experience at the children, these mother only files could not be used. Thus, as shown in Exhibit 4 below, the final study cohort numbered 7,802 children. Complete mother/baby Medicaid files were available for 86.7% of the final study cohort while only data from the child Medicaid files were available for the balance of study substance exposed children. For the comparison group, the final size was 15,814 children. Just under 66% of these children were linked to their mothers' Medicaid files.
| EXHIBIT 4. Final Study Cohort and Comparison Group by Medicaid File Linkage Status | ||||
| Study Cohort | Comparison Group | |||
| Number | Percent | Number | Percent | |
| Linked Mother/Child Files | 6,768 | 86.7% | 10,383 | 65.7% |
| Child Only Files | 1,034 | 13.3% | 5,431 | 34.3% |
| Total Files | 7,802 | 100.0% | 15,814 | 100.0% |
File Merger with California Vital Statistics
As discussed earlier, the California Vital Statistics files contain information on a number of variables not available in the Tape-to-Tape data. Thus, as a final step in the methodology, the children in the Tape-to-Tape files were linked to the California Vital Statistics data. To accomplish this, a series of iterative steps were undertaken, using selected variables available in both data sets. The linking variables included the child's last name, first name and middle initial, the delivery date, the child's sex, the mother's last name, the age of the mother, the hospital name and the county of birth. The vast majority of cases were linked with these variables. A few additional cases were identified using a soundex version of the child's last and first names.
Exhibit 5 presents the results of the file merger. Approximately 77% of the children in both the study cohort and the comparison group were successfully matched with the Vital Statistics file. There were two main reasons for unsuccessful matches. First, not all children who were enrolled in California Medicaid sometime during their first two years of life were born in California. Second, the Vital Statistics file contained only the mother's last name. For common last names, this limited the ability to match Tape-to-Tape records to the Vital Statistics files.
| EXHIBIT 5. Final Study Cohort and Comparison Group by Vital Statistics Merger Status | ||||||
| Study Cohort | Comparison Group | |||||
| Number | Number Merged with Vital Statistics | Percent Merged | Number | Number Merged with Vital Statistics | Percent Merged | |
| Linked Mother/Child Files | 6,768 | 5,392 | 79.7% | 10,383 | 8,472 | 81.6% |
| Child Only Files | 1,034 | 626 | 60.5% | 5,431 | 3,759 | 69.2% |
| Total Files | 7,802 | 6,018 | 77.1% | 15,814 | 12,231 | 77.3% |
The merged file appeared to be representative of the original study cohort and comparison group in the Tape-to-Tape data set. Data are presented later which compares the original groups to the merged groups.
Other Methodological Issues
More than one denominator is used throughout the study data to compute Medicaid utilization and expenditure rates for the study cohort and comparison group. In addition to the usual approach of average utilization and expenditures per child, child person years of enrollment are used as a denominator, thus allowing the study data to be adjusted for length of enrollment. One of the advantages of the Tape-to-Tape data set is that monthly enrollment data are available for each child. As a result, the data can be adjusted so that a child who is only enrolled in Medicaid for 6 months is only counted as half a person year of enrollment. Similarly, rate calculations can be made with "user" person years of enrollment. With user person years of enrollment, the denominator includes only the users of a particular service. For example, the average number of inpatient hospital days per person year of enrollment can be calculated only for children who were hospitalized during the year.
Finally, it should be noted that all expenditure data were adjusted to 1988 dollars, using the medical component of the Consumer Price Index (CPI).
Study Limitations
Perhaps the most serious limitation of the study involves the problems at identifying children exposed to drugs and alcohol during the prenatal period. As other researchers have reported, there is no consensus on the number at substance exposed infants born each year, and most believe that the incidence of substance exposed newborns is significantly under-reported. In fact some evidence exists that the majority of substance exposed newborns are undetected by hospitals, in the absence of comprehensive screening and testing. There is also concern that hospitals and pediatricians until recently were not sensitive to the likelihood of substance exposure (Government Accounting Office, 1990).
This study was dependent upon there being a diagnosis of problems related to substance abuse either in the mothers' Medicaid claims data, or in the children's data. No direct testing was involved. The presumption was that if a mother had a problem of substance abuse reported in her record, substance exposure for her child occurred. Nevertheless, as noted earlier, sensitivity analyses (which are reported later) were undertaken to determine the effect of limiting the study cohort to only those children with a direct diagnosis of substance exposure, and those whose mothers had a diagnosis of substance abuse during the period of pregnancy.
A further constraint was that each California outpatient claim for Medicaid includes only one primary diagnosis code. Since a substance exposure problem is often reported as a secondary diagnosis, this limitation is believed to have significantly constrained the size of the study cohort, particularly for alcohol exposed children.
In addition, California's hospital inpatient and outpatient claims on the Tape-to-Tape files only include 4 digits in the ICD-9-CM diagnosis coding. As a result, identification of certain diagnoses which require 5 digit codes (such as fetal alcohol syndrome) was not possible, but they are included under a broader 4 digit diagnostic category.
A second limitation with study data involved delivery charges. In California, hospital delivery charges are usually assigned to the mother's Medicaid file. However, in some instances, the delivery charges may be assigned to the child's Medicaid files. This appears to occur when the mother has not been enrolled in Medicaid prior to delivery. For them reasons, there was concern that delivery charges in the child files would contaminate our calculations of the hospital expenditures under Medicaid for the children in the study. There was interest, however, in the delivery costs of substance exposed children. Thus, an attempt was made to extract the delivery charges both from the mothers' Medicaid files and the files of the children. These delivery costs are presented as a separate expenditure category in the study data, regardless of whether they come from the mothers' files or the children's files.
Third, there are some limitations in the data because children do not usually have individual Medicaid identification numbers at birth. Until they are able to obtain their own individual identification numbers, any charges for the care of children will appear on their mothers' Medicaid records. Study data showed that children in the study cohort were enrolled in Medicaid on average by age 2.3 months, compared to 3.1 months for the comparison group. Thus, hospital and outpatient expenditures in the first two months of life are not included in study data for many of the study cohort and comparison group. This causes the hospital and outpatient user and expenditure rates to be understated.
A fourth limitation is that complete expenditure data could not be compiled for the Tape-to-Tape data set for services related to the early periodic screening, diagnosis, and treatment (EPSDT) program in 1986; the EPSDT utilization data for that year are complete.2 This arose because in 1986 the EPSDT claims files only reported the total amount paid, not payments by specific services. Although the utilization and expenditure data for EPSDT for later years (1987-1989) are complete, EPSDT expenditure data are presented separately for each study year due to the limitation in the 1986 data.
A fifth limitation relates to the availability of Medicaid data for children born in 1988 (both in the study cohort and the comparison group). Medicaid data were only available through December, 1989. Thus, most children born in 1988 do not have a full two years of Medicaid data in the study results. Fortunately, the use of person years of enrollment as the denominator can compensate for these incomplete data in most calculations. However, in some instances, data are presented separately for children by year of birth.
DESCRIPTIVE FINDINGS
Identification of Substance Exposed Children in the Medicaid Population
As reported earlier, 7,802 children born in 1986, 1987 and 1988 with evidence of substance exposure problems (either in their own claims files or their mothers' files) were identified in California's Medicaid files. Exhibit 6 shows the proportion of children in the study cohort by diagnosis codes related to substance exposure. The most frequently occurring diagnosis grouping is labeled "various types of drug dependence;" the mothers of 28% of the infants identified in the study cohort had diagnoses in this grouping. The specific codes in this group included opioid (heroin), barbiturate, cocaine, marijuana or unspecified drug dependence. As a close second, 26.5% of infants had the diagnosis of drug withdrawal syndrome in newborn. Exactly 16% of study children were identified due to a diagnosis related to various types of drug abuse. Other diagnosis groupings accounting for more than 10% of study children included noxious influences affecting fetus (12.4%), drug dependence in mother complicating pregnancy or childbirth (12.2%), and various types of non-accidental drug-related poisonings (11.3%).
Exhibit 7 provides additional information about the diagnoses identifying the study cohort. The vast majority of substance exposed children (70.9%) were identified solely through diagnoses in their mothers' files. Another 24.3% of children were identified solely as a result of direct diagnoses of substance exposure problems in their own files. A final 4.8% of the study cohort had substance-related diagnoses both in their own files and in their mothers' files. Thus, only 29.1 % of children in the study cohort had direct diagnoses related to substance exposure. This low proportion of children with direct diagnoses was expected. Other researchers have reported the lack of screening for substance exposure problems among infants and the reluctance of physicians and hospitals to code children as having substance exposure problems, even when they are detected.
Most children (77.8%) only had one specific substance-related diagnosis in their (or their mothers') Medicaid files, although the diagnosis could have appeared on multiple claims; 22.2% of the study cohort had multiple diagnoses related to substance abuse. Also of interest, only about 5.6% of the study cohort had any diagnoses related to alcohol abuse. This is believed to be an undercount due to an earlier reported limitation of the data base--California only provides for one diagnosis code for outpatient claims. Since a problem of alcohol abuse would often be reported only as a secondary diagnosis, it is believed that the study data significantly undercount the frequency of alcohol exposure problems. For example, Washington's Medicaid program estimated that one-quarter of substance-abusing pregnant women on Medicaid had problems with alcohol abuse (Cawthon, 1991).
| EXHIBIT 6. Proportion of Substance Exposed Children by ICD-9-CM Diagnosis Code and Source of Identification | |||||
| ICD-9-CM Code | Description of Diagnosis Code | % Total* (n=7,802) | % Identified in Mothers' Files* (n=5,528) | % Identified in Children's Files* (n=1,899) | % Identified in Both Files* (n=375) |
| 304.0-304.9 | Various types of drug dependence | 28.0% | 33.8% | 3.6% | 51.5% |
| 779.5 | Drug withdrawal syndrome in newborn | 26.5% | 21.6% | 32.8% | 67.5% |
| 305.2-305.9 | Various types of drug abuse | 16.0% | 20.0% | 4.5% | 15.5% |
| 760.7 | Noxious influences affecting fetus | 12.4% | 8.5% | 20.6% | 29.1% |
| 648.3 | Drug dependence in mother complicating pregnancy/childbirth | 12.2% | 16.0% | 0.1% | 17.9% |
| 965.0, 967.0-967.9, 969.0-969.9, 970.0-970.9 | Various types of non-accidental poisonings | 11.3% | 8.4% | 20.5% | 8.3% |
| 292.0-292.9 | Drug psychoses/withdrawal syndromes | 9.0% | 6.9% | 12.4% | 22.9% |
| 655.5 | Suspected damage to fetus from drugs | 3.4% | 4.6% | 0.1% | 2.4% |
| 303.0-303.9 | Acute alcoholic intoxication/dependence | 3.2% | 4.0% | 1.0% | 2.9% |
| E850-E858 | Accidental poisonings | 2.7% | 0.5% | 9.4% | 1.6% |
| 305.0 | Alcohol abuse | 2.5% | 3.2% | 0.7% | 1.3% |
| 655.4 | Suspected damage to fetus from other disease in mother (alcohol addiction) | 1.0% | 1.3% | 0.0% | 1.9% |
| * More than one substance related diagnosis was reported for 22.2% of the study cohort. Thus, these percentages do not add to 100% | |||||
Exhibit 7 also shows the extent to which certain questionable diagnoses were the only reported diagnosis for children in the study cohort; 2.4% of the study cohort were identified solely because of a reported accidental poisoning. Another 0.1% were identified solely due to an adverse drug effect. A final 8.9% were identified solely due to a non-accidental drug-related poisoning. A decision was made to include these codes in the identification of study children based on review and consultation with other researchers, with the realization that their inclusion was debatable. For example, diagnoses covering non-accidental drug-related poisonings (see Exhibit 6 for codes) were included because these codes were reportedly used (especially in the early 1980s) to identify substance exposure problems even when physicians realized the problem might not be due to a poisoning. At that time, there was greater reluctance to directly identify children as having substance exposure problems. As is reported later, sensitivity analyses were performed which omitted children with these diagnoses from the study cohort.
| EXHIBIT 7. Other Findings Related to Study Identification by Diagnosis Codes | |
| % Children by source of study identification | |
| 70.9% |
| 24.3% |
| 4.8% |
| 100.0% |
| % Children by number of different substance related diagnoses | |
| 77.8% |
| 16.2% |
| 4.7% |
| 1.3% |
| 100.0% |
| % Children with alcohol-related diagnoses | 5.6% |
| % Children whose only diagnosis was in questionable group | |
| 2.4% |
| 0.1% |
| 8.9% |
| 11.4% |
There were no major changes over the study period in the overall pattern of identification by diagnosis code (data not shown). However, there were noticeable increases in two areas. The proportion of children in the study cohort with the diagnosis of drug withdrawal syndrome in a newborn increased from 23.7% in 1986 to 28.7% in 1988. Similarly, the proportion of children with a diagnosis of noxious influences affecting the fetus increased from 10.6% to 14.3% over the same period. It is not clear whether this reflects an increase in the true incidence of these diagnoses, or a change in coding practices.
There was some debate about the exact time period to use in identifying delivering mothers who might have a substance abuse problem. Exhibit 8 below shows when the substance-related diagnoses occurred for the mothers of children in the study cohort; however, these data have to be used with caution since not all mothers were enrolled in Medi-Cal throughout the 24 months preceding birth and the 6 months after birth. Diagnoses were reported only in the 6 month period immediately following birth (post-pregnancy only) for 41.2% of the mothers identified as having substance-related problems. Thus, these mothers did not have any substance-related diagnoses in Medi-Cal claims in the two year period prior to birth. Another 26.8% of mothers reported a substance-related diagnosis only during the estimated period of pregnancy, which for study purposes was defined as the 9 months preceding birth. Still another 20.2% of mothers only had substance-related diagnoses during the period before pregnancy. Recall that the study selection criteria specified that mothers' files were searched for the 2 year period preceding birth for any substance-related codes. Mothers in the pre-pregnancy group only had substance-related diagnosis codes in the period of 24 months to 10 months preceding birth, i.e. the period prior to pregnancy. Diagnoses were reported in more than one time period for 11.9% of mothers. Sensitivity analyses were conducted to see whether there was any significant difference in study results related to the time period used for identifying substance-related diagnoses in the mothers' claims files. These are reported later.
| EXHIBIT 8. Timing of Substance Related Diagnoses Among Mothers of Study Cohort | |
| Time Period of Substance Related Diagnoses | Percent of Mothers |
| Pre-pregnancy only | 20.2% |
| Pregnancy only | 26.8% |
| Post-pregnancy only | 41.2% |
| Pre-pregnancy and pregnancy | 1.8% |
| Pre-pregnancy and post-pregnancy | 2.1% |
| Pregnancy and post-pregnancy | 7.1% |
| All three periods | 0.9% |
| Total | 100.0% |
Incidence of Substance Exposed Children in the Medicaid Population
The number of substance exposed infants enrolled in the California Medicaid program increased substantially over the three year study period as shown in Exhibit 9 below. The number of substance exposed infants identified from Medi-Cal data was 3,113 for those born in 1988, compared to 2,159 for those infants born in 1986. This represented an increase of 44.2%. The number of substance exposed infants enrolled in Medi-Cal was growing at a faster rate than the overall enrollment of children under age 1 in California's Medicaid program. From 1986 to 1988, the number of child enrollees under age 1 in Medi-Cal grow by only 8.8%.
| EXHIBIT 9. Incidence of Substance Exposed Children by Year of Birth Compared to Overall Enrollment of Children Under Age 1 in Medi-Cal by Year | ||||
| Number of Substance Exposed Children Identified in Medi-Cal by Year of Birth | Percent Increase in Study Cohort | Number of Medi-Cal Child Enrollees Under Age 1 by Year of Enrollment* | Percent Increase in Medi-Cal Children Under Age 1 | |
| 1986 | 2,159 | --- | 152,739 | --- |
| 1987 | 2,530 | 17.2% | 150,936 | (1.2%) |
| 1988 | 3,113 | 23.0% | 166,244 | 10.1% |
| Percent Increase 1986-1988 | 44.2% | 8.8% | ||
| * Adjustments have been made for exclusions related to children enrolled in capitated programs, but not for children with shared identification numbers. | ||||
Nevertheless, the proportion of Medi-Cal children who were identified as having substance exposure problems was smaller than expected. Generally, the study cohort only represented from 1.4% to 1.9% of overall Medi-Cal enrollment for children born in the period from 1986 to 1988. Other estimates of substance exposed children vary greatly. Study results are reasonably consistent with those of Washington State's Medicaid program. Using a similar methodology for identifying children with substance exposure problems, Washington found that only 2.7% of its deliveries from July to December, 1988 were to women with substance abuse problems (Cawthon, 1991). Recent research using the National Hospital Discharge Survey found a similarly low rate of substance affected newborns (Dicker and Leighton, 1991).3 However, testimony before the House Select Committee on Children, Youth and Families suggested that 10% of all Medi-Cal births in 1987 were substance exposed children (Halfon, 1989).
As discussed earlier, several aspects of the study methodology significantly constrain the identification of children included in the study. Thus, study results cannot be used to estimate with any certainty the true incidence of substance exposure in this population.
Personal Characteristics and Medicaid Enrollment Patterns
Very little personal characteristics information is included in Medicaid administrative data. As mentioned earlier, reliable information on race/ethnic group was not reported in California's MMIS system for the study period. (Data on race/ethnicity are reported later, based on the merger with the Vital Statistics file). Only the variables of sex and geographic location of residence were available with the Tape-to-Tape data. With both of these variables, little difference was seen between the study cohort and the control group. As shown in Exhibit 10, a slight majority of children in both the study cohort and the comparison group were male (51.7% and 50.9%, respectively). There were also similar proportions of children living in urban areas in both the study cohort and the comparison group (64.7% and 62.6%).
| EXHIBIT 10. Personal Characteristics and Enrollment Information on Study Cohort and Comparison Group | ||
| Study Cohort (n=7,802) | Control Group (n=15,814) | |
| % Male | 51.7% | 50.9% |
| % Urban county of residence | 64.7% | 62.6% |
| Medicaid eligibility group | ||
| 66.7% | 58.4% |
| 24.3% | 2.1% |
| 0.3% | 0.3% |
| 8.3% | 37.9% |
| Average length of Medicaid enrollment | ||
| 16.5 months | 12.6 months |
| 17.9 months | 13.0 months |
| 53.4% | 30.2% |
| 18.2 months | 13.4 months |
| 55.5% | 31.1% |
| 14.0 months | 11.4 months |
| Average age of infants' enrollment in Medicaid | 2.3 months | 3.1 months |
| 86.1% | 79.9% |
There were significant differences for the two groups in the distribution of children by Medicaid eligibility group.4 The most striking difference is the higher proportion of substance exposed children in foster care. Just over 24% of children in the study cohort were in foster care, compared to 2.1% in the control group. Other researchers have reported a high proportion of substance exposed children in foster cars. The General Accounting Office reported a foster care placement rate of 26% to 58% for drug exposed infants, compared to 1% to 2% for infants born to mothers with no indication of drug use, in a study it conducted at 4 urban hospitals (General Accounting Office, 1990). The Inspector General's Office reported foster care estimates of 30% to 50% for "crack babies" (Office of the Inspector General, 1990). Half of the foster care children in a foster care pediatric practice (in Oakland, California) were reported to be drug exposed (Halfon, 1989).
Another eligibility-related difference is the comparatively low proportion of medically needy children in the substance exposed group (8.3% compared to 37.9% for the control group). Previous research has documented the high proportion of newborns in California in the medically needy group. One study showed 42% of Medicaid deliveries in California in 1983 were to mothers qualifying under the medically needy eligibility provisions. This earlier study documented that many of these mothers only became enrolled in the last trimester of pregnancy, and almost one-quarter did not obtain coverage until the point of delivery (Howell and Ellwood, 1991). This pattern is consistent with study results for the comparison group.
Generally, children in the study cohort were enrolled in the Medicaid program for a considerably longer period of time over their first 2 years of life than children in the control group. Children in the study cohort born in 1986 and 1987 averaged about 18 months enrollment over a 24 month period, compared to 13 months for children in the control group. Children in the study cohort had their own Medi-Cal enrollment records slightly sooner after birth than children in the comparison group (age 2.3 months on average compared to age 3.1 months). Over half of 1986 and 1987 study cohort children were enrolled for 22-24 months, compared to only about 30% of the control group. Thus, substance exposed children showed a stronger attachment to the Medicaid program in their first 2 years of life than children in the control group.
Information on Mothers
As reported earlier, linkages were made to the mothers' files for 86.7% of the study cohort and 65.7% of the control group. Exhibit 11 presents data from the mothers' Medicaid records.
| EXHIBIT 11. Information on Mothers of Children in the Study Cohort and Comparison Group | ||
| Study Cohort (n=6,768) | Control Group (n=10,383) | |
| % Children linked to mothers' Medicaid files | 86.7% | 65.7% |
| Average age of mothers | 25.9 years | 23.7 years |
| 62.0% | 60.9% |
| 12.9% | 23.8% |
| Medicaid enrollment during pregnancy | ||
| 6.0 months | 3.8 months |
| 41.1% | 29.1% |
| 13.3% | 35.0% |
| Medicaid enrollment during 24 months prior to delivery | ||
| 26.2% | 14.2% |
| Mothers with >1 baby during 3 year study period | 7.2% | 5.8% |
Generally, the mothers of substance exposed children were older than mothers in the control group, and the study cohort mothers showed a much longer-term attachment to the Medicaid program prior to delivery. The average age of the mothers of substance exposed children was 25.9 years, compared to 23.7 years for mothers of the control group children. This result is similar to program data from Washington on substance abusing mothers (Cawthon, 1991) and data on "crack babies" from the Inspector General's Office (Office of the Inspector General, 1990). Almost 24% of the control group mothers were under 20 years of age, versus about 13% of mothers of the study cohort. The average length of Medicaid enrollment during pregnancy was 6 months for study cohort mothers, compared to 3.8 months for control group mothers. Only 13.3% of mothers of the study cohort had no enrollment during the estimated period of pregnancy, compared to 35% of the control group mothers. Finally, over one-quarter (26.2%) of study cohort mothers had been enrolled in Medicaid for the entire 2 years prior to delivery, compared to 14.2% of the control group mothers. Since most of these women qualified under the AFDC provisions of Medicaid (data not shown), they had to have other children in addition to the infants who were the focus of this study. This result suggests that there may be other children with potential substance exposure problems beyond those identified for this study.
Also important, over the three year study period from 1986 to 1988, 7.2% of the mothers in the study cohort had more than one baby delivered under Medicaid coverage, compared to 5.8% of mothers in the control group.
Medicaid Health Care Utilization Patterns
| EXHIBIT 12. Service Utilization Data for Children in Study Cohort and Control Group By Selected Time Periods | ||
| Study Cohort (n=7,802) | Control Group (n=15,814) | |
| Age Birth - 12 Months | ||
| % Hospital Users | 14.9% | 9.2% |
| 1.6 | 2.5 |
| 6.8 | 7.9 |
| % Intensive Care Users | 3.0% | 1.6% |
| % Physician/Ambulatory Visit Users | 86.6% | 74.9% |
| 10.2 | 8.4 |
| % EPSDT Users | 51.3% | 37.8% |
| 1.6 | 1.4 |
| Age 13-24 Months | ||
| % Hospital Users | 8.4% | 4.9% |
| 1.4 | 2.2 |
| 4.7 | 5.3 |
| % Intensive Care Users | 1.8% | 0.9% |
| % Physician/Ambulatory Visit Users | 83.4% | 7.9% |
| 7.0 | 6.5 |
| % EPSDT Users | 37.4% | 32.2% |
| 1.3 | 1.3 |
| Age Birth - 12 Months (Using Person Years of Enrollment - PYE) | ||
| % Hospital Users (PYE) | 16.1% | 11.0% |
| 1.9 | 3.3 |
| 8.0 | 10.2 |
| % Intensive Care Users (PYE) | 3.2% | 1.7% |
| % Physician/Ambulatory Visit Users (PYE) | 91.3% | 88.3% |
| 12.2 | 11.2 |
| % EPSDT Users (PYE) | 56.0% | 48.1% |
| 1.8 | 1.7 |
| Age 13 - 24 Months (Using Person Years of Enrollment - PYE) | ||
| % Hospital Users (PYE) | 9.8% | 5.7% |
| 1.7 | 2.9 |
| 5.6 | 6.8 |
| % Intensive Care Users (PYE) | 2.1% | 0.9% |
| % Physician/Ambulatory Visit Users (PYE) | 89.3% | 88.0% |
| 9.0 | 8.7 |
| % EPSDT Users (PYE) | 39.4% | 36.2% |
| 1.7 | 1.7 |
An important study question was whether or not substance exposed children had greater health care needs and thus higher rates of Medicaid utilization than other Medicaid children in the first two years of life. Generally, study data showed that substance exposed children were more likely to be inpatient hospital users in both the first and second years of life than other children on Medicaid. However, the number of discharges per child user and the average number of hospital days per child user were actually less for substance exposed children. Adjusting study data for length of enrollment only did not change this basic pattern.
Substance exposed children also had higher use rates for physician/ambulatory care services, and they averaged more visits per user than children in the control group. However, this difference was reduced in the first year of life and disappeared in the second year of life, using adjusted data.
Exhibit 12 presents the service utilization data from the study. In the first year of life, 14.9% of the study cohort children had inpatient hospital admissions, compared to 9.2% of the control group. However, the control group averaged more discharges per user--2.5 per user compared to 1.6 for the study group. Also, the control group hospital users averaged 7.9 days in the hospital, compared to 6.8 days for children in the study cohort. In the second year of life, the hospital user rate fell to 8.4% for the study cohort and 4.9% for the control group. The number of days per hospital user also dropped to 4.7 days per user for substance exposed children and 5.3 for control group children. Children in the study cohort had twice the rate of intensive care use as the control group for both time periods. In the first year of life, 3.0% of the substance exposed group reported intensive care use, compared to 1.6% of the control group. For the second year of life, the intensive care user rate dropped to 1.8% for the study group, compared to 0.9% for the control group.
| EXHIBIT 13. Distribution of Diagnoses for Inpatient Hospital Admissions Study Cohort and Comparison Group* | ||
| ICD-9-CM Diagnostic Categories | Distribution of Diagnoses for Inpatient Hospital Stays | |
| Study Cohort | Comparison Group | |
| Diseases of the Respiratory System | 36.6% | 37.2% |
| Injury and Poisoning | 13.1% | 6.4% |
| Diseases of the Digestive System | 9.7% | 10.1% |
| Symptoms, Signs and Ill-Defined Conditions | 9.7% | 8.1% |
| Infectious and Parasitic Diseases | 9.5% | 11.6% |
| Congenital Anomalies | 5.6% | 7.5% |
| Diseases of the Nervous System and Sense Organs | 4.7% | 5.3% |
| * Diagnostic categories which accounted for fewer than 5.0% of hospital stays are not presented. | ||
When adjustments were made for length of enrollment (using person years of enrollment as the denominator), the hospital user rate for substance exposed children was about 46% more in the first year of life and 72% more in the second year of life than the rate for the comparison group. However, children in the substance exposed group continued to have fewer discharges per user and fewer days of inpatient hospital services per user. This pattern occurred in both years. Exhibit 13 shows the distribution of diagnosis codes associated with the inpatient hospital stays for both groups. Generally, these data show that children in the study cohort were hospitalized for similar diagnoses as children in the control group, with one exception. Children in the study group were much more likely to be hospitalized for injuries and poisonings. Thus, the reasons for hospitalization of children in the study cohort were not markedly different from that of the comparison group, with the exception of injuries and poisonings.
Study data were compared to data from the National Center for Health Statistics on hospital utilization rates for children under age 1 in the general population, as shown in Exhibit 14. This comparison uses somewhat different measures of hospital use--the hospital discharge rate per 1,000 population and the average length of stay per discharge. Study data show that both the study and control group children had a significantly higher hospital discharge rate than children under age 1 in the general population, but a shorter average length of stay per discharge. The discharge rate per 1,000 population was 238.9 for the study cohort and 231 for the control group, compared to 196.1 to 200.6 for the general population from 1986 to 1988. The difference may be even greater than these data suggest. As reported earlier, many children do not have their own Medicaid identification numbers for several weeks after birth. During this period, any service utilization (and expenditures) they experience is reported on their mothers' Medicaid records. As a result, service utilization in the first year of life for both Medicaid groups is probably somewhat underreported.
| EXHIBIT 14. Comparison of Hospital Discharge Rate and Average Stay for Children Under Age 1 in General Population and Study Cohort and Comparison Group | ||
| Discharge Rate per 1,000 Population | Average Stay in Days | |
| General Population of Children 5 | ||
| 196.1 | 5.7 |
| 191.6 | 5.9 |
| 200.6 | 6.7 |
| Substance Exposed Study Cohort | 238.9 | 4.3 |
| Study Control Group | 231.0 | 3.1 |
Returning to Exhibit 12, the vast majority of children in both groups were users of physician/ambulatory services in both years of life. The substance exposed group showed a slightly higher user rate. With the adjusted data, 91.3% of the study group had physician/ambulatory visits during the first year, with an average of 12.2 visits per user. About 88.3% of control group children were physician/ambulatory users, with an average of 11.2 visits per user. In the second year of life, there was little difference in the physician/ambulatory user rate for either group, using the adjusted data. Both groups had an overall user rate of about 8889%, with an average of about 9 visits per user.
Neither group had a very high rate of EPSDT service use. With the adjusted data, 56.0% of the study cohort and 48.1% of the control group were EPSDT users in their first year. This rate dropped to 39.4% in the second year for the study cohort and 36.2% for the control. For the users of EPSDT services, the number of visits per user was virtually the same for both groups in both years--about 1.7 visits per user. California's own recornmended standard for screening visits in the first year of life is 6 visits and 2 visits in the second year. Thus, the first year users were substantially under the recommended number of visits, while the second year users were closer to the standard. Nevertheless, in both years a substantial number of children had no EPSDT service use. An earlier study by the American Academy of Pediatrics documented that many children in California receive Medicaid well-child care outside the EPSDT program (Yudkowsky and Fleming, 1990). As a result the proportion of EPSDT users reported in the study data may understate the number of children receiving routine preventive care services. Also, the problem of missing data for the first few weeks of life (until the child is assigned an individual Medicaid identification number) could affect this result. Finally, the overall physician/ambulatory utilization rates reported earlier for both the study cohort and the comparison group were quite high, suggesting both groups had a high degree of contact with outpatient health care providers.
Medicaid Expenditure Patterns6
The primary study objective was to determine whether or not substance exposed children are more costly to the Medicaid program than other Medicaid children. Generally, study data Indicate that substance exposed children are considerably more costly to the Medicaid program than other Medicaid children of the same age. However, much of this cost difference is attributable to longer average lengths of enrollment. Without an adjustment for length of enrollment, average expenditures per substance exposed child are about 47% greater than other Medicaid children in the first two years of life. With adjustments for enrollment, this difference is reduced to about 13%.
As shown in Exhibit 15, the average Medicaid expenditure per substance exposed child over the first two years of life was $2,285, compared to $1,551 for the control group. Thus, substance exposed children cost the State Medicaid program $734 more (47.3%) than children in the control group. Although study children had higher hospital expenditures than the control group, their expenditures for physician/ambulatory services, drugs and other services were proportionally even greater. As with most insured groups, a majority of children did not have expenditures nearly as great as the average. The median expenditure per child was $465 for the study group and $240 for the control group, a difference of almost 94%. The range of expenditures per child was greater for the control group, going from $0 to $503,726, compared to so to $312,227 for the study group.
The expenditure difference between substance exposed children and control group children decreased from the first to second year of life. Expenditures for substance exposed children were 40.1% more than the control group from birth through 12 months, and 22.2% more for 13 through 24 months.
| EXHIBIT 15. Medicaid Expenditure Data for Children in Study Cohort and Control Group By Selected Time Periods | ||||
| Study Cohort (n=7,802) | Control Group (n=15,814) | Difference | ||
| $ | % | |||
| Expenditure per child for study period | ||||
| $1,452 | $1,048 | $404 | 38.5% |
| 105 | 72 | 33 | 45.8% |
| 529 | 341 | 188 | 55.1% |
| 199 | 90 | 109 | 121.1% |
| 2,285 | 1,551 | 734 | 47.3% |
| Median expenditure per child for study period | $465 | $240 | $225 | 93.8% |
| Range - expenditure per child for study period | 0-$312,227 | 0-$503,726 | --- | --- |
| Total expenditure per child by age | ||||
| $1,646 | $1,175 | $471 | 40.1% |
| 820 | 671 | 149 | 22.2% |
| Hospital Expenditure per child by age | ||||
| 1,115 | 836 | 279 | 33.4% |
| 440 | 393 | 47 | 12.0% |
| Expenditure per child person year of enrollment for study period* | ||||
| $1,058 | $995 | $63 | 6.3% |
| 76 | 68 | 8 | 11.8% |
| 386 | 324 | 62 | 19.1% |
| 145 | 85 | 60 | 70.6% |
| 1,664 | 1,472 | 192 | 13.0% |
| Total expenditure per child person year of enrollment by age | ||||
| $2,085 | $1,830 | $255 | 13.9% |
| 1,126 | 993 | 133 | 13.4% |
| * Since the study period encompassed the first two years of life, these numbers should be multiplied by 2 to be directly comparable to the expenditure per child for the study period shown in the first rows of data in this exhibit. | ||||
With adjustments for length of enrollment, the total Medicaid expenditure per child person year of enrollment was $1,664 over the entire study period, compared to $1,472 for the control group. This would amount to a difference of only $192 per year, or 13%. For a two-year period, this amount would be $384, instead of the $734 reported earlier (without the person year adjustment). Of interest, with the length of enrollment adjustment, the percent difference between the study and control group expenditures was constant between the first and second years of life. In both periods, the percent difference was about 13%.
Exhibit 16 shows two types of additional Medicaid expenditure charges per child--EPSDT expenditures and delivery expenditures. As mentioned earlier, EPSOT expenditures were reported separately because they were not complete for 1986, although they were complete for 1987 through 1989. Delivery expenditures were reported separately because in some instances they came from the children's Medicaid records, although in most instances they were extracted from the mothers' Medicaid records. Further, delivery expenditures were not available for all children since they were not all covered by Medicaid at birth.
| EXHIBIT 16. EPSDT and Delivery Expenditure Data for Study Cohort and Control Group | |||
| Study Cohort (n=7,802) | Control Group (n=15,814) | % Difference | |
| EPSDT expenditure per child over study period | $126 | $93 | 35.5% |
| EPSDT expenditure per child person year of enrollment* | 92 | 89 | 3.4% |
| % Children with delivery expenditures | 88.1% | 67.4% | --- |
| $3,925 | $4,406 | (10.9%) |
| * To be directly comparable to the data in the first row, this expenditure number should be multipled by 2, since the study period encompassed the first two years of life. | |||
Over the study period, the average Medicaid expenditure for EPSDT services was $126 per child in the study cohort, compared to $93 per child in the comparison group. With adjustments for length of enrollment, the EPSDT expenditure was $92 per person year of enrollment for substance exposed children and $89 for control group children. Thus, substance exposed children had 35.5% greater EPSDT expenditures per child over the study period. This difference was reduced to 3.4% with adjustments for length of enrollment.
The one area in which expenditures were less for substance exposed children than other Medicaid children was delivery expenditures. For those child average expenditure was $3,925 for the study cohort, compared to $4,406 for children in the control group. The average delivery expenditure per substance exposed child was 10.9% less than other Medicaid children. This probably occurs because of the high proportion of medically needy deliveries in the control group. As discussed earlier, many mothers qualifying under the medically needy provisions only become enrolled in Medicaid at the point of delivery and thus they may not have received any prenatal care. This could contribute to higher delivery costs.
Sensitivity Analyses
As discussed earlier, there was concern that some methodological decisions might skew the study results; therefore, sensitivity analyses were undertaken to determine the impact of alternative approaches to selecting the study cohort and comparison group. The results of these analyses are shown in Exhibit 17 which shows what the average expenditure levels per child would have been with alternative definitions.
As reported earlier, 11.4% of the study cohort were selected solely due to an accidents poisoning, adverse drug effect, or other type of drug poisoning. If these children were excluded from the study cohort, the average expenditure per child would have been $2,139 for the study period, or $1,580 per child person year of enrollment. As it turned out, study children who were selected solely due to a poisoning-related diagnosis had greater Medicaid expenditures per child on average. As a result, excluding them from the study cohort reduced the difference between substance exposed children and children in the control group to 37.9% per child over the study period, or 7.3% per person year of enrollment. Nevertheless, substance exposed children would have continued to be more expensive to the Medicaid program than children in the control group.
The next three analyses alter the time period during which the Medicaid records of mothers who delivered in 1986, 1987 and 1988 were reviewed to search for substance related diagnoses. First, children were excluded from the study cohort if their only substance related diagnosis came from their mothers' Medicaid record in the period prior to pregnancy. The second analysis excluded those children whose only diagnosis came from their mothers' post-pregnancy records. The third analysis combined the first two and only includes children whose mothers had substance related diagnoses during pregnancy and children identified with diagnoses in their own records. In all three instances, the effect was to increase the average expenditure per substance exposed child over the study period and by person year of enrollment. This occurred because children who were identified due to substance related diagnoses in their mothers' Medicaid records generally cost less to the Medicaid program than children identified through direct substance related diagnoses in their own Medicaid records. If the study cohort excluded children selected only due to diagnoses in their mothers' Medicaid files either pre or post pregnancy, the average Medicaid expenditure per child in the study cohort would have been 69.1% greater than that of children in the comparison group aver the study period (instead of 47.3%). With adjustments for length of enrollment, this difference would have been 28.1% (instead of 13.0%). Thus, if the study cohort had only been limited to children who had their own direct substance-related diagnoses and children whose mothers had substance-related diagnoses during pregnancy, there would have been an even greater discrepancy between the expenditures levels for the study cohort and the control group.
| EXHIBIT 17. Sensitivity Analysis: Medicaid Expenditure Data for Children in Study Cohort and Control Group | |||
| Study Cohort | Control Group | % Difference | |
| Original study cohort and comparison group (Study cohort=7,802 and comparison group=15,814) | |||
| Medicaid expenditure per child for study period | $2,285 | $1,551 | 47.3% |
| Medicaid expenditure per child person year of enrollment* | 1,664 | 1,472 | 13.0% |
| 1. Excluding children from study cohort whose only diagnosis was poison-related (Study cohort=6,880) | |||
| Medicaid expenditure per child for study period | $2,139 | $1,551 | 37.9% |
| Medicaid expenditure per child person year of enrollment* | 1,580 | 1,472 | 7.3% |
| 2. Excluding children from study cohort whose only diagnosis was from mothers' records pre-pregnancy (Study cohort=6,687) | |||
| Medicaid expenditure per child for study period | $2,355 | $1,551 | 51.8% |
| Medicaid expenditure per child person year of enrollment* | 1,724 | 1,472 | 17.1% |
| 3. Excluding children from study cohort whose only diagnosis was from mothers' records post-pregnancy (Study cohort=5,524) | |||
| Medicaid expenditure per child for study period | $2,470 | $1,551 | 59.3% |
| Medicaid expenditure per child person year of enrollment* | 1,770 | 1,472 | 20.2% |
| 4. Excluding children from study cohort whose only diagnosis was from mothers' records pre-pregnancy and post-pregnancy (Study cohort=4,409) | |||
| Medicaid expenditure per child for study period | $2,623 | $1,551 | 69.1% |
| Medicaid expenditure per child person year of enrollment* | 1,886 | 1,472 | 28.1% |
| 5. Excluding children from study cohort and comparison group whose eligibility group was medically needy (Study cohort=7,153 and comparison group=9,819) | |||
| Medicaid expenditure per child for study period | $2,289 | $1,843 | 24.2% |
| Medicaid expenditure per child person year of enrollment* | 1,607 | 1,361 | 18.1% |
| * To be directly comparable to data in the row above, this expenditure number should be multiplied by 2 since the study period encompassed the first two years of life. | |||
The final area of sensitivity analysis involved excluding children whose Medicaid eligibility group was medically needy from both the study cohort and comparison groups. This analysis was undertaken because previous research has shown that medically needy children have very different Medicaid expenditure patterns than other groups of Medicaid children. In particular, medically needy children tend to have shorter average lengths of enrollment and considerably greater average Medicaid expenditures per person year of enrollment, primarily due to a much higher hospital user rate (Rymer and Adler, 1987). The sensitivity results suggest that this same pattern is in the study data for medically needy children. If they are excluded from both the study cohort and the comparison group, the difference between the average expenditure per child in the study cohort and the control group is reduced to 24.2%, instead of 47.3%. However, with adjustments for length of enrollment, the difference increases to 18.1%, instead of 13.0%.
In conclusion, with all the sensitivity analyses the direction of the difference between substance exposed children and the control group of children with regard to Medicaid expenditures was not changed. That is, substance exposed children continued to be more expensive to the Medicaid program, regardless of the methodological approach. On the other hand, the magnitude of the difference was affected. In some instances, such as reducing the number of children in the study cohort identified through their mothers' claims, the expenditure differences were increased. In other instances, such as excluding children from the study cohort due to poisoning-related diagnoses, the expenditure differences were reduced. With all the analyses, the actual dollar amounts involved in either direction were not substantial.
SUBGROUP ANALYSES OF SUBSTANCE EXPOSED COHORT
Self-Identified Children Versus Mother-Identified Children
It was expected that the majority of children in the study cohort would be identified for inclusion in the study through indications in their mothers' records of substance abuse problems. Other researchers have reported that clinicians may be reluctant to "label" children as having substance exposure problems. It is also difficult for clinicians to diagnose children as having substance exposure problems without deliberate testing. For example, one study found that screens of newborns (using medical histories and urine toxicology) increased the identification rate of substance exposed neonates by three to five times (Chasnoff, 1989, as reported by the General Accounting Office, 1990).
As presented earlier, 70.9% of the study cohort were identified through diagnoses in their mothers' fides, 24.3% through diagnoses in their own files, and 4.8% had diagnoses in both files. Exhibit 18 presents selected data comparing the subgroups of substance exposed children identified through their own files, and those identified through their mothers' files. In the discussion which follows, these are referred to as self-identified and mother-identified children. Exhibit 18 also includes study data on children identified as substance exposed both in their own files and in their mothers' files. Since this third group is quite small (n=375), their data are presented for information purposes only and not discussed.
Generally, study results showed that self-identified children had substantially greater health care utilization and expenditures than substance exposed children identified solely through their mothers' files. For the first year of life, self-identified children had Medicaid expenditures of $2,576, compared to $1,319 for mother-identified children. For the second year of life, self-identified children had expenditures of $1,309, compared to $658 for the subgroup identified through mothers' records. In both years, the expenditures of self-identified children were over 95% greater than the expenditures of the mother-identified group. This relationship was not changed very much by the person year adjustment. Service utilization data showed self-identified children had a much higher hospital user rate in both years. Although the user rate for ambulatory/physician services was similar between the two groups, self-identified children averaged more visits per user (13.5 versus 8.8 for mother-identified children in year one, and 8.8 versus 6.3 in year two).
Also important, 45% of the self-identified children were in the foster care eligibility group, compared to only 15.2% of the children in the group identified through their mothers' records. Over three-quarters of mother-identified children were in the AFDC cash assistance group, while only 44.1 % of self-identified children were on AFDC cash assistance. The mothers of self-identified children also had less of an attachment to the Medicaid program. The average length of Medicaid enrollment for the mothers in the 24 months prior to delivery was 12.7 months for the self-identified group, compared to 16.1 months for the mother-identified group.
| EXHIBIT 18. Selected Data Comparing Substance Exposed Children by Source of Study Identification | |||
| Source of Identification for Study Cohort | |||
| Diagnoses in Children's Files (n=1,899) | Diagnoses in Mothers' Files (n=5,528) | Diagnoses in Both Files (n=375) | |
| % Male | 53.9% | 51.0% | 50.9% |
| % Urban | 65.7% | 64.2% | 66.1% |
| Medicaid eligibility group | |||
| 44.1% | 76.0% | 43.2% |
| 45.0% | 15.2% | 54.4% |
| 0.6% | 0.1% | 0.3% |
| 9.6% | 8.3% | 1.9% |
| Average length of enrollment over study period | 16.5 months | 16.3 months | 17.9 months |
| % Children linked to mothers' Medicaid files | 45.6% | 100.0%* | 100.0%* |
| 24.6 years | 25.9 years | 28.0 years |
| 12.7 months | 16.1 months | 13.6 months |
| Service utilization age birth-12 months | |||
| 21.8% | 12.5% | 16.1% |
| 1.8 | 1.5 | 1.5 |
| 7.3 | 6.5 | 7.8 |
| 85.6% | 86.1% | 97.8% |
| 13.5 | 8.8 | 13.1 |
| Service utilization age 13-24 months | |||
| 16.1% | 5.9% | 8.0% |
| 1.4 | 1.4 | 1.6 |
| 4.1 | 5.3 | 4.7 |
| 87.8% | 81.5% | 88.3% |
| 8.8 | 6.3 | 7.5 |
| Medicaid expenditure per child by age | |||
| $2,576 | $1,319 | $1,781 |
| 1,309 | 658 | 758 |
| Medicaid expenditure per child person year of enrollment by age | |||
| 3,299 | 1,675 | 2,071 |
| 1,728 | 918 | 1,019 |
| Median expenditure per child for study period | $770 | $381 | $749 |
| * By definition, all children identified by diagnoses in their mothers' files had linked records. | |||
Foster Care Children Versus Non-Foster Care Children
Many States have reported significant increases in their foster care caseloads in recent years. Many have attributed part of this growth to the increasing numbers of substance exposed infants. Indeed, as reported earlier, foster care children were found to constitute a significant proportion of the substance exposed group. Almost one-quarter of the children in the study cohort were in foster care. Given the importance of this group, a separate analysis of foster care children in the study cohort was undertaken. Exhibit 19 presents data comparing the sub-group of foster care children to children not in foster care among substance exposed children.
Study data showed that the number of substance exposed children in foster care grew at a faster rate than the number of substance exposed children in other Medicaid eligibility groups. From 1986 to 1988, the number of substance exposed children in foster care increased by 54.2%, compared to a growth rate of 41.1 % for other substance exposed children. Other Tape-to-Tape data (not shown) indicated that the number of children under age 1 in California's foster care program was 3,585 in 1986, 3,494 in 1987 and 4,724 in 1988 (excluding children in capitated programs). There was no growth in the number of children under age 1 in foster care from 1986 to 1987, but in 1988 enrollment increased by 31.8% relative to 1986. Thus, substance exposed infants in foster care were growing at an even faster rate than the overall population of infants in foster care. Also, over this three year time period, substance exposed infants using the study's limited methodology appear to have constituted about 16.5% of California's foster care enrollees under age 1.
Foster care children in the study cohort were more likely to be self-identified than other cohort children. Over half of the foster care subgroup (55.6%) had diagnoses related to substance exposure in their own Medicaid records, compared to only 20.6% of non-foster care children.
Linkages were made to the mothers' delivery records for 68% of the foster care subgroup children, compared to 92.8% of the non-foster care subgroup. Thus, two-thirds of substance exposed children in foster care were born to mothers on Medicaid.
Children in the foster care subgroup differed from other children with regard to their residence. Some 72.6% of foster care children were classified as living in urban areas, compared to 62.1% for other substance exposed children.
Previous research has shown that the general population of foster care children on Medicaid has substantially greater utilization and expenditures than other Medicaid children (Rymer and Adler, 1987). This is hypothesized to occur because the situations of neglect and abuse from which they come have negative impacts on their health status. Another factor may be that foster parents are more likely to seek medical treatment for their charges, simply as part of their routine responsibilities as foster parents.
| EXHIBIT 19. Selected Data Comparing Foster Care Children to Non-Foster Care Children in the Substance Exposed Group | ||
| Foster Care (n=1,898) | Non-Foster Care (n=5,904) | |
| % Population growth 1986-1988 | 54.2% | 41.1% |
| Source of study identification | ||
| 44.3% | 79.4% |
| 45.0% | 17.7% |
| 10.6% | 2.9% |
| % Male | 53.1% | 51.3% |
| % Urban | 72.6% | 62.1% |
| Average length of enrollment over study period | ||
| % Children linked to mothers' Medicaid files | 68.0% | 92.8% |
| 26.9 years | 25.6 years |
| 14.6 months | 15.8 months |
| Service utilization age birth-12 months | ||
| 19.0% | 13.6% |
| 1.7 | 1.6 |
| 7.0 | 6.8 |
| 87.9% | 86.1% |
| 12.4 | 9.4 |
| Service utilization age 13-24 months | ||
| 8.3% | 8.5% |
| 1.5 | 1.4 |
| 5.5 | 4.5 |
| 86.7% | 82.3% |
| 7.6 | 6.8 |
| Medicaid expenditure per child by age | ||
| $2,319 | $1,428 |
| 958 | 777 |
| Medicaid expenditure per child person year of enrollment by age | ||
| 2,962 | 1,804 |
| 1,303 | 1,071 |
| Median expenditure per child for study period | $620 | $425 |
Other researchers have also reported that substance exposed foster care children have greater Medicaid utilization and expenditures than substance exposed children not in foster care (Walker, Zangrillo, and Smith, 1991). Study results confirmed this pattern. In the first year of life, the Medicaid expenditures of children in the foster care subgroup exceeded those of other children by about 62%. However, this difference dropped to just over 23% in the second year of life. This relationship was not changed by adjustments for length of enrollment. Utilization of inpatient hospital care and outpatient care (as measured by visits per user) were substantially higher for the foster care group during the first year, while such differences were only slight in the second year.
Children with Continuous Versus Non-Continuous Medicaid Enrollment
In the general population of Medicaid children, there are sometimes substantial differences in the utilization and expenditure patterns of children who are enrolled in the program for only a short time, compared to those with continuous, long-term enrollment. Generally, children whose Medicaid enrollment is continuous and long-term have higher average Medicaid expenditures. However, when their expenditures are adjusted for length of enrollment, their average expenditures per person year of enrollment are lower than the expenditures of children with shorter lengths of enrollment. This occurs because they are more likely to have some months of low utilization or no utilization than children who are enrolled in Medicaid for a brief period of time. Sometimes children are enrolled in Medicaid for a short period of time simply to be eligible for Medicaid coverage of substantial health care costs. In fact, hospitals have obvious incentives to make certain otherwise uninsured children are eligible for Medicaid coverage during their hospital stays.
Thus, there was interest in comparing the utilization and expenditure patterns of children with continuous, long-term Medicaid enrollment among the substance exposed population to those with non-continuous, short-term enrollment. For study purposes, the continuous group was defined as children who had their own Medicaid records by age three months and remained continuously enrolled in Medicaid (without interruption) over the study observation period, i.e. through age 24 months. The parameters were relaxed for those children born in 1988 so that they only had to have continuous enrollment through December 1989. Exhibit 20 presents the study data of relevance.
Study results confirmed the expected pattern. Although the Medicaid expenditure per child for the continuously enrolled group was substantially higher than that of the non-continuously enrolled group, this difference completely disappeared when adjustments were made for length of enrollment. In fact, the non-continuously enrolled group were slightly more expensive to the Medicaid program using person years of enrollment as the denominator. For the first year of life, continuously enrolled children had expenditures of $1,998, compared to $1,294 for the non-continuous subgroup, a difference of 54.4%. For the second year of life, the expenditure rates were $878 compared to $736, a difference of 19.3%. However, with the length of enrollment adjustment, continuously enrolled children in the substance exposed group actually cost 4.0% less to Medicaid than the non-continuously enrolled group for the first year of life and 5.8% less for the second year of life.
Other characteristics of the continuously enrolled group included:
-
They were somewhat less likely to reside in urban areas (61.2% for the continuously enrolled group compared to 68% for the non-continuous group).
-
Their mothers had a stronger attachment to the Medicaid program. Their mothers' average length of Medicaid enrollment was 16.5 months during the 24 months prior to delivery, compared to 14.5 months for the. non-continuously enrolled group. Also, 35.2% of their mothers had been enrolled the entire 24 months prior to delivery, compared to only 25.3% of the mothers of the non-continuously enrolled group (data not shown).
High Cost Children Versus Other Children
| EXHIBIT 20. Selected Data Comparing Continuously Enrolled Children to Non-Continuously Enrolled Children in the Substance Exposed Group | ||
| Continuously Enrolled (n=3,811) | Non-Continuously Enrolled (n=3,991) | |
| % Male | 51.5% | 51.9% |
| % Urban | 61.2% | 68.0% |
| Medicaid eligibility group | ||
| 69.9% | 63.6% |
| 27.2% | 21.6% |
| 0.3% | 0.2% |
| 2.3% | 14.1% |
| % Children linked to mothers' Medicaid files | 89.0% | 85.0% |
| 26.2 years | 25.5 years |
| 16.5 months | 14.5 months |
| Service utilization age birth-12 months | ||
| 17.8% | 13.5% |
| 1.7 | 2.2 |
| 7.3 | 9.6 |
| 94.7% | 85.9% |
| 12.1 | 12.4 |
| Service utilization age 13-24 months | ||
| 10.0% | 9.3% |
| 1.7 | 1.8 |
| 5.6 | 5.5 |
| 91.8% | 84.7% |
| 9.3 | 8.4 |
| Medicaid expenditure per child by age | ||
| $1,998 | $1,294 |
| 878 | 736 |
| Medicaid expenditure per child person year of enrollment by age | ||
| 2,063 | 2,120 |
| 1,104 | 1,166 |
| Median expenditure per child for study period | $677 | $278 |
In both the general population and the Medicaid population, relatively few people account for the majority of health care utilization and expenditures. For example, Tape-to-Tape data in 1984 showed 10% of Medicaid child enrollees in California accounted for over 75% of child Medicaid expenditures that year (unpublished Tape-to-Tape data).
It was hypothesized that a similar pattern would be found with the study cohort. To test this hypothesis, a high cost subgroup was defined as the 10% of children in the study cohort with the highest expenditures per child. Exhibit 21 is a Lorenz Curve showing the distribution of the study cohort by level of expenditures over the study period. In this graph, the percent of total enrollees in the study cohort is the horizontal axis, and the cumulative percent of total expenditures for the study cohort is the vertical axis. Over the study period of 1986 through 1988, the 7,802 children in the study cohort accounted for $17,829,745 in adjusted Medicaid expenditures. The 45° line shows the hypothetical distribution under the assumption that all enrollees had equal expenditures for the study period. The curve, the actual distribution, shows that expenditures were unevenly distributed across the population of substance exposed children. For example, had expenditures been evenly distributed, 90% of enrollees would have accounted for 90% of expenditures. In actuality, 90% of enrollees accounted for only 27.3% of expenditures, while expenditures for the top 10% of enrollees were $12,955,754 or 72.7% of total expenditures over the study period. At the 90th percentile, the expenditure per child was $4,200, and the highest expenditure among the study cohort reached $312,227.
| EXHIBIT 21. Distributional Analysis of Medicaid Expenditures for Substance Exposed Cohort |
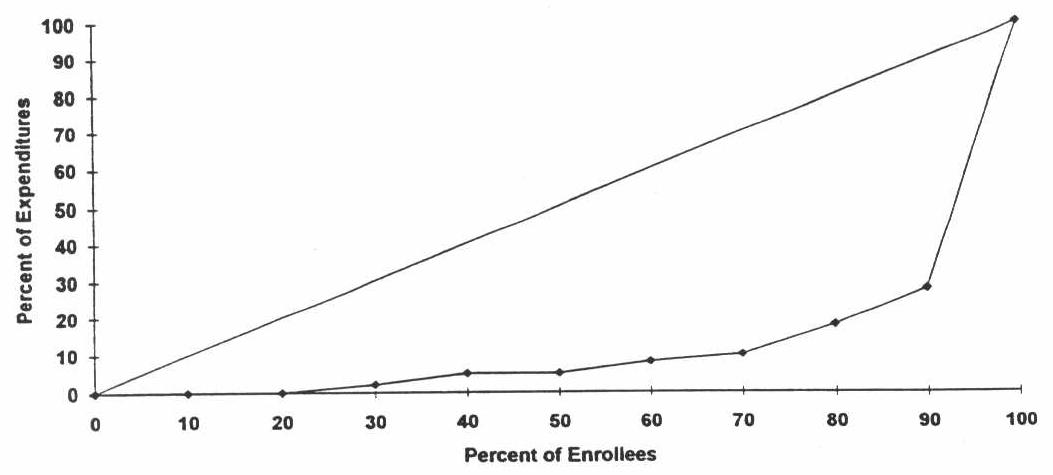 |
Thus, the cohort of substance exposed children exhibited a similar distribution with regard to expenditures to that seen previously with Medicaid children. This distribution is also seen in most insured groups. As reported earlier, the median expenditure per child in the study cohort was only $465, compared to an average expenditure level of $2,285 over the study period. This underscores the fact that most children in the substance exposed group did not have unusually high expenditures. Instead, a small group of children accounted for most of the expenditures.
Exhibit 22 presents study data comparing the so-called high cost group of 780 children who accounted for 73% of the total expenditures to other children in the study cohort. With regard to personal characteristics and enrollment patterns, there were three areas of difference for the high cost group:
-
The high cost group had a greater proportion of males--58% compared to 51 % among other substance exposed children.
-
The high cost group had a greater proportion of children in foster care (32.3% compared to 23.5%) and SSI cash assistance (2.4% compared to 0.1 %), and a lower proportion on AFDC cash assistance (58.3% compared to 67.6%).
-
Children in the high cost group had a longer average length of Medicaid enrollment over the study period--19.0 months compared to 16.2 for other children.
Not surprisingly, high cost children had considerably greater utilization rates in both years of life, particularly for inpatient hospital care. The average expenditure for high cost children was $12,262 in the first year of life and $4,853 in the second year. This was about 27 times the expenditure rate of other substance exposed children from birth to 12 months, and 15 times for 13-24 months. Because there were differences in the average length of Medicaid enrollment for the two groups, this difference was reduced slightly, when the expenditure rate was calculated using person years of enrollment.
| EXHIBIT 22. Selected Data Comparing High Cost Children* to Other Children in the Substance Exposed Group | ||
| High Cost Children (n=780) | Other Children (n=7,022) | |
| % Male | 58.0% | 51.0% |
| % Urban | 65.8% | 64.5% |
| Medicaid eligibility group | ||
| 58.3% | 67.6% |
| 32.3% | 23.5% |
| 2.4% | 0.1% |
| 6.9% | 8.5% |
| Average length of enrollment over study period | 19.0 months | 16.2 months |
| % Children linked to mothers' Medicaid files | 82.6% | 87.2% |
| 26.1 years | 25.8 years |
| 16.3 months | 15.5 months |
| Service utilization age birth-12 months | ||
| 81.0% | 7.4% |
| 2.0 | 1.1 |
| 10.2 | 2.7 |
| 94.3% | 85.7% |
| 32.3 | 7.4 |
| Service utilization age 13-24 months | ||
| 39.5% | 4.5% |
| 1.8 | 1.1 |
| 7.1 | 2.0 |
| 92.9% | 82.2% |
| 14.8 | 5.9 |
| Medicaid expenditure per child by age | ||
| $12,262 | $448 |
| 4,853 | 315 |
| Medicaid expenditure per child person year of enrollment by age | ||
| 13,973 | 575 |
| 6,227 | 436 |
| Median expenditure per child for study period | $7,835 | $393 |
| * High cost children were defined as the 10% of the study cohort with the highest individual expenditures. The expenditure range per child for the high cost group was from $4,200 to $312,227 during the study period. | ||
An analysis at the children in the comparison group showed a similar distribution. As expected, the data showed that a minority of children in the comparison group accounted for the vast majority of expenditures. Specifically, 90% of child enrollees in the comparison group accounted for only 20.7% of expenditures, while expenditures for the top 10% of enrollees were 79.3% of total expenditures. Exhibit 23 presents selected study data for the high cost children in the comparison group. Generally, the high cost children in the comparison group showed similar patterns to the high cost children in the substance exposed group. For example, there was a greater proportion of males In the high cost group; they had a longer average length of enrollment over the study period; and there was a greater proportion of high cost children in foster care and SSI cash assistance.
MERGER WITH CALIFORNIA VITAL STATISTICS DATA
The California Vital Statistics Data contain information on a number of variables not available in the Tape-to-Tape data, including: birth outcomes, receipt of prenatal care, race/ethnicity and marital status of the mother, previous pregnancy history, and complications in pregnancy and delivery. Strong relationships have been documented in the literature between (1) substance exposure and low birth weight, and (2) low birth weight and Medicaid expenditures. The Tape-to-Tape data were merged with the California Vital Statistics data for 1986, 1987, and 1988 to enable the examination of these relationships for the study and control groups.
As described earlier, the merged file included 6,018 children in the substance exposed cohort and 12,231 children in the comparison group. Approximately 77% of the original Tape-to-Tape children in both the study and comparison groups were successfully matched with the California Vital Statistics data. A first step was to insure that this new merged file was representative of the original study cohort and comparison groups. Next, descriptive analyses of the new variables available from the Vital Statistics file (race and marital status of the mother, pregnancy history, and birth outcomes) were undertaken for the study cohort and comparison groups, and further examined by birth weight category. Finally, multivariate analyses of low birth weight and Medicaid expenditures were carried out. The objective of the multivariate analyses was to examine whether substance exposure had both indirect effects on Medicaid expenditures (through the risk of low birth weight outcomes) and direct effects on expenditures, after controlling for low birth weight and other factors.
Exhibit 24 presents some of the tabulations shown earlier for the Tape-to-Tape data, using the merged data set. Generally, these tabulations indicate the characteristics of the merged file are consistent with the original study cohort and comparison group. The distributions of the eligibility groups are very similar to those of the original Tape-to-Tape file, as are average adjusted Medicaid expenditures per child, the average age of the mothers, percentage of mothers living in an urban county, and the percentage of male children. Moreover, the study cohort and control group sample sizes are similar in proportion to the original Tape-to-Tape file.
| EXHIBIT 23. Selected Data Comparing High Cost Children* to Other Children in the Comparison Group | ||
| High Cost Children (n=1,581) | Other Children (n=14,233) | |
| % Male | 56.8% | 50.3% |
| % Urban | 60.9% | 62.8% |
| Medicaid eligibility group | ||
| 63.4% | 57.8% |
| 3.4% | 2.0% |
| 1.4% | 0.1% |
| 31.1% | 38.7% |
| Average length of enrollment over study period | 16.5 months | 12.2 months |
| % Children linked to mothers' Medicaid files | 69.5% | 65.2% |
| 23.6 years | 23.8 years |
| 13.8 months | 11.5 months |
| Service utilization age birth-12 months | ||
| 79.0% | 1.1% |
| 2.6 | 1.8 |
| 8.5 | 2.7 |
| 94.6% | 72.6% |
| 21.8 | 6.4 |
| Service utilization age 13-24 months | ||
| 35.6% | 0.6% |
| 2.3 | 1.7 |
| 5.6 | 2.5 |
| 91.4% | 77.3% |
| 11.0 | 5.8 |
| Medicaid expenditure per child by age | ||
| $9,283 | $232 |
| 3,912 | 217 |
| Medicaid expenditure per child person year of enrollment by age | ||
| 11,780 | 370 |
| 5,306 | 325 |
| Median expenditure per child for study period | $6,270 | $188 |
| * High cost children were defined as the 10% of the study cohort with the highest individual expenditures. The expenditure range per child for the high cost group was from $3,764 to $503,726 during the study period. | ||
| EXHIBIT 24. Distributions of Selected Variables for the Merged California Tape-to-Tape and Vital Statistics File | ||||
| Study Cohort | Control Group | |||
| Merged File (n=6,018) | Tape-to-Tape (n=7,802) | Merged File (n=12,231) | Tape-to-Tape (n=15,814) | |
| Medicaid eligibility group | ||||
| 71.5% | 66.7% | 61.1% | 58.4% |
| 20.0% | 24.3% | 1.7% | 2.1% |
| 0.2% | 0.3% | 0.2% | 0.3% |
| 7.8% | 8.3% | 36.0% | 37.9% |
| % Male | 50.8% | 51.7% | 50.2% | 50.9% |
| % Urban | 63.6% | 64.7% | 61.7% | 62.6% |
| Average expenditure per child | ||||
| $1,318 | $1,452 | $1,050 | $1,048 |
| 106 | 105 | 78 | 72 |
| 515 | 529 | 358 | 341 |
| 185 | 199 | 86 | 90 |
| 2,124 | 2,285 | 1,572 | 1,551 |
| Average age of mothers | 25.7 years | 25.9 years | 24.0 years | 23.7 years |
Study Cohort/Control Group Comparisons
Exhibit 25 reports the study cohort and control group distributions of selected explanatory variables available from the merged data file. Substantial differences in the race/ethnicity distributions of the study cohort and control groups are evident. Mothers of infants in the study cohort were much more likely to be Black than mothers of infants in the control group; the converse was true for mothers of Hispanic origin. Thirty percent of the study cohort mothers were Black--twice the percentage for the control group. Twenty-seven percent of the mothers in the study group were of Hispanic origin compared to 41.5% of the mothers in the control group. A much higher percent of the study cohort was unmarried (74.6% compared to 52.9%).7
Exhibit 25 also presents the distributions of several variables measuring pregnancy histories and birth outcomes. Mothers in the study cohort were much more likely to have had previous pregnancy terminations8 or pregnancy complications than mothers in the control group. In addition, more than 74% of the mothers in the study cohort had previously given birth, compared to about 60% of the control group.
The most significant findings in Exhibit 25, however, pertain to premature birth and low birth weight. Over 19% of the substance exposed children were premature (or very premature) versus 12.4% of the control group infants.9 Moreover, these figures probably underestimate the actual incidence of premature births because gestational age was not computed for 7.9% of the study cohort and 5.5% of the control group.10
| EXHIBIT 25. Distributions of Selected Explanatory Variables for Study Cohort and Control Group | ||
| Study Cohort (n=6,018) | Control Group (n=12,231) | |
| Race/ethnicity of mother | ||
| 39.2% | 33.1% |
| 30.1% | 15.0% |
| 26.8% | 41.5% |
| 3.5% | 10.2% |
| % Unmarried | 74.6% | 52.9% |
| Previous pregnancy termination | ||
| 24.1% | 15.4% |
| 4.3% | 2.0% |
| Complications with pregnancy | ||
| 78.1% | 86.4% |
| 18.5% | 11.8% |
| 3.1% | 1.2% |
| Complications with delivery | ||
| 81.5% | 82.6% |
| 16.2% | 14.5% |
| 2.0% | 2.3% |
| Previous live births (now living) | ||
| 25.6% | 39.9% |
| 28.3% | 28.0% |
| 22.6% | 16.4% |
| 12.5% | 8.3% |
| 6.1% | 4.0% |
| 4.7% | 3.3% |
| Gestational age | ||
| 1.2% | 0.8% |
| 17.9% | 11.6% |
| 73.0% | 82.1% |
| 7.9% | 5.5% |
| Birth weight | ||
| 2.1% | 1.1% |
| 16.4% | 6.6% |
| 81.5% | 92.3% |
The incidence of low birth weight among the study cohort was even more striking than that for premature births. Over 18% of the infants in the study cohort had a birth weight of less than 2500 grams; the same was true of only 7.7% of the control group.
Study Cohort Characteristics by Birth Weight
Given the pronounced differences in the distributions of birth weight for the study and control groups, it is important to examine the distributions of the explanatory variables by birth weight for both groups; these distributions are presented in Exhibit 26 and Exhibit 27. Exhibit 26 presents the variable distributions for the study cohort. Mothers of regular weight infants were more likely to be White (41.3%) or Hispanic (28.1 %) than mothers of low birth weight infants. In contrast, mothers of low and very low birth infants were more likely to be Black. Nearly 44% of very low birth weight mothers and over 46% of low birth weight mothers were Black.
Mothers age 30 or older were also more likely to give birth to low or very low birth weight infants. Nearly 39% of the mothers of very low birth weight infants and more than 28% of the mothers of low birth weight infants were age 30 or over. Only 23.4% of the mothers of regular weight infants were this age.
There were no dramatic differences in the unmarried status of mothers in the three birth weight categories. About 74% of the mothers of very low birth weight and regular birth weight infants were unmarried. Mothers of low birth weight infants were only slightly more likely to be unmarried (77.3%).
Mothers of very low and low birth weight infants were more likely to live in urban counties than mothers of regular weight infants. Nearly 68% of the mothers of very low birth weight infants and 68.9% of the mothers of low birth weight infants lived in urban counties. The same was true of only 62.5% of regular weight infants.
Compared to mothers of regular weight infants, mothers of very low birth weight and low birth weight infants were much more likely to have experienced previous terminations of pregnancies and complications of pregnancies and deliveries. Mothers of very low and low birth weight infants were also more likely to have given birth to a previous child.
Not surprisingly, gestational age was strongly associated with birth weight. Nearly 23% of very low birth weight infants were very premature compared to only 2.3% of low birth weight and 0.5% of regular weight infants. An additional 46% of very low birth weight infants were premature. Forty-one percent of low birth weight infants were premature, as were 12.5% of regular weight Infants. Notably, 15.3% of very low birth weight infants and 47.8% of low birth weight infants were full term. In contrast, 79.6% of regular weight infants were full term.
| EXHIBIT 26. Distributions of Selected Explanatory Variables by Birth Weight Category: Study Cohort | |||
| Under 1500 g. (n=124) | 1500-2499 g. (n=989) | 2500+ g. (n=4,904) | |
| Race/ethnicity of mother | |||
| 31.5% | 30.0% | 41.3% |
| 43.6% | 46.3% | 26.6% |
| 20.2% | 21.2% | 28.1% |
| 3.2% | 2.4% | 3.7% |
| Age | |||
| 2.4% | 1.0% | 3.0% |
| 8.9% | 7.9% | 11.5% |
| 22.6% | 28.1% | 29.7% |
| 27.4% | 34.8% | 32.3% |
| 27.4% | 21.0% | 17.7% |
| 11.3% | 7.2% | 5.7% |
| % Unmarried | 74.2% | 77.3% | 74.1% |
| % Urban | 67.7% | 68.9% | 62.5% |
| Previous pregnancy termination | |||
| 31.5% | 27.5% | 23.9% |
| 8.1% | 5.6% | 4.0% |
| Complications with pregnancy | |||
| 71.0% | 72.3% | 79.4% |
| 21.8% | 22.2% | 17.6% |
| 7.3% | 5.1% | 2.6% |
| Complications with delivery | |||
| 57.3% | 73.1% | 83.8% |
| 27.4% | 23.2% | 14.5% |
| 15.3% | 3.5% | 1.4% |
| Previous live births (now living) | |||
| 21.8% | 21.0% | 26.7% |
| 29.0% | 27.2% | 28.5% |
| 18.6% | 25.0% | 22.2% |
| 13.7% | 13.8% | 12.2% |
| 11.3% | 7.0% | 5.8% |
| 5.7% | 5.5% | 4.4% |
| Gestational age | |||
| 22.6% | 2.3% | 0.5% |
| 46.0% | 41.0% | 12.5% |
| 15.3% | 47.8% | 79.6% |
| 16.1% | 8.9% | 7.5% |
Control Group Characteristics by Birth Weight
Exhibit 27 reports the distributions of the explanatory variables, by infant birth weight, for the control group. In contrast to the findings for the study cohort, the percentage of White mothers was not substantially higher for the regular weight infants than for the very low and low birth weight infants. The patterns of Black and Hispanic mothers across birth weight categories were similar for the study and control groups, but the size of the percentages differed substantially for the two groups. The Black percentages were lower for the control group than for the study cohort, while the converse was true for Hispanics.
| EXHIBIT 27. Distributions of Selected Explanatory Variables by Birth Weight Category: Control Group | |||
| Under 1500 g. (n=133) | 1500-2499 g. (n=804) | 2500+ g. (n=11,293) | |
| Race/ethnicity of mother | |||
| 30.1% | 32.5% | 33.2% |
| 33.8% | 25.3% | 14.1% |
| 31.6% | 31.5% | 42.3% |
| 4.5% | 10.6% | 10.2% |
| Age | |||
| 6.0% | 4.0% | 4.2% |
| 14.3% | 17.5% | 18.3% |
| 42.1% | 34.7% | 37.4% |
| 21.8% | 24.6% | 24.0% |
| 8.3% | 12.6% | 11.4% |
| 7.5% | 6.6% | 4.8% |
| % Unmarried | 60.9% | 60.1% | 52.2% |
| % Urban | 64.7% | 62.6% | 61.7% |
| Previous pregnancy termination | |||
| 27.8% | 16.0% | 15.5% |
| 5.3% | 3.2% | 1.9% |
| Complications with pregnancy | |||
| 61.7% | 72.0% | 87.7% |
| 32.3% | 22.5% | 10.8% |
| 5.3% | 4.4% | 1.0% |
| Complications with delivery | |||
| 48.1% | 70.5% | 83.9% |
| 39.1% | 23.1% | 13.6% |
| 12.0% | 5.2% | 2.0% |
| Previous live births (now living) | |||
| 40.6% | 40.6% | 39.8% |
| 28.6% | 26.1% | 28.1% |
| 16.5% | 15.9% | 16.4% |
| 6.8% | 9.7% | 8.3% |
| 4.5% | 5.2% | 3.9% |
| 2.3% | 2.5% | 3.4% |
| Gestational age | |||
| 31.6% | 1.9% | 0.3% |
| 48.9% | 46.3% | 8.7% |
| 9.8% | 43.7% | 85.7% |
| 9.8% | 8.2% | 5.2% |
Exhibit 27 also indicates that there were substantial differences in the age distributions of the study cohort and control groups and how they interacted with birth weight. The percentages of control group mothers aged 30 and over were substantially lower than the corresponding percentages for the study group in each birth weight category. Most striking of all, is the tact that 15.8% of the mothers of very low birth weight infants were age 30 or older--less than half the percentage of the corresponding mothers in the study group (38.7%). Moreover, among the mothers of the control group, there was no strong relationship between being age 30 and over, and low birth weight. As just mentioned, 15.8% of the mothers of very low birth weight infants were age 30 and over, compared to 19.2% of the mothers of low birth weight infants and 16.2% of the mothers of regular weight infants.
Exhibit 25 indicated that the percentage of unmarried mothers was lower in the control group than in the study cohort. This was true for each birth weight category also. In contrast to the study cohort, however, the percentages of unmarried women were higher for underweight than for regular weight infants in the control group. Nearly 61% of the mothers of very low birth weight infants and 60.1% of low birth weight infants were unmarried, versus 52.2% of the mothers of regular weight infants.
Patterns of residence in urban counties by infant birth weight were similar for the study cohort and control group, except that differences by birth weight were stronger for the former. Approximately 65% of the mothers of very low birth weight infants in the control group lived in an urbanized county, compared to 62.6% of mothers of low birth weight and 61.7% of regular weight infants. The corresponding percentages for the study group were higher for underweight infants.
In general, the patterns of having a history of previous pregnancy terminations and experiencing complications with pregnancy and delivery were similar for the study cohort and control group across birth weight categories. The incidence of such problems, however, differed across variables in a sometimes unexpected fashion. For example, 32.3% of the mothers of very low birth weight infants in the control group had experienced at least one complication with pregnancy compared to 21.8% of the same group of mothers in the study cohort. Similarly, 39.1% of these mothers in the control group had experienced one complication with delivery, compared to 27.4% of the study cohort mothers of very low birth weight infants. On the other hand, 31.5% of the mothers of very low birth weight infants in the study cohort had a history of one very early pregnancy termination (=20 weeks)11 versus 27.8% of the corresponding mothers in the control group.
The distributions of numbers of previous children did not demonstrate a great deal of variation by birth weight for either the control group or the study cohort. The most notable difference for this variable was the greater incidence of previous births in the study cohort relative to the control group. This finding was noted earlier in reference to Exhibit 25.
Like the pregnancy history, pregnancy complications, and delivery complications variables, the distributions of gestational age by birth weight differed in complex ways between the study cohort and control group. The incidence of premature and very premature birth within the very low birth weight category was higher for the control group than the study cohort. In addition, the incidence of full term births was higher for the underweight infants in the study group than the control group. As expected, however, the percentage of full term pregnancies in the normal weight infant category was higher for the control group (85.7%) than the study cohort (79.6%). To disentangle these complexities, and others such as the differential racial composition of the study and control groups, multivariate analyses of low birth weight and Medicaid expenditures are presented in the following section.
MULTIVARIATE ANALYSES
A major goal of the analysis was to examine how birth weight and Medicaid expenditures were influenced by substance exposure, controlling for other potential influences. Several previous studies have used multivariate analysis to examine the determinants of low birth weight among infants born to Medicaid women (Devaney, Bilhemier and Schore, 1992; Howell, Herz, Wang and Hirsch, 1991). These studies have been helpful in understanding the factors influencing low birth weight but suggest that further research is necessary in several areas. In particular, what are the effects of substance exposure on the incidence of low and very low birth weight infants? Do the determinants of low weight births differ from those of very low weight births? What affect does substance exposure have on Medicaid expenditures per child during the first two years of life after controlling for other factors?
To answer these questions, two types of multivariate analyses were undertaken. First, the effects of substance exposure on the risk of low birth weight and very low birth weight were examined, controlling for the effects of other factors such as the demographic characteristics and pregnancy history of the mother. Second, the direct and indirect effects (through the risk of low birth weight) of substance exposure on Medicaid expenditures during the child's first two years of life were examined--again controlling for the effects of other variables. Multinomial logit analysis was used for the birth weight model because the outcome variable contained three discrete categories (very low birth weight, low birth weight, and normal weight). Multiple regression was used for the analyses of Medicaid expenditures.
Multinomial Logit Models of Low and Very Low Birth Weight
By merging the California Tape-to-Tape data with the California Vital Statistics data, considerable information was available on the substance exposure of young children, characteristics of the mother, birth outcomes, and complications during pregnancy and delivery. The analysis presented thus far has identified differences between study cohort and control group mothers by the birth weight of their infants. Multivariate analyses were conducted to explore these differences further, as well as to ascertain the relative strength of alternative factors in explaining them. In the first stage of the analysis, a multinomial logit model of the factors associated with the probability of low and very low birth weight (normal birth weight was used as the reference category) was estimated. Variables included in the model were identified through a review of the literature. Factors previously found to be associated with low birth weight included demographic characteristics of the mother (race and ethnicity, age, marital status, and educational level), amount and timing of prenatal care, complications in pregnancy and delivery, and behavioral characteristics of the mother (smoking, weight gain, and substance abuse).
The results are shown in Exhibit 28. In general, the equations for very low birth weight and low birth weight infants were very similar. In all instances, variables that were statistically significant in both models had the same signs in both models. The low birth weight equation had 14 coefficients that were statistically significant at the 95 percent confidence level or higher. The very low birth weight equation had 8 statistically significant coefficients. The somewhat stronger performance of the low birth weight equation was probably due to the greater sample size for low birth weight infants (n=1,793) relative to very low birth weight infants (n=257).
| EXHIBIT 28. Multinomial Logit Model of Very Low and Low Birth Weight | ||||
| Very Low Birth Weight | Low Birth Weight | |||
| Coefficient | Standard Error | Coefficient | Standard Error | |
| Intercept | -4.8810*** | 0.4369 | -2.7245*** | 0.1600 |
| Race/ethnicity of mother | ||||
| -0.0151 | 0.1900 | -0.1959** | 0.0734 |
| 1.0423*** | 0.1858 | 0.7468*** | 0.0716 |
| -0.0106 | 0.3676 | 0.2532* | 0.1219 |
| Age of mother | ||||
| -0.0161 | 0.2069 | -0.1652* | 0.0822 |
| 0.4357 | 0.2649 | 0.2814* | 0.1128 |
| Pregnancy complications | 0.6723*** | 0.1570 | 0.6135*** | 0.0651 |
| Labor complications | 1.4553*** | 0.1463 | 0.6502*** | 0.0648 |
| Unmarried | -0.1158 | 0.1568 | 0.1956** | 0.0638 |
| Previous live births, living | -0.0002 | 0.0518 | 0.0386 | 0.0204 |
| Previous live births, dead | 0.5875** | 0.1809 | 0.2487 | 0.1017 |
| Previous pregnancy terminations | ||||
| 0.5436*** | 0.1580 | 0.0869 | 0.0675 |
| 0.3837 | 0.3176 | 0.2424 | 0.1385 |
| Study cohort | 0.6690*** | 0.1581 | 0.8945*** | 0.0606 |
| Urban | 0.0816 | 0.1550 | 0.0959 | 0.0600 |
| 1987 cohort | -0.2044 | 0.1821 | -0.1412* | 0.0693 |
| 1988 cohort | 0.1573 | 0.1691 | -0.0119 | 0.0670 |
| Mother's months of Medicaid enrollment during pregnancy | -0.1359*** | 0.0205 | -0.0455*** | 0.0079 |
| Prenatal care during first trimester | 0.0677 | 0.3671 | -0.1933 | 0.1288 |
| Medically needy | -0.0243 | 0.1762 | 0.0401 | 0.0704 |
| Male baby | -0.2490 | 0.1399 | -0.2542*** | 0.0548 |
| X2 = 25091.58 * Statistically significant at p or = .05 level ** Statistically significant at p or = .01 level *** Statistically significant at p or = .001 level | ||||
Low Birth Weight Model. Several characteristics of the mother increased the odds of having a low birth weight infant (relative to having a normal weight infant): being Black or a member of another nonwhite, non-Hispanic group, age 35 or older, experiencing pregnancy complications, labor complications, being unmarried, and having a history of previous live births that had subsequently died. Mothers' characteristics that reduced the odds of having a low birth weight infant were: being Hispanic, age 18 or under, and the length of Medicaid enrollment during the pregnancy. Males were also less likely to be low birth weight infants. In addition, the dummy variable for 1987 was negative and statistically significant, indicating that after controlling for all of the other variables in the equation, the odds of a Medicaid enrollee having a low birth weight infant were lower in 1987 than in 1986 (the reference year).
The most important finding concerned the dummy variable for substance exposure. Members of the study group were more likely to be low birth weight infants, even after controlling for all of the other factors included in the equation. This finding was statistically significant at the 99.9 percent confidence level.
Finally, one of the most interesting findings for low birth weight equation had to do with the dummy variable indicating the receipt of prenatal care in the first trimester. After controlling for the mother's length of Medicaid enrollment during her pregnancy, prenatal care was not statistically significant. When mother's length of Medicaid enrollment was dropped from the equation, prenatal care was still not statistically significant at a 95 percent confidence level. It seems clear from these findings that length of Medicaid enrollment is a stronger predictor of low birth weight than prenatal care, although the two are obviously related.
Very Low Birth Weight Model. As in the low birth weight model, mothers' characteristics were powerful predictors of the odds of having a very low birth weight infant. Mothers' characteristics that increased the odds of having a very low birth weight infant were: being Black, having a history of pregnancy or labor complications, previous live births that were now dead, and previous pregnancy terminations less than or equal to 20 weeks.12 For the reasons mentioned earlier, however, the association between very early pregnancy terminations (= 20 weeks) and birth weight should be interpreted with caution. The mother's length of Medicaid enrollment during her pregnancy red uced the odds of having a very low birth weight infant and was statistically significant at the 99.9 percent confidence level.
As with the low birth weight equation, being a member of the study cohort increased the odds of very low birth weight. Again, this finding was statistically significant at the 99.9 percent confidence level.
Multiple Regression Model of Medicaid Expenditures
The second step in the multivariate analysis was to estimate a regression model of Medicaid expenditures. Several previous studies have examined the factors associated with low birth weight and Medicaid expenditures (e.g., Devaney, Bilheimer, and Schore, 1992; Howell, Herz, Wang, and Hirsch, 1991). The simplest approach to examining the effects of low birth weight on expenditures is to include a dummy variable for low birth weight in the expenditure equation. If, however, the underlying factors that determine low birth weight also influence expenditure levels, then the residuals for these two equations will be correlated. Failure to take account of this correlation will lead to biased coefficient estimates in the expenditure equation. Several approaches have been developed to correct for this type of bias.
One well accepted method of correcting for sample selection bias is that developed by Heckman (1979). The first step in the Heckman approach is to estimate the equation for the probability of low birth weight. From the predicted probabilities of this model, a variable is constructed known as the inverse Mills ratio. The inclusion of the inverse Mills ratio (also known as lambda) in the expenditure equation controls for the bias that would otherwise be introduced by ignoring the unobserved determinants of the probability of being a low birth weight baby. A t-statistic can be used to test whether the selection bias is statistically significant (Heckman, 1979; Maddala, 1990).
The estimated Medicaid expenditure equation is reported in Exhibit 29.13 The mother's age 18 years) and race/ethnicity (Hispanic origin, and other non-White, non-Hispanic origin) were found to be associated with higher Medicaid expenditures. Mothers who had a history of previous live births still living tended to have lower cost infants.
| EXHIBIT 29. Multiple Regression Model of Log-Transformed Medicaid Costs | ||
| Variable Name | Coefficients | Standard Error |
| Intercept | 5.2791*** | 0.0533 |
| 1+ Congential malformations | 1.8400*** | 0.1884 |
| Pregnancy complications | -0.0112 | 0.0473 |
| Labor complications | 0.0666 | 0.0483 |
| Cesarean delivery | 0.1630*** | 0.0487 |
| Age of mother | ||
| 0.0905* | 0.0426 |
| 0.1308 | 0.0729 |
| Male baby | 0.2363*** | 0.0310 |
| Race/ethnicity of mother | ||
| 0.1131** | 0.0381 |
| 0.0139 | 0.0458 |
| 0.4213*** | 0.0641 |
| Unmarried | 0.0632 | 0.0349 |
| Previous live births, living | -0.0568*** | 0.0123 |
| Previous live births, dead | 0.0635 | 0.0698 |
| Previous pregnancy terminations | ||
| 0.0693 | 0.0408 |
| 0.1093 | 0.0955 |
| Urban | -0.2232*** | 0.0332 |
| Study cohort | 0.3418*** | 0.0374 |
| Eligibility group | ||
| -0.6867*** | 0.0396 |
| 0.4652*** | 0.0639 |
| 1987 cohort | -0.0528 | 0.0384 |
| 1988 cohort | -0.1080** | 0.0384 |
| Inverse Mills ratio | 0.3707*** | 0.0327 |
| Adjusted R2 = .07 * Statistically significant at p or = .05 level ** Statistically significant at p or = .01 level *** Statistically significant at p or = .001 level | ||
Not surprisingly, infants with one or more congenital malformations had higher Medicaid expenditures. Similarly, the risk of low birth weight (as indicated by the inverse mills ratio) was also associated with higher expenditures. The finding that cesarean deliveries were more expensive was unexpected given that delivery charges were not included in the Medicaid expenditures. Perhaps the cesarean births reflect underlying health problems with the infant prior to delivery that carried over into the first two years of life. Male babies also had higher average Medicaid expenditures.
The finding that medically needy infants were associated with lower Medicaid expenditures was also very interesting. This may reflect the fact that medically needy infants more often have both parents living in the household and have higher incomes than other eligibility groups. Higher economic status may, in turn, be a proxy for better nutrition, living conditions, and other factors that could favorably influence health status--thereby lowering Medicaid utilization and expenses. In contrast, foster care infants tended to have significantly higher expenditures than infants receiving AFDC cash assistance.
Urban county of residence was also found to be associated with lower Medicaid expenditures. This was surprising since Medicaid payments to providers in urban areas would generally be expected to be higher than those in non-urban areas.
In addition, the dummy variable for 1988 was negative and statistically significant, indicating that after controlling for all of the other variables in the equation, enrollment adjusted Medicaid expenditures were lower in 1988 than 1986 (the reference year).
Perhaps the most important finding presented in Exhibit 29 is that of the effects of substance exposure on Medicaid expenditures. After controlling for all of the other factors included in the equation, membership in the study cohort was associated with higher Medicaid expenditures relative to membership in the control group. Moreover, there was an additional indirect effect of substance exposure on Medicaid expenditures that entered through the risk of low birth weight.
The findings from the multinomial logit and regression models are consistent with those of previous studies. The most closely related study is that of Howell, Herz, Wang, and Hirsch (1991) who examined the predictors of low birth weight for California Medicaid and non- Medicaid infants, as well as the determinants of Medicaid expenditures. As in this study, Howell et al. found that the mother's race, age, pregnancy and delivery history, and length of Medicaid enrollment during pregnancy were associated with the probability of low birth weight. Also as in this study, Howell et al. found that very low birth weight, congenital malformations, pregnancy and delivery complications, cesarean delivery, urban residence, and medically needy status (of infant) were associated with Medicaid expenditures. In addition, Howell et al. found that hospital characteristics (ownership and level of care) were strongly associated with Medicaid expenditures; the effects of hospital characteristics were not examined in the current study. The major difference between the current study and that of Howell et al., however, is that their emphasis was on the influence of prenatal care on birth outcomes. They did not investigate the effects of substance exposure on the probability of low birth weight or Medicaid expenditures.
Devaney, Bilheimer and Schore (1992) examined the determinants of birth weight in Florida, Minnesota, North Carolina, South Carolina, and Texas. As in this study, they found that the sex of the child, mother's age, race, and marital status, previous pregnancy history, and urban residence (North Carolina only) influenced infant birth weight. They also found that prenatal care, prenatal WIC participation, and mother's education level influenced infant birth weight. The education level of the mother was not available in the California Tape-to-Tape or Vital Statistics data. In contrast to Devaney et al., however, the findings from this study indicate that prenatal care was not statistically significant after controlling for the length of the mother's enrollment in Medicaid during her pregnancy.14 Devaney, Bilheimer and Schore (1992), like Howell, Herz, Wang and Hirsch (1991), did not examine the effects of substance exposure on birth outcomes or Medicaid expenditures.15 They were interested mainly in the effects of prenatal WIC participation and the use of prenatal care on Medicaid birth outcomes.
CONCLUSIONS AND IMPLICATIONS
No matter what method of identification was used, study results showed that substance exposed children in their first two years of life cost the Medicaid program more than other children of the same age. How much more they cost was related to the method of identification. The study used a broad definition and methodology to identify substance exposed children, including the use of substance abuse diagnoses in the mothers' files for two years prior to delivery and 6 months post delivery. With this approach, substance exposed children had expenditures which were 40% greater than other Medicaid children in the first year of life and 22% greater in the second year. However, this difference was largely due to a much longer average length of enrollment on Medicaid for substance exposed children. Study data showed that children in the substance exposed group had a strong attachment to the Medicaid program and appeared to be long-term enrollees. When adjustments were made for length of enrollment, the Medicaid expenditure difference between substance exposed children and other Medicaid children was reduced to about 13% in the first two years of life.
Thus, substance exposed children had greater utilization and expenditures than other children. However, much of this difference was attributable to longer lengths of enrollment, not greater health cam needs. This result is important because some anecdotal information has implied that the long-term health care needs (and expenses) of substance exposed children far exceed those of other children. Study data over a two year period do not support this conclusion, when a broad definition of substance exposure for children is used.
On the other hand, it is important to note that the percentage difference in median Medicaid expenditures between the study cohort and the control group was quite substantial. The median Medicaid expenditure for substance exposed infants was $465--94% higher than the median expenditure for the control group ($240). Nevertheless, it does not appear that substance exposed children have a substantial impact on aggregate Medicaid expenditures because the dollar magnitude of the difference in costs is fairly modest ($225) and substance exposed children represent a small percentage of the Medicaid infant population. Rather, it is the high cost children in both groups that have a major impact on the aggregate Medicaid expenditures and the average expenditure per child.
However, with a more conservative definition of substance exposure, i.e. only those children with direct diagnoses in their own claims records, the cost difference between substance exposed children and other Medicaid children was substantial. To use the terminology of Dicker and Leighton, this group could be called substance affected children, i.e. there was a direct diagnosis of medical problems caused by substance exposure in the children's files. These substance affected children (also called self-identified children in the text) had Medicaid expenditures approximately 90% greater than other substance exposed children, even with length of enrollment adjustments. Due to their high costs, this group of children with direct diagnoses of substance exposure in their records may be good candidates for case management under State Medicaid programs.
The study methodology did not identity nearly as many substance exposed children in the Medicaid population as other researchers have suggested. The study cohort represented 1.4% to 1.9% of the children born in 1986, 1987 and 1988 who were enrolled in California's Medicaid program. However, without direct testing, the study methodology was limited in its ability to identify children with substance exposure. Other researchers have found that the identification rate of substance exposed infants is increased from 3 to 5 times if direct testing is utilized (Chasnoff, 1989, as reported by the General Accounting Office, 1990). There were also limitations regarding the diagnosis coding in California Medicaid claims data.
Even with the study limitations regarding the identification of substance exposed children, the incidence of substance exposed infants enrolled in California's Medicaid program increased by 44% from 1986 to 1988. If this growth rate continues and substance exposed children continue to show long-term enrollment in the program, the effect on California's Medicaid expenditures for children will become significant. In this time of limited resources, any group of children with greater service needs are a concern.
Study results confirmed both the growing numbers and high proportion of substance exposed children in foster care. Further, substance exposed children in foster care had higher Medicaid expenditures than other substance exposed children. The higher Medicaid costs of the substance exposed foster care subgroup, coupled with their costs in foster care payments, add to a growing burden on a system already under financial pressure.
One unexpected study finding was that many of the substance exposed children had mothers with strong attachments to the Medicaid program. For example, one-quarter of the mothers had been on Medicaid for the entire two years preceding delivery. This result reinforces the need for Medicaid treatment services for adults with substance abuse problems.
Study results also confirmed that substance exposure increases the risk of under weight births. Under weight births were, in turn, found to be associated with higher Medicaid costs over the first two years of life. Again, these results reinforce the need for Medicaid treatment services directed to adults with substance abuse problems.
The multivariate findings from the study confirmed the descriptive results. In particular, it was found that, after controlling for the influence of other variables, substance exposure increased the probability of under weight births and increased Medicaid expenditures. However, the mother's length of Medicaid enrollment had a very significant effect of lowering the probability of a low birth weight infant. When the mother's length of Medicaid enrollment during pregnancy was included in the equation, the variable for prenatal care in the first trimester was not statistically significant. These findings indicate that efforts to enroll pregnant women in Medicaid can help to reduce the likelihood of low birth weight infants, which are a significant factor in higher Medicaid expenditures.
Subsequent to the time period analyzed in this study, the Federal government has imposed increased mandates to States to broaden Medicaid coverage for poor infants and pregnant women. These new initiatives could substantially increase the number of infants with substance exposure problems who are covered under Medicaid. Whether or not these children will exhibit the patterns of higher Medicaid utilization and expenditures seen with the study data is not known. It seems likely that a key factor will be the success of substance abuse treatment programs (that accept Medicaid payment) directed to both pregnant women and all low-income women of child-bearing age.
It would be helpful to investigate the incidence of substance exposed children in other State Medicaid programs, using a similar methodology. California's Medicaid program over the study period offered more comprehensive benefits and used less restrictive eligibility criteria than other States. These program differences could influence the number and characteristics of substance exposed children who were identified. On the other hand, there were limitations to the diagnosis data available in California's Medicaid files. For example, California's outpatient files do not include secondary diagnoses. As a result, the proportion of substance exposed children found in other States could be greater, especially with regard to problems related to alcohol abuse.
There are also opportunities for continued research with the California Medicaid data. It would be informative to continue tracking the study cohort to see if the pattern of long-term enrollment and greater expenditures persists. It would also be useful to look at children born in later years to determine whether the incidence of substance exposed infants has increased, particularly among the new Medicaid eligibility groups which measure family income against the poverty standard. Research could also be undertaken to further analyze the Medicaid experience of mothers of substance exposed children. For example, how long have they been enrolled in Medicaid and how many other children have they delivered under Medicaid coverage? What level of treatment have they received for their substance abuse problems?
Finally, it would be helpful to study the usefulness of the multivariate models for developing refined of the effects of substance exposure on Medicaid expenditures. Preliminary analyses indicated estimates that the relationships of substance exposure to Medicaid expenditures are extraordinarily complex. For example, this study controlled for the indirect effects of substance exposure on Medicaid expenditures through the probability of low birth weight infants. But it is reasonable to expect that there are similar interactions of substance exposure with race, foster care status, and other variables. Exploration of these indirect effects of substance exposure on Medicaid expenditures could be very useful in fully understanding the expenditure impacts and policy implications of substance exposure.
REFERENCES
State of California, Office of the Legislative Analyst, The 1989-90 Budget: Perspectives and Issues. 1989.
Cawthon, L, "First Steps Database: Substance Abuse in Pregnancy," State of Washington, June, 1991.
Devaney, B., Bilheimer, L, and Schore, J. "Medicaid Costs and Birth Outcomes: The Effects of Prenatal WIC Participation and the Use of Prenatal Care," Journal of Policy Analysis and Management. Vol.11, No.4, pp.573-592, 1992.
Dicker, M. and Leighton, E., 'Trends in Diagnosed Drug Problems Among Newborns: United States 1979-1987," in Drug and Alcohol Dependence, in press.
Feig, L, Drug Exposed Infants and Children: Service Needs and Policy Questions, Office of the Assistant Secretary for Planning and Evaluation, January, 1990.
Foy, J. Regression Diagnostics. Newbury Park, California: Sage Publications, Inc. 1991.
Frank, R., Strobino, D., Salkever, D., and Jackson, C. "Updated Estimates of the Impact of Prenatal Care on Birthweight Outcomes by Race," The Journal of Human Resources. Vol.27, No.4, pp.629-642, 1991.
Gomby, D., and Shiono, P. "Estimating the Number of Substance-Exposed Infants," The Future of Children. Vol.1, No.1, pp.17-25. Center for the Future of Children, The David and Lucille Packard Foundation, 1991.
Government Accounting Office, "Drug-Exposed Infants: A Generation at Risk," June, 1990.
Halfon, N., M.D., M.P.H., Director, Center for the Vulnerable Child, Oakland Children's Hospital, Oakland, California, Testimony before the Select Committee on Children, Youth and Families, U.S. House of Representatives, April, 1989.
Heckman, J. "Sample Selection Bias as a Specification Error." Econometrica. Vol.47, pp. 153162, 1979.
Horgan, C., Rosenbach, M., Ostby, E., and Butricia, B., "Targeting Special Populations with Drug Abuse Problems: Pregnant Women," in Background Papers on Drug Abuse Financing and Services Research, National Institute on Drug Abuse, 1991.
Howell, E., Herz, E., Wang, R., and Hirsch, M. "A Comparison of Medicaid and Non-Medicaid Obstetrical Care in California," Health Care Financing Review, Vol.12, No.4. pp.1-15, 1991.
Howell, E.M., and Ellwood, M.R., "Medicaid and Pregnancy: Issues in Expanding Eligibility," Family Planning Perspectives, Vol.23, No.3. May/June, 1991.
Johnson, A., Johnson, M., and Buse, R. Econometrics: Basic and Applied. New York: Macmillan Publishing Company, 1987.
Jones, A. "An Econometric Investigation of Low Birth Weight in the United States," Journal of Health Economics. Vol.10, pp.81-99, 1991.
Joyce, T., Racine, A., and Mocan, N. "The Consequences and Costs of Maternal Substance Abuse in New York City: A Pooled Time-Series, Cross-Section Analysis," Journal of Health Economics. Vol.11. No.3, pp.297-314, 1992.
Maddala, G.S. Limited-Dependent and Qualitative Variables in Econometrics. Cambridge University Press, 1990.
Office of the Inspector General, "Crack Babies," June, 1990.
Phibbs, C. "The Economic Implications of Prenatal Substance Exposure," The Future of Children. Vol.1, No.1, pp.113-120. Center for the Future of Children, The David and Lucille Packard Foundation, 1991.
Phibbs, C.S., Bateman, D.A., and Schwartz, R.M., "The Neonatal Costs of Maternal Cocaine Use, Journal of American Medical Association, Vol.266, No.11. September, 1991.
Rosenzweig, M.R., and Schultz, T.P. "Estimating a Household Production Function: Heterogeneity, the Demand for Health Inputs, and Their Effects on Birth Weight," Journal of Political Economy. Vol.91, No.51, pp.723-745, 1983.
Rymer, M.P., and Adler, G.S., "Children and Medicaid: The Experience in Four States," Health Care Financing Review. Vol.9, No.1, Fall, 1987.
Slutsker, L., Smith, R., Higginson, G., and Fleming, D. "Recognizing Illicit Drug Use by Pregnant Women: Reports from Oregon Birth Attendants," American Journal of Public Health. Vol.83, No.1, pp.61-64, 1991.
Walker, C., Zangrillo, P., and Smith, J., Parental Drug Abuse and African American Children in Foster Care, February, 1991.
Yudkowsky, B.K., and Fleming, G.V., "Preventive Health Care for Medicaid Children," Health Care Financing Review, 1990 Annual Supplement.
Zuckerman, B. "Drug-Exposed Infants: Understanding the Medical Risk," The Future of Children. Vol.1, No.1, pp.26-35. Center for the Future of Children, The David and Lucille Packard Foundation, 1991.
NOTES
-
For 1,060 children, only the mothers' records were available. These children were excluded from the final study cohort for analysis.
-
In California, the EPSDT program is called the Child Health and Disability Prevention (CHDP) Program.
-
This focus of Dicker and Leighton's study was drug affected, not drug exposed, newborns. Drug affected newborns were defined as those who, at the time of birth, were found to have symptoms diagnosed by the attending hospital staff as due to the use of drugs by the mother. The study reported in this paper and many other studies report in the literature focus on substance exposed children, i.e. children exposed to drugs at some time during the mothers's pregnancy, even if there are no reported signs of a birth complication or a drug problem in the newborn. Thus, drug affected children are a subset of substance exposed children.
-
Children were assigned to the eligibility group in which they were enrolled for the longest amount of time over the study period.
-
Estimates from the National Hospital Discharge Survey, National Center for Health Statistics, on rate of discharges and average length of stay for patients under 1 year of age, excluding newborn infants, discharged from short-stay nonfederal hospitals in the United States.
-
It should be noted that study data did not permit the calculation of hospital neonatal intensive care expenditures for either the study cohort or the control group. This limitation occurred because Medicaid claims only indicate the hospital charges, not the "Medicaid amount paid," in the accommodation field in which intensive care is reported.
-
Marital status is not directly provided on California birth certificates. Rather it is inferred from an elaborate set of rules based on the surnames of the mother and father provided on the birth certificate.
-
The early pregnancy termination variable needs to be interpreted with caution because it includes both abortions and miscarriages. No information was available from California Vital Statistics data to determine the relative sizes of the two types of early pregnancy terminations. In addition, the degree to which early pregnancy terminations are reported consistently is unknown.
-
Very premature infants are defined as those with a gestational age of less than 28 weeks; infants with a gestational age of 28 to 37 weeks were defined as premature; and those with a gestational age of 38 weeks or more were defined as full term.
-
One might expect that gestational age would be more likely to be noted in the case of a premature birth than a full term birth. Exhibit 26 and Exhibit 27, however, indicate that gestational age was less frequently available for very low and low birth weight infants.
-
The California Vital Statistics Data do not separate early pregnancy terminations into abortions and miscarriages. Nor is it known, the extent to which this variable is coded consistently by hospitals. Consequently, the meaning of the association of very early pregnancy terminations with low or very low birth weight is not completely clear. It seems, however, to be indicating a positive association between miscarriage and low or very low birth weight.
-
The reference group for the two previous pregnancy termination dummy variables was no history of previous pregnancy terminations.
-
The dependent variable was the natural logarithm of expenditures per child person year of enrollment for the study period. The natural logarithm of these expenditures values was used as the dependent variable in the regression to improve the normality of the model's error distribution (e.g., Fox, 1991; Johnson, Johnson, Buse, 1987).
-
In their review of previous studies of the effects of Medicaid on prenatal care and birth outcomes, Howell et al. (1991) point out that results regarding these effects in the literature have been mixed.
-
In addition to the studies just described, which used data on individuals, a number of studies have used aggregate (usually county of SMSA-level) data to examine the effects of prenatal care, smoking, and substance abuse on low birth weight (Joyce, Racine, and Mocan, 1992; Frank, Strobino, Salkever, and Jackson, 1991; Jones, 1991; and Rosenzweig and Schultz, 1983). In particular, Joyce et al. (1992) found evidence that substance exposure increased the probability of Black low birth weight infants.