
U.S. Department of Health and Human Services
The Diversity of Welfare Leavers
Robert Moffitt and Jennifer Roff
Johns Hopkins University
September 2000
PDF Version: http://aspe.hhs.gov/daltcp/reports/2000/diverswl.pdf (27 PDF pages)
This report was prepared under contract between the U.S. Department of Health and Human Services (HHS), Office of Disability, Aging and Long-Term Care Policy (DALTCP) and Johns Hopkins University. Additional funds were provided by HHSs National Institute of Child Health and Human Development. For additional information about this subject, you can visit the DALTCP home page at http://aspe.hhs.gov/_/office_specific/daltcp.cfm or contact the office at HHS/ASPE/DALTCP, Room 424E, H.H. Humphrey Building, 200 Independence Avenue, S.W., Washington, D.C. 20201. The e-mail address is: webmaster.DALTCP@hhs.gov. The Project Officer was William Marton.
The opinions and views expressed in this report are those of the authors. They do not necessarily reflect the views of the Department of Health and Human Services, the contractor or any other funding organization.
TABLE OF CONTENTS
- LIST OF FIGURES
- FIGURE 1: Percent of Time Employed Off Welfare in Year Prior to Interview: Conventional Leavers
- FIGURE 2: Percent Never Employed When Off Welfare in Year Prior to Interview: Conventional Leavers
- FIGURE 3: Number of Months on TANF
- LIST OF TABLES
- TABLE 1: Monthly Income of Leavers
- TABLE 2: Monthly Incomes of Leavers of Different Characteristics
There are large variations in employment and income among welfare leavers. Women with a greater history of welfare dependence, women who were sanctioned while on TANF, and women with less education, in poorer health, and with younger children have significantly worse outcomes.
SUMMARY
Women who have left TANF in three cities--Boston, Chicago, and San Antonio--have an average employment rate of 63 percent after leaving, a rate similar to figures found in studies of welfare leavers in many other states. But this average obscures a large amount of variation across different groups of women, some of whom have done much better than this and some of whom have done much worse. Women with lower levels of education, worse levels of health status, with younger children, and who are themselves young have considerably lower employment rates and post-welfare income levels than women with greater levels of education, better health status, with older children, and who are older. Outcomes also differ among those leavers with a history of greater welfare dependence, a group not examined in other studies. The employment and, especially, income outcomes among these leavers are considerably worse than the average. These large differences in outcomes for different former welfare recipients should be examined by policy-makers when they consider reforms to assist those who have difficulty attaining self-sufficiency off the welfare rolls.
The historically unprecedented wave of welfare reforms sweeping the country in the early 1990s, embodied in the 1996 Personal Responsibility and Work Opportunity Reconciliation Act (PRWORA), has brought the most drastic and deep-seated reforms in the welfare system for single mothers since the inception of the AFDC program in 1935. An equally unprecedented decline in the welfare rolls has accompanied this wave of reform. Nationwide the recipient caseload of the AFDC-TANF program dropped by almost 50 percent from 1994 to 1999. This caseload decline has been the result not only of the strong economy and low unemployment rate, but also of policy developments that expanded the benefits of the Earned Income Tax Credit and other programs for nonwelfare recipients. Welfare reform has unquestionably played a major role in the caseload decline as well.1
The women and children who have left welfare over this period have been a major focus of public policy attention. The most important issue is whether they have been able to find employment at acceptable rates, as well as high enough incomes, to attain self-sufficiency after leaving the rolls. A large number of states have conducted studies of these welfare leavers and have found, overall, that employment rates after leaving the rolls are in the range of 50 percent to 70 percent.2 Earnings of these welfare leavers have, on average, been lower than the welfare benefits they had been receiving while on welfare; however, less is known about total household income after leaving welfare because few studies have a complete inventory of other sources of income.
This policy brief goes behind these figures to chart the experiences of women who have done better or worse than the averages. It is to be expected that some women, such as those with more labor market experience and superior job skills, will do better than average and that women with less experience and fewer skills will do worse. But the magnitude of those differences, particularly for those of the more disadvantaged groups, is an important question for policy-makers that has not been adequately addressed in discussions thus far. We present information on three types of diversity among welfare leavers:
-
Differences in education, health, and other characteristics.
-
Differences in whether or not an individual had been sanctioned before she left the rolls.
-
Differences in welfare dependency: the amount of time an individual had spent on welfare before leaving and the amount of time spent off welfare after leaving.
All three are important sources of variation among welfare leavers that have been ignored in many previous studies. An examination of the diversity of the experiences of welfare leavers is thus the subject of this brief.
Our findings are based on the experiences of leavers in Boston, Chicago, and San Antonio, three large cities in the U.S. with differing populations and located in states with a range of welfare policies. The Three City Study (see description on back panel) is a longitudinal survey of approximately 2,500 low-income families with children who are living in low- and moderate-income neighborhoods in these three cities. The first wave of the survey data took place between March and December 1999 and is used for this brief. The survey includes information on welfare and nonwelfare families, but for the purposes of this brief we examine data only for those women who were on the rolls sometime in the two years immediately prior to the interview (approximately 1997 to 1999) and who left the rolls sometime in that period. The survey collected a wide range of information on employment, income, family structure, and characteristics of the caregiver (usually the mother) of the children in the family. Given that this range of information is considerably broader than the data sources that have been used for most other welfare leaver studies, we are able to document more fully how leavers have been doing.
The economy has improved and the welfare rolls have plummeted in all three states in which our cities are located, as they have nationally.3 The rates of decline of the unemployment rate and the TANF rolls have been roughly similar across the three cities, and the magnitudes have been approximately those of the nation as a whole. Our three areas can, therefore, be regarded as not very different from the rest of the country in these broad dimensions. The populations of the three cities are somewhat different from one another, with a greater number of Puerto Rican Hispanics in Boston and a greater number of Mexican-American families in Chicago and San Antonio. Since relatively few low-income white families live in inner city neighborhoods in Chicago and San Antonio, we draw most of our families of that group from Boston. Our sample includes African-American families from all three cities.
The TANF policies in the three cities also differ (see below). Massachusetts has one of the shortest time limits in the country (two years out of every five) but, at the same time, exempts a large number of those families from the time limits and also has not, at this writing, imposed a lifetime limit. Massachusetts also has a fairly strict sanction policy and a family cap. Texas is a relatively low-benefit state compared to the nation as a whole and has one-, two-, and three-year time limits (four including a one-year waiting period), though the state does give longer limits for those with greater employment difficulties and allows the clock not to start ticking until the recipient has been called by the employment agency and offered a slot. Earnings disregards are the least generous of those in our three states; it is a Work First state, and it has an official diversion policy. Illinois is a medium benefit state that has maintained the federal maximum of five years of benefits but allows families to stop the clock indefinitely by working 30 or more hours per week. Work requirements are not imposed as quickly in Illinois as in the other states, and the state has no official diversion policy.4
AVERAGE OUTCOMES FOR LEAVERS
We first report what our data say about the average outcomes of welfare leavers, in order to establish whether our data are showing the same results as past studies have shown. We go on to report our findings on averages for outcomes that are not often measured. After establishing that our data are consistent with those of past studies, we turn to a discussion of our findings on diversity around those averages.
Our survey has 1,262 women who report that they were on TANF at some point in the two years prior to interview (that is, from 1997 to 1999), of whom 329 were not on TANF at the time they were interviewed or the month before. We define these 329 women as conventional leavers because this is similar to the way past studies have generally defined what it means to leave welfare--to have been on welfare at some point in the past and to be off welfare at the interview date.5 The conventional leaving rate for our families is 28 percent--the percent of families on the rolls in the two-year period who have left by this definition.6
Our leavers were asked why they left welfare. The vast majority (65 percent) said that they left because of a job or because of high earnings. Another 14 percent said that they left because they were sanctioned, and another 6 percent said that they had reached a time limit of some kind. The remainder cited a variety of reasons for leaving--because of the availability of child support income, someone else in the household obtained a job, and other reasons.
At the interview, we asked leavers about their current labor market outcomes. We find that:
-
Sixty-three percent of women are employed.
-
Individual earnings are $511 per month, including the nonemployed, and $910 for those employed.
-
Hourly wage rates are typically $7.50.
-
Of those who work, 60 percent work full-time rather than part-time.
-
Thirty-six percent of the jobs had health insurance.
These figures are squarely in line with those reported in past studies, and thus our data are showing the same, relatively favorable, average outcomes for welfare leavers as have been found in the past.7
The first column of Table 1 shows the poverty rate and incomes of these conventionally defined leavers in the month prior to the interview. Both the level of overall household income and its composition reveal important new results:
-
Total household income is $1,031 per month, or about $12,400 annually.
-
Almost three-quarters (74 percent) of leavers are in poverty.8
-
The earnings of the leaver herself are only one-half of total household income.
-
Earnings and welfare income of others in the household constitute one-third of household income.
The contributions of others in the household are critical, for poverty rates would be much higher if the women leaving welfare had to rely on their own earnings alone.9
Households with welfare leavers rely heavily on other government aid. Almost 70 percent of households receive Medicaid and about the same percent live in subsidized housing. Nearly 40 percent receive Food Stamps, 31 percent receive WIC benefits, but only about 12 percent or less receive energy assistance, emergency food assistance, SSI, or clothing and other private charity goods.
DIVERSITY, TYPE ONE: DIFFERENCES BY EDUCATION, HEALTH, AND OTHER CHARACTERISTICS
Leavers differ along a wide number of socioeconomic characteristics that are associated with labor market opportunity, ability to work, and barriers to finding work. Among the many possible dimensions, we consider four that are well-known to be associated with the employment rates of adult women: the level of education, health status, age, and presence of young children in the household.
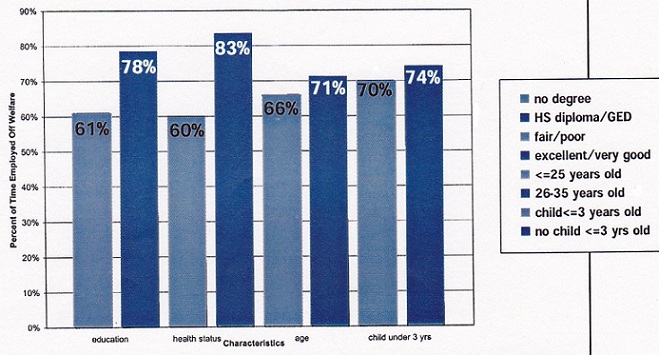
Figure 1 shows differences in percent-time-employed for leavers of different types, calculated as the percent of the months off welfare in the year prior to interview that the leaver was employed.10 Large differences are apparent for leavers with different levels of education and health:
-
Leavers without a high school diploma or a GED were employed 61 percent of the time compared to 78 percent for those with a diploma or GED.
-
Leavers in fair or poor health were employed 60 percent of the time compared to 83 percent for those in excellent or very good health.
The percent-time-employed varied less by age of the mother (66 percent for those 25 and under, 71 percent for those aged 26-35) and by the presence of young children (70 percent for those with children 0-3, 74 percent for those without children 0-3).
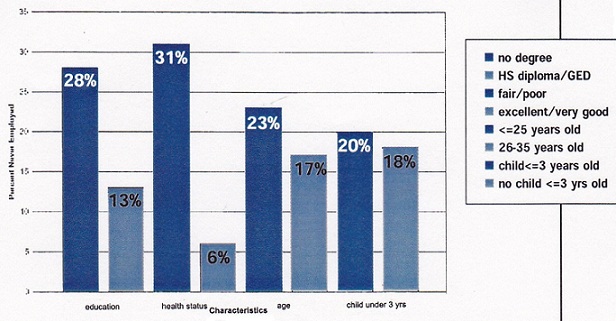
A better indicator of how many leavers are not successful in the labor market at all is the fraction of leavers who have never been employed the entire time they have been off TANF. In the year prior to the interview, as shown in Figure 2, 28 percent of less-educated leavers were never employed compared to only 13 percent of more-educated leavers. A high 31 percent of leavers who were in fair or poor health were never employed after leaving, compared to only 6 percent of those in excellent or very good health. Younger women and women in households with young children also are more likely not to have worked than older women and those in households without young children, although the differences are not as large in magnitude.
Income differences between leavers of different types are large, as shown in Table 2. Among the important differences are:
-
Leavers without a high school degree or GED have poverty rates of 91 percent, compared to 64 percent for those with a high school degree or GED, and leavers who are young have poverty rates of 83 percent compared to 68 percent for older women.
-
Earnings of less-educated leavers are only about one-half those of more educated leavers, and earnings of leavers in poor or fair health are likewise only about 50 percent of those of leavers in excellent or very good health.
The figures in Table 2 confirm what was found earlier about the relatively small differences in labor market outcomes of leavers who are young rather than old, or who have young children in the household. However, there are marked differences in the earnings of others in these households, which are higher for those leavers with lower earnings, and by other types of welfare income, which tend to be lower for those leavers who have lower earnings. Family sizes differ as well, a factor that is responsible for the relatively large differences in poverty rates for the different types of families.
Compensation for lower earnings of less-educated leavers comes from higher government aid received by both themselves and other members of the household, rather than from earnings of other household members, which are also lower in households with less-educated leavers than in households with more-educated leavers. Earnings of others in the household matter more for the other groups, however. For example, leavers in fair or poor health, leavers who are themselves young, and leavers in households with young children all live in households where other members bring in significantly more earned income than in households containing leavers in better health, who are older, and who do not have young children.11
DIVERSITY, TYPE TWO: SANCTIONED LEAVERS
Another important subgroup of leavers includes those women who were sanctioned when on welfare, either in part or in full. Past leaver studies have indicated that employment rates for sanctioned leavers are lower than for other leavers, but no one has painted a more general picture.12
As noted previously, 14 percent of leavers in our three cities reported leaving welfare because they were sanctioned.13 Another 6 percent of leavers reported that they had been sanctioned when previously receiving welfare even though they did not cite it as the reason they left the rolls. Leavers who report having been sanctioned while on TANF have very different employment and income experiences after leaving welfare than those who were not sanctioned:
-
Previously sanctioned leavers were employed 57 percent of the time they were off welfare in the 12 months prior to interview (regardless of the reason they left welfare), compared to 76 percent for those not previously sanctioned; 34 percent of the former group were never employed, compared to 14 percent of the latter group.
-
Only 47 percent of leavers previously sanctioned were employed at the interview date, compared to 68 percent of those not previously sanctioned.
-
Eighty-nine percent of previously sanctioned leavers were poor after leaving welfare, compared to 71 percent of leavers not previously sanctioned.
-
Monthly earnings of leavers previously sanctioned were $327, compared to $558 for those not previously sanctioned.
This evidence provides strong confirmation that women who are sanctioned while on welfare are a more disadvantaged group than those who are not sanctioned, and that sanctioned women, compared to women not sanctioned, have a more difficult time both in the labor market and in raising their household incomes above poverty after leaving TANF.
DIVERSITY, TYPE THREE: DEPENDENCY LEAVERS
The third type of diversity we examine is motivated by recent scholarly research on patterns of welfare receipt indicating that turnover rates on welfare are quite high--many women go on and off welfare fairly frequently. Some research has divided welfare recipients into three types: long-termers, who spend uninterrupted periods of time on welfare and rarely go off; short-termers, who only occasionally rely on welfare; and cyclers, who go on and off frequently and cannot develop a sustaining income off welfare.14 The third group, cyclers, may end up spending a great deal of time on welfare even though they are not on for long periods at any given time; they may therefore end up being dependent on welfare if dependency is defined as receiving welfare benefits for a large fraction of time, even if only in small increments.15
The implications of this research for the study of welfare leavers are two. First, frequent movements on and off the rolls make it difficult to determine when a woman actually leaves welfare. Past studies have included in the leaver category women who have left welfare but have come back on and gone off again. Moreover, women who have been off welfare for only a short period of time (e.g., two or three months) may not have truly freed themselves from welfare dependence for, given the high rates of return to welfare, they may be back on the rolls soon. Many of these leavers may only be cyclers. Second, many of the women who have left welfare may not have been on welfare for very long to begin with; most studies of welfare leavers do not restrict their samples to women who are long-term welfare recipients but rather include women who are on the rolls at any time. Consequently, many welfare leavers may actually be short-termers who were never heavily dependent on welfare.
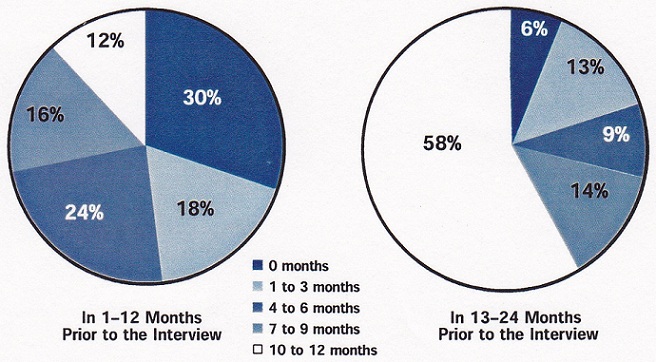
These two issues are illustrated in Figure 3, which shows how many of the conventional leavers have really left welfare in the sense of having demonstrated independence from the welfare system, as well as showing how many were relatively dependent in the first place. Figure 3 shows that only 30 percent had been off TANF for the full 12 months prior to the interview. Moreover, about one-quarter (28 percent, the sum of 16 percent and 12 percent) were on TANF for seven or more months out of the last 12. Thus a substantial fraction of these leavers have not become independent of TANF in anything more than a very short-term sense. In addition, many of these leavers were not heavily dependent on welfare in the year prior to that (i.e., 13 to 24 months prior to the interview date), for a high one-quarter (28 percent) were on TANF for six months or less over that period (see Figure 3). Consequently, a substantial fraction of leavers according to the conventional definition are short-term recipients who were not heavily dependent on welfare prior to leaving.
A NEW DEFINITION OF LEAVERS
To address these issues directly, we define a new type of leaver we call dependency leavers, who are women who have become significantly less dependent on welfare over time. We implement this definition with our data by terming a woman dependent on welfare if she receives benefits for more than six months in a year. Dependency leavers are then defined to be those women who were not dependent on TANF in the 12 months prior to the interview (i.e., who were on TANF for six months or less in that year) but who were dependent on welfare in the 12 months prior to that (i.e., who received TANF for more than six months in that year). By this definition, only one-half (48 percent) of conventional leavers are dependency leavers--that is, only one-half of leavers as usually defined actually moved from welfare dependency to relative independence from welfare.16
The leaving rate for dependency leavers--the fraction of those who were dependent on TANF but moved to relative independence--is 19 percent, considerably below the 28 percent leaving rate for conventional leavers. That fewer welfare dependent women have left TANF is not surprising, but the nearly 10-percentage-point difference is large and serves to emphasize the importance of not mistaking the average experience for the experiences of all welfare recipients.
In comparison to conventional leavers, dependency leavers have slightly worse labor market outcomes. In the 12 months prior to the interview:
-
Dependency leavers were employed for 66 percent of months off TANF, whereas conventional leavers were employed 72 percent of those months.
-
About 24 percent of dependency leavers were never employed while off TANF, compared to 18 percent of conventional leavers.
-
About 48 percent of dependency leavers were employed the entire time they were off TANF, compared to 56 percent of conventional leavers.
The hourly wage rates, percentage of people working full time rather than part time, and health insurance coverage of dependency leavers do not differ a great deal from those of conventional leavers (these are not shown in the tables or figures). Therefore, the primary labor market difference between conventional and dependency leavers is in the likelihood of being employed in the first place, which itself is modest in size, more than in the types of jobs obtained.
The income levels and sources of income differ much more, as shown in Table 1. Dependency leavers:
- Have monthly earnings that are almost 18 percent lower than conventional leavers;
- Are more heavily dependent on government aid from other welfare programs;
- Receive 23 percent less support from earnings of other members of the household than conventional leavers, although this is partly offset by higher welfare income of those members.
With their lower earnings, dependency leavers receive more government aid from other programs. But the lower earnings support they receive from other members of the household is a sign that dependency leavers come from households with less earning power in general than the households of conventional leavers.
CONCLUSIONS
In summary, in this brief we have gone beyond the experiences of the average welfare leaver to examine the diversity of outcomes of different types of leavers. We highlight four findings.
-
We find generally large differences in employment, household incomes, and poverty rates for leavers with differing social and economic characteristics. Those with greater levels of education, in good health, without young children, and who are not young themselves have done better than average. However, those with less education, in poor health, with young children, and who are young themselves have done worse than average, often significantly so.
-
We find that the earnings of leavers are only one-half of total household incomes on average. Moreover, there is significant variation across households in support from sources other than leaver earnings, particularly from other family members. Some leavers are in households where there is significant income support from other members of the household, either from earnings or welfare income of those members. Other leavers are in households with very little of this type of support. Unfortunately, those leavers who themselves have the most difficulty in the labor market often live in households where there is relatively little other support as well.
-
We find that women who have been previously sanctioned have much worse employment and income experiences after leaving welfare than those leavers who have not been sanctioned.
-
When we restrict our analysis to women who were heavily dependent on welfare prior to leaving (the group whom policy-makers most intended welfare reform to affect) and who have become relatively independent of welfare after leaving, we find some of their outcomes differ from those of conventional leavers. Nearly as many of these dependency leavers are employed as are conventional leavers, but the dependency leavers earn less, receive less earnings support from other household members, and depend more on government benefits. In addition, women who were heavily dependent on welfare are substantially less likely to leave welfare to begin with than are other welfare recipients.
The existence of significant numbers of women who have not done well after leaving welfare is a source of concern, especially in light of the strong economy, which makes the outcomes of these families probably the best they can be. These leavers deserve the attention of policy-makers who in the future will be considering modifications in welfare programs or who will be designing special programs to assist those off the rolls who are in greatest need.
--- --- --- --- --- --- --- --- ---
Thanks...The authors would like to acknowledge the contributions of the co-principal investigators of the Three City Study for repeated group discussions of the content of this report, which is a collaborative effort, as well as the contributions of the research associates who were most heavily involved in the discussions. They are Ronald Angel, Linda Burton, P. Lindsay Chase-Lansdale, Andrew Cherlin, William Julius Wilson, Rebekah Levine Coley, and James Quane. Valuable input to the report was also made by Juliane Baron, Alan Benjamin, Karen Bogen, Paula Fomby, Ruth Friedman, and Deborah Graefe.
STATE WELFARE POLICIES
Boston: Massachusetts is operating under its HHS waiver, which is approved through September 2005. Under its waiver plan, it has a time limit of two out of every five years, but relatively generous exemptions from those limits and fairly high cash benefits and income eligibility limits compared to the other two states. Massachusetts has no formal diversion policy but does have a family cap and provisions for both full and partial family sanctions.
Chicago: Illinois is operating under an approved PRWORA plan with an official five-year lifetime time limit but pays benefits out of state funds for all months in which recipients work or go to school for more than 30 hours per week, effectively stopping the clock. The state has cash benefit levels and income eligibility limits between those of Massachusetts and Texas but has the most generous earnings disregards of the three. Its sanction policy is less strict than that of Massachusetts, and it does not have a diversion policy. Illinois has the longest time period before work requirements are imposed (24 months).
San Antonio: Texas is also operating under HHS waiver authority. Texas has one-, two-, or three-year time limits (four including a one-year waiting period) assigned on the basis of employability, but it had no lifetime limit as of the time of our interviews (since then Texas has imposed the federal guideline of a five-year lifetime limit). The one-, two-, and three-year time limits do not begin until the recipient is offered an opening in the state employment program. The state has fairly low cash benefit levels and income eligibility limits as well as the least generous earnings disregards of our three states. Texas has less strict sanctions than the other two states and does not have a provision for a full family sanction, nor does it have a family cap. Unlike Illinois or Massachusetts, Texas has a diversion policy involving onetime payment and mandatory job search.
Welfare, Children, and Families: A Three City Study is an ongoing research project in Boston, Chicago, and San Antonio to evaluate the consequences of welfare reform for the well-being of children and families and to follow these families as welfare reform evolves. The study comprises three interrelated components: (1) a longitudinal in-person survey of approximately 2,500 families with children in low-income neighborhoods, about 40 percent of whom were receiving cash welfare payments when they were interviewed in 1999. Seventy-seven percent of the families have incomes below the poverty line. Seventy-three percent are headed by single mothers, and 23 percent are headed by two parents. They should be thought of as a random sample in each city of poor and near-poor families who live in low-income neighborhoods.17 Extensive baseline information was obtained on one child per household and his or her caregiver (usually the mother). The caregivers and children will be reinterviewed at 18-month intervals. In addition, at the 36-month mark, a second sample of about 1,250 families, focused primarily on young parents who are just coming of age and encountering the welfare system for the first time under the new rules, will be selected and interviewed. (2) an embedded developmental study of a subset of about 630 children age 2 to 4 in 1999 and their caregivers, consisting of videotaped assessments of childrens behaviors and caregiver-child interactions, observations of child-care settings, and interviews with fathers. (3) an ethnographic study of about 215 families residing in the same neighborhoods as the survey families who will be followed for 12 to 18 months, and periodically thereafter, using in-depth interviewing and participant observation. About 45 of the families in the ethnography include a child with a physical or mental disability. A detailed description of the research design can be found in Welfare, Children, and Families: A Three City Study. Overview and Design Report, available at http://www.jhu.edu/~welfare or in hardcopy upon request.
The principal investigators are Ronald Angel, University of Texas; Linda Burton, Pennsylvania State University; P. Lindsay Chast-Lansdale, Northwestern University; Andrew Cherlin, Johns Hopkins University; Robert Moffitt, Johns Hopkins University; and William Julius Wilson, Harvard University.
| FIGURE 1. Percent of Time Employed Off Welfare in Year Prior to Interview: Conventional Leavers |
 |
| FIGURE 2. Percent Never Employed When Off Welfare in Year Prior to Interview: Conventional Leavers |
 |
| FIGURE 3. Number of Months on TANF |
 |
| TABLE 1. Monthly Income of Leavers | ||
| Conventional Leavers | Dependency Leavers | |
| Total Household Income | $1,031 | $943 |
| Poverty Rate (%) | 74 | 78 |
| Earnings of Leaver | $511 | $420 |
| Food Stamps & Child Support of Leaver | $116 | $145 |
| Earnings of Others in Household | $242 | $187 |
| Welfare of Others in Household | %95 | $125 |
| Other | $67 | $66 |
| TABLE 2. Monthly Incomes of Leavers of Different Characteristics | ||||||||
| Education | Health Status | Age | Young Children | |||||
| Less than HS Degree | HS Degree or GED | Fair or Poor | Excellent or VeryGood | 25 or Under | 26 to 35 | Some 0 to 3 | None 0 to 3 | |
| Total Household Income | $825 | $1,158 | $976 | $1,182 | $936 | $1,114 | $1,052 | $1,013 |
| Poverty Rate (%) | 91 | 64 | 77 | 71 | 83 | 68 | 76 | 72 |
| Earnings of Leaver | $334 | $632 | $356 | $718 | $432 | $565 | $484 | $536 |
| Food Stamps & Child Support of Leaver | $132 | $104 | $104 | $110 | $100 | $168 | $99 | $135 |
| Earnings of Others in Household | $143 | $285 | $282 | $217 | $303 | $223 | $323 | $165 |
| Welfare of Others in Household | $151 | $75 | $174 | $47 | $58 | $130 | $81 | $110 |
| Other | $65 | $62 | $60 | $90 | $43 | $28 | $65 | $67 |
NOTES
-
The Clinton Administration has estimated the relative roles of welfare reform, the economy, and other factors in the caseload decline. For details see The Effects of Welfare Policy and the Economic Expansion on Welfare Caseloads: An Update (Washington: Council of Economic Advisors, 1999).
-
S. Brauner and P. Loprest, "Where Are They Now? What States' Studies of People Who Left Welfare Tell Us," ANF Paper Series A, No. A-32 (Washington: The Urban Institute, 1999).
-
The exact trends in caseloads and unemployment in our states are shown in our background report. R. Moffitt and J. Roff "The Diversity of Welfare Leavers: Background Paper" (Baltimore: Johns Hopkins University, 2000).
-
A diversion policy is a policy that gives new applicants a onetime payment or that requires a period of job search prior to receiving benefits, and hence seeks to "divert" families from coming onto welfare. Sanctions are penalties imposed by the welfare department for violation of rules, particularly failure to search or find work, but also failure to cooperate with paternity establishment or to comply with other rules. Earnings disregards are provisions that allow recipients to work and earn money without having their benefits heavily reduced because of the higher income that comes from the earnings. A Work First state is a state that requires new welfare recipients to begin work or some type of job search activity immediately upon acceptance onto the welfare rolls, without a delay of a few months or of two years, as required by federal legislation.
-
Many past studies have used welfare administrative data rather than interview data so there has not been an "interview date" to examine. These define leavers as those who have gone off welfare at least once at some point, even if they are back on welfare at a later date. Our interpretation of the conventional definition is close to that used in an Urban Institute leaver study, which had two-year retrospectives from a telephone interview. P. Loprest, "Families Who Left Welfare: Who Are They and How Are They Doing?" ANF Discussion Paper (Washington: The Urban Institute, 1999).
-
This 28 percent figure is not exactly equal to the ratio of 329 to 1,262 because the leaving rate definition uses survey weights and hence does not correspond exactly to figures obtained using the number of unweighted observations.
-
For a review of prior studies, see Brauner and Loprest, "Where Are They Now?"
-
These poverty rates would be smaller if income from the Earned Income Tax Credit (EITC) were included. However, no EITC income is received by those who do not work at all, since the credit is proportional to the amount of earnings.
-
However, contributions from relatives and friends outside the household (not shown in the table but included in "Other") are minor in amount. Consequently, we have no evidence that reliance on kin or the community outside the household can be expected to be a significant source of support for women who have left welfare.
-
This is a better measure of employment than the point-in-time employment rate at the interview date because it averages over more periods of time. For the leaver sample as a whole, the average percent-time-employed is 72 percent, slightly larger than the interview-date employment rate of 63 percent reported earlier.
-
Again, Table 2 does not include income from the Earned Income Tax Credit (EITC). However, for the purposes of Table 2, as well as the other differences discussed in this report, the inclusion of the EITC would magnify the differences in income after leaving welfare relative to what we show. This is because the EITC is geared to the level of earnings, and therefore those with lower earnings receive a smaller EITC subsidy. In addition, those who do not work at all after leaving welfare receive no subsidy at all.
-
Brauner and Loprest, "Where Are They Now?"
-
Our questionnaire obtained information on a concept broader than official sanctions, for we asked each woman whether she had had benefits reduced in full or in part because she "was not following the rules."
-
M.J. Bane and D. Ellwood, Welfare Realities: From Rhetoric to Reform (Cambridge: Harvard University Press, 1994).
-
P. Gottschalk and R. Moffitt, "Welfare Dependence: Concepts, Measures, and Trends," American Economic Review 84 (May 1994):38-42. Gottschalk and Moffitt also propose an income definition of dependence, i.e., a woman is dependent if more than a certain fraction of her total income comes from welfare. The Department of Health and Human Services uses this definition of welfare dependence as well. See Indicators of Welfare Dependence: Annual Report to Congress, March 2000 (Washington, D.C.: U.S. Department of Health and Human Services, 2000).
-
Varying the six-month cutoff up to seven, eight, or nine months does not materially affect any of the findings in this section on dependency leavers. For details see R. Moffitt and J. Roff, "The Diversity of Welfare Leavers: Background Paper" (Baltimore: Johns Hopkins University, 2000).
-
Families of different income levels and family structures were sampled at different rates, but we have survey weights which allow us to generalize our sample to the population of low-income single-mother and two-parent families living in low-income neighborhoods in the city as a whole. We employ these survey weights in all the tabulations reported here. For details on weights and sampling, see P. Winston, R. Angel, L. Burton, P. L. Chase-Lansdale, A. Cherlin, R. Moffitt, and W.J. Wilson, Welfare, Children, and Families: A Three City Study, Overview and Design Report (Baltimore: Johns Hopkins University, 1999).
REPORTS AVAILABLE
- The Diversity of Welfare Leavers
- Full HTML Version http://aspe.hhs.gov/daltcp/reports/2000/diverswl.htm
- Full PDF Version http://aspe.hhs.gov/daltcp/reports/2000/diverswl.pdf
- What Welfare Recipients Know About the New Rules and What They Have to Say About Them
- Full HTML Version http://aspe.hhs.gov/daltcp/reports/2000/whatwelf.htm
- Full PDF Version http://aspe.hhs.gov/daltcp/reports/2000/whatwelf.pdf
To obtain a printed copy of this report, send the full report title and your mailing information to:
U.S. Department of Health and Human ServicesOffice of Disability, Aging and Long-Term Care PolicyRoom 424E, H.H. Humphrey Building200 Independence Avenue, S.W.Washington, D.C. 20201FAX: 202-401-7733Email: webmaster.DALTCP@hhs.gov
RETURN TO:
Office of Disability, Aging and Long-Term Care Policy (DALTCP) Home [http://aspe.hhs.gov/_/office_specific/daltcp.cfm]Assistant Secretary for Planning and Evaluation (ASPE) Home [http://aspe.hhs.gov]U.S. Department of Health and Human Services Home [http://www.hhs.gov]