
U.S. Department of Health and Human Services
A Demographic and Attitudinal Profile of Buyers of the Federal Long-Term Care Insurance Program
LifePlans, Inc.
August 2004
PDF Version: http://aspe.hhs.gov/daltcp/reports/2004/buyprof.pdf (23 PDF pages)
This policy brief was prepared under contract between the U.S. Department of Health and Human Services (HHS), Office of Disability, Aging and Long-Term Care Policy (DALTCP) and LifePlans, Inc. For additional information about the study, you may visit the DALTCP home page at http://aspe.hhs.gov/_/office_specific/daltcp.cfm or contact the ASPE Project Officer, Hunter McKay, at HHS/ASPE/DALTCP, Room 424E, H.H. Humphrey Building, 200 Independence Avenue, SW, Washington, DC 20201. His e-mail address is: Hunter.McKay@hhs.gov.
I. BACKGROUND
One of the more ambitious proposals for encouraging growth in the private insurance market was the passage of the Long Term Care Security Act (Public Law 106-265). This act was passed in the summer of 2000 and was signed into law on September 19th of that year. It authorized the U.S. Office of Personnel Management (OPM) to contract for a long-term care (LTC) insurance program for federal employees. Medically underwritten coverage was made available to active federal employees and annuitants (civilian retirees), as well as active and retired members of the uniformed services. It was also made available to other qualified relatives, who would include current spouses of employees and annuitants, including surviving spouses of members and retired members of the uniformed services who are receiving a survivor annuity, adult children of living employees and annuitants, and parents, parents-in-law, and stepparents of living active employees. Because this coverage is medically underwritten, certain medical conditions prevented some people from being approved for coverage. OPM expected that, like the health and life insurance programs it administers, the Federal Long-Term Care Insurance Program (FLTCIP) would become the largest employer-sponsored LTC insurance program in the nation.
Naturally it was expected that implementation of the federal LTC program would spur additional interest and growth in the market. The program began in earnest in July of 2002, which constituted the beginning of the open enrollment period. The carriers underwriting the program -- John Hancock and MetLife -- formed a joint venture called Long Term Care Partners, LLC, which is devoted exclusively to administering the Program.
Long Term Care Partners conducted one of the largest LTC educational campaigns ever. More than one million people requested enrollment kits. As of August 2003, 273,000 applications had been received. About 64% of enrollees were active employees and spouses, 31% annuitants and their spouses, and another 5% surviving spouses, parents/in-laws and adult children. Thus, in relatively short order, the FLTCIP became the largest group programs in the United States. In part this was due to the significant marketing and enrollment activities including more than 2,100 educational meetings, briefings to human resources staff and outreach programs to affinity groups.
The large number of enrollments affords a unique opportunity to better understand the attitudes and perspectives of both working and retired individuals regarding LTC concerns, the importance of planning, and the role that insurance may (or may not) play in meeting the needs of disabled individuals. An examination of such attitudes can assist policymakers as well as insurers to better understand marketplace opportunities and barriers, and devise strategies to encourage growth in the market.
II. PURPOSE
The purpose of this project is to analyze survey data collected by Long Term Care Partners from members of the federal family regarding the LTC insurance offering available to them. The analysis focuses on the attitudes, opinions and motivations of both active employees and retirees who have enrolled in the program (buyers), those who have expressed an interest in the program but chosen not to enroll (non-buyers), and those who are members of the federal family but have not enrolled or expressed any interest in doing so (non-responders). As part of this project, we also compare the results to available data from other studies of non-federal buyers and non-buyers in both the individual and group markets. In this way we are able to determine the extent to which there are significant differences, which could influence both the marketing and future design of LTC insurance. Finally, we examine specific issues within each of he three sample groups.
This is the first in a series of data briefs based on the information collected from the three aforementioned surveyed groups. The analysis focuses on the attitudes, opinions and motivations of individuals who purchased policies. Where appropriate, we also compare these buyers to other individuals who have purchased private LTC insurance either in the individual or employer group markets. Relevant research questions we intend to answer in this brief include but are not limited to the following:
- What are the socio-demographic characteristics of active and retired buyers as well as individuals who were not accepted into the insurance program (declinees)?
- What are the principal factors motivating active and retired buyers to participate in the federal LTC insurance program?
- What is the attitudinal profile of active and retired buyers with respect to retirement planning, experience with LTC, attitudes about insurance, and knowledge of risk?
- What are the types of policies that these individuals have chosen and what process did they undertake as they approached the purchase decision?
- How do these buyers compare to those who have purchased either individual policies or other employer group policies?
III. METHOD AND SAMPLE
We used mail surveys to collect information from buyers. A buyer is someone who has purchased the insurance plan through the federal program and paid premiums beyond the free look period. Between the months of January 2003 and April 2003, roughly 2,700 surveys were mailed out to individuals who had enrolled in the federal program. About 63% of these individuals -- 1,756 respondents -- returned their surveys. This is a particularly high response rate for a mail survey. Of these, 642 were active employees and 1,114 were retirees. Once returned, these surveys were linked by a unique identifier to administrative data at Long Term Care Partners. This data contained information on the policy designs chosen by these buyers. The identifier was then stripped from the data file so that specific information could not be correlated to a specific individual.
IV. FINDINGS
A. Demographic Characteristics of Buyers
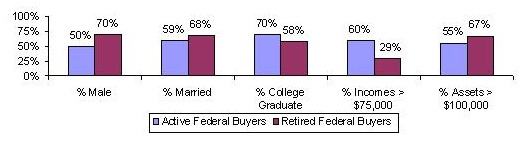
In the analysis that follows, we segment all data by work status. That is, we focus separately on active employees versus retirees. Figure 1 below summarizes key demographic characteristics of the sample of buyers.
| FIGURE 1: Socio-Demographic Characteristics of Federal Buyers |
 |
| SOURCE: Analysis of Buyer Data from Federal Long-Term Care Insurance Program, 2003. |
As shown, a much higher percentage of retirees is male and this reflects the fact that a large proportion of those who comprise the group of retired federal employees were made up of retired military. Most buyers are married and have a college education. While active employees are much more likely to have annual incomes greater than $75,000, a higher percentage of retirees have assets in excess of $100,000. This is not surprising given that retirees have had many more years to save. The average income of active buyers is about $86,000 and about $65,000 for retired buyers. The average age of active employees is 53 whereas the average age of retirees is 66.
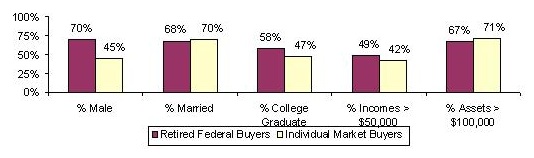
Figure 2 below shows differences between the federal retiree sample and a sample of buyers age 55 and over that purchased policies in the individual market in the year 2000.
| FIGURE 2: Socio-Demographic Characteristics of Retired Federal Buyers and Buyers in the Individual Market |
 |
| SOURCE: Analysis of Buyer Data from Federal Long-Term Care Insurance Program, 2003 and Health Insurance Association of America, 2000. |
Retired federal buyers tend to be more male, somewhat more educated, and have higher annual incomes than individual market buyers. On the other hand, a greater proportion of individual market buyers have asset levels greater than $100,000.
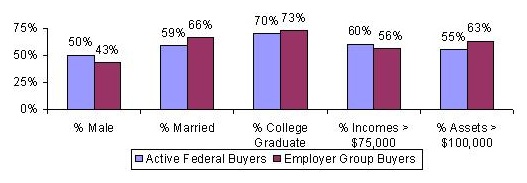
Figure 3 summarizes socio-demographic differences between active federal buyers and individuals purchasing group policies in other employer settings. Active federal buyers tend to have a higher proportion of males, are less likely to be married and have somewhat higher incomes than buyers derived from other employer groups. In contrast, a higher proportion of non-federal actives have assets in excess of $100,000.
| FIGURE 3: Socio-Demographic Characteristics of Active Federal Buyers and Employer Group Market |
 |
| SOURCE: Analysis of Buyer Data from Federal Long-Term Care Insurance Program, 2003 and Health Insurance Association of America, 2000. |
Declinees
The vast majority of individuals -- 85% -- applying for the federal program qualified to receive policies.1 Of the small number of individuals who were declined based on medical underwriting, most already had chronic conditions or heart- or bone-related issues that made them probable immediate or near term claimants. All individuals not accepted into the insurance program were given the opportunity to enroll in the Federal Service Package Program. For a flat annual fee, enrollees to this non-insurance option would have access to a care coordinator, general information and referral services and access to a discounted network of LTC providers and services.
As of October 2003, 2,092 individuals had enrolled in the service package program. The average age of these individuals was 73. Slightly more than half (52%) were female and 60% were married. Slightly more than four in five are annuitants.
It is also worth noting that a small number of individuals who were declined from the program due to health reasons were offered alternative insurance, that is, insurance with more limited benefits than those offered to the vast majority of applicants. Of the roughly 2,700 individuals who fell into this category, about 500 accepted this alternative insurance.
B. Attitudes and Opinions about Retirement Planning and Long-Term Care
Previous research indicates that individuals purchasing LTC insurance tend to be planners who think about their retirement, understand the LTC risk and take steps to secure their retirement (HIAA, 2000; ACLI, 2000). In these respects, federal buyers are no different. More than 80% have engaged in active retirement planning, have a good idea about how much they will need to save to live comfortably during retirement and are confident that they have enough money to meet their retirement needs. Almost four in five are also confident that they will have enough money to maintain their living standards during retirement. This applies to both the active and retired sample. Almost all buyers -- more than 90% -- have thought about how to pay for LTC expenses during retirement and similar percentages view having LTC insurance as an important component of a retirement plan.
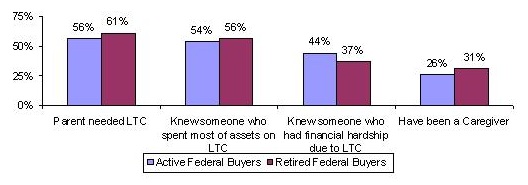
While there may be many reasons why an individual chooses to purchase insurance, knowledge about the potential impact of a long term care event would certainly play a role. Figure 4 below shows the experience that buyers have had with LTC.
| FIGURE 4: Experience with Long-Term Care among Federal Buyers |
 |
| SOURCE: Analysis of Buyer Data from Federal Long-Term Care Insurance Program, 2003. |
A majority of buyers in both groups have had parents that required LTC or knew someone who spent most of their assets paying for these services. Somewhat surprisingly, despite the difference in age between the two samples, differences regarding LTC experience are not that great. Between one-quarter and one-third of the buyer samples have had personal experience being a caregiver. Given the high level of awareness among the sample, it is therefore, not surprising that more than two-thirds of each sample believed that they were likely to need LTC at some time in the future. This is consistent with data from national surveys of buyers in the individual market and in the employer group market, most of whom -- 60% to 70% -- believe that they will need LTC sometime before they die.
C. The Purchase Process
Most buyers -- 58% of actives and 72% of retirees -- indicated that even before the federal offering they were considering purchasing LTC insurance. Moreover, between 30% and 40% offered that they were planning to buy the insurance even if the Federal Government had not offered it. While it is difficult to gauge the strength of this stated intention, it does suggest that even before the marketing campaign got under way, a meaningful proportion of future buyers had seriously explored the purchase of LTC insurance. This is not inconsistent with national surveys, which show that roughly 45% of individuals age 55 and over have at some point thought about or considered buying a policy (HIAA, 2000).
Most buyers -- 54% of active buyers and 67% of retirees -- did compare the federal program to other LTC insurance plans. When asked why they purchased the federal plan instead of another LTC insurance plan, 52% of actives and 62% of retirees indicated that federal sponsorship was the most important reason. About one in six also indicated that they felt that the federal program had lower rates, thus making it more attractive to them. Although not among the most important reasons, about two in five active buyers indicated that they felt it was easier to qualify for the federal program and slightly less than a third also felt it was important that the program was underwritten by Long Term Care Partners. Among retirees, lower rates, better benefits and the program underwriters were cited as important reasons to prefer the federal program over competing individual plans.
Most buyers had a relatively easy time with the application process. More than 90% found it easy to obtain an application, to understand the application and to complete the health questions. On the other hand, 15% found it difficult to read through all of the application materials. This may relate more to the quantity of information rather than the quality of the materials. Most married buyers discussed their purchase with their spouse and among active buyers, three-quarters also discussed their decision with their co-workers. Across both samples, spouses had the greatest influence on the purchase decision.
Program sponsors invested significant resources into the marketing of the program. Educational meetings, mailings, articles, satellite broadcasts, and advertisements were some of the methods used to reach people. Buyers were asked whether they had been exposed to some of these activities and which they felt were particularly useful. Among active buyers, visiting the website (69%), reading program brochures (89%) and advertisements (45%), and attending educational meetings (34%) were viewed as helpful. While trends are similar among retirees, far fewer -- 40% -- visited the website.
There are many reasons why individuals purchase LTC insurance. Some people want to avoid being a burden on family and friends, others want to have the financial wherewithal to choose certain providers, whereas others want to assure living standards. Figure 5 below summarizes the single most important reasons why individuals in the federal and non-federal markets purchased their LTC insurance policy.
| FIGURE 5: Single Most Important Reason for Purchasing Long-Term Care Insurance among Federal and Non-Federal Buyers |
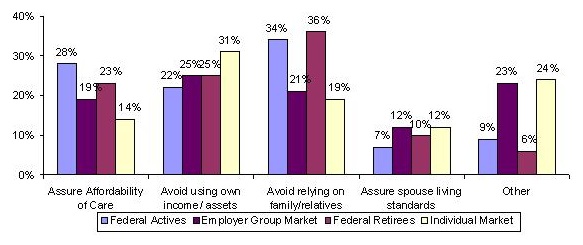 |
| SOURCE: Analysis of Buyer Data from Federal Long-Term Care Insurance Program, 2003. |
As shown, among active employees, the desire to avoid being a burden on family and friends is a primary reason for purchase among federal employees; in contrast, individual buyers in the non-federal employee group market are most likely to cite protecting income and assets as the primary purchase reason. The same pattern persists among retirees and individual buyers. The key point is that there are a variety of reasons that are related to the purchase decision in the federal market as well as other markets.
D. Policy Designs
Individuals interested in purchasing the federal LTC insurance plan could choose among four pre-packaged plans or they could choose to customize their own plan. The four pre-packaged plans included (A) a facilities-only plan that pays $100 per day for three years; (B) a comprehensive plan that pays $100 per day for three years; (C) a comprehensive plan paying $150 per day for five years; and (D) a comprehensive plan paying $150 per day for an unlimited benefit period. All of these plans had a waiting period of 90 days and individuals could choose to purchase automatic benefit increases or a guaranteed future purchase option. The custom plans allowed individuals to choose daily benefit amounts in increments of $25, whether the plan covered facility care only or a comprehensive set of services, a 30 or 90 day waiting period and benefit period choices of three, five or unlimited durations. There was also an option to have benefits calculated on a weekly basis. Again, individuals could choose to purchase automatic benefit increases or a guaranteed future purchase option.
Table 1 summarizes the policy designs chosen by active and retired buyers of the federal program as well as by buyers in the non-federal individual market and the employer group market. As shown, the clear trend across all groups is to purchase comprehensive coverage. Fewer than one in five purchase facility-only policies. Also, a smaller percentage of federal buyers purchase unlimited duration policies than buyers in other markets. In fact, federal buyers are only half as likely to purchase policies with unlimited durations. On the other hand, a much higher percentage -- 72% of federal actives and 62% of federal retirees -- chose automatic benefit increases as part of their policy design. The difference is particularly pronounced in the retiree market where three times as many federal buyers chose automatic benefit increases compared to buyers in the individual market. Potentially, these buyers traded off unlimited duration for more protection of daily benefit levels. Given the three-year difference in data collection times -- 2003 for federal buyers and 2000 for non-federal buyers -- it seems that daily benefit amounts are roughly comparable. Daily benefits are higher among actives than they are among retirees.
| TABLE 1: Policy Design Characteristics Chosen by Federal and Non-Federal Buyers of Long-Term Care Insurance | ||||
| Policy Features | Active Federal Buyers | Buyers in the Employer Group Market1 | Retired Federal Buyers | Buyers in the Individual Market |
| Policy Type | ||||
| Comprehensive | 93% | 97% | 85% | 77% |
| Facility Only | 7% | 3% | 15% | 14%2 |
| Duration of Coverage | ||||
| 3 years | 41% | 26% | 62% | 22% |
| 5 years | 40% | 25%3 | 23% | 10% |
| Lifetime | 19% | 39% | 15% | 30% |
| Elimination Period | ||||
| 30 days | 15% | 36% | 8% | 16% |
| 90 days | 85% | 56% | 92% | 55% |
| Inflation Protection | ||||
| Automatic | 72% | 40% | 62% | 22% |
| Future Purchase | 28% | 48% | 38% | ---4 |
| Average Daily Benefit Amount | $135 | $124 | $120 | $109 |
| Up to $100 | 3% | 8% | 3% | 25% |
| $100 to $149 | 40% | 61% | 59% | 55% |
| $150 and over | 57% | 31% | 38% | 20% |
| Average Premium | $1,206 | $722 | $1,661 | $1677 |
| Up to $500 | 16% | 43% | 6% | 5% |
| $500-$999 | 30% | 35% | 22% | 24% |
| $1,000-$1,499 | 24% | 13% | 27% | 26% |
| $1,500-$1,999 | 17% | 6% | 17% | 18% |
| $2,000 or greater | 13% | 3% | 28% | 27% |
SOURCE: Analysis of Buyer Data from Federal Long-Term Care Insurance Program, 2003 and Health Insurance Association of American, 2000. NOTES: Data from the non-federal buyers was derived from 3,212 individuals in the employer group market and 5,407 individual buyers age 55 and over. Data was for policies sold in 2000.
| ||||
Finally, premiums are strikingly similar among retirees and buyers in the individual market but markedly different among actives. In fact, premiums are 67% higher among active federal buyers compared to buyers in the employer group market. In large part this is a function of the fact that more than twice as many federal buyers have automatic benefit increase options built into their policies than their counterparts in the employer group market. It also reflects more recent experience data related to lapse rates of LTC insurance policies and claims data, which have a major impact on policy premiums.
Because LTC insurance has a variety of features that affect levels of coverage as well as policy premiums, it is often seen as a complicated product that may be difficult to understand. Buyers were asked about certain specific features of their policy. Their answers were then compared to what was on record as having been purchased. About 90% correctly identified whether their policy covered home care, slightly more than 80% correctly knew whether they had chosen automatic inflation protection and 77% knew whether they had unlimited coverage. Taken together, however, the data suggests that a meaningful proportion of buyers were uncertain of at least one feature of their purchase decision. About one-third of active buyers and 38% of retirees did not know at least one of their policy design features.
V. CONCLUSIONS
While there are many similarities between buyers in the federal and non-federal markets, there are some important differences. There are fewer married federal buyers. This may reflect the fact that in the individual and employer group-markets many companies offer premium discounts for married couples who purchase policies. This tends to attract a higher percentage of married applicants. Also, in both the active and retired market, federal buyers tend to have higher levels of income and lower levels of assets. This may explain why protecting assets is a primary purchase reason among non-federal employees whereas among federal buyers, the desire to avoid being a burden on family and friends is the primary purchase motivation.
Clearly, federal buyers have a greater likelihood of having more of their LTC expenses covered by insurance than do non-federal buyers. This is because of the extremely high proportion of buyers who purchased automatic benefit increases. This assures that even as service costs increase, the purchasing power of insurance benefits will not decline. Given that this point was emphasized during the marketing campaign, it would appear to have been very successfully communicated. It appears that overall experience with LTC, both knowing someone who needed care and/or knowing someone who used significant monetary resources for LTC may have prepared those who purchase. Finally, use of the Internet appears to have played a major and significant role in the purchase process, even among federal retirees. This is instructive for other affinity or employer-groups that are interested in implementing an LTC insurance program.
REFERENCES
American Council of Life Insurers (2001). Long-Term Care Insurance at Work. The Retirement Link and Employer Perspectives. Research Findings. Washington, D.C. July.
American Council of Life Insurers (2001). Making the Retirement Connection. The Growing Importance of Long-Term Care Insurance in Retirement Planning. Research Findings. Washington, D.C. March.
Cohen A. M. and J. S. Miller (2000), Long-Term Care Insurance and Retirement Planning: The Road to Retirement Security, LifePlans, Inc. Waltham, MA.
Health Insurance Association of America (2000), Who Buys Long-Term Care Insurance in 2000? A Decade of Study of Buyers and Nonbuyers, Washington, D.C.
Health Insurance Association of America (1990), Who Buys Long-Term Care Insurance? Research Findings. Washington, D.C.
Health Insurance Association of America (1995), Who Buys Long-Term Care Insurance? 1994-95 Profiles and Innovations in a Dynamic Market, Washington, D.C.
NOTES
-
Applicants had to answer a series of health related questions when applying for the insurance. A decline rate of 20% in the individual LTC insurance market is about the industry average.
APPENDIX
Notes for Tables
Unless otherwise indicated, the analysis of the data is based on the responses of 6,870 active and 487 retired non-responders.
All significance tests are based on 5% level or better. Notations for significance are as follows: If one category out of three contains the symbol (*), then the category starred is statistically different from each of the other two categories, but the non-starred categories are not different from each other. If two categories out of the three contain the symbol (*), then those two categories are statistically different from each other, but each of those categories is not statistically different from the third one. If all three categories contain the symbol (*), then all three are statistically different from each other.
Unless otherwise specified, only the response category that has a notation of significance was tested against all other categories. In some cases, it was determined that a combination of categories would be tested. These are indicated in the footnotes. It also may be the case that if categories were or were not combined, it could change the results of the test of significance.
Unless otherwise indicated, only the first response category (i.e., strongly agree, very important, very likely, etc.) or the yes response was tested. Therefore, if there are no notations for significance, the test was not significant at the 5% level.
| TABLE A-1: Socio-Demographic Characteristics of Active and Retired Buyers1 | ||
| Socio-Demographic Characteristics | Active Buyers | Retired Buyers |
| Average age | 53 | 66 |
| Less than 50 | 27% | 1% |
| 50 to 54 | 25 | 3 |
| 55 to 59 | 26 | 14 |
| 60 to 64 | 15 | 24 |
| 65 and over | 7 | 58 |
| Gender | ||
| Male | 50 | 70 |
| Female | 50 | 30 |
| Marital status | ||
| Never Married | 17 | 9 |
| Married | 59 | 68 |
| Divorced/separated | 18 | 10 |
| Widowed | 4 | 12 |
| Domestic Partner | 2 | 1 |
| Presence of children living within 25 miles | ||
| Yes | 42 | 51 |
| No | 58 | 49 |
| Education level | ||
| Less than high school graduate | 0 | 1 |
| High school graduate | 6 | 14 |
| Technical/trade/business school | 4 | 5 |
| Some college | 20 | 22 |
| College graduate2 | 37 | 30 |
| Graduate degree | 33 | 28 |
| Average income3 | $86,929 | $64,796 |
| Less than $15,000 | 0 | 1 |
| $15,000 to $24,999 | 0 | 3 |
| $25,000 to $34,999 | 3 | 8 |
| $35,000 to $39,999 | 2 | 9 |
| $40,000 to $49,999 | 8 | 15 |
| $50,000 to $59,999 | 9 | 15 |
| $60,000 to $69,999 | 10 | 12 |
| $70,000 to $74,999 | 8 | 8 |
| $75,000 to $99,999 | 23 | 16 |
| $100,000 to $124,999 | 15 | 7 |
| $125,000 or more | 22 | 6 |
| Average liquid assets3 | $201,176 | $209,405 |
| Less than $10,000 | 7 | 4 |
| $10,000 to $19,999 | 3 | 3 |
| $20,000 to $29,999 | 5 | 3 |
| $30,000 to $49,999 | 10 | 7 |
| $50,000 to $74,999 | 13 | 9 |
| $75,000 to $99,999 | 7 | 7 |
| $100,000 to $124,999 | 8 | 8 |
| $125,000 to $149,999 | 6 | 6 |
| $150,000 to $199,999 | 9 | 9 |
| $200,000 to $249,999 | 10 | 7 |
| $250,000 and above | 22 | 37 |
| Home ownership | ||
| Yes | 90 | 92 |
| No | 10 | 8 |
| ||
| TABLE A-2: Attitudes and Opinions About Retirement Planning and Long-Term Care Among Active and Retired Buyers1 | ||
| Attitudes and Opinions | Active Buyers | Retired Buyers |
| Done retirement planing | ||
| Yes | 86% | 87% |
| No | 14 | 13 |
| Determnied how much to save to live comforably in retirement | ||
| Yes, a definite sense2 | 24 | 28 |
| Yes, a general sense | 56 | 58 |
| No | 19 | 14 |
| Do not plan to retire | 1 | |
| Confident that there is enough money to live comfortably in retirement | ||
| Very confident | 62 | 32 |
| Somewhat confident | 12 | 59 |
| Not very confident | 3 | 8 |
| Not at all confident | 2 | 1 |
| Do not plan to retire | ||
| Standard of living during retirement will be: | ||
| Better than during working years | 8 | 18 |
| Same as working years | 70 | 71 |
| Worse than during working | 20 | 11 |
| Do not plan to retire | 2 | |
| Thought given to paying for LTC expenses | ||
| A great deal | 57 | 66 |
| Some | 33 | 32 |
| Not much thought | 8 | 2 |
| No thought at all2 | 2 | 0 |
| How important is LTC insurance to retirement planning | ||
| Very important | 57 | 59 |
| Somewhat important | 38 | 39 |
| Not very important | 4 | 2 |
| Not at all important | 0 | 0 |
| Have not started planning | 1 | 0 |
| I worry how to pay for LTC3 | ||
| Strongly agree | 16 | 17 |
| Agree | 42 | 52 |
| Disagree | 32 | 26 |
| Strongly disagree | 10 | 5 |
| It is important to plan now for the possibility of needing LTC services in the future | ||
| Strongly agree | 51 | 48 |
| Agree | 44 | 51 |
| Disagree | 3 | 1 |
| Strongly disagree | 2 | 0 |
| LTC insurance programs sold today will cover the cost of LTC services needed in the future | ||
| Strongly agree | 9 | 10 |
| Agree | 67 | 69 |
| Disagree | 21 | 19 |
| Strongly disagree | 3 | 2 |
| How would LTC costs be paid3 | ||
| Medicaid | 3 | 2 |
| Medicare | 9 | 6 |
| Medigap Supplement Policy | 1 | 1 |
| Own health insurance or retiree health care plan | 28 | 18 |
| Own income | 36 | 62 |
| Children will help pay | 1 | 0 |
| Other | 4 | 2 |
| LTC insurance | ||
| Don't know | 18 | 9 |
| ||
| TABLE A-3: Experience with Long-Term Care Among Active and Retired Buyers | ||
| Experiences with LTC | Active Buyers | Retired Buyers |
| Respondent needed LTC | ||
| Yes | 1% | 1% |
| No | 99 | 99 |
| Spouse needed LTC | ||
| Yes | 2 | 3 |
| No | 98 | 97 |
| Parent needed LTC | ||
| Yes | 56 | 61 |
| No | 44 | 39 |
| Close friend needed LTC | ||
| Yes | 8 | 11 |
| No | 92 | 89 |
| The respondent has been a caregiver | ||
| Yes | 26 | 31 |
| No | 74 | 69 |
| The respondent knew someone who used most of his/her assets to pay for LTC | ||
| Yes | 54 | 56 |
| No | 46 | 44 |
| The respondent has experienced financial hardship as a result of caring for an elderly relative | ||
| Yes | 8 | 5 |
| No | 92 | 95 |
| The respondent knew someone who has experienced financial hardship as a result of caring for an elderly relative | ||
| Yes | 44 | 37 |
| No | 56 | 63 |
| TABLE A-4: Self-Assessed Risk of Needing LTC Among Active and Retired Buyers and Views About LTC Coverage of Costs | ||
| Type of LTC | Active Buyers | Retired Buyers |
| How likely is it that: | ||
| a) the respondent thinks he/she will need help with everyday activities like bathing and dressing | ||
| Very likely | 11% | 8% |
| Likely | 16 | 17 |
| Somewhat likely | 40 | 45 |
| Not very likely | 26 | 24 |
| Not at all likely | 7 | 6 |
| b) the respondent thinks he/she will need home care services for more than three months | ||
| Very likely | 11 | 7 |
| Likely | 19 | 18 |
| Somewhat likely | 42 | 47 |
| Not very likely | 22 | 22 |
| Not at all likely | 6 | 6 |
| c) the respondent thinks he/she will need nursing home care for more than three months | ||
| Very likely | 11 | 6 |
| Likely | 16 | 16 |
| Somewhat likely | 39 | 44 |
| Not very likely | 25 | 27 |
| Not at all likely | 9 | 7 |
| d) the respondent thinks he/she will need care provided in an assisted living facility for more than three months | ||
| Very likely | 14 | 9 |
| Likely | 20 | 20 |
| Somewhat likely | 38 | 45 |
| Not very likely | 21 | 20 |
| Not at all likely | 7 | 6 |
| What % of your expenses do you expect your LTC insurance to pay | ||
| 100% | 12 | 8 |
| 61%-99% | 68 | 68 |
| 40%-60% | 17 | 20 |
| 35%-39% | 3 | 4 |
| TABLE A-5: Decision Making Process of Active and Retired Buyers | ||
| Decision Making Process | Active Buyers | Retired Buyers |
| I considered buying LTC insurance prior to the federal offering | ||
| Yes | 58% | 72% |
| No | 42 | 28 |
| I would have bought LTC insurance if the Federal Government had not offered it | ||
| Yes | 33 | 42 |
| No | 17 | 13 |
| Not sure | 50 | 45 |
| I discussed LTC insuarnce purchase with:1 | ||
| a) spouse | ||
| Yes | 92 | 94 |
| No | 8 | 6 |
| b) children | ||
| Yes | 43 | 50 |
| No | 57 | 50 |
| c) HR officer | ||
| Yes | 16 | 2 |
| No | 84 | 98 |
| d) colleagues | ||
| Yes | 76 | 34 |
| No | 24 | 66 |
| e) financial planner | ||
| Yes | 26 | 27 |
| No | 74 | 73 |
| f) other relative | ||
| Yes | 62 | 53 |
| No | 38 | 47 |
| g) insurance agent | ||
| Yes | 17 | 16 |
| No | 83 | 84 |
| ||
| TABLE A-6: Experience with the Application Process Among Active and Retired Buyers | ||
| Experience with the Application Process | Active Buyers | Retired Buyers |
| How easy/difficult was the application process | ||
| Very easy | 57% | 37% |
| Easy | 40 | 59 |
| Difficult | 3 | 4 |
| Very difficult | 0 | 0 |
| Was the following easy/difficult for you: | ||
| a) getting an application1 | ||
| Easy to get an application | 98 | 99 |
| Difficult to get an application | 2 | 1 |
| b) understanding the application1 | ||
| Easy to understand the application | 94 | 94 |
| Difficult to understand the application | 6 | 6 |
| c) answering health questions1 | ||
| Easy to answer health questions | 98 | 92 |
| Difficult to answer health questions | 2 | 8 |
| d) reading the application materials1 | ||
| Easy to read the application materials | 84 | 85 |
| Difficult to read the application materials | 16 | 15 |
| Easy/difficult to obtain answers to questions about the federal program | ||
| Very easy | 32 | 34 |
| Easy | 62 | 62 |
| Difficult | 5 | 3 |
| Very difficult | 1 | 1 |
| ||
| TABLE A-7: Exposure to Promotional Activities Among Active and Retired Buyers1 | ||
| Promotional Activities | Active Buyers | Retired Buyers |
| Did you do any of the following: | ||
| a) talk to colleagues about the federal program | ||
| Did not talk to colleagues | 31% | 72% |
| Did talk to colleagues | 69 | 28 |
| Found it to be helpful | 72 | 79 |
| Did not find it to be helpful | 28 | 21 |
| b) talk to human resource representative | ||
| Did not talk to human resource representative | 83 | 97 |
| Did talk to human resource representative | 17 | 3 |
| Found it to be helpful | 82 | 90 |
| Did not find it to be helpful | 18 | 10 |
| c) read Get Smart About Your Future | ||
| Did not read Get Smart About Your Future | 27 | 28 |
| Did not know about Get Smart About Your Future | 7 | 6 |
| Did read Get Smart About Your Future | 66 | 66 |
| Found it to be helpful | 95 | 97 |
| Did not find it to be helpful | 5 | 3 |
| d) read advertisements | ||
| Did not read advertisements | 42 | 36 |
| Did not know about the advertisements | 8 | 4 |
| Did read advertisements | 50 | 60 |
| Found it to be helpful | 90 | 94 |
| Did not find it to be helpful | 10 | 6 |
| e) visit websites describing the federal program | ||
| Did not visit websites describing the federal program | 26 | 54 |
| Did not know about the websites describing the federal program | 3 | 4 |
| Did visit websites describing the federal program | 71 | 42 |
| Found it to be helpful | 98 | 96 |
| Did not find it to be helpful | 2 | 4 |
| f) call toll-free number | ||
| Did not call a toll-free number | 61 | 55 |
| Did not know about the toll-free number | 4 | 2 |
| Did call a toll-free number | 35 | 43 |
| Found it to be helpful | 94 | 98 |
| Did not find it to be helpful | 6 | 2 |
| g) read newspaper articles | ||
| Did not read newspaper articles | 58 | 58 |
| Did not know about the newspaper article | 8 | 5 |
| Did read newspaper articles | 34 | 37 |
| Found it to be helpful | 89 | 92 |
| Did not find it to be helpful | 11 | 8 |
| h) read general brochures | ||
| Did not read general brochures | 14 | 12 |
| Did not know about the general brochures | 1 | 1 |
| Did read general brochures | 85 | 87 |
| Found it to be helpful | 97 | 98 |
| Did not find it to be helpful | 3 | 2 |
| ||
| TABLE A-8: Reasons for Planning and Buying the Federal Program: Active and Retired Buyers | ||
| Reasons for Buying | Active Buyers | Retired Buyers |
| Single most important reason for buying the FLTCIP | ||
| Avoid using own income | 22% | 25% |
| Assure that care is affordable | 28 | 23 |
| Assure greater freedom in choosing service providers | 5 | 3 |
| Avoid having to rely on relatives for care | 19 | 17 |
| Avoid being a burden on family | 15 | 19 |
| Assure that spouses standard of living will not decline if individual needs care | 7 | 10 |
| Avoid relying on Medicaid | 2 | 2 |
| Other | 2 | 1 |
| What was the motivation for planning for LTC: | ||
| a) seeing someone not prepare and then struggle to pay for services | ||
| Yes | 18* | 11 |
| No | 82 | 89 |
| b) realizing that time is running out to prepare for future needs | ||
| Yes | 23* | 35 |
| No | 77 | 65 |
| c) encouragement from someone who is trusted | ||
| Yes | 13 | 13 |
| No | 87 | 87 |
| d) receiving information/educational materials about LTC | ||
| Yes | 30* | 41 |
| No | 70 | 59 |
| e) easy to do since offered at (former) work | ||
| Yes | 39* | 21 |
| No | 61 | 79 |
| f) had personal experience caring for someone with LTC needs | ||
| Yes | 17 | 16 |
| No | 83 | 84 |
| How important was the Federal Governments sponsorship to the purchase decision | ||
| Very important | 60* | 69 |
| Somewhat important | 35 | 29 |
| Not very important | 4 | 2 |
| Not at all important | 1 | 0 |
| How important was the abbreviated/less restrictive underwriting to the purchase decision | ||
| Very important | 35* | 68 |
| Somewhat important | 38 | 31 |
| Not very important | 23 | 1 |
| Not at all important | 4 | 0 |
| TABLE A-9: Comparison of FLTCIP to other programs Among Active and Retired Buyers | ||
| Reasons for Buying | Active Buyers | Retired Buyers |
| Was the FLTCIP program compared to other programs | ||
| Yes | 54%* | 67% |
| No | 46 | 33 |
| Why was the FLTCIP purchased instead of a different program | ||
| a) lower rates | ||
| Yes | 31* | 44 |
| No | 69 | 56 |
| b) better benefits | ||
| Yes | 25* | 33 |
| No | 75 | 67 |
| c) recommended by others | ||
| Yes | 9 | 7 |
| No | 91 | 93 |
| d) easier to qualify | ||
| Yes | 40* | 18 |
| No | 60 | 82 |
| e) easier to get benefits | ||
| Yes | 15* | 7 |
| No | 85 | 93 |
| f) easier to understand coverage | ||
| Yes | 22 | 21 |
| No | 78 | 79 |
| g) Federal Government sponsorship | ||
| Yes | 74* | 84 |
| No | 26 | 16 |
| h) underwritten by Long Term Care Partners | ||
| Yes | 28* | 34 |
| No | 72 | 66 |
| TABLE A-10: Do Buyers Know What They Are Buying: Active and Retired Buyers | ||
| Policy Features | Active Buyers | Retired Buyers |
| Does your current FLTC plan cover the following: | ||
| a) Home care services | ||
| % of people who know that their policy covers home care services | 91% | 90% |
| % of people who did not know that their policy covers home care services | 9 | 10 |
| b) Automatic compound inflation | ||
| % of people who know that their policy has an automatic compound inflation option | 84 | 83 |
| % of people who did not know that their policy has an automatic compound inflation option | 16 | 17 |
| c) Unlimited benefit period | ||
| % of people who know that their policy has an unlimited benefit period | 77 | 77 |
| % of people who did not know that their policy has an unlimited benefit period1 | 23 | 23 |
| % of people who believed they had unlimited coverage, but had coverage for 3 years | 3 | 5 |
| % of people who believed they had unlimited coverage, but had coverage for 5 years | 4 | 3 |
| % of people who believed they did not have unlimited coverage, but do have it | 1 | 0 |
| % of people who are unsure of what type of coverage they have | 15 | 15 |
| d) % of people who did not know at least one of the three features (presented above) about their policies | 32* | 38 |
| ||
| TABLE A-11: Characteristics of Long-Term Care Insurance Policies Bought Through the Federal Program | ||
| Policy Characteristics | Active Buyers | Retired Buyers |
| Duration | ||
| 3 years | 41% | 62% |
| 5 years | 40 | 23 |
| Unlimited | 19* | 15 |
| Policy type | ||
| Comprehensive | 93* | 85 |
| Facility Only | 7 | 15 |
| Benefit amount | ||
| Daily | 89 | 92 |
| Weekly | 11 | 8 |
| Elimination period | ||
| 30 days | 15 | 8 |
| 90 days | 85* | 92 |
| Inflation protection | ||
| Future purchase option | 28 | 38 |
| Automatic compound inflation | 72* | 62 |
| Average daily benefit amount | $135* | $120 |
| Up to $100 | 3 | 3 |
| $100-$149 | 40 | 59 |
| $150-$199 | 50 | 36 |
| Greater than $200 | 7 | 2 |
| Average annual premium | $1,206* | $1,661 |
| Up to $500 | 16 | 6 |
| $500-$999 | 30 | 22 |
| $1,000-$1,499 | 24 | 27 |
| $1,500-$1,999 | 17 | 17 |
| Greater than $2,000 | 13 | 28 |
| ||
LONG-TERM CARE INSURANCE FOR THE FEDERAL FAMILY: A STUDY OF BUYERS, NON-BUYERS AND NON-RESPONDENTS REPORTS AVAILABLE
- A Comparison of Demographic and Attitudinal Characteristics Among Active and Retired Buyers, Non-Buyers and Non-Responders to the Federal Long-Term Care Insurance Program
- HTML http://aspe.hhs.gov/daltcp/reports/charcom.htm
- PDF http://aspe.hhs.gov/daltcp/reports/charcom.pdf
- A Demographic and Attitudinal Profile of Buyers of the Federal Long-Term Care Insurance Program
- HTML http://aspe.hhs.gov/daltcp/reports/2004/buyprof.htm
- PDF http://aspe.hhs.gov/daltcp/reports/2004/buyprof.pdf
- A Demographic and Attitudinal Profile of Non-Buyers of the Federal Long-Term Care Insurance Program
- HTML http://aspe.hhs.gov/daltcp/reports/nonbuyprof.htm
- PDF http://aspe.hhs.gov/daltcp/reports/nonbuyprof.pdf
- A Demographic and Attitudinal Profile of Non-Responders of the Federal Long-Term Care Insurance Program
- HTML http://aspe.hhs.gov/daltcp/reports/nonresprof.htm
- PDF http://aspe.hhs.gov/daltcp/reports/nonresprof.pdf
- Marketing Activities: A Comparative Analysis of Engagement and Participation Among Buyers, Non-Buyers and Non-Responders of the Federal Long-Term Care Insurance Program
- HTML http://aspe.hhs.gov/daltcp/reports/markact.htm
- PDF http://aspe.hhs.gov/daltcp/reports/markact.pdf
- Multivariate Analysis of Buyers and Non-Buyers of the Federal Long-Term Care Insurance Program
- HTML http://aspe.hhs.gov/daltcp/reports/2004/FLTCIanal.htm
- PDF http://aspe.hhs.gov/daltcp/reports/2004/FLTCIanal.pdf
- What We Know About Buyers and Non-Buyers of Private Long-Term Care Insurance: A Review of Studies
- HTML http://aspe.hhs.gov/daltcp/reports/LTCIlr.htm
- PDF http://aspe.hhs.gov/daltcp/reports/LTCIlr.pdf
LONG-TERM CARE INSURANCE FOR THE FEDERAL FAMILY: ANALYSIS OF FOLLOW-UP SURVEY DATA REPORTS AVAILABLE
- A Comparative Analysis of the Socio-Demographic and Attitudinal Characteristics of Active Buyers and Non-Buyers of Long-Term Care Insurance in the Federal, Private and Public Sectors
- HTML http://aspe.hhs.gov/daltcp/reports/LTCIchar.htm
- PDF http://aspe.hhs.gov/daltcp/reports/LTCIchar.pdf
- Does Geographic Location Make a Difference? A Comparative Analysis of the Socio-Demographic and Attitudinal Characteristics of Active Buyers and Non-Buyers of the Federal Long-Term Care Insurance Program
- HTML http://aspe.hhs.gov/daltcp/reports/FLTCIloc.htm
- PDF http://aspe.hhs.gov/daltcp/reports/FLTCIloc.pdf
To obtain a printed copy of this report, send the full report title and your mailing information to:
U.S. Department of Health and Human ServicesOffice of Disability, Aging and Long-Term Care PolicyRoom 424E, H.H. Humphrey Building200 Independence Avenue, S.W.Washington, D.C. 20201FAX: 202-401-7733Email: webmaster.DALTCP@hhs.gov
RETURN TO:
Office of Disability, Aging and Long-Term Care Policy (DALTCP) Home [http://aspe.hhs.gov/_/office_specific/daltcp.cfm]Assistant Secretary for Planning and Evaluation (ASPE) Home [http://aspe.hhs.gov]U.S. Department of Health and Human Services Home [http://www.hhs.gov]