
U.S. Department of Health and Human Services
Estimating the Prevalence of Long-Term Disability for an Aging Society
Suzanne R. Kunkel and Robert A. Applebaum
Miami University, Scripps Gerontology Center
April 1991
PDF Version: http://aspe.hhs.gov/daltcp/reports/agsoces.pdf (23 PDF pages)
This report was prepared under grant #87ASPE1821 between the U.S. Department of Health and Human Services (HHS), Office of Family, Community and Long-Term Care Policy (now the Office of Disability, Aging and Long-Term Care Policy (DALTCP)) and Miami University of Ohio. For additional information about the study, you may visit the DALTCP home page at http://aspe.hhs.gov/_/office_specific/daltcp.cfm or contact the office at HHS/ASPE/DALTCP, Room 424E, H.H. Humphrey Building, 200 Independence Avenue, SW, Washington, DC 20201. The e-mail address is: webmaster.DALTCP@hhs.gov. The DALTCP Project Officer was Paul Gayer.
Invaluable assistance was provided by P. Neal Ritchey, Project Consultant, and Shahla Mehdizadeh, Programming Consultant. Gregory Spencer, at the Bureau of the Census, provided essential census projections. Ray Hanley, Peter Kemper, and Robert Atchley provided valuable comments on an earlier version of this work.
TABLE OF CONTENTS
POLICY AND RESEARCH IMPLICATIONS
TECHNICAL DOCUMENTATION (separate file)
LIST OF FIGURES
FIGURE 1: Disability Categories for LTC Projection Study
FIGURE 2: Description of Estimation Scenarios
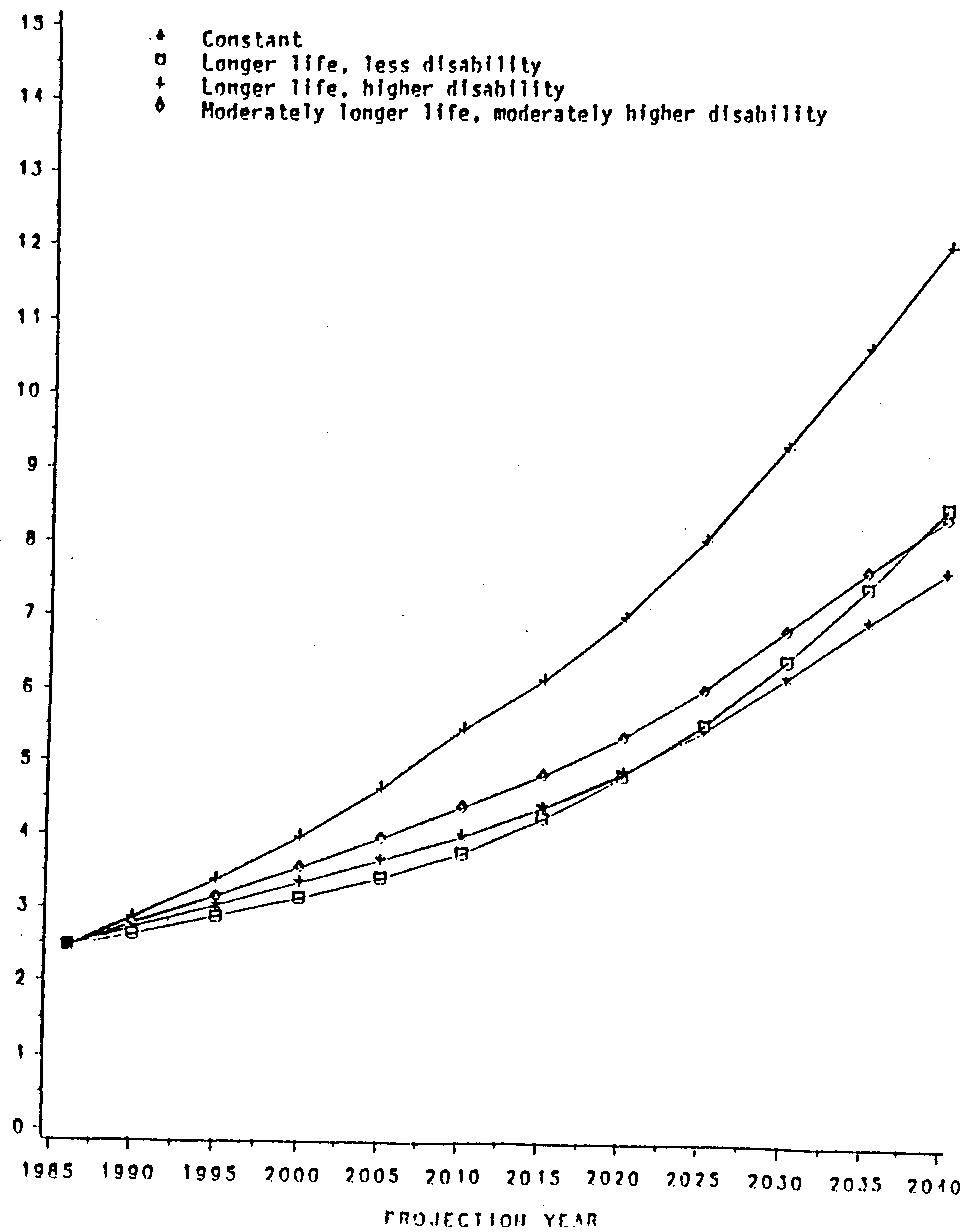
FIGURE 3: Total Projected Population 65 and Older With Severe Disability, 1986 to 2040: Different Mortality & Disability Assumptions
LIST OF TABLES
TABLE 1: Baseline Disability Proportions by Age Category and Sex
TABLE 2: Estimated Number of Older People at Different Levels of Disability in 1986, 2000, 2020, and 2040 for Four Projection Scenarios
The aging of a nation has profound effects on all aspects of society. From the marketing of products, to retirement and employment patterns, to social relationships between generations, aging of a population results in dramatic changes in the way a society functions. Although these demographic changes have significant effects on every aspect of life in our society, one of the greatest challenges faced by an aging society lies in its ability to provide health and social service care of high quality, particularly for those with chronic needs.
Providing high quality long-term care services to disabled people in a society in which the number of people requiring those services is increasing rapidly raises difficult public policy decisions. Debates about the best approaches to providing long-term care, and equally difficult issues concerning what level of resources a society can allocate to this care, have already become common in industrialized nations! Projections of the need for long-term care are fundamental for sound public policy. "If our efforts to plan for our aging population are to become more intelligent and less feeble, the highest priority must be given to amassing data and making projections of health care needs" (Brody, et. al., 1987).
Projecting the size of the long-term care population in an aging America has become a subject of particular interest for researchers. Manton and Liu (1984) estimated the future growth of the long-term care population, using comprehensive national data. While this work served as an important data source, the projections were based on a static model; that is, the rates of disability and mortality were assumed to remain constant for the next half century. Given the research on potential changes in "active life expectancy" (Katz et. al. 1983), a model based on current rates lacks the comprehensiveness necessary for public policy analysis.
Two other recent studies are of interest. The Brookings Institution estimated future costs for long-term care. Estimates in this model were based both on the continuation of current policies, and on changes that could occur as a result of some of the various public and private initiatives currently being proposed (Rivlin et. al., 1988). This comprehensive study assumed that disability rates remained constant over the projection period. A sensitivity analysis was done to look at the effects of higher or lower disability, but the disability assumptions on which all cost estimates wer e based was constant. A second recent effort was conducted by researchers at the Urban Institute and used a model that incorporated potential changes in disability (McBride 1989). This work attempted to develop alternative scenarios in estimating disability. This study relied on the National Health Interview Survey, Supplement on Aging for non-institutional baseline data. Due to major variations in approaches to measuring disability and differences in sampling frame, data from the Urban Institute study and this work generate different baseline estimates and hence projections of disability for the older population.
The study presented in this paper extends the contributions made by the works noted above in two important ways. First, this study, like the Urban Institute project, employs a model in which both life expectancy and rates of disability can be altered over time. Second, this research deals with projections of needs for long-term care as an issue related to, but separate from, where people live (in institutions or at home in the community). Since the mix of these two populations may change in the future, accurate projections of need for long-term care should be made separate from the issue of where and what type of care is currently provided. Since social and economic changes, and policy decisions made today and in the future may well alter the availability and utilization of institutional and community-based services, it is critical to know the numbers of people who will need various levels of long-term care, without regard to whether this care would be in an institutional or home setting.
In the remainder of this paper, projections of disability, and, by implication, need for long-term care, are detailed by age and sex, for the entire older population (not tied to current living arrangements or service utilization). The policy implications raised by these estimates are then discussed.
ESTIMATION METHODOLOGY
The projection model used in this research required the following tasks: 1) generating baseline estimates of the level of disability of the current older population; 2) formulating assumptions about the future of disability; 3) projecting the numbers of older people with need for long-term care under different disability and mortality scenarios. The following sections describe the data sets, disability measures, and procedures used to generate baseline data, the mortality-disability scenarios, and the projection methodology.
Data Sets: Two national data sets were used to generate the beginning rates of disability. The National Long Term Care Survey of 1982 (NLTCS) is a detailed interview study of the population age 65 and over who were residing in non-institutional settings. In addition to data on medical conditions, cognitive functioning, health care sources and costs, and demographic characteristics, the survey provides detailed data on the functional ability of this nationally representative population. General information on disability status was obtained by telephone from a sample of 35,790 persons from the Medicare master beneficiary files. Detailed information on the nature and extent of functional limitations was then gathered from in-person interviews with the 6088 persons who had reported a functional impairment.
The 1985 National Nursing Home Survey (NNHS) is a nationwide sample survey of residents and staff of nursing and related care homes. Information on a sample of 4595 current residents in the facilities included details about the nature and extent of functional limitations. Thus, the NNHS was the source of disability information on the institutionalized older population, while the NLTCS provided such data on the community-based older population.
Measurement of Disability: Defining and measuring long-term care disability was a critically important step in this study. In past research and in practice settings, two major approaches have been used to determine the number of individuals with long-term care disability: 1) a strategy that estimates disability based on the presence of an illness or disease that could result in chronic impairments; and, 2) a strategy that concentrates on the individual's ability to perform functional activities of daily living (such as ability to feed oneself, bathe, or dress oneself), without regard to clinical diagnosis. The primary method used to measure long-term care disability has been to examine functional ability because, although the presence of a chronic disease, such as arthritis, provides an indication that an individual may have a need for long-term care, the presence of the disease does not necessarily imply anything about level of need. In addition, because assessing the presence of disease often requires professional diagnosis, this measure is m ore likely to be affected by access to health care than is an assessment of functional ability. Criteria used for admission to nursing homes and to community-based long-term care demonstration programs have consistently emphasized the functional ability of the applicant (Rowland et. al. 1987; Kemper et. al., 1987). The study presented in this paper also uses the functional approach for assessing disability.
Two principles guided the development of the disability measure for this study: 1) to distinguish between levels of disability, long-term disability should be classified into several categories, and 2) to the extent possible, the definition of disability should not be linked to an individual's place of residence.
Definitions of functional disability vary widely across long-term care programs, but all rely on "activities of daily living" (ADL) and "instrumental activities of daily living" (IADL) measures. Some programs consider an impairment in one IADL or ADL as in indicator of long-term disability. Others define long-term disability as impairment in three or more ADL's. Still other programs define disability quite specifically to include only those individuals who meet criteria for nursing home of care (Rowland et. al., 1988; Kane and Kane, 1987). In response to this disagreement, a number of studies have used an approach in which disability is divided into multiple levels (Rivlin et. al., 1988; Kane and Kane, 1987). Such a strategy provides an opportunity to answer questions about a range of disability levels.
Multiple levels of disability were used for this study. (See Figure 1) Specifically, the following three levels of disability were defined:
-
Severe disability--includes those individuals with at least two ADL impairments. Individuals at this level of disability generally meet the current state requirements for intermediate level nursing home care.
-
Moderate disability--includes those individuals experiencing at least one ADL impairment, or two IADL limitations. These individuals, in general, would not be disabled enough to meet the current nursing home level of care criteria.
-
Little or no disability--includes individuals with no functional impairment and those with one limitation in an IADL. It is assumed that individuals in this category currently experience no long-term disability.
Calculating Current Prevalence Rates of Disability: Using the measures described above, age- and-sex-specific rates of disability were calculated for the institutionalized older population using the NNHS data, and for the community-based older population using the NLTCS information. Since calculating disability rates for the entire over 65 population without regard to residence was a key objective of the study, it was necessary to combine the residence-specific disability information on the two populations. This was accomplished by weighting the disability rates for each of the two groups by their relative representation in the overall older population. These weights were age and sex-specific.
It should be noted that despite the importance of combining these two data sets, some limitations are encountered in such an approach. Because questionnaire wording, data items and data collection strategies varied between the two surveys, potential measurement problems arise when combining data from these two samples. For example, the data collection methods in the NLTCS rely primarily on self report, while the NNHS utilizes data collected from professional staff. Studies examining alternative data collection techniques have reported that such variations can result in apparent differences in functional ability of respondents, when no such differences actually exist (Brown, 1986). However, comparable data collection approaches have not been used in the existing long-term care data sets.
Projecting Disability: The age-sex specific disability rates calculated according to the methods described were combined with 1986 census estimates to form the baseline for our projections. The rates from the two surveys were applied to the census estimates for 1986, the most recent year available, to form the data base. Next, a disability trend (described below) was applied to the beginning rates. The result of this process was a matrix of disability rates by age and gender for the years 1986 to 2040. That is, based on our assumptions about what would happen to disability rates in the future, current disability rates were altered to give a new set of rates that increased, decreased, or remained constant over the next 55 years. These disability rates were then applied to census projections for the years in question (U.S. Bureau of the Census, 1988). The census projections were acted upon by varying mortality assumptions--continuation of recent mortality trends, faster increase in life expectancy, slower increase in life expectancy. Thus, after mortality rates are applied to the population, the disability rate matrix produces disability projections specific to the disability-mortality assumptions that have been used. For each set of mortality-disability assumptions, projections were done in five year intervals from 1990 to 2040.
| FIGURE 1. Disability Categories for LTC Projection Study | ||
| Categories | ||
| Severe | Moderate | Little or None |
| 2 or more ADL's from below- eating- transferring- using toilet- dressing- incontinence- cognitive impairment | at least 1 ADL from below- eating- transferring- using toilet- dressing- bathing- incontinenceor at least 2 IADL's(at least one must be from Group 1)Group 1- walking- shopping- meal preparation- housekeepingGroup 2- phone use- travel | No ADL or IADLor 1 IADL from below- walking- shopping- meal preparation- housekeeping- travel- money management- phone use |
Disability-Mortality Scenarios: Estimating rates of disability and mortality through the year 2040 is without question a speculative process. Numerous developments in such areas as public health, medical technology, the environment, and economic and social changes cannot be predicted with accuracy, yet will surely influence mortality and disability. Estimates for longevity did not have to be developed by the project, as they had been generated by the U.S. Bureau of the Census. The Census uses three different assumptions about the future of mortality (a rapid improvement life expectancy series, a middle mortality view, and a slow improvement series). The middle mortality scenario was estimated by examining mortality trends between 1940 and 1986. Census researchers identified variations in life expectancy improvements over that time period. During the 1970's life expectancy increased at a much higher rate 1han the time period 1982 to 1986. The middle mortality scenario thus, "represents the middle ground between sharply different recent trends" (Spencer, 1989, p. 24). The rapid improvement scenario assumes that mortality will decline 100 percent faster than in the middle series. Longevity in the slow- improvement series was originally assumed to decrease half as fast as the middle assumption. However, these estimates were modified because of the effects of Acquired Immunodeficiency Syndrome (AIDS). Under this latter assumption life expectancy is projected to show almost no increase.
A review of the research literature revealed very little agreement on the direction of change in disability rates or on the magnitude of potential changes. Predictions range from decline to improvement in disability rates among older people. A reduction in the rate of disability experienced by older cohorts is perhaps best represented by the work of Fries (1983; also Fries and Crapo, 1981), who suggests that medical advances would result in a compression of morbidity and mortality into the latest years of life. This theory took the position that life would be extended to its biological maximum and that the additional years of life would be relatively healthy and active. While such a theory has been proposed by others (Bjorksten, 1987), there is little research evidence to support such a scenario.
A more middle-ground position suggests that the current rates of disability will remain relatively constant. Represented by the works of several researchers (Brody, 1985; Chapman et. al. 1986; Manton 1986; Feldman 1983) this review of health trends for older people found relatively stable patterns of disability over the past few decades, suggesting that disability rates would remain constant.
A third scenario suggests that longer life expectancy will actually result in an increase in the rates of disability experienced by older people. Verbrugge (1984) suggested, for example, that longer life and the resultant higher prevalence rates for serious diseases would have a "pernicious effect ... since future new survivors will be even more ill and susceptible than those in earlier decades" (1984: 515). Thus, the extension of life would include more active days, but also more inactive or disabled days.
After identifying the continuum of possibilities for future disability trends, it was still necessary to quantify the possible changes in order to develop the estimation models. Unfortunately, there was little information available to aid in estimating the magnitude of potential changes. A review of the literature on disability identified a small number of studies that examined rates of disability over time. The studies used a range of measures such as the existence of an activity limitation, the number of days restricted in the home, and the number of days restricted to bed to assess disability.
The analysis of disability over time in the U.S. relied on the National Health Interview Survey. A detailed analysis of the survey between 1958 and 1980 examined several variables including the presence of total restricted activity, a major activity limitation, and any activity limitation (Verbrugge 1984). Results from this work showed that between 1958 and 1980 there was an increase in the proportion of the older population that reported experiencing disability. For the total restricted activity measure, men age 65 and over showed a 4 percent increase in days restricted, and women 65 and over had a 10.3 percent increase. A second measure which examined the presence of a major activity limitation, showed an 11 percent increase for women and a 1.1 percent increase for men age 65 and over. A third measure that examined the existence of any limitation showed a 13.8 percent increase for men age 65 and over and a 2.3 percent increase for women of comparable ages. This study also examined changes for the 45 to 64 age group. Larger increases in the proportion of those experiencing a disability were reported for this group. Men age 45 to 64 showed a 33 percent increase, while women of this group showed a 46 percent increase.
Although these numbers suggest increased disability, they need to be interpreted cautiously. Changes in questionnaire wording, data collection, and sampling procedures existed. For example, because the data from the survey are grouped in broad age categories as the population has aged over the course of the studies, the average age of the groupings has risen, thus causing an increase in group disability rates that is not necessarily related to increasing rates of disability for comparable age groups.
Several other studies have also used the National Health Interview Survey (Colvez and Blanchet, 1981; Ycas, 1985, Chapman, LaPlante, Wilensky, 1986; Culler, van Deen Daigle 1983). Although these studies examined different time periods (typically a smaller number of years), as expected the findings of these studies, while smaller in magnitude, were generally consistent with the study discussed above.
A second major data source was the Canadian Health Survey (Wilkins and Adams, 1983). Using measures of both the presence of a long-term disability and the number of disability days, the study examined changes between 1951 and 1978. Results also showed an increase in disability over time. Men age 65 and over showed a 15 percent increase, and women of comparable age were reported to show a 60 percent increase. The measure on disability days also showed an increase, but of smaller magnitude, in reported disability over time. For example, men age 65 and over were reported to have a 3.4 percent increase, and women of this age category had a 34 percent increase. The authors of this study pointed out several methodological problems. The most serious problem appears to be the change in definition of long-term disability; from having permanent physical disability to the presence of any activity limitation. Other questionnaire wording and data collection changes and sample weighting problems were also noted.
In addition to these studies there were several other authors who speculated about future trends in disability (Fries, 1981; Manton, 1986; Brody, 1985; Schneider and Brody, 1983). These estimates were based on theoretical assumptions rather than data on trends in disability.
With these studies as background, we developed our estimates. Data from' the NHIS for the over 65 population had suggested disability increases for the over 65 population ranging from 1 to 14 percent, depending on the measure. Larger increases (33% men, 46% women) were reported for the 45-64 age group. The Canadian survey reported increases on the disability days measure of 3.4 percent for men and 34 percent for women and increases in any long term disability of 50 percent for the over 65 population.
Based on these numbers a 15 percent increase in disability was used to represent the estimates for the increasing disability scenario. No supporting numbers were available for estimating an improvement in disability. In order to represent an alternative hypothesis a 15 percent rate for the decreasing disability scenario was used as well. A best-guess scenario, which assumed a smaller increase (7.5%) in disability rates was also estimated. The rationale for the best-guess estimate was that while some increase in disability may have occurred, methodological concerns suggest that the increase has been over-estimated in the data presented. Yet it seems plausible that increases in longevity may result in a higher proportion of the population experiencing a disability. The disability changes were estimated for the next twenty-five years; after 2010, rates were held constant. The estimates did assume that the amount of change would be spread evenly over the twenty-five years, and evenly among the three levels of disability (little or none, moderate, severe). Disability rates were also assumed to be the same for men and women and spread evenly across the age range.
Models developed: From the combination of mortality and disability scenarios possible, four models were developed to generate projections: 1) a constant model--with mortality and disability trends continuing under current rates; 2) a longer life/lower disability model--assuming faster improvement in mortality and lower levels of disability (compression of morbidity and mortality); 3) a longer life/higher disability model--assuming faster improvements in mortality and higher levels of disability; 4) a moderately longer life/moderately higher disability model-- assuming the middle mortality rates and a higher level of disability than currently exists, but not as high as that assumed in the previous model. This last model represents our best guess for the future long-term care population. The selected scenarios are summarized in Figure 2.
MODEL ESTIMATES
Table 1 shows the beginning disability rates summarized by age and sex. Data for 1986 indicate that the vast majority of the population over age 65 (82.7%) experienced little or no disability. However, 8.9 percent of the over 65 population are classified as moderately impaired and 8.4 percent are placed in the severely disabled category. As might be expected, the proportion of the older population with little or no disability decreases with age, and the proportion with severe disability increases with age. For example, 4.4 percent of the 65-74 year old age group are classified as being severely impaired, compared to almost 29 percent for the over age 85 group. Examination of the category of individuals with no disability also highlights these differences. Almost 90 percent of the 65-74 age category are classified as having no disability, compared to just under 50 percent for the 85+ group.
For all age groups, the proportion of women with a severe disability is greater than that for males. For those age 85 and above, almost 32 percent of the women are classified as being severely disabled, while about 22 percent of the men are within this category. This reinforces an often-cited finding that women have higher rates of illness and disability than do men, even though in general women enjoy greater longevity than do men. To be certain that the higher rates of disability among women were not explained by their higher average age (and thus greater likelihood of living long enough to become disabled), we compared the proportions of men and women disabled within single years of age. The same pattern held; in fact, at higher ages, the difference between men and women was greater. Old-old women were much more likely than old-old men to be disabled, and this difference was greater at these older ages than at younger ages. Thus, the sex differential in disability is not "explained away" by the greater longevity, and thus higher average age of older women.
Using these 1986 numbers as a base (see Table 1), estimates were generated for the four different models described above. The importance of developing alternative models that allow for change in disability and mortality over the course of the projection period is illustrated by the range of estimates generated by the different scenarios. As seen in Table 2, the estimates of the numbers of older persons with severe disability for the year 2040 range from 7.6 million (in the constant model) to 12 million (for the high disability model). The reader will note that the lowest estimate of the number of older persons with severe disability in the year 2040 comes from the constant model rather than the longer life/lower disability model. This and other apparent discrepancies are explained by the fact that findings reflect three related but distinct forces: the force of population aging, the force of mortality, and the impact of disability. The estimates for severe disability are lower for the constant model than the longer life/lower disability model because the latter model assumes faster improvement in life expectancy. Thus, the longer life/lower disability scenario results in a very large old-old population. Although the scenario assumes improvements in disability, the higher number of people in the oldest age group results in a higher estimate of severely disabled persons than does the scenario with higher rates of disability.
| FIGURE 2. Description of Estimation Scenarios | ||
| Model | Description | Disability and Mortality Rate Assumption |
| Constant Model | Continuation of current rates of disability. Mortality estimates represent middle ground of diverging mortality trends. | Model assumes that current disability rates will remain constant in the future. Current rates of disability in 1986 are applied to the population estimates based on the middle series mortality projections. |
| Longer Life/ Less Disability Model | Improvement in mortality rates. Lowering of disability rates. | Model uses Census estimates for rapid improvement series in life expectancy. Disability rates are assumed to be lower than current rates (15% decrease). Assumptions made for first 25 years of projections only. |
| Longer Life/ Higher Disability Model | Improvement in mortality rates. Increase in disability rates. | Model uses Census estimates for rapid improvement series in life expectancy. Disability rates are assumed to be higher than current rates (15% increase). Assumptions made for first 25 years of projections. |
| Moderately Longer Life/ Moderately Higher Disability | Mortality uses middle series. Some increase projections in disability rates is expected to occur. | Model assumes the middle series rates of improvement in life expectancy. Disability is assumed to increase, but at slower rate than above (7.5%). Assumptions for first 25 years of projections. |
| TABLE 1. Baseline (1986) Disability Proportions by Age Category and Sex*(proportions are given as percentages) | ||||
| DisabilityCategory | AgeRange | Males | Females | Total |
| Little or No Disability | 65-7475-8485+All Ages | 90.982.758.386.4 | 89.077.146.580.2 | 89.979.249.882.7 |
| Moderate Disability | 65-7475-8485+All Ages | 5.19.119.97.2 | 6.312.121.810.0 | 5.811.021.38.9 |
| Severe Disability | 65-7475-8485+All Ages | 4.08.221.76.4 | 4.610.831.79.8 | 4.49.928.98.4 |
| * Estimates use data from the 1982 National Long-Term Care Survey and the 1985 National Nursing Home Survey that have been weighted and applied to 1986 Census population estimates. | ||||
The models are graphically presented in Figure 3. The interaction of the forces of population aging, mortality, and disability explains the inter-relationships between the scenarios. For example, in Figure 3, the longer life/less disability line is quite close to the longer life and moderately higher disability model line due to differences in mortality rates between the two models. If mortality rates were the same for each model and only disability levels were manipulated, such a merging of estimates would not occur.
As presented in Table 2, the four scenarios generate a range of estimates concerning the projected size of the disabled population of older persons. Although the differences in the estimates generated by the various mortality-disability scenarios are clearly significant, what is most important is that the numbers generated under even the most conservative and most optimistic scenarios have enormous consequences for future long-term care needs. Current estimates indicate that about 2.6 million older people have a moderate disability and about 2.5 million are severely disabled. In the constant model, with no changes in current disability or mortality rates, the sheer force of population aging will result in 4.9 million older people estimated to have a severe disability by 2020; another 4.8 million will have moderate disability. The longer life/lower disability model generates the lowest estimates of disability for 2020, predicting 4.8 million severely disabled older people and 4.6 million with moderate levels of disability. Thus, by 2020, under the most conservative model, the population of older people experiencing disability is projected to increase about 84 percent, from the current 5.1 million to 9.4 million. Similarly the lowest estimates for disability for 2040 (generated under the constant model) are 14.8 million older people with a disability (an increase of about 190% from 1986). The longer life/higher disability model generates estimates of 7.0 million severely disabled older people by 2020 and 6.6 million moderately disabled older people, for an increase of approximately 167% in the elderly disabled population.
| TABLE 2. Estimated Number (in millions) of Older People at Different Levels of Disability in 1986, 2000, 2020, and 2040 for Four Projection Scenarios | ||||
| ProjectedYear | Little orNo Disability | ModerateDisability | SevereDisability | *TotalPopulation |
| CONSTANT | ||||
| 1986200020202040 | 24.128.142.453.3 | 2.63.44.87.2 | 2.53.44.97.6 | 29.334.852.168.1 |
| LONGER LIFE/LOWER DISABILITY | ||||
| 1986200020202040 | 24.129.748.164.1 | 2.63.14.67.5 | 2.53.24.88.5 | 29.236.057.580.1 |
| LONGER LIFE/HIGHER DISABILITY | ||||
| 1986200020202040 | 24.128.143.957.5 | 2.63.96.610.6 | 2.54.07.012.0 | 29.236.057.580.1 |
| LONGER LIFE/MODERATE DISABILITY (BEST GUESS) | ||||
| 1986200020202040 | 24.127.741.551.9 | 2.63.65.37.9 | 2.53.65.48.4 | 29.234.952.168.1 |
| * Due to rounding errors total may not match the sum of individual disability categories. | ||||
POLICY AND RESEARCH IMPLICATIONS
Most of us are aware of the children's story Chicken Little in which the main character is struck on the head by an acorn, then communicates to his fellow citizens that the sky is failing, creating a panic in the mythical animal community. Although we are not suggesting that the sky is failing, the policy and research implications of these estimates are clearly striking. Of particular importance is the finding that regardless of the scenario projected, by the year 2040 when the baby boomers reach their 80's and 90's, the number of older Americans with long-term disabilities will have increased significantly. Estimates of the over 65 population expected to have a long-term disability in 2040 range from 14.8 to 22.6 million people, compared to approximately 5.1 million older people experiencing a long-term disability in 1986, (an increase ranging from 190 to 343 percent).
| FIGURE 3. Total Projected Population 65 and Older With Severe Disability, 1986 to 2040: Different Mortality & Disability Assumptions |
 |
These projections present a serious challenge for a long-term care system that has already been subject to a considerable amount of criticism, particularly concerning quality and financing. When combined with other social and demographic trends, such as lower fertility rates and changes in the structure and mobility patterns of the family, these estimates suggest that the challenges of providing adequate long-term care to an aging America are almost overwhelming. For example, a current problem that has implications for the future involves the adequacy of the labor force available to provide long-term care. Many states are currently experiencing a shortage of long-term care personnel, both nurses and paraprofessionals. In some states, particularly those with low unemployment rates, these shortages are severe. At the same time, projections indicate that the pool of workers most likely to perform these jobs will decline in future years. if concerns about who will provide long-term care are real today, in future years such an issue will be of paramount importance.
The increase in the population experiencing long-term disabilities also has obvious implications for financing long-term care. Concern about whether American society can afford to provide adequate health and long-term care for our nation's elderly and disabled populations has now become a topic of national interest. Long-term care has undeniably come to the forefront of the American political system with numerous bills being proposed in the 100th Congress. If adequate funding for long-term care is a topic of debate in 1989, it is difficult to imagine how this challenge will be addressed in 2020 or 2040.
What then are the implications of these demographic changes for policy makers and researchers? Because the estimates show dramatic increases, a coherent set of public policies will be essential. A planning and research strategy that recognizes the future challenges facing the system needs to be developed. While some of the policy and research activities will follow current lines of thinking, others must clearly search for new horizons. For example, current research on personnel problems in long-term care has primarily focused on methods to reduce turnover of staff through various benefit changes. Future research will need to look past the current approach to entirely different ways to structure and deliver long-term care. A related topic involves the relationship between technology and long-term care. Exploration into different ways to deliver long-term care, such as through the use of robotics, smart houses, and other technological innovations, needs to be incorporated into our research agenda.
This work has also identified several specific research issues of significance. First, our review suggests that while the definition and measurement of disability is important both for the development of projections and in the operation of everyday programs, there is no agreement on what constitutes long-term disability, nor on exactly how to measure disability. In fact, the major national surveys, such as the National Nursing Home Survey, the National Long-Term Care Survey (used in this work), and the National Health Interview Survey, do not measure disability in a consistent manner. Because much of the proposed legislation for expanding coverage for long-term care provides benefits based on a specific definition of disability, this issue has direct relevance to the current public policy debate on long-term care.
Information on the duration of disability will also be an important research area. At one time the literature was dominated by the theme that once an individual needed long-term care that would always be the case. Book titles and articles such as, Last Home For the Aged, (Tobin & Lieberman 1976), were common. Longitudinal data from both nursing homes and disabled community residents suggests that although the majority of disabled older people do continue to experience impairments, approximately 25 to 30 percent of the disabled sample members improved their functional status (Branch, et al. 1984; Manton, 1988).
Although developing uniform definitions and measures will improve efforts to generate future projections, other enhancements are needed as well. For instance, it is important to examine additional social and economic variables such as marital status, living arrangement, family structure and mobility patterns, and economic status as part of the projections process. Speculation about these areas is perhaps even more difficult than forecasting disability, but these factors will undoubtedly have a major impact on the long-term care needs of our society,
Another research area for continued study is the differential rates of disability experienced by men and women. As noted, despite longer life expectancy, women experience higher rates of disability. Whether this is a by-product of gains in life expectancy achieved by women and is indicative of future trends, and whether such patterns can be altered are clearly questions of critical importance.
The issues raised in this paper are but a sampling of topics for future policy and research activities in long-term care. While the development of such an agenda is not straightforward, it is clear that the aging of America will have a phenomenal impact on the number of people experiencing long-term disabilities. Our policy and research agenda must now formulate a response to this demographic and social challenge.
REFERENCES
Bjorksten, Johan. 1987. Longevity: Past, Present Future. Charleston, SC: JAB Publishing.
Branch, Laurence, S. Katz, K. Kniepman, and J. Papsidero. 1984. A prospective study of functional status among community elders. American Journal of Public Health 74(3).
Brody, Jacob A., O.B. Brock, and T. Franklin Williams. 1987. Trends in the health of the elderly. Annual Review of Public Health, V.8:211-234.
Brody, Jacob A. 1985. Prospects for an Aging Population. Nature, V.315:463-466.
Brown, Randy. 1986. Methodological Issues in the Evaluation of the National Long-Term Care Demonstration, Mathematica Policy Research, Princeton NJ. [http://aspe.hhs.gov/daltcp/reports/methodes.htm]
Chapman, Steven H., M.P. LaPlante, and G. Wilensky. 1986. Life Expectancy and Health Status of the Aged. Social Security Bulletin, V.49(10):24-48.
Feldman, Jacob J. 1983. Work Ability of the Aged Under Conditions of Improving Mortality. Milbank Memorial Fund Quarterly/Health and Society, V.62(3):430-444.
Fries, James F. 1983. The compression of morbidity. Milbank Memorial Fund Quarterly, V.6:397-419.
Fries, James F. and L. M. Crapo. 1981. Vitality and Aging: Implications of the Rectangular Curve. San Francisco: W. H. Freeman.
Kane, Rosalie, and Robert Kane. 1982. Long-Term Care, Principles, Programs and Policies. Springer . Publishing, New York.
Katz, Sidney, L. Branch, M. Bronson, J. Papsidero, J. Beck and D. Greer. 1983. Active life expectancy. New England Journal of Medicine, V.309(20):1218- 1224.
Kemper, Peter, R. Applebaum, and M. Harrigan. 1987 Community Care Demonstrations: What Have We Learned? Health Care Financing Review, V.8(4).
Manton, Kenneth G. 1988. A longitudinal study of functional change and mortality in the United States. Journal of Gerontology: Social Sciences 43(5):5153-5159.
Manton, Kenneth G. 1986. Past and Future Life Expectancy Increases at Later Ages: Their Implications for the Linkage of Chronic Morbidity, Disability, and Mortality. Journal of Gerontology, V.41(5):672-681.
Manton, Kenneth G. and K. Liu. 1984. The future growth of the long-term care population: Projections based on the 1977 National Nursing Home Survey and the 1982 Long-Term Care Survey. Paper presented at Third National Leadership Conference on Long-Term Care Issues.
McBride, Timothy D. 1989. Measuring the Disability of the Elderly: Empirical Analysis and Projections into the 21st Century, Paper presented at the Population Association of America, Baltimore Md.
Rivlin, Alice M., et. al. 1988. Caring for the Disabled Elderly--Who Will Pay? Washington, D.C.: The Brookings Institution.
Rowland, Diane, B. Lyons, P. Neuman, A. Salganicoff, T. Taghavi. 1988. Defining the functionally impaired elderly population. Report submitted to the Public Policy Institute, The American Association of Retired Persons.
Spencer, Gregory. 1989. Projections of the population of the United States by age, sex, and race: 1988 to 2080. Current Population Reports, Series P-25, Number 1018, Washington, DC: U.S. Government Printing Office.
Verbrugge, Lois M. 1984. Long life but worsening health? Trends in health and mortality of middle-aged and older persons. Milbank Memorial Fund Quarterly/Health and Society. V.62(3):475-519.
Technical Documentation
TABLE OF CONTENTS
CALCULATING BEGINNING DISABILITY RATES
PREDICTING FUTURE RATES OF DISABILITY
PROJECTING THE DISABLED POPULATION: APPLYING THE DISABILITY RATES TO THE SURVIVED POPULATION
LIST OF TABLES
TABLE 1: Rates of Institutionalization by Age and Sex
TABLE 2: Calculated Beginning of Disability Rates by Age and Sex
TABLE 3: Review of Studies Examining Morbidity Changes Experienced by the U.S. Population
This document is the technical manual to accompany the paper, Estimating the Prevalence of Long-term Disability for an Aging Society.1 That paper describes the results of research projecting to the year 2040 the numbers of older persons who will have long-term care needs in the future, under varying assumptions about the future of mortality and disability. This document describes in detail the methods, tasks, and procedures involved in those projections. Each step in the process is outlined, and the computer programs that accomplish each of these steps are included, with documentation.
There were three general steps in the projection of disability: 1) calculating beginning rates of disability; 2) trending disability rates over time, allowing for the possibilities that health of the older population may improve, stay about the same, or worsen; 3) applying the disability rates to the survived population, allowing for three different mortality scenarios (continuation of recent gains in life expectancy, faster improvement in mortality, slower improvement in mortality. Each of these three basic procedures involved multiple tasks and computer programs and generated computer data files. Details about these tasks, data files, and programs, are provided below.
CALCULATING BEGINNING DISABILITY RATES
Two national data sets were used as the basis for the beginning rates of disability among the older population: the National Long-Term Care Survey (NLTCS) of 1982, which provided information on the community-based older population, and the National Nursing Home Survey (NNHS) of 1985, which surveyed institutionalized older people. Further information on these data sets is provided in the text of the overview paper, Estimating the Prevalence of Long-Term Disability for an Aging Society.2 The rates of disability calculated from the two subpopulations were combined to provide overall disability rates for the older population. These rates were calculated for males and females for single years of age up to age 94; ages 95 through 99, and 100 plus were aggregated. Following are the detailed steps in this process.
-
Create disability measure. Based on past research and current practice regarding the measurement of disability, a three-category ordinal scale of level of disability was created. The three categories are: little or no disability, moderate disability, severe disability. Further discussion of these levels of disability, and the items that comprise the scale, are provided in the overview paper.
-
Calculate individual disability scores. After carefully selecting ADL-IADL items that were comparable on the two surveys, individual scores on each of the ADL-IADL items were calculated. Based on these responses, each individual was assigned to a disability category or level. Individuals in the NLTCS with 7 or more missing items, and individuals in the NNHS with 5 or more missing items, were eliminated from the sample; in the remaining cases mean substitution was used for missing items. Details about the ADL and IADL items, and the program that calculates disability scores for the NLTCS and NNHS samples are on pages 1-12 of the Program Appendix to this document.
-
Calculate proportions of older persons at three levels of disability. The age-and-sex specific proportions of individuals at each level of disability were calculated for each of the two subsamples. For the NNHS sample, this was a straightforward percentage taken from a frequency table of disability levels. The program which calculates these proportions is on page of the Program Appendix. For the NLTCS, this calculation was more complicated because of the sampling procedure used for the detailed interviews. Anyone who reported no disability at the time of the screening interview was eliminated from the detailed sample. Thus, the detailed sample includes only those individuals who have at least one ADL or IADL impairment. To account for the excluded persons who actually comprise a large part of the “little or no” category, the proportions at various levels of disability in the NLTCS detailed sample were weighted. The adjustment factor was an age-sex specific ratio of number in the detailed sample to number in the total sample. This factor was then multiplied times the proportion calculated for the detailed sample only. This adjustment effectively alters the denominator of the proportion to be equivalent to the total sample age-sex group, instead of the detailed sample age-sex group. Consider a hypothetical example of 120 70-year old women in the detailed sample; 60 of these women were moderately disabled. From just these figures, one might conclude that 50% of 70-year old women are moderately disabled. However, that proportion is exaggerated, because those 70-year older women with no disability were not included in the denominator. So, if there were 200 70-year old women in the total sample, that proportion calculated from the detailed sample (60/120) would be multiplied by 120/200; this procedure in effect alters the denominator to reflect the total sample rather than the detailed sample only. The logic of the adjustment factor is as explained above, the actual adjustment weights were calculated as five-year moving averages of the single-year weights, to compensate for variations in sample size and sampling error. The program that calculates the appropriate adjustment factors for each age-sex group, and further details on the moving-average procedure, is in the Appendix. The age-sex specific “little or no” disability category was then calculated by subtracting the sum of the adjusted moderate and severe proportions from 1.
-
Combine disability rates from nursing home sample with those from community-based sample. Since our goal during this phase of the project was to estimate overall prevalence of disability, it was necessary to combine information on the two subpopulations (nursing home and community-based). This was accomplished by weighting the information on the two subgroups according to their representation in the total older population.
Institutionalization rates were calculated, then age-sex specific community-based were calculated as (1 - the rates of institutionalization) for that age-sex group.
For the numerator of the age-sex specific rates of institutionalization, estimates of the numbers of older persons in institutions were taken from the 1980 Census Special Report3 on persons in institutions and other groups quarters. It is important to note that, for this research, institutionalization was not defined as inclusively as is often the case. For example, the Bureau of the Census typically distinguishes two general categories of living arrangements: in households or in group quarters (including institutions and other noninstitutional group quarters). Since this research required information specifically on older persons living in nursing homes (to weight our nursing home sample appropriately), only those older persons living in “homes for the aged” were counted in the numerator of the rate of institutionalization. Therefore, these estimates of the rates of institutionalization will be lower than other rates based on more inclusive definitions of institutionalization.
Since the estimates of older people in homes for the aged were 1980 figures, counts of population for the denominator were 1980 estimates also. These population estimates by age and sex for the denominator were taken from two sources, since no single source provided the age-sex detail necessary. The primary source was the most recent published Census4 estimates of the total population; however, this most recent publication did not include any age detail beyond 85+, so an earlier Census publication was used for estimates of those 85 to 89, 90 to 94, and 95 plus.
The age-sex specific rates of institutionalization, and the sources of data used to calculate those rates, are given in Table 1. These weights were applied to the disability rates for the two subsamples to produce overall age-sex proportions of older persons at four levels of disability. The program that weights and combines the subsample proportions is part of the program in the Appendix.
-
Smoothing the age-disability curves. The single-year of age, sex-specific data for levels of disability produced a predictably jagged curve, which was smoothed using five-year moving averages. The five year span used in calculating the moving average included the two years before and the two years after a given year of age. The program which accomplished this task is in the appendix.
-
Produce data file of baseline rates. The preceding steps produced proportions disabled at three different levels for the older population, by sex and single years of age. These beginning rates which were used as a baseline for all projections are given in Table 2.
| TABLE 1: Rates of Institutionalization by Age and Sex | ||
|---|---|---|
| Age | Males | Females |
| 65 | 0.01 | 0.01 |
| 66 | 0.01 | 0.01 |
| 67 | 0.01 | 0.01 |
| 68 | 0.01 | 0.01 |
| 69 | 0.01 | 0.01 |
| 70 | 0.01 | 0.02 |
| 71 | 0.02 | 0.02 |
| 72 | 0.02 | 0.02 |
| 73 | 0.02 | 0.03 |
| 74 | 0.02 | 0.03 |
| 75 | 0.03 | 0.04 |
| 76 | 0.03 | 0.04 |
| 77 | 0.04 | 0.05 |
| 78 | 0.04 | 0.06 |
| 79 | 0.05 | 0.08 |
| 80 | 0.05 | 0.09 |
| 81 | 0.06 | 0.10 |
| 82 | 0.07 | 0.12 |
| 83 | 0.07 | 0.13 |
| 84 | 0.09 | 0.15 |
| 85 | 0.11 | 0.18 |
| 86 | 0.13 | 0.20 |
| 87 | 0.15 | 0.22 |
| 88 | 0.16 | 0.25 |
| 89 | 0.16 | 0.28 |
| 90 | 0.19 | 0.29 |
| 91 | 0.20 | 0.30 |
| 92 | 0.20 | 0.31 |
| 93 | 0.20 | 0.32 |
| 94 | 0.20 | 0.32 |
| 95-99 | 0.28 | 0.48 |
| 100+ | 0.33 | 0.56 |
| DATA SOURCES: 1980 Census of Population, v.2 Subject Reports, Persons in Institutions and Other Group Quarters, U.S. Department of Commerce, 1984. Current Population Reports, Series P-25, Number 929, Estimates of the Population of the U.S. by Age, Sex, and Race, U.S. Department of Commerce, 1983. | ||
| TABLE 2: Calculated Beginning of Disability Rates by Age and Sex | ||||||||
|---|---|---|---|---|---|---|---|---|
| Age | NODIS-M | NODIS-F | MILDDIS-M | MILDDIS-F | MODDIS-M | MODDIS-F | SVEREDIS-M | SVEREDIS-F |
| 65 | 0.886540 | 0.872374 | 0.018675 | 0.012912 | 0.052111 | 0.068478 | 0.042674 | 0.046236 |
| 66 | 0.898503 | 0.879552 | 0.015516 | 0.011606 | 0.047082 | 0.061800 | 0.038899 | 0.047042 |
| 67 | 0.910492 | 0.891920 | 0.011271 | 0.010552 | 0.044144 | 0.054203 | 0.034093 | 0.043325 |
| 68 | 0.912165 | 0.894536 | 0.009686 | 0.011326 | 0.043442 | 0.051737 | 0.034707 | 0.042401 |
| 69 | 0.908763 | 0.896909 | 0.011688 | 0.012252 | 0.043032 | 0.052804 | 0.036517 | 0.038035 |
| 70 | 0.904047 | 0.893258 | 0.013954 | 0.011455 | 0.042771 | 0.054405 | 0.039228 | 0.040882 |
| 71 | 0.894966 | 0.877360 | 0.010231 | 0.011279 | 0.055794 | 0.064223 | 0.039009 | 0.047147 |
| 72 | 0.885851 | 0.864802 | 0.010085 | 0.012919 | 0.060262 | 0.069915 | 0.043801 | 0.052364 |
| 73 | 0.874615 | 0.852736 | 0.014040 | 0.015070 | 0.064407 | 0.76516 | 0.046938 | 0.055678 |
| 74 | 0.865530 | 0.846851 | 0.018675 | 0.016112 | 0.064258 | 0.080632 | 0.051536 | 0.056405 |
| 75 | 0.856974 | 0.834662 | 0.018537 | 0.014238 | 0.066068 | 0.087289 | 0.058427 | 0.063811 |
| 76 | 0.850976 | 0.818653 | 0.018058 | 0.014020 | 0.068774 | 0.093019 | 0.062192 | 0.074308 |
| 77 | 0.843089 | 0.798597 | 0.016053 | 0.015507 | 0.078460 | 0.097037 | 0.062398 | 0.088859 |
| 78 | 0.825720 | 0.777589 | 0.016639 | 0.018140 | 0.090549 | 0.106143 | 0.067092 | 0.098128 |
| 79 | 0.802035 | 0.752673 | 0.022068 | 0.017251 | 0.097367 | 0.118816 | 0.078530 | 0.111259 |
| 80 | 0.779377 | 0.726876 | 0.022477 | 0.020202 | 0.105129 | 0.131765 | 0.093017 | 0.121157 |
| 81 | 0.760430 | 0.697876 | 0.018404 | 0.028405 | 0.114488 | 0.146951 | 0.106678 | 0.126769 |
| 82 | 0.745541 | 0.671138 | 0.016711 | 0.031692 | 0.115733 | 0.161271 | 0.122015 | 0.135899 |
| 83 | 0.732364 | 0.642034 | 0.022943 | 0.030610 | 0.120239 | 0.165393 | 0.124454 | 0.161963 |
| 84 | 0.711687 | 0.615603 | 0.029535 | 0.026637 | 0.125125 | 0.169244 | 0.133654 | 0.188516 |
| 85 | 0.684635 | 0.585447 | 0.033016 | 0.026117 | 0.136895 | 0.179174 | 0.145454 | 0.209262 |
| 86 | 0.648618 | 0.555925 | 0.026264 | 0.021374 | 0.155378 | 0.194508 | 0.169741 | 0.228193 |
| 87 | 0.614459 | 0.519170 | 0.011255 | 0.022193 | 0.191934 | 0.202966 | 0.183252 | 0.256570 |
| 88 | 0.584799 | 0.470918 | 0.014180 | 0.023102 | 0.197537 | 0.219542 | 0.203484 | 0.286438 |
| 89 | 0.5410.13 | 0.412285 | 0.025174 | 0.022814 | 0.212405 | 0.238873 | 0.221408 | 0.326028 |
| 90 | 0.501841 | 0.370619 | 0.031514 | 0.020564 | 0.226852 | 0.261115 | 0.239793 | 0.347702 |
| 91 | 0.476466 | 0.354703 | 0.022347 | 0.017767 | 0.255428 | 0.266644 | 0.245758 | 0.360886 |
| 92 | 0.454570 | 0.338441 | 0.013466 | 0.016099 | 0.293437 | 0.252365 | 0.238527 | 0.393095 |
| 93 | 0.403403 | 0.299338 | 0.026168 | 0.009750 | 0.324142 | 0.259881 | 0.246287 | 0.431031 |
| 94 | 0.366625 | 0.276847 | 0.054570 | 0.017131 | 0.321344 | 0.249630 | 0.257461 | 0.456392 |
| 95 | 0.270686 | 0.263427 | 0.023223 | 0.012142 | 0.256135 | 0.224285 | 0.449955 | 0.500146 |
| 100 | 0.234400 | 0.182094 | 0.000000 | 0.051581 | 0.055110 | 0.135082 | 0.710490 | 0.631243 |
| RUN INFO: 21-Feb-90, 19:21:47, Miami University, IBM 4381 M23 VM/CMS 5.0 NOTE: The “no” and “mild” disability categories were combined following this step. | ||||||||
PREDICTING FUTURE RATES OF DISABILITY
The next major task was to estimate future disability rates. This is clearly one of the most difficult aspects of this study. Based on past literature, three possible scenarios concerning future disability rates were considered: increase in disability, decrease in disability, and maintenance of current rates of disability. As noted in the overview paper, while several researchers have speculated about how disability or morbidity might be influenced over the next half century or so, few of these researchers have estimated the size of these changes. In order to develop estimates we reviewed those studies that examined past changes in rates of morbidity and disability over time. It was our contention that information on past disability trends would provide a basis for the development of estimates of future trends.
A review of the literature on disability identified a small number of studies that examined rates of disability over time. A summary of these studies is presented in Table 3. These studies use data collected annually from two national samples, one in Canada (first done in 1951) and one in the United States (1958). The studies used a range of measures such as the existence of an activity limitation, the number of days restricted in the home, and the number of days restricted to bed to assess disability. Although these major data bases (the National Health Interview Survey, and the Canadian Health Interview Survey) are an important data source, they are not without major methodological limitations. For example, while the Canadian Health Survey reports data annually from 1951, questionnaire wording changes limit the ability of the survey to analyze whether differences have actually occurred. In 1951 respondents were asked if they had a permanent physical disability, while in 1978 they were asked if they had any activity limitation. Thus, the fact that the proportion of the population that was disabled rose from 25.5% in 1951 to 38.2% in 1978 (a 50% increase) is not particularly meaningful. Measurement, sampling and weighting problems appear on the U. S. National Health Interview Survey as well. Thus, while data are available to examine trends of disability over time, such data need to be examined with caution.
As shown in Table 3, the analysis of disability over time has primarily relied on the National Health Interview Survey. Verbrugge (1984) has undertaken a detailed analysis of the survey between 1958 and 1980. Her work examined several variables including the presence of total restricted activity, a major activity limitation, and any activity limitation. Results from this work showed that between 1958 and 1980 there was an increase in the proportion of the older population that reported experiencing a disability. For the total restricted measure between 1958 and 1980 men age 65 and over showed a 4 percent increase in days restricted, and women 65 and over had a 10.3 percent increase. A second measure which examined the presence of a major activity limitation, showed an 11 percent increase for women and a 1.1 percent increase for men age 65 and over. A third measure that examined the existence of any limitation showed a 13.8 percent increase for men age 65 and over and a 2.3 percent increase for women of comparable ages. This study also examined changes for the 45 to 64 age group. Larger increases in the proportion of those experiencing a disability were reported for this group. Men age 45 to 64 showed a 33 percent increase, while women of this group showed a 46 percent increase.
| TABLE 3: Review of Studies Examining Morbidity Changes Experienced by the U.S. Population | ||||||
|---|---|---|---|---|---|---|
| Study/Data Base | Results | |||||
| Verbrugge 1984/National Health Interview Survey, 1958-1980 | Men 65+ | Percent Change | Women 65+ | Percent Change | ||
| 1958 | 1980 | 1958 | 1980 | |||
| TOTAL RESTRICTED ACTIVITY | ||||||
| 37 days | 38.5 days | 4% | 39 days | 43 days | 10.3% | |
| MAJOR ACTIVITY LIMITATION | ||||||
| 45.5% | 45% | 1.1% | 32% | 35.5% | 11% | |
| ANY LIMITATION | ||||||
| 43.5% | 49.5% | 11% | 43% | 44% | 2.3% | |
| MAJOR ACTIVITY/LIMITATIONS | ||||||
| 15% | 20% | 33.3% | 12% | 17.5% | 46% | |
| Colvez, Blanchet 1981/NHIS 1966-1974 | Men 65+ | Percent Change | Women 65+ | Percent Change | ||
| 1966 | 1974 | 1966 | 1974 | |||
| SEVERE LIMITATION OF ACTIVITY 65+ -- 1966-1974 | ||||||
| 21.0% | 29.8% | 38% | 5.12% | 8.2% | 6% | |
| MODERATE LIMITATION OF ACTIVITY | ||||||
| 26.96% | 15.1% | -44% | 24.9% | 27.1% | 9% | |
| Culler, Van Veen Daigle 1983/NHIS | 1975 | 1981 | Percent Change | |||
| RESTRICTED-ACTIVITY DAYS -- ALL 65+ | ||||||
| 38.4 | 39.9 | 3.9% | ||||
| BED-DISABILITY DAYS -- ALL 65+ | ||||||
| 12.9 | 14.0 | 8.5% | ||||
| Wilkins, Adams 1983/Canada Health Survey | 1951 | 1978 | Percent Change | |||
| LONG TERM DISABILITY -- ALL AGE 65+ | ||||||
| 25.5 | 38.2 | 50% | ||||
| Men 65+ | Percent Change | Women 65+ | Percent Change | |||
| 1951 | 1978 | 1951 | 1978 | |||
| LONG-TERM DISABILITY | ||||||
| 27.0 | 31.1 | 15.2% | 23.9 | 38.3 | 60.3% | |
| 1951 | 1978 | Percent Change | ||||
| DISABILITY DAYS | ||||||
| 29 | 35 | 21% | ||||
| Men | Percent Change | Women | Percent Change | |||
| 1951 | 1978 | 1951 | 1978 | |||
| DISABILITY DAYS | ||||||
| 29 | 30 | 3.4% | 29 | 39 | 34% | |
Although these numbers suggest increased disability, as noted earlier they need to be interpreted cautiously. Changes in questionnaires and in data collection and sampling procedures could effect results. Because the data from the survey are grouped in broad age categories (45-64, 65 and above) as the population has aged over the course of the studies, the average age of the groupings has risen, this could cause an increase in group disability rates that is not related to increasing rates of disability for comparable age groups.
Several other studies have also used the National Health Interview Survey (Colvez and Blanchet, 1981; Ycas, 1985, Chapman, LaPlante, Wilensky, 1986; Culler, Van Veen Daigle 1983). Although these studies examined different time periods (typically a smaller number of years), as might be expected the findings of these studies, while smaller in magnitude, were generally consistent with the Verbrugge study discussed above.
The seond major data source was the Canadian Health Survey (Wilkins and Adams, 1983). Using measures of both the presence of a long-term disability and the number of disability days, the study examined changes between 1951 and 1978. Results also showed an increase in disability over time. Men age 65 and over showed a 15 percent increase, and women of comparable age were reported to show a 60 percent increase. The measure on disability days also showed an increase, but of smaller magnitude, in reported disability over time. For example, men age 65 and over were reported to have a 3.4 percent increase, and women of this age category had a 34 percent increase. The authors of this study pointed out several serious methodological problems. The most serious problem, as noted earlier, appears to be the change in definition of long-term disability, from permanent physical disability to any activity limitation. Other questionnaire wording and data collection changes and sample weighting problems were also noted.
In addition to these studies there were several other authors who speculated about future trends in disability (Fries, 1981; Manton, 1986; Brody, 1985; Schneider and Brody, 1983). These estimates were based on theoretical assumptions rather than data on trends in disability.
With these studies as background, we developed our estimates. Data from the NHIS for the over 65 population had suggested disability increases for the over 65 population ranging from 1 to 14 percent, depending on the measure. Larger increaes (33% men, 46% women) were reported for the 45-64 age group. The Canadian survey reported increases on the disability days measure of 3.4% for men and 34% for women and increases in any long term disability of 50% for the over 65 population.
Based on these numbers we used a 15 percent increase in disability to represent our estimates for the increasing disability scenario. No supporting numbers were available for estimating an improvement in disability; Fries, the major proponent of the suggestion that health of older persons will improve over time, bases his argument on a theoretical rather than empirical foundation. Therefore, we used the 15 percent rate for the lowering of disability scenario as well. A best guess scenario, which assumed a smaller increase (7.5%) in disability rates was also estimated. The rationale for our best guess estimate was that while some increase in disability may have occurred, methodological concerns suggest that the increase has been over-estimated in the data presented. Yet it seems plausible that increase in longevity may result in a higher proportion of the population experiencing a disability. Thus, four specific possibilities were included in these projections: an increase of 15%, a decrease of 15%, an increase of 7.5%, and no change in disability among the older population. Each of these four possibilities represented a different data set to be input into the projection program. Each of the three sets of disability rates that assume some change were created using the following simplifying assumptions: 1) that the change would occur during the next twenty-five years; after 2010, rates were held constant; 2) that the amount of change would be spread evenly over the twenty-five years, and evenly among the three levels of disability (little or none, moderate, severe); 3) that men’s and women’s disability rates would not converge at any age or at any point in time; 4) that the change would affect all ages.
An example of the programs used to trend disability rates over time is found in the Program Appendix. For each of the three disability scenarios involving change, the program is essentially the same, with differences only in the amount and direction of change over the next twenty-five years. For the fourth possibility, no change in disability, the baseline rates were used for each year of the projection. This step in the process resulted in four separate data files of disability rates, to be input into the projection program, depending on the assumption about disability being considered.
PROJECTING THE DISABLED POPULATION: APPLYING THE DISABILITY RATES TO THE SURVIVED POPULATION
The final step in generating the projections was to apply the disability rates to the survived population. Estimates of the survived population through the year 2040 were generously provided by Gregory Spencer at the Bureau of the Census. Three different sets of estimates were used, based on three assumptions about mortality in the future: a continuation of recent gains in life expectancy, a faster improvement in life expectancy, and a slower improvement in life expectancy. These three sets of population estimates were used as input matrices; they were multiplied by the disability matrices. Population estimates and disability rates were input for five-year intervals from 1985 through 2040. Given four different disability matrices, and three different mortality matrices, twelve combinations were possible. All combinations were run, but the final report focused on only four, which were selected because they covered the range of possibilities, from longer life with worsening health to longer life with improving health. The programs that combined the disability and mortality matrices to project the numbers of other persons at various levels of disability are in the Program Appendix.
SUMMARY
In summary, there were two types of input files: disability rates and population estimates by single years of age and sex, through the year 2040. There was one type of output file: estimates of disabled persons by single years of age and sex, through the year 2040. The exact nature of each of these input and output files depended upon the disability and mortality assumptions being considered in any particular projection run. The computer programs in the Program Appendix are arranged in a logical order, beginning with the programs that generated beginning rates of disability, followed by those programs that created disability rate matrices, followed by the projection programs.
PROGRAM APPENDIX
Programs were written by: P. Neal Ritchey and Shahla Mehdizadeh
PROGRAM NAME: ASPSTORY
- Calculates disability item scores for individuals
- Calculates disability level of individual
FILE: ASPSTORY TEXT A MIAMI UNIVERSITY VM/CMS REL 5
The following text will explain the process used in calculation of DISABILITY proportions used in the computation of the number of disabled and level of disability in ASPE project.
Process involves three steps:
-
Calculation of DISABILITY proportions for the institutionalized populations.
- Calculation of the individual ADL & IADL item scores for institutionalized sample.
- Using ADL & IADL scores according to our specific definition to arrive at institutionalized disability proportions.
-
Calculation of DISABILITY proportions for the non-institutionalized population.
- Calculation of the individual ADL & IADL item scores for the non-institutionalized sample.
- Using ADL & IADL scores according to our specific definition to arrive at non-institutionalized disability proportions.
- Conversion of the sample disability proportions to population proportions.
-
Combining of the two above proportions and smoothing to compensate for sampling error and variation in sample size at different age and sex.
| 1.a) | In order to arrive at the institutionalized DISABILITY proportions the 1985 National Nursing Home Survey of Current Residents were used. The following logical statements were used to arrive at ADL & IADL scores. (The questions that the Variable names stand for are listed first.) |
ASSTBATH : DOES RES. REQUIRE ANY ASSISTANCE IN BATHING?
BATHSPEQ : DOES RES. BATHE WITH HELP OF SPECIAL EQUIPMENT?
BATHPERS : DOES RES. BATHE WITH HELP OF A PERSON?
ASSTDRES : DOES RES. REQUIRE ASSISTANCE IN DRESSING?
DRESSREQ : DOES RES. DRESS WITH HELP OF SPECIAL EQUIPMENT?
DRESPERS : DOES RES. DRESS WITH HELP OF A PERSON?
ASSTEAT : DOES RES. REQUIRE ASSISTANCE IN EATING?
EATSPEQ : DOES RES. EAT WITH HELP OF SPECIAL EQUIPMENT?
EATPERS : DOES RES. EAT WITH HELP OF A PERSON?
ASSTOUTB : DOES RES. REQUIRE ASSISTANCE TRANSFERRING OUT OF BED?
OUTBSPEQ : DOES RES. REQUIRE THE HELP OF SPECIAL EQUIPMENT?
OUTBREPS : DOES RES. REQUIRE HELP OUT OF BED:PERSON?
CHAIFAST : IS RES. CHAIRFAST?
BEDFAST : IS RES. BEDFAST?
ASSTTOIL : DOES RES. REQUIRE ASSISTANCE USING TOILET?
TOILSPEQ : DOES RES. REQUIRE HELP WITH SPECIAL EQUIPMENT?
TOILPERS : DOES RES. REQUIRE HELP OF A PERSON?
HELPFONE : DOES RES. RECEIVE HELP USING THE PHONE?
WALKHELP : DOES RES. CURRENTLY REQUIRE HELP WALKING?
WALKSPEQ : DOES RES. REQUIRE SPECIAL EQUIPMENT TO WALK?
WALKPERS : DOES RES. WALK WITH HELP OF A PERSON?
HANDLE$ : DOES RES. RECEIVE HELP HANDLING MONEY?
OUTFACIL : DOES RES. GO OUTSIDE GROUPS OF FACILITY?
OUTSPEQ : DOES RES. GO OUTSIDE WITH HELP OF SPECIAL EQUIPMENT?
OUTPERS : DOES RES. GO OUTSIDE WITH HELP OF A PERSON?
DIFBOWEL : DOES RES. HAVE DIFFICULTY CONTROLLING BOWELS?
DIFBLADD : DOES RES. HAVE DIFFICULTY CONTROLLING BLADDER?
FDIFBOWL : HOW FREQUENTLY DOES RES. HAVE THIS DIFFICULTY?
FDIFBLAD : HOW FREQUENTLY DOES RES. HAVE THIS DIFFICULTY?
ONLYNITE : DOES THIS OCCUP ONLY AT NIGHT?
OSTOCATH : DOES RES. HAVE AN OSTOMY OR CATHETER?
BSTEAL : TYPES OF BEHAVIOR : STEALING
BGETLOST : TYPES OF BEHAVIOR : GETTING LOST
BADATTIM : BASIC ACTIVITIES : UNABLE TO REMEMBER DATES/TIME
DO IF (ASSTBATH EQ 2)
COMPUTE BATHING=0
ELSE IF (ASSTBATH EQ 1 AND BATHSPEQ EQ 1)
COMPUTE BATHING=1
ELSE IF (ASSTBATH EQ 1 AND BATHPERS EQ 1)
COMPUTE BATHING=1
ELSE
COMPUTE BATHING=99
END IF
DO IF (ASSTDRES EQ 2)
COMPUTE DRESSING=0
ELSE IF (ASSTDRES EQ 1 AND DRESSPEQ EQ 1)
COMPUTE DRESSING=1
ELSE IF (ASSTDRES EQ 1 AND DRESPERS EQ 1)
COMPUTE DRESSING=1
ELSE
COMPUTE DRESSING=99
END IF
DO IF (ASSTEAT EQ 2)
COMPUTE EATING=0
ELSE IF (ASSTEAT EQ 1 AND EATSPEQ EQ 1)
COMPUTE EATING=1
ELSE IF (ASSTEAT EQ 1 AND EATPERS EQ 1)
COMPUTE EATING=1
ELSE
COMPUTE EATING=99
END IF
DO IF (ASSTOUTB EQ 2)
COMPUTE TRANSFER=0
ELSE IF (ASSTOUTB EQ 1 AND OUTBSPEQ EQ 1)
COMPUTE TRANSFER=1
ELSE IF (ASSTOUTB EQ 1 AND OUTBPERS EQ 1)
COMPUTE TRANSFER=1
ELSE IF (CHAIFAST EQ 1)
COMPUTE TRANSFER=1
ELSE IF (BEDFAST EQ 1)
COMPUTE TRANSFER=1
ELSE
COMPUTE TRANSFER=99
END IF
DO IF (ASSTTOIL EQ 2)
COMPUTE TOILTING=0
ELSE IF (ASSTTOIL EQ 1 AND TOILSPEQ EQ 1)
COMPUTE TOILTING=1
ELSE IF (ASSTTOIL EQ 1 AND TOILPERS EQ 1)
COMPUTE TOILTING=1
ELSE
COMPUTE TOILTING=99
END IF
DO IF (HELPFONE EQ 2)
COMPUTE FONEUSE=0
ELSE IF (HELPFONE EQ 1)
COMPUTE FONEUSE=1
ELSE
COMPUTE FONEUSE=99
END IF
DO IF (WALKHELP EQ 2)
COMPUTE WALKING=0
ELSE IF (WALKHELP EQ 1 AND WALKSPEQ EQ 1)
COMPUTE WALKING=1
ELSE IF (WALKHELP EQ 1 AND WALKPERS EQ 1)
COMPUTE WALKING=1
ELSE
COMPUTE WALKING=99
END IF
DO IF (HANDLE$ EQ 2)
COMPUTE MONEYMGT=0
ELSE IF (HANDLE$ EQ 1)
COMPUTE MONEYMGT=1
ELSE
COMPUTE MONEYMGT=99
END IF
DO IF (OUTFACIL EQ 2)
COMPUTE TRAVEL=0
ELSE IF (OUTFACIL EQ 1 AND OUTSPEQ EQ 1)
COMPUTE TRAVEL=1
ELSE IF (OUTFACIL EQ 1 AND OUTPERS EQ 1)
COMPUTE TRAVEL=1
ELSE
COMPUTE TRAVEL=99
END IF
DO IF (DIFBOWEL EQ 2 OR DIFBLADD EQ 2)
COMPUTE CONTINEN=0
ELSE IF ((DIFBOWEL EQ 1 AND FDIFBOWL LE 3) OR (DIFBLADD EQ 1 AND FDIFBLAD LE 3))
COMPUTE CONTINEN=1
ELSE IF ((DIFBOWEL EQ 1 AND FDIFBOWL EQ 4) OR (DIFBLADD EQ 1 AND FDIFBLAD EQ 4))
COMPUTE CONTINEN=0
ELSE IF (ONLYNITE EQ 1)
COMPUTE CONTINEN=1
ELSE IF (OSTOCATH EQ 1)
COMPUTE CONTINEN=1
ELSE
COMPUTE CONTINEN=99
END IF
DO IF (BSTEAL EQ 1 OR BGETLOST EQ 1 OR BADATTIM EQ 1)
COMPUTE COGNETIV=1
ELSE
COMPUTE COGNETIV=0
END IF
MISSING VALUES BATHING TO COGNETIV(99)
COMPUTE AGE=1985-DATEBIRY
VALUE LABEL BATHING TO COGNETIV 0 ‘INDEPENDENT’ 1 ‘DISABLED’
| 1.b) | Since not all the questions were answered by all the respondents missing values were generated in the calculation of ADL & IADL scores. The respondents who had 6 or more ADL IADL scores missing were excluded from further calculations. For the remaining respondents the missing value was substituted by the mean value of the specific ADL IADL score of the appropriate age and sex. The following logical statements were used to employ ADL & IADL scores in order to create DISABILITY proportions for institutionalized sample. |
COUNT NOFMISS=BATHING TO COGNET IV(99)
DO IF (NOFMISS GE 6)
MISSING VALUES BATHING TO COGNETIV( )
COMPUTE CHECK=1
ELSE
COMPUTE CHECK=0
END IF
IF (AGE EQ 106) TOILTING=0
COMPUTE SEVERADL=EATING+TRANSFER+TOILTING+DRESSING+CONTINEN+COGNETIV
COMPUTE MODADL=EATING+TRANSFER+TOILTING+DRESSING+CONTINEN+BATHING
COMPUTE MODIADL=WALKING+FONEUSE+TRAVEL
DO IF (CHECK EQ 1)
COMPUTE DISABLTY=99
ELSE IF (SEVERADL GE 2)
COMPUTE DISABLTY=4
ELSE IF (MODADL EQ 1 OR (MODIADL EQ 2))
COMPUTE DISABLTY=3
ELSE IF (TRAVEL EQ 1 OR (MONEYMGT EQ 1 AND FONEUSE EQ 1))
COMPUTE DISABLTY=2
ELSE
COMPUTE DISABLTY=1
END IF
| 1.c) | after the disability score for each respondent in the sample was calculated, a frequency table of this score for each single year of age and sex was formed. The % of the respondents at each level of disability of this table was used as the proportion of the sample with that level of disability for the specific age and sex. As a result of the above performance for each single year of age and sex four disability proportion exist. i.e. Age sex No or Mild Dis. Mod Dis. Sev. Dis. |
****************************************************************************************************
| 2.a) | In order to arrive at the non-institutionalized DISABILITY proportions the 1982 National Long Term Care (Detailed Survey) were used. The following logical statements were used to arrive at ADL & IADL scores. (The questions that the Variable names stand for are listed first.) |
PCTRLBS : TROUBLE CONTROLLING BLADDER?
PCOLOS : USE CATHETER OR COLOSTOMY?
PHUEAT1 : IN PAST WEEK GET HELP TO EAT?
PFEEDU : DID SOMEONE FEED YOU?
PCUTMEAT : DID SOMEONE CUT YOUR MEAT?
PSPUTN2 : DID YOU USE SPECIAL UTENSILS?
PSPUTN1 : USE SPECIAL UTENSILS?
PNEPEAT1 : SOMEONE STAY NEAR WHEN EATING?
PPWALKIN : PROBLEM WALKING INSIDE WITHOUT HELP?
PFONHERE : IS THERE A PHONE HERE?
PCANFON : CAN YOU MAKE OWN PHONE CALLS?
PTYPEON : IS IT A REGULAR OR SPECIAL PHONE?
PUFON : DO YOU MAKE OWN PHONE CALLS?
PMG$WOH : MANAGE MONEY WITHOUT HELP?
PHNWALK : NEED HELP OUTSIDE OF WALKING DISTANCE?
PHBATHRM : SOMEONE HELP YOU TO BATHROOM?
PUTOIL2 : TAKE YOURSELF TO TOILET?
PSPTOL1 : USE SPECIAL EQUIPMENT TO USE TOILET?
PNEPTOL2 : SOMEONE STAY NEAR I CASE NEED HELP?
PHDRESS : SOMEONE HELP YOU GET DRESSED?
PSPDRES1 : SPECIAL CLITHING OR EQUIPMENT TO DRESS?
PNERDRS1 : SOMEONE STAY NEAR IN CASE YOU NEED HELP?
PNOBED : NOT GET OUT OF BED?
PWCHAIR : CONFINED TO A WHEELCHAIR?
PHUBED : SOMEONE HELP YOU GET IN/OUT OF BED?
PSPBED1 : USE SPECIAL EQUIPMENT TO GET OUT OF BED?
PNEP1 : SOMEONE STAY NEAR IN CASE NEED HELP?
PHBATHE : SOMEONE HELP YOU BATHE?
PSNKBSN : WASH AT SINK OR BASIN?
PBEDBATH : HAVE A BEDBATH?
PSPBATH1 : USE SPECIAL EQUIPMENT TO BATHE?
PNERBTH1 : SOMEONE STAY NEAR IN CASE NEED HELP?
PLOST : GET LOST AND NOT FIND WAY BACK?
PSTEAL : TAKE SOMETHING NOT BELONGING TO YOU?
PFORGET : FORGET IMPORTANT THINGS?
PUMEAL : DO YOU PREPARE OWN MEALS?
PCANMEAL : CAN YOU PREPARE OWN MEALS?
PRMOMEAL : REASON CAN NOT PREPARE OWN MEALS
PUSHOP2 : DO YOU SHOP FOR OWN GROCERIES?
PCANSHOP : CAN YOU SHOP FOR OWN GROCERIES?
PRNOSHOP : REASON CAN NOT SHOP FOR GROCERIES
PLWORK2 : DO YOU DO LIGHT WORK?
PCANLWK : CAN YOU DO LIGHT WORK?
PRNOLWK : REASON CAN NOT DO LIGHT WORK
PLAUD1 : DO YOU DO LAUNDRY?
PCANLAUD : CAN YOU DO LAUNDRY?
PRNOLAUD : REASON CAN NOT DO LAUNDRY
DO IF (PCTRLBB EQ 2)
COMPUTE CONTINEN=0
ELSE IF (PCTRLBB EQ 1)
COMPUTE CONTINEN=1
ELSE IF (PCOLOS EQ 1)
COMPUTE CONTINEN=1
ELSE
COMPUTE CONTINNEN=99
END IF
DO IF (PHUEAT1 EQ 3)
COMPUTE EATING=99
ELSE IF (PHUEAT1 EQ 1 AND PFEEDU EQ 1)
COMPUTE EATING=1
ELSE IF (PHUEAT1 EQ 1 AND PCUTMEAT EQ 1 AND PSPUTN2 EQ 2)
COMPUTE EATING=0
ELSE IF (PHUEAT1 EQ 1 AND PCUTMEAT EQ 1 AND PSPUTN2 EQ 1)
COMPUTE EATING=1
ELSE IF (PHUEAT1 EQ 1)
COMPUTE EATING=1
ELSE IF (PHUEAT1 EQ 2 AND PSPUTN1 EQ 1)
COMPUTE EATING=1
ELSE IF (PHUEAT1 EQ 2 AND PNEREAT1 EQ 1)
COMPUTE EATING=1
ELSE IF (PHUEAT1 EQ 2)
COMPUTE EATING=0
ELSE
COMPUTE EATING=99
END IF
DO IF (PPWALKIN EQ 1)
COMPUTE WALKING=1
ELSE IF (PPWALKIN EQ 2)
COMPUTE WALKING=0
ELSE
COMPUTE WALKING=99
END IF
DO IF (PFONHERE EQ 2 AND PCANFON EQ 1)
COMPUTE FONDUSE=0
ELSE IF (PFONHERE EQ 2 AND PCANFON EQ 2)
COMPUTE FONEUSE=1
ELSE IF (PFONHERE EQ 1 AND PTYPFON EQ 1 AND PUFON EQ 1)
COMPUTE FONEUSE=0
ELSE IF (PFONHERE EQ 1 AND PTYPFON EQ 2 AND PUFON EQ 1)
COMPUTE FONEUSE=1
ELSE IF (PFONHERE EQ 1 AND PTYPFON EQ 1 AND PUFON EQ 2)
COMPUTE FONEUSE=1
ELSE IF (PFONHERE EQ 1 AND PTYPFON EQ 2 AND PUFON EQ 2)
COMPUTE FONEUSE=1
ELSE
COMPUTE FONEUSE=99
END IF
DO IF (PMG$WOH EQ 1)
COMPUTE MONEYMGT=0
ELSE IF (PMG$WOH EQ 2)
COMPUTE MONEYMGT=1
END IF
DO IF (PNHWALK EQ 1)
COMPUTE TRAVEL=1
ELSE
COMPUTE TRAVEL=0
END IF
DO IF (PHBATHRM EQ 3 AND PUTOIL2 EQ 1)
COMPUTE TOILTING=1
ELSE IF (PHBATHRM EQ 1)
COMPUTE TOILTING=1
ELSE IF (PHBATHRM EQ 2 AND PSPTOL1 EQ 1)
COMPUTE TOILTING=1
ELSE IF (PHBATHRM EQ 2 AND PNERTOL1 EQ 1)
COMPUTE TOILETING=1
ELSE IF (PHBATHRM EQ 2)
COMPUTE TOILTING=0
ELSE
COMPUTE TOILTING=99
END IF
DO IF (PHDRESS EQ 3 AND PHPJ EQ 1)
COMPUTE DRESSING=1
ELSE IF (PHDRESS EQ 2 AND PSPDRES1 EQ 1)
COMPUTE DRESSING=1
ELSE IF (PHDRESS EQ 2 AND PNERDRS1 EQ 1)
COMPUTE DRESSING=1
ELSE IF (PHDRESS EQ 3)
COMPUTE SHOPPING=99
END IF
DO IF (PLWORK2 EQ 1 OR PCONLWK EQ 1)
COMPUTE HKEEP=0
ELSE IF (PLWORK2 EQ 2 OR PCANLWK EQ 2 AND PRNOLWK EQ 1)
COMPUTE HKEEP=1
ELSE
COMPUTE HKEEP=99
END IF
DO IF (PLAUD1 EQ 1 OR PCANLAUD EQ 1)
COMPUTE LAUNDRY=0
ELSE IF (PLAUD1 EQ 2 OR PCANLAUD EQ 2 AND PRNOLAUD EQ 1)
COMPUTE LAUNDRY=1
ELSE
COMPUTE LAUNDRY=99
END IF
DO IF (LAUNDRY EQ 1 OR HKEEP EQ 1)
COMPUTE HOUSKEEP=1
ELSE IF (LAUNDRY EQ 99 AND HKEEP EQ 99)
COMPUTE HOUSKEEP=99
ELSE
COMPUTE HOUSKEEP=0
END IF
MISSING VALUES CONTINEN TO HOUSKEEP (99)
VALUE LABEL
CONTINEN TO HOUSKEEP 0 ‘INDEPENDENT’ 1 ‘DISABLED’/
| 2.b) | Since not all the questions were answered by all the respondents missing values were generated in the calculation of ADL & IADL scores. The respondents that had 8 or more ADL & IADL scores missing were excluded from further calculations. For the remaining respondents the missing values were substituted by the mean value of the specific ADL IADL score of the appropriate age and sex. The following logical statments were used to employ ADL & IADL scores in order to create DISABILITY proportions for non-institutionalized sample. |
RECODE HOUSKEEP(SYSMIS=0)
COUNT NOFMISS=BATHING DRESSING EATING TOILTING TRANSFER CONTINEN WALKING FONEUSE MONEYMGT TRAVEL COGNETIV MEALPREP SHOPPING HKEEP LAUNDRY HOUSKEEP(99)
DO IF (NOFMISS GE 8)
COMPUTE CHECK=1
ELSE
COMPUTE CHECK=0
END IF
COMPUTE SEVERADL=EATING+TRANSFER+TOILTING+DRESSING+CONTINEN+COGNETIV
IF (SEVERADL GT 0 AND SEVEADL LT 1)SEVERADL=0
IF (FONEUSE GT 0 AND FONEUSE LT 1)FONEUSE=0
RECODE MONEYMGT(SYSMIS=0)
COMPUTE MODADL=EATING+TRANSFER+TOILTING+DRESSING+CONTINEN
IF (MODADL GT 0 AND MODADL LT 1)MODADL=0
COMPUTE MODIADL=HOUSKEEP+SHOPING+MEALPREP+WALKING
IF (MODIADL GT 1 AND MODIADL LT2)MODIADL=1
COMPUTE MODIADL2=MODIADL+TRAVEL+FONEUSE
COMPUTE MILDIADL=MODIALD+TRAVEL
COMPUTE OTHRIADL=MONEYMGT+FONEUSE
COMPUTE IADL=HOUSKEEP+SHOPPING+MEALPREP+FONEUSE+MONEYMGT+TRAVEL
COMPUTE ADL=EATING+DRESSING+TOILTING+BATHING+TRANSFER
DO IT (CHECK=1)
COMPUTE DISABLTY=99
ELSE IF (SEVERADL GE 2)
COMPUTE DISABLTY=4
ELSE IF (MODADL EQ 1 OR BATHING EQ 1 OR(MODIADL2 GE 2 AND MODIADL GE 1))
COMPUTE DISABLTY=3
ELSE IF (MILDIADL EQ 1 OR OTHRIADL EQ 2)
COMPUTE DISABLTY=2
ELSE IF (ADL EQ 0 AND IALD EQ 0 OR (ADL EQ 0 AND (MONEYMGT FQ 1 OR FONEUSE EQ 1)))
COMPUTE DISABLTY=1
ELSE
COMPUTE DISABLTY=1
END IF
MISSING VALUES DISABLTY ADL (99)
RECODE DISABLTY(SYSMIS=2)
| 2.c) | after the disability score for each respondent in the sample was calculated, a frequency table of this score for each single year of age and sex was formed. The % of the respondents at each level of disability of this table was used as the proportion of the sample with that level of disability for the specific age and sex. As a result of the above performance for each single year of age and sex four disability proportions exist. i.e. Age sex No or Mild Dis. Mod Dis. Sev. Dis. |
****************************************************************************************************
inistitutionalized with severe dis.(2.c
To compensate for variation in sample size in different age and sex and sampling error a five year moving average procedure was used. The five year consisted of two years before and two years after. As a result of this procedure the fist two ages (65 and 66) remained blank, for 65 the actual proportions as they were used, for 66 the three year moving average was used.
Because the sample size for ages 95+ was very small, the disability proportions for ages 95-99 and 100+ was calculated together as a group rather than single year of age, for this reason the dis. proportions for these two age group are the actual proportions rather than the smoothed one. however the single year of age disability proportions for 95 and 96 was used to calculate the smoothed dis. proportion for 94 year olds.
PROGRAM NAME: PROCORR
- Weights NLTCS detailed sample by its relative representation in total sample
- Combines weighted disability rates for community and nursing home sample
- Calculates five-year moving average for total disability rates
FILE: PROCORR SAS A MIAMI UNIVERSITY VM/CMS REL 5
CMS FILEDEF RATE95 DISK INSTR3 DATA;
CMS FILEDEF DISABLTY DISK COMOIS95 DATA;
CMS FILEDEF RATIOS DISK INSTRATE DATA;
CMS FILEDEF DISABL95 DISK COMOIS95 DATA;
DATA INS_COM;
INFILE RATIOS;
INPUT AGE MALEINS MALECOM FEMALINS FEMALCOM;
IF AGE >=65;
DATA INS_COM5;
INFILE RATE95;
INPUT AGE MALEINS MAILCOM FEMALINS FEMALCOM;
DATA PART2;
INFILE DISABLTY;
INPUT AGE SEX NN NNMI NNMC NNS NL NLMI NLMO NLS;
NTOTAL=NN+NNMI+NNMO+NNS;
ADJUSTN=1-NTOTAL;
IF NTOTAL1 THEN NNN=NN+ADJUSTN;
ELSE IF NTOTAL=1.001 THEN NNN=NN+ADJUSTN;
ELSE IF NTOTAL=1.000 THEN NNN=NN;
LTOTAL=NL+NLMI+NLM0+NLS;
ADJUSTL=1-LTOTAL;
IF LTOTAL1 THEN NLN=NL+ADJUSTL;
ELSE IF LTOTAL=1.001 THEN NLN=NL+ADJUSTL;
IF LTOTAL=1.000 THEN NLN-NL;
NTOTAL=NNN+NNMI+NNMO+NNS;
LTOTALC=NLN+NLMI+NLMO+NLS;
PROC PRINT; VAR NTOTALC LTOTALC;
DATA PART295;
INFILE DISABL95;
INPUT AGE SEX NNN NNMI NNMO NNS NLN NLMI NLMO NLS;
NTOTAL=NNN+NNMI+NNMO+NNS;
LTOTAL=NLN+NLMI+NLMO+NLS;
CMS FILEDEF SWEIGHT DISK SOWEIGHT DATA A;
CMS FILEDEF SWEIGHT2 DISK SOW95PLS DATA A;
DATA NEWFIND; INFILE SWEIGHT; INPUT AGE 1-3 SEX 5 WEIGHT 7-14 6;
PROC SORT; BY AGE SEX;
PROC PRINT;
DATA NEWFIND2; INFILE SWEIGHT2; INPUT AGE 1-3 SEX 5 WEIGHT 7-14 6;
PROC SORT; BY AGE SEX;
PROC PRINT;
DATA CORRCTED;
MERGE PART2 NEW FIND; BY AGE SEX;
CNLMI-WEIGHT*NLMI;
CNLMO=WEIGHT*NLMO;
CNLS=WEIGHT*NLS;
CNLN=1-(CNLMI+CNLMO+CNLS);
CLTOTAL=CNLN+NCLMI+CNLMC+CNLS;
DATA C95PLUS;
MERGE PART295 NEWFIND2;
CNLMI=WEIGHT*NLMI;
CNLMO=WEIGHT*NLMO;
CNLS=WEIGHT*NLS;
CNLN=1-(CNLMI+CNLMO+CNLS);
CLTOTAL=CNLN+CNLMI+CNLMO+CNLS;
PROC PRINT;
DATA MALE;
SET CORRCTED;
KEEP AGE SEX NNN NNMI NNMO NNS CNLN CNLMI CNLMO CNLS;
IF SEX=1;
DATA FEMALE;
SET CORRCTED;
IF SEX=2;
KEEP AGE SEX NNN NNMI NNMO NNS CNLN CNLMI CNLMO CNLS;
REMAIN NNN=NNNF NNMI=NNMIF NNMO=NNMCF NNS=NNSF CNLN=CNLNF CNLMI=CNLMIF CNLMO=CNLMOF CNLS=CNLSF;
DATA ALL;
MERGE MALE FEMALE;
BY AGE;
DATA ADJUSTED;
MEGER ALL INS_COM;
BY AGE;
PNDM=MALEINS*NNN+MALECOM*CNLN;
PNDF=FEMALINS*NNNF+FEMALCOM*CNLNF;
PLDM=MALEINS*NNMI+MALECOM*CNLMI;
PLDF=FEMALINS*NNMIF+FEMALCOM*CNLMIF;
PMODDM=MALEINS*NNMC+MALECOM*CNLMO;
CMODDF=FEMALINS*NNMCF+FEMALCOM*CNLMOF;
PMOSDM=MALEINS*NNS+MALECOM*CNLS;
PMOSDF=FEMALINS*NNSF+FEMALCOM*CNLSF;
PNDM_1=LAG(PNDM);
PNDF_1=LAG(PNDF);
PLDM_1=LAG(PLDM);
PLDF_1=LAG(PLDF);
PMODDM_1=LAG(PMODDM);
PMODDF_1=LAG(PMODDF);
PMOSDM_1=LAG(FMOSDM);
PMOSDF_1=LAG(FMOSDF);
PNDM_2=LAG(PNDM_1);
PNDF_2=LAG(PNDF_1);
PLDM_2=LAG(PLDM_1);
PLDF_2=LAG(PLDF_1);
PMODDM_2=LAG(PMODDM_1);
PMODDF_2=LAG(PMODDF_1);
PMOSDM_2=LAG(PMOSDM_1);
PMOSDF_2=LAG(PMOSDF_1);
PNDM_3=LAG(PNDM_2);
PNDF_3=LAG(PNDF_2);
PLDM_3=LAG(PLDM_2);
PLDF_3=LAG(PLDF_2);
PMODDM_3=LAG(PMODDM_2);
PMODDF_3=LAG(PMODDF_2);
PMOSDM_3=LAG(PMOSDM_2);
PMOSDF_3=LAG(PMOSDF_2);
PNDM_4=LAG(PNDM_3);
PNDF_4=LAG(PNDF_3);
PLDM_4=LAG(PLDM_3);
PLDF_4=LAG(PLDF_3);
PMODDM_4=LAG(PMODDM_3);
PMODDF_4=LAG(PMODDF_3);
PMOSDM_4=LAG(PMOSDM_3);
PMOSDF_4=LAG(PMOSDF_3);
DATA LEAD1;
SET ADJUSTED;
KEEP AGE PNDM--PMOSDF;
RENAME PNDM=PNDM1 PNDF=PNDF1 PLDM=PLDM1 PLDF=PLDF1 PMODDM=PMODDM1 PMODDF=PMODDF1 PMOSDM=PMOSDM1 PMOSDF=PMOSDF1;
AGE=AGE+1;
DATA LEAD2;
SET ADJUSTED;
KEEP AGE PNDM--PMOSDF;
RENAME PNDM=PNDM2 PNDF=PNDF2 PLDM=PLDF2 PMODDM=PMODDM2 PMODDF=PMODDF2 PMOSDM=PMOSDM2 PMOSDF=PMOSDF2;
AGE=AGE+2;
DATA LEAD3;
SET ADJUSTED;
KEEP AGE PNDM--PMOSDF;
RENAME PNDM=PNDM3 PNDF=PNDF3 PLDM=PLDM3 PLDF=PLDF3 PMODDM=PMODDM3 PMODDF=PMODDF3 PMOSDM=PMOSDM3 PMOSDF=PMOSDF3;
AGE=AGE+3;
DATA LEAD4;
SET ADJUSTED;
KEEP AGE PNDM--PMOSDF;
RENAME PNDM=PNDM4 PNDF=PNDF4 PLDM=PLDM4 PLDF=PLDF4 PMODDM=PMODDM4 PMODDF=PMODDF4 PMOSDM=PMOSDM4 PMOSDF=PMOSDF4;
AGE=AGE+4;
DATA ALL;
MERGE ADJUSTED LEAD1 LEAD2 LEAD3 LEAD4;
BY AGE;
SMONM3=(PNDM1+PNDM+PNDM_1)/3;
SMOLM3=(PLDM1+PLDM+PLDM_1)/3;
SMOMDDM3=(PMODDM1+PMODDM+PMODDM_1)/3;
SMOMOSM3=(PMOSDM1+PMOSDM+PMOSDM_1)/3;
SMONF3=(PNDF1+PNDF+PNDF_1)/3;
SMOLF3=(PLDF1+PLDF+PLDF_1)/3;
SMOMODF3=(PMODDF1+PMODDF+PMODDF_1)/3;
SMOMOSF3=(PMOSDF1+PMOSDF+PMOSDF_1)/3;
SMONM5=(PNDM2+PNDM1+PNDM+PNDM_1+PNDM_2)/5;
SMOLM5=(PLDM2+PLDM1+PLDM+PLDM_1+PLDM_2)/5;
SMOMODM5=(PMODDM2+PMODDM1+PMODDM+PMODDM_1+PMODDM_2)/5;
PMOMOSM5=(PMOSDM2+PMOSDM1+PMOSDM+PMOSDM_1+PMOSDM_2)/5;
SMONF5=(PNDF2+PNDF1+PNDF+PNDF_1+PNDF_2)/5;
SMOLF5=(PLDF2+PLDF1+PLDF+PLDF_1+PLDF_2)/5;
SMOMODF5=(PMODDF2+PMODDF1+PMODDF+PMODDF_1+PMODDF_2)/5;
SMODOSF5=(PMOSDF2+PMOSDF1+PMOSDF+PMOSDF_1+PMOSDF_2)/5;
SMONM7=(PNDM3+PNDM2+PNDM1+PNDM+PNDM_1+PNDM_2+PNDM_3)/7;
SMOLM7=(PLDM3+PLDM2+PLDM1+PLDM+PLDM_1+PLDM_2+PLDM_3)/7;
SMOMODM7=(PMODDM3+PMODDM2+PMODDM1+PMODDM+PMODDM_1+PMODDM_2+PMODDM_3)/7;
SMOMOSM7=(PMOSDM3+PMOSDM2+PMOSDM1+PMOSDM+PMOSDM_1+PMOSDM_2+PMOSDM_3)/7;
SMONF7=(PNDF3+PNDF2+PNDF1+PNDF+PNDF_1+PNDF_2+PNDF_3)/7;
SMOLF7=(PLDF3+PLDF2+PLDF1+PLDF+PLDF_1+PLDF_2+PLDF_3)/7;
SMOMODF7=(PMODDF3+PMODDF2+PMODDF1+PMODDF+PMODDF_1+PMODDF_2+PMODDF_3)/7;
SMOMOSF7=(PMOSDF3+PMOSDF2+PMOSDF1+PMOSDF+PMOSDF_1+PMOSDF_2+PMOSDF_3)/7;
SMONM9=(PNDM4+PNDM3+PNDM2+PNDM1+PNDM+PNDM_1+PNDM_2+PNDM_3+PNDM_4)/9; ;
SMOLM9=(PLDM4+PLDM3+PLDM2+PLDM1+PLDM+PLDM_1+PLDM_2+PLDM_3+PLDM_4)/9;
SMOMODM9=(PMODDM3+PMODDM2+PMODDM1+PMODDM+PMODDM_1+PMODDM_2+PMODDM_3+PMODDM4+PMODDM_4)/9;
SMOMOSM9=(PMOSDM3+PMOSDM2+PMOSDM1+PMOSDM+PMOSDM_1+PMOSDM_2+PMOSDM_3+PMOSDM4+PMOSDM_4)/9;
SMONF9=(PNDF4+PNDF3+PNDF2+PNDF1+PNDF+PNDF_1+PNDF_2+PNDF_3+PNDF_4)/9;
SMOLF9=(PLDF4+PLDF3+PLDF2+PLDF1+PLDF+PLDF_1+PLDF_2+PLDF_3+PLDF_4)/9;
SMOMODF9=(PMODDF3+PMODDF2+PMODDF1+PMODDF+PMODDF_1+PMODDF_2+PMODDF_3+PMODDF4+PMODDF_4)/9;
SMOMOSF9=(PMOSDF3+PMOSDF2+PMOSDF1+PMOSDF+PMOSDF_1+PMOSDF_2+PMOSDF_3+PMOSDF4+PMOSDF_4)/9;
PROC PRINT; VAR AGE SMONM3--SMOMCSF3;
DATA MALE95;
SET C95PLUS;
KEEP AGE SEX NNN NNMI NNMO NNS CNLN CNLMI CNLMO CNLS;
IF SEX=1;
DATA FEMALE95;
SET C95PLUS;
IF SEX=2;
KEEP AGE SEX NNN NNMI NNMO NNS CNLN CNLMI CNLM0 CNLS;
RENAME NNN=NNNF NNMI=NNMIF NNMO=NNMOF NNS=NNSF CNLN=CNLNF CNLMI=CNLMF CNLMO=CNLMOF CNLS=CNLSF;
DATA ALL95;
MERGE MALE95 FEMALE95;
BY AGE;
DATA ADJUST95;
MERGE ALL95 INS_COM5;
BY AGE;
PNDM=MALEINS*NNN*MALECOM*CNLN;
PNDF=FEMALINS*NNNF*FEMALCOM*CNLNF;
PLDM=MALEINS*NNMI+MALECOM*CNLMI;
PLDF=FEMALINS*NNMIF+FEMALCOM*CNLMIF;
PMODDM=MALEINS*NNMO+MALECOM*CNLMO;
PMODDF=FEMALINS*NNMOF+FEMALCOM*CNLMOF;
PMOSDM=MALEINS*NNS+MALECOM*CNLS;
PMOSDF=FEMALINS*NNSF+FEMALCOM*CNLSF;
SMONM5=PNDM;
SMOLM5=PLDM;
SMOMODM5=PMCDDM;
SMOMOSM5=PMCSDM;
SMONF5=PNDF;
PMOLF5=PLDF;
SMOMODF5=PMCDDF;
SMOMOSF5=PMCSDF;
DATA ALL_1;
SET ALL;
IF AGE95 AND AGE>=65;
KEEP AGE PNDM--PMOSDF SMONM5=SMOMOSF5;
PROC PRINT;VAR AGE PNDM--PMOSDF SMONM5--SMOMOSF5;
DATA ALL95_C; SET ADJUST95;
KEEP AGE PNDM--PMOSDF SMONM5--SMOMOSF5;
DATA FINAL;SET ALL_1 ALL95_C;
IF AGE=65 THEN SMONM5=.886539;
IF AGE=65 THEN SMOLM5=.0186755;
IF AGE=65 THEN SMOMODM5=.052111;
IF AGE=65 THEN SMOMOSM5=.042674;
IF AGE=65 THEN SMONF5=.872375;
IF AGE=65 THEN SMOLF5=.0129119;
IF AGE=65 THEN SMOMCDF5=.068478;
IF AGE=65 THEN SMOMCSF5=.046236;
IF AGE=66 THEN SMONM5=.898503;
IF AGE=66 THEN SMOLM5=.0155162;
IF AGE=66 THEN SMOMCDM5=.047082;
IF AGE=66 THEN SMOMCSM5=.038899;
IF AGE=66 THEN SMONF5=.879552
IF AGE=66 THEN SMOLF5=.0116058;
IF AGE=66 THEN SMOMCDF5=.061800;
IF AGE=66 THEN SMOMCSF5=.047042;
TM=SUM(OF SMONM5--SMOMCSM5);
TF=SUM(CF SMONF5--SMOMCSF5);
PROC PRINT; VAR TM TF;
PROC PRINT;
VAR AGE PNDM--PMOSDF;
PROC PRINT;
VAR AGE SMONM5--SMOMOSF5;
CMS FILEDEF OUT DISK FILE1C DATA;
DATA LAST; FILE OUT;SET FINAL;
PUT @1 ‘1986’ @5 ‘1’ AGE 6-8 SMONM5 10-17 6 SMOLM5 19-26 6 SMOMODMS 28-35 6 SMOMCSM5 37-44 6 SMONF5 46-53 F SMOLF5 55-62 6 SMOMCDF5 64-71 6 SMOMOSF5 73-80 6;
PROGRAM NAME: DISESFIO
- Sample program that calcaltes marginals for projected disability over time; this example calculates marginals for an increase of 7.5% in disability of women
FILE: DISESF10 SAS A MIAMI UNIVERSITY VM/CMS REL 5
TITLE1 ‘THIS FILE WILL CREATE THE “MARGINAL” DISABILITIES FOR 1986’;
TITLE2 ‘AND EVERY FIVE YEAR AFTER THAT. THE 7.5% CHANGE IS DIVIDED’;
TITLE 3 ‘EVENLY BETWEEN 1986 AND 2010’;
DATA MARGINAL;
INPUT YEAR SEX MD1-MD4;
TOTAL=MD1+MD2+MD3+MD4;
ARRAY A MD1-MD4;
ARRAY B SMD1-SMD4;
DO OVER A;
DO OVER B;
B=A/32;
END; END;
TOTAL SD=SUM(OF SMD1-SMD4);
CHNG1SM2=SMD2*1.015;
CHNG1SM3=SMD3*1.015;
CHNG1SM4=SMD4*1.015;
CHNG1SM1=1-(CHNG1SM4+CHNG1SM2+CHNG1SM3);
CHNG2SM2=CHNG1SM2*1.015;
CHNG2SM3=CHNG1SM3*1.015;
CHNG2SM4=CHNG1SM4*1.015;
CHNG2SM1=1-(CHNG2SM4+CHNG2SM2+CHNG2SM3);
CHNG3SM2=CHNG2SM2*1.015;
CHNG3SM3=CHNG2SM3*1.015;
CHNG3SM4=CHNG2SM4*1.015;
CHNG3SM1=1-(CHNG3SM4+CHNG3SM2+CHNG3SM3);
CHNG4SM2=CHNG3SM2*1.015;
CHNG4SM3=CHNG3SM3*1.015;
CHNG4SM4=CHNG3SM4*1.015;
CHNG4SM1=1-(CHNG4SM4+CHNG4SM2+CHNG4SM3);
CHNG5SM2=CHNG4SM2*1.015;
CHNG5SM3=CHNG4SM3*1.015;
CHNG5SM4=CHNG4SM4*1.015;
CHNG5SM1=1-(CHNG5SM4+CHNG5SM2+CHNG5SM3);
TOTAL1=SUM(CF CHNG1SM1-CHNG1SM4);
TOTAL2=SUM(CF CHNG2SM1-CHNG2SM4);
TOTAL3=SUM(CF CHNG3SM1-CHNG3SM4);
TOTAL4=SUM(CF CHNG4SM1-CHNG4SM4);
TOTAL5=SUM(CF CHNG5SM1-CHNG5SM4);
CARDS;
1986 2 20.7352 .60281 4.59481 6.06717
PROC PRINT; VAR SMD1-SMD4 TOTAL SD;
PROC PRINT; VAR CHNG1SM1-CHNG1SM4 TOTAL1;
PROC PRINT; VAR CHNG2SM1-CHNG2SM4 TOTAL2;
PROC PRINT; VAR CHNG3SM1-CHNG3SM4 TOTAL3;
PROC PRINT; VAR CHNG4SM1-CHNG4SM4 TOTAL4;
PROC PRINT; VAR CHNG5SM1-CHNG5SM4 TOTAL5;
CMS FILEDEF R1 DISK R1 DATA;
DATA NEW; SET MARGINAL; FILE R1;
PUT ‘1986’ SEX SMD1-SMD4;
CMS FILEDEF R2 DISK R2 DATA;
DATA NEW; SET MARGINAL; FILE R2;
PUT ‘1990’ SEX CHNG1SM1-CHNG1SM4;
CMS FILEDEF R3 DISK R3 DATA;
DATA NEW; SET MARGINAL; FILE R3;
PUT ‘1995’ SEX CHNG2SM1-CHNG2SM4;
CMS FILEDEF R4 DISK R4 DATA;
DATA NEW; SET MARGINAL; FILE R4;
PUT ‘2000’ SEX CHNG3SM1-CHNG3SM4;
CMS FILEDEF R5 DISK R5 DATA;
DATA NEW; SET MARGINAL; FILE R5;
PUT ‘2005’ SEX CHNG4SM1-CHNG4SM4;
CMS FILEDEF R6 DISK R6 DATA;
DATA NEW; SET MARGINAL; FILE R6;
PUT ‘2010’ SEX CHNG5SM1-CHNG5SM4;
PROGRAM NAME: MATRXFIO
- Sample program that projects proportions disabled to the marginals calculated in preceeding program
FILE: MATRXFI0 SAS A MIAMI UNIVERSITY VM/CMS REL 5
TITLE1 ‘THIS PROGRAM PRODUCES THE PROJECTIONS FOR FEMALE’;
************** PROGRAM CREATING AGE SPECIFIC TRANSITION RATES ******;
*NOTE THIS PROGRAM WILL BE RUN FOR MALE AND FEMALE SEPARATELY AND *;
* THE TWO DATA SETS WILL BE COMBINED*;
* INPUT AGE-SPECIFIC BASE RATES ;
CMS FILEDEF RAW DISK FILEIO DATA;
DATA BASE;
INFILE RAW;
INPUT @6 AGE 3. @46 R1 8.7 @55 R2 8.7 @64 R3 8.7 @73 R4 8.7;
PROC SORT;
BY AGE;
* INPUT COLUMN MARGINALS OVER TIME HORIZON;
* NOTE FIRST OBSERVATION IS BASE RATES’ MARGINALS;
CMS FILEDEF RAW1F DISK RAW10F DATA;
DATA MARGINAL;
INFILE RAW1F;
INPUT YEAR 1-4 @7 R1-R4;
PROC SORT;
BY YEAR;
********** CONVERSIONS *************** ;
PROC MATRIX FUZZ FW=10;
* FETCHING DATA IN BASE = AGER;
FETCH AGER 36 DATA = BASE (KEEP=R1-R4);
* FETCHING BASE RATES’ MARGINALS = BCM;
FETCH BCM 1 DATA = MARGINAL (KEEP=R1-R4);
******** LOOP YEAR FOR EACH FUTURE YEAR IN TIME HORIZON *****;
* DO YEAR = 1985 TO 2040 BY 5;
DO YEAR = 1985 TO 2010 BY 5;
WK1 = J(36,4,0);
* FETCHING GOAL COLUMN MARGINAL = GCM ;
FETCH GCM 1 DATA=MARGINAL (KEEP=R1-R4);
* COMPUTING ROW VECTOR OF INITIAL COLUMN RATIOS = ICR ;
ICR = GCM #/ BCM ;
PRINT ICR;
* ROUND 1 ADJUSTMENT WHERE ROUND = ADJUSTMENT BASED ON COLUMN THEN ROW TOTALS;
DO I = 1 TO 36;
WK1(I,) = AGER(I,) * ICR ;
END;
LINK RSUM;
* ADDITIONAL ROUNDS CONTROLLED BY INDEX TIMES -- SET TO DO 8 IN ALL;
DO TIME = 2 TO 8;
LINK CSUM;
LINK RSUM;
END;
************** OUTPUT TO SAS DATA SET = PROGRATE ********;
OUTDAT = J(36,7,0);
* SET YEAR ON RECORD ;
OUTDAT(,1) = YEAR;
* SET DISABILITY SERIES # ON RECORD ;
OUTDAT(,2) = 1;
* SET AGE ON RECORD ;
CT = 0;
DO AGE = 65 TO 100 ;
CT = CT + 1;
OUTDAT(CT,3) - AGE;
END;
* SET COMPUTED RATES ;
OUTDAT(,4:7) = WK1(,1:4);
* OUTPUT;
OUTPUT OUT DAT OUT=PROGRATE(RENAME=(COL1=YEAR COL2=DIS_AB_S COL3=AGE COL4=APPRO1 COL5=APPRO2 COL6=APPRO3 COL7=APPRO4));
* END LOOP;
END;
********** SUEROUNTINES RSUM & CSUM **********;
RSUM:
WK2 = J(36,4,0); RS = J(36,1,0); RRS = J(36,1,0);
RS = WK1(,+);
RRS = 1 #/ RS;
DO C = 1 TO 4;
WK2(,C) = WK1(,C) # RRS;
WK1 = WK2;
RETURN;
CSUM:
WK2 = J(36,4,0); CS = J(1,4,0); RCS = J(1,4,0);
CS = WK1(+,);
RCS = GCM #/ (CS #/ 36);
DO R = 1 TO 36;
WK2(R,) = WK1(R,) # RCS;
WK1 = WK2;
RETURN;
************ PROC MATRIX DONE **********;
************* NEW DATA SET TO DO WHATEVER WITH PROGRATE ********;
PROC PRINT DATA= PROGRATE;
SUM APPRO1 APPRO2 APPRO3 APPRO4;
BY YEAR;
CMS FILEDEF OUTF DISK FILE1F10 DATA ;
DATA NEW; SET PROGRATE; FILE OUTF;
PUT YEAR 1-4 AGE 5-8 @10 ‘2’ @12 APPRO1-APPRO4;
PROGRAM NAME: COMPRJCT
- Combines disability projections for men and women
FILE: COMPRJCT SAS A MIAMI UNIVERSITY VM/CMS REL 5
TITLE1 ‘THIS IS THE PROGRAM THAT COMBINES THE PROJECTED DISABILITY’;
TITLE2 ‘RATES FOR MALE AND FEMALE AND PRODUCES FILE129’;
CMS FILEDEF MALE DISK FILE1M29 DATA;
CMS FILEDEF FEMALE DISK FILE1F29 DATA;
DATA MALE;
INFILE MALE;
INPUT YEAR AGE SEX DISPRO1-DISPRO4;
DATA FEMALE;
INFILE FEMALE;
INPUT YEAR AGE SEX DISPRO1-DISPRO4;
DATA ALL;SET MALE FEMALE;
IF AGE>96 THEN DELETE;
IF AGE=96 THEN AGE =100;
IF YEAR=1985 THEN YEAR 1986;
PROC SORT; BY YEAR AGE SEX ;
CMS FILE DEF COMB DISK COMB DATA;
DATA LAST; SET ALL;FILE COMB;
PUT YEAR AGE SEX DISPRO1-DISPRO4;
DATA NEW; INFILE COMB;
INPUT YEAR AGE SEX DISM1-DISM4 #2 @12 DISF1-DISF4;
CMS FILEDEF XXXX DISK FILE129 DATA;
DATA NEW;SET NEW; FILE XXXX;
PUT YEAR 1-4 ‘3’ @6 AGE 3. @10 DISM1 8.7 @19 DISM2 8.7 @28 DISM3 8.7 @37 DISM4 8.7 @46 DISF1 8.7 @55 DISF2 8.7 @64 DISF3 8.7 @73 DISF4 8.7;
PROGRAM NAME: PROGIOS
- Sample program that projects numbers disabled, using population counts and disability rate matrices as input
FILE: PROGIOS SAS A MIAMI UNIVERSITY VM/CMS REL 5
TITLE1 ‘THIS IS THE 10TH SCENARIO WITH BASELINE, CONTINUATION OF ‘;
TITLE2 ‘CURRENT, MORTALITY, “1”, AND INCREASE IN DISABILITY, “4”, ‘;
TITLE3 ‘THE INCREASE IN DISABILITY IS 7.5% FROM 1985 TO 2010 AND NO’;
TITLE4 ‘CHANGE FROM 2010 TO 2040’;
************** PROGRAM I ********************************;
CMS FILEDEF FILE1 DISK FILEI10 DATA;
CMS FILEDEF FILE2 DISK CENSUS1 DATA;
TITLE “CREATING FILES 3 AND 4 FROM FILES 1 AND 2”;
* READING FILE 1 INTO SASFILES DIS_DNE, DIS_TWO, & DIS_TRI = SEGREGATING DISABILITY RATES BY DISABILITY SERIES;
DATA DIS_ONE;
INFILE FILE1;
INPUT @1 YEAR 4.0 @5 DIS_AB_S 1.0 @6 AGE 3.0 @10 MAL_D_RI 8.7 @19 MAL_D_R2 8.7 @28 MAL_D_R3 8.7 @37 MAL_D_R4 8.7 @46 FEM_D_R1 8.7 @55 FEM_D_R2 8.7 @64 FEM_D_R3 8.7 @73 FEM_D_R4 8.7;
MAL_D_R=MAL_D_R1+MAL_D_R2;
FEM-D-R=FEM_D_R1+FEM_D_R2;
PROC SORT DATA = DIS_ONE;
BY YEAR AGE;
* READING FILE 2 INTO SASFILE MCRT_ONE=SEGREGATING PROJECTED POPULATION COUNTS BY MORTALITY SERIES;
DATA MORT_ONE;
INFILE FILE2;
INPUT YEAR MORT_S AGE MALE_CNT FEM_CNT;
* MERGING INPUT SASFILES TO NIN COMBINATIONS OF RATES AND COUNTS = CREATING NINE SEPARATE SASFILES WITH PROJECTED COUNTS BY DISABILITY STATUS;
* NOTE EACH OF THESE FILES RESEMBLE FILE 3;
DATA TEMP1;
MERGE DIS_ONE MORT_ONE;
* TOTAL POPULATION AT AGE;
TOTL_CNT = MALE_CNT + FEM_CNT;
* MALE AND FEMALE COUNT BY DISABILITY STATUS;
MAL_D_C1 =ROUND(MAL_D_R1 * MALE_CNT) ; MAL_D_C2 =ROUND(MAL_D_R2 * MALE_CNT);
MAL_D_C=MAL_D_C1+MAL_D_C2;
MAL_D_C3 = ROUND(MAL_D_R3 * MALE_CNT) ;
MAL_D_C4 = MALE_CNT - (MAL_D_C1 + MAL_D_C2 + MAL_D_C3) ;
FEM_D_C1 =ROUND(FEM_D_R1 * FEM_CNT) ; FEM_D_C2 = ROUND(FEM_D_R2 * FEM_CNT);
FEM_D_C=FEM_D_C4+FEM_D_C2;
FEM_D_C3 = ROUND(FEM_D_R3 * FEM_CNT) ;
FEM_D_C4 = FEM_CNT - (FEM_D_C1 + FEM_D_C2 + FEM_D_C3) ;
* TOTAL COUNT BY DISABILITY STATUS;
TOT_D_C1 = MAL_D_C1 + FEM_D_C1 ; TOT_D_C2 = MAL_D_C2 + FEM_D_C2 ;
TOT_D_C3 = MAL_D_C3 + FEM_D_C3 ; TOT_D_C4 = MAL_D_C4 + FEM_D_C4 ;
TOT_D_C=MAL_D_C+FEM_D_C;
* PROPORTION OF TOTAL COUNT BY DISABILITY STATUS;
TOT_D_P1 = TOT_D_C1 / TOTL_CNT; TOT_D_P2 = TOT_D_C2 / TOTL_CNT;
TOT_D_P3 = TOT_D_C3 / TOTL_CNT; TOT_D_P4 = TOT_D_C4 / TOTL_CNT;
TOT_D_P=TOT_D_P1 + TOT_D_P2;
* CONCATENATE NINE SCENARIOS INTO TEMPORARY FILE 2;
DATA TFILES3;
SET TEMP1;
KEEP YEAR DIS_AB_S MORT_2 AGE TOTL_CNT MALE_CNT FEM_CNT MAL_D_R1 MAL_D_R2 MAL_D_R3 MAL_D_R4 MAL_D_R FEM_D_R1 FEM_D_R2 FEM_D_R3 FEM_D_R4 FEM_D_R MAL_D_C1 MAL_D_C2 MAL_D_C3 MAL_D_C4 MAL_D_C FEM_D_C1 FEM_D_C2 FEM_D_C3 FEM_D_C4 FEM_D_C TOT_D_C1 TOT_D_C2 TOT_D_C3 TOT_D_C4 TOT_D_C TOT_D_P1 TOT_D_P2 TOT_D_P3 TOT_D_P4 TOT_D_P;
PROC SORT DATA=TFILE3;
BY YEAR DIS_AB_S MORT_S;
* CREATING FILE 4;
DATA FILE4; SET TFILE3;
BY YEAR DIS_AB_S MORT_S;
RETAIN SUM_PCP SUM_MALE SUM_FEM S_M_D_C1 S_M_D_C2 S_M_D_C3 S_M_D_C4 S_M_D_C S_F_D_C1 S_F_D_C2 S_F_D_C3 S_F_D_C4 S_F_D_C STD_M_D1 STD_M_D2 STD_M_D3 STD_M_D4 STD_M_D STD_F_D1 STD_F_D2 STD_F_D3 STD_F_D4 STD_F_D;
ARRAY L1 SUM_POP SUM_MALE SUM_FEM S_M_D_C1 S_M_D_C2 S_M_D_C3 S_M_D_C4 S_M_D_C S_F_D_C1 S_F_D_C2 S_F_D_C3 S_F_D_C4 S_F_D_C STD_M_D1 STD_M_D2 STD_M_D3 STD_M_D4 STD_M_D STD_F_D1 STD_F_D2 STD_F_D3 STD_F_D4 STD_F_D;
ARRAY L2 TOTL_CNT MALE_CNT FEM_CNT MAL_D_C1 MAL_D_C2 MAL_D_C3 MAL_D_C4 MAL_D_C FEM_D_C1 FEM_D_C2 FEM_D_C3 FEM_D_C4 FEM_D_C MAL_D_R1 MAL_D_R2 MAL_D_R3 MAL_D_R4 MAL_D_R FEM_D_R1 FEM_D_R2 FEM_D_R3 FEM_D_R4 FEM_D_R;
KEEP YEAR DIS_AB_S MORT_S SUM_POP SUM_MALE SUM_FEM ACT_M_P1 ACT_M_P2 ACT_M_P3 ACT_M_P4 ACT_M_P ACT_F_P1 ACT_F_P2 ACT_F_P3 ACT_F_P4 ACT_F_P S_M_D_C1 S_M_D_C2 S_M_D_C3 S_M_D_C4 S_M_D_C S_F_D_C1 S_F_D_C2 S_F_D_C3 S_F_D_C4 S_F_D_C SUM_C1 SUM_C2 SUM_C3 SUM_C4 SUM_C ACT_P1 ACT_P2 ACT_P3 ACT_P4 ACT_P STD_M_D1 STD_M_D2 STD_M_D3 STD_M_D4 STD_M_D STD_F_D1 STD_F_D2 STD_F_D3 STD_F_D4 STD_F_D STD_D1 STD_D2 STD_D3 STD_D4 STD_D;
********************************* ;
* NOTE N_AGES MUST BE SET = # OF AGE GROUPS SELECTED…
ALL AGE GROUPS = 32;
N_AGES = 32;
********************************* ;
IF FIRST.MORT_S THEN DO;
DO OVER L1;
L1 = 0;
END;
END;
DO OVER L1;
L1 = L1 + L2;
END;
IF LAST.MORT_S THEN DO;
ACT_M_P1 = S_M_D_C1 / SUM_MALE; ACT_M_P2 = S_M_D_C2 / SUM_MALE;
ACT_M_P3 = S_M_D_C3 / SUM_MALE; ACT_M_P4 = S_M_D_C4 / SUM_MALE;
ACT_M_P = ACT_M_P1 + ACT_M_P2;
ACT_F_P1 = S_F_D_C1 / SUM_FEM; ACT_F_P2 = S_F_D_C2 / SUM_FEM;
ACT_F_P3 = S_F_D_C3 / SUM_FEM; ACT_F_P4 = S_F_D_C4 / SUM_FEM;
ACT_F_P = ACT_F_P1 + ACT_F_P2;
SUM_C1 = S_M_D_C1 + S_F_D_C1; SUM_C2 = S_M_D_C2 + S_F_D_C2;
SUM_C3 = S_M_D_C3 + S_F_D_C3; SUM_C4 = S_M_D_C4 + S_F_D_C4;
SUM_C = SUM_C1 + SUM_C2;
ACT_P1 = SUM_C1 / SUM_POP; ACT_P2 = SUM_C2 / SUM_POP;
ACT_P3 = SUM_C3 / SUM_POP; ACT_P4 = SUM_C4 / SUM_POP;
ACT_P = ACT_P1 + ACT_P2;
ARRAY L3 STD_M_D1--STD_M_D STD_F_D1--STD_F_D;
DO OVER L3;
L3 = L3 / N_AGES;
END;
STD_D1 = (STD_M_D1 + STD_F_D1) / 2;
STD_D2 = (STD_M_D2 + STD_F_D2) / 2;
STD_D3 = (STD_M_D3 + STD_F_D3) / 2;
STD_D4 = (STD_M_D4 + STD_F_D4) / 2;
STD_D = STD_D1 + STD_D2;
OUTPUT;
END;
LABEL YEAR = ‘PROJECTION YEAR’;
LABEL DIS_AB_S = ‘DISABILITY SERIES’;
LABEL MORT_S = ‘MORTALITY SERIES’;
LABEL SUM_POP = ‘POP 65 AND OLDER’;
LABEL SUM_MALE = ‘MALES 65 AND OLDER’;
LABEL SUM_FEM = ‘FEMALES 65 AND OLDER’;
LABEL ACT_M_P = ‘MALE, (% NOT + % LEAST) DISABLED’;
LABEL ACT_M_P1 = ‘MALE, % NOT DISABLED’;
LABEL ACT_M_P2 = ‘MALE, % LEAST DISABLED”;
LABEL ACT_M_P3 = ‘MALE, % MODERATELY DISABLED’;
LABEL ACT_M_P4 = ‘MALE, % MOST DISABLED’;
LABEL ACT_F_P = ‘FEMALE, (% NOT + % LEAST) DISABLED’;
LABEL ACT_F_P1 = ‘FEMALE, % NOT DISABLED’;
LABEL ACT_F_P2 = ‘FEMALE, % LEAST DISABLED”;
LABEL ACT_F_P3 = ‘FEMALE, % MODERATELY DISABLED’;
LABEL ACT_F_P4 = ‘FEMALE, % MOST DISABLED’;
LABEL S_M_D_C = ‘MALE, COUNT (NOT + LEAST) DISABLED’;
LABEL S_M_D_C1 = ‘MALE, COUNT NOT DISABLED’;
LABEL S_M_D_C2 = ‘MALE, COUNT LEAST DISABLED’;
LABEL S_M_D_C3 = ‘MALE, COUNT MODERATELY DISABLED’;
LABEL S_M_D_C4 = ‘MALE, COUNT MOST DISABLED’;
LABEL S_F_D_C = ‘FEMALE, COUNT (NOT + LEAST) DISABLED’;
LABEL S_F_D_C1 = ‘FEMALE, COUNT NOT DISABLED’;
LABEL S_F_D_C2 = ‘FEMALE, COUNT LEAST DISABLED’;
LABEL S_F_D_C3 = ‘FEMALE, COUNT MODERATELY DISABLED’;
LABEL S_F_D_C4 = ‘FEMALE, COUNT MOST DISABLED’;
LABEL SUM_C = ‘COUNT (NOT + LEAST) DISABLED’;
LABEL SUM_C1 = ‘COUNT NOT DISABLED’;
LABEL SUM_C2 = ‘COUNT LEAST DISABLED’;
LABEL SUM_C3 = ‘COUNT MODERATELY DISABLED’;
LABEL SUM_C4 = ‘COUNT MOST DISABLED’;
LABEL ACT_P = ‘% (NOT + LEAST) DISABLED’;
LABEL ACT_P1 = ‘% NOT DISABLED’;
LABEL ACT_P2 = ‘% LEAST DISABLED’;
LABEL ACT_P3 = ‘% MODERATELY DISABLED’;
LABEL ACT_P4 = ‘% MOST DISABLED’;
LABEL STD_M_D = ‘MALE, STANDARD % (NOT + LEAST) DISABLED’;
LABEL STD_M_D1= ‘MALE, STANDARD % NOT DISABLED’;
LABEL STD_M_D2= ‘MALE, STANDARD % LEAST DISABLED’;
LABEL STD_M_D3= ‘MALE, STANDARD % MODERATELY DISABLED’;
LABEL STD_M_D4= ‘MALE, STANDARD % MOST DISABLED’;
LABEL STD_F_D = ‘FEMALE, STANDARD % (NOT + LEAST) DISABLED’;
LABEL STD_F_D1= ‘FEMALE, STANDARD % NOT DISABLED’;
LABEL STD_F_D2= ‘FEMALE, STANDARD % LEAST DISABLED’;
LABEL STD_F_D3= ‘FEMALE, STANDARD % MODERATELY DISABLED’;
LABEL STD_F_D4= ‘FEMALE, STANDARD % MOST DISABLED’;
LABEL STD_D = ‘STANDARD % (NOT + LEAST) DISABLED’;
LABEL STD_D1= ‘STANDARD % NOT DISABLED’;
LABEL STD_D2= ‘STANDARD % LEAST DISABLED’;
LABEL STD_D3= ‘STANDARD % MODERATELY DISABLED’;
LABEL STD_D4= ‘STANDARD % MOST DISABLED’;
* FINISHING FILE 3 CONSTRUCTION;
DATA FILE3; MERGE TFILE3 FILE4;
BY YEAR DIS_AB_S MORT_S;
KEEP YEAR DIS_AB_S MORT_S AGE TOTL_CNT MALE_CNT FEM_CNT MAL_D_R1 MAL_D_R2 MAL_D_R3 MAL_D_R4 MAL_D_R FEM_D_R1 FEM_D_R2 FEM_D_R3 FEM_D_R4 FEM_D_R MAL_D_C1 MAL_D_C2 MAL_D_C3 MAL_D_C4 MAL_D_C FEM_D_C1 FEM_D_C2 FEM_D_C3 FEM_D_C4 FEM_D_C TOT_D_C1 TOT_D_C2 TOT_D_C3 TOT_D_C4 TOT_D_C TOT_D_P1 TOT_D_P2 TOT_D_P3 TOT_D_P4 TOT_D_P SUM_POP SUM_MALE SUM_FEM S_M_D_C1 S_M_D_C2 S_M_D_C3 S_M_D_C4 S_M_D_C S_F_D_C1 S_F_D_C2 S_F_D_C3 S_F_D_C4 S_F_D_C SUM_C1 SUM_C2 SUM_C3 SUM_C4 SUM_C;
LABEL YEAR = ‘PROJECTION YEAR’;
LABEL DIS_AB_S = ‘DISABILITY SERIES’;
LABEL MORT_S = ‘MORTALITY SERIES’;
LABEL AGE = ‘AGE GROUP’;
LABEL TOTL_CNT = ‘TOTAL POP -- THIS AGE GRP’;
LABEL MALE_CNT = ‘MALES -- THIS AGE GRP’;
LABEL FEM_CNT = ‘FEMALES -- THIS AGE GRP’;
LABEL MAL_D_R = ‘MALE, % (NOT + % LEAST) DISABLED’;
LABEL MAL_D_R1 = ‘MALE, % NOT DISABLED’;
LABEL MAL_D_R2 = ‘MALE, % LEAST DISABLED”;
LABEL MAL_D_R3 = ‘MALE, % MODERATELY DISABLED’;
LABEL MAL_D_R4 = ‘MALE, % MOST DISABLED’;
LABEL FEM_D_R = ‘FEMALE, % (NOT + % LEAST) DISABLED’;
LABEL FEM_D_R1 = ‘FEMALE, % NOT DISABLED’;
LABEL FEM_D_R2 = ‘FEMALE, % LEAST DISABLED”;
LABEL FEM_D_R3 = ‘FEMALE, % MODERATELY DISABLED’;
LABEL FEM_D_R4 = ‘FEMALE, % MOST DISABLED’;
LABEL MAL_D_C = ‘MALE, COUNT (NOT + LEAST) DISABLED’;
LABEL MAL_D_C1 = ‘MALE, COUNT NOT DISABLED’;
LABEL MAL_D_C2 = ‘MALE, COUNT LEAST DISABLED’;
LABEL MAL_D_C3 = ‘MALE, COUNT MODERATELY DISABLED’;
LABEL MAL_D_C4 = ‘MALE, COUNT MOST DISABLED’;
LABEL FEM_D_C = ‘FEMALE, COUNT (NOT + LEAST) DISABLED’;
LABEL FEM_D_C1 = ‘FEMALE, COUNT NOT DISABLED’;
LABEL FEM_D_C2 = ‘FEMALE, COUNT LEAST DISABLED’;
LABEL FEM_D_C3 = ‘FEMALE, COUNT MODERATELY DISABLED’;
LABEL FEM_D_C4 = ‘FEMALE, COUNT MOST DISABLED’;
LABEL TOT_D_C = ‘COUNT (NOT + LEAST) DISABLED’;
LABEL TOT_D_C1 = ‘COUNT NOT DISABLED’;
LABEL TOT_D_C2 = ‘COUNT LEAST DISABLED’;
LABEL TOT_D_C3 = ‘COUNT MODERATELY DISABLED’;
LABEL TOT_D_C4 = ‘COUNT MOST DISABLED’;
LABEL TOT_D_P = ‘% (NOT + LEAST) DISABLED’;
LABEL TOT_D_P1 = ‘% NOT DISABLED’;
LABEL TOT_D_P2 = ‘% LEAST DISABLED’;
LABEL TOT_D_P3 = ‘% MODERATELY DISABLED’;
LABEL TOT_D_P4 = ‘% MOST DISABLED’;
LABEL SUM_POP = ‘POP 65 AND OLDER’;
LABEL SUM_MALE = ‘MALES 65 AND OLDER’;
LABEL SUM_FEM = ‘FEMALES 65 AND OLDER’;
LABEL S_M_D_C = ‘65+ - MALE, COUNT (NOT+LEAST) DISABLED’;
LABEL S_M_D_C1 = ‘65+ - MALE, COUNT NOT DISABLED’;
LABEL S_M_D_C2 = ‘65+ - MALE, COUNT LEAST DISABLED’;
LABEL S_M_D_C3 = ‘65+ - MALE, COUNT MODERATELY DISABLED’;
LABEL S_M_D_C4 = ‘65+ - MALE, COUNT MOST DISABLED’;
LABEL S_F_D_C = ‘65+ - FEMALE, COUNT (NOT+LEAST) DISABLED’;
LABEL S_F_D_C1 = ‘65+ - FEMALE, COUNT NOT DISABLED’;
LABEL S_F_D_C2 = ‘65+ - FEMALE, COUNT LEAST DISABLED’;
LABEL S_F_D_C3 = ‘65+ - FEMALE, COUNT MODERATELY DISABLED’;
LABEL S_F_D_C4 = ‘65+ - FEMALE, COUNT MOST DISABLED’;
LABEL SUM_C = ‘65+ - COUNT (NOT+LEAST) DISABLED’;
LABEL SUM_C1 = ‘65+ - COUNT NOT DISABLED’;
LABEL SUM_C2 = ‘65+ - COUNT LEAST DISABLED’;
LABEL SUM_C3 = ‘65+ - COUNT MODERATELY DISABLED’;
LABEL SUM_C4 = ‘65+ - COUNT MOST DISABLED’;
CMS FIL5DEF FILE3 DISK FILE310 SYSFILE;
DATA FILE3.FILE310;
SET FILE3;
CMS FILEDEF FILE4 DISK FILE410 SYSFILE;
DATA FILE4.FILE410;
SET FILE4;
PROGRAM NAME: PRGRAM 20 and PRGRAM 30
- Sample programs to present data from projections in tabular and graph form
FILE: PRGRAM20 SAS A MIAMI UNIVERSITY VM/CMS REL 5
TITLE1 ‘THIS IS THE 10TH SCENARIO WITH BASELINE, CONTINUATION OF ‘;
TITLE2 ‘CURRENT, MORTALITY, “1”, AND INCREASE IN DISABILITY, “4”, ‘;
TITLE3 ‘THE INCREASE IN DISABILITY IS 7.5% FROM 1985 TO 2010 AND NO’;
TITLE4 ‘CHANGE FROM 2010 TO 2040’;
**************** PROGRAM II ***********************;
CMS FILEDEF FILE3 DISK FILE310 FILE 3 A;
DATA FILE3; SET FILE3.FILE310;
************************************************;
* IF YOU WANT TO SELECT A CERTAIN SENARIO(S) FOR THIS RUN THEN SELECT ON DIS_AB_S & MORT_S IN FOLLOWING EXAMPLE IF STATEMENT. SAME IF STATEMENT COULD SELECT PROJECTION YEAR IF DESIRED. NOT REMOVE COMMENT ASTERISK…;
* YEAR = ‘PROJECTION YEAR’;
* DIS_AB_S = ‘DISABILITY SERIES’;
* MORT_S = ‘MORTALITY SERIES’;
* AGE = ‘AGE GROUP’;
* TOT_CNT = ‘TOTAL POP -- THIS AGE GRP’;
* MALE_CNT = ‘MALES -- THIS AGE GRP’;
* FEM_CNT = ‘FEMALES -- THIS AGE GRP’;
* MAL_D_R = ‘MALE, % (NOT+LEAST) DISABLED’;
* MAL_D_R1 = ‘MALE, % NOT DISABLED’;
* MAL_D_R2 = ‘MALE, % LEAST DISABLED’;
* MAL_D_R3 = ‘MALE, % MODERATELY DISABLED’;
* MAL_D_R4 = ‘MALE, % MOST DISABLED’;
* FEM_D_R = ‘FEMALE, % (NOT+LEAST) DISABLED’;
* FEM_D_R1 = ‘FEMALE, % NOT DISABLED’;
* FEM_D_R2 = ‘FEMALE, % LEAST DISABLED’;
* FEM_D_R3 = ‘FEMALE, % MODERATELY DISABLED’;
* FEM_D_R4 = ‘FEMALE, % MOST DISABLED’;
* MAL_D_C = ‘MALE, COUNT (NOT+LEAST) DISABLED’;
* MAL_D_C1 = ‘MALE, COUNT NOT DISABLED’;
* MAL_D_C2 = ‘MALE, COUNT LEAST DISABLED’;
* MAL_D_C3 = ‘MALE, COUNT MODERATELY DISABLED’;
* MAL_D_C4 = ‘MALE, COUNT MOST DISABLED’;
* FEM_D_C = ‘FEMALE, COUNT (NOT+LEAST) DISABLED’;
* FEM_D_C1 = ‘FEMALE, COUNT NOT DISABLED’;
* FEM_D_C2 = ‘FEMALE, COUNT LEAST DISABLED’;
* FEM_D_C3 = ‘FEMALE, COUNT MODERATELY DISABLED’;
* FEM_D_C4 = ‘FEMALE, COUNT MOST DISABLED’;
* TOT_D_C = ‘COUNT (NOT+LEAST) DISABLED’;
* TOT_D_C1 = ‘COUNT NOT DISABLED’;
* TOT_D_C2 = ‘COUNT LEAST DISABLED’;
* TOT_D_C3 = ‘COUNT MODERATELY DISABLED’;
* TOT_D_C4 = ‘COUNT MOST DISABLED’;
* TOT_D_P = ‘% (NOT+LEAST) DISABLED’;
* TOT_D_P1 = ‘% NOT DISABLED’;
* TOT_D_P2 = ‘% LEAST DISABLED’;
* TOT_D_P3 = ‘% MODERATELY DISABLED’;
* TOT_D_P4 = ‘% MOST DISABLED’;
* SUM_POP = ‘POP 65 AND OLDER’;
* SUM_MALE = ‘MALES 65 AND OLDER’;
* SUM_FEM = ‘FEMALES 65 AND OLDER’;
* S_M_D_C = ‘65+ -- MALE, COUNT (NOT+LEAST) DISABLED’;
* S_M _D_C1 = ‘65+ -- MALE, COUNT NOT DISABLED’;
* S_M _D_C2 = ‘65+ -- MALE, COUNT LEAST DISABLED’;
* S_M _D_C3 = ‘65+ -- MALE, COUNT MODERATELY DISABLED’;
* S_M _D_C4 = ‘65+ -- MALE, COUNT MOST DISABLED’;
* S_F_D_C = ‘65+ -- FEMALE, COUNT (NOT+LEAST) DISABLED’;
* S_F _D_C1 = ‘65+ -- FEMALE, COUNT NOT DISABLED’;
* S_F _D_C2 = ‘65+ -- FEMALE, COUNT LEAST DISABLED’;
* S_F _D_C3 = ‘65+ -- FEMALE, COUNT MODERATELY DISABLED’;
* S_F _D_C4 = ‘65+ -- FEMALE, COUNT MOST DISABLED’;
* SUM_C = ‘65+ -- COUNT (NOT+LEAST) DISABLED’;
* SUM_C1 = ‘65+ -- COUNT NOT DISABLED’;
* SUM_C2 = ‘65+ -- COUNT LEAST DISABLED’;
* SUM_C3 = ‘65+ -- COUNT MODERATELY DISABLED’;
* SUM_C4 = ‘65+ -- COUNT MOST DISABLED’;
*************************************************;
* TO PRINT A TYPE OF ITEM BY AGE AND SEX OR BY AGE FOR ALL OR SELECTED SENARIOS
NAME ITEMS ON VAR CARD;
* LEAVE AGE IN FIRST POSITION ON VAR CARD TO GET AGE GROUP NOTATION PRINTED ON OUTPUT;
* NOTE CAN SUM VARIABLE OVER AGE CASES WITH SUM STATEMENT IN PROC PRINT BY NAMING VARIABLE ON SUM CARD (REMEMBER SUM ONLY COUNTS, NOT RATES);
PROC SORT;
BY DIS_AB_S MORT_S YEAR AGE;
PROC PRINT;
VAR AGE TOT_D_C1 TOT_D_C2 TOT_D_C TOT_D_C3 TOT_D_C4 TOT_D_P1 TOT_D_P2 TOT_D_P TOT_D_P3 TOT_D_P4;
SUM TOT_D_C1 TOT_D_C2 TOT_D_C TOT_D_C3 TOT_D_C4;
BY DIS_AB_S MORT_S YEAR;
**************************************************;
TITLE1 ‘THIS IS THE 10TH SCENARIO WITH BASELINE, CONTINUATION OF ‘;
TITLE2 ‘CURRENT, MORTALITY, “1”, AND INCREASE IN DISABILITY, “4”, ‘;
TITLE3 ‘THE INCREASE IN DISABILITY IS 7.5% FROM 1985 TO 2010 AND NO’;
TITLE4 ‘CHANGE FROM 2010 TO 2040’;
**************** PROGRAM III ***********************;
CMS FILEDEF FILE4 DISK FILE410 FILE 4;
DATA FILE4; SET FILE4.FILE410;
**************** PROGRAM III ***********************;
* VARIABLES ARE:
YEAR DIS_AB_S MORT_S SUM_POP SUM_MALE SUM_FEM ACT_M_P1 ACT_M_P2 ACT_M_P3 ACT_M_P4 ACT_M_P ACT_F_P1 ACT_F_P2 ACT_F_P3 ACT_F_P4 ACT_F_P S_M_D_C1 S_M_D_C2 S_M_D_C3 S_M_D_C4 S_M_D_C S_F_D_C1 S_F_D_C2 S_F_D_C3 S_F_D_C4 S_F_D_C SUM_C1 SUM_C2 SUM_C3 SUM_C4 SUM_C ACT_P1 ACT_P2 ACT_P3 ACT_P4 ACT_P STD_M_D1 STD_M_D2 STD_M_D3 STD_M_D4 STD_M_D STD_F_D1 STD_F_D2 STD_F_D3 STD_F_D4 STD_F_D STD_D1 STD_D2 STD_D3 STD_D4 STD_D;
* YEAR = ‘PROJECTION YEAR’;
* DIS_AB_S = ‘DISABILITY SERIES’;
* MORT_S = ‘MORTALITY SERIES’;
* SUM_POP = ‘POP 65 AND OLDER’;
* SUM_MALE = ‘MALES 65 AND OLDER’;
* SUM_FEM = ‘FEMALES 65 AND OLDER’;
* ACT_M_P = ‘MALE, % (NOT + LEAST) DISABLED’;
* ACT_M_P1 = ‘MALE, % NOT DISABLED’;
* ACT_M_P2 = ‘MALE, % LEAST DISABLED’;
* ACT_M_P3 = ‘MALE, % MODERATELY DISABLED’;
* ACT_M_P4 = ‘MALE, % MOST DISABLED’;
* ACT_F_P = ‘FEMALE, % (NOT + LEAST) DISABLED’;
* ACT_F_P1 = ‘FEMALE, % NOT DISABLED’;
* ACT_F_P2 = ‘FEMALE, % LEAST DISABLED’;
* ACT_F_P3 = ‘FEMALE, % MODERATELY DISABLED’;
* ACT_F_P4 = ‘FEMALE, % MOST DISABLED’;
* S_M_D_C = ‘MALE, COUNT (NOT + LEAST) DISABLED’;
* S_M_D_C1 = ‘MALE, COUNT NOT DISABLED’;
* S_M_D_C2 = ‘MALE, COUNT LEAST DISABLED’;
* S_M_D_C3 = ‘MALE, COUNT MODERATELY DISABLED’;
* S_M_D_C4 = ‘MALE, COUNT MOST DISABLED’;
* S_F_D_C = ‘FEMALE, COUNT (NOT + LEAST) DISABLED’;
* S_F_D_C1 = ‘FEMALE, COUNT NOT DISABLED’;
* S_F_D_C2 = ‘FEMALE, COUNT LEAST DISABLED’;
* S_F_D_C3 = ‘FEMALE, COUNT MODERATELY DISABLED’;
* S_F_D_C4 = ‘FEMALE, COUNT MOST DISABLED’;
* SUM_C = ‘COUNT (NOT + LEAST) DISABLED’;
* SUM_C1 = ‘COUNT NOT DISABLED’;
* SUM_C2 = ‘COUNT LEAST DISABLED’;
* SUM_C3 = ‘COUNT MODERATELY DISABLED’;
* SUM_C4 = ‘COUNT MOST DISABLED’;
* ACT_P = ‘% (NOT + LEAST) DISABLED’;
* ACT_P1 = ‘% NOT DISABLED’;
* ACT_P2 = ‘% LEAST DISABLED’;
* ACT_P3 = ‘% MODERATELY DISABLED’;
* ACT_P4 = ‘% MOST DISABLED’;
* STD_M_D = ‘MALE, STANDARD % (NOT + LEAST) DISABLED’;
* STD_M_D1= ‘MALE, STANDARD % NOT DISABLED’;
* STD_M_D2= ‘MALE, STANDARD % LEAST DISABLED’;
* STD_M_D3= ‘MALE, STANDARD % MODERATELY DISABLED’;
* STD_M_D4= ‘MALE, STANDARD % MOST DISABLED’;
* STD_F_D = ‘FEMALE, STANDARD % (NOT + LEAST) DISABLED’;
* STD_F_D1= ‘FEMALE, STANDARD % NOT DISABLED’;
* STD_F_D2= ‘FEMALE, STANDARD % LEAST DISABLED’;
* STD_F_D3= ‘FEMALE, STANDARD % MODERATELY DISABLED’;
* STD_F_D4= ‘FEMALE, STANDARD % MOST DISABLED’;
* STD_D = ‘STANDARD % (NOT + LEAST) DISABLED’;
* STD_D1= ‘STANDARD % NOT DISABLED’;
* STD_D2= ‘STANDARD % LEAST DISABLED’;
* STD_D3= ‘STANDARD % MODERATELY DISABLED’;
* STD_D4= ‘STANDARD % MOST DISABLED’;
************************************************;
* IF YOU WANT TO SELECT A CERTAIN SENARIO(S) FOR THIS RUN THEN SELECT ON DIS_AB_S & MORT_S IN FOLLOWING EXAMPLE IF STATEMENT. NOTE REMOVE COMMENT ASTERISK…;
*************************************************;
* TO PRINT A TYPE OF ITEM BY YEAR FOR ALL OR SELECTED SENARIOS, NAME ITEMS ON VAR CARD;
PROC SORT DATA=FILE4;
BY DIS_AB_S MORT_S YEAR;
PROC PRINT;
VAR SUM_POP SUM_MALE SUM_FEM STD_D1 STD_D2 STD_D STD_D3 STD_D4;
BY DIS_AB_S MORT_S YEAR;
**************************************************;
* TO PLOT TREND IN VARIABLE OVER TIME HORIZON REQUIRES STATING VARIABLE*YEAR ON PLOT CARD. OVERLAYS FOR SEVERAL VARIABLES ARE POSSIBLE THRU OVERLAY OPTION. TITLE CARD CONTAINS MESSAGE IN QUOTES;
NOTES
-
References for these data sources are given in Table T1.