
ERG evaluated the private and social returns associated with the development of antibacterial drugs for acute bacterial otitis media (ABOM), acute bacterial skin and skin structure infections (ABSSSI), community acquired bacterial pneumonia (CABP) complicated intra-abdominal infections (CIAI), complicated urinary tract infections (CUTI), hospital acquired/ventilator associated bacterial pneumonia (HABP/VABP); a new vaccine effective in preventing ABOM; and a new rapid point-of-care diagnostic designed to identify MRSA.
For antibacterial drugs, the average private return ranges from -$4.5 million (HABP/VABP) to $37.4 million (CABP). The average social value for the development of antibacterial drugs, however, ranges from a low of $486.6 million (ABOM) to a high of $1.217 billion (HABP/VABP). The private and social value for a new ABOM vaccine was estimated at $515.1 million and $2.281 billion, respectively. Similarly, the private and social value for new rapid point-of-care diagnostic designed to identify methicillin-resistant Staphylococcus aureus (MRSA) that can cause serious infections is estimated at $329.0 million and $22.1 billion, respectively.
The gap between the current private and social values of drug development suggests that incentives are desirable to stimulate the development of drugs to treat the six indications considered. It is also important to note that simultaneous institution of conservation mechanisms, such as education campaigns to promote prudent use, and other stewardship programs, are likely to alter the incentive levels identified in this study.
Acknowledgments
We gratefully acknowledge Hui-Hsing Wong (ASPE) and Amber Jessup (ASPE) for their leadership, guidance, and input throughout this study. We also would like to thank Edward Cox (FDA) and Michael Lanthier (FDA) for their insightful comments, advice, and guidance. IMS Health provided the sales data for the analysis of antibacterials designed to treat different indications. We would like to thank Laura Governale (FDA), Patty Greene (FDA), Grace P. Chai (FDA), Katrina S. Garry (FDA), and Psachal Calloway (FDA) for accommodating our data requests and answering our questions.
Many people involved in clinical research, including pharmaceutical/biopharmaceutical company representatives, academic researchers, and industry experts, provided valuable information for the study. We are grateful to all of them for sharing their expertise and experiences with us. Finally, we would like to thank the workshop participants at the Brookings Institute meeting on antibacterials titled Incentives for Change: Addressing the Challenges in Antibacterial Drug Development for their input.
Executive Summary
Antibacterial resistance is a growing global problem. According to the most recent statistics from the Centers for Disease Control and Prevention (CDC), at least 2 million people acquire serious infections with bacteria that are resistant to one or more of antibacterial drugs designed to treat those infections in the United States alone. Of these, approximately 23,000 die as a result of drug-resistant infections. Even though estimates vary widely, the economic cost of antibacterial resistance in the United States could be as high as $20 billion and $35 billion a year in excess direct healthcare costs and lost productivity costs, respectively (U.S. Centers for Disease Control and Prevention, 2013).
Despite the potential of new antibacterial products to reduce the social burden associated with resistant infections, some of the large companies have been exiting the markets for antibacterial drugs and vaccines in recent years and have also failed to respond to the possible social value of opportunities in production of rapid diagnostic products. These market exits have been driven by the most basic of reasons: insufficient return to capital invested in development of these products. Consequently, governments across the globe are looking to identify ways to stimulate the development of antibacterial products.
This study, conducted by Eastern Research Group, Inc. (ERG) under contract to the U.S. Department of Health and Human Services (HHS), Office of the Assistant Secretary for Planning and Evaluation (ASPE) and partly funded by FDA, develops an analytical decision-tree model framework that can be used to assess the impacts of different possible market incentives on the private and social returns to product development of new antibacterial products (in contrast to those already under development).
Using the model developed, we evaluate the private and social returns associated with the following types of antibacterial products for a hypothetical developer at the beginning of pre-clinical research phase:
- Antibacterial drugs for oral or intravenous (IV) administration designed to treat:
- Acute bacterial otitis media (ABOM);
- Acute bacterial skin and skin structure infections (ABSSSI);
- Community acquired bacterial pneumonia (CABP);
- Complicated intra-abdominal infections (CIAI);
- Complicated urinary tract infections (CUTI); and
- Hospital acquired/ventilator associated bacterial pneumonia (HABP/VABP).
- A new vaccine effective in preventing acute bacterial otitis media (ABOM), and
- A new rapid point-of-care diagnostic designed to identify methicillin-resistant Staphylococcus aureus (MRSA) that can cause serious infections, such as skin or wound infections, pneumonia, or infections of the blood
The study also considers the level needed to reach a private value of $100 million at the start of pre-clinical research for a hypothetical developer for the following four categories of incentives that encompass the majority of strategies that have been proposed in the policy literature:
- Intellectual property (IP) extensions;
- Tax incentives;
- Modifications to the clinical trial process and approval standards aimed at shortening the drug development process; and
- Private grants, awards, and prizes for antibacterial product research and development.
For antibacterial drugs (see Table E - 1), we find that the average value to the developer considering whether to start pre-clinical research ranges from a low of -$4.5 million for HABP/VABP to a high of $37.4 million for CABP, falling short of the $100 million threshold. However, when parameter uncertainty is considered, the lower bound of private returns could potentially range from -$23.5 million (HABP/VABP) to -$15.8 million (ABSSSI), substantially lower than the $100 million threshold, and the upper bound from $126.7 (HABP/VABP) to $330.0 million (CABP), considerably above the $100 million threshold. The primary drivers for the observed wide range of results are attributable to, in order of importance, the total market size, the real opportunity cost of capital, and the total time to market model parameters. Value of the incentives to the developers would be higher at later stages of development, meaning that once a drug successfully reaches certain milestones, incentives to further develop it increase. However, we focus on the value at the point the developer is considering whether to start the pre-clinical stage.
Table E - 1: Antibacterial Drug Private Returns (Figures are in $ Million)
| Indication | Private Value (in $ Million) | ||
|---|---|---|---|
| 90% Lower Bound | Mean | 90% Upper Bound | |
| ABOM | -$18.8 | -$2.7 | $215.1 |
| ABSSSI | -$15.8 | $27.1 | $198.9 |
| CABP | -$17.6 | $37.4 | $330.0 |
| CIAI | -$18.0 | $8.9 | $222.5 |
| CUTI | -$16.3 | $21.9 | $213.0 |
| HABP/VABP | -$23.5 | -$4.5 | $126.7 |
Note that this study considers the developer’s private value from the point of the current state of science. Assessing advancements in translational research and basic pathogen biology were outside the scope of this project. However, we note that such advancements have the potential to impact private value of a drug at the start of pre-clinical studies. For example, improved understanding of pathogen biology can cut pre-clinical research time and can yield compounds with higher average efficacy entering human trials.
To assess the extent to which these private values fall short of the societal importance of drugs, we estimate the potential social value for these antibacterial drugs. Similar to private returns, we find that there is wide variation in the estimated social values across the different indications (see Table E - 2). The primary drivers for the observed wide range of social EPV results are attributable to, in order of importance, the model parameters for the percentage in disease duration for patients that do not respond to commonly used antibacterial drugs; phase 1 clinical trial success probability; pre-clinical R&D success probability, and the real annual social rate of discount.
Despite the high degree of variability, even the lower bounds of these social values (see Table E - 2) are greater than the estimated private ENPVs by orders of magnitude across all of the indications. Moreover, for CABP, CUTI, and HABP/VABP, the 90 percent lower bounds of social values are greater than the 90 percent upper bounds of private values for the same indications.
Table E - 2: Antibacterial Social Returns (Figures are in $ Million)
| Indication | Social Value | ||
|---|---|---|---|
| Min | Mean | Max | |
| ABOM | $48 | $486.6 | $5,363 |
| ABSSSI | $58 | $584.2 | $6,133 |
| CABP | $706 | $9,375.3 | $72,494 |
| CIAI | $114 | $1,069.2 | $10,231 |
| CUTI | $674 | $6,064.6 | $54,795 |
| HABP/VABP | $1,068 | $12,165.6 | $161,335 |
Using the decision-tree framework developed, we estimate the private and social value for a new ABOM vaccine at $515.1 million (which is greater than the $100 million threshold) and $2.281 billion, respectively. Similarly, the private and social value for new rapid point-of-care diagnostic designed to identify methicillin-resistant Staphylococcus aureus (MRSA) that can cause serious infections is estimated at $329.0 million and $22.1 billion, respectively.
The gap between the current private and public values of drug development suggest that incentives are desirable to stimulate the development of drugs to treat the six indications considered, whether through incentives described in this report or public research investment. However, given the degree of uncertainty associated with different model parameters and the limited scope of this project, it is difficult to ascertain the necessary levels of such incentives. The size of the social benefits from developing a new antibacterial drug is also highly uncertain and based on the improvement in outcomes from a hypothetical new drug.
It is also important to note that simultaneous institution of conservation mechanisms, such as education campaigns to promote prudent use, and other stewardship programs, along with the types of antibacterial drug production incentives considered are likely to alter the incentive levels identified in this study. Conservation incentives, by their very nature, tend to reduce the potential market size for new antibacterial drugs thereby necessitating higher production incentive levels to boost private returns to the $100 million threshold.
1 Introduction
1.1 Background
Modern medicine relies on effective antibacterial drugs, vaccines, and rapid diagnostic tools, collectively referred to as “antibacterial products” hereinafter, for the prevention, detection, and treatment of bacterial infections. Since antibacterial drugs first came into use in the 1940s, they have transformed mankind’s ability to combat deadly microorganisms and saved innumerable lives. However, use of these drugs is not without consequences. The mutations and natural selection processes that occur when an antibacterial drug is utilized can lead to the selection of strains of bacteria that are resistant to antibacterial drug or drugs. Many such strains (e.g., methicillin-resistant Staphylococcus aureus) are now quite common throughout the U.S. and the world. Today, the rapid rate of increase in antibacterial drug resistant bacteria combined with a weak pipeline for new antibacterial drugs threatens to create a public health crisis in which we are no longer able to effectively treat common infections (Kesselheim & Outterson, 2010; Laxminarayan & Malani, 2007; Infectious Diseases Society of America , 2004; Smith & Coast, 2013).
Drug resistance problems are compounded by the misuse of existing antibacterial drugs. Antibacterial drugs are commonly overused by physicians and patients; for example, they may be prescribed to treat conditions caused by viral pathogens, which will not respond to antibacterial treatment, or for infections that will resolve quickly on their own. Additionally, under-treatment through inadequate dosage or inappropriate treatment duration can also give rise to resistant bacterial strains (Laxminarayan & Malani, 2007; Kesselheim & Outterson, 2010; Levy, 1992).
Appropriate use of existing diagnostic tests and/or the development of new tests could help relieve selective pressure resulting from unnecessary or inappropriate antibacterial use. By identifying the etiologic causes of infections, diagnostic tools can help physicians determine an appropriate course of treatment for their patients. Unfortunately, many existing tests are too slow to provide results, too invasive or uncomfortable for patients, or too expensive to be practical (Laxminarayan & Malani, 2007).
An alternative mechanism for reducing antibacterial drug demand is infection prevention, which might be achieved in part through more widespread vaccination, the development of additional vaccines, and more effective infection control, especially in health care facilities. Plus, there are likely to be spillover benefits from vaccination of part of the population to unvaccinated individuals. Nevertheless, the cost and voluntary nature of vaccinations hinder their uptake, and vaccines for some common infections, such as a vaccine to prevent infections caused by Staphylococcus aureus, are not yet available (Laxminarayan & Malani, 2007).
Despite the potential of new antibacterial products to reduce the social burden associated with resistant infections, some of the large companies have been exiting the markets for antibacterial drugs and vaccines in recent years and have also not responded to the possible social value of opportunities in production of rapid diagnostic products. These market exits have been driven by the most basic of reasons: insufficient return to capital invested in development of these products. Commentators have identified a number of factors limiting markets for some new antibacterial products, including short treatment durations, an absence of market mechanisms to capture social benefits, challenges of conducting clinical trials, use of single-purchaser government power to limit payments for final products, and the availability of cheap generic drugs to treat most infections. However, empirical evidence is lacking to evaluate the relative impact of these factors (Kesselheim & Outterson, 2010; Mossialos, et al., 2010). Furthermore, there remain a number of participants in, as well as, new entrants to these markets and there are opportunities for novel products despite the exits of many large companies (Usdin, 2012). Current antibacterial product development efforts are directed primarily towards addressing the treatment of acute bacterial skin and skin structure infections including infections caused by methicillin-resistant Staphylococcus aureus (MRSA), Clostridium difficile associated diarrhea, and some infections caused by drug-resistant gram-negative pathogens.
Given the potentially sizable social benefits of new antibacterial products, governments have been considering a number of alternative policies to foster development. While many approaches have been proposed, the path for policymakers to succeed in accelerating antibacterial product development is not well established. Further, a rigorous transparent analytical framework that can be used to systematically examine the effects of different policy alternatives is currently lacking. This study is therefore intended to fill that void by developing an analytical framework to evaluate the economics (private and social value) of development of antibacterial products that can aid in considering potential strategies designed to incentivize these antibacterial products.
1.2 Study Objectives
There are two primary objectives to this study: 1) the creation of an economic framework for antibacterial drug development decisions and 2) the assessment of the impact of various incentives on their development. As secondary objectives, this study creates a similar framework for the development of vaccines and rapid point of care diagnostics and examines the social returns to developing new antibacterial products.
For the antibacterial drug development framework, the study examines the private and social returns (i.e., expected present value, EPV) to developing a new antibacterial drug for oral or intravenous (IV) administration for each of the following six indications:
- Acute bacterial otitis media (ABOM);
- Acute bacterial skin and skin structure infections (ABSSSI);
- Community acquired bacterial pneumonia (CABP);
- Complicated intra-abdominal infections (CIAI);
- Complicated urinary tract infections (CUTI); and
- Hospital acquired/ventilator associated bacterial pneumonia (HABP/VABP).
These six indications represent major areas of antibacterial use. In our EPV model, they are differentiable by forecasted developer revenues and costs, as well as by associated social costs and benefits that would accrue as a result of having a new drug available to treat them.
We also examine vaccines and rapid diagnostics. Vaccine markets vary with the specific disease under consideration. Thus, for the purposes of this study, we model a new vaccine designed to offer protection against acute bacterial otitis media (ABOM) infections commonly caused by nontypeable Haemophilus influenzae and by Moraxella catarrhalis.
Rapid diagnostics tools influence the rate and effectiveness of antibacterial use and thus affect their use in healthcare settings. In this study, we focus on a new rapid diagnostic tool designed to identify methicillin-resistant Staphylococcus aureus (MRSA) that can cause serious infections, such as skin or wound infections, pneumonia, or infections of the blood. While a newer type of MRSA is community-acquired, here we focus primarily on healthcare-associated MRSA infections, which occur in hospitals and nursing homes.
The study also considers a number of possible incentives within the private and social EPV framework developed. We examine the following four categories of incentives that encompass the majority of strategies that have been proposed in the policy literature:
- Intellectual property (IP) extensions;
- Tax incentives;
- Modifications to the clinical trial process and approval standards; and
- Grants, awards, and prizes for antibacterial drug research and development.
The above incentive categories are described in more detail in Section 2.
1.3 Data Sources
For constructing our EPV model, we compiled information from a variety of sources, including:
- Systematic reviews of published literature;
- Interviews with experts, including individuals who previously worked for drug companies and now advise companies on drug development, U.S. Food and Drug Administration (FDA) personnel, drug company representatives, clinicians, and hospital pharmacists;
- IMS Health data on drug expenditures; and
- Databases available through the CDC National Center for Health Statistics;
- National Ambulatory Medical Care Survey (NAMCS)
- National Hospital Ambulatory Medical Care Survey (NHAMCS)
- Compressed Mortality File
- Healthcare Cost and Utilization Project National Inpatient Sample (HCUP NIS)
- National Hospital Discharge Survey (NHDS)
- National Vital Statistics Report (NVSR)
- National Nosocomial Infections Surveillance (NNIS)
Our literature search targeted several categories of literature: peer-reviewed articles in scientific journals, unpublished papers and presentations, white papers, gray literature,1 and news stories and occasional pieces appearing in newspapers and magazines or other print media outlets. Our search methodology featured systematic inquiries of the following databases:
- PubMed for peer-reviewed healthcare and biomedical journals;
- Lexis/Nexis academic for mass media and other periodical publications; and
- PAIS, Scopus, Web of Knowledge, and Embase for gray literature.
The search strategies differed for each category of literature and related database, but each query employed search terms in various combinations using logic strings.
Some of the information needed for modeling the private and social EPV came from semi-structured discussions with independent experts, FDA personnel, drug sponsors, clinical researcher, clinicians, and hospital pharmacists. In accordance with Office of Management and Budget (OMB) guidelines, we limited the number of interviews involving the same set of questions to fewer than 10. From these interviews, we collected information about how drug sponsors make the decision to move forward with the development of a novel antibacterial drug, vaccine, or diagnostic, magnitudes of various cost components (e.g., clinical trial costs, non-clinical expenditures, post-approval pediatric study commitments, etc.), timelines for getting a new product to market, and health practitioner adoption rates and considerations.
We used IMS Health data on drug expenditures to estimate the total market size for each of the indications. Through FDA’s Third Party Agreement with IMS Health, we obtained 5 years (2007 – 2011) of U.S. sales data on a total of 43 and 31 antibacterial drugs in intravenous (IV) and solid oral dosage form, respectively. The data provided included information on:
- Extended Units (EU) – These are the number of individual tablets, capsules, etc. for solids; number of grams or milliliters for other forms.
- Total Dollars (DOL/TOT) – This measure reports the amount of money pharmacies, non-federal hospitals, federal facilities, long-term care facilities, clinics, and HMOs spent on a product acquired from manufacturers and drug wholesalers.
- Units – This corresponds to the total amount of packages sold of a particular drug to the dispensing outlet/chain/hospital.
- There are a number of databases that are available through CDC’s National Center for Health Statistics (NCHS). We used these databases, as appropriate, to estimate disease duration and number of patients per annum in the U.S. for the different indications covered in the study. Details on how each of these databases was utilized are provided in the sections related to each of these indications below.
1 Gray literature encompasses those publications that fall outside of the realm of normal publishing outputs, such as journals and books. Examples of gray literature include technical reports written for a specific audience, dissertations and theses, article pre-prints, white papers, and conference proceedings.
2 Incentives for Developing Antibacterial Drugs, Vaccines for Bacterial Diseases, and Rapid Diagnostics
The literature is replete with possible incentives to stimulate new antibacterial product development. Additionally, the recently enacted Title VIII (Generating Antibiotic Incentives Now) of the Food and Drug Administration Safety and Innovation Act (Public Law 112-144)(GAIN), creates incentives to encourage the development of antibacterial or antifungal drugs for the treatment of serious or life-threatening infections, including drugs to treat antibacterial drug-resistant infections. GAIN extends the period of exclusivity for certain qualifying products by adding 5-years of additional exclusivity. In this study, we took a comprehensive approach to examining incentives, not just those that are included in GAIN.
For organization purposes, we adopted the incentive categories proposed by Kesselheim and Outterson (2010) as our starting point as presented in Table 1 below. The columns in the table depict the goal of the incentive under consideration, i.e., conservation or production. Conservation efforts aim to limit the development of drug resistance in drugs currently on the market while production incentives aim to stimulate development of new drug compounds. The rows correspond to the four primary legal tools that can be used to achieve conservation or production goals, i.e., property, regulation, contract or tort.
Optimal antibacterial drug incentive strategies would combine elements from both columns, incentivizing both conservation as well as new production. To the extent that the same impacts can be attained through different legal mechanisms (i.e., property, regulation, contract, or tort), we view the choice of specific mechanism used as a practical decision outside the scope of this study.
Table 1: Types of Incentives for Antibacterial Drug, Vaccine, and Diagnostic Product Development
| Type | Conservation | Production |
|---|---|---|
| Property | Intellectual property (IP) used as conservation tools to privately constrain demand (1) | Intellectual property (IP) used as incentives to bring new antibacterial drugs to market (2) |
| Regulation | Public health infection control and antibacterial drug stewardship programs regulate demand for antibacterial drugs (3) | FDA regulations relaxed to speed approval of new antibacterial drugs. Tax subsidies support R&D (4) |
| Contract | Prizes, grants, and value-based reimbursement support antibacterial drug conservation. (5) | Prizes, grants, and value-based reimbursement support new antibacterial drug production. (6) |
| Tort | Patients sue for hospital-associated infections, increasing institutional incentives to promote safety through antibacterial drug conservation (7) | Federal law designed to preempt state tort law, waiving drug company tort liability for antibacterial drugs (8) |
Source: Kesselheim & Outterson, 2010
Next, we undertook a comprehensive review of the policy literature on antibacterial drug incentives that have been proposed over the past decade to start with an organized list. This literature review resulted in the identification of over 50 incentives that fell into one of the 8 categories shown in Table 1. For example, the conservation-regulation category included 18 different incentives from the policy literature ranging from education campaigns to encourage appropriate use to expanding the promotion of vaccination to providing transparency on institutional infection rates.
We then performed an initial qualitative iterative evaluation that involved assessing each of the 50+ incentives against multiple criteria depicted in Table 2. We combined incentives that were considered similar. For example, “incentive designed to encourage antibacterial drug substitutes, such as free or heavily discounted “cold kits” to physicians” and “education campaigns to encourage appropriate use of antibacterial drugs” were combined into one incentive category titled “education campaigns.”
Table 2: Antibacterial Incentive Evaluation Criteria
| Evaluation Question | Yes | No | Comment |
|---|---|---|---|
| Is the incentive practical to implement? |  | | ______________________ |
| Is implementation time for the incentive reasonable? | | | ______________________ |
| Is the incentive politically feasible? | | | ______________________ |
| Is there a good match between the incentive and type of developer? | | | ______________________ |
| Does the incentive avoid creating market distortions? | | | ______________________ |
| Does the incentive impede access and affordability? | | | ______________________ |
| Does the incentive avoid creating other perverse incentives or outcomes? | | | ______________________ |
| Are the transaction costs imposed by the incentive acceptable? | | | ______________________ |
| Is the level of risk associated with the incentive acceptable? | | | ______________________ |
| Does the incentive stimulate valuable innovation? | | | ______________________ |
| Does the incentive stimulate competition? | | | ______________________ |
| Is the incentive cost-effective compared to next best alternative? | | | ______________________ |
| Does the incentive promote development of antibacterial drugs? | | | ______________________ |
| Does the incentive promote conservation and/or appropriate use? | | | ______________________ |
| Is the incentive within possible FDA/DHHS purview? | | | ______________________ |
| Can the incentive be analyzed within EPV model framework? | | | ______________________ |
This initial evaluation process resulted in reducing the 50+ incentives to the 10 as depicted in Table 3 below that ultimately correspond to the 5 categories shown in the “Private NPV Model Category” column. The table shows each incentive’s expected impact on parameters in the private and social NPV models (explained below), as well as the intention of the incentive (i.e., to promote development of antibacterial drugs, vaccines, and/or rapid diagnostic tools, or to promote antibacterial drug conservation). The table also depicts the parameters that each of the 10 incentive categories would impact within the private EPV model framework developed for the study (see Sections 3.1 and 3.5 for discussions of the private and social frameworks, respectively). Further examination of this list of 10 from a modeling perspective resulted in combining those categories of incentives that impact the same model parameters resulting in a total of 5 incentive categories noted in the “Private NPV Model Category” column of Table 3. For example, the incentives “education campaigns” through “performance- and value-based reimbursement schemes” affect the same model parameter, “unit sales”, in the same direction. Thus, we cannot really distinguish between education campaigns and vaccine promotion in the context of our model and hence need to combine these into one category for analysis purposes.
Table 3: List of Incentives for Antibacterial Drugs, Vaccines, and Rapid Point-of-Care (POC) Diagnostics
| Incentive Type | Incentive Detail | Potential Impact(s) on Private NPV? | Potential Impact(s) on Social NPV? | Promotes Development of Antibacterial | Promotes Conservation, Appropriate Use, and/or Stewardship? | Private NPV Model Category | Impact on Private ENPV | ||
|---|---|---|---|---|---|---|---|---|---|
| Drugs? | Rapid Point-of-Care Diagnostics? | Vaccines? | |||||||
| Production | Intellectual Property (IP) extensions [a] | Increase in sponsor revenue stream due to delayed generic entry | • Reductions in number, duration, severity of infections due to new antibacterial product • Reduced market competition | Yes | No [j] | Yes | Possible [i] | Intellectual Property (IP) extensions [a] | Delays generic entry |
| Tax incentives | Decrease in cost of capital | • Reductions in number, duration, severity of infections due to new antibacterial product • Reduced tax revenue for the government | Yes | Yes | Yes | Possible [i] | Tax incentives | Decreases cost of capital | |
| Modifications to the clinical trial process & approval standards (including LPAD) | • Decrease in time to market • Decrease in clinical trial costs | Reductions in number, duration, severity of infections due to new antibacterial product Increase in probability of adverse events due to fewer safety data | Yes [f] | Yes [f] | Yes [f] | Possible [g] | Modifications to the clinical trial process & approval standards [c] | Reduces time to market [c] | |
| Grants for antibacterial products research and development | Decrease in R&D costs | • Reductions in number, duration, severity of infections due to new antibacterial product • Added societal cost equivalent to the prize amount (or NPV of prize) | Yes | Yes | Yes | Possible [i] | Grants/Awards/Prizes for antibacterial product research and development [d] • Pre-clinical • Phase 1 • Phase 2 • Phase 3 • NDA/BLA Approval | Decreases R&D costs | |
| Prizes and product development partnerships (PDPs) | Increase in antibacterial sponsor revenues due to lump-sum prize payment | • Reductions in number, duration, severity of infections due to antibacterial production • Added societal cost equivalent to the prize amount (or NPV of prize) | Yes | Yes | Yes | Possible [i] | |||
| Conservation | Education campaigns | Decrease in revenues for antibacterial drug sponsor | Reductions in number, duration, severity of infections | No | Yes | Yes | Yes | Conservation for Drugs but Promotion for Vaccines and Rapid POC Diagnostics [e] | Reduces unit sales |
| Improvements in hospital infection control | Decrease in revenues for antibacterial drug sponsor | • Reductions in number, duration, severity of infections • Increase in useful life of antibacterial (due to deferred antimicrobial resistance) | No | Yes | Yes | Yes | |||
| Vaccination promotion | Decrease in revenues for antibacterial drug sponsor | Reductions in number, duration, severity of infections | No | No | Yes | Yes | |||
| Better monitoring & reporting of infection rates & antibacterial drug resistance | Decrease in revenues for antibacterial drug sponsor (2nd order) | • Reductions in number, duration, severity of infections • Increase in useful life of antibacterial (due to deferred antimicrobial resistance) - 2nd order | No | Yes | Yes | Yes | |||
| Performance- and value-based reimbursement schemes [b] | Decrease in revenues for antibacterial drug sponsor (2nd order) | Increase in useful life of antibacterial (due to deferred antimicrobial resistance) - 2nd order | Yes [h] | Yes | Yes | Yes | |||
| Revocation of marketing authorization for antibacterial drugs that pollute | Decrease in revenues for antibacterial drug sponsor | • Reductions in number, duration, severity of infections • Increase in useful life of antibacterial (due to deferred antimicrobial resistance) - 2nd order | No | Yes | Yes | Yes | Conservation for Drugs but Promotion for Vaccines and Rapid POC Diagnostics [e] | Truncates revenue time horizon | |
[a] IP collectively refers to patents/Data Exclusivity/Marketing Exclusivity/Patent Term Adjustments/Patent Term Extensions/Supplementary Protection Certificates (see Section 2.1.1 for further detail).
[b] Can be designed to maintain/increase total reimbursement to sponsor through price adjustments
[c] These could also simultaneously impact clinical trial costs. However, allowing both parameters to vary in the private ENPV model would lead to non-unique solutions for the incentive level. Thus, we limited the effect of each incentive to a single model parameter to avoid solver problems.
[d] While these can be structured in multiple different ways, in this study, they are envisioned to be paid out sequentially upon successful completion of a phase. It should be noted that for rapid point of care diagnostics, there would only be three award/grant/prize stages, one for a pilot clinical study, another for a full-scale clinical trial, and a final one for 510(k) submission to FDA.
[e] All of the conservation incentives reduce private ENPV and hence are not examined in the model.
[f] It might undermine value of programs to apply to all.
[g] Vaccines and diagnostics would promote conservation, but speeding more antibacterial drugs to market might harm conservation through market dynamics.
[h] An effective P4P system must greatly increase reimbursement across the entire antibacterial drugs class.
[i] If paired with conservation targets.
[j] Currently, there are no market or data exclusivity protections for rapid point-of-care diagnostics.
2.1 Production Incentives
2.1.1 Intellectual Property (IP) Protection Extensions
We use the term “intellectual property (IP) protection extensions” to encompass patent/data exclusivity (DE), marketing exclusivity (ME), patent term adjustments (PTAs), patent term extensions (PTEs), and supplementary protection certificates (SPCs); all of which serve to increase drug developer revenues and hence private NPV, by barring generic competition and allowing companies to charge consumers and insurers higher prices for innovator drugs over a longer time period.
- Data exclusivity (DE) refers to a period of time during which generic competitors are barred from applying for market authorization on the basis of clinical data generated for the originator drug. Though it does not legally prevent generic competitors from generating their own evidence to obtain marketing approval, the resources required to do so are so considerable that data exclusivity acts as an effective market barrier.
- Marketing exclusivity (ME) refers to a period of time during which a generic equivalent cannot be approved by the FDA for market entry. It differs from data exclusivity in that competitors may not enter the market even if they seek approval using their own data.
- Patent term adjustments/extensions (PTAs and PTEs) and supplementary protection certificates (SPC) (in Europe) enable manufacturers to gain protection to compensate for time spent in the regulatory approval process. The SPC protection takes effect after the patent expires and applies to a specific active ingredient that has been granted marketing authorization. The period of protection is dependent on the length of time between patent filing and market authorization.
It should be noted that these exclusivities are likely to differ in their value to the drug developer because of how much additional time is given to exclusivity. However, it is not possible to distinguish among these different mechanisms within the developed analytic framework. Hence, all of these are combined under the generic umbrella of “intellectual property (IP) protection extensions” in our model. Further, not all of the above mechanisms are applicable to rapid point-of-care diagnostics and vaccines.
2.1.2 Tax Incentives
Tax incentives for antibacterial product R&D can take many forms, including (but not limited to) the following:
- Tax credits: amounts deducted from tax liability, including transferrable tax credits,2
- Tax allowances: amounts deducted from gross income to calculate taxable income,
- Tax deferrals: delay in payment of a tax,
- Accelerated depreciation: immediate or accelerated write-off of capital expenditures, and
- Favorable “patent box” tax rates: reduced tax rate for income derived from patents.
While all forms of tax incentives have the effect of increasing the net present value (NPV) of potential research projects by decreasing the cost of capital, they could be applied in a variety of ways to achieve this result. In general, they are either applied to a developer’s current expenditures (including wages/salaries for research personnel and the cost of materials) or capital expenditures (cost of facilities and equipment). Tax incentives may not be valuable for small and medium enterprises (SMEs), which do not have the access to capital and high expenditures that larger companies do. However, these incentives may be designed in such a way that allows SMEs to receive a refund for the excess tax credit (regardless of the size of their tax bill), which may then function as a research subsidy (Mossialos, et al., 2010).
2 A transferable tax credit can be sold by the entity that has earned it to another qualified entity. A transferable tax credit would enable emerging, often small, companies without any tax liability to sell the credit to established profitable companies.
2.1.3 Modifications to the Clinical Trial Process and Approval Standards
This incentive encompasses a number of ideas intended to streamline the clinical trial and drug approval processes for antibacterial drugs in order to shorten the timelines and, in turn, reduce the costs associated with developing these drugs. Easing the development requirements could reduce development costs by shortening the time to market for these products, thereby increasing the potential returns to developers.
For example, the Limited Population Antibacterial Drug (LPAD) Approval Mechanism proposal put forth by the Infectious Diseases Society of America (IDSA) is one such approach that can be examined in the context of the analytical framework developed. Under the LPAD proposal, “…the safety and effectiveness [of an antibacterial drug designed to treat serious infections] would be studied in substantially smaller, more rapid, and less expensive clinical trials—much like the Orphan Drug (OD) Program permits for other rare diseases. LPAD products then would be narrowly indicated for use in small, well-defined populations of patients for whom the drugs’ benefits have been shown to outweigh their risks” (Infectious Diseases Society of America, 2012).
2.1.4 Grants/Awards/Prizes for Antibacterial Product Research and Development
International-level support for research occurs primarily through public research institutions. In the United States, national-level funding of research is conducted through several departments and agencies, including the Department of Health and Human Services (HHS) and it’s Assistant Secretary for Preparedness and Response (ASPR), NIH and CDC. NIH is the primary agency responsible for performing and supporting basic, clinical, and translational research and its support acts as a subsidy to drug development, as it funds the scientific research needed to identify new target organisms and drugs that are effective against those targets (Laxminarayan & Malani, 2007).
Under the ASPR, the Biomedical Advanced Research and Development Authority (BARDA) funds the development and procurement of medical countermeasures (MCMs). The Pandemic and All-Hazards Preparedness Act (PAHPA) (2006) specifies that the BioShield program can be invoked for an infectious disease as long as the MCM is also a national security countermeasure. PAHPA created the BARDA to help advance R&D in response to security threats (Mossialos, et al., 2010).
Privately- and publicly-funded prize incentives and product development partnerships (PDPs) for medical innovation have flourished in recent years. Prize incentives directly reduce R&D costs and risks or increase revenues. They can take a variety of forms, including milestone monetary prizes, best entry tournaments, elective systems (e.g., the optional reward scheme), and others. Under some of these schemes, the manufacturer retains its patent, while others require the manufacturer to relinquish the patent.
In this study, we model this category of incentives as sequential payments of lump-sum amounts upon successful completion of a phase with the amounts increasing for later clinical trial stages.
2.2 Conservation Incentives
As depicted in Table 3, there are a number of approaches that might prolong the useful lives of antibacterial drugs through stewardship, appropriate use, and conservation. All of these goals are important for public health. However, from the perspective of the antibacterial drug developer, all of these programs reduce demand for their products and therefore reduce incentives to create new drugs. Some of these incentives include the following:
- Education campaigns – Many patients continue to believe that antibacterial drugs are effective against common non-bacterial conditions (such as colds and influenza) and therefore seek antibacterial drug prescriptions from their doctors to treat these viral infections. Correcting these widespread false beliefs through better public education could help to decrease the demand for antibacterial drugs and slow the development of resistance.
- Improvements in hospital infection control – Reducing healthcare-associated infections can decrease both antibacterial demand and the incidence of antibacterial drug resistance.
- Vaccination promotion – Vaccines for both bacterial and viral diseases, such as the pneumococcal conjugate vaccine and the influenza vaccine, can reduce disease incidence, bacterial coinfections, antibacterial drug demand, and antibacterial drug resistance, while also providing spillover benefits to non-vaccinated individuals, whose risk of infection decreases as more of the population are vaccinated. Direct subsidies for research into new antibacterial vaccines would also reduce the demand for antibacterials drugs, delaying resistance.
- Better monitoring and reporting of infection rates and antibacterial drug resistance (AR) – Surveillance of antibacterial drug resistance (AR) will improve understanding of the impacts of changes in antibacterial drug prescribing patterns, help identify new resistance mechanisms and outbreaks of resistant pathogens, assist in development of public health guidelines for infection control, and allow better education of health care providers and patients regarding AR (Laxminarayan & Malani, 2007; Mossialos, et al., 2010; Ming, Chen, Miller, Sexton, & Anderson, 2012).
- Performance- and value-based reimbursement schemes – Under a performance-based scheme, hospital reimbursement would be tied to levels of infection and drug resistance. Alternatively, in a value-based reimbursement approach, existing insurance plans would implement a system that provides reimbursement for antibacterial drugs according to their health impact, encouraging manufacturers to set their price based on the calculated impact, with more effective drugs being priced higher.
As noted earlier, the conservation incentives have the effect of reducing antibacterial drug developer revenues and thus can be examined using the analytical framework developed by simply applying a percentage reduction to the total developer revenue scheme or varying percentage reductions to annual developer revenues. We did not, however, analyze conservation incentives in this study.
3 Antibacterial Drugs
3.1 Expected Net Present Value (ENPV) Framework For Evaluating Private Returns
Drug development activities include early stage research and development (R&D), pre-clinical and clinical research as well as supply chain related efforts (such as sample preparation, process research development, manufacturing plant design) (see Figure 1 for a stylized depiction of the drug development process). Each of these activities involves costs and failure risks. Thus, a rational forward looking drug sponsor will evaluate these costs and risks against the potential returns before beginning development of a drug.
In this study, we model the drug developer’s evaluation in the form of a decision tree that looks at the decision process from the point of view of an expected-revenue-maximizing sponsor in the face of uncertainty (or risk).
Figure 1: Stylized Model of New Drug Development and Commercialization Activities
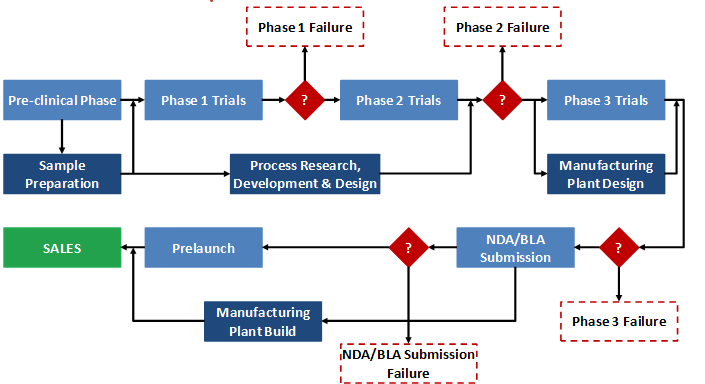
Source: Blaue, Pekny, Varma, & Bunch, 2004
To illustrate our approach, we consider a highly simplified example adapted from Damodaran (2007) below - the analysis of a New Molecular Entity (NME) candidate for treating a hypothetical Indication X. Assume that we are provided with the following hypothetical information:3
- Pre-clinical research and development takes 5.5 years and costs around $21 million to identify a lead molecule. There is a 31 percent likelihood that a lead molecule will be successfully identified.
- Phase 1 trial is expected to cost $30 million and to require 100 participants to determine safety and dosage. The trial is expected to last 1.5 years and there is a 54 percent likelihood that the drug will successfully complete the first phase.
- Phase 2 involves testing the NME’s effectiveness in treating Indication X on 250 participants over a period of around 2.1 years. This phase is expected to cost $45 million and the agent will need to show a statistically significant impact on a number of clinical endpoints to move on to the next phase. There is only a 60 percent likelihood that the drug will prove successful in treating Indication X.
- In Phase 3, the testing will be expanded to around 500 patients. The phase will last 2.5 years and cost $210 million, and there is a 67 percent likelihood of success.
- Upon completion of Phase 3, the sponsor will need to submit a New Drug Application (NDA) to the FDA paying a user fee of $2 million and there is an 85 percent likelihood of being approved. The NDA/ Biologic License Application (BLA) submission decision will take 0.8 year.
- Given the size of the patient population and average wholesale price for similar drugs, the net annual returns for the NME, if it is approved, are estimated at $793 million per year for 20 years (i.e., approximately $1.5 billion total).
- The cost of capital for the sponsor is 11 percent.
We can now draw the decision tree for this NME by specifying the phases, the revenues at each phase, and the respective success and failure probabilities (see Figure 2). The decision tree depicted shows the likelihood of success at each phase and the marginal returns associated with each step. Because it takes time to go through the different phases of development, there is a time value effect that is built into the expected returns computation for each path. The figure reflects this time value effect and computes the cumulative present value of returns from each path using the 11 percent cost of capital as the sponsor’s internal rate of discount. When time-discounted costs of conducting trials are subtracted from the present value of the returns at the end nodes, we are left with the net present value (NPV) of each possible outcome.
In Figure 2, the yellow square is the root decision node of interest. It is the point at which the revenue-maximizing sponsor is deciding whether or not to pursue development of the drug. The green circles (event/chance nodes) represent the possibility of success or failure at each phase, with the probabilities associated with each possibility appearing to the left of each branch. Finally, the red triangles are the end nodes. To the right of each end node is the NPV of that outcome to the sponsor. For example, if the drug completed all phases and successfully reached the market, the NPV of the cost and revenue streams would be $1.5 billion in this scenario. By contrast, if the sponsor pushed forward with development but the drug failed at some point, the sponsor would incur the costs of the clinical trials without earning any revenues. Therefore, the other outcome nodes represent negative NPVs.
Figure 2: Drug Development Decision Tree Depicting Expected Net Present Value (ENPV) of Private Returns (Values in $ Million) for a Hypothetical New Molecule X
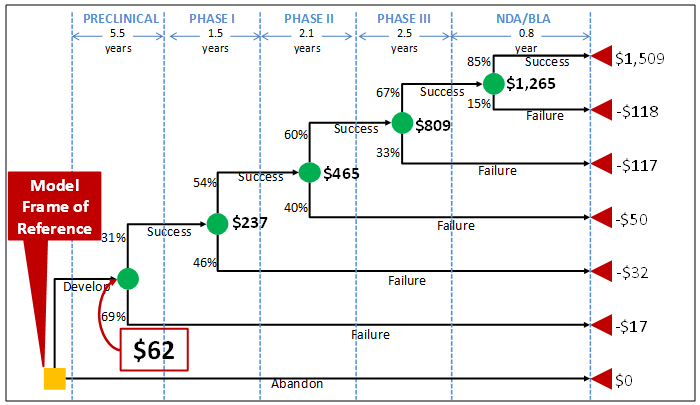
The dollar values appearing in bold next to the green chance nodes are calculated from right to left across the tree by multiplying the NPVs associated with each outcome by the probabilities of that outcome occurring. These dollar values thus represent the expected NPVs (ENPVs). For example, the ENPV at the start of the NDA/BLA review phase is equal to ($1.5 billion × 85 percent) + (-$118 million × 15 percent), or $1.3 billion. The $1.3 billion can then be used to do the same calculation for the chance node at Phase 3, and so forth until the value at the first chance node can be calculated. This number, $62 million in this example, represents the ENPV to the sponsor of moving forward with the development project at the time when the decision is made to continue or abandon the new drug. This value reflects all of the possibilities that can unfold over time clearly depicting the sub-optimal choices that a revenue-maximizing developer should reject. The decision tree also characterizes the full range of outcomes, with the worst case scenario being failure in the NDA review stage to the best case scenario of FDA approval.
Postmarketing commitments, such as pediatric trials, and costs associated with supply chain activities, as described earlier, do not appear in Figure 2 as part of the decision tree because they do not play a role in determining which branch or outcome node a new drug ends up on in the same way that pre-clinical, Phase 1, 2, 3 trials, and NDA/BLA application process do. However, these costs can easily be reflected in the values shown in the tree.4 The cost of these activities can then be discounted back to the start of the project (in the same way all of the other costs are) and included in the branch representing successful completion of applicable phases and approval of the new drug.
3 The figures provided are for demonstrative purposes only and do not represent a specific antibacterial NME.
4 For the purposes of this example, the costs of supply chain and post marketing activities are assumed to be zero.
3.2 Antibacterial Drug Private ENPV Model Parameters and Assumptions
Table 4 presents the point estimates for the private ENPV model parameters and assumptions. The following sections discuss the basis for these estimates in further detail.
3.2.1 Real Opportunity Cost of Capital
The real opportunity cost of capital represents the rate of return (net of inflation) that the drug sponsor would otherwise be able to earn at the same risk level as the investment in the new antibacterial drug that has been selected. The cost of capital rates used by the pharmaceutical sector reported in the literature range from a low of 9 percent to as high as 40 percent. For example, in their most widely cited study, DiMasi et al (2004) use an 11 percent discount rate based (in part) on historic returns in the industry.
According to experts interviewed, the opportunity cost of capital varies significantly by drug sponsor-specific factors, such as new product candidate portfolio, size of company, type of company (pharmaceutical or biopharmaceutical), as well as other exogenous factors, such as economic and regulatory climate for drug development projects. While large pharmaceutical companies use rates ranging from 9 percent to 13 percent, the rates used by small venture-capital backed pharmaceutical companies tend to be much higher ranging from 20 percent to as high as 70 percent. On the other hand, the rates used by biopharmaceutical companies reportedly vary from 18 percent to 24 percent.
In the model, we use 11 percent as the average real opportunity cost of capital. Because the parameter value heavily influences private ENPV outcomes, we assign a triangular probability distribution with a lower limit of 9 percent, an upper limit of 24 percent, and a likely point estimate of 11 percent for sensitivity analysis purposes.
3.2.2 Pre-clinical R&D Cost
A direct link between pre-clinical expenditures and the specific drug that ends up being commercialized is difficult to establish. For biopharmaceuticals, DiMasi and Grabowski (2007) estimate the average out-of-pocket cost of pre-clinical development that includes expenditures for both basic research and pre-clinical development at $59.9 million in 2005 dollars. The authors’ figures are based on a sample of 17 compounds from a biotechnology company and are not specific to antibacterials.
Table 4: Private ENPV Model Parameters and Assumptions (Point Estimates)
| Indication | ABOM | ABSSSI | CABP | CIAI | CUTI | HABP/VABP |
|---|---|---|---|---|---|---|
| Real Opportunity Cost of Capital | 11.0% | |||||
| Pre-clinical R&D Time (in Years) | 5.5 | |||||
| Pre-clinical R&D Cost | $21,084,405 | |||||
| Pre-clinical R&D Success Probability | 35.2% | |||||
| Phase 1 Clinical Trial Time (in Years) | 0.9 | |||||
| Phase 1 Clinical Trial Cost | $9,652,500 | |||||
| Phase 1 Clinical Trial Success Probability | 33.0% | |||||
| Phase 2 Clinical Trial Time (in Years) | 1.3 | 0.8 | 1.3 | 0.9 | 0.9 | 1.5 |
| Phase 2 Clinical Trial Cost | $9,164,533 | $8,852,794 | $9,129,191 | $9,588,073 | $9,088,073 | $15,635,029 |
| Phase 2 Clinical Trial Success Probability | 50.0% | |||||
| Phase 3 Clinical Trial Time (in Years) | 2.0 | 1.0 | 1.0 | 1.8 | 1.8 | 3.3 |
| Phase 3 Clinical Trial Cost | $41,699,750 | $33,640,993 | $38,840,993 | $50,558,507 | $43,758,507 | $101,375,897 |
| Phase 3 Clinical Trial Success Probability | 67.0% | |||||
| FDA New Drug Application (NDA) Review Time (in Years) | 0.8 | |||||
| NDA/BLA Submission Cost | $1,958,800 | |||||
| NDA/BLA Success Probability | 85.0% | |||||
| Sample preparation for animal/human studies | $2,676,066 | |||||
| Process research/development/design | $26,760,658 | |||||
| Plant design | $13,380,329 | |||||
| Plant build | $82,958,039 | |||||
| Non-clinical Work Time (in Years) | 4.0 | 2.6 | 3.0 | 3.5 | 3.5 | 5.5 |
| Non-clinical Work Cost | $3,700,000 | |||||
| Post-approval Pediatric Trial Time (in Years) | 3.0 | |||||
| Post-approval Pediatric Trial Cost | $10,000,000 | |||||
| Time to generic entry upon FDA Approval (in Years) | 12 | |||||
| Percentage Reduction in Revenues due to Generic Competition | 50.0% | |||||
| Total Product Life (in Years) | 20 | |||||
| Total Market Size (in $ million) | $2,950 | $6,590 | $7,970 | $4,660 | $6,540 | $3,470 |
| Product Success Probability | 60% | |||||
More recently, using data from Eli Lilly and Company along with industry benchmarks, Paul et al (2010) estimate the average out-of-pocket pre-clinical expenditures at $18.5 million in 2008 dollars for the pharmaceutical industry overall, which is the sum of expenditures associated with target-to-hit ($1 million), hit-to-lead ($2.5 million), lead optimization ($10 million) and pre-clinical ($5 million) stages. In contrast to the DiMasi et al (2004) figure, Paul et al.’s (2010) estimate excludes costs associated with the earliest phase of discovery research prior to target selection.
While some experts contend that drug sponsors only include the pre-clinical stage expenditures but not those incurred prior to this stage in their private ENPV calculations, others argue that all early stage R&D expenditures enter into the decision making process. Given that the research required to identify and validate a given target is highly variable and difficult to quantify, we only consider the cash outlays needed for target-to-hit, hit-to-lead, lead optimization, and pre-clinical development in this model. Using figures provided by Paul et al (2010), we estimate the total cost of pre-clinical research at $21.1 million in 2012 dollars. For sensitivity analysis, we assume that the pre-clinical cost parameter follows a triangular probability distribution with a lower limit of $19.0 million, an upper limit of $23.2 million, and a mean of $21.1 million (see Table 5).
Table 5: Pre-clinical R&D Cost Estimates (in 2012 $ million)
| Source [a] | Min | Mean | Max | Comments |
|---|---|---|---|---|
| DiMasi & Grabowski, 2007 | N/A | $76.9 | N/A | Includes basic research and all costs associated with stages prior to clinical |
| Paul et al., 2010 | N/A | $21.1 | N/A | Includes costs associated with target-to-hit, hit-to-lead, lead optimization, and pre-clinical stages |
| ERG | $19.0 | $21.1 | $23.2 | Includes costs for the target-to-hit, hit-to-lead, lead optimization, and pre-clinical stages (screening to IND) but not very early stage R&D |
N/A = Not available
[a] The figures are inflated to 2012 dollars using the CPI inflator.
[b] Italics indicate that the estimate is extrapolated based on the provided range estimate.
3.2.3 Clinical Phase and NDA/BLA Submission Costs
There is very limited data on phase costs by therapeutic class in the public domain. The most widely cited estimates are from DiMasi et al (2004) and are based on confidential data collected from 10 pharmaceutical companies. For anti-infectives, DiMasi et al (2004) report mean clinical trial phase costs of $23 million, $20 million, and $137 million in 2000 dollars for Phase 1, Phase 2, and Phase 3, respectively. As acknowledged by the authors, these phase costs are largely driven by the relatively high development costs for antiretroviral drugs for treatment of persons with HIV/AIDS included in the anti-infectives category.
Our discussions with experts and drug sponsors that specialize in antibacterial drug development yielded estimates that are widely different than those of DiMasi et al (2004). According to experts and company representatives interviewed, current Phase 1 costs for antibacterial drugs range from $7.3 to $12.0 million which includes data management and statistical analysis costs. Further, our interviewees noted that Phase 2 and Phase 3 costs are likely to vary by the type of indication the new drug is designed to treat. Among the six indications considered in this study, Phase 2 and 3 costs are likely to be highest for HABP/VABP around $15.0 million and $100.0 million, respectively. This is primarily because 1) VABP is difficult to clearly define and diagnose and 2) in order to enroll sufficient number of VABP patients in a trial, a large number of trial sites are required, thereby increasing trial costs significantly. Table 6 shows the clinical phase costs and their likely ranges used in this study. The DiMasi et al (2004) estimates are presented in the same table for comparison purposes only.
Table 6: Clinical Phase Cost Estimates (in 2012 $ million), by Indication
| Estimate | ABOM [c] | ABSSSI | CABP | CIAI | CUTI | HABP/VABP | ||
|---|---|---|---|---|---|---|---|---|
| Phase 1 | DiMasi et al (2004) [a] | $36.6 | ||||||
| ERG | Min | $7.3 | ||||||
| Mean | $9.7 | |||||||
| Max | $12.0 | |||||||
| Phase 2 | DiMasi et al (2004) [a] | $31.8 | ||||||
| ERG [d] | Min [e] | $7.4 | $7.12 | $7.28 | $7.68 | $7.28 | $12.48 | |
| Mean | $9.2 | $8.9 | $9.1 | $9.6 | $9.1 | $15.6 | ||
| Max [e] | $11.0 | $10.68 | $10.92 | $11.52 | $10.92 | $18.72 | ||
| Phase 3 | DiMasi et al (2004) [a] | $218.0 | ||||||
| ERG [d] | Min [e] | $33.36 | $26.88 | $31.04 | $40.48 | $35.04 | $81.12 | |
| Mean | $41.7 | $33.6 | $38.8 | $50.6 | $43.8 | $101.4 | ||
| Max [e] | $50.04 | $40.32 | $46.56 | $60.72 | $52.56 | $121.68 | ||
[a] The figures are inflated to 2012 dollars using the CPI inflator.
[b] Italics indicate that the estimate is extrapolated based on the provided range or point estimate.
[c] Phase 2 and Phase 3 trial costs for ABOM is extrapolated by averaging the costs for ABSSSI, CABP, CIAI, and CUTI for the respective phases.
[d] Costs are based on outsourcing expenditures plus an average of 4.5 FTEs for the duration of the clinical trial phase to the drug sponsor to manage project outsourcing with CRO. The cost per FTE is estimated at $94,000 per annum based on earnings data provided by the Bureau of Labor Statistics.
[e] The interval around the point estimate is assumed to be ±20%.
The reported new drug application fee for those drug or biologic product applications requiring clinical data is $1,958,800 for fiscal year 2013. Thus, we use this figure as the NDA/BLA submission cost in the model.
3.2.4 Pre-clinical, Clinical, and NDA/BLA Submission Phase Durations
Private ENPV is dependent on the duration of each phase and the distribution of out-of-pocket costs throughout each phase. Often times, there are overlaps as well as gaps among phases. For example, while Phase 1 may last for nearly 20 months, a company may initiate Phase 2 trials after having completed its single ascending dose tier studies within the first 12 months of Phase 1. There are a number of published studies that provide estimates of average phase durations for pharmaceutical development accounting for these phase overlaps and gaps (see Table 7). None of these reported estimates, however, are specific to antibacterials which may have a different phase duration profile than the “average pharmaceutical.”
Based on the published information and discussion with experts and drug sponsors, the average pre-clinical and Phase 1 durations are set at 66.0 months (i.e., 5.5 years) and 10.5 months (i.e., 0.9 year), respectively. Further, assuming most new antibacterials will get priority review by the FDA, we estimate the NDA approval phase duration at 9.0 months (i.e., 0.75 year) in the model.5 Unlike pre-clinical, Phase 1 and NDA approval times, however, the timelines for Phase 2 and Phase 3 studies are expected to vary across the six different indications.
Table 7: Pre-clinical, Clinical, and NDA/BLA Application Average Phase Durations (in Months)
| Source | Pre-clinical | Phase 1 | Phase 2 | Phase 3 | NDA/BLA |
|---|---|---|---|---|---|
| DiMasi et al., 2003 | N/A | 21.6 | 25.7 | 30.5 | N/A |
| DiMasi et al., 2004 [c] | N/A | 50.5 | 12.5 | ||
| DiMasi & Grabowski, 2007 [a] | 52.0 | 19.5 | 29.3 | 32.9 | N/A |
| Adams & Brantner, 2006 [b] | N/A | 19.0 | 30.0 | 30.0 | 15.8 |
| Paul et al., 2010 | 66.0 | 18.0 | 30.0 | 30.0 | 18.0 |
| Abrantes-Metz et al., 2004 | N/A | 19.7 | 29.9 | 47.0 | N/A |
| ERG | |||||
| ABOM | 66.0 | 10.5 | 15.0 | 24.0 | 9.0 |
| ABSSSI | 10.0 | 12.5 | |||
| CABP | 15.0 | 12.5 | |||
| CIAI | 11.0 | 21.5 | |||
| CUTI | 11.0 | 21.5 | |||
| HABP/VABP | 18.0 | 39.0 | |||
[a] The figures are applicable to biopharmaceuticals.
[b] The reported figures only include those based on the Pharmaprojects database.
[c] The reported figures are specific to anti-infectives.
Depending on the indication, Phase 2 and Phase 3 studies are expected to last from 10.0 to 18.0 months and 12.5 to 39.0 months, respectively (see Table 7). For sensitivity analysis, we again assume that each phase duration parameter has a triangular probability distribution with the following bounds:
- Pre-clinical: Lower bound of 52.0 months, upper bound of 72.0 months
- Phase 1: Lower bound of 9.0 months, upper bound of 21.6 months
- Phase 2
- ABOM: Lower bound of 12.0 months, upper bound of 30.0 months
- ABSSSI: Lower bound of 9.0 months, upper bound of 30.0 months
- CABP: Lower bound of 12.0 months, upper bound of 30.0 months
- CIAI: Lower bound of 10.0 months, upper bound of 30.0 months
- CUTI: Lower bound of 10.0 months, upper bound of 30.0 months
- HABP/VABP: Lower bound of 16.0 months, upper bound of 30.0 months
- Phase 3
- ABOM: Lower bound of 20.0 months, upper bound of 47.0 months
- ABSSSI: Lower bound of 10.0 months, upper bound of 47.0 months
- CABP: Lower bound of 10.0 months, upper bound of 47.0 months
- CIAI: Lower bound of 17.0 months, upper bound of 47.0 months
- CUTI: Lower bound of 17.0 months, upper bound of 47.0months
- HABP/VABP: Lower bound of 35.0 months, upper bound of 47.0 months
- NDA Approval: Lower bound of 6.0 months, upper bound of 12.5 months
5 Under GAIN, Antibacterial or antifungal drugs designated as Qualifying Infectious Disease Products will receive a priority review. The nine-month timeline used in our model reflects a slightly longer approval time given historical data and thus does not reflect the review and approval goals for FDA.
3.2.5 Pre-clinical, Clinical, NDA/BLA Submission Success Probabilities
Table 8 presents the different phase success probabilities (also referred to as phase transition probabilities) reported in the literature and gleaned from discussions with experts and drug sponsors. Estimates reported in DiMasi et al., (2004) and DiMasi et al., (2010) are applicable to anti-infectives whereas the remaining figures from published studies apply to all pharmaceuticals. Based on the collective body of information, we use the following success rates by phase in the model:
- Pre-clinical: Lower bound of 17.5%, upper bound of 69.0%, likely point estimate of 35.2%
- Phase 1: Lower bound of 25.0%, upper bound of 83.7%, likely point estimate of 33.0%
- Phase 2: Lower bound of 34.0%, upper bound of 74.0%, likely point estimate of 50.0%
- Phase 3: Lower bound of 31.4%, upper bound of 78.6%, likely point estimate of 67.0%
- NDA/BLA Approval: Lower bound of 83.0%, upper bound of 99.0%, likely point estimate of 85.0%
Table 8: Pre-clinical, Clinical, and NDA/BLA Submission Success Probabilities (in %)
| Source | Pre-clinical | Phase 1 | Phase 2 | Phase 3 | NDA/BLA |
|---|---|---|---|---|---|
| DiMasi et al., 2003 | N/A | N/A | 71.0% | 31.4% | N/A |
| DiMasi et al., 2004 [d] | N/A | N/A | 66.1% | 38.2% | N/A |
| DiMasi & Grabowski, 2007 [a] | N/A | 83.7% | 56.3% | 64.2% | N/A |
| DiMasi et al., 2010 [d] | N/A | 58.2% | 52.2% | 78.6% | 100.0% |
| Adams & Brantner, 2006 [b] | 31.0% | N/A | 74.0% | 46.0% | N/A |
| Paul et al., 2010 | 69.0% | 54.0% | 34.0% | 70.0% | 91.0% |
| Abrantes-Metz et al., 2004 | N/A | 81.0% | 57.0% | 57.0% | N/A |
| Hay et al., 2011 | N/A | 67.0% | 41.0% | 65.0% | 83.0% |
| ERG | 35.2% | 33.0% | 50.0% | 67.0% | 85.0% |
[a] The figures are applicable to biopharmaceuticals.
[b] The reported figures only include those based on the Pharmaprojects database.
[c] The figure reflects time for an accelerated FDA approval.
[d] The reported figures are specific to anti-infectives.
It should be noted that the average Phase 1 success rate selected for the model is much lower than the figures reported in the literature. According to experts interviewed, this high failure rate is primarily attributable to higher toxicity and tolerance issues for antibacterials compared to other therapeutic areas. Often, studies require use of high doses of the antibacterial to treat resistant infections resulting in toxicity issues for the trial subjects. Unlike other therapeutic areas, such as oncology, where the efficacious exposure may not be determined till Phase 3 trials are completed, the efficacious exposures are known early on for antibacterials, leading to early rather than late failures. Because we did not have any information on how success rates may vary by indication, we apply the same rates across all of the six indications under consideration.
3.2.6 Costs of Supply Chain Activities
The drug sponsor needs to undertake a variety of additional activities concurrently with clinical development, including sample preparation, process research, process development, process design, and plant design and construction. As was depicted in Figure 1, sponsors initially need to focus on preparing sufficient amount of drug sample for use in animal and human studies. Depending on the active ingredient(s), this could cost from $3,500 to over $80,000 per kilogram according to some experts. Upon start of clinical research, the focus shifts to developing a process for commercialization. This includes a pilot facility that provides data for plant design and larger quantities of drug samples for Phase 3 trials. While Phase 3 is ongoing, the sponsor usually begins plant design or starts investigating other arrangements (e.g., contract facilities, licensing, etc.) for manufacturing the drug. Because of significant failure rates in late stage clinical trials, sponsors often cannot commit themselves to building a manufacturing plant until they are certain of the product’s commercialization success. Thus, typically upon successful completion of Phase 3 trials, plans are launched to build a new manufacturing facility or modify existing facilities.
Table 9 below presents the cost estimates for each of these supply chain activities as available from Blau et al. (2004). The figures are based on historical information on nine new drug candidates provided by a large pharmaceutical company to the study authors. We use the reported estimates in our model by inflating the 2004 dollar figures to 2012 dollars with the CPI inflator.
Table 9: Product Supply Chain Activity Costs (in 2012 $ million) as Available from (Blaue, Pekny, Varma, & Bunch, 2004) [a]
| Parameter | Min | Mean | Max | Comment |
|---|---|---|---|---|
| Sample preparation for animal/human studies | $2.4 | $2.7 | $2.9 | Assumes that out-of-pocket costs for the activity are evenly distributed across all clinical phases. |
| Process research/development/design | $18.7 | $26.8 | $34.8 | Assumes that out-of-pocket costs for the activity are evenly distributed across Phases 1 and 2 |
| Plant design | $10.7 | $13.4 | $16.1 | Assumes that 75% of out-of-pocket costs for the activity are spent during Phase 3 and the remaining 25% during the NDA/BLA submission/approval phase. |
| Plant build | $69.6 | $83.0 | $96.3 | Assumes that out-of-pocket costs for the activity are expended during the NDA/BLA submission/approval phase.
|
[a] Authors’ figures are inflated to 2012 dollars using the CPI inflator.
3.2.7 Non-clinical Work Costs and Duration
Sponsors also need to conduct non-clinical work starting with the beginning of Phase 2 through product launch. These involve toxicological studies in up to 2 species that include qualification of final synthetic processes, reproductive toxicity studies, and susceptibility test development. According to experts and drug sponsors, the cost of all such non-clinical work can range from $3.4 to $4.0 million. In the model, we estimate the average cost of non-clinical work at $3.7 million.
3.2.8 Post-approval Pediatric Pharmacokinetic/Pharmacodynamic and Safety Study Costs and Duration
The Pediatric Research Equity Act (Public Law 108-155) (PREA), requires the conduct of pediatric studies for certain drug and biological products. Specifically, PREA requires new drug applications (NDAs) and biologics licensing applications (BLAs) (or supplements to applications) for a new active ingredient, new indication, new dosage form, new dosing regimen, or new route of administration to contain a pediatric assessment unless the applicant has obtained a waiver or deferral (see section 505B(a) of the Act) (FDA, 2005). Thus, drug sponsors often need to conduct pharmacokinetic and safety studies for the pediatric population post-FDA approval. According to experts and drug sponsors interviewed, these studies could last up to 3 years and cost approximately $10.0 million on average. For sensitivity analysis, we again assume that the cost of post-approval pediatric studies has a triangular distribution with a lower bound of $8.0 million and an upper bound of $12.0 million.
3.2.9 Average Time to Generic Entry upon FDA Approval
We estimate the average time to generic entry upon obtaining FDA approval for the drug at 12 years based on a recent study by Grabowski et al. (2011). For sensitivity analysis, we employ a triangular distribution with endpoints of 10 and 14 years, respectively.
3.2.10 Percentage Reduction in Revenues due to Generic Competition
According to Berndt & Aitken (2010), brand name drugs lose between 5 to 45 percent of their market to generic competition within their first full calendar year after generic entry into the market. Other reported estimates in the published literature range from 25 percent to as high as 75 percent reductions in sales revenue after generic entry into the market. Further, depending on the therapeutic area, the generic market share increases range from 60 to as high as 96 percent within five years after market entry (Berndt & Aitken, 2010).6 For the model, we estimate the expected reduction in revenues after generic entry at 50 percent. Because revenues in out years contribute very little to private ENPV due to discounting, we keep the generic entry market share at 50 percent for the remaining market life of the new antibacterial rather than increasing it over time. For the sensitivity analysis, we assume that the figure has a triangular distribution with a lower bound of 25 percent and an upper bound of 75 percent.
6 The figures represent select therapeutic areas; calcium channel blockers, lipid-regulators, and anti-epileptics. Comparative figures for antibacterials are not available in the published literature.
3.2.11 Total Product Life
Similar to DiMasi et al. (2004), we use 20 years to characterize the average life cycle of a new drug upon market approval. Even though the expected revenues from sales in years beyond 20 contribute very little to private ENPV due to discounting, the model allows the user to vary this parameter for what-if scenario analysis if needed.
3.2.12 Product Launch Success Probability
According to Griffin (1997), only about 60 percent of new product launches end up being commercially successful. Using this as our basis, we assume that there is a 60 percent chance that the novel antibacterial drug market share would be 27.1 percent and a 40 percent (= 1 – 0.60) chance that it would be 12.3 percent. For sensitivity analysis, we use a triangular distribution for the product success probability with a lower bound of 40 percent and an upper bound of 80 percent.
3.2.13 Total Market Size
As noted in Section 1.3, we obtained data on drug expenditures from IMS Health through FDA’s third party agreement. Based on antibacterial drugs approved for the treatment of each of the six indications, IMS Health provided data on total sales of these drugs across all indications by formulation (oral or IV) for the years 2007 to 2011. Using these data, we estimate market size based on 2011 sales in three different ways:
- Estimate 1: Total sales of antibacterial drugs that are in the formulation of interest (i.e., oral or IV) labeled to treat the indication.
- Estimate 2: Total sales of all antibacterial drugs in Estimate 1, plus other formulations of the antibacterial drugs in Estimate 1, plus any other antibacterial drugs (in any formulation) approved to treat the indication.
- Estimate 3: Total sales of all antibacterial drugs in Estimate 2 plus any antibacterial drugs that compete with antibacterial drugs in Estimate 2 for treating other indications (i.e., if a drug included in Estimate 2 is also used to treat another indication, all other drugs used to treat that other indication are added to the total sales calculation for this final estimate). Due to the extent of overlap among drugs used to treat these indications, Estimate 3 is the same across all indications considered ($9.23 billion).
The three estimates are intended to reflect differing visions of drug manufacturers as they consider potential market size. The smallest estimate is for the drug and formulation specifically under development, which represents the most conservative or narrowly defined market vision. The medium estimate represents the larger potential market for treating the same indications, but also reflects the possibility that the NME can be formulated for oral administration as well. The largest estimate represents all potential antibacterial drugs with which the NME might compete if it can also be approved to treat other indications. Table 10 presents the total market size estimates for each indication under consideration. The lists of drugs used for each type of estimate are included in Appendix A.
Table 10: Estimates of Total Market Size, by Indication (in $ Million)
| Estimate | ABOM | ABSSSI | CABP | CIAI | CUTI | HABP/VABP |
|---|---|---|---|---|---|---|
| 1 | $2,720 | $3,070 | $2,290 | $2,530 | $5,760 | $1,780 |
| 2 | $2,950 | $6,590 | $7,970 | $4,660 | $6,540 | $3,470 |
| 3 | $9,230 | $9,230 | $9,230 | $9,230 | $9,230 | $9,230 |
Source: (IMS Health, 2012)
For the model, we assume that the total market size for each indication has a uniform distribution with Estimate 1 and Estimate 3 constituting the lower and upper bounds, respectively. Additionally, Estimate 2 serves as our point estimate in the model.
3.2.14 Expected Market Share at Peak Year Sales
The rate and extent of market penetration for pharmaceutical products depend on the maturity of the market as well as product characteristics (IMS Health, 2010). Significantly, innovative products that face no or little competition enjoy quicker sales growth compared to commoditized products. According to data from IMS Health, a differentiated product could potentially capture around 27 percent of the market at its peak year sales point whereas a commodity product’s market share at its peak year sales point may not be half as large (around 12 percent of market share).
If the new antibacterial drug is expected to be significantly better (in terms of safety and/or efficacy) than existing drugs in the same market, we assume a peak year sales market share of 27 percent based on the “differentiated” market share curve provided in IMS Health (2010). If, on the other hand, the new antibacterial drug is not substantially superior to existing therapies, we assume a peak year sales market share of 12 percent based on the “commodity” market share curve provided in the same source.
3.2.15 Market Uptake for a New Antibacterial Drug over Time
Table 11 presents sales data on Cubicin (daptomycin,) an antibacterial drug launched in the U.S. in 2003. Cubicin is indicated for the treatment of complicated skin and skin structure infections (cSSSI) and Staphylococcus aureus bloodstream infections, including cases caused by methicillin-resistant Staphylococcus aureus (MRSA). As can be observed from the figure, it takes an antibacterial drug much longer to achieve peak year sales compared to other drugs. According to Shlaes (2010), healthcare providers have little incentive to use the antibacterial drug unless it addresses an immediate antibacterial drug resistance problem. Physicians will restrain their use of the new drug to avoid rapid emergence of resistance to the new agent thereby slowing down market uptake.
In the model, assuming no real change in antibacterial drug reimbursement, we use the rate of uptake reported in Table 11 as the typical rate for a novel antibacterial drug. Assuming that the novel drug would be able to capture between 27 percent and 12 percent of the total market (see previous Section 3.2.14 for a discussion on the basis for these numbers) when it reaches its peak year sales.
Table 12 presents the market size estimates from launch year to peak year sales years which is reached approximately 10 years after product launch.
Table 11: Annual Total Net Revenues for CUBICIN from Launch (2003) to 2012
| Year | Total Net Revenues | Year-to-Year % Change |
|---|---|---|
| 2003 | $3.7 | 0% |
| 2004 | $68.1 | 1741% |
| 2005 | $120.6 | 77% |
| 2006 | $194.7 | 61% |
| 2007 | $294.6 | 51% |
| 2008 | $433.6 | 47% |
| 2009 | $562.1 | 30% |
| 2010 | $636.4 | 13% |
| 2011 | $754.0 | 18% |
| 2012 [a] | $915.0 | 21% |
Source: Cubist, 2013
[a] The figure is the midpoint of the reported range of $900 to $930 million.
Table 12: Expected Market Share Estimates over Time for a New Antibacterial Drug
| Year | Market Share | Product Launch Success Probability [a] | Expected Market Share [b] | |
|---|---|---|---|---|
| Lower Bound< | Upper Bound< | |||
| 1 (Launch) | 0.05% | 0.11% | 60% | 0.07% |
| 2 | 0.87% | 1.91% | 1.29% | |
| 3 | 1.57% | 3.47% | 2.33% | |
| 4 | 2.57% | 5.68% | 3.81% | |
| 5 | 3.92% | 8.64% | 5.81% | |
| 6 | 5.79% | 12.77% | 8.58% | |
| 7 | 7.52% | 16.59% | 11.15% | |
| 8 | 8.52% | 18.80% | 12.63% | |
| 9 | 10.10% | 22.30% | 14.98% | |
| 10 | 12.27% | 27.08% | 18.19% | |
[a] See Section 3.2.12 for further discussion on the basis for this parameter
[b] The expected market share is computed as: (Lower Bound % × [1 – 60%]) + (Upper Bound % × 60%)
3.3 Private ENPV Estimates by Indication
Figure 3 presents the estimated private ENPVs by indication for a new antibacterial drug. As can be observed from the figure, the private ENPVs for both ABOM and HABP/VABP are lower than zero, indicating that expected returns from developing new antibacterials for the treatment of these indications are lower than development costs. According to our model, the expected return to developing a new antibacterial for the treatment of CABP is highest ($37 million), followed by ABSSSI ($27 million) and CUTI ($22 million). All of these figures assume no change in antibacterial drug reimbursement methodologies.
Figure 3: Estimated Private ENPVs by Indication for a New Antibacterial Drug (in $ Million)
To assess the sensitivity of our private ENPV results to model parameters and assumptions utilized, we conducted a Monte Carlo analysis in which the point estimates reported in Table 4 were replaced by distribution of values (the probability distributions used and the applicable functional parameters are discussed in those sections applicable to the model parameter above). Table 13 and Figure 4 present the results of this sensitivity analysis. In the figure, the error bars correspond to the 90 percent confidence bounds. As can be observed, there is wide variation in the estimated private ENPV values across the different indications. The primary drivers for the observed wide range of results are attributable to the following model parameters in order of importance:
- Total market size,
- Real opportunity cost of capital, and
- Total time to market.
Table 13: Private ENPV Sensitivity Results (Figures are in $ Million)
| Indication | Private ENPV (in $ Million) | ||
|---|---|---|---|
| 90% Lower Bound | Mean | 90% Upper Bound | |
| ABOM | -$18.8 | -$2.7 | $215.1 |
| ABSSSI | -$15.8 | $27.1 | $198.9 |
| CABP | -$17.6 | $37.4 | $330.0 |
| CIAI | -$18.0 | $8.9 | $222.5 |
| CUTI | -$16.3 | $21.9 | $213.0 |
| HABP/VABP | -$23.5 | -$4.5 | $126.7 |
Figure 4: Sensitivity of Estimated Private ENPVs by Indication for a New Antibacterial Drug (in $ Million) - Error Bars Represent 90% Confidence Bounds
3.4 Threshold Analysis of Incentive Options
We considered each incentive identified in Section 2 in the context of our private ENPV framework. This threshold analysis involved calculating the level of each incentive (in dollars) that would equate the private ENPV to $100 million for a drug sponsor that is at the start of pre-clinical phase. This threshold represents the developer’s opportunity cost of engaging in R&D for a new drug. For sponsors at later stages of drug development, levels of incentives will likely be different. While the selection of a $100 million threshold value is somewhat arbitrary, the figure is comparable to the figures used in other similar analysis and has been indicated as being the tipping point for smaller companies by some of the experts interviewed for the study. Figure 5 depicts the amounts needed to achieve a $100 million private ENPV at the start of pre-clinical phase across the different indications studied. As can be observed, the level of the incentive valued at the start of pre-clinical phase needs to be $104 million to induce a drug sponsor to begin development of an antibacterial drug designed to treat HABP/VABP. On the other hand, for CABP, the level of the incentive needed is $63 million.
Table 14 presents the different incentive values needed to get to the threshold of $100 million for each of the indications. It is important to note that the estimated incentive levels are geared towards encouraging a drug sponsor that is at the start of pre-clinical phase (i.e., model frame of reference). The extent and magnitude of the incentives needed for those sponsors that may be at different points along the decision tree (e.g., start of Phase 3), are expected to decrease closer the sponsor is to a successful product launch. Moreover, the inclusion of the pre-clinical phase, which is the longest at 5.5 years, heavily influences our estimates. Some of the other key findings from the analysis include the following:
- Intellectual property (IP) extensions are not sufficient by themselves to incentivize a drug sponsor that is at the start of pre-clinical phase. This is primarily due to the effect of discounting, whereby the product revenues in out years contribute increasingly less to the net present value.
- The percentage reduction in the cost of capital needed through tax incentives ranges from 33 percent (ABSSSI) to 81 percent (CUTI) from the baseline level of 11 percent. For ABOM, CIAI, and HABP/VABP, even a zero cost of capital is insufficient to reach a $100 million private ENPV.
- Across the different indications, the total time to market varies from 9 years (ABSSSI) to around 12 years (HABP/VABP). Decreasing the overall time to market through modifications to clinical trial process and approval standards is insufficient for ABOM, CIAI, and HABP/VABP. For the remaining three indications (ABSSSI, CABP, and CUTI), the total time to market needs to reduce significantly to 2 to 4 years from its current level of 9 to 10 years to incentivize those drug sponsors at the start of pre-clinical phase.
- Grant/award/prize amounts increase substantially if paid out at later stages of clinical development. This is due to multiple factors, time discounting being one of them. As the drug sponsor moves along the decision tree depicted in Figure 2, clinical research costs and hence risks also increase.
- Principal-agent problems might be relevant for early stage R&D grants/prizes/awards as there is a greater risk in the early stages that a sponsor could abandon development after receiving funding.
Figure 5: Difference between $100 Million Threshold and Estimated Private ENPV, by Indication (in $ Million)
Table 14: Incentive Values Needed to Get to the $100 Million Threshold for Private ENPV for a Sponsor at the Beginning of Pre-clinical Phase
| Incentive | Model Parameter | Baseline | ABOM | ABSSSI | CABP | CIAI | CUTI | HABP/VABP |
|---|---|---|---|---|---|---|---|---|
| Intellectual Property (IP) Extensions [a] | Time to Generic Entry (in Years) | 12 | N/S | N/S | N/S | N/S | N/S | N/S |
| Tax Incentives | Real Opportunity Cost of Capital | 11% | N/S | 2.4% | 7.4% | N/S | 2.1% | N/S |
| Modifications to the Clinical Trial Process and Approval Standards | Total Time to Market (in Years) | Varies | N/S | ~3.5 | ~4.0 | N/S | ~2.0 | N/S |
| Grants/Award/Prizes Paid out Sequentially (in $ Million) [c] | ||||||||
| Pre-clinical [b] | $0 | $98 | $59 | $46 | $79 | $53 | $103 | |
| Phase 1 [b] | $0 | $98 | $76 | $67 | $89 | $86 | $103 | |
| Phase 2 [b] | $0 | $196 | $165 | $159 | $203 | $223 | $207 | |
| Phase 3 [b] | $0 | $586 | $495 | $477 | $617 | $694 | $621 | |
| NDA/BLA Approval [b] | $0 | $147 | $124 | $119 | $154 | $173 | $155 |
N/S = No solution
[a] IP collectively refers to patents/DE/ME/PTAs/PTEs/SPCs. The example is more applicable to patent extensions, however.
[b] Because five different grant/award/prize amounts are solved for simultaneously, there are no unique solutions for the computed threshold values.
[c] The amounts are shown by phase of development and would need to be paid out sequentially. For example, in order to achieve the $100 million threshold for ABSSSI sequential payments (in millions of dollars) of $59, $76, $165, $495, and $124 would be required at each successfully completed phase of development listed in the table for a total payout of $919 million dollars over time.
3.5 Expected Present Value (EPV) Framework for Evaluating Social Returns
In addition to estimating the private expected net present value (ENPV) of a new antibacterial drug to the sponsor, we also need to consider the expected net present value (ENPV) of the new antibacterial drug to society as a whole. The social ENPV considers the societal costs and benefits of these drugs. From the perspective of economic efficiency, providing incentives to private individuals to develop new antibacterial drugs makes sense if the social ENPV of these drugs is positive, but the private ENPV is insufficient for sponsors to produce these drugs.
The methodology we employed for evaluating social ENPV for each of the six indications involved the following steps:
Step 1 – Estimate the Value of the New Antibacterial Drug to the Individual. We estimate the burden of experiencing an illness to the individual for each indication we study. We consider two potential cases for each illness:
- Morbidity – the individual becomes sick, then returns to full health, and
- Mortality – the individual dies as a result of the disease
To measure the burden of morbidity, we use Quality Adjusted Life Years (QALYs). QALYs measure the equivalent number of years of life in perfect health lost as a result of the illness, and are widely considered to provide some measure of a patient’s lost “utility” or preference due to illness (although economists might argue that it is not derived from a well-defined utility function). Intuitively, the QALY weight is a preference ranking bounded by 0 and 1 that reflects a person’s state of health (1 signifies perfect health, and 0 indicates health equivalent to being dead).7 We estimate two key data elements: 1) the QALY weight, and 2) the average duration of the illness. Tufts Medical Center maintains a searchable online “Cost-Effectiveness Analysis Registry” that includes QALY weights (Cost-Effectiveness Analysis Registry); which is where we obtained weights to use for each indication. We then adjusted these weights by period of illness using the following equation, which represents the reduction in QALYs multiplied by the percent of a year during which the illness is experienced:8, 9
Average duration of illness was obtained from the literature on each indication as described in further detail in the following sections below.
The data elements required to calculate lost QALYs for patients who die are: 1) the age at which a patient dies due to the infection, and 2) the typical life expectancy for the age at which the patient dies. In the case of death, the QALY weight is zero, so the loss of QALYs for a single patient for a single year of life would be 1.0, and the period over which the QALYs were lost would be the years of life lost.10
Step 2 – Estimate Annual Societal Burden by Extrapolating the Individual Burden. To calculate societal burden, we estimated the total number of illnesses and deaths associated with each of the indications in the U.S. per year. In most cases, the total number of cases per year was available or derived from the literature on each indication. Using population estimates from the U.S. Census Bureau, we converted the total number of episodes (by age group, where possible) to rates and applied those rates to 2011 population figures to obtain a total number of cases for the year 2011 for all indications (U.S. Census Bureau, 2008). Additionally, mortality rates for each indication were either derived from the clinical literature or calculated using the Compressed Mortality File (from Centers for Disease Control and Prevention, National Center for Health Statistics, available online from CDC WONDER).
Step 3 – Monetize Societal Burden of Illness. We monetize our estimates of QALYs lost by using the value of a statistical life year (VSLY). The VSLY is based on the value of a statistical life (VSL). The VSL is a measure of how much consumers are willing to pay for a small reduction in their probability of dying. This small amount is then aggregated over the probabilities to give the VSL. For example, if consumers are willing to pay $400 to reduce their risk of dying by one in 20,000, then the VSL is $8,000,000 (= $400 × 20,0000). We then extrapolate the VSLY from the VSL by amortizing it at a 3 percent real discount rate over the remaining years of expected life. Thus, we applied the value of that year of life to the duration of the illness and the loss of utility from that illness to place a monetary value on the lost QALYs. This approach is clearly a mere approximation of WTP and has been criticized in the past for using a constant estimate of VSL instead of allowing VSL to vary over a person’s life span. Although still controversial, in the absence of direct, valid estimates of WTP, this approach provides a usable alternative.
Step 4 – Calculate Net Present Value (NPV) of the Total Societal Burden of Disease for the Projected Useful Life of the New Antibacterial (i.e., 20 Years). Using the annual monetized societal burden of disease computed in Step 3, we estimated the 20-year burden by adjusting for population growth and using a 3 percent social discount rate.
Step 5 – Estimate Reduction in Total Societal Burden of Disease due to the New Antibacterial Drug. From a societal perspective, social benefits accrue only if the new drug offers a therapeutic benefit over existing drugs in terms of reductions in morbidity or mortality. Therefore, we assumed that the new antibacterial drug must somehow be an improvement over existing drugs: patients get better faster, and/or patients that are resistant to existing drugs will not be resistant to the new drug.
To derive this benefit, we used estimates of 1) percentage of patients that are not effectively treated by existing drugs, and 2) percentage increase in disease duration in those patients that do not respond to existing therapies compared to those that do respond. Combining these assumptions, we then calculated the percentage reduction in the total social burden of illness for the new antibacterial (see Sections 3.6.2 and 3.6.3 below).
Step 6 – Calculate Social EPV at the Model Reference Point (i.e., Start of Pre-clinical Phase). The value computed in Step 5 represents the social NPV at the point of product launch (i.e., the social value that corresponds to the uppermost end node on the decision tree depicted in Figure 2). To be able to compare private ENPV to social EPV, we rolled back the social NPV using the respective success/failure probabilities for each decision tree branch all the way back to the model reference point.
7 It is possible to conceive of cases in which the health state of a living person is zero, or even negative, however the intuitive explanation provided here is adequate for our current purposes.
8 The key assumption here is that the quality of the patient’s life is reduced by the value of the QALY weight. For example, a patient suffering from a preexisting condition might have an initial health state value that is less than 1; however, as long as the illness further reduces the patient’s health state by the value of the QALY weight, the calculation is still correct. It is plausible that the combined effect of two or more health conditions will reduce the patient’s quality of life by less than the sum of the individual QALY weights, in which case this calculation will overestimate the reduction in QALYs; however we did not have data to support such adjustments.
9 Assuming an initial health value of 1 will overestimate benefits as most individuals are not in full health.
10 This method is an overestimate of the QALYs lost due to death because absent the illness that caused death, the individual would not have lived for the rest of his or her life in a state of perfect health.
3.6 Antibacterial Drug Social EPV Model Parameters and Assumptions
Table 15 presents the point estimates for the social EPV model parameters and assumptions. The following sections discuss the basis for these estimates in further detail.
3.6.1 Real Annual Social Rate of Discount
In accordance with the Office of Management and Budget (OMB) guidelines for economic analysis, we use a real social discount rate of 3 percent in the analysis. The social discount rate is assumed to have a triangular probability distribution with a lower bound of 1 percent and an upper bound of 7 percent in the sensitivity analysis.
Table 15: Social EPV Model Parameters and Assumptions (Point Estimates)
| Model Parameter/Assumption | ABOM | ABSSSI | CABP | CIAI | CUTI | HABP/VABP |
|---|---|---|---|---|---|---|
| Real Annual Social Rate of Discount
| 3% | |||||
| % of Patients Not Responding to Existing Drugs | 20% | |||||
| % Increase in Duration in Patients Not Responding to Existing Drugs | 50% | |||||
| Loss in Quality of Life, Acute | 0.11 | 0.36 | 0.15 | 0.5 | 0.27 | 0.17 |
| Duration (days) | 10 | 6 | 4 | 10 | 4 | 8.5 |
| Loss in Quality of Life, Convalescence | 0.04 | 0.36 | 0.1 | 0.15 | N/A | N/A |
| Duration (days) | 20 | 18 | 5 | 12 | N/A | N/A |
| Lost QALYs per illness | 0.0049 | 0.0239 | 0.0038 | 0.0023 | 0.0030 | 0.0040 |
| Total Number of Cases per Year (unadjusted for population growth) | 13,200,000 | 726,000 | 1,170,000 | 72,000 | 1,083,000 | 272,600 |
| Mortality Parameters | ||||||
| Deaths | 0 | 1,923 | 51,683 | 14,554 | 36,900 | 81,779 |
| Lost QALYs for Patients that Die | 0 | 26,167 | 572,741 | 243,987 | 319,913 | 1,848,212 |
| VSL per Patient | N/A | $5,623,708 | $5,301,924 | $5,585,504 | $4,953,688 | $4,770,000 |
| Morbidity Parameters | ||||||
| Number of Patients that Survive | 13,200,000 | 724,397 | 1,118,000 | 57,489 | 1,045,986 | 190,818 |
| Lost QALYs for Patients that Survive | 65,248 | 17,336 | 4,295 | 1,632 | 2,432 | 756 |
| WTP (VSLY*Lost QALYs) per patient | $1,124 | $8,749 | $1,113 | $12,717 | $758 | $1,149 |
N/A = Not applicable
QALY = Quality-adjusted-life-year
VSL = Value of a statistical life
VSLY = Value of a statistical life year
WTP = Willingness-to-pay
The figures in the table are rounded for presentation purposes.
3.6.2 Percentage of Patients not Responding to Existing Commonly Used Antibacterial Drugs
The percentage of patients that do not respond to existing commonly used antibacterials is difficult to estimate on a nationwide as well as on an indication basis. Antimicrobial resistance varies widely by hospital and geographic region, depending on local resistance patterns and standard prescribing practices.
Published estimates of indication-specific antimicrobial resistance are scarce. Evans, et al. (2007) find that out of 604 surgical admissions treated for at least one Gram-negative rod (GNR) infection in a university hospital surgical intensive care unit and ward, 137 (23 percent) were due to infections with GNR resistant to at least one major class of antibacterial drugs (rGNR). In a later study, Roberts, et al. (2009) report that in a sample of 1,391 patients in a Chicago area hospital, 188 (13.5 percent) had antibacterial drug-resistant infections.11 According to a 2009 report by the European Center for Disease Prevention and Control (ECDC) and the European Medicines Agency (EMEA), resistance to antibacterial drugs is high among Gram-positive and Gram-negative bacteria that cause serious infections in humans and reaches 25 percent or more in several EU Member States.12
One expert interviewed for the study estimated that roughly a third of all hospital-acquired infections are resistant to standard antibacterial drugs but that resistance is increasing more slowly in the outpatient setting. The expert further speculated that if approximately 30 percent of infections are resistant to antibacterial drugs in hospitals, the rate of resistance in the outpatient settings might range from 10 percent to 15 percent. A large pharmaceutical executive noted that resistance to commonly used antibacterial drugs currently ranges from 20 percent to 25 percent according to internal research conducted by his company.
Table 16 summarizes the antimicrobial resistance data available for the model estimate. As can be observed from the table, reported estimates of antimicrobial resistance are highly varied. Based on the collective body of evidence available, we use 20 percent as the average percentage of patients not responding to existing commonly used antibacterial drugs in the U.S., independent of type of indication. For sensitivity analysis, we assume that the parameter follows a uniform probability distribution with a lower limit of 10 percent and an upper limit of 25 percent.
11 In the study, an infection was defined as antibacterial resistant if the implicating organism(s) fell into one of four subgroups: (1) methicillin-resistant Staphylococcus aureus, (2) vancomycin-resistant enterococci, (3) Escherichia coli resistant to fluoroquinolones or third-generation cephalosporins or Klebsiella species resistant to third-generation cephalosporins (AREK), and (4) amikacin- or imipenem-resistant Enterobacter, Pseudomonas, or Acinetobacter species (AIR).
12 In the study, the antibacterial resistant gram-positive bacteria included Staphylococcus aureus, Enterococcus spp. (e.g., Enterococcus faecium), and Streptococcus pneumoniae. The gram-negative bacteria included Enterobacteriaceae (Escherichia coli and Klebsiella spp.), and Non-fermentative Gram-negative bacteria (Pseudomonas aeruginosa).
3.6.3 Percentage Increase in Disease Duration for Patients Not Responding to Existing Commonly Used Antibacterial Drugs
There are no publicly available estimates of how long each of the different types of illnesses last in patients who do not respond to existing commonly used antibacterial drugs. Thus, for analysis purposes, we assume that those patients who do not respond to existing drugs have an average duration of illness 50 percent longer than those who do respond. For sensitivity analysis purposes, we further assume that the parameter follows a uniform distribution with a lower bound of 25 percent and an upper bound of 100 percent.
In the analysis, we further assume that 1) all those not responding to existing commonly used antibacterial drugs respond to the new drug and 2) their duration of illness is reduced to the average of those responding to existing drugs.13 Combining these assumptions, we then calculate that a new antibacterial will reduce the total social burden of illness by about 9 percent. This estimate is highly uncertain, as we do not know the actual improvement in patient response to a hypothetical new antibacterial drug. It should also be noted that this does not imply that the new antibacterial drug will avert 9 percent of deaths attributable to the different types of indications studied here. Given data limitations, our analysis cannot distinguish between avoided mortality and morbidity cases due to the new antibacterial drug. We only are able to compute overall reductions in the total social burden of illness due to these new drugs in monetary terms.
Table 16: Reported Estimates of Antimicrobial Resistance
| Source | % of Patients Resistant to Commonly Used Antibacterial Drugs |
|---|---|
| Evans, et al., 2007 [a] | 23.0% |
| Roberts, et al., 2009 [b] | 13.5% |
| ECDC/EMEA Joint Technical Report, 2009 [c] | |
| Methicillin-resistant S. aureus (MRSA) | 25.0% |
| Vancomycin-resistant Enterococcus faecium | 8.0% |
| Penicillin-resistant S. pneumonia | 4.0% |
| Third-generation cephalosporin-resistant E. coli | 9.0% |
| Third-generation cephalosporin-resistant K. pneumoniae | 20.0% |
| Carbapenem-resistant P. aeruginosa | 19.0% |
| Expert 1 | |
| Inpatient | 30.0% |
| Outpatient | 10.0% - 15.0% |
| Expert 2 | 20.0% - 25.0% |
[a] Based on a sample of 604 surgical admissions treated for at least one Gram-negative rod (GNR) infection [b] Based on a sample of 1,391 patients in a Chicago area hospital
[c] Based on European Antimicrobial Resistance Surveillance System (EARSS) for EU Member States, Iceland
and Norway for each year during the period 2002–2007
13 This is a simplifying assumption that likely leads to an overestimation of social benefits. In reality, there will be time lost for the patient due to being on the wrong drug initially.
3.6.4 Value of a Statistical Life (VSL)
To calculate VSL, we first took the value of a statistical life reported in 2000 dollars by age group from Aldy & Viscusi (2008). Next, it was necessary to adjust the VSL values by age group to capture changes in real income as well as prices from 2000 to 2011. Current data from the U.S. Bureau of Economic Analysis (BEA) show that the real personal income per capita was $28,888 in the year 2000 and $32,635 in 2012 (both in 2005 dollars), yielding a growth rate of 13 percent over this span of time. Moreover, Hammitt & Robinson (2011) report that U.S. regulatory agencies generally assume that a 1.0 percent change in real income over time will result in a 40 to 60 percent change in the VSL. Using the midpoint of this range (50 percent), we inflated the reported VSL values by age group by 1.065 (= 1 + [0.5 × 0.13]) to account for changes in real income from 2000 to 2011. To adjust the VSL values for price changes, we used the general consumer price index-based inflation calculator (available on the Bureau of Labor Statistics website) that shows an average price increase of approximately 31 percent over the same time period. We then calculated the age-specific VSLY and apply it to the estimated number of years of life lost for each condition.
3.6.5 Morbidity
3.6.5.1 Abom
Total Number of Cases that do not Result in Death
We obtained the number of cases per year from the literature on acute otitis media. As ABOM is generally treated in the ambulatory care setting, we, like many other studies, considered it to be exclusively an outpatient disease and therefore used counts of outpatient visits to estimate the number of episodes per year (see, for example, Huang, et al., 2011). The primary sources used by many researchers to obtain information on acute otitis media visits are the National Ambulatory Medical Care Survey (NAMCS) and the National Hospital Ambulatory Medical Care Survey (NHAMCS), which are the only surveys of U.S. outpatient settings that collect drug prescribing information and allow for calculation of unbiased national estimates (Coco, Horst, & Gambler, 2009; Huang, et al., 2011).
To obtain an estimate of the number of cases per year, we used the information contained in Appendix A of the paper by Huang, et al. (2011) on healthcare utilization and the cost of pneumococcal disease. This study uses data from NAMCS/NHAMCS, to report by age group, the total number of outpatient visits for acute otitis media in which antibacterial drugs was prescribed. Based on information gathered from expert panels and other papers, Huang, et al. (2011) also include estimates of how often typical resolution of the disease occurs (as opposed to delayed resolution), the number of follow-up visits/visits per episode, and the frequency of over-diagnosis. Our first step in calculating the number of episodes per year was to determine the average number of outpatient visits per episode. To do this, we multiplied the probabilities associated with typical and delayed resolution by the number of visits associated with each possibility and arrived at approximately 1.2 visits per episode. Next, we adjusted the number of visits per year by subtracting the estimated proportion of visits that were over-diagnoses, and divided the resulting figures (broken down by age group) by the number of visits per episode, 1.2, to arrive at numbers of episodes per year by age group.
Across all age groups, we found there to be 12.6 million acute otitis media episodes for which antibacterial drugs were prescribed for the year 2004. Our finding is also consistent with the authors’ statements that there were 1.5 million cases of acute otitis media due to pneumococcus, and 12 percent of acute otitis media cases are due to pneumococcus (1.5 million/0.12 = 12.5 million total cases of acute otitis media). Using population estimates by age from the U.S. Census Bureau, we converted the total number of episodes by age group to rates and applied those rates to 2011 population figures to obtain a total number of cases for the year 2011, which we estimated to be 13.2 million. Since there are no deaths associated with ABOM (see discussion below), this is equivalent to the total number of cases that do not result in death.
QALYs Lost per Case
In estimating lost QALYs due to ABOM, we considered one possibility: the patient is ill for a defined period of time and then returns to full health. For more severe conditions, it would be appropriate to also consider the possibility of the patient dying; however, ABOM is not associated with significant mortality, and deaths are therefore unaddressed in the literature (see, for example, Huang, et al., 2011). We also consulted the Compressed Mortality File from the Centers for Disease Control and Prevention and the National Center for Health Statistics and found that the number of deaths associated with various types of acute otitis media were either zero or so small that they were labeled “unreliable.” Therefore, we do not consider the possibility of death in our calculations of QALYs or other social cost estimations for ABOM.
Assuming that all patients eventually recover from ABOM, we considered two possible scenarios: 1) the patient with ABOM is treated, and the initial treatment is successful, and 2) the patient with ABOM is treated, and the initial treatment is unsuccessful, delaying recovery. In the Tufts database, we located a paper that provided numbers of days spent in each stage of the illness/treatment, as well as associated QALY weights (Coco, 2007). This paper evaluated the patient condition over a standard of 30 days. Successful treatment resulted in the patient experiencing acute symptoms for 2.7 days, followed by 27 days of recuperation. Patients whose initial treatment was unsuccessful experienced the same acute symptoms for 2.7 days, followed by another 7 days when the patient would be even sicker; this leaves a 20 day recuperation period. The lost QALY calculations for both possibilities are shown below in Table 17.

According to the ABOM clinical practice guidelines, initial antibacterial drug therapy leads to symptomatic relief at 2 to 3 days in 91 percent of cases; therefore, we weighted success and failure possibilities at .91 and .09, respectively, to arrive at a weighted average of 0.00493 lost QALYs per ABOM episode (American Academy of Pediatrics and American Academy of Family Physicians, Subcommittee on Management of Acute Otitis Media, 2004).
Table 17: QALY Calculations for Acute Bacterial Otitis Media (ABOM)
| Scenario | Days of ABOM | Days of Treatment Success | Days of Treatment Failure |
|---|---|---|---|
| Initial Treatment Success (3) | QALY weight: 0.79 2.7 days | QALY weight: 0.96 27 days | N/A |
| Initial Treatment Failure (4) | QALY weight: 0.79 2.7 days | QALY weight: 0.96 20 days | QALY weight: 0.72 7 days |
Source: Coco, Cost-Effectiveness Analysis of Treatment Options for Acute Otitis Media, 2007.
Total QALYs Lost due to Morbidity
Given that lost QALYs per ABOM case is 0.00493 and the total number of ABOM cases in the US is around 13.2 million, we computed the total annual QALYs lost due to ABOM morbidity to be around 65,000 (= 0.00493 × 13.2 million) in the US.
Morbidity Cost
To calculate VSLY-based illness costs (for patients who do not die, which we assume to be all ABOM patients), we first calculated an average VSLY weighted by ABOM incidence by age group in 2011. This weighted average VSLY is roughly $228,000, which is then multiplied by the average lost QALYs per patient (0.00493) to arrive at $1,124 per patient which yields a total morbidity cost of $14.8 billion.
3.6.5.2 Absssi
Total Number of Cases that do not Result in Death
The total number of cases per year was obtained from the literature on skin and skin structure infections. Using data from the Healthcare Cost and Utilization Project National Inpatient Sample (HCUP NIS) for the 5-year period from 2000 to 2004, Edelsberg, et al. (2009) estimated the total number of hospital admissions for SSTIs to be 869,777 in 2004. The authors also provided estimates broken down by type of skin infection, allowing us to exclude chronic ulcers and infections, gangrene, necrotizing fasciitis, decubitus ulcer infections, diabetic foot infections, and certain healthcare-associated infections (as specified in the FDA guidance for ABSSSIs) and arrive at an estimated 678,956 hospital admissions for ABSSSIs, or approximately 231.9 per 100,000 population. Applied to the 2011 U.S. population, this rate is equivalent to an estimated 726,321 inpatient ABSSSI cases for the year 2011.14
We calculated the total number of patients hospitalized with ABSSSIs that do not die in a given year by subtracting those who die in that year from the total number of ABSSSI patients. This number can then be subtracted from the estimated total number of hospital admissions for ABSSSI in 2011, 726,321 (explained above), to get 724,397 surviving ABSSSI hospital patients.
QALYs Lost per Case
To calculate lost QALYs for patients who have an ABSSSI but recover, we first searched the Tufts database and found a QALY weight of 0.642 for cellulitis, abscess, and wound infection, three major types of ABSSSI (though this QALY weight was for hospital patients infected with MRSA and therefore might represent cases on the more serious end of the severity spectrum) (Lee, et al., 2010). As with ABOM, we then adjusted the QALY weight by period of illness.
The average length of inpatient stay for patients hospitalized for an SSTI is 6.1 days (Menzin, et al., 2010). However, many skin infection patients are treated in both inpatient and outpatient settings, and length of hospital stay does not capture additional days spent sick or recovering outside the hospital. The mean number of days of episode duration is 24.4 days, which includes time spent in both inpatient and outpatient treatment settings (Marton, et al., 2008). Using 24.4 days as the illness period, we calculated the lost QALYs per patient to be 0.02393 as:
Total QALYs Lost due to Morbidity
Given that lost QALYs per ABSSSI case is 0.02393 and the total number of ABSSSI cases that do not result in death in the US is around 724,397, we computed the total annual QALYs lost due to ABSSSI morbidity to be 17,336 in the US.
Morbidity Cost
To calculate VSLY-based illness costs (for patients who do not die), we first calculated an average VSLY weighted by ABSSSI incidence by age group (available from Edelsberg, et al., 2009). This weighted average VSLY is roughly $365,500, which is then multiplied by the average lost QALYs per patient (0.02393) to arrive at $8,749 per patient. The total morbidity cost due to ABSSSI is then $6.3 billion (= $8,749 × 724,397) per annum.
14 The total number of ABSSSI cases—including patients who are treated in the outpatient setting only—is, however, far greater. Hersh, et al. (2008) examined visits by patients with SSTIs to physician offices, hospital outpatient departments, and emergency departments using NAMCS and NHAMCS and found that the overall rate of visits for SSTIs was 48.1 visits per 1000 population in 2005, totaling 14.2 million visits. As patients with skin infections are likely to visit these healthcare settings multiple times over the course of their SSTI episode, it is necessary to divide the total number of visits by the average number of visits per episode to arrive at the number of episodes per year. According to Marton, et al. (2008), who analyzed skin and skin structure infections caused by Staphylococcus aureus using managed care claims data for the years 2002-2005, the mean number of physician visits per episode was 6.3. Thus, 14.2 million outpatient visits divided by 6.3 visits per episode equals roughly 2.3 million episodes per year in 2005, or 778.1 per 100,000 population. Thus, the estimates presented herein constitute a lower bound.
3.6.5.3 Cabp
Total Number of Cases that do not Result in Death
We obtained the number of cases per year from the literature on community-acquired pneumonia and publicly available survey data. Using the National Health and Nutrition Examination Survey (NHANES) III, Niederman, et al. (1998) estimate the total number of CAP cases to be 5.6 million per year, or 2.3 percent of the U.S. population. Of these 5.6 million patients, Niederman, et al. (1998) report that 1.135 million are treated as inpatients, and the remaining 4.5 million are treated as outpatients. The National Hospital Discharge Survey (NHDS) (2009), available from the Centers for Disease Control and Prevention (CDC) website, arrives at a similar total of 1.145 million discharges of patients treated for pneumonia, or a rate of 37.4 per 10,000 population. Applied to the U.S. population in 2011, this rate yields an inpatient case count of approximately 1.17 million (National Hospital Discharge Survey, 2009), though these estimates are not limited to pneumonia cases with bacterial causative agents. Subtracting the total number of deaths (51,683) from this estimate (see Section 3.6.6.3), yields a survivor count of approximately 1.12 million per year.
QALYs Lost per Case
We searched the Tufts database for pneumonia and found reasonable QALY weights to be 0.85 for the period of hospitalization and 0.90 for the post-hospitalization period of convalescence (Pepper & Owens, 2002). We then adjusted these weights by period of illness using the following equation:

The average length of stay in the hospital for pneumonia patients is reported in Pepper & Owens (2002) to be 4 days. However, length of hospital stay does not capture additional days spent sick or recovering outside the hospital. Pepper & Owens (2002) also estimate that healthy young adults miss approximately 9 work days due to pneumonia that is treated in the hospital, which includes 4 days in the hospital and 5 days of convalescence. Depending on what day a person gets sick, this may include one or two weekends, so we added 3 days to this convalescence period (1.5 weekends). Thus, the lost QALYs per patient came out to be 0.00384 computed as:
Total QALYs Lost due to Morbidity
Given that lost QALYs per CABP case is 0.00384 and the total number of CABP cases that do not result in death in the US is around 1.12 million, we computed the total annual QALYs lost due to CABP morbidity to be 4,295 in the US.
Morbidity Cost
To calculate VSLY-based illness costs (for patients who do not die), we took the VSLY for the age group containing the average age of a pneumonia inpatient (age 61, VSLY of $290,150), and multiplied it by the average lost QALYs per patient (0.00384) to arrive at a cost of $1,113 per patient. The total morbidity cost due to CABP was then computed at $1.2 billion (= $1,113 × 1,118,000) per annum.
3.6.5.4 Ciai
Total Number of Cases that do not Result in Death
Estimates of the number of cases of CIAIs each year in the U.S. were not readily available in the literature. Therefore, we estimated incidence using the rate of 2.3 cases of secondary intra-abdominal infections (sIAI) per 10,000 person-years reported in a Netherlands-based study (Sturkenboom, et al., 2005). Using a database of pharmacy dispensing records from community pharmacies linked to hospitalization records, the authors identified potential cases of sIAI on the basis of a primary discharge diagnosis with one of the following International Classification of Diseases, ninth revision (ICD-9-CM) codes: 475, 540–543, 562, 567, 569, 574–577, 614.5, 997.4, 998.2, E8782, and E8783. The authors then excluded “all potential cases that did not receive an intra-abdominal surgical intervention to establish the diagnosis sIAI or antibacterial drug treatment during their hospital admission.” Finally, a clinician and an epidemiologist reviewed the hospital discharge letters associated with the remaining cases to verify that they met the case definition used by the authors (cholecystitis with rupture; diverticular abscess; appendiceal perforation and periappendiceal abscess; acute gastric and duodenal perforation operated within 24 hours; perforation of intestines; traumatic perforation of the intestines; or intra-abdominal abscess). To obtain an estimate of the number of U.S. cases per year, we applied the rate of 2.3 cases per 10,000 person-years to the 2011 U.S. population, resulting in 72,043 cases. Subtracting the total number of deaths (14,136) from this estimate (see Section 3.6.6.4), results in around 57,489 surviving CIAI hospital patients per year.
QALYs Lost per Case
We searched the Tufts database for utility weights related to intra-abdominal infections and found reasonable QALY weights to be 0.50 for the period of hospitalization and 0.85 for the post-hospitalization period of convalescence (Richards & Hammitt, 2002). We then adjusted the utility weights by period of illness using the following equation:

The average length of stay in the hospital for complicated intra-abdominal infections is estimated in various pharmacoeconomic studies to be around 10 days (Cattan, et al., 2002; Sturkenboom, et al., 2005; Walters, Solomkin, & Paladino, 1999). To capture additional days spent sick or recovering outside the hospital, we used 21.8 days as an average length of the post-hospital convalescence period based on the average length of convalescence after appendectomies (National Center for Health Statistics, 1963). Thus, the lost QALYs per patient were estimated at 0.002266 as:
Total QALYs Lost due to Morbidity
Given that lost QALYs per CIAI case is 0.00266 and the total number of CIAI cases that do not result in death in the US is around 57,500, we computed the total annual QALYs lost due to CIAI morbidity to be 1,632 in the US.
Morbidity Cost
To calculate VSLY-based illness costs (for patients who do not die), we took the VSLY for the age group containing the median age of a CIAI inpatient (age 53, VSLY of $561,250) (Sturkenboom, et al., 2005), and multiplied it by the average lost QALYs per patient (0.02266) to arrive at $12,717 per patient. The total morbidity cost due to CIAI was then computed at $731.1 million (= $12,717 × 57,489) per annum.
3.6.5.5 Cuti
Total Number of Cases that do not Result in Death
Assessing the incidence of CUTI is difficult because urinary tract infection is not a reportable disease in the United States (Foxman, 2002). Total number of cases per year was obtained from the literature on urinary tract infections. We estimated cases of community-acquired CUTI separately from cases of hospital-acquired (nosocomial) UTI.
To arrive at a number of cases for community-acquired CUTI, we assumed that all inpatient hospitalizations where the primary diagnosis was urinary tract infection were cases of community-acquired CUTI. Griebling and Freedmen (2007) analyzed the 2000 National Inpatient Sample and estimated a total of 403,814 inpatient hospital stays for men, women and children with UTI as the primary diagnosis in 2000. They provide rates of inpatient stays by age and gender breakdowns. For comparison, we replicated this analysis with the 2009 NIS using the list of ICD-9 codes for urinary tract infection provided by the authors. For 2009, we estimated a total of 543,140 inpatient hospital stays for men, women and children with UTI as the primary diagnosis. When divided by the 2009 U.S. population, this is equivalent to a rate of 17.7 per 10,000 population. The National Hospital Discharge Survey (NHDS) (2009), available from the Centers for Disease Control and Prevention (CDC) website, arrives at a similar total of 575,000 discharges of patients treated for urinary tract infection in 2009, or a rate of 18.8 per 10,000 population. For our calculations, we applied the 2000 rates of inpatient stays for men, women, and children to the U.S. population totals for those categories to arrive at a total an inpatient count of approximately 470,915 cases of community-acquired CUTI in 2011 (National Hospital Discharge Survey, 2009).
According to a 2007 public health report that uses data from the National Nosocomial Infections Surveillance (NNIS) system (conducted by the Centers for Disease Control and Prevention), supplemented by data from the National Hospital Discharge Survey and the American Hospital Association Survey, there were 561,667 cases of healthcare-associated urinary tract infection in 2002 (Klevens, et al., 2007), which is equivalent to a rate of 195.4 per 100,000 population. Applied to the 2011 U.S. population, this rate results in an estimated 611,935 cases for the year 2011.
We subtracted the estimated deaths from the estimated total number of CUTI cases in 2011 to get surviving CUTI hospital patients (448,311 and 597,675 for community-acquired and hospital-acquired, respectively, for a total of 1,045,986 CUTI cases).
QALYs Lost per Case
From the Tufts database, we found a QALY weight of 0.73 as a mean utility weight for bladder infections (Gold, Franks, McCoy, & Fryback, 1998). This value is relatively consistent with a 0.2894 disutility (0.7106 utility) for “chronic dysuria, vaginitis and other symptoms” from a different cost-utility analysis of UTIs in ambulatory women, which also lists a disutility of 0.3732 for pyelonephritis (Barry, Ebell, & Hickner, 1997). As was done for other indications, we adjusted this weight by period of illness.
We calculated lost QALYs separately for community-acquired and hospital-acquired CUTI. To calculate lost QALYs for community-acquired CUTIs, we used an average inpatient length of stay of 4 days. This number represents a weighted average length of stay for adults 18 to 64 years of age, who represent the bulk of the working population. Although there may be some outpatient recovery time following hospitalization for patients who have suffered complicated urinary tract infections, that information is not readily accessible in the literature, so outpatient recovery time is not included in these estimates. Thus, the lost QALYs per patient for community-acquired CUTI were estimated as:
As nosocomial CUTIs occur, by definition, in patients who are already hospitalized for other conditions, it is necessary to differentiate the length of time by which the episode of hospital-acquired CUTI extends the patient’s stay from the entire length of stay due to all conditions from which the patient suffers. According to the literature, nosocomial UTI lengthens the period of hospitalization by 1 to 4 days (Lai & Fontecchio, 2002), so we used the midpoint of that range (2.5 days) for the purposes of our calculations. Again, although there may be some outpatient recovery time following hospitalization for patients who have suffered from nosocomial CUTI, that information is not readily accessible in the literature, perhaps because it is so difficult to distinguish between recovery time for CUTI and recovery time for the patient’s underlying illness(es). Therefore, we do not include any outpatient recovery time in our estimates. Using 2 days as the illness period, we calculated the lost QALYs per patient to be 0.00185 as:
Total QALYs Lost due to Morbidity
Given that lost QALYs per community-acquired CUTI case is 0.00296 and the total number of community-acquired CUTI cases that do not result in death in the US is around 448,000, we computed the total annual QALYs lost due to community-acquired CUTI morbidity to be 1,327 in the US. Similarly, the total annual QALYs lost due to hospital-acquired CUTI was computed as 1,106 (= 0.00185 × 597,675) per year. This yielded a total of 2,432 QALYs lost due to CUTI overall per annum.
Morbidity Cost
To calculate VSLY-based illness costs (for patients who do not die) we first calculated a weighted average WTP to avoid CUTI, which is equal to the VSLY weighted by CUTI incidence by age group in 2011. To approximate the age distribution of CUTI incidence, we calculated the age distribution from 2000 HCUP data on inpatient stays with a primary diagnosis of UTI (U.S. Department of Health and Human Services, Public Health Service, National Institutes of Health, National Institute of Diabetes and Digestive and Kidney Diseases, 2007). The resulting weighted average VSLY is roughly $325,000 which is then multiplied by the average lost QALYs per patient (0.00296 and 0.00185 for community-acquired and hospital-acquired, respectively) to arrive at $961 per community-acquired CUTI patient and $601 per hospital-acquired CUTI patient, for a weighted average of $758 per patient for a CUTI case. The total morbidity cost due to CUTI was then computed at $792.9 million (= $758 × 1,045,986) per annum.
3.6.5.6 HABP/VABP
Total Number of Cases that do not Result in Death
We obtained the number of cases per year from the literature on HABP/VABP. HABP is not a reportable illness, and diagnosis may be complicated due to overlap with other respiratory tract infections, especially for mechanically ventilated patients; therefore, determining incidence for HABP and VABP is difficult (American Thoracic Society; Infectious Diseases Society of America, 2005). However, many sources cite available data suggesting that these infections occur at a rate of 5 to 10 cases per 1,000 hospital admissions (American Thoracic Society; Infectious Diseases Society of America, 2005; McEachern & Campbell, 1998), or roughly 300,000 cases per year, as McEachern & Campbell (1998) report. To get a more up-to-date estimate, we applied this rate to the 36.1 million inpatient discharges in 2009 (from the National Hospital Discharge Survey), which yields a range of 180,500 to 361,000 HABP/VABP cases per year, with the midpoint of the range equal to 270,750.
According to a 2007 public health report (the same one used to estimate the number of hospital-acquired CUTI cases), there were 250,205 cases of healthcare-associated pneumonia in 2002 (Klevens, et al., 2007), which is equivalent to a rate of 87.0 per 100,000 population. Applied to the 2011 U.S. population, this rate results in an estimated 272,598 cases for the year 2011. Though the 2007 report is not specific with regard to the types of infections that are included, the estimate of 272,598 cases per year is very close to the midpoint of the range calculated above (270,750). It is also similar to the 300,000 figure reported by McEachern & Campbell (1998). Therefore, we determined that 272,598 was a reasonable point estimate of HABP/VABP cases in 2011. Subtracting the total number of deaths (81,779) from this estimate (see Section 3.6.6.6), results in 190,818 surviving HABP/VABP hospital patients.
QALYs Lost per Case
From the Tufts database, we found a QALY weight of 0.83 for VABP (Shorr, Susla, & Kollef, 2004), which we then adjusted by period of illness.
As HABP/VABP occur, by definition, in patients who are already hospitalized for other conditions, it is necessary to determine the length of time by which the episode of HABP or VABP extends the patient’s stay (as opposed to the entire length of stay due to all conditions from which the patient suffers). According to the literature, HABP/VABP lengthens the period of hospitalization by 7 to 10 days (McEachern & Campbell, 1998; Sampathkumar, 2009), so we use the midpoint of this range for the purposes of our calculations (8.5 days). Though there may be some outpatient recovery time following hospitalization for patients who have suffered from HABP/VABP, that information is not readily accessible in the literature, perhaps because it is so difficult to distinguish between recovery time for HABP/VABP and recovery time for the patient’s underlying illness(es). Therefore, we do not include any outpatient recovery time in our estimates. Using 8.5 days as the illness period, we calculated lost QALYs as:
Total QALYs Lost due to Morbidity
Given that lost QALYs per HABP/VABP case is 0.00396 and the total number of HABP/VABP cases that do not result in death in the US is around 191,000, we computed the total annual QALYs lost due to HABP/VABP morbidity to be 756 in the US.
Morbidity Cost
To calculate VSLY-based illness costs (for patients who do not die), we first selected an appropriate VSLY based on average patient age, as we do not have a breakdown of incidence by age group from the literature or other sources (as discussed above). The VSLY for people aged 55 to 62 is $290,150, which is then multiplied by the average lost QALYs per patient (0.00396) to arrive at $1,149 per patient. The total morbidity cost due to HABP/VABP was then computed at $219.2 million (= $1,149 × 190,818) per annum.
3.6.6 Mortality
3.6.6.1 Abom
As discussed previously, we assumed the annual number of deaths due to ABOM to be zero. Therefore, the VSL-based mortality costs were assumed to be null.3.6.6.2 Absssi
Total Number of Cases that Result in Death
We estimated the number of deaths attributable to ABSSSI to be 1,868 in 2008, or 0.61 per 100,000 population. Applying this rate to 2011 population estimates yields a total of 1,923 deaths attributed to ABSSSI in 2011.
QALYs Lost
To calculate lost QALYs for patients who die from skin infections, we used the Compressed Mortality File. Using the mortality rate and age breakdowns for 2008 from the Compressed Mortality File, we estimated the total number of deaths by age group for the year 2011. Life expectancies by age were available from the National Vital Statistics Report (NVSR). To illustrate the calculation, there were an estimated 497 deaths caused by an ABSSSI among Americans aged 75-84 in 2011. The life expectancy for an 80-year-old is 8.8 years; thus, each person who died from an ABSSSI at that age was assumed to have lost 8.8 years of life. After matching the Compressed Mortality File age cohorts to an appropriate age in the NVSR data (usually the age in the middle of the cohort), we calculated total QALYs lost by the 75-84 age cohort as 4,374 (8.8 × 483). Summing lost QALYs across all ages yielded a total of 26,167 QALYs lost due to ABSSSI deaths in 2011.
Mortality Cost
To calculate VSL-based mortality costs, we multiplied the number of deaths in each age group by the VSL for those age groups. For ABSSSI, this resulted in $10.8 billion in mortality costs. The average per-patient VSL, weighted by the number of deaths by age, is $5.62 million.
3.6.6.3 Cabp
Total Number of Cases that Result in Death
According to mortality data obtained from the NVSR, there were 50,774 deaths attributed to pneumonia in 2009; this is equal to a mortality rate of 16.5 per 100,000 population, which is equivalent to 51,683 deaths in 2011 (U.S. National Center for Health Statistics, 2010).
QALYs Lost
Similar to ABSSSI, we used the Compressed Mortality File and data on life expectancies by age available from the National Vital Statistics Report (NVSR). The 2009 deaths were broken down by age group in the NVSR, and we applied the same proportion of deaths by age group to the expected number of deaths in 2011. To illustrate the calculation, there were estimated to be 13,971 deaths caused by pneumonia among Americans aged 75-84 in 2011. The life expectancy for an 80-year-old is 8.8 years; therefore, total QALYs lost by the 75-84 age cohort is 122,945 (8.8 × 13,971). Summing lost QALYs across all ages yielded a total of 572,741 QALYs lost due to CABP deaths in 2011.
Mortality Cost
To calculate VSL-based mortality costs, we multiplied the number of deaths in each age group by the VSL for those age groups. For CABP, this resulted in $274 billion in mortality costs. The average per-patient VSL, weighted by the number of deaths by age, is $5.3 million.
3.6.6.4 Ciai
Total Number of Cases that Result in Death
Using the Compressed Mortality File, we estimated the number of deaths attributable to CIAI to be 14,136 in 2008, or 4.65 per 100,000 population. Applying this rate to 2011 population estimates yields a total of 14,554 deaths attributed to CIAI in 2011.
QALYs Lost
Using data available in the Compressed Mortality File and NSVR, we estimated the total number of deaths by age group for the year 2011. To illustrate the calculation, there were an estimated 3,982 deaths caused by a CIAI among Americans aged 75-84 in 2011. The life expectancy for an 80 year old is 8.8 years; therefore, total QALYs lost by the 75-84 age cohort is 35,042 (8.8 × 3,982). Summing lost QALYs across all ages yielded a total of 243,987 QALYs lost due to CIAI deaths in 2011.
Mortality Cost
To calculate VSL-based mortality costs, we multiplied the number of deaths in each age group by the VSL for that age group. For CIAI, this resulted in $31.6 billion in mortality costs. The average per-patient VSL, weighted by the number of deaths by age, is $5.59 million.
3.6.6.5 Cuti
Total Number of Cases that Result in Death
For CUTI, estimates of both mortality and potential long-term morbidity are problematic because they are confounded by the morbidity/mortality of underlying disease and/or injury. Our best source for mortality associated with community-acquired CUTI estimated an overall mortality rate of 13.7 percent, but then concluded that “only 15 [of 43] deaths were attributed directly to bacteremic urinary tract infection according to the criteria used in this study. Of these 15 deaths, 13 occurred among patients on medical services, all but 1 of whom had alcoholic liver disease, malignancy and/or chronic neurologic disease” (Bryan & Reynolds, 1984). For our calculations, we used a mortality rate of 4.8 percent (15 deaths out of 313 cases), although even this adjusted rate might be high.
In the public health report cited above in the calculation of projected healthcare-associated cases, Klevens et al. (2007) estimate that there were 13,088 deaths associated with healthcare-associated urinary tract infections in 2002, which is equivalent to a rate of 4.55 deaths per 100,000 population. In that study, the percentage of patients with a healthcare-associated UTI whose death was determined to be caused by or associated with the UTI from NNIS data was used to estimate the number of deaths. Applied to the 2011 U.S. population, this rate produces 14,259 deaths due to healthcare-associated pneumonia in 2011. Though the 2007 report is not specific with regard to the types of infections that are included (for instance, it may not be strictly limited to complicated UTIs), we used these figures in the absence of better data.
QALYs Lost
As was done for the other indications, we relied on data from the Compressed Mortality File (from Centers for Disease Control and Prevention, National Center for Health Statistics, available online from CDC WONDER) to approximate a breakdown of deaths by age. Specifically, we utilized a 2008 age distribution of deaths for individuals where the listed cause of death was “Urinary tract infection, site not specified.” This distribution is highly skewed; 92 percent of deaths due to UTIs are among individuals 65 years of age or older. We used this distribution to estimate the number of deaths by age category for 2011. To calculate lost QALYs, we multiplied the number of deaths due to CUTI (redistributed by age group by the breakdowns in the Compressed Mortality File) in each age category by the average years of life remaining for that age group. Life expectancies by age were available from the NVSR. Multiplying the number of deaths by these average life expectancies yields a total of 196,165 QALYs lost due to community-acquired CUTI deaths and 123,748 QALYs lost due to hospital-acquired UTI in 2011 for an overall total of 319,913 QALYs lost.
Mortality Cost
To calculate VSL-based mortality costs, we multiplied the number of deaths in each age group by the VSL for those age groups. For CUTI, this results in mortality costs of $112 billion and $71 billion for community-acquired and hospital-acquired CUTI, respectively, for an overall total of $183 billion. The average per-patient VSL, weighted by the number of deaths by age, is $4.95 million.
3.6.6.6 HABP/VABP
Total Number of Cases that Result in Death
Due to the nature of HABP/VABP, estimation of mortality was quite difficult. As mentioned above, incidence estimates are relatively unrefined because HABP is not a reportable illness, and accurate diagnosis can be complicated. Estimating mortality involves even greater uncertainty due to the fact that HABP occurs in patients who are already hospitalized for other serious conditions, making it difficult to determine whether deaths are due to the underlying illness or HABP/VABP. Accordingly, the mortality rates seen in the literature on HABP/VABP vary widely. As summarized in the 2005 American Thoracic Society/Infectious Diseases Society of America guidelines on hospital-acquired, ventilator-associated, and health care-associated pneumonia, “[t]he crude mortality rate for HAP may be as high as 30 to 70 percent, but many of these critically ill patients with HAP die of their underlying disease rather than pneumonia. The mortality related to HAP (or ‘attributable mortality’) has been estimated to be between 33 and 50 percent in several case-matching studies of VAP.”
In our review of the literature, we saw mortality rates ranging from about 14 percent (Klevens, et al., 2007) to 50 percent (Warren, et al., 2003) to 50 percent and have therefore selected 30 percent as a reasonable middle point among the varying estimates and the low end of the mortality rates reported by the American Thoracic Society/Infectious Diseases Society of America guidelines. Multiplying 30 percent by our estimated number of HABP/VABP cases in 2011, 272,598, results in an estimated 81,779 deaths in 2011.
QALYs Lost
Due to the difficulties associated with measuring mortality and HABP’s status as a non-reportable illness, we were unable to find a breakdown of deaths by age group. Therefore, to calculate years of life lost, we multiplied the number of deaths due to HABP/VABP by average years of life remaining for the age group including the average age of HABP/VABP patients. We estimated average age by taking the midpoint of the average patient ages reported in two studies, 61.7 (Rello, et al., 2002) and 58.3 (Kollef, et al., 2006), to get 60. Life expectancies by age are available from the NVSR. For a 60-year-old, there are estimated to be 22.6 years of life remaining; thus, each person who died from HABP/VABP is assumed to have lost 22.6 years of life. Multiplying the number of deaths (81,779) by this average life expectancy yields a total of 1,848,212 QALYs lost, due to HABP/VABP deaths in 2011.
Mortality Cost
To calculate VSL-based mortality costs, we multiplied the number of deaths in each age group by the VSL for those age groups; however, as mentioned above, the literature and available data resources did not provide a breakdown of deaths by age group for HABP/VABP. Therefore, it was necessary to use the VSL for a representative patient (based on average age, which is 60), and multiply that by the annual number of deaths. The VSL for people aged 55 to 62 is $4.77 million.
3.7 Social EPV Estimates by Indication
Figure 6 presents the estimated social EPVs by indication for a new antibacterial drug. Comparison of the social EPV values to private ENPV shows that the social EPV is significantly higher than private ENPV for all of the indications. Interestingly, HABP/VABP, the indication with the lowest private ENPV (-$4 million) has the highest estimated social EPV ($12.2 billion). CABP has the second highest social EPV ($9.4 billion) followed by CUTI ($6.1 billion). The indications yielding the lowest social EPVs are ABOM ($487 million) and ABSSSI ($584 million).
Similar to what was done for the private ENPV analysis, we assess the sensitivity of our social EPV results to model parameters and assumptions utilized by conducting a Monte Carlo analysis in which the point estimates reported in Table 15 were replaced by distribution of values (the probability distributions used and the applicable functional parameters are discussed in those sections applicable to the model parameter above). Table 18 and Figure 6 present the results of this sensitivity analysis. In the figure, as before, the error bars correspond to the 90 percent confidence bounds. As can be observed, there is wide variation in the estimated social EPV values across the different indications. The primary drivers for the observed wide range of social EPV results are attributable to the following model parameters in order of importance:
- Percentage change in disease duration for patients that do not respond to commonly used antibacterial drugs,
- Phase 1 clinical trial success probability,
- Pre-clinical R&D success probability, and
- Real annual social rate of discount.
Table 18: Social EPV Sensitivity Results (Figures are in $ Million)
| Indication | Social EPV | ||
|---|---|---|---|
| Min | Mean | Max | |
| ABOM | $48 | $486.6 | $5,363 |
| ABSSSI | $58 | $584.2 | $6,133 |
| CABP | $706 | $9,375.3 | $72,494 |
| CIAI | $114 | $1,069.2 | $10,231 |
| CUTI | $674 | $6,064.6 | $54,795 |
| HABP/VABP | $1,068 | $12,165.6 | $161,335 |
Figure 6: Sensitivity of Estimated Social ENPVs by Indication for a New Antibacterial Drug (in $ Million) - Error Bars Represent 90% Confidence Bounds
4 Vaccines
4.1 Background
From a public health standpoint, development of vaccines that effectively prevent illness caused by infectious agents is an attractive alternative or complement to developing drugs that treat those diseases, as it may reduce the need for consumption of antibacterial drugs and thus slow the development of antibacterial drug resistance. Vaccines for highly contagious diseases such as smallpox, polio, and measles have been used for many years, essentially eradicating those diseases in the United States and many other parts of the world. Vaccines developed more recently include a pneumococcal conjugate vaccine for children as well as a meningococcal vaccine. This section summarizes the key demand- and supply-side challenges associated with the development of new vaccines.
4.1.1 Demand-side Challenges
It is traditionally argued that the existence and use of vaccines creates a positive externality, meaning that vaccination not only prevents the inoculated individuals from getting sick; it also reduces the likelihood that any non-vaccinated individuals around them will get sick.15 While this is a beneficial characteristic of vaccination, it also creates two unfortunate side effects. First, individuals may have an incentive to “free ride”; in other words, they may count on their neighbors getting vaccinated to decrease their chances of getting sick rather than getting vaccinated themselves. Second, a private decision-maker considering whether or not to consume or produce a vaccine will likely only consider the private (personal) costs and benefits of vaccination rather than taking this broader social benefit into account. As a result, society as a whole will tend to under-consume vaccines.
At the individual consumer level, people have proven largely unwilling to pay for higher priced vaccines out-of-pocket. This may be due in part to a failure among consumers to recognize the value of a vaccine in preventing periods of suffering and lost productivity due to infectious illness (Kaper, Rappuoli, & Buckley, 2005). Instead of paying to avoid an uncertain event, people may prefer to take their chances and bear the costs of treatment if and when they become sick. Additionally, many doctors and consumers believe, based on past experience with childhood vaccines, that vaccination should be cheap, which is not often the case with newer products (Kaper, Rappuoli, & Buckley, 2005). Lack of insurance coverage for vaccination is also problematic; for example, those for whom vaccination is not covered by private insurance would have to pay over $240 for the recommended four doses of pneumococcal conjugate vaccine, a sum that exceeds many people’s willingness to pay for illness avoidance (Sloan, Berman, Rosenbaum, Chalk, & Griffin, 2004). Insurance reimbursement has been key to the market success of the latest generation of higher-priced vaccines.
Under requirements of the Affordable Care Act of 2010, insurers will pay for vaccines recommended by the Advisory Committee on Immunization Practices (ACIP). Producers of newer vaccines may face demand-related challenges and manufacturers of vaccines are more likely to cease production if their vaccines are not recommended by ACIP. In addition, sales potential for specialized vaccines such as those for anthrax, cholera, rabies, and plague can be quite limited (Scherer, 2004).16 For instance, production of the vaccine for Lyme disease was discontinued when the market proved to be significantly smaller than the manufacturer originally estimated (Kaper, Rappuoli, & Buckley, 2005). For other important vaccines, the market is sizable (e.g., roughly $700 million in U.S. sales for influenza) (Scherer, 2004); however, the longer the period over which a vaccine is effective, the smaller the demand (Danzon, Pereira, & Tejwani, 2005). Furthermore, in comparison to other product lines that vaccines may compete against within a company—particularly drugs taken daily by patients with chronic illnesses such as high cholesterol or high blood pressure—low profit margins and high financial risk often render vaccine development an unattractive option (Layton & Lenfestey, 2005).
15 By contrast, antibiotic resistance is a negative externality; individual consumption of antibiotics contributes to the development of resistant strains and reduces the drugs’ effectiveness for society as a whole.
16 It should be noted that the recent successful vaccine introductions, such as the HPV vaccine, could overturn this conventional wisdom from the previous 30 years.
4.1.2 Supply-side Challenges
There are certain key differences between the processes of developing and manufacturing a vaccine and producing a new drug that serve as additional barriers to vaccine development. For one thing, vaccines are generally derived from living pathogenic organisms which are more complex in terms of their molecular structures and the processes needed to control and produce them than the components of other pharmaceutical products (Layton & Lenfestey, 2005; Scherer, 2004).
Furthermore, unlike with drugs, vaccine trials and development of production facilities take place simultaneously, as production facilities must be up and running prior to licensure (Honeycutt, Robinson, & Layton, 2005). This requirement has major implications on the start-up costs for manufacturing a vaccine, as the processes of building a plant, honing manufacturing techniques, and training staff can cost as much as $300 to $400 million (Murphy, 2002), depending on the production technology required.
As one might expect given differences such as these in the processes and complexity involved in developing a vaccine versus a new drug, disparities between biopharmaceutical and pharmaceutical products have also been reported in development times, costs, and phase transition probabilities. While biopharmaceutical products such as vaccines may have slightly higher transition probabilities for some clinical phases than drugs, DiMasi & Grabowski (2006) find that costs per clinical phase may be significantly higher for biopharmaceutical products, depending on how costs are measured and compared. With regard to phase length, a chart included in DiMasi & Grabowski (2006) (reproduced in Figure 7 below) shows that total time to market is longer for vaccines, a finding reflected in the parameters chosen for our model (as discussed below).
Figure 7: Clinical and Development and Regulatory Approval Times by Product Type
Source: DiMasi & Grabowski, 2006
4.2 Vaccine Private ENPV Model Parameters and Assumptions
For the purposes of modeling the decision-making process and expected returns for a vaccine producer, we chose to model a theoretical new vaccine effective in preventing acute bacterial otitis media (ABOM). ABOM was chosen because otitis media is an infectious disease for which efforts to develop a preventive vaccine are already underway; therefore, we were able to find published studies including data specific to this indication that could be used in our modeling.17 The obtained results should be interpreted in the context of this indication and cannot be extended to other areas.
Table 19 presents the point estimates for the private ENPV model parameters and assumptions for vaccines. The following sections discuss the basis for these estimates in further detail.
17 See, e.g., O'Brien, et al., 2009.
4.2.1 Real Opportunity Cost of Capital
The real opportunity cost of capital represents the rate of return (net of inflation) that the vaccine developer would otherwise be able to earn at the same risk level as the investment in the new vaccine that has been selected. The cost of capital we use in the model is based on information gathered during interviews with industry experts. While vaccines are biopharmaceutical products, they are often developed and manufactured by divisions of big pharmaceutical companies. Thus, even though the experts interviewed reported that biopharmaceutical companies use rates ranging from 18 to 24 percent, we selected the 11 percent rate deemed appropriate for pharmaceutical developers as was done for the analysis of antibacterial drugs in Section 3.2.1 above.
Table 19: Private ENPV Model Parameters and Assumptions (Point Estimates) for Vaccines
| Parameter | Point Estimate |
|---|---|
| Real Opportunity Cost of Capital | 11.0% |
| Pre-clinical R&D Time (in Years) | 4.3 |
| Pre-clinical R&D Cost | $73,901,395 |
| Pre-clinical R&D Success Probability | 57.0% |
| Sample Preparation for Animal/Human Studies | $2,676,066 |
| Phase 1 Clinical Trial Time (in Years) | 1.6 |
| Phase 1 Clinical Trial Cost | $39,838,628 |
| Phase 1 Clinical Trial Success Probability | 72.0% |
| Phase 2 Clinical Trial Time (in Years) | 2.4 |
| Phase 2 Clinical Trial Cost | $46,515,424 |
| Phase 2 Clinical Trial Success Probability | 79.0% |
| Process Research/Development/Design | $26,760,658 |
| Phase 3 Clinical Trial Time (in Years) | 2.7 |
| Phase 3 Clinical Trial Cost | $118,590,265 |
| Phase 3 Clinical Trial Success Probability | 71.0% |
| Plant Design | $13,380,329 |
| FDA Biologics License Application (BLA) Review Time (in Years) | 1.3 |
| BLA Submission to Launch Cost | $1,958,800 |
| BLA Success Probability | 96.0% |
| Plant Build | $508,485,294 |
| Total Time to Market (in Years) | 12.48 |
| Total Cost of Development | $1,413,891,197 |
| Time to Generic Entry upon FDA Approval (in Years) | 12 |
| % Reduction in Revenues due to Generic Competition | 0.0% |
| Total Product Life (in Years) | 20 |
| Average Expected Price per Dose | $63 |
| Number of Doses | 4 |
| Product Launch Success Probability | 60% |
Because this parameter value heavily influences private ENPV outcomes, we assign a triangular probability distribution with a lower limit of nine percent, an upper limit of 24 percent, and a likely point estimate of 11 percent for sensitivity analysis purposes.
4.2.2 Pre-Clinical, Clinical Phase, and BLA Submission Costs
We estimated per-phase costs for vaccine development using out-of-pocket pre-clinical and clinical period costs per investigational biopharmaceutical compound from DiMasi & Grabowski (2006). These estimates were given in 2005 dollars; therefore, we inflated them using a consumer price index for medical care from BLS. This resulted in cost totals of $73.9 million, $39.8 million, $46.5 million, and $118.6 million for the pre-clinical phase, Phase 1 trials, Phase 2 trials, and Phase 3 trials, respectively.
The reported new drug application fee for those drug or biologic product applications requiring clinical data is $1,958,800 for fiscal year 2013. Thus, we use this figure as the BLA submission cost in the model as we did for antibacterial drug products.
4.2.3 Pre-Clinical, Clinical, and BLA Submission Phase Durations
As with drugs, private ENPV for vaccine development is dependent on the duration of each phase and the distribution of out-of-pocket costs throughout each phase. To estimate the lengths of these phases, we consulted DiMasi & Grabowski (2006), in which phase lengths of 52.0, 19.5, 29.3, and 32.9 months are reported for the pre-clinical phase, Phase 1, Phase 2, and Phase 3, respectively. The regulatory review period is estimated by the authors to last 16 months (for a total time-to-market of 12.5 years). These phase lengths, applicable to biopharmaceutical compounds, translate to point estimates with the following bounds (in years):
- Pre-clinical: Lower bound of 3.5, upper bound of 5.2, point estimate of 4.3 years,
- Phase 1: Lower bound of 1.3, upper bound of 2.0, point estimate of 1.6 years,
- Phase 2: Lower bound of 2.0, upper bound of 2.9, point estimate of 2.4 years,
- Phase 3: Lower bound of 2.2, upper bound of 3.3, point estimate of 2.7 years, and
- Regulatory Review: Lower bound of 1.1, upper bound of 1.6, point estimate of 1.3 years.
4.2.4 Pre-clinical, Clinical, BLA Submission Success Probabilities
Success probabilities (phase transition probabilities) applicable to vaccines were found in Struck, 1996. These were used as likely point estimates in the model, bounded as follows:
- Pre-clinical: Lower bound of 27.0 percent, upper bound of 77.0 percent, likely point estimate of 57.0 percent,
- Phase 1: Lower bound of 52.0 percent, upper bound of 92.0 percent, likely point estimate of 72.0 percent,
- Phase 2: Lower bound of 59.0 percent, upper bound of 99.0 percent, likely point estimate of 79.0 percent,
- Phase 3: Lower bound of 51.0 percent, upper bound of 91.0 percent, likely point estimate of 71.0 percent, and
- BLA Approval: Lower bound of 76.0 percent, upper bound of 99.0 percent, likely point estimate of 96.0 percent.
4.2.5 Costs of Supply Chain Activities
Vaccine developers, like drug sponsors, need to undertake a variety of additional activities concurrently with clinical development, including sample preparation, process research, process development, process design, and plant design and construction. These activities are discussed in greater detail in Section 4.2.5, and Table 9 in Section 4.2.5 presents the cost estimates for each of these supply chain activities as available from Blau et al. (2004). We use the same figures for vaccines as were used for new drugs, with the exception of plant build costs. For this parameter, we used a vaccine-specific cost estimate found in Murphy (2002) and inflated to 2012 dollars to arrive at a total of approximately $500 million. This is substantially higher than the plant build cost used for development of a new antibacterial drug and reflects the unique challenges of vaccine manufacturing. As vaccines are complex products that are created from living organisms and are mainly given to healthy people (making any side effects highly undesirable), vaccine development involves processes and regulatory requirements that are different from those for drugs intended for use by sick people; therefore, construction of special facilities is a necessity in most cases (Murphy, 2002).
4.2.6 Total Product Life
As for drugs, we use 20 years to characterize the average life cycle of a new vaccine upon market approval (DiMasi, Grabowski, & Vernon, 2004). Though the span of time over which a vaccine is used may extend beyond this 20-year period, expected revenues from sales in years beyond 20 contribute very little to private ENPV due to discounting, and the model allows the user to vary this parameter for what-if scenario analysis if needed.
It should be noted that the threat of generic competition which we took into consideration for new drug products is virtually nonexistent for vaccines in the United States. Barriers to generic entry include the lack of an abbreviated application process for biologics such as exists for generic drugs (thus generic entrants would have to undergo the same costly steps of demonstrating safety and efficacy as a vaccine originator would), small markets, and the proprietary nature of some vaccine strains. However, vaccine products may still be superseded in the market by newer, more effective products (Danzon, Pereira, & Tejwani, 2005).
4.2.7 Product Launch Success Probability
According to Griffin (1997), only about 60 percent of new product launches end up being commercially successful. As we did for antibacterial drugs, we use this as our basis for new vaccines. For sensitivity analysis, we use a triangular distribution for the product success probability with a lower bound of 40 percent and an upper bound of 80 percent.
4.2.8 Average Expected Price per Dose and Number of Doses
Before calculating the expected revenues that would be earned by the manufacturer of a new ABOM vaccine, we first estimated the total number of doses that would be required per patient and the average expected price per dose. These were then multiplied by the projected portion of the population that would use the vaccine over the next 20 years (total product life). Consistent with the assumptions made in O’Brien, et al. (2009), in which the authors estimated the projected benefits and cost-effectiveness of new vaccines for otitis media that were being developed, we chose to assume that its theoretical new vaccine would require four doses. To estimate an average price per dose, we consulted the most recent Vaccine Price List, available on the Centers for Disease Control and Prevention (CDC) website, and took the average of the minimum and maximum prices reported in the pediatric vaccine list ($9 and $116, respectively) to get an estimated price of $63.
4.3 Private ENPV Results
We found that the private ENPV for a new ABOM vaccine is $515.1 million. This is positive, indicating that the expected returns from developing such a vaccine are greater than the development costs. It is also worth noting that the private ENPV for developing a new ABOM vaccine are much higher than the private ENPV for developing a new antibacterial drug for ABOM, which was shown in Section 3.3 to be -$3.0 million. Because the private ENPV estimated ($515.1 million) exceeds the threshold value of $100 million, we did not conduct a threshold analysis of different types of incentives for the ABOM vaccine. It should be noted that the private ENPV could have been lower than $100 million had we selected another indication to model, indicating the desirability of market incentives. Therefore, the results presented here are limited to vaccines for ABOM and should not be viewed as representative of all types of vaccines.
Similar to the antibacterial drug analysis, we assessed the sensitivity of our results to our model parameters and assumptions by conducting a Monte Carlo analysis in each the point estimates were replaced by distribution of values (the probability distributions used and the applicable functional parameters are discussed in those sections applicable to the model parameter above). This results in a large private ENPV range of -$63.7 million to $1.479 billion. The primary drivers for the observed wide range of results are attributable to the following model parameters in order of importance:
- Average expected price per dose,
- Real opportunity cost of capital,
- Pre-clinical R&D success probability,
- Clinical phase success probabilities, and
- Total time to market.
As described above with relation to antibacterial drugs, we did not model changes in reimbursement as a variable parameter.
4.4 Social EPV Model Parameters and Assumptions
The framework we used to assess social benefits for a new ABOM vaccine is the same as that used for antibacterial drugs and described earlier in this report. We use the same values for the real annual social discount rate, VSL, and VSLY as in the antibacterial drugs model. Table 20 presents the point estimates for the social EPV model parameters and assumptions. The following sections discuss the basis for these estimates in further detail.
4.4.1 Expected Effectiveness of Vaccine
The expected effectiveness of the vaccine is used to determine how many cases of ABOM might be avoided as a result of the new vaccine being available, a component of social benefit. To estimate the effectiveness of a new ABOM vaccine, we used the midpoint of the range of 1 to 50 percent (25.5 percent) given by O’Brien, et al. (2009), which is specific to vaccines for otitis media. We then multiply 25.5 percent by the number of children aged 0 to 5 expected to receive the vaccination over the product’s total life to estimate the number of ABOM cases which would be prevented by the vaccine. This yields a range of approximately 700,000 cases prevented in the first year the vaccine is used to up to 2.7 million cases in subsequent years, taking into account the anticipated growth rate in this segment of the population as well as changes in the predicted vaccine adoption rate over this time period. For reference, we estimate that the baseline case counts over this time period range from 6.7 million to 8.3 million.
Table 20: Social EPV Model Parameters and Assumptions for a New ABOM Vaccine
| Parameter | Point Estimate |
|---|---|
| Real Annual Social Rate of Discount | 3% |
| Expected Effectiveness of Vaccine | 25.5% |
| 2000 Real Personal Income Per Capita in 2005 $ | $28,888 |
| 2012 Real Personal Income Per Capita in 2005 $ | $32,635 |
| Real GDP Growth, 2000 – 2011 | 13.0% |
| Income Elasticity of VSL | 50.0% |
| VSLY Inflator | 1.065 |
| VSL in 2000 $ for 0 - <5 yr olds | $3,740,000 |
| VSL in 2000 $ Adjusted for Income for 0 - <5-Yr Olds | $3,982,554 |
| VSL in 2012 $ Adjusted for Income for 0 - <5-Yr Olds | $5,309,933 |
| Life Expectancy for an Average 3-Year Old | 75 |
| VSLY in 2012 $ Adjusted for Income for 0 - <5-Yr Olds | $178,775 |
| Average Number of Lost QALYs for Patients with ABOM | 0.0049266 |
| WTP (VSLY*Lost QALYs) Per Patient | $881
|
4.4.2 Average Number of Lost QALYs for Patients with ABOM
The method by which the average number of lost QALYs due to ABOM was calculated is described in detail in Section 3.6.5.1.
4.4.3 Per-Patient Willingness to Pay
Willingness to pay to avoid illness is calculated as the product of VSLY ($178,775) and the number of lost QALYs per patient (0.00493), which equals $881.
4.5 Social EPV Results
We estimated the social EPV for a new ABOM vaccine to be $2.281 billion. Comparison of the social EPV value to private ENPV shows that the social EPV is substantially higher than the private ENPV by $2.213 billion. When a Monte Carlo analysis was conducted to gauge the sensitivity of our results to changes in model parameters and assumptions, we find that the social EPV could potentially range from $148.0 million to $7.742 billion. The primary drivers for the observed wide range of social EPV results include 1) expected effectiveness of vaccine, 2) real annual social rate of discount, 3) pre-clinical R&D success probability, and 4) clinical phase success probabilities.
5 Rapid Point-of-Care (POC) Diagnostics
There is a need for specific and inexpensive rapid point of care (POC) diagnostic tests that can be used for clinical management of infectious diseases. Diagnostics are important as they allow tailoring treatment with antibacterial drugs, reducing unnecessary antibacterial drug use and thereby delaying the development of antibacterial resistance. However, the tools need to be readily available at point-of-care and cost-effective, such as the rapid strep test. Additionally, the tools that work best are technologies that can be used across the entire patient population. Given the potential complexity of some of these tests, there also needs to an educational component so healthcare practitioners know how to use the tests and be able to interpret the test results.
At present, it takes about 3 days (and sometimes a week) to identify organisms. If such tests could be done more expeditiously, physicians can institute a narrower antibacterial drug therapy relieving the pressure in terms of selecting resistant organisms (by using antibacterial drugs that are ineffective against the organism, one starts selecting out mutants that are more resistant and become more resistant over time).
The different types of rapid POC diagnostic tools for bacterial diseases currently available in the market may be imperfect; they may be costly, not particularly fast, or otherwise limited in scope. Some of these diagnostics include:
- PNA FISH test – The test is done on a positive blood culture and reportedly returns results in 24-36 hours. Additionally, laboratories reportedly have found it difficult to incorporate this test into their workflow.
- BioFire Diagnostics FilmArray® System – This molecular assay can identify 17 viruses and 4 bacteria within an hour, but currently costs around $300 (although price will likely go down in the future).
- Procalcitonin (PCT) – This is a test used in some hospitals to diagnose sepsis or to rule it out. However, because the test does not reveal whether the infection is multi-drug resistant, it is not widely adopted.
One of the challenges that relate to the use of rapid POC diagnostics is the existence of a range of organisms residing on the body without causing infections, which makes it difficult to pinpoint which bacteria are actually causing the infection. By adjusting the cut-off result in molecular assays to distinguish colonized from organisms actually causing the signs and symptoms of infection, this issue has been partially mitigated. However, this factor may impact the acceptance of rapid POC diagnostics by healthcare providers.
5.1 Rapid POC Diagnostic Private ENPV Model Parameters and Assumptions
For the purposes of modeling the decision-making process and expected returns for a rapid point-of-care diagnostic producer, we selected a new rapid point-of-care diagnostic designed to identify methicillin-resistant Staphylococcus aureus (MRSA) that can cause serious infections, such as skin or wound infections, pneumonia, or infections of the blood. While community acquired MRSA is on the rise, in this analysis, we focused primarily on healthcare–associated MRSA infections, which occur in hospitals and nursing homes. The selection of MRSA is based on the fact that there are 1) diagnostic tests on the market and under development for the infection and 2) published studies with MRSA-specific quantitative information that can be used in our modeling.
Table 21 presents the point estimates for the private ENPV model parameters and assumptions for the rapid point-of-care diagnostics for bacterial infectious disease. The following sections discuss the basis for these estimates in further detail.
Table 21: Private ENPV Model Parameters and Assumptions for a Rapid POC Diagnostic for MRSA
| Parameter | Point Estimate |
|---|---|
| Real Opportunity Cost of Capital | 11.0% |
| R&D Time (in Years) | 2.0 |
| R&D Cost | $1,397,000 |
| R&D Success Probability | 33% |
| Clinical Trial Time (in Years) | 2.0 |
| Clinical Trial Cost | $2,000,000 |
| Clinical Trial Success Probability | 80.0% |
| FDA 510(k) Application Review Time (in Years) | 0.4 |
| FDA 510(k) Application Review Cost | $124,960 |
| FDA 510(k) Application Success Probability | 96.0% |
| Supply Chain Activity Costs | $9,861,488 |
| Time to generic entry upon FDA Approval (in Years) | 3 |
| % Reduction in Revenues due to Competition | 50.0% |
| Total Product Life (in Years) | 20 |
| Average Expected Price per Test | $76 |
| Product launch success probability | 60% |
| Expected Market Share at Peak-Year Sales | 24% |
5.1.1 Real Opportunity Cost of Capital
As previously discussed (see Sections 3.2.1 and 4.2.1), the real opportunity cost of capital represents the rate of return (net of inflation) that a developer would otherwise be able to earn at the same risk level as the investment in the new rapid POC diagnostic that has been selected. Based on discussions with industry experts and published studies, we use an 11 percent cost of capital in the model. Similar to the antibacterial and vaccine analyses, because this parameter value heavily influences private ENPV outcomes, we assign a triangular probability distribution with a lower limit of 9 percent, an upper limit of 24 percent, and a likely point estimate of 11 percent for sensitivity analysis purposes.
5.1.2 R&D Costs
R&D costs for a new rapid POC diagnostic are variable based on whether the diagnostic would require the development of a new platform (i.e., instrumentation) along with the test. Other factors also influence R&D costs, such as the existence of a predicate device. Given that there currently are FDA-approved MRSA tests in the market, we assume that the new rapid POC diagnostic for detecting MRSA colonization will likely have a predicate device which will allow the manufacturer to pursue FDA clearance through the 510(k) route.
While the precise sequence of the steps may vary from case to case, the R&D costs associated with bringing a device to market generally include: development of engineering drawings, definition of the final materials list, device bench testing, development of design controls as well as costs related to market research to establish that a clinical need and a market for a new device, or a new version of a device, exists. Table 22 presents estimates for the different R&D cost components. Based on Table 22, we estimate the total R&D cost for a rapid POC diagnostic for MRSA at $1.4 million. For sensitivity analysis, we assume that the R&D costs follow a triangular distribution with a lower bound of $1.0 million and an upper bound of $2.0 million, with a likely point estimate of $1.4 million.
Table 22: R&D Costs for a New Rapid POC Diagnostic Requiring a 510(k) Approval
| R&D Component | Cost ($) |
|---|---|
| Total | $1,397,000 |
| Exploratory research – engineering drawings, final material list, and bench testing | $1,000,000 |
| Identification of Predicate Devices | $15,000 |
| Development of Design Controls | $200,000 |
| Development of SOPs | $30,000 |
| Development of a Risk Management System | $30,000 |
| Holding a pre-Submission Meeting with FDA | $2,000 |
| Preparation of Indications for Use | $20,000 |
| Validation of Device Sterility | $75,000 |
| Investigational Device Exemption (IDE) Approval [a] | $25,000 |
Source: Eastern Research Group, Inc., 2012
[a] This cost component may not be applicable to a POC diagnostic for MRSA.
5.1.3 Clinical Research Costs
Depending upon the characteristics of the diagnostic, manufacturers might be required to perform one or more clinical trials, to obtain data for a 510(k) and data to obtain a CLIA Waiver for POC use. While only a small fraction of 510(k) devices perform any clinical trials, most of the FDA-approved rapid diagnostics for bacterial diseases have conducted clinical trials in support of their 510(k) applications. Thus, we assume that the manufacturer of a new MRSA rapid POC diagnostic will need to conduct a pivotal clinical trial to demonstrate substantial equivalence to a predicate device. Based on discussions with industry experts and ERG’s research, the pivotal trial costs could range from a low of $250,000 to as high as $4.0 million for some diagnostics that require 3,000 – 4,000 patients and collection of multiple specimens and inclusion of symptomatic as well as asymptomatic patients. Given the wide range, we use a point estimate of $2.0 million for conducting pivotal trials for a rapid POC diagnostic for MRSA. It should be noted that the estimate may overstate the clinical research costs given information provided in some of the recent 510(k) submissions for a MRSA rapid POC diagnostic test (U.S. Food and Drug Administration, 2007). Similar to the other parameters, we assume that the clinical research costs follow a triangular distribution with a lower bound of $250,000 and an upper bound of $4.0 million.
5.1.4 FDA 510(k) Submission Costs
Upon completion of clinical research, the manufacturer of the new diagnostic needs to prepare the labeling for the product and submit it to FDA. We estimate this effort at $20,000 for a new rapid POC diagnostic manufacturer. Additionally, under the Medical Device User Fee Act (MDUFA), device sponsors must pay a fee for entering the FDA review process. The 2013 FDA fee for 510(k) submissions is $4,960. Lower fees apply for small businesses. The costs for preparing this regulatory submission (i.e., 510(k) clearance package) could be highly variable depending on device characteristics. We estimate this cost at $100,000 based on ERG’s previous research (Eastern Research Group, Inc., 2012). Combined, the costs for submitting a 510(k) application to FDA with clinical data are estimated at $124,960.
5.1.5 Phase Durations
There are no published studies that provide estimates of time to market for rapid POC diagnostics. Based on discussions with industry experts, the time it takes to bring a new rapid POC diagnostic to market could range from 2 to 3 years if the diagnostic does not require the development of a new platform to around 5 years if a new platform is necessary along with the test. For the model, we assume that it takes 4 years to get to the point of submitting a 510(k) application to FDA, with 2 years spent on R&D and the remaining two years on clinical research. Further, we estimate that it takes 143 days (i.e., 0.39 year) for a complete review of the submitted application based on FDA data (U.S. Food and Drug Administration, 2012).
5.1.6 Phase Success Probabilities
While unable to provide quantitative estimates of success probabilities, industry experts interviewed for the study indicated that by the time a device reaches the clinical stage, it has a very high chance of success in making it to market. Experts also noted that most failures tend to occur at the early research and development phase. Based on this input, we assume success probabilities of 33 percent, 80 percent, and 96 percent for the R&D, clinical, and FDA application stages, respectively, in the analysis. We further assume that each of these parameters follows a triangular distribution with the following bounds:
- R&D phase success probability: Lower bound of 25 percent, upper bound of 50 percent, likely point estimate of 33 percent,
- Clinical phase success probability: Lower bound of 70 percent, upper bound of 90 percent, likely point estimate of 80 percent, and
- FDA 510(k) application approval success: Lower bound of 90 percent, upper bound of 99 percent, likely point estimate of 96 percent.
5.1.7 Costs of Supply Chain Activities
Rapid POC diagnostic developers, like drug and vaccine sponsors, need to undertake a variety of additional activities concurrently with clinical development, including manufacturing a sample of devices using validated processes for use in clinical trials and other demonstrations and acquisition of GMP-compliant capabilities.18 For antibacterial drugs, the ratio of supply chain activity costs to the sum of pre-clinical, clinical, and post-clinical research is 2.8. In the absence of published figures for rapid POC diagnostic manufacturer supply chain activity costs, we estimate the costs of these activities at $9.9 million by applying the same ratio to total estimated rapid POC diagnostic development costs of $3.5 million (i.e., sum of R&D, clinical research, and FDA approval costs). We further assume that these costs are evenly distributed across the average 4.39 years it takes to bring a device to market in the model.
18 Along with the manufacturing SOPs, device sponsors must develop a manufacturing system capable of producing their device according to their SOPs in a rigorous and consistent fashion. Sponsors who are new to manufacturing might acquire this manufacturing capability from contract manufacturers, thereby avoiding the risk of a substantial capital investment in the, as yet, un-marketed product. Contract manufacturers of medical devices are familiar with the relevant GMP requirements and are able to charge higher manufacturing prices as a result. Manufacturers who have previously introduced medical devices to market successfully are likely to have developed their own good manufacturing capability (Eastern Research Group, Inc., 2012).
5.1.8 Total Product Life
As for drugs and vaccines, we use 20 years to characterize the average life cycle of a new rapid POC diagnostic upon market approval (DiMasi, Grabowski, & Vernon, 2004). Though the span of time over which a rapid POC diagnostic is used may extend beyond this 20-year period, expected revenues from sales in years beyond 20 contribute very little to private ENPV due to discounting.
5.1.9 Product Launch Success Probability
According to Griffin (1997), only about 60 percent of new product launches end up being commercially successful. As we did for antibacterial drugs and vaccines previously, we use this as our basis for new rapid POC diagnostics. For sensitivity analysis, we use a triangular distribution for the product success probability with a lower bound of 40 percent and an upper bound of 80 percent.
5.1.10 Average Expected Price per Patient
As noted previously, there are a number of diagnostics for MRSA that are currently in the U.S. market. To estimate the average expected price per patient, we used the reported per-patient test costs under Cepheid’s Federal Supply Schedule agreement with the Department of Veteran Affairs. Under that schedule, the per-patient-test cost for Cepheid’s Xpert MRSA assay ranges from $71.02 to $81.62 when their 3-year pricing option is used (Cepheid, 2008). Thus, we estimate that the new rapid POC diagnostic will cost $76 per patient per test. For sensitivity analysis, we use a triangular distribution for the average per-patient price with a lower bound of $70 and an upper bound of $85.
5.1.11 Market Uptake
Given the competitive landscape for rapid POC diagnostics for MRSA, we assume that the U.S. market share of the new entrant will range from 15 to 30 percent at peak-year sales with an expected market share of 24 percent given that the product launch success probability is estimated at 60 percent (= 60% × 30% + [(1 – 60%) × 15%) (see Section 3.2.12).
According to projections, the rapid POC diagnostic market for infectious diseases is expected to grow an average of 16 percent per year (Ben-Haim, 2008). Assuming that expected first year market share is 6 percent, Table 23 presents the annual market share estimates for the new rapid POC diagnostic used in the model.
Table 23: Estimates of Market Share over Time for a New Rapid POC Diagnostic for MRSA
| Year | Market Share | ||
|---|---|---|---|
| Lower Bound | Upper Bound | Expected | |
| 1 | 4% | 8% | 6% |
| 2 | 5% | 9% | 7% |
| 3 | 5% | 11% | 9% |
| 4 | 6% | 12% | 10% |
| 5 | 7% | 14% | 12% |
| 6 | 8% | 17% | 13% |
| 7 | 10% | 19% | 16% |
| 8 | 11% | 23% | 18% |
| 9 | 13% | 26% | 21% |
| 10 | 15% | 30% | 24% |
Note: The expected market share in years beyond 10 is capped at 24%.
5.1.12 Expected Percentage Reduction in Revenues due to Increased Competition
The market for rapid POC diagnostics is competitive, especially for those infectious diseases that have the potential to impact sizeable populations, such as influenza and Group A Streptococcus. MRSA is one such market as there are many different strains of MRSA affecting a large number of individuals in many different healthcare settings at present (Collier, 2004).
Unlike antibacterial drugs, rapid POC diagnostics do not have marketing exclusivity protections that would prevent other device manufacturers from market entry for a specified time period. Thus, we assume that other manufacturers of rapid POC diagnostics for MRSA will enter the market over time reducing revenues to the developer. According to research by ECRI (2008), FDA provided GeneOhm Sciences with 510(k) marketing clearance for their IDI-MRSA Assay (also known as the BD GeneOhm MRSA Assay) in March 2004. Approximately 3 years later, FDA provided Cepheid Inc. with 510(k) clearance for their Xpert MRSA Assay (ECRI Institute, 2008). Thus, for the model, we estimate the average time for experiencing a reduction in market share for a rapid POC diagnostic manufacturer at 3 years. Similar to antibacterial drugs, we further estimate reduction in revenues due to increased competition at 50 percent.
5.1.13 Private ENPV Results
Based on the above model parameters and assumptions, the private ENPV for a new MRSA rapid POC diagnostic manufacturer is $329 million. The positive ENPV indicates that the expected returns from developing such a diagnostic are greater than its development costs. The robust pipeline for MRSA rapid POC diagnostics in the U.S. lends support to the estimated sizable returns (see ECRI Institute’s study for a list of rapid test’s for MRSA under development in the U.S.). However, while positive expected returns might be true for the MRSA diagnostic market, the diagnostics market for other pathogens of concern such as fungal infections caused by for example Aspergillus may not yield a sufficiently high private ENPV to encourage development.
Similar to the antibacterial drug and vaccine analyses, we assessed the sensitivity of our results to our model parameters and assumptions by conducting a Monte Carlo analysis for which the point estimates were replaced by distribution of values (the probability distributions used and the applicable functional parameters are discussed in those sections applicable to the model parameter above). This results in a large private ENPV range of $53.3 million to $435.4 million. The primary drivers for the observed wide range of results are attributable to the following model parameters in order of importance:
- Real opportunity cost of capital,
- R&D and clinical stage success probabilities,
- Product launch success probability, and
- Average expected price per test.
Given that the average private ENPV is sizable for a manufacturer of a rapid POC diagnostic for MRSA, production incentives are not essential in this case.
5.2 Rapid POC Diagnostic Social EPV Model Parameters and Assumptions
The framework used to assess social benefits for a new MRSA rapid POC diagnostic is the same as that used for antibacterial drugs and vaccines as described earlier in this report. We use the same values for the real annual social discount rate, VSL, and VSLY as in the antibacterial drugs model. Table 24 presents the point estimates for the social EPV model parameters and assumptions. The following sections discuss the basis for these estimates in further detail.
Table 24: Social EPV Model Parameters and Assumptions for a MRSA Rapid POC Diagnostic
| Parameter | Point Estimate |
|---|---|
| Real Annual Social Rate of Discount | 3.0% |
| 2000 Real Personal Income per capita in 2005 $ | $28,888 |
| 2012 Real Personal Income per capita in 2005 $ | $32,635 |
| Real GDP Growth, 2000 – 2011 | 13.0% |
| Income Elasticity of VSL | 50.0% |
| VSLY Inflator | 1.065 |
| VSL in 2012 $ Adjusted for Income Overall | $5,623,708 |
| VSLY in 2012 $ Adjusted for Income Overall | $-365,558 |
| Average Number of Lost QALYs for Patients with MRSA Infection | 0.02393 |
| WTP (VSLY*Lost QALYs) per Patient | $8,749 |
| MRSA Parameters | |
| Average MRSA Colonization Rate for Patients Admitted to Hospital | 10.0% |
| % of Patients Colonized with MRSA that Develop an Infection | 33.3% |
| % of Patients with MRSA Infection that Die | 9.2% |
| Expected MRSA Transmission Rate | 1.7% |
| Expected Reduction in MRSA Transmission Rate due to Screening and Isolation | 60% |
5.2.1 Average Number of Lost QALYs for Patients with MRSA Infection
Similar to the VSL and VSLY values, we used the average number of lost QALYs estimated for ABSSSI for patients with MRSA infection (see Section 3.6.5.2).
5.2.2 Additional MRSA Parameters
According to Guleri, et al. (2011), MRSA colonization rate among patients admitted to the hospital ranges from 6 to 11 percent. Further, one third of patients colonized with MRSA tend to go on to develop an infection (Coia, et al., 2006). Another study by Datta & Huang (2008) finds that around 9 percent of patients that develop a MRSA infection die as a result. In a blinded study of MRSA transmission, Fishbain, et al. (2003) find that out of 354 discharged patients who did not have MRSA upon admission, 20 were colonized after being admitted to the hospital due to exposure to MRSA in the hospital setting. This translates to a transmission rate of 1.7 percent (= 20/354).
Based on the information, we use the following estimates in the model:
- MRSA colonization rate: Triangular probability distribution with a lower bound of 6 percent, upper bound of 11 percent, a likely point estimate of 10 percent,
- Percentage of patients colonized with MRSA that develop an infection: Triangular probability distribution with a lower bound of 25 percent, upper bound of 42 percent, a likely point estimate of 33.3 percent,
- Percentage of patients with MRSA infection that die: Triangular probability distribution with a lower bound of 7 percent, upper bound of 11 percent, a likely point estimate of 9.2 percent, and
- Expected MRSA transmission rate: Triangular probability distribution with a lower bound of 1 percent, upper bound of 2.5 percent, a likely point estimate of 1.7 percent.
There are a number of studies that have investigated reductions in MRSA infection cases as a result of institution of a variety of infection control practices, such as hand washing, patient screening, and education. Findings from these studies suggest that MRSA infections can be substantially reduced, 50 to 70 percent, with the implementation of one or more of these strategies (Jernigan & Kallen, 2010). More recently, Guleri, et al. (2011) report a 78 percent reduction in MRSA bacteremias in a UK hospital after implementation of a rapid MRSA screening program. For the model, we use an expected reduction in MRSA transmission of 60 percent due to the implementation of a rapid MRSA screening program that involves testing all patients admitted to the hospital upon visit to the emergency department. For sensitivity analysis, we assume that the parameter follows a triangular probability distribution with a lower and upper bound of 50 and 70 percent, respectively. Based on the above parameters, Table 25 presents the estimated total number of mortality and morbidity cases in the baseline and under RDT adoption in year 2011 as well as other intermediate parameter estimates used in arriving at the projected health outcomes. We use the U.S. Census population projections to estimate the annual number of cases of avoided mortality and morbidity for years 2012 through 2040 used in the model.
Table 25: Estimates of Mortality and Morbidity under the Baseline without RDT and with RDT Adoption, Respectively
| Parameter | Value |
|---|---|
| Expected RDT Adoption Rate | 6.4% |
| US Population | 313,232,044 |
| Hospital Admissions Eligible for RDT | 20,080,917 |
| Number with MRSA Colonization | 2,008,092 |
| Baseline Number That will Acquire MRSA in the Hospital | 306,319 |
| Baseline Number That will Develop An Infection | 102,106 |
| Baseline Mortality | 9,425 |
| Baseline Morbidity | 92,681 |
| Projected Number That will be Tested with RDT | 1,285,179 |
| Projected Number with MRSA Colonization Among those Tested with RDT | 128,518 |
| Projected Number That will Acquire MRSA in the Hospital with RDT | 7,842 |
| Projected Number That will Develop an Infection with RDT | 2,614 |
| Projected Number That will Die due to MRSA Infection with RDT | 241 |
| MRSA Cases Due to Non-Adopters | 95,572 |
| Number That will Die due to MRSA Infection Among Non-Adopters | 8,822 |
| Projected Mortality | 9,063 |
| Projected Morbidity | 89,122 |
| MRSA Cases Avoided Due to RDT | 3,921 |
5.3 Rapid POC Diagnostic Social EPV Results
We estimate the social EPV of a new MRSA rapid POC diagnostic at $22.1 billion. Comparison of the social ENPV value to private ENPV shows that the social EPV is substantially higher than the private ENPV by $21.9 billion. When a Monte Carlo analysis was conducted to gauge the sensitivity of our results to changes in model parameters and assumptions, we find that the social EPV could potentially range from $6.0 billion to $73.4 billion. The primary drivers for the observed wide range of social EPV results include 1) expected MRSA transmission rate, 2) real annual social rate of discount, 3) clinical stage success probability, and 4) percentage of patients with MRSA infection that die.
The results of this analysis, however, are limited to rapid POC diagnostics developed for MRSA and likely reflect the lower costs of development through the 510(k) process and the greater demand for a MRSA rapid POC diagnostic.
6 Discussion
We find that four of the six studied classes (CABP, ABSSI, CUTI and CIAI) had positive ENPVs for developers considering whether to enter the pre-clinical phase of development. However, in all six classes private value fell below the $100 million threshold identified by industry and other experts as the ENPV threshold commonly used in decisions whether to enter pre-clinical trials. As such, our findings suggest that incentives are desirable to stimulate research and development for antibacterial drugs to treat the six indications studied, ABOM, ABSSSI, CABP, CIAI, CUTI, and HABP/VABP, especially that the expected societal returns for bringing such drugs to market are significantly greater than the private returns for each indication.
Given the degree of uncertainty associated with different model parameters, it is difficult to ascertain the necessary levels of such incentives. However, the model does highlight certain regularities, which are relevant for policy-making. In particular, the extent and magnitude of the incentives needed for those sponsors at different points along the decision tree (e.g., start of Phase 3), decrease the closer the sponsor is to a successful product launch. This is primarily due to the effect of discounting, whereby the product revenues in out years contribute increasingly less to the net present value. This dynamic contributes to the fact that intellectual property (IP) extensions are not sufficient by themselves to incentivize a drug sponsor at the start of pre-clinical phase. Similarly, grants, awards and prizes for later drug development milestones must be quite substantial to induce developers to enter pre-clinical phases. And in parallel to the findings about other incentives, solely relying on regulatory modifications to shorten drug development process would not be sufficient to entice drug developers to enter pre-clinical research. It seems that only a combination of incentives has the potential to sufficiently move the ENPV above the $100 million threshold, but identifying the possible combinations was outside the scope of this project.
We should also note that simultaneous institution of conservation mechanisms, such as education campaigns to promote prudent use, and other stewardship programs, along with the types of antibacterial drug production incentives considered are likely to alter the incentive levels identified in this study. Conservation incentives, by their very nature, tend to reduce the potential market size for new antibacterial drugs thereby necessitating higher production incentive levels to boost private returns to the $100 million threshold.
In addition to high model parameter uncertainty, there are other study limitations that further complicate derivation of reliable incentive levels needed to stimulate development. The simplified nature of our decision tree is one such factor because it removes considerations such as drug development for multiple indications that directly impact expected private returns, development costs, and success probabilities. Additionally, even though the model uses the most up to date and comprehensive data, it still lacks some antibacterial drug specific parameter values, such as the costs associated with supply chain activities. Another limitation includes the consideration of the U.S. rather than the global market in estimating market sizes for the six indications due to data availability. Limiting market analysis to U.S. likely results in underestimation of the market size for each indication and therefore underestimates private ENPV in the absence of any incentives.
Perhaps the most important study limitation is our simplified model’s inability to account for other decision criteria that drug developers use internally in deciding which new compounds to pursue. In addition to private ENPV, developers often consider such factors as peak-year sales value, return on R&D investment and expected returns in comparison to other new product candidates, and whether the compound fits in with one’s existing or planned product portfolio. These kinds of synergies, especially if accompanied by cost of capital lower than assumed in this model, could translate into higher ENPV value for those players. Coupled with differing opportunity costs (the $100 million threshold), it is possible that some industry players may have stronger incentives to enter pre-clinical phases of drug development than this average model suggests.
Nonetheless, our model provides a necessary and transparent analytical model with which incentive discussions can be framed, particularly when coupled with a discussion of incentives to stimulate the public state of knowledge about pathogens and disease progression.
For the development of vaccines for ABOM and rapid POC diagnostics for MRSA, we find that incentives are not needed to stimulate development. The ENPV for an ABOM vaccine is $515.1 million and the ENPV for a MRSA POC diagnostic is $ 329 million; both are greater than a threshold ENPV of around $100 million needed for development.
7 References
About NIAID. (2012, February 29). Retrieved November 12, 2012, from National Institute of Allergy and Infectious Diseases: http://www.niaid.nih.gov/about/pages/default.aspx
Aldy, J. E., & Viscusi, W. K. (2008). Adjusting the Value of a Statistical Life for Age and Cohort Effects. The Review of Economics and Statistics, 90(3), 573–581.
American Academy of Pediatrics and American Academy of Family Physicians, Subcommittee on Management of Acute Otitis Media. (2004, May). Clinical Practice Guideline: Diagnosis and Management of Acute Otitis Media. Pediatrics, 1451-1465.
American Thoracic Society; Infectious Diseases Society of America. (2005). Guidelines for the Management of Adults with Hospital-acquired, Ventilator-associated, and Healthcare-associated Pneumonia. American Journal of Respiratory and Critical Care Medicine, 171(4), 388–416.
Association of Medical Microbiology and Infectious Disease (AMMI) Canada Guidelines Committee. (2005). Complicated urinary tract infection in adults. Canadian Journal of Infectious Diseases & Medical Microbiology, 349-360.
Ball, C. G., Hansen, G., Harding, G. K., Kirkpatrick, A. W., Weiss, K., & Zhanel, G. G. (2010). Canadian practice guidelines for surgical intra-abdominal infections. Canadian Journal of Infectious Diseases & Medical Microbiology, 21(1), 11-37.
Barie, P. S., Rotstein, O. D., Dellinger, E. P., Grasela, T. H., & Walawander, C. A. (2004). The Cost-Effectiveness of Cefepime plus Metronidazole versus Imipenem/Cilastatin in the Treatment of Complicated Intra-Abdominal Infection. Surgical Interventions, 5(3), 269-280.
Barry, H. C., Ebell, M. H., & Hickner, J. (1997). Evaluation of suspected urinary tract infection in ambulatory women: a cost-utility analysis of office-based strategies. Journal of Family Practice, 49.
Ben-Haim, A. (2008). The POC Market for Diagnostics of Diabetes, Maternal and Child Health, Tuberculosis, Malaria and Diarrhoeal Diseases in India and the World. Chennai, India: IKP Centre for Technologies in Public Health (ICTPH).
Berndt, E. R., & Aitken, M. L. (2010). Brand Loyalty, Generic Entry and Price Competition in Pharmaceuticals in the Quarter Century after the 1984 Waxman-Hatch Legislation. Cambridge, MA: National Bureau of Economic Research (NBER).
Berndt, E. R., Glennerster, R., Kremer, M. R., Lee, J., Levine, R., Weizsäcker, G., & Williams, H. (2005, January 5). Advanced Markets for a Malaria Vaccine: Estimating Costs and Effectiveness. MIT Sloan School of Management and NBER.
BIO Ventures for Global Health (BVGH). (2006). Tuberculosis Vaccines: The Case for Investment.
Blaue, G. E., Pekny, J. F., Varma, V. A., & Bunch, P. R. (2004). Managing a Portfolio of Interdependent New Product Candidates in the Pharmaceutical Industry. Journal of Product Innovation Management, 227-245.
Bryan, C. S., & Reynolds, K. L. (1984). Community-acquired bacteremic urinary tract infection: epidemiology and outcome. The Journal of Urology, 490-493.
Carson, C., & Naber, K. G. (2004). Role of Fluoroquinolones in the Treatment of Serious Bacterial Urinary Tract Infections. Drugs, 1359-1373.
Cattan, P., Yin, D. D., Sarfati, E., Lyu, R., de Zelicourt, M., & Fagnani, F. (2002). Cost of Care for Inpatients with Community-Acquired Intra-Abdominal Infections. European Journal of Clinical Microbiology & Infectious Diseases, 787–793.
Center for Drug Evaluation and Research (CDER). (2009, March). Guidance for Industry Community-Acquired Bacterial Pneumonia: Developing Drugs for Treatment. Retrieved November 8, 2011, from Food and Drug Administration: http://www.fda.gov/downloads/Drugs/GuidanceComplianceRegulatoryInformati...
Center for Drug Evaluation and Research (CDER). (2010, August). Guidance for Industry: Acute Bacterial Skin and Skin Structure Infections: Developing Drugs for Treatment (Draft Guidance). Retrieved June 27, 2012, from U.S. Food and Drug Administration: http://www.fda.gov/downloads/Drugs/GuidanceComplianceRegulatoryInformati...
Center for Drug Evaluation and Research (CDER). (2010, November). Guidance for Industry: Hospital-Acquired Bacterial Pneumonia and Ventilator-Associated Bacterial Pneumonia: Developing Drugs for Treatment (Draft Guidance). Retrieved November 9, 2011, from U.S. Food and Drug Administration: http://www.fda.gov/downloads/Drugs/GuidanceComplianceRegulatoryInformati...
Center for Drug Evaluation and Research (CDER). (2012, February). Guidance for Industry Complicated Urinary Tract Infections: Developing Drugs for Treatment. Retrieved April 3, 2012, from U.S. Food and Drug Administration: http://www.fda.gov/downloads/Drugs/.../Guidances/ucm070981.pdf
Cepheid. (2008). Laboratory Instruments and Equipment FSC Group 66, Part III Cost-Per-Test FSC Class 6630. Department of Veterans Affairs Federal Supply Schedule Authorized Federal Supply Schedule Price List. Sunnyvale, CA: U.S. General Services Administration (GSA).
Cernuschi, T., Furrer, E., Schwalbe, N., Jones, A., Berndt, E. R., & McAdams, S. (2011). Advance Market Commitment for Pneumococcal Vaccines: Putting Theory into Practice. Bulletin of the World Health Organization, 89, 913-918.
Choe, J. (2012). Fewer Drugs, More Superbugs: Strategies to Reverse the Problem. Retrieved November 13, 2012, from Alliance for the Prudent Use of Antibiotics: http://www.tufts.edu/med/apua/news/news-newsletter-vol-30-no-1-5.shtml
Coco, A. S. (2007). Cost-Effectiveness Analysis of Treatment Options for Acute Otitis Media. Annals of Family Medicine, 5(1), 29-38.
Coco, A. S., Horst, M. A., & Gambler, A. S. (2009, June 24). Trends in broad-spectrum antibiotic prescribing for children with acute otitis media in the United States, 1998–2004. BMC Pediatrics, 9(41).
Coia, J., Duckworth, G., Edwards, D., Farrington, M., Fry, C., Humphreys, H., . . . Association, I. C. (2006). Guidelines for the Control and Prevention of Meticillin-resistant Staphylococcus Aureus (MRSA) in Healthcare Facilities. Journal of Hospital Infection, Vol 63 No. 1, S1-S44.
Collier, M. (2004, January). Recognition and Management of Wound Infections. Retrieved June 3, 2013, from World Wide Wounds: http://www.worldwidewounds.com/2004/january/Collier/Management-of-Wound-...
Congressional Budget Office (CBO). (1998). How Increased Competition from Generic Drugs Has Affected Prices and Returns in the Pharmaceutical Industry. The Congress of the United States, Congressional Budget Office.
Cost-Effectiveness Analysis Registry. (n.d.). Retrieved June 19, 2012, from Tufts Medical Center: https://research.tufts-nemc.org/cear4/Home.aspx
Danzon, P. M., Pereira, N. S., & Tejwani, S. S. (2005). Vaccine Supply: A Cross-National Perspective. Health Affairs, 24(3), 706-717.
Datta, R., & Huang, S. S. (2008). Risk of Infection and Death due to Methicillin-Resistant Staphylococcus aureus in Long-Term Carriers. Clinical Infectitous Diseases, Vol. 47, 176-181.
DiMasi, J. A., & Grabowski, H. G. (2006). The Cost of Biopharmaceutical R&D: Is Biotech Different? Managerial And Decision Economics.
DiMasi, J. A., Grabowski, H. G., & Vernon, J. (2004). R&D Costs and Returns by Therapeutic Category. Drug Information Journal, 38, 211-223.
DiMasi, J., Hansen, R., & Grabowski, H. (2003). The price of innovation: new estimates of drug development costs. Journal of Health Economics, 22(2), 151-185.
Dong, J., Olano, J. P., McBride, J. W., & Walker, D. H. (2008). Emerging Pathogens: Challenges and Successes of Molecular Diagnostics. Journal of Molecular Diagnostics Vol. 10, No. 3, 185-197.
Drugs & Medications Search: Acute Otitis Media Infection. (2005-2012). Retrieved June 25, 2012, from WebMD: http://www.webmd.com/drugs/condition-1385-Acute+Otitis+Media+Infection.a...
Drummond, M. F., O'Brien, B., Stoddart, G. L., & Torrance, G. W. (1997). Methods for the Economic Evaluation of Health Care Programmes (2nd ed.). Oxford University Press, GB.
Eastern Research Group, Inc. (2012). Economic Analysis of CDRH Submission Requirements. Lexington, MA: Eastern Research Group, Inc.
ECRI Institute. (2008). Rapid test to Screen for Methicillin-resistant Staphylococcus aureus (MRSA). Plymouth Meeting, PA: ECRI Institute.
Edelsberg, J., Taneja, C., Zervos, M., Haque, N., Moore, C., Reyes, K., . . . Oster, G. (2009, September). Trends in US Hospital Admissions for Skin and Soft Tissue Infections. Emerging Infectious Diseases, 15(9), 1516-1518.
EPA Office of Environmental Information. (2006). Data Quality Assessment: Statistical Methods for Practitioners, EPA QA/G-9S. Washington, DC: EPA Office of Environmental Information.
Eron, L. J., Lipsky, B. A., Low, D. E., Nathwani, D., Tice, A. D., & Volturo, G. A. (2003). Managing skin and soft tissue infections: expert panel recommendations on key decision points. Journal of Antimicrobial Chemotherapy, 52(Suppl. S1), i3–i17.
Evans, H., Lefrak, S., Lyman, J., Smith, R., Chong, T., McElearney, S., . . . Sawyer, R. (2007). Cost of Gram-negative resistance. Critical Care Medicine 35(1), 89-95.
Fast Track, Accelerated Approval and Priority Review. (2012, August 2). Retrieved November 7, 2012, from U.S. Food and Drug Administration: http://www.fda.gov/forconsumers/byaudience/forpatientadvocates/speedinga...
File, T., & Marrie, T. (2010). Burden of community-acquired pneumonia in North American adults. Postgraduate Medicine, 122(2), 130-41.
Fishbain, J. T., Lee, J. C., Nguyen, H. D., Mikita, J. A., Mikita, C. P., Uyehara, C. F., & Hospenthal, D. R. (2003). Nosocomial Transmission of Methicillin-resistant Staphlyococcus Aureus: A Blinded Study to Establish Baseline Acquisition Rates. Infection Control and Hospital Epidemiology, Vol. 24 No. 6, 415-421.
Flores-González, J. C., Hernández-González, A., Rodríguez-López, C., Roldán-Cano, V., Rubio-Quiñones, F., Quintero-Otero, S., . . . Pantoja-Rosso, S. (2011). Nosocomial urinary tract infection in critical pediatric patients. Medicina Intensiva, 344-348.
Foxman, B. (2002). Epidemiology of Urinary Tract Infections: Incidence, Morbidity, and Economic Costs. Excerpta Medica, 5S-13S.
Gold, M. R., Franks, P., McCoy, K. I., & Fryback, D. G. (1998). Toward Consistency in Cost-Utility Analyses: Using National Measures to Create Condition-Specific Values. Medical Care, 36(6), 778-792.
Gomez, P. L. (n.d.). Product Development: Moving from the Bench to the Clinic: Presentation at the Dale and Betty Bumpers Vaccine Research Center. Vaccine Research Center (NIH).
Grabowski, H. G., & Vernon, J. M. (2000). Effective Patent Life in Pharmaceuticals. International Journal of Technologfy Management, 19(1/2), 98-120.
Grabowski, H. G., Kyle, M., Mortimer, R., Long, G., & Kirson, N. (2011). Evolving Brand-Name And Generic Drug Competition May Warrant A Revision Of The Hatch-Waxman Act. Health Affairs Vol. 30 No. 11, 2157-2166.
Guleri, A., Kehoe, A., Hartley, J., Lunt, B., Harper, N., Palmer, R., . . . Jones, A. (2011). The Costs and Benefits of Hospital MRSA Screening. British Journal of Healthcare Management, Vol 17 No. 2, 64-71.
Hammitt, J. K., & Robinson, L. A. (2011). The Income Elasticity of the Value per Statistical Life: Transferring Estimates between High and Low Income Populations. Journal of Benefit-Cost Analysis, 2(1), 1-27.
Hay, M., Rosenthal, J., Thomas, D., & Craighead, J. (2011, February 15). Presentation: Clinical Trial Success Rates Study (BIO CEO & Investor Conference). Biotechnology Industry Organization (BIO) / BioMedTracker.
Hersh, A. L., Chambers, H. F., Maselli, J. H., & Gonzales, R. (2008, July 28). National Trends in Ambulatory Visits and Antibiotic Prescribing for Skin and Soft-Tissue Infections. Archives of Internal Medicine, 168(14), 1585-1591.
Honeycutt, A., Robinson, T., & Layton, C. (2005). Influenza Vaccine Economics (Issue Brief prepared by RTI International for the U.S. Department of Health and Human Services). Research Triangle Park, NC: RTI International.
Hooton, T. M., Bradley, S. F., Cardenas, D. D., Colgan, R., Geerlings, S. E., Rice, J. C., . . . Nicolle, L. E. (2010). Diagnosis, Prevention, and Treatment of Catheter-Associated Urinary Tract Infection in Adults: 2009 International Clinical Practice Guidelines from the Infectious Diseases Society of America. Clinical Infectious Diseases, 50, 625–663.
Huang, S. S., Johnson, K. M., Ray, G. T., Wroe, P., Lieu, T. A., Moore, M. R., . . . Finkelstein, J. A. (2011). Healthcare utilization and cost of pneumococcal disease in the United States. Vaccine, 3398–3412.
IMS Health. (2010). Launch Evolution Across Pharmerging Markets: IMS Health LEAP Study 2010. Norwalk, CT: IMS Health.
IMS Health. (2012). National Sales Perspectives™, Year 2007-2011. Source File: 1205 antimicrobials sales 5-18-12.xls. Extracted May 2012.
Infectious Diseases Society of America . (2004). Bad Bugs, No Drugs: As Antibiotic Discovery Stagnates, A Public Health Crisis Brews. Alexandria, VA: Infectious Diseases Society of America.
Infectious Diseases Society of America (IDSA). (2012, April 12). Drug Companies, Health Groups Back IDSA Proposal. Retrieved November 13, 2012, from Infectious Diseases Society of America: http://www.idsociety.org/2012_LPAD_Proposal_Backing/#
Infectious Diseases Society of America (IDSA). (n.d.). Limited Population Antibacterial Drug (LPAD) Approval Mechanism: One-Page Summary. Retrieved November 13, 2012, from Infectious Diseases Society of America: http://www.idsociety.org/uploadedFiles/IDSA/News_and_Publications/IDSA_N...
Infectious Diseases Society of America. (2005, November 15). Practice Guidelines for the Diagnosis and Management of Skin and Soft-Tissue Infections. Clinical Infectious Diseases, 1373-1406.
Infectious Diseases Society of America. (2012). Limited Population Antibacterial Drug (LPAD) Approval Mechanism. Retrieved from http://www.idsociety.org/uploadedFiles/IDSA/News_and_Publications/IDSA_N...
Jernigan, J., & Kallen, A. (2010, March 24). Methicillin-Resistant Staphylococcus aureus (MRSA) Infections: Activity C: ELC Prevention Collaboratives. Atlanta, GA: Centers for Disease Control and Prevention (CDC).
John K. Jenkins, M. (2011, December 8). CDER New Drug Review: 2011 Update - FDA/CMS Summit. Retrieved January 2, 2013, from http://www.fda.gov/downloads/AboutFDA/CentersOffices/OfficeofMedicalProd...
Jones, R. N. (2010). Microbial Etiologies of Hospital-Acquired Bacterial Pneumonia and Ventilator-Associated Bacterial Pneumonia. Clinical Infectious Diseases, 51(S1), S81–S87.
Kades, E. (2005). Preserving a Precious Resource: Rationalizing the Use of Antibiotics. Northwestern University Law Review, 611–674.
Kaper, J., Rappuoli, R., & Buckley, M. (2005). Vaccine Development: Current Status and Future Needs. Washington, D.C.: American Academy of Microbiology.
Kesselheim, A. S., & Outterson, K. (2010). Fighting Antibiotic Resistance: Marrying New Financial Incentives To Meeting Public Health Goals. Health Affairs, 29(9), 1689-1696.
Kesselheim, A. S., & Outterson, K. (2011). Improving Antibiotic Markets for Long Term Sustainability. Yale Journal of Health Policy, Law, and Ethics.
Kesselheim, A. S., & Outterson, K. (2011). Improving Antibiotic Markets for Long Term Sustainability. Yale Journal of Health Policy Law and Ethics, 101-167.
Klevens, R. M., Edwards, J. R., Richards, J. C., Horan, T. C., Gaynes, R. P., Pollock, D. A., & Cardo, D. M. (2007). Estimating Health Care-Associated Infections and Deaths in U.S. Hospitals, 2002. Public Health Reports, 122(2), 160–166.
Kollef, M. H., Morrow, L. E., Niederman, M. S., Leeper, K. V., Anzueto, A., Benz-Scott, L., & Rodino, F. J. (2006). Clinical Characteristics and Treatment Patterns Among Patients With Ventilator-Associated Pneumonia. Chest, 1210-1218.
Lai, K. K., & Fontecchio, S. A. (2002, June). Use of silver-hydrogel urinary catheters on the incidence of catheter-associated urinary tract infections in hospitalized patients. American Journal of Infection Control, 221-225.
Lane, D. R., & Takhar, S. S. (2011). Diagnosis and Management of Urinary Tract Infection and Pyelonephritis. Emergency Medicine Clinics of North America, 539–552.
Laxminarayan, R., & Malani, A. (2007). Extending the Cure: Policy responses to the growing threat of antibiotic resistance. Washington, D.C.: Resources for the Future.
Layton, C., & Lenfestey, N. (2005). Influenza Vaccine Manufacturing (Issue Brief prepared by RTI International for the U.S. Department of Health and Human Services). Research Triangle Park, NC: RTI International.
Lee, B. Y., Bailey, R. R., Smith, K. J., Muder, R. R., Strotmeyer, E. S., Lewis, G. J., . . . Harrison, L. H. (2010, June). Universal methicillin-resistant Staphylococcus aureus (MRSA) surveillance for adults at hospital admission: an economic model and analysis. Infection Control and Hospital Epidemiology, 31(6), 598-606.
Levine, H. L. (2010, December). Vaccine Manufacturing Facilities of the Future (presentation by BioProcess Technology Consultants, BPTC).
Levy, S. B. (1992). The Antibiotic Paradox: How Miracle Drugs Are Destroying the Miracle. New York: Plenum Press.
Lichtenberger, P., & Hooton, T. M. (2008). Complicated Urinary Tract Infections. Current Infectious Disease Reports, 10, 499–504.
Lipsky, M. S., & Sharp, L. K. (2001). From Idea to Market: The Drug Approval Process. The Journal of the American Board of Family Practice, 362-367.
Liu, C., Bayer, A., Cosgrove, S. E., Daum, R. S., Fridkin, S. K., Gorwitz, R. J., . . . Chambers, H. F. (2011). Clinical Practice Guidelines by the Infectious Diseases Society of America for the Treatment of Methicillin-Resistant Staphylococcus Aureus Infections in Adults and Children. Clinical Practice Guidelines, 1-38.
Lopez, N., Kobayashi, L., & Coimbra, R. (2011). A Comprehensive review of abdominal infections. World Journal of Emergency Surgery, 6.
Lutfiyya, M. N., Henley, E., Chang, L. F., & Reyburn, S. W. (2006). Diagnosis and Treatment of Community-Acquired Pneumonia. American Family Physician, 73(3), 442-450.
Marton, J. P., Jackel, J. L., Carson, R. T., Rothermel, C. D., Friedman, M., & Menzin, J. (2008). Costs of skin and skin structure infections due to Staphylococcus aureus: an analysis of managed-care claims. Current Medical Research and Opinion, 2821-2828.
Mayo Clinic. (2011, May 10). Pneumonia. Retrieved February 28, 2012, from Mayo Clinic: http://www.mayoclinic.com/health/pneumonia/DS00135/DSECTION=causes
Mazuski, J., & Solomkin, J. S. (2009). Intra-Abdominal Infections. Surgical Clinics of North America, 89, 421–437.
McEachern, R., & Campbell, J. G. (1998). Hospital-Acquired Pneumonia: Epidemiology, Etiology, and Treatment. Infectious Disease Clinics of North America, 12(3), 761-779.
Melekos, M. D., & Naber, K. G. (2000). Complicated urinary tract infections. International Journal of Antimicrobial Agents, 247–256.
Menzin, J., Marton, J. P., Meyers, J. L., Carson, R. T., Rothermel, C. D., & Friedman, M. (2010). Inpatient treatment patterns, outcomes, and costs of skin and skin structure infections because of Staphylococcus aureus. American Journal of Infection Control, 38(1), 44-49.
Merck. (2011). Community-Acquired Pneumonia. Retrieved February 28, 2012, from The Merck Manual Homehealth Handbook: http://www.merckmanuals.com/home/lung_and_airway_disorders/pneumonia/com...
Ming, D. Y., Chen, L. F., Miller, B. A., Sexton, D. J., & Anderson, D. J. (2012). The Impact of Depth of Infection and Postdischarge Surveillance on Rate of Surgical-Site Infections in a Network of Community Hospitals. Infection Control and Hospital Epidemiology, 276-282.
Mossialos, E., Morel, C. M., Edwards, S., Berenson, J., Gemmill-Toyama, M., & Brogan, D. (2010). Policies and incentives for promoting innovation in antibiotic research. European Observatory on Health Systems and Policies. Copenhagen, Denmark: World Health Organization.
Murphy, E. (2002). Weakened Defenses. Johns Hopkins Public Health: The Magazine of the Johns Hopkins Bloomberg School of Public Health.
National Center for Health Statistics. (1963, July). Length of Convalescence After Surgery. Series 10, Number 3.
National Hospital Discharge Survey. (2009). Table: Number and rate of discharges from short-stay hospitals and of days of care, with average length of stay, and standard error, by selected first-listed diagnostic categories: United States, 2009. Retrieved June 19, 2012, from Centers for Disease Control and Prevention: http://www.cdc.gov/nchs/data/nhds/2average/2009ave2_firstlist.pdf
National Hospital Discharge Survey. (2009). Table: Number, rate and average length of stay for discharges from short-stay hospitals by age, region, and sex: United States, 2009. Retrieved July 17, 2012, from Centers for Disease Control and Prevention: http://www.cdc.gov/nchs/data/nhds/1general/2009gen1_agesexalos.pdf
NIMH (National Institute of Mental Health). (2005). National Institute of Mental Health, National Institutes of Health, Department of Health and Human Services, FY 2005 Budget. Retrieved 2011, from http://www.nimh.nih.gov/about/budget/cj2005.pdf
Noskin, G. A., Rubin, R. J., Schentag, J. J., Kluytmans, J., Hedblom, E. C., Jacobson, C., . . . Bharmal, M. (2007, November 1). National Trends in Staphylococcus aureus Infection Rates: Impact on Economic Burden and Mortality over a 6-Year Period (1998–2003). Clinical Infectious Diseases, 45, 1132-1140.
Nugent, R., Back, E., & Beith, A. (2010). The Race Against Drug Resistance: A Report of the Center for Global Development’s Drug Resistance Working Group. Center for Global Development.
O'Brien, M. A., Prosser, L. A., Paradise, J. L., Ray, G. T., Kulldorff, M., Kurs-Lasky, M., . . . Lieu, T. A. (2009). New Vaccines Against Otitis Media: Projected Benefits and Cost-effectiveness. Pediatrics, 1452-1463.
Office of the Assistant Secretary for Preparedness and Response Organization Chart. (n.d.). Retrieved November 12, 2012, from U.S. Department of Health & Human Services: http://www.hhs.gov/about/orgchart/aspr.html
Okeke, I. N., Peeling, R. W., Goossens, H., Auckenthaler, R., Olmsted, S. S., de Lavison, J.-F., . . . Nordqvist, K. (2011). Diagnostics as Essential Tools for Containing Antibacterial Resistance. Drug Resistance Updates, 14(2), 95-106.
Outterson, K. (2006). The Vanishing Public Domain: Antibiotic Resistance, Pharmaceutical Innovation and Intellectual Property Law. University of Pittsburgh Law Review, 67-123.
Outterson, K. (2010). The Legal Ecology of Resistance: The Role of Antibiotic Resistance in Pharmaceutical Innovation. Cardozo Law Review, 101-168.
Outterson, K., & Yevtukhova, O. (2011). Germ Shed Management in the United States. In I. M. Gould, & J. van der Meer (Eds.), Antibiotic Policies: Controlling Hospital-Associated Infection. Springer.
Outterson, K., Samora, J. B., & Keller-Cuda, K. (2007). Will Longer Antimicrobial Patents Improve Global Public Health? Lancet Infectious Disease, 559-566.
Paladino, J. A., Gilliland-Johnson, K. K., Adelman, M. H., & Cohn, S. M. (2008). Pharmacoeconomics of Ciprofloxicin plus Metronidazole vs. Piperacillin-Tazobactam for Complicated Intra-Abdominal Infections. Surgical Infections, 9(3), 325-333.
Parmet, S. (2003, September 24). JAMA Patient Page: Acute Otitis Media. The Journal of the American Medical Association, 290(12), 1666.
Paul, S. M., Mytelka, D. S., Dunwiddie, C. T., Persinger, C. C., Munos, B. H., Lindborg, S. R., & Schacht, A. L. (2010, March). How to improve R&D productivity: the pharmaceutical industry’s grand challenge. Nature Reviews Drug Discovery, 9, 203-214.
Peeling, R. W., Artsob, H., Pelegrino, J. L., Buchy, P., Cardosa, M. J., Devi, S., . . . Yoksan, S. (2010). Evaluation of diagnostic tests: Dengue. Nature Reviews Microbiology, s30-s37.
Pepper, P. V., & Owens, D. K. (2002, Sep-Oct). Cost-effectiveness of the pneumococcal vaccine in healthy younger adults. Medical Decision Making, 22(5 Suppl), S45-57.
Rajan, S. (2012, January). Skin and soft-tissue infections: Classifying and treating a spectrum. Cleveland Clinic Journal of Medicine, 79(1), 57-66.
Regan, T. L. (2008). Generic entry, price competition, and market segmentation in the prescription drug market. International Journal of Industrial Organization, 26, 930-948.
Rello, J., Ollendorf, D. A., Oster, G., Vera-Llonch, M., Bellm, L., Redman, R., & Kollef, M. H. (2002). Epidemiology and Outcomes of Ventilator-Associated Pneumonia in a Large US Database. Chest, 2115-2121.
Richards, R. J., & Hammitt, J. K. (2002). Timing of Prophylactic Surgery in Prevention of Diverticulitis Recurrence: A Cost-Effective Analysis. Digestive Diseases and Sciences, 47(9), 1903-1908.
Rickwood, S. (2010). Rising Payor Influence Means Successful Drug Launches are Rarer. IN VIVO, Vol 28 (4).
Ridley, D. B., Grabowski, H. G., & Moe, J. L. (2006). Developing Drugs For Developing Countries. Health Affairs, 25(2), 313-324.
Roberts, R. R., Douglas II, S. R., Hota, B., Kampe, L. M., Abbasi, F., Schabowski, S., . . . Weinstein, R. A. (2010). Costs Attributable to Healthcare-Acquired Infection in Hospitalized Adults and a Comparison of Economic Methods. Medical Care, 48(11), 1026-1035.
Roberts, R., Hota, B., Ahmad, I., Scott, R., Foster, S., Abbasi, F., . . . Weinstein, R. (2009). Hospital and societal costs of antimicrobial-resistant infections in a Chicago teaching hospital: implications for antibiotic stewardship. Clinical Infectious Diseases 49(8), 1175-1184.
Rudholm, N. (2002). Economic Implications of Antibiotic Resistance in a Global Economy. Journal of Health Economics, 1071-1083.
Saint, S. (2000). Clinical and economic consequences of nosocomial catheter-related bacteriuria. American Journal of Infection Control, 68-75.
Sampathkumar, P. (2009). Nosocomial Pneumonia. In K. I. Bland, M. W. Büchler, A. Csendes, O. J. Garden, M. G. Sarr, & J. Wong (Eds.), General Surgery: Principles and International Practice (2nd Edition ed., pp. 287-295).
Sartelli, M. (2010). A focus on intra-abdominal infections. World Journal of Emergency Surgery, 5.
Sartelli, M., Catena, F., Coccolini, F., & Pinna, A. D. (2012). Antimicrobial management of intra-abdominal infections: Literature's guidelines. World Journal of Gastroenterology, 865-871.
Scherer, F. M. (2004). An Industrial Organization Perspective on the Influenza Vaccine Shortage (unpublished manuscript).
Schmitt, S. (2010, August 1). Community-Acquired Pneumonia. Retrieved November 8, 2011, from Cleveland Clinic Center for Continuing Education: http://www.clevelandclinicmeded.com/medicalpubs/diseasemanagement/infect...
Sharma, P., & Towse, A. (2011). New Drugs to Tackle Antimicrobial Resistance: Analysis of EU Policy Options. London: Office of Health Economics Research.
Shorr, A. F., Susla, G. M., & Kollef, M. H. (2004). Linezolid for treatment of ventilator-associated penumonia: A cost-effective alternative to vancomycin. Critical Care Medicine, 32(1), 137-143.
Sloan, F. A., Berman, S., Rosenbaum, S., Chalk, R. A., & Griffin, R. B. (2004, December 2). The Fragility of the U.S. Vaccine Supply (presentation).
Smith, R., & Coast, J. (2013). The True Cost of Antimicrobial Resistance. BMJ Vol. 346, 1-5.
So, A. D., Gupta, N., Brahmachari, S. K., Chopra, I., Munos, B., Nathan, C., . . . Weigelt, J. (2011). Towards new business models for R&D for novel antibiotics. Drug Resistance Updates, 14, 88-94.
Solomkin, J. S., Mazuski, J. E., Bradley, J. S., Rodvold, K. A., Goldstein, E. J., Baron, E. J., . . . Bartlett, J. G. (2010). Diagnosis and Management of Complicated Intra-abdominal Infection in Adults and Children: Guidelines by the Surgical Infection Society and the Infectious Diseases Society of America. Clinical Infectious Diseases, 50, 133–164.
Spirt, M. J. (2010). Complicated Intra-abdominal Infections: A Focus on Appendicitis and Diverticulitis. Postgraduate Medicine.
Stamm, W. E., & Hooten, T. M. (1993). Management of Urinary Tract Infections in Adults. The New England Journal of Medicine, 1328-1334.
Strongin, R. J. (2002). Hatch-Waxman, Generics, and Patents: Balancing Prescription Drug Innovation, Competition, and Affordability. Washingto DC: The George Washington University, National Health Policy Forum.
Struck, M. (1996). Vaccine R&D success rates and development times. Nature Biotechnology, 14, 591-593.
Sturkenboom, M. C., Goettsch, W. G., Picelli, G., Veld, B. i., Yin, D. D., de Jong, R. B., . . . Herings, R. M. (2005). Inappropriate initial treatment of secondary intra-abdominal infections leads to increased risk of clinical failure and costs. British Journal of Clinical Pharmacology, 438–443.
Tambyah, P. A., Knasinski, V., & Maki, D. G. (2002). The Direct Costs of Nosocomial Catheter-Associated Urinary Tract Infection in the Era of Managed Care. Infection Control and Hospital Epidemiology, 23(1), 27-31.
Tenover, F. C. (2011). Developing Molecular Amplification Methods for Rapid Diagnosis of Respiratory Tract Infections Caused by Bacterial Pathogens. Clinical Infectious Diseases Vol. 52, Supp 4, S338–S345.
U.S. Bureau of Economic Analysis. (2013). GDP & Personal Income. Retrieved June 2013, from U.S. Bureau of Economic Analysis: http://www.bea.gov/
U.S. Bureau of Labor Statistics. (1990-2011). Consumer Price Index - All Urban Consumers: Series IDs CUUR0000SAM,CUUS0000SAM (Medical Care). Retrieved July 3, 2012, from Bureau of Labor Statistics: http://data.bls.gov/pdq/querytool.jsp?survey=cu
U.S. Census Bureau. (2008, August 14). 2008 National Population Projections: Projected Population by Single Year of Age, Sex, Race, and Hispanic Origin for the United States: July 1, 2000 to July 1, 2050.
U.S. Centers for Disease Control and Prevention. (2013). Antibiotic Resistance Threats in the United States. U.S. Department of Health and Human Services, Centers for Disease Control and Prevention.
U.S. Centers for Disease Control and Prevention. (2013, April 29). CDC Vaccine Price List. Retrieved June 2013, from U.S. Centers for Disease Control and Prevention: http://www.cdc.gov/vaccines/programs/vfc/awardees/vaccine-management/pri...
U.S. Department of Health and Human Services, Public Health Service, National Institutes of Health, National Institute of Diabetes and Digestive and Kidney Diseases. (2007). Urologic Diseases in America. Washington, D.C.: U.S. Government Printing Office.
U.S. Department of Labor. (2011). Establishment Data: Historical Hours and Earnings (Table B-2). Retrieved July 3, 2012, from U.S. Bureau of Labor Statistics: ftp://ftp.bls.gov/pub/suppl/empsit.ceseeb2.txt
U.S. Food and Drug Administration. (2007, April 17). System, Nucleic Acid Amplification Test, DNA, Methicillin Resistant Staphylococcus Aureus, Direct Specimen XPERT MRSA Test by Cepheid- 510(k) No. K070462. Retrieved from 510(k) Substantial Equivalence Determination Decision Summary: http://www.accessdata.fda.gov/scripts/cdrh/cfdocs/cfPMN/pmn.cfm?ID=K070462
U.S. Food and Drug Administration. (2012, March). Table of antibacterial drugs for Acute Bacterial Skin and Skin Structure Infections (ABSSSI).
U.S. Food and Drug Administration. (2012, March). Table of antibacterial drugs for Community-Acquired Bacterial Pneumonia (CABP).
U.S. Food and Drug Administration. (2012, March). Table of antibacterial drugs for Complicated Intra-Abdominal Infections (CIAIs).
U.S. Food and Drug Administration. (2012, March). Table of antibacterial drugs for Complicated Urinary Tract Infections (CUTIs).
U.S. Food and Drug Administration. (2012, March). Table of antibacterial drugs for Hospital-Acquired Bacterial Pneumonia and Ventilator-Associated Bacterial Pneumonia (HABP/VABP).
U.S. Food and Drug Administration. (2013, June 26). U.S. Food and Drug Administration. Retrieved from Fast Track, Breakthrough Therapy, Accelerated Approval and Priority Review: http://www.fda.gov/ForConsumers/ByAudience/ForPatientAdvocates/SpeedingA...
U.S. National Center for Health Statistics. (2010, December 9). National Vital Statistics Report (NVSR): Deaths: Preliminary Data for 2008. Retrieved June 19, 2012, from http://www.census.gov/compendia/statab/cats/births_deaths_marriages_divo...
University of Michigan Health System. (2007, July). Guidelines for Clinical Care: Otitis media. 1-12. Ann Arbor, MI: University of Michigan Health System (UMHS).
Usdin, S. (2012, November 19). GAIN Act, FDA Stance Only First Steps to Refilling Antibiotic Pipeline in U.S. - Antibiotics Reset. Retrieved from BioCentury on BioBusiness: http://www.biocentury.com/biotech-pharma-news/coverstory/2012-11-19/gain...
Walters, D. J., Solomkin, J. S., & Paladino, J. A. (1999). Cost-Effectiveness of Ciprofloxacin plus Metronidazole versus Imipenem-Cilastatin in the Treatment of Intra-Abdominal Infections. Pharmacoeconomics, 16(5 Pt 2), 551-561.
Warren, D. K., Shukla, S. J., Olsen, M. A., Kollef, M. H., Hollenbeak, C. S., Cox, M. J., . . . Fraser, V. J. (2003). Outcome and attributable cost of ventilator-associated pneumonia among intensive care unit patients in a suburban medical center. Critical Care Medicine, 31(5), 1312-1317.
Weigelt, J. A. (2007). Empiric treatment options in the management of complicated intra-abdominal infections. Cleveland Clinic Journal of Medicine, 74, S29-S37.
Appendix A: Background Information on Indications
Introduction
As noted in Section 3.2.13, we estimate market size for each indication based on 2011 sales data obtained from IMS Health in three different ways:
- Estimate 1: Total sales of antibacterial drugs that are in the formulation of interest (i.e., oral or IV) labeled to treat the indication.
- Estimate 2: Total sales of all antibacterial drugs in Estimate 1, plus other formulations of the antibacterial drugs in Estimate 1, plus any other antibacterial drugs (in any formulation) approved to treat the indication.
- Estimate 3: Total sales of all antibacterial drugs in Estimate 2 plus any antibacterial drugs that compete with antibacterial drugs in Estimate 2 for treating other indications (i.e., if a drug included in Estimate 2 is also used to treat another indication, all other drugs used to treat that other indication are added to the total sales calculation for this final estimate). Due to the extent of overlap among drugs used to treat these indications, Estimate 3 is the same across all indications considered ($9.23 billion).
The three estimates are intended to reflect differing visions of drug manufacturers as they consider potential market size. The smallest estimate is for the drug and formulation specifically under development, which represents the most conservative or narrowly defined market vision. The medium estimate represents the larger potential market for treating the same indications, but also reflects the possibility that the NME can be formulated for oral administration as well. The largest estimate represents all potential antibacterial drugs with which the NME might compete if it can also be approved to treat other indications. More details on the drugs included in each market size estimate are provided in the following sections. It should be noted that some of the drugs used in generating these estimates may have been discontinued since the time for the data collection.
Acute Bacterial Otitis Media (ABOM)
A.1.1 Background
Acute bacterial otitis media (ABOM) is an infection of the middle ear.. It is the most common infection for which antibacterial drugs are prescribed for children in the United States, though it can also occur in adults. Streptococcus pneumoniae is the most commonly identified bacterium in ABOM among children, found in approximately 25% to 50% of cases; Haemophilus influenzae is found in 15%-30% of cases, and Moraxella catarrhalis in 3% to 20% of cases
The economic burden associated with acute otitis media (including non-bacterial causes) is substantial, particularly when the indirect costs associated with lost time from school and work (for parents) are taken into account. According to a 2001 study, the direct cost of acute otitis media in was estimated to be $1.96 billion in 1995, and the indirect cost was estimated at $1.02 billion Recent studies of outpatient survey data indicate that there are roughly between 9 million and 16 million physician office visits for acute otitis media every year
A.1.2 Current Treatment
Physicians may manage patients with ABOM with either a short period (48-72 hours) of observation and then antibacterial therapy if symptoms do not improve or by starting antibacterials immediately. If a decision is made to treat with antibacterial drugs, amoxicillin is recommended as the first antibacterial agent of choice, but alternative drugs (including cefdinir, cefpodoxime, azithromycin, and clarithromycin) may be used if the patient has allergic reactions to penicillin.
A.1.3 List of Drugs Used in Determining Different Market Size Estimates
Appendix Table 1: List of Drugs Used in Determining Different Market Size Estimates for ABOM
| Market Size Estimate 1 | Market Size Estimate 2 | Market Size Estimate 3 |
|---|---|---|
| AMOXICILLIN (oral) | AMPICILLIN (IV) | AMIKACIN (IV) |
| AMOXICILLIN/CLAVULANIC ACID (oral) | AZITHROMYCIN (IV) | AMPICILLIN (oral) |
| AZITHROMYCIN (oral) | CEFTRIAXONE (IV) | AMPICILLIN/SULBACTAM (IV) |
| CEFDINIR (oral) | CEFUROXIME (IV) | AZTREONAM (IV) |
| CEFPODOXIME PROXETIL (oral) | ERYTHROMYCIN (IV) | CEFACLOR (oral) |
| CEFPROZIL (oral) | MINOCYCLINE (IV) | CEFADROXIL (oral) |
| CEFUROXIME AXETIL (oral) | PENICILLIN G (IV) | CEFAZOLIN (IV) |
| CEPHALEXIN (oral) | SULFAMETHOXAZOLE/TRIMETHOPRIM (IV) | CEFDITOREN PIVOXIL (oral) |
| CLARITHROMYCIN (oral) | CEFEPIME (IV) | |
| ERYTHROMYCIN (oral) | CEFOTAXIME (IV) | |
| MINOCYCLINE (oral) | CEFOTETAN (IV) | |
| PENICILLIN G (oral) | CEFOXITIN (IV) | |
| SULFAMETHOXAZOLE/TRIMETHOPRIM (oral) | CEFTAROLINE FOSAMIL (IV) | |
| TETRACYCLINE (oral) | CEFTAZIDIME (IV) | |
| CEFTIZOXIME (IV) | ||
| CHLORAMPHENICOL (IV) | ||
| CIPROFLOXACIN (IV) | ||
| CIPROFLOXACIN (oral) | ||
| CLINDAMYCIN (IV) | ||
| CLINDAMYCIN (oral) | ||
| COLISTIN (IV) | ||
| DAPTOMYCIN (IV) | ||
| DOXYCYCLINE (IV) | ||
| DOXYCYCLINE (oral) | ||
| ERTAPENEM (IV) | ||
| GEMIFLOXACIN (oral) | ||
| GENTAMICIN (IV) | ||
| IMIPENEM/CILASTATIN (IV) | ||
| LEVOFLOXACIN (IV) | ||
| LEVOFLOXACIN (oral) | ||
| LINEZOLID (IV) | ||
| LINEZOLID (oral) | ||
| LOMEFLOXACIN (oral) | ||
| MEROPENEM (IV) | ||
| METRONIDAZOLE (IV) | ||
| METRONIDAZOLE (oral) | ||
| MOXIFLOXACIN (IV) | ||
| MOXIFLOXACIN (oral) | ||
| NAFCILLIN (IV) | ||
| NORFLOXACIN (oral) | ||
| OFLOXACIN (oral) | ||
| OXACILLIN (IV) | ||
| PIPERACILLIN (IV) | ||
| PIPERACILLIN/TAZOBACTAM (IV) | ||
| QUINUPRISTIN/DALFOPRISTIN (IV) | ||
| TELAVANCIN (IV) | ||
| TELITHROMYCIN (oral) | ||
| TICARCILLIN/CLAVULANIC ACID (IV) | ||
| TIGECYCLINE (IV) | ||
| TOBRAMYCIN (IV) | ||
| VANCOMYCIN (IV) | ||
| VANCOMYCIN (oral) |
Acute Bacterial Skin and Skin Structure Infection (ABSSSI)
A.2.1 Background
Acute bacterial skin and skin structure infections (ABSSSIs) are a subgroup of skin and soft tissue infections (SSTIs), which are commonly occurring microbial infections of the epidermis, dermis and subcutaneous tissues For the purpose of clinical trial design, ABSSSIs are defined by FDA guidance to include such conditions as cellulitis/erysipelas, wound infections, burn infections, cutaneous abscesses, and impetigo. Infections of animal or human bites, necrotizing fasciitis, diabetic foot infections, decubitus ulcer infections, myonecrosis, ecthyma gangrenosum, and catheter-site infections are specifically excluded because they generally require different medical management than ABSSSI. SSTIs can have diverse etiologies, and identification of the causative agent is often difficult; however, the majority of SSTIs are caused by Staphylococcus aureus and streptococci. The economic burden associated with SSTIs is substantial and growing. Total hospital admissions for SSTIs increased by 29 percent between 2000 and 2004 and the number of visits (and visit rate) to ambulatory care facilities increased from 8.6 million (32.1 visits per 1000 population) to 14.2 million visits (48.1 per 1000) between 1997 and 2005. These increases have been attributed largely to increasing resistance to antibacterial drug agents among the microorganisms that most commonly cause these infections especially methicillin-resistant Staphylococcus aureus (MRSA) According to a recent study, the total economic burden of S. aureus infection was estimated to be $14.5 billion for all inpatient stays in 2003A.2.2 Current Treatment
While uncomplicated SSTIs may be treated in the outpatient setting with oral dicloxacillin–flucloxacillin or cephalexin (or, alternatively, penicillin, amoxicillin/clavulanic acid, macrolides, tetracyclines, or clindamycin), more serious SSTIs often require parenteral administration of antimicrobial agents, such as ceftriaxone, clindamycin, penicillins, and cefazolin In cases of complicated SSTIs caused by MRSA, intravenous administration of vancomycin, linezolid, daptomycin, telavancin, or clindamycin is recommended. Outpatient treatment of MRSA infections may involve oral clindamycin, trimethoprim-sulfamethoxazole, doxycycline, minocycline, linezolid, or cephalexin.
A.2.3 List of Drugs Used in Determining Different Market Size Estimates
Appendix Table 2: List of Drugs Used in Determining Different Market Size Estimates for ABSSSI
| Market Size Estimate 1 | Market Size Estimate 2 | Market Size Estimate 3 |
|---|---|---|
| AMPICILLIN/SULBACTAM (IV) | CEFACLOR (oral) | AMIKACIN (IV) |
| AZTREONAM (IV) | CEFADROXIL (oral) | AMOXICILLIN (oral) |
| CEFAZOLIN (IV) | CEFDINIR (oral) | AMOXICILLIN/CLAVULANIC ACID (oral) |
| CEFEPIME (IV) | CEFDITOREN PIVOXIL (oral) | AMPICILLIN (IV) |
| CEFOTAXIME (IV) | CEFPODOXIME PROXETIL (oral) | AMPICILLIN (oral) |
| CEFOTETAN (IV) | CEFPROZIL (oral) | AZITHROMYCIN (IV) |
| CEFOXITIN (IV) | CEFUROXIME AXETIL (oral) | AZITHROMYCIN (oral) |
| CEFTAROLINE FOSAMIL (IV) | CEPHALEXIN (oral) | CLARITHROMYCIN (oral) |
| CEFTAZIDIME (IV) | CIPROFLOXACIN (oral) | COLISTIN (IV) |
| CEFTIZOXIME (IV) | CLINDAMYCIN (oral) | ERYTHROMYCIN (IV) |
| CEFTRIAXONE (IV) | DOXYCYCLINE (oral) | ERYTHROMYCIN (oral) |
| CEFUROXIME (IV) | LEVOFLOXACIN (oral) | GEMIFLOXACIN (oral) |
| CHLORAMPHENICOL (IV) | LINEZOLID (oral) | GENTAMICIN (IV) |
| CIPROFLOXACIN (IV) | METRONIDAZOLE (oral) | LOMEFLOXACIN (oral) |
| CLINDAMYCIN (IV) | MOXIFLOXACIN (oral) | MINOCYCLINE (IV) |
| DAPTOMYCIN (IV) | OFLOXACIN (oral) | MINOCYCLINE (oral) |
| DOXYCYCLINE (IV) | PENICILLIN G (oral) | NORFLOXACIN (oral) |
| ERTAPENEM (IV) | SULFAMETHOXAZOLE/TRIMETHOPRIM (oral) | PIPERACILLIN (IV) |
| IMIPENEM/CILASTATIN (IV) | VANCOMYCIN (oral) | TELITHROMYCIN (oral) |
| LEVOFLOXACIN (IV) | TETRACYCLINE (oral) | |
| LINEZOLID (IV) | TOBRAMYCIN (IV) | |
| MEROPENEM (IV) | ||
| METRONIDAZOLE (IV) | ||
| MOXIFLOXACIN (IV) | ||
| NAFCILLIN (IV) | ||
| OXACILLIN (IV) | ||
| PENICILLIN G (IV) | ||
| PIPERACILLIN/TAZOBACTAM (IV) | ||
| QUINUPRISTIN/DALFOPRISTIN (IV) | ||
| SULFAMETHOXAZOLE/TRIMETHOPRIM (IV) | ||
| TELAVANCIN (IV) | ||
| TICARCILLIN/CLAVULANIC ACID (IV) | ||
| TIGECYCLINE (IV) | ||
| VANCOMYCIN (IV) |
Community Acquired Bacterial Pneumonia (CABP)
A.3.1 Background
Community-acquired bacterial pneumonia (CABP) is an acute infection that involves the lungs. CABP is associated with symptoms such as fever or, chills, rigors, cough, chest pain, or dyspnea, and accompanied by the presence of a new lobar or multilobar infiltrate on a chest radiograph. Streptococcus pneumoniae is the most commonly identified bacterium in CABP. Other bacteria that cause CABP include Haemophilus influenzae, Staphylococcus aureus, Mycoplasma pneumoniae, Chlamydophila pneumoniae, and Legionella species. A causative agent is not identified in 30 percent to 50 percent of cases with currently employed diagnostic techniques.
The economic burden associated with community-acquired pneumonia (including non-bacterial causes) remains substantial at greater than $17 billion annually in the United States. Despite the availability and widespread adherence to recommended treatment guidelines, the disease continues to present a significant burden in adults. Furthermore, given the aging population, clinicians can expect to encounter an increasing number of adult patients with the disease.
A.3.2 Current Treatment
Patients with CABP are started on antibacterial drugs as soon as possible. Because the causative organism is difficult to identify, physicians choose antibacterial drugs for the most common pathogen(s) associated with the condition and the severity of illness. Most CABP patients improve with antibacterial drug treatment. For those patients whose conditions do not improve, physicians look for unusual organisms, resistance to the antibacterial drug used for treatment, infection with a second organism, or some other disorder (such as a problem with the immune system or a lung abnormality) that might be delaying recovery.
In the absence of comorbidities and a low-risk determination, a patient is typically treated on an outpatient basis. The preferred antibacterial drugs for outpatient treatment are macrolides (azithromycin, clarithromycin, or erythromycin), and doxycycline (Vibramycin), a tetracycline. The preferred antibacterial drug treatment for high-risk patients with comorbidities is an intravenous beta-lactam (cefotaxime, ceftriaxone, or ampicillin) plus a macrolide or a fluoroquinolone alone delivered in an inpatient setting
A.3.3 List of Drugs Used in Determining Different Market Size Estimates
Appendix Table 3: List of Drugs Used in Determining Different Market Size Estimates for CABP
| Market Size Estimate 1 | Market Size Estimate 2 | Market Size Estimate 3 |
|---|---|---|
| AMPICILLIN (IV) | AMOXICILLIN (oral) | AMIKACIN (IV) |
| AMPICILLIN/SULBACTAM (IV) | AMOXICILLIN/CLAVULANIC ACID (oral) | CEFADROXIL (oral) |
| AZITHROMYCIN (IV) | AMPICILLIN (oral) | CEFAZOLIN (IV) |
| AZTREONAM (IV) | AZITHROMYCIN (oral) | CEFTAZIDIME (IV) |
| CEFEPIME (IV) | CEFACLOR (oral) | CHLORAMPHENICOL (IV) |
| CEFOTAXIME (IV) | CEFDINIR (oral) | CIPROFLOXACIN (IV) |
| CEFOTETAN (IV) | CEFDITOREN PIVOXIL (oral) | COLISTIN (IV) |
| CEFOXITIN (IV) | CEFPODOXIME PROXETIL (oral) | DAPTOMYCIN (IV) |
| CEFTAROLINE FOSAMIL (IV) | CEFPROZIL (oral) | GENTAMICIN (IV) |
| CEFTIZOXIME (IV) | CEFUROXIME AXETIL (oral) | LOMEFLOXACIN (oral) |
| CEFTRIAXONE (IV) | CEPHALEXIN (oral) | MEROPENEM (IV) |
| CEFUROXIME (IV) | CIPROFLOXACIN (oral) | METRONIDAZOLE (IV) |
| CLINDAMYCIN (IV) | CLARITHROMYCIN (oral) | METRONIDAZOLE (oral) |
| DOXYCYCLINE (IV) | CLINDAMYCIN (oral) | MINOCYCLINE (IV) |
| ERTAPENEM (IV) | DOXYCYCLINE (oral) | NORFLOXACIN (oral) |
| ERYTHROMYCIN (IV) | ERYTHROMYCIN (oral) | QUINUPRISTIN/DALFOPRISTIN (IV) |
| IMIPENEM/CILASTATIN (IV) | GEMIFLOXACIN (oral) | TELAVANCIN (IV) |
| LEVOFLOXACIN (IV) | LEVOFLOXACIN (oral) | TOBRAMYCIN (IV) |
| LINEZOLID (IV) | LINEZOLID (oral) | |
| MOXIFLOXACIN (IV) | MINOCYCLINE (oral) | |
| NAFCILLIN (IV) | MOXIFLOXACIN (oral) | |
| OXACILLIN (IV) | OFLOXACIN (oral) | |
| PENICILLIN G (IV) | PENICILLIN G (oral) | |
| PIPERACILLIN (IV) | SULFAMETHOXAZOLE/TRIMETHOPRIM (oral) | |
| PIPERACILLIN/TAZOBACTAM (IV) | TELITHROMYCIN (oral) | |
| SULFAMETHOXAZOLE/TRIMETHOPRIM (IV) | TETRACYCLINE (oral) | |
| TICARCILLIN/CLAVULANIC ACID (IV) | VANCOMYCIN (oral) | |
| TIGECYCLINE (IV) | ||
| VANCOMYCIN (IV) |
Complicated Intra-abdominal Infection (CIAI)
A.4.1 Background
Intra-abdominal infections (IAIs) comprise a wide range of pathological conditions, such as appendicitis, diverticulitis, gastroduodenal perforation, cholangitis, cholecystitis, and pancreatitis. IAIs are typically subcategorized as either uncomplicated or complicated, although the distinction between them is not always clear. Generally, uncomplicated IAIs involve a single organ and treatment includes surgical resection and perioperative prophylaxis only. Complicated IAIs (CIAIs) occur when the infection extends outside the organ that is the source of the infection into the peritoneal cavity. Most CIAIs involve peritonitis or intra-abdominal abscesses.
IAIs can also be classified as either community-acquired or healthcare-associated. Community-acquired IAIs develop in individuals that have not undergone recent surgical intervention or hospitalization. It is estimated that appendicitis and diverticulitis together comprise more than 80 percent of all community-acquired CIAIs. In contrast, healthcare-associated infections appear 48 hours or more after hospital admission, often during treatment for other conditions or as a post-surgical complication. Although most intra-abdominal infections are community-acquired, healthcare–associated pathogens are of increasing concern given the rising threat of resistant bacteria.
As CIAIs are often caused by resident gastrointestinal flora, their microbial etiology depends on the level of disruption of the gastrointestinal tract, where the number of microorganisms increases further down the gastrointestinal tract. Predominant pathogens include enteric gram-negative bacilli, gram-positive cocci, and anaerobic microorganisms.
A.4.2 Current Treatment
CIAIs are likely to be managed in an inpatient setting, as successful treatment is dependent on both source control (e.g., surgical drainage and definitive management of the source) and antimicrobial treatment.
For IAIs, the location of the primary source of infection, the presence of comorbidities, and whether the infection is community-acquired or healthcare-associated are critical factors in predicting antibacterial drug susceptibilities. Healthcare-associated CIAIs are frequently associated with more resistant flora. Complicated IAIs can be treated with either single agent or combination therapy antimicrobials. Agents approved for use include ticarcillin-clavulanate, cefoxitin, moxifloxacin, ertapenem, and tigecycline. The empiric use of antimicrobial regimens such as meropenem, imipenem-cilastatin, doripenem, piperacillin-tazobactam, ciprofloxacin or levofloxacin in combination with metronidazole, or ceftazidime or cefepime in combination with metronidazole, is recommended for patients with high-severity community-acquired intra-abdominal infection.
A.4.3 List of Drugs Used in Determining Different Market Size Estimates
Appendix Table 4: List of Drugs Used in Determining Different Market Size Estimates for CIAI
| Market Size Estimate 1 | Market Size Estimate 2 | Market Size Estimate 3 |
|---|---|---|
| AMIKACIN (IV) | AMPICILLIN (oral) | AMOXICILLIN (oral) |
| AMPICILLIN (IV) | CEFUROXIME AXETIL (oral) | AMOXICILLIN/CLAVULANIC ACID (oral) |
| AMPICILLIN/SULBACTAM (IV) | CIPROFLOXACIN (oral) | AZITHROMYCIN (IV) |
| AZTREONAM (IV) | CLINDAMYCIN (oral) | AZITHROMYCIN (oral) |
| CEFEPIME (IV) | DOXYCYCLINE (oral) | CEFACLOR (oral) |
| CEFOTAXIME (IV) | LINEZOLID (oral) | CEFADROXIL (oral) |
| CEFOTETAN (IV) | MOXIFLOXACIN (oral) | CEFAZOLIN (IV) |
| CEFOXITIN (IV) | VANCOMYCIN (oral) | CEFDINIR (oral) |
| CEFTAZIDIME (IV) | CEFDITOREN PIVOXIL (oral) | |
| CEFTIZOXIME (IV) | CEFPODOXIME PROXETIL (oral) | |
| CEFTRIAXONE (IV) | CEFPROZIL (oral) | |
| CEFUROXIME (IV) | CEFTAROLINE FOSAMIL (IV) | |
| CIPROFLOXACIN (IV) | CEPHALEXIN (oral) | |
| CLINDAMYCIN (IV) | CHLORAMPHENICOL (IV) | |
| COLISTIN (IV) | CLARITHROMYCIN (oral) | |
| DOXYCYCLINE (IV) | DAPTOMYCIN (IV) | |
| ERTAPENEM (IV) | ERYTHROMYCIN (IV) | |
| GENTAMICIN (IV) | ERYTHROMYCIN (oral) | |
| IMIPENEM/CILASTATIN (IV) | GEMIFLOXACIN (oral) | |
| LINEZOLID (IV) | LEVOFLOXACIN (IV) | |
| MEROPENEM (IV) | LEVOFLOXACIN (oral) | |
| MOXIFLOXACIN (IV) | LOMEFLOXACIN (oral) | |
| NAFCILLIN (IV) | METRONIDAZOLE (IV) | |
| OXACILLIN (IV) | METRONIDAZOLE (oral) | |
| PIPERACILLIN (IV) | MINOCYCLINE (IV) | |
| PIPERACILLIN/TAZOBACTAM (IV) | MINOCYCLINE (oral) | |
| TICARCILLIN/CLAVULANIC ACID (IV) | NORFLOXACIN (oral) | |
| TIGECYCLINE (IV) | OFLOXACIN (oral) | |
| TOBRAMYCIN (IV) | PENICILLIN G (IV) | |
| VANCOMYCIN (IV) | PENICILLIN G (oral) | |
| QUINUPRISTIN/DALFOPRISTIN (IV) | ||
| SULFAMETHOXAZOLE/TRIMETHOPRIM (IV) | ||
| SULFAMETHOXAZOLE/TRIMETHOPRIM (oral) | ||
| TELAVANCIN (IV) | ||
| TELITHROMYCIN (oral) | ||
| TETRACYCLINE (oral) |
Complicated Urinary Tract Infections (CUTI)
A.5.1 Background
Complicated urinary tract infections (CUTIs) are those infections diagnosed in individuals with structural or functional abnormalities of the genitourinary tract. Factors that may contribute to complicated infections include indwelling catheters, neurogenic bladder, renal failure, obstructive uropathy, urinary retention, and pregnancy. It is estimated that complicated UTIs comprise less than five percent of cases of UTIs.
Escherichia coli is the causative agent in almost all cases of uncomplicated UTI and about 60 percent of cases of complicated UTI. A wide variety of other gram-negative and gram-positive bacteriacan also cause CUTI, including, Klebsiella pneumonia, Proteus mirabilis, Providencia species, Pseudomonas aeruginosa, Enterococcus species, and Coagulase-negative staphylococcus. Overall, UTI is one of the most common bacterial infections in both the community and healthcare settings. Catheter-associated UTI is the most frequently occurring nosocomial infection As a result of its high incidence, the economic burden associated with urinary tract infection is substantial. Symptomatic catheter-associated UTI has been associated with an increased hospital stay of 1-2 days at an additional minimal cost of $676 per patient
A.5.2 Current Treatment
Treatment often involves empiric broad-spectrum antibacterial drug therapy, initially. Modifications of the antibacterial drug regimen can be made after urine culture and sensitivity analysis results are obtained. Mild to moderately ill patients may be treated in an outpatient setting with oral antibacterial drugs, such as norfloxacin or ciprofloxacin. Antibacterial drugs are typically prescribed for 7 to 14 days, with longer courses of treatment for more severe complicated urinary tract infections. Patients with more severe infections, such as complicated pyelonephritis, or those accompanied by severe symptoms may require hospitalization and intravenous antibacterial drugs, such as ampicillin and gentamicin, ciprofloxacin, ofloxacin, ceftriaxone, aztreonam, ticarcillin-clavulanate, or imipenem-cilastatin
A.5.3 List of Drugs Used in Determining Different Market Size Estimates
Appendix Table 5: List of Drugs Used in Determining Different Market Size Estimates for CUTI
| Market Size Estimate 1 | Market Size Estimate 2 | Market Size Estimate 3 |
|---|---|---|
| AMIKACIN (IV) | AMPICILLIN (oral) | AZITHROMYCIN (IV) |
| AMOXICILLIN (oral) | LINEZOLID (oral) | AZITHROMYCIN (oral) |
| AMOXICILLIN/CLAVULANIC ACID (oral) | MINOCYCLINE (IV) | CEFAZOLIN (IV) |
| AMPICILLIN (IV) | VANCOMYCIN (oral) | CEFDINIR (oral) |
| AMPICILLIN/SULBACTAM (IV) | CEFDITOREN PIVOXIL (oral) | |
| AZTREONAM (IV) | CEFPROZIL (oral) | |
| CEFACLOR (oral) | CEFTAROLINE FOSAMIL (IV) | |
| CEFADROXIL (oral) | CHLORAMPHENICOL (IV) | |
| CEFEPIME (IV) | CLARITHROMYCIN (oral) | |
| CEFOTAXIME (IV) | CLINDAMYCIN (IV) | |
| CEFOTETAN (IV) | CLINDAMYCIN (oral) | |
| CEFOXITIN (IV) | DAPTOMYCIN (IV) | |
| CEFPODOXIME PROXETIL (oral) | ERYTHROMYCIN (IV) | |
| CEFTAZIDIME (IV) | ERYTHROMYCIN (oral) | |
| CEFTIZOXIME (IV) | GEMIFLOXACIN (oral) | |
| CEFTRIAXONE (IV) | MEROPENEM (IV) | |
| CEFUROXIME (IV) | METRONIDAZOLE (IV) | |
| CEFUROXIME AXETIL (oral) | METRONIDAZOLE (oral) | |
| CEPHALEXIN (oral) | MOXIFLOXACIN (IV) | |
| CIPROFLOXACIN (IV) | MOXIFLOXACIN (oral) | |
| CIPROFLOXACIN (oral) | OXACILLIN (IV) | |
| COLISTIN (IV) | PENICILLIN G (IV) | |
| DOXYCYCLINE (IV) | PENICILLIN G (oral) | |
| DOXYCYCLINE (oral) | QUINUPRISTIN/DALFOPRISTIN (IV) | |
| ERTAPENEM (IV) | TELAVANCIN (IV) | |
| GENTAMICIN (IV) | TELITHROMYCIN (oral) | |
| IMIPENEM/CILASTATIN (IV) | TIGECYCLINE (IV) | |
| LEVOFLOXACIN (IV) | ||
| LEVOFLOXACIN (oral) | ||
| LINEZOLID (IV) | ||
| LOMEFLOXACIN (oral) | ||
| MINOCYCLINE (oral) | ||
| NAFCILLIN (IV) | ||
| NORFLOXACIN (oral) | ||
| OFLOXACIN (oral) | ||
| PIPERACILLIN (IV) | ||
| PIPERACILLIN/TAZOBACTAM (IV) | ||
| SULFAMETHOXAZOLE/TRIMETHOPRIM (IV) | ||
| SULFAMETHOXAZOLE/TRIMETHOPRIM (oral) | ||
| TETRACYCLINE (oral) | ||
| TICARCILLIN/CLAVULANIC ACID (IV) | ||
| TOBRAMYCIN (IV) | ||
| VANCOMYCIN (IV) |
Hospital Acquired Bacterial Pneumonia (HABP)/Ventilator Associated Bacterial Pneumonia (VABP)
A.6.1 Background
Hospital-acquired bacterial pneumonia (HABP) and ventilator-associated bacterial pneumonia (VABP) are acute infections of the that occur, by definition, in hospitalized patients. The bacteria that commonly cause HABP and VABP include Gram-negative bacilli including Pseudomonas aeruginosa, Staphylococcus aureus, Streptococcus pneumoniae, and Legionella.
The economic burden associated with HABP and VABP is significant. HABP/VABP is currently the second most common type of nosocomial infection in the United States and is associated with high mortality and morbidity, especially in the intensive care unit (ICU). HABP accounts for up to a quarter of all ICU infections and for over half of the antibacterial drugs prescribed, with nearly 90 percent of ICU episodes occurring during mechanical ventilation. HABP/VABP increases patients’ duration of hospital stay by several days, increasing treatment costs substantially
A.6.2 Current Treatment
According to American Thoracic Society/Infectious Diseases Society of America guidelines, patients with no known risk factors for multi-drug resistant pathogens and early onset of disease may receive initial intravenous treatment with antibacterial drugs such as ceftriaxone, levofloxacin, moxifloxacin, ciprofloxacin, ampicillin/sulbactam, or ertapenem, depending on the potential pathogen.
Patients with late-onset disease or other risk factors for infection with multi-drug resistant pathogens should be treated with antibacterial agents likely to cover the suspected etiologies. Possible therapies include an antipseudomonal cephalosporin (cefepime, ceftazidime); an antipseudomonal carbepenem (imipenem or meropenem); a beta-lactam/beta-lactamase inhibitor (piperacillin–tazobactam) plus an antipseudomonal fluoroquinolone (ciprofloxacin or levofloxacin); or an aminoglycoside (amikacin, gentamicin, or tobramycin) plus linezolid or vancomycin.
A.6.3 List of Drugs Used in Determining Different Market Size Estimates
Appendix Table 6: List of Drugs Used in Determining Different Market Size Estimates for HABP/VABP
| Market Size Estimate 1 | Market Size Estimate 2 | Market Size Estimate 3 |
|---|---|---|
| AMIKACIN (IV) | CIPROFLOXACIN (oral) | AMOXICILLIN (oral) |
| CEFEPIME (IV) | LEVOFLOXACIN (oral) | AMOXICILLIN/CLAVULANIC ACID (oral) |
| CEFTAZIDIME (IV) | LINEZOLID (oral) | AMPICILLIN (IV) |
| CIPROFLOXACIN (IV) | VANCOMYCIN (oral) | AMPICILLIN (oral) |
| COLISTIN (IV) | AMPICILLIN/SULBACTAM (IV) | |
| GENTAMICIN (IV) | AZITHROMYCIN (IV) | |
| IMIPENEM/CILASTATIN (IV) | AZITHROMYCIN (oral) | |
| LEVOFLOXACIN (IV) | AZTREONAM (IV) | |
| LINEZOLID (IV) | CEFACLOR (oral) | |
| MEROPENEM (IV) | CEFADROXIL (oral) | |
| PIPERACILLIN/TAZOBACTAM (IV) | CEFAZOLIN (IV) | |
| TOBRAMYCIN (IV) | CEFDINIR (oral) | |
| VANCOMYCIN (IV) | CEFDITOREN PIVOXIL (oral) | |
| CEFOTAXIME (IV) | ||
| CEFOTETAN (IV) | ||
| CEFOXITIN (IV) | ||
| CEFPODOXIME PROXETIL (oral) | ||
| CEFPROZIL (oral) | ||
| CEFTAROLINE FOSAMIL (IV) | ||
| CEFTIZOXIME (IV) | ||
| CEFTRIAXONE (IV) | ||
| CEFUROXIME (IV) | ||
| CEFUROXIME AXETIL (oral) | ||
| CEPHALEXIN (oral) | ||
| CHLORAMPHENICOL (IV) | ||
| CLARITHROMYCIN (oral) | ||
| CLINDAMYCIN (IV) | ||
| CLINDAMYCIN (oral) | ||
| DAPTOMYCIN (IV) | ||
| DOXYCYCLINE (IV) | ||
| DOXYCYCLINE (oral) | ||
| ERTAPENEM (IV) | ||
| ERYTHROMYCIN (IV) | ||
| ERYTHROMYCIN (oral) | ||
| GEMIFLOXACIN (oral) | ||
| LOMEFLOXACIN (oral) | ||
| METRONIDAZOLE (IV) | ||
| METRONIDAZOLE (oral) | ||
| MINOCYCLINE (IV) | ||
| MINOCYCLINE (oral) | ||
| MOXIFLOXACIN (IV) | ||
| MOXIFLOXACIN (oral) | ||
| NAFCILLIN (IV) | ||
| NORFLOXACIN (oral) | ||
| OFLOXACIN (oral) | ||
| OXACILLIN (IV) | ||
| PENICILLIN G (IV) | ||
| PENICILLIN G (oral) | ||
| PIPERACILLIN (IV) | ||
| QUINUPRISTIN/DALFOPRISTIN (IV) | ||
| SULFAMETHOXAZOLE/TRIMETHOPRIM (IV) | ||
| SULFAMETHOXAZOLE/TRIMETHOPRIM (oral) | ||
| TELAVANCIN (IV) | ||
| TELITHROMYCIN (oral) | ||
| TETRACYCLINE (oral) | ||
| TICARCILLIN/CLAVULANIC ACID (IV) | ||
| TIGECYCLINE (IV) |