
By: Kimberly Burgess, Nina Chien, Taryn Morrissey, Kendall Swenson
Acknowledgements
The authors would like to acknowledge our Deputy Assistant Secretary for Human Services Policy, Ajay Chaudry, for his leadership and vision in the development of this report. The authors would also like to acknowledge Barbara Broman, Ann McCormick, Martha Moorehouse, and Pam Winston for their direction and reviews.
Disclaimer
Persons with disabilities having problems accessing the below PDF file and this report may call Nina Chien (202) 690-7927 or email Nina.Chien@hhs.gov for assistance.
"Executive Summary
Over the past several decades, increasing maternal labor force participation and growing public recognition of the importance of early education for children’s development and school readiness have led to a large and steady increase in young children’s participation in early care and education programs. Whereas in 1964 only 9.5 percent of three- and four-year-olds were enrolled in school, by 2011 that figure had grown to 52.4 percent (Snyder and Dillow, 2012). There has been a contemporaneous growth in public investment in early childhood programs over the past few decades, including both federal programs (e.g., Head Start and child care subsidies) and state investments (e.g., state prekindergarten).
This report uses multiple years of data from two data sources—the Current Population Survey (CPS, 1995-2011) and the National Household Education Survey (NHES, 1995, 2001, 2005)—to examine trends in early care and education arrangements for young children over the past few decades. Specifically, this report seeks to address the two main questions:
- What types of non-parental early care and education (ECE) arrangements were children enrolled in between 1995 and 2011, and how did enrollment patterns change over that period?
- What are the trends in the use of center and non-center ECE?
- What are the trends in the use of private ECE (with a family payment) and public ECE (without a family payment)?
- What are the trends in the use of full-time and part-time preschool for three- and four-year-old children?
- How do rates of participation in ECE and trends in the use of various ECE arrangements differ based on demographic characteristics, particularly:
- Child age
- Family income
- Maternal demographic characteristics: maternal employment, education, marital status, and nativity
- Race/ethnicity
Overall Trends
From 1995 to 2005, there was remarkably little change in the overall use of non-parental early care and education (ECE), but there was a significant shift in the types of care children attended: children’s enrollment in center-based ECE increased and enrollment in non-center care decreased. This shift occurred for all ages between birth and five years, but was most pronounced among children under age three. Additionally, among children ages three and four, the CPS data show that rates of enrollment in public preschool increased and private enrollment decreased from 1995 to 2011. Among children under three, however, the NHES data show that the rate of enrollment in centers with a family payment (i.e., private centers) increased while enrollment rates in centers without a family payment (i.e., public centers) did not change. Rates of participation in full-day and part-day ECE among three- and four-year-olds changed very little during this period.
Child Age and ECE Use
Center care participation has remained consistently higher among preschool-aged children than infants and toddlers. Yet, most of the growth in the use of center care from 1995 to 2005 occurred among children under age three. For example, the number of two-year-olds in center-based care increased from 18 to 28 percent between 1995 and 2005. By 2005, two-year-olds were as likely to be in centers as in non-center-based care. For infants and toddlers (children under age three), the increase in center-based enrollment was driven by an increase in the use of centers with a family payment, and the number of infants and toddlers in center care without a family payment remained very low (under three percent). In contrast, for preschool-aged children, the increase in center-based enrollment seems to be driven by the increased availability and use of public preschool options during this period. Whereas private preschool enrollment for three- and four-year-olds exceeded public enrollment in 1995, this trend had completely reversed by 2011 when preschoolers were more likely to be enrolled in public preschools than in private preschools.
Family Income and ECE Use
There was a large and consistent difference in the use of center-based care and education by family income across this time period. Among children under age five, 27 percent of children with a family income below 200 percent of the Federal Poverty Level (FPL) participated in center-based care compared to 40 percent of their peers with family incomes above 200 percent of the FPL (in 2005). One way of understanding the magnitude of this income gap is that at each age between birth and age four, a child from a higher-income family (above 200 percent of the FPL) was as likely to be in center-based care as a child one year older from a low-income family (below 200 percent of the FPL). For example, a higher-income two-year-old was just as likely as a low-income three-year-old to be in center-based care. Not surprisingly, lower-income children (below 200 percent of the FPL) were more likely to be in publicly-funded centers without a family payment, and less likely to be in private preschool or centers with a family payment, compared to their relatively higher-income peers. From 1995 to 2011 public preschool enrollment increased for children in families with incomes both above and below 200 percent of the FPL. However, for low-income children, this resulted in a net growth in preschool enrollment, whereas for higher-income children there was an observed substitution from private preschools into public alternatives.
Maternal Demographic Characteristics and ECE Use
Maternal employment
Children with employed mothers were more than twice as likely to participate in non-parental ECE as those with mothers who were not employed: four-in-five children with an employed mother were in some type of non-parental care arrangement, compared to only one-in-three children with mothers who were not employed. For children younger than three, those with employed mothers were consistently more than four times as likely to participate in ECE as those whose mothers were not employed. The largest increase in the use of center-based care over this time period occurred among infants and toddlers with employed mothers. Among employed mothers who paid for infant and toddler care, there was a shift from non-center care to an increasing use of center-based care during this time period.
Maternal education, marital status, and nativity
Children with more highly educated mothers remained more likely to be enrolled in preschool across 1995 to 2011. Further, higher maternal education was associated with higher levels of private preschool enrollment and lower levels of public preschool enrollment. With regard to public preschool enrollment, there were no differences in the use of public preschool by levels of maternal education below a bachelor’s degree; however, children whose mothers had a bachelor’s degree were less likely than those with less-educated mothers to participate in publicly-funded preschool. Public preschool enrollment also increased at a similar rate across all levels of maternal education. Children with unmarried mothers were more likely to be in public preschool and less likely to be in private preschool, compared to those with married mothers. Children with native-born mothers were more likely to be enrolled in preschool and more likely to attend private preschool than children with foreign-born mothers.
Race/Ethnicity and ECE Use
Preschool enrollment increased among Black children, and the Black-White enrollment gap in 1995 (for three- and four-year-old children) was no longer present in 2011. The Asian-White enrollment gap for three- and four-year-old children was also significant in 1995 but not in 2011[1]. Latino children’s participation in preschool also increased, narrowing the Latino-White gap, but Latino preschool enrollment rates remained lower than all other racial/ethnic groups across this time period. It is worth noting that the increases in Black and Latino children’s preschool participation occurred only among four-year-olds (with no statistically significant increases for three-year-olds)[2]. The percent of children enrolled in public preschool was highest among Black children, followed by Latino children, and then White children. The percent of children enrolled in private school, in contrast, was highest among White children, followed by Black children, and then Latino children.
[1] This is due largely due to a non-significant increase in Asian enrollment. Note that large standard errors associated with Asian estimates cause even seemingly large differences to be statistically insignificant. Among Asian three-and four-year olds, preschool enrollment was 38 percent in 1995 and 49 percent in 2011; among three-year-olds only, 25 (in 1995) and 38 (in 2011) percent; and among four-year-olds only, 55 (in 1995) and 61 (in 2011) percent. None of these differences were statistically significant.
[2] Asian enrollment was not statistically significant from 1995 to 2011 for either three- or four-year-olds. However, the pattern of greater increase among four-year-olds compared to three-year-olds was not observed – even in terms of nonsignificant trends – among Asian children.
Introduction and Background
Over the past several decades, increasing maternal labor force participation and growing public recognition of the importance of early education for children’s development and school readiness has led to a large and continuous increase in young children’s participation in early care and education (ECE) programs. In 1965, only six percent of children with employed mothers were in organized center-based care arrangements, compared to more than one-quarter in 2011. Participation in early education programs has increased even more steeply among preschool-aged children: from 1968 to 2000, the enrollment rates of three-year-olds rose from eight to 39 percent and four-year-olds rose from 23 to 65 percent (Bainbridge et al., 2005).
Over the same time period, there has been growth in public investments in early childhood programs. Total federal funding for ECE programs nearly quadrupled in nominal dollars between 1990 and 2002 (Chaudry, 2004). With expansions in Head Start, the creation of Early Head Start, and expansions in child care subsidies, in recent years public spending continued to grow, particularly with the investments made under the American Recovery and Reinvestment Act (ARRA) of 2009 (U.S. Department of Health and Human Services, 2009). State investments have also increased, as indicated by the doubling of the proportion of four-year-olds enrolled in state public prekindergarten programs from 2002 to 2012 (NIEER, 2013).
Several recent publications have examined trends in preschool and center-based child care attendance over the last several decades and the characteristics of children and families who account for the growth in ECE participation. Private, out-of-pocket spending on ECE rose from 1995 to 2005. This increase was driven by private spending for younger children, with a 30 percent increase in spending on birth to two-year-olds, a 17 percent increase for three-year-olds, and a six percent increase for four-year-old children (Belfield, 2010). Using data from 1968 to 2010, Magnuson and Waldfogel (2012) found that historically, Black three-and four-year-old children were more likely to be enrolled in preschool than White preschoolers, but this gap disappeared by the 1980s and reversed direction thereafter such that White preschoolers became more likely to be enrolled than their Black peers. Hispanic children’s enrollment in preschool has been consistently lower than White or Black children’s enrollment, though the gap between Hispanic and White children’s preschool enrollment began to narrow after 2000. Also, children with employed mothers spend more hours in center care, as do both children with more educated mothers and those in single-parent households (Belfield, 2010). The use of center care is strongly associated with children’s age; four-year-olds are much more likely to be enrolled in centers than infants and toddlers (Belfield, 2010; Laughlin, 2013).
A large body of research has found that lower-income children are less likely to be enrolled in center care than higher-income children, and this income gap has remained fairly stable over the past 30 years (Magnuson and Waldfogel, 2012). However, there is evidence that increases in public spending for ECE and the availability of no- or low-cost public options increase the probability that low-income children enroll in preschool or center-based settings (Ertas and Shields, 2012; Greenberg, 2010; Kinukawa, Guzman, and Lippman, 2004; Laughlin, 2013; Magnuson et al., 2007). While the probability of a child in the lowest income quartile being enrolled in center care is just 0.29, this increases to 0.41 if the family receives child care assistance (Ertas and Shields, 2012). Likewise, among families in the bottom third of the income distribution, a $1,000 per-child increase in public pre-K funding increases the odds that a three- to five-year-old child will attend center-based care as their primary arrangement by about 35 percent, whereas there is no effect on enrollment among children in the top third of the income distribution (Greenberg, 2010).
This report and analysis adds to this literature by providing a comprehensive picture of how young children’s enrollment in center-based care or preschool settings has changed over the last two decades, and how rates of participation in these various settings differ by child age and family demographic characteristics, using two complementary nationally representative datasets.
Data Sources and Methodology
In this report, we examine trends in the use of early care and education (ECE) from 1995 to 2011 by utilizing two large, nationally representative datasets: the October Supplement of the Current Population Survey (CPS) and the National Household Education Survey (NHES) of Early Childhood Program Participation. Together, these sources provide a broad set of descriptive data that show trends over time. There are important differences in survey wording and timing, highlighted in the below table, that pertain to our analysis and findings and also contribute to our following definition of terms (pg. 9).
Key Differences in the Two Data Sources
| National Household Education Survey (NHES – Early Childhood Program Participation) | Current Population Survey (CPS – October Supplement) | |
|---|---|---|
| Years administered | 1995, 2001, 2005 | 1995 – 2011, annually |
| Ages of children | 0, 1, 2, 3, 4 | 3, 4 |
| Center-based care | “center-based care” | “nursery school” or “preschool” |
| Non center-based care | ✓ | Not assessed |
| Financing of care | “charge or fee for program” | “private” or “public” |
| Part and full-time preschool | Not assessed | ✓ |
Differences in Survey Wording
Center-based care and Preschool
Previous research has shown that the percentage of children ages three and four reported by the CPS as being in “nursery school” or “preschool” is similar to the percentage of children reported by the NHES as participating in “center-based care”, which might include day care centers, preschools, prekindergarten, or (Early) Head Start programs.[1] However, it is important to note that survey respondents may not interpret these terms as equivalent. For example, some respondents in the CPS sample may have children in “center-based care” that they would not consider to be “preschool”. These respondents would respond “no” to the CPS item asking whether they have a child in “nursery school” or “preschool”, but “yes” to the NHES item asking whether they have a child in “center-based care”.
Financing of ECE
In the CPS, parents report whether their children attend “public or private school.” In the NHES, parents report whether there is “any charge or fee for this [early care and education] program, paid either by you or some other person or agency.” Although “public” could be thought of as not having a charge or fee (as with Head Start and most state prekindergarten programs located at public schools) and “private” could be thought of as having a charge or fee, the two sets of terms do not always align. For example, local preschools may be “public,” but still require a small fee. Likewise, a private preschool may accept subsidy dollars or other sources of public funding, and some parents may have no or small out-of-pocket co-payments. Therefore, throughout the rest of this section, we preserve the use of “public” and “private” to describe findings from the CPS data and “with payment” and “without payment” to describe findings from the NHES data, recognizing that these terms refer to categories of care that overlap but are not identical.
Definition of Terms
- Center-based care and preschool: To be consistent with language used in the original surveys, this report uses the term “preschool” when describing data collected from the CPS and uses the term “center-based care” when describing data from the NHES.
- Non-center care: For consistency in aggregating, this report uses “non-center care” to include all non-parental care arrangements that are not in a center or preschool setting. This is most often home-based care arrangements with relative and non-relative providers.
- Infants and toddlers: Children under age three.
- Preschoolers: Children ages three and four.
- Poor families: Families with incomes below 100 percent of the Federal Poverty Level (which varies based on family size, and is updated each year). In 2011, the poverty level for a family of four was $23,021.
- Low-income families: Families with incomes below 200 percent of the Federal Poverty Level. In 2011, this represented $46,042 for a family of four.
- Higher-income families: Families with incomes above 200 percent of the Federal Poverty Level.
Overall Participation in Early Care and Education
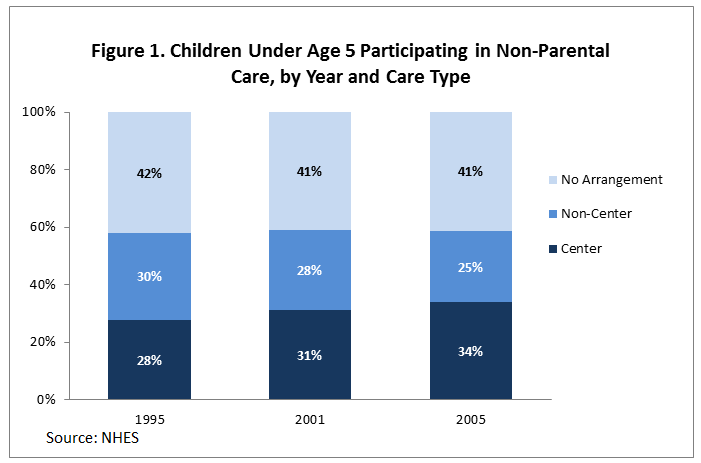
While there was no change between 1995 and 2005 in the overall use of non-parental care, there was an increase in the use of center-based early care and education (ECE), and a corresponding decrease in the use of non-center care, according to the NHES. As shown in Figure 1, center-based enrollment for all children under age five increased by an estimated six percentage points, from 28 percent in 1995 to 34 percent in 2005 (NHES Table 1.8). During this same timeframe, there was a decrease in the use of non-center care arrangements from 30 to 25 percent. The percent of children in any care arrangement (either center or non-center) remained fairly stable across this period, with approximately four out of ten children in no arrangement and six out of ten children enrolled in some non-parental care arrangement.
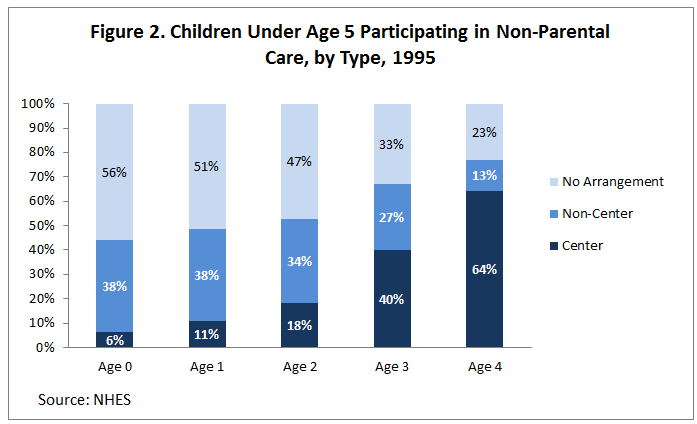
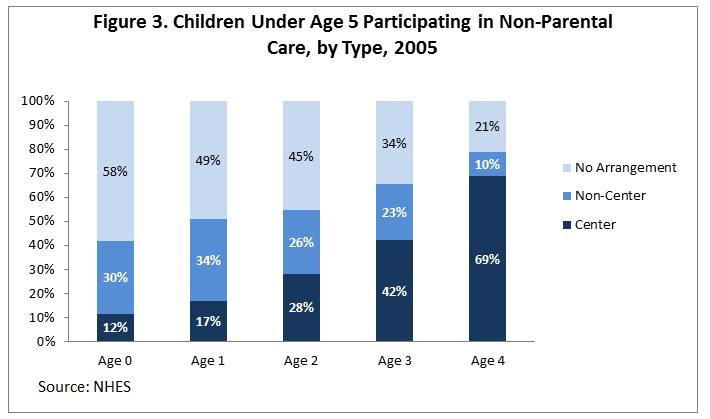
The distribution of children in center, non-center, and no arrangement has consistently varied by child age. As Figures 2 and 3 show, the likelihood that children attended non-parental care increased as they grew older. Whereas over half of children in their first year of life were in some type of non-parental ECE arrangement, by time they reach four years of age, less than a quarter did not attend any ECE arrangement. Similarly, across this time period, children’s enrollment in center care increased with age and their participation in non-center care decreased with age.
The next section of this report will examine how trends in rates of participation in center and non-center care changed over time by child age, family income, and maternal employment status using data from both the NHES and CPS. Further examination of demographic differences in ECE arrangements for preschool-aged children will be explored using CPS data on demographic characteristics such as maternal education, mother’s marital status, mother’s nativity, and race/ethnicity. The subsequent sections also cover the use of private and public ECE by demographic subgroups of children as well as rates of full- and part-day preschool.
Participation in Center-Based Early Care and Education
Child Age
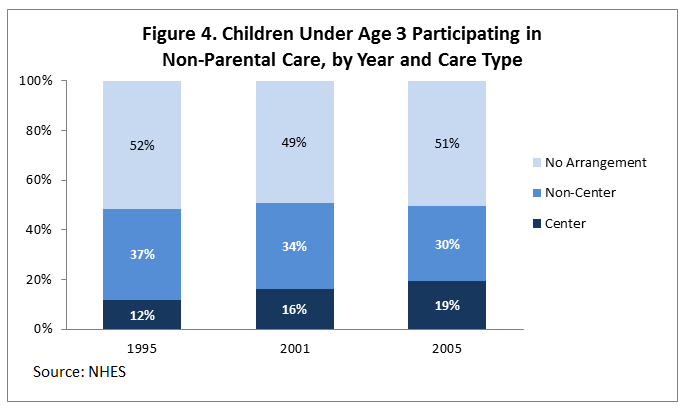
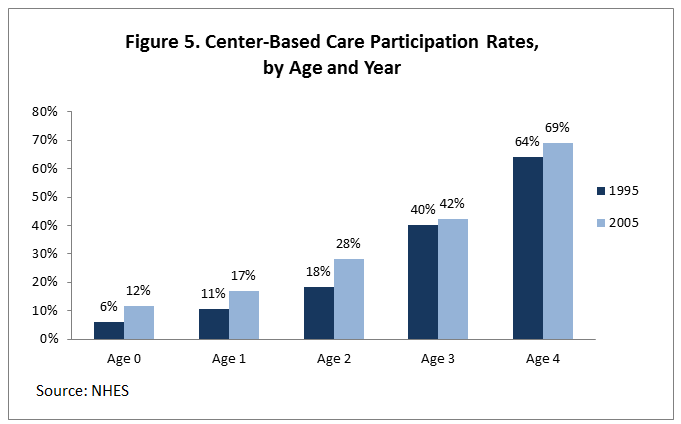
Much of the recent growth in the use of center care occurred among infants and toddlers under age three. As shown in Figure 4, there was a seven percentage point increase (from 12 to 19 percent) in the percent of infants and toddlers in centers between 1995 and 2005. The largest increase in center care occurred among two-year-olds (10 percentage points, from 18 to 28 percent; Figure 5). As Figure 3 shows, by 2005, two-year-olds were equally likely to be in center-based care as in non-center care arrangements.
Figure 5 highlights rates of center care participation from birth to age five and how these rates increased over time. Participation in center care was much higher among preschool-aged children (ages three and four) than infants and toddlers across this time period. However, compared to infants and toddlers, there was a smaller increase in preschooler center care enrollment rates. There was no significant increase in the use of center care among three-year-olds alone, according to either the NHES or CPS, but four-year-olds increased center/preschool enrollment by approximately five percentage points (from 64 to 69 percent according to NHES and 59 to 63 percent according to CPS).
As mentioned above, while rates of center care use increased, there was a corresponding decline in the use of non-center care (see Figures 2, 3, and 4). As might be expected considering the relatively larger increase in center care participation among infants and toddlers, the concurrent decrease in the use of non-center care was also larger for infants and toddlers than for preschoolers. According to the NHES, infants and toddlers experienced a seven percentage point decrease (from 37 percent to 30 percent) in the use of non-center care from 1995 to 2005 (NHES Tables 1.1). The decline in non-center care among preschoolers was only three percentage points (from 20 to 17 percent, NHES Table 1.7). Overall, the data suggest a gradual substitution towards center-based care in place of non-center care for successive cohorts of young children during this period.
Family Income
Like child age, participation in ECE also varied by family income, and the disparity between low- and higher-income children’s enrollment remained relatively stable over this time period. In 2005, children under age five in low-income families (below 200 percent of the FPL) were 18 percentage points less likely to be in any child care arrangement compared to children in higher-income families (above 200 percent of the FPL): whereas 67 percent of higher-income children under age five were in some ECE arrangement, only 49 percent of lower-income children were in any ECE arrangement (NHES Table 1.8).
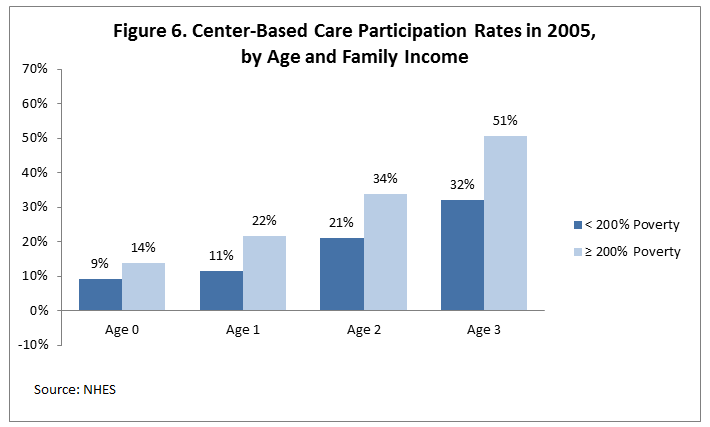
Furthermore, there was a difference in the use of center-based care by family income. Figure 6 shows that in 2005, children at each age from low-income families were less likely to be in center-based arrangements than their higher-income peers of the same age (although this difference was only marginally significant for infants under one year). The income gap in the use of center care was larger for older children across this time period. At each given age between birth and age four, a child from a higher-income family was as likely to be in center care as a child one year older from a low-income family. For example, one-year-olds in higher income families were as likely or more likely to be in center care as two-year-olds in low-income families (22 and 21 percent, respectively). Similarly, higher income two-year-olds were as likely to be in center care as low-income three-year-olds (34 and 32 percent, respectively).
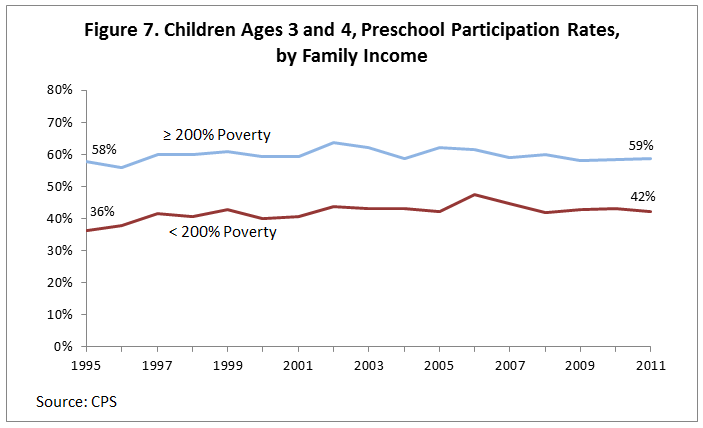
The CPS data confirm this persistent disparity in preschool participation by income among three- and four-year-old children (visible in Figure 7). From 1995 to 2011, preschool participation increased among children in low-income families from 36 percent to 42 percent, but there was no significant change among their higher-income peers (58 to 59 percent; CPS Table 1.6). In 2011, the income gap for preschoolers remained at approximately 17 percentage points.
Maternal Demographic Characteristics
Maternal Employment
We observe in both the NHES and CPS data that children with employed mothers were much more likely than those of non-employed mothers to be in any ECE arrangement, and children with employed mothers were more likely to be in center-based care or preschool. In 2005, nearly four in five children under age five with an employed mother were in an ECE arrangement compared to only one in three children with mothers who were not employed (NHES Tables 2.8 and 3.8). Approximately 42 percent of children under five with employed mothers were in center care that year compared to only 23 percent of children with mothers who were not employed (NHES Tables 2.8 and 3.8).
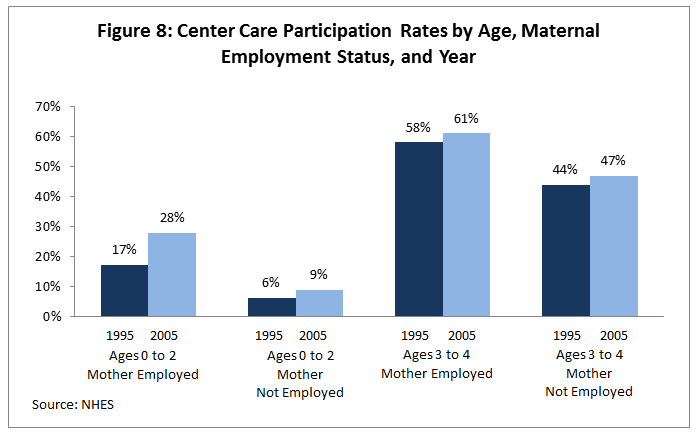
As previous suggested and shown in Figure 8, regardless of maternal employment status, preschool-aged children were more likely to be in center-based care than younger children, and children of all ages increased enrollment in center-based care between 1995 and 2005. However, the largest increase in center-based care occurred among infants and toddlers (under age three) with employed mothers. This group increased enrollment in center care from 17 percent in 1995 to 28 percent in 2005 (Figure 8, NHES Table 2.1). Thus, the gap in center care use for infants and toddlers with employed and non-employed mothers increased from 11-percentage points in 1995 to 19 percentage points in 2005.
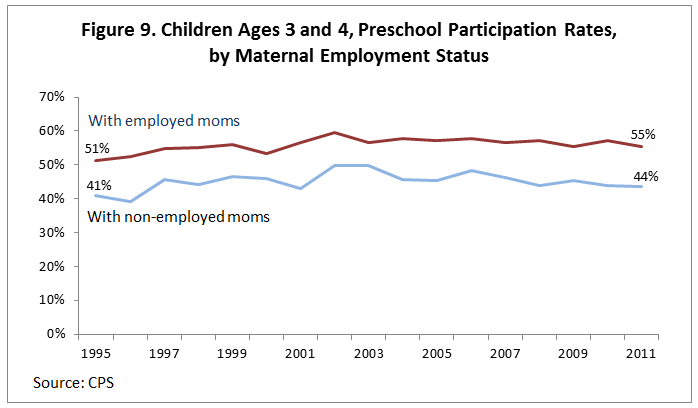
Comparing the two surveys, both the NHES and CPS data indicate that children with employed mothers were consistently more likely to be enrolled in preschool or center care than children of non-employed mothers. According to the CPS, children with employed and non-employed mothers both increased their enrollment in preschool by four-to-five-percentage points and the gap between these groups remained steady at approximately 10-percentage points from 1995 to 2011 (Figure 9; CPS Table 1.2). This sustained gap in center care use between employed and non-employed mothers is slightly higher in the NHES data, but also remains steady at 14 percentage points across this time period (Figure 8).
Maternal Education
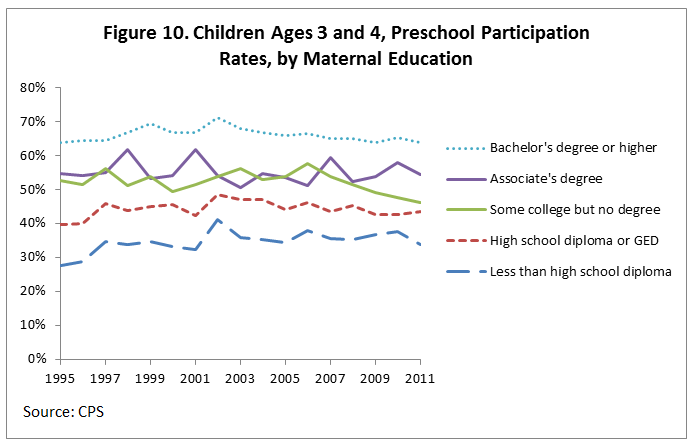
Children with more highly educated mothers were consistently more likely to be in preschool, compared to children with less-educated mothers (Figure 10). In 1995, there was an estimated 35 percentage point difference in preschool participation between children whose mothers had less than a high school education (28 percent) and children whose mothers had earned a bachelor’s degree or higher (63 percent; CPS Table 1.5). In 2011, this difference remained at 30 percentage points: 34 percent of children with mothers who had not obtained a high school diploma were enrolled in preschool, compared to 64 percent of children with mothers who had earned at least a bachelor’s degree.
Maternal Marital Status
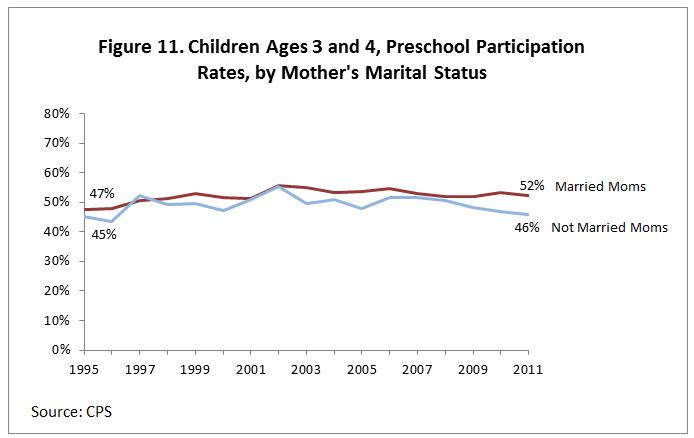
Preschool enrollment by mother’s marital status varied much less than it did by mother’s education or employment status (Figure 11). In 1995, preschool enrollment did not differ between children with married and non-married mothers (47 and 45 percent). The preschool enrollment rates of children with married mothers increased in the recent period, creating a six percentage point gap in preschool enrollment by mother’s marital status by 2011: preschool enrollment of children with married mothers had increased to 52 percent, and enrollment among children with non-married mothers remained at 46 percent (Figure 12; CPS Table 1.4).
Maternal Nativity
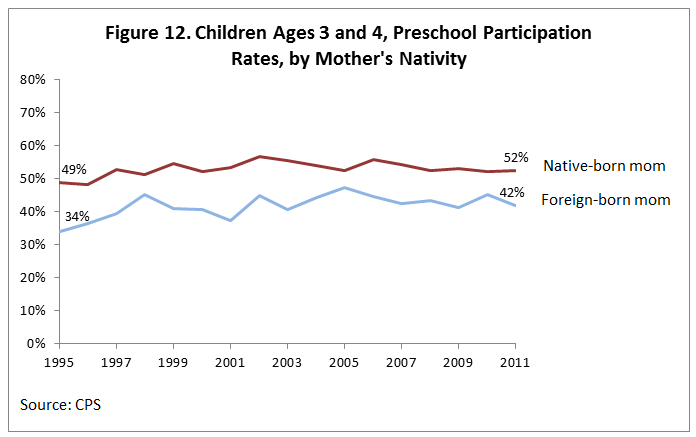
Although children with native-born mothers were consistently more likely to be enrolled in preschool than children with foreign-born mothers, the gap narrowed somewhat from a 15-percentage point difference in 1995 to a ten-percentage point difference in 2011 (Figure 12; CPS Table 1.3). Preschool enrollment for children with foreign-born mothers increased from 34 to 42 percent, and for children with native-born mothers, from 49 to 52 percent.
Race and Ethnicity
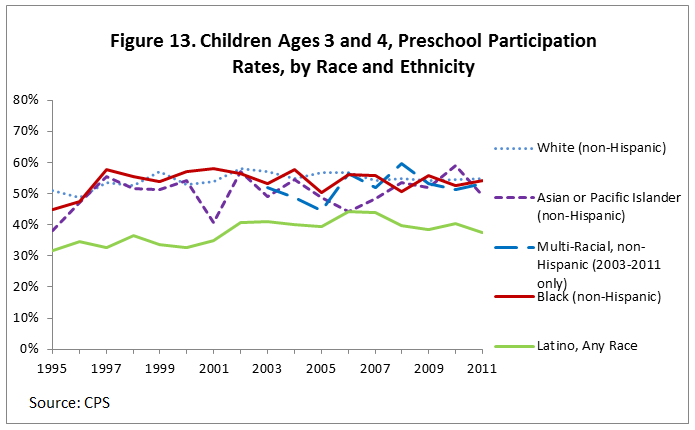
Gaps in preschool enrollment by race and ethnicity were present in 1995 but in some cases disappeared by 2011, according to the CPS data (Figure 13). Preschool enrollment increased among Black children, and the Black-White enrollment gap in 1995 (for three- and four-year-old children) was no longer present by 2011. The Asian-White enrollment gap for three- and four-year-old children was also significant in 1995 but not in 2011. White children’s enrollment in preschool increased from 51 to 55 percent; Black children’s enrollment increased from 45 to 54 percent; and Asian children’s enrollment increased from 38 to 49 percent (the change in Asian children is not statistically significant). While Latino children’s preschool enrollment increased from 32 to 38 percent, Latino preschool enrollment rates remained lower than rates for children of all other racial and ethnic groups (i.e., White, Black, Asian, American Indian/Alaska Native, and multiracial children; CPS Table 1.1).
For both Black and Latino children, the increase in preschool enrollment was driven by four-year-olds. Black four-year-olds increased enrollment rates from 60 percent to 72 percent, and Latino four-year-olds increased from 46 percent to 54 percent. Among three-year-olds, however, there was no discernible increase in preschool enrollment among Black or Latino children (CPS Table 1.1).
Participation in Public and Private Early Care and Education
Not only were there differences in the degree to which families access center and non-center care based on child age, family income, and other demographic characteristics, there was also wide variation in children’s enrollment in public and private early care and education (ECE). This section focuses on trends in children’s attendance in both private ECE for which families pay, and public options that may not require a family financial contribution. Note that to be consistent with survey wording, we use “public” and “private” in referring to the CPS data and “centers with payment” or “without payment” to refer to the NHES data. These definitions are outlined above in our Definition of Terms within the Data Sources and Methodology section of this report.
Child Age
Trends among preschool-aged children
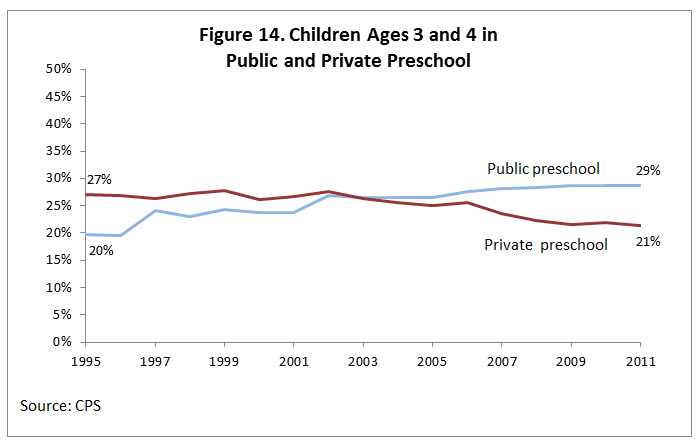
The CPS showed an increase in public preschool enrollment among three- and four-year-old children and a corresponding decrease in private preschool enrollment between 1995 and 2011. As seen in Figure 14, public enrollment rose by nine percentage points from 20 percent in 1995 to 29 percent in 2011. Conversely, attendance in private preschools declined for this group from 27 percent in 1995 to 21 percent in 2011. Meanwhile, the NHES data, which covers only the 1995 to 2005 time period, showed no statistically significant changes in the rate of participation in either centers with or without payments for the same age group. A truncated section of the CPS from 1995 to 2005 (to correspond with the NHES time period) indicated that private preschool enrollment remained unchanged (consistent with NHES data), but it also showed an increase in public preschool enrollment during that time period (not consistent with NHES). Differences in survey wording and sample sizes may contribute to this contrast in the two datasets.
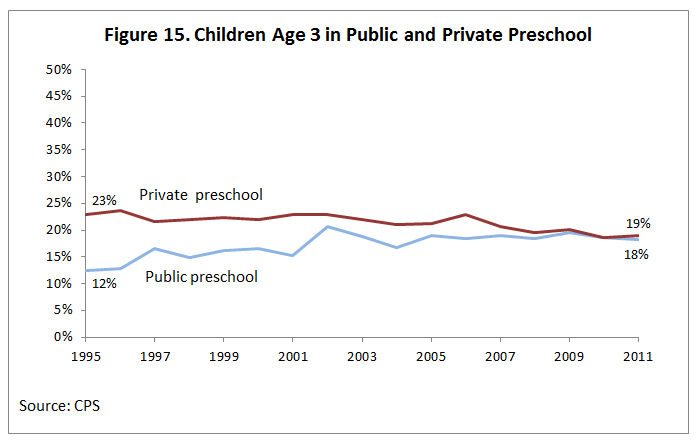
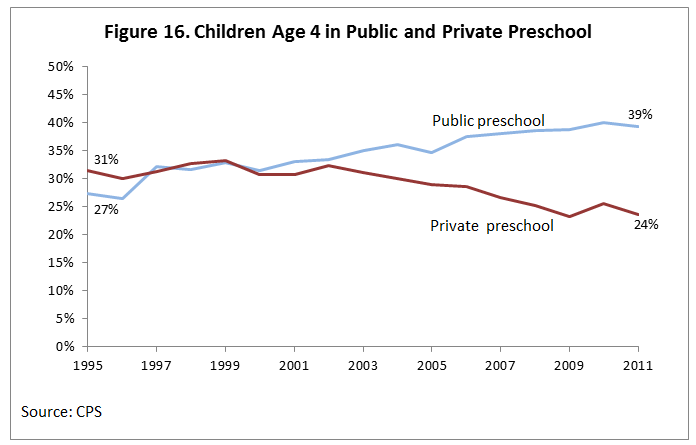
The trending increase in public preschool enrollment counterbalanced by declining private school enrollment found in the CPS data was apparent in each subgroup analyses, including by child age. However, this crossing trend was more pronounced for four-year-olds than three-year-olds. Three-year-olds increased attendance in public preschool by six percentage points from 12 to 18 percent during this time period (Figure 15), and four-year-olds increased by 12-percentage-points from 27 to 39 percent (Figure 16). Private enrollment decreased among three-year-olds by four percentage points from 23 to 19 percent (Figure 15), and by seven percentage-points among four-year-olds from 31 to 24 percent (Figure 16).
As Figure 16 shows, by the early 2000s, four-year-olds were more likely to be in public than private preschool and that spread widened to a 15-percentage point difference by 2011. The rapid increase in public preschool enrollment among four-year-olds that occurred throughout the early 2000s could reflect increasing public investment in prekindergarten during this time.
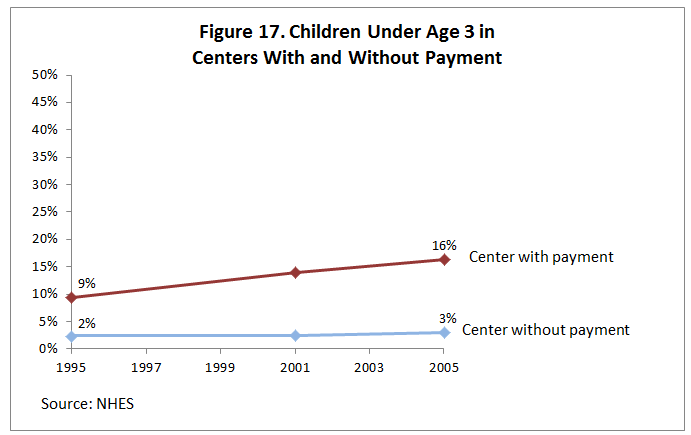
Trends among infants and toddlers
Trends in the use of public and private ECE among children under age three tell an entirely different story (these data are available in the NHES only). As shown in Figure 17, the NHES reported an increase in the use of centers with a family payment for infants and toddlers from nine to 16 percent from 1995 to 2005, and no change in the use of centers without a family payment. The increase in center-based care that occurred among infants and toddlers was driven by increased private enrollment in centers for which families paid. The rate of participation in centers without a family payment remained very low for infants and toddlers across this time period and these trends highlight the lack of availability of public ECE options for infants and toddlers.
Family Income
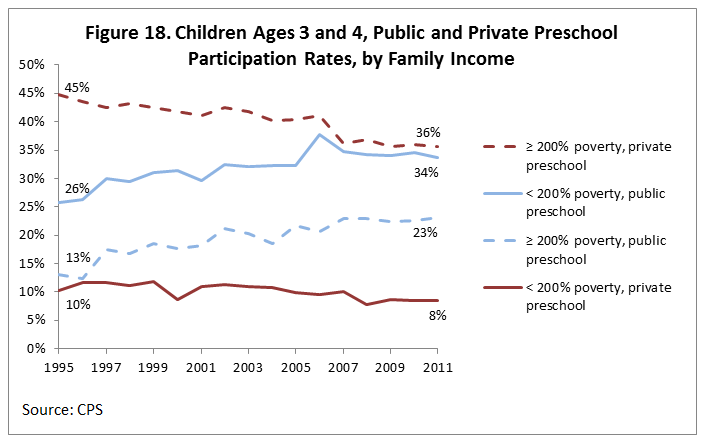
The NHES and CPS both show large stable differences in enrollment in private and public ECE for three- and four-year-old children by family income. At higher levels of income, children were more likely to be enrolled in private centers or those with a family payment than in public centers or those without a family payment. At lower levels of income, the opposite was true: children were more likely to be enrolled in public than private ECE. Figure 18 shows CPS data from 1995 to 2011 on public and private preschool enrollment by family income, highlighting these income trends. Low-income children (solid lines) were more likely to be enrolled in public preschool (blue) than private preschool (red). Whereas among higher-income children (dotted lines), the exact opposite was true: higher-income children were more likely across this time period to be in private preschools.
There was a substantial increase in public preschool enrollment between 1995 and 2011 among three- and four-year-olds in both low- and higher-income families; however, among higher-income preschoolers, there was a net substitution from private to public preschools from 1995 to 2011 (Figure 18). Children in higher-income families made a ten percentage point increase in public preschool enrollment (from 13 to 23 percent) during this time that was offset by a decrease of nearly the same magnitude in private preschool participation (45 to 36 percent). Among low-income preschoolers, there was an eight percentage point gain in public preschool participation (from 26 to 34 percent), but no statistically significant change in the rate of private enrollment. This led to an increase in preschool participation among low-income preschoolers from 36 percent of low-income children enrolled in either public or private preschool in 1995 to 42 percent enrollment by 2011.
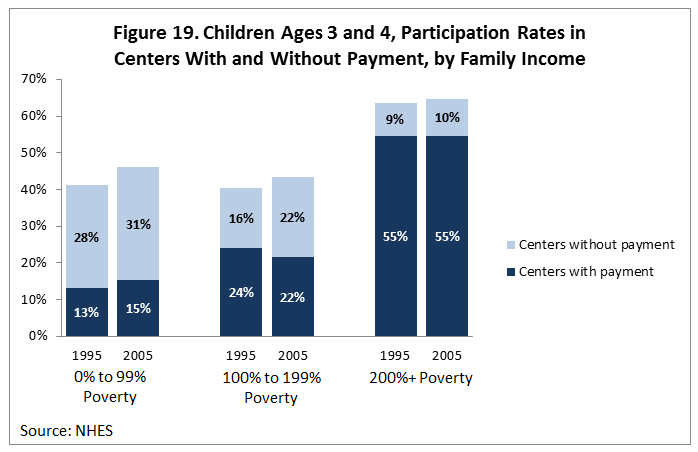
Figure 19 also shows rates of participation in centers with and without family payment, by family income based on NHES data. Most of the children with families above 200 percent of the FPL used paid center care: more than five out of six higher-income children in center care were with a family payment. By contrast, between half and two-thirds of children with incomes below 200 percent of the FPL relied on public or non-paid center care. There was a larger increase in the use of centers without a family payment among children with family incomes between 100 and 200 percent of the FPL (from 16 to 22 percent) than among poor children (below 100 percent of the FPL) and children with incomes over 200 percent of the FPL, for whom there were no statistically significant changes in use of centers without a family payment. While there was an increase in overall preschool participation among children with family incomes between 100 and 200 percent of the FPL, there seemed to be some substitution away from centers with a family payment into those without a payment, similar to the trend we see in the CPS data from private to public preschools.
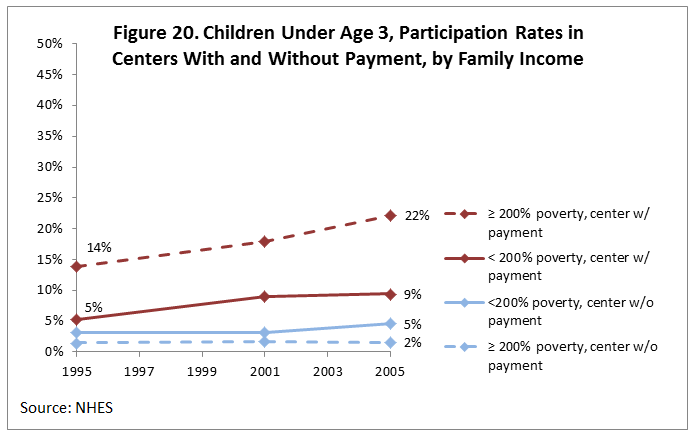
For infants and toddlers, unlike preschool-aged children, center care with a family payment, or private ECE, was more common for both low-income children and their higher-income peers. This may be a result of the relative lack of availability of public ECE options for infants and toddlers. Figure 20 shows that from 1995 to 2005, enrollment in centers with a family payment increased for families both above and below 200 percent of the FPL. For higher-income families, infant and toddler care in centers with a family payment grew rapidly, from 14 percent in 1995 to 22 percent by 2005. Low-income families also increased their use of paid center care in this period, though not as rapidly (from five to nine percent). There was no statistically significant change in the use of centers without a family payment for this age group, as this rate remained very low (5 percent or less) for all subgroups across this period.
Maternal Demographic Characteristics
Maternal Employment
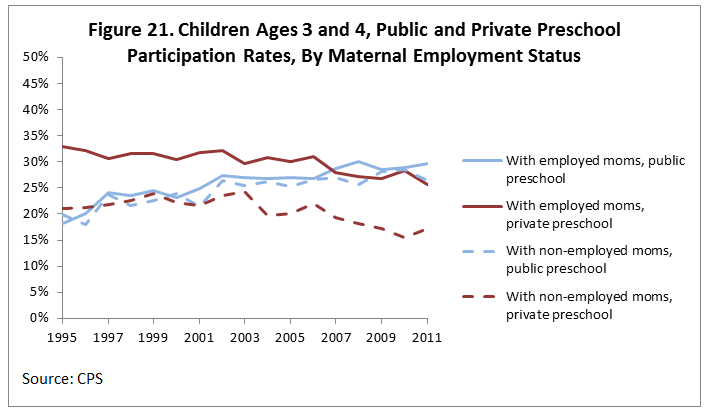
In both the CPS and NHES data, children with and without employed mothers were about equally likely over this time period to attend public preschool/centers without payment (in some years the differences were significant, but still small). However, children with employed mothers were much more likely to attend private preschool/centers with payment compared to their peers with non-employed moms. As shown in Figure 21, both groups increased their attendance in public preschool from 1995 to 2011 (18 to 30 percent for children of employed mothers; 20 to 26 percent for children of non-employed mothers). Private preschool enrollment decreased among both groups in the CPS from 33 to 26 percent of preschoolers with employed mothers and from 21 to 17 percent of preschoolers with non-employed mothers. The NHES, however, showed no changes in preschooler enrollment in either centers with or without family payment for children with employed or non-employed mothers (NHES Tables 2.7 and 3.7).
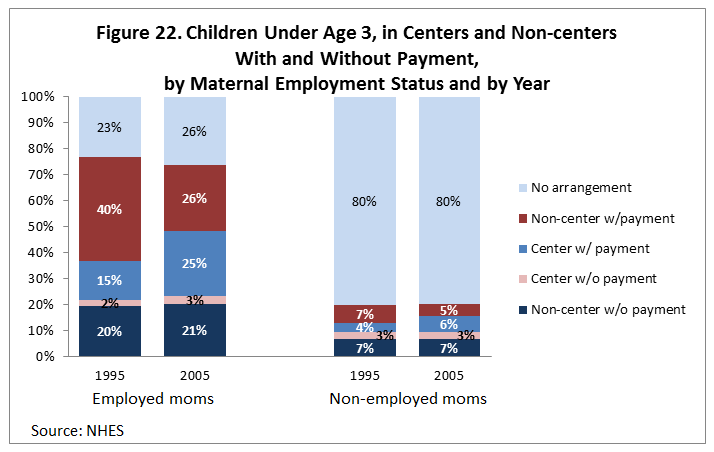
Among infants and toddlers with employed mothers, there was a shift from non-center to center care from 1995 to 2005. This pattern is further broken down in Figure 22, showing that there was an increase in centers with a family payment (from 15 to 25 percent) and a decrease in non-centers with a payment (from 40 to 26 percent). The very low enrollment in centers without a family payment for infants and toddlers aligns with the relatively low supply of public ECE options for this age group. In contrast to the children of employed mothers, there was very little change in the use of paid center care for infants and toddlers with non-employed mothers. This group increased their use of centers with payment from four to six percent and did not change in their use of non-centers with payment. Note that children with employed mothers were about equally likely to be in paid center (25 percent) and paid non-center care (26 percent) in 2005 (NHES Table 2.1).
Maternal Education
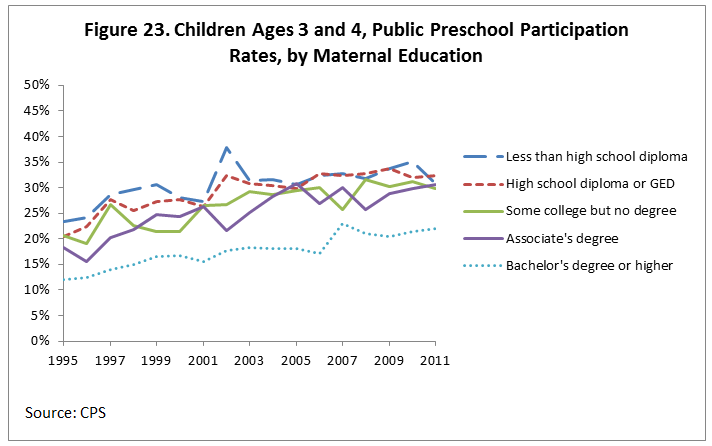
Public preschool enrollment increased at similar rates for children with different levels of maternal education. Over this time period, there was an increase in participation in public preschool of between 8 and 12 percentage points for each of the maternal education categories as shown in Figure 23 ( marginally significant for children of mothers with less than a high school diploma; significant for all other maternal education subgroups). Children of mothers with education levels below a bachelor’s degree had similar levels of public preschool enrollment, and those rates increased from around 20 percent in 1995 to around 30 percent in 2011. Children of mothers with a bachelor’s degree or higher had consistently lower levels of public preschool enrollment.
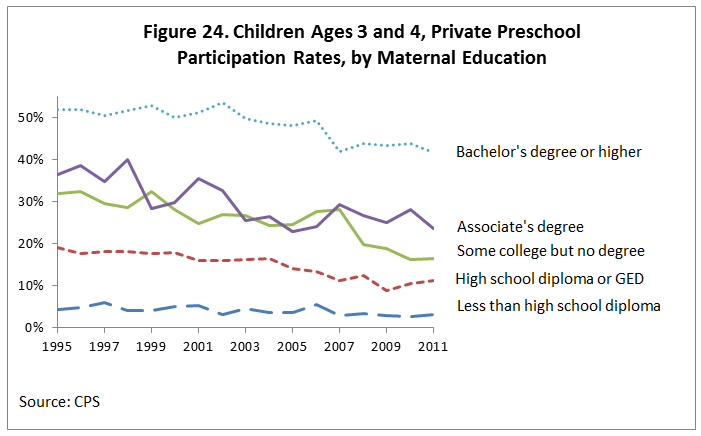
Private preschool participation, on the other hand, was lower at each successively lower level of maternal education, with the exception that there was no difference between associate’s degree and some college (Figure 24). It could be that declining earnings at declining levels of education made families with lower levels of education unable to afford or use private preschool or that mothers with higher levels of education were willing to pay more for their children’s private preschool. While public preschool enrollment increased, there was a decline in private preschool enrollment that occurred for all groups between 1995 and 2011 except for mothers with less than a high school diploma; this group had consistently low levels of private preschool enrollment over time.
Maternal Marital Status
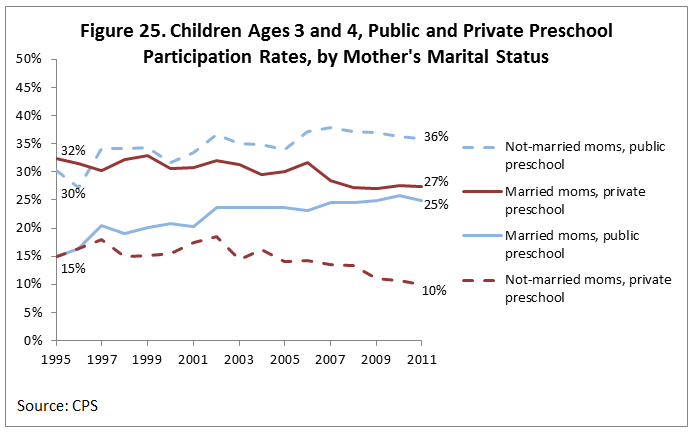
Public preschool enrollment increased for both children with married mothers (from 15 to 25 percent) and for children with non-married mothers (from 30 to 36 percent; marginally significant; Figure 25), although the children of married mothers were consistently less likely to attend public preschool and more likely to attend private preschool than children whose mothers were not married. Private preschool enrollment declined at similar rates for both groups of children (32 to 27 percent for the children of married mothers; 15 to 10 percent for the children of non-married mothers). For children with married mothers, there was a large gap in enrollment rates at public and private preschools in 1995 (15 versus 32 percent, respectively) that narrowed to a small, non-significant gap by 2011 (25 versus 27 percent, respectively).
Mother’s Nativity
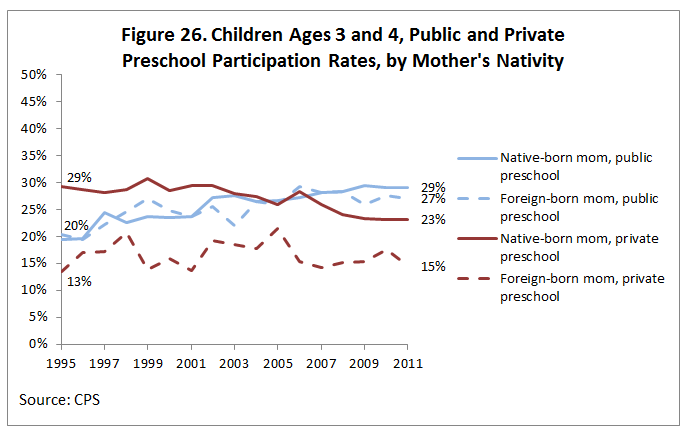
Children with native-born and foreign-born mothers were about equally as likely to attend public preschool, and the increase in public attendance from 1995 to 2011 was similar among these two groups: from 20 to 29 percent for children of native-born mothers and from 20 to 27 percent for children of foreign-born mothers (Figure 26). Children with native-born mothers were consistently more likely to attend private school than children of foreign-born mothers. Private preschool enrollment declined for children of native-born mothers from 29 to 23 percent, but did not change for children of foreign-born mothers (13 to 15 percent).
Race and Ethnicity
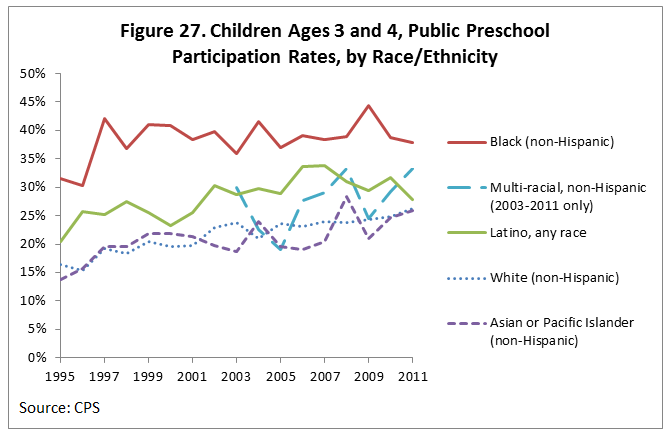
There was an upward trend in public preschool enrollment across all the racial/ethnic groups between 1995 and 2011. Across this time period, public preschool enrollment was highest for Black children, followed by Latino children, followed by White children (Figure 27). Note that these differences were not statistically significant every year, but the overall trend is evident. Asian and White children followed a similar trend across this time period, although the estimate of Asian children’s public preschool participation has greater variance due to a smaller sample size.
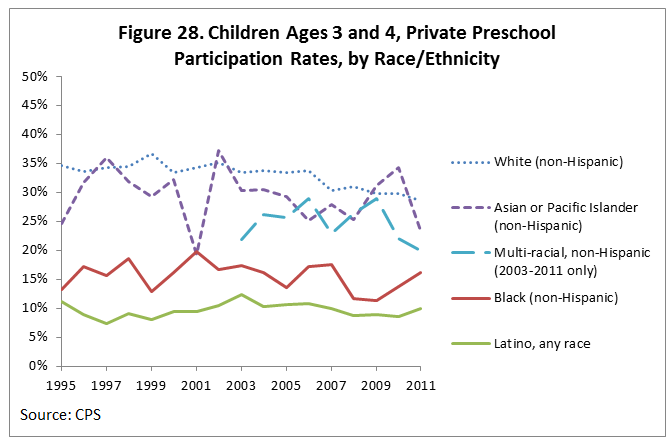
Private preschool enrollment was consistently highest for White children, followed by Asian children, Black children, and finally, Latino children (Figure 28). Private preschool enrollment remained unchanged for Black, Latino, and Asian children, but White children’s enrollment declined from 35 to 29 percent during this time period.
Full- and Part-Day Preschool by Selected Demographic Characteristics
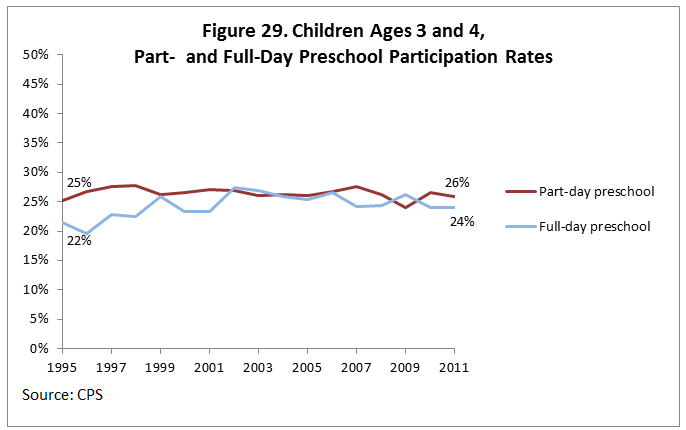
Finally, we examined participation in full- versus part-time preschool enrollment using CPS data. The percentage of three- and four-year old children in part- and full-day preschool were similar and did not change greatly in the period from 1995 to 2011. Full-day preschool enrollment among children ages three and four increased slightly from 22 to 24 percent, while part-day preschool remained unchanged (Figure 29; CPS Table 1.7).
Child Age
Among three-year-olds, full-day preschool enrollment increased from 18 percent to 21 percent, and part-day preschool enrollment changed little from 18 to 17 percent (CPS Table 2.7). Four-year-old enrollment was consistently higher in part-day (33 percent in 1995 to 35 percent in 2011) than in full-day preschool (25 percent in 1995 to 28 percent in 2011). Percent enrollment in part- and full-day preschool remained stable from 1995 to 2011 (CPS Table 3.7).
Family Income
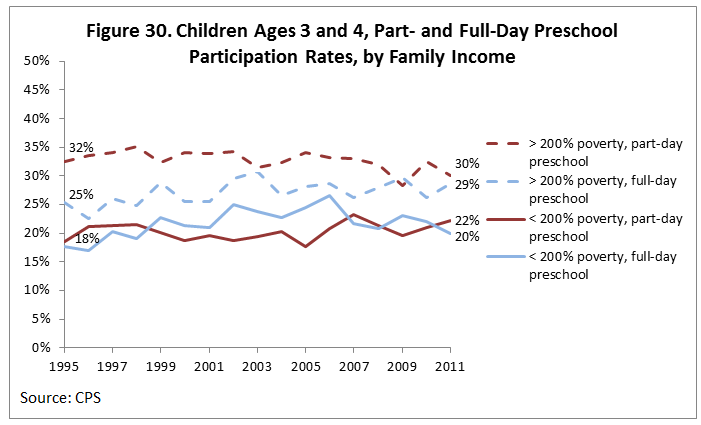
As shown in Figure 30, higher-income children were consistently more likely to attend both full- and part-day preschool than lower-income children. Higher-income children’s full-day preschool enrollment increased from 25 to 29 percent from 1995 to 2011 while their part-day enrollment did not change. Conversely, there was increased enrollment in part-day preschool among low-income children from 18 to 22 percent, but no change in their full-day participation from 1995 to 2011.
Maternal Employment
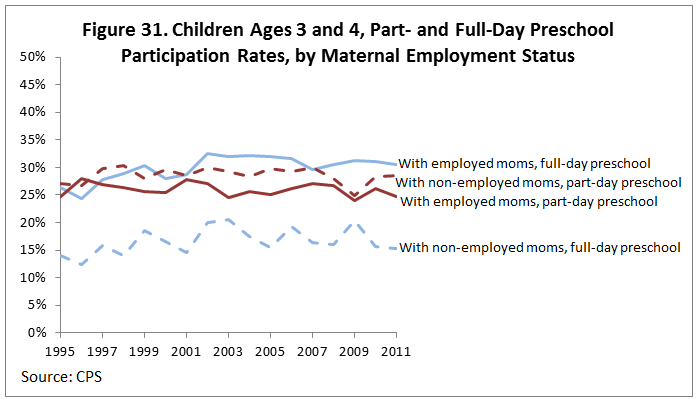
Full-day preschool enrollment increased among children with employed mothers from 26 to 31 percent though there was no change for children of non-employed mothers (Figure 31). Not surprisingly, children with employed mothers were consistently more likely to be enrolled in full-day preschool. However, children with non-employed mothers were just as likely and in some years slightly more likely to be enrolled in part-day preschool than children with employed mothers.
Summary and Conclusion
The period from 1995 to 2011 was marked by much change in the ECE sector, both in the types of care arrangements that families used and in rates of participation in various ECE settings by subgroups of children and families. Two overall trends observed were the increases in the use of public preschool among three- and four-year olds, and the use of center-based care in general.
As public preschool options expanded during the time period studied, in particular for four-year-olds, overall preschool enrollment for this age group increased. Increasing public preschool enrollment and steady private enrollment resulted in a net increase in preschool enrollment among lower-income children. However, increasing public preschool enrollment for higher-income children coincided with decreasing private enrollment, suggesting that higher-income families substituted away from private preschool and into public alternatives.
Over this period, higher-income parents increasingly chose center-based ECE for their children across all ages from birth to age five, particularly for infants and toddlers. However, the percent of low-income infants and toddlers in center-based care did not increase at the same rate as higher-income children. Public options for infants and toddlers remain more limited: in 2012, the Early Head Start program served approximately 150,000 children under age three, whereas over six times as many three- and four-year-olds (approximately 950,000) were served by the Head Start program. An expansion in the supply of high-quality ECE options for low-income infants and toddlers may help to narrow the income and age disparities in their enrollment in ECE programs.
Summary Table: Overall ECE Participation by Demographic Subgroup
| Demographic characteristics | More likely in preschool/center care (comparison group is diametric subgroup, unless otherwise specified) | More likely in private preschool/center care with a family payment (comparison group is diametric subgroup unless otherwise specified) |
|---|---|---|
| Children from higher-income families (CPS & NHES) | ✓ | ✓ |
| Children with employed mothers (CPS & NHES) | ✓ | ✓ |
| Children with more highly educated mothers (CPS) | ✓ | ✓ |
| Children with native-born mothers (CPS) | ✓ | ✓ |
| Children with married mothers (CPS) | ✓ | ✓ |
| White, Black and Asian Children (CPS)* | ✓ | |
| White and Asian Children (CPS) ** | ✓ | ✓ |
* Compared to Latino children
** Compared to Black and Latino children; note that Black children were more likely to be in private preschool than Latino children
Appendices
Current Population Survey Data Tables
Public and Private Preschool Participation by Demographic Characteristics, Children Age 3
Public and Private Preschool Participation by Demographic Characteristics, Children Age 4
Public and Private Preschool Participation by Demographic Characteristics, Children Ages 3 & 4
National Household Education Survey Data Tables
Child Care Arrangements of All Children Ages 0-4
Child Care Arrangements of Children Ages 0-4 with Working Mothers
Child Care Arrangements of Children Ages 0-4 with Non-Working Mothers
References
Bainbridge, J., Meyers, M. K., Tanaka, S., & Waldfogel, J. (2005). Who gets an early education? Family income and the enrollment of three- to five-year-olds from 1968 to 2000. Social Science Quarterly, 86(3), 724-745.
Belfield, C. (2010). Early childhood care and education: Enrollment patterns and expenditures over the decade 1995-2005. Working paper.
Bureau of Labor Statistics. (2012). Retrieved from http://www.bls.gov.
Chaudry, A. (2004) Putting children first: How low-wage working mothers manage child care. New York: Russell Sage Foundation.
Ertas, N., & Shields, S. (2012). Child care subsidies and care arrangements of low-income parents. Children and Youth Services Review, 34, 179-185.
Greenberg, J. P. (2010). Assessing policy effects on enrollment in early childhood education and care. Social Service Review, 84(3), 461-490.
Kinukawa, A., Guzman, L., & Lippman, L. (2004, October). National estimates of child care and subsidy receipt for children ages 0 to 6: What can we learn from the National Household Education Survey? Child Trends Research Brief.
Laughlin, L. (2013). Who’s Minding the Kids? Child Care Arrangements: Spring 2011. Household Economic Studies. U.S. Census Bureau.
Magnuson, K., Meyers, M. K., & Waldfogel, J. (2007). Public funding and enrollment in formal child care in the 1990s. Social Service Review, 81(1), 47-83.
Magnuson, K., & Waldfogel, J. (2012, May). The role of early childhood education in changing income-related gaps in achievement. Paper presented at the Conference on Income, Inequality, and Educational Success. Center for Education Policy Analysis, Stanford University.
NIEER http://nieer.org/publications/presentations/state-preschool-2012-state-p...
Snyder, T.D., & Dillow, S.A. (2012). Digest of Education Statistics 2011. (NCES 2012-001) National Center for Education Statistics, Institute of Education Sciences, U.S. Department of Education, Washington, DC.
U. S. Department of Health and Human Services. (April, 2009). Head Start, Early Head Start Programs to Receive Over $2 Billion in Recovery Act Funding. http://www.hhs.gov/news/press/2009pres/04/20090402a.html