
U.S. Department of Health and Human Services
Nursing Home Divestiture and Corporate Restructuring: Final Report
David Stevenson, Ph.D., David Grabowski, Ph.D., and Laurie Coots, B.A.
Harvard Medical School
December 2006
PDF Version (35 PDF pages)
This report was prepared under contract #HHS-100-03-0033 between the U.S. Department of Health and the MEDSTAT Group. For additional information about this subject, you can visit the DALTCP home page at http://aspe.hhs.gov/_/office_specific/daltcp.cfm or contact the ASPE Project Officer, Susan Polniaszek, at HHS/ASPE/DALTCP, Room 424E, H.H. Humphrey Building, 200 Independence Avenue, S.W., Washington, D.C. 20201. Her e-mail address is: Susan.Polniaszek@hhs.gov.
The opinions and views expressed in this report are those of the authors. They do not necessarily reflect the views of the Department of Health and Human Services, the contractor or any other funding organization.
TABLE OF CONTENTS
- BACKGROUND/SUMMARY OF LITERATURE REVIEW
- The Rise of the Nursing Home Industry
- Changes in Reimbursement Policy
- Bankruptcies of the Major Chains
- Re-emergence of the Industry and New Challenges
- The Nursing Home Industry Today
- Summary
- DATA ANALYSES
- Introduction
- Data and Methods
- Results
- LIST OF FIGURES
- FIGURE 1: Number of Nursing Home Facilities and Beds, United States, 1993-2004
- FIGURE 2: Percent Chain Nursing Home Providers, United States, 1993-2004
- FIGURE 3: Nursing Home Occupancy Rates by Chain and Non-Chain Facilities, 1993-2004
- FIGURE 4: Nursing Home Occupancy Rates by Chain and Year, 1993-2004
- FIGURE 5: Percent Medicare Residents by Chain and Year, 1993-2004
- FIGURE 6: Percent Medicaid Residents by Chain and Year, 1993-2004
- FIGURE 7: Percent Other Pay Residents by Chain and Year, 1993-2004
- LIST OF TABLES
- TABLE 1: Percent of Chain Nursing Homes by Year
- TABLE 2: Total Number of Facilities and Beds by Chain and Year, 1993-2004
- TABLE 3: Number of States in which Chains Operate by Year, 1993-2004
- TABLE 4: Number of Chain-Operated Facilities in Florida by Chain and Year
- TABLE 5: Number of Chain-Operated Facilities in Texas by Chain and Year
ABSTRACT
Over the past two decades, the nursing home industry has experienced changes in the financial, regulatory, and competitive environments. Nursing homes have been greatly impacted by federal and state policies, such as the regulatory reforms of the Omnibus Budget Reconciliation Act of 1987 and the payment reforms of the Balanced Budget Act of 1997. Occupancy rates have fallen in the context of shortened lengths of stay for residents and increased competition from assisted living facilities and other home and community-based care. State Medicaid payment rates vary substantially across states and have gone through periods of relative generosity and parsimony. Nursing home malpractice litigation has increased causing an increase in overall operating costs, especially in a handful of states.
Responding to these and other policy and market factors, the nations largest chains have undergone periods of considerable expansion, contraction, and retrenchment. The role of chain providers, which represent more than half of all facilities, is significant in the nursing home industry, and a recent study by Medstat found that many chains have reacted to recent trends by divesting ownership in certain markets and pursuing other types of corporate restructuring. To investigate these issues further, the Office of the Assistant Secretary of Planning and Evaluation contracted with Medstat and Harvard Medical School to study recent trends in nursing home divestiture and corporate restructuring of the nations largest nursing home chains.
After a review of the literature and analyses of On-line Survey, Certification, and Reporting (OSCAR) data, the final report describes the trends in nursing home ownership by national chains over the past decade and discusses policy implications. The literature review identified the policy and market incentives that led the nursing home industry and especially national chains to expand substantially. The generous cost-based reimbursement policies attracted investment in the industry and encouraged substantial merger and acquisition activities. The review highlighted several challenges that followed when market conditions were less favorable, leading highly leveraged chains to bankruptcy, divestiture, and corporate restructuring.
The outcome of these challenges is a national chain sector that is smaller and differently focused than it was ten years ago. Government financing remains vital, with corporate structure also heavily influenced by factors such as litigation, state reimbursement climates, and geographic considerations. The industry today maintains a moderately healthy capital structure. The industrys re-emergence and relatively better financial condition are attributed to more rational portfolios of nursing home ownership, improved access to capital, and improved Medicare reimbursement.
Guided by the literature review, we set out to describe the nursing home industry and document ownership trends over the last decade. In particular, we analyzed OSCAR data from 1993-2004 to gain a descriptive look at the nursing home industry over time. As with the literature review, our focus was on the characteristics and activities of the nations largest nursing home chain providers. Analyses of these data nationally, within states, and across specific chains, revealed several broad themes. Nationally, nursing home chains have consistently owned or operated half of all facilities. Importantly, these aggregate numbers masked important state and chain-specific trends.
Analysis of large national chains indicated a trend toward consolidation in the industry, exemplified by smaller chains operating in fewer states and, in some states, emergent regional chains replacing the national chains. For example, our analyses documented the strategic withdrawal of national chains from certain key states like Florida and Texas where malpractice litigation has been particularly acute. In sum, these analyses indicated that the nursing home industry over the past decade was a dynamic one marked by expansions, bankruptcies, divestitures and corporative restructuring.
The analyses highlighted several issues for policymakers, stakeholders, and researchers, including areas where further research is needed. Importantly, the analyses show that there is substantial variation across national chain providers in the strategies by which they navigate policy and market conditions. Thus, in researching nursing home chains in comparison to the rest of the nursing home industry, it is important to focus beyond the dichotomous Yes/No of whether a facility is part of a chain and to investigate more about the specific characteristics and practices of the parent company.
Moreover, some of the restructuring and financing trends that were identified have unclear implications for the quality of care received by nursing home residents (e.g., the increased role of Real Estate Investment Trusts in the senior housing market). Although further research into some topics is made difficult by the lack of comprehensive data on facility ownership, further analytic work is ultimately needed to investigate these trends more thoroughly and to analyze whether they have had any impact on nursing home residents quality of care.
INTRODUCTION AND PROJECT OVERVIEW
Over the past two decades, nursing homes have experienced changes in the financial, regulatory, and competitive environments that have influenced the manner in which they do business. Many of these shifts resulted from government policy changes and demonstrate the extent to which the nursing home industry and government are intertwined. The Omnibus Budget Reconciliation Act (OBRA) of 1987 established extensive operating guidelines that are enforced by the Centers for Medicare and Medicaid Services (CMS) through state survey agencies. OBRA guidelines and regulations enacted subsequently shape the manner in which nursing homes provide care, as well as the penalties they face for non-compliance. Nursing homes depend on Medicaid and Medicare for the majority of their financing (66 percent and 13 percent of nursing home residents relied on Medicaid and Medicare in 2004, respectively). Thus, changes in state and federal regulations and reimbursement policies can have a tremendous impact on the nursing home industry. A key example that will be discussed below is the impact of the Balanced Budget Act (BBA) of 1997 and the shift to prospective payment for skilled nursing facility (SNF) care under Medicare.
Intertwined with public policies at the state and federal levels, other environmental pressures have affected nursing homes in recent years. The growth of assisted living and the home and community-based care sector generally has provided increased competition to nursing homes, especially for private paying residents with lower acuity levels. At the same time, nursing homes have cared for higher acuity residents who are often admitted from hospitals for shorter lengths of time. Reflecting these trends, nursing home occupancy rates have fallen substantially over the last few decades.1 Further pressures have been felt due to the emergence of nursing home litigation and the increased costs of general and professional liability insurance. Importantly, these costs have been especially high in a small number of states, such as Florida and Texas.2, 3, 4, 5 Underlying these market and policy factors are broader demographic shifts. Although the United States population is growing older, the need for long-term care services has been less than expected due to declining disability rates.6
Responding to these trends, the role of multi-facility providers in the nursing home industry has changed in recent years. For-profit, chain providers typically have had a large role in the nursing home industry, with more than half of all nursing homes being part of a chain and almost two-thirds of the industry operating on a for-profit basis. These aggregate figures have been relatively stable over time, but they mask substantial changes among the chains and in specific states. In particular, responding to policy, market, and other factors, the nations largest chains have undergone periods of considerable expansion, contraction, and retrenchment. Little has been written about these changes and their implications for nursing home care. Seeking to fill this gap, the Office of the Assistant Secretary for Planning and Evaluation (ASPE) contracted with MedStat and Harvard Medical School to study the role of divestiture and corporate restructuring of nursing homes. The overall objectives of this project were: (1) to describe the extent to which corporate restructuring has occurred among nursing home chains and to identify the states or markets in which this has occurred; (2) to describe factors that have influenced organizational restructuring and divestiture strategies; and (3) to highlight unanswered questions for future research.
The current work builds on previous research also funded by ASPE. Specifically, a recent ASPE-funded study of the nursing home liability insurance market conducted by MedStat found that many nursing homes chains have been reacting to environmental changes by divesting ownership of facilities in certain markets and pursuing other types of corporate restructuring. The tasks of the current project were to review the current literature on the topic and to pursue related analytic work using On-Line Survey, Certification, and Reporting (OSCAR) data. Because of the dominance of the national chains, the study emphasizes their activity in particular. The Final Report, presented here, summarizes the literature review and the analytic findings and concludes with a discussion of the policy implications and areas for future research.
BACKGROUND/SUMMARY OF LITERATURE REVIEW
To provide background information and inform the OSCAR analyses, a key component of the project was the literature review, completed in May 2006. Conducting a review of literature on nursing home divestiture and corporate restructuring presented some challenges. The literature in peer-reviewed and academic journals on the topic is limited; thus, we included additional resources such as business reports, professional and trade journals, newspaper articles, briefings, and conference proceedings. These sources were supplemented by interviews with key stakeholders in the nursing home industry and in the investment community.
The literature review focused on the nursing home industry over the past two decades with a focus on corporate restructuring and divestiture practices among the largest national chains.a Relevant topics included the expansion of the nursing home industry in the 1990s, reimbursement policies and related changes over the study period, widespread bankruptcies among the major national chains, and a discussion of the industry today and the challenges it faces.
The Rise of the Nursing Home Industry
Until the mid 1980s, post-acute care accounted for only a small percentage of total Medicare expenditures, and Medicare dollars were a relatively small portion of nursing facility revenues. The implementation of Medicares acute care hospital prospective payment system (PPS) in 1984, however, created an incentive for hospitals to discharge patients more quickly, leading to a higher acuity case-mix for nursing homes and substantial increases in Medicares spending for SNF care.7 At the same time, Medicares generous cost-based reimbursement provided nursing facilities with relatively generous payments compared to traditional Medicaid-financed nursing home care.8 Moreover, Medicares cost-based payment to SNFs extended to ancillary nursing home services such as rehabilitation therapies and pharmacy services. Under such incentives, nursing homes found they could maximize profits by admitting more Medicare patients with greater ancillary service needs and, often, by increasing their emphasis on ancillary service provision.
Combined with expectations for greater service demand because of population aging, these generous reimbursement policies attracted investments in the nursing home industry by national corporations and Wall Street. For-profit nursing home chains issued public stock offerings and secured generous lines of debt.9 Other creative financing strategies also were employed such as monetizing assets by selling facilities and land to Real Estate Investment Trusts (REITs) that would then lease the facilities back to the operators. By monetizing assets, companies could procure additional capital without more debt appearing on balance sheets.
Over the 1990s, nursing home operators put their supply of capital to use by expanding operations through acquisitions of other nursing homes and by developing or acquiring ancillary service capacity and complimentary lines of business. Conventional wisdom at the time held that larger nursing home chains would benefit from economies of scale through minimizing overhead costs and gaining negotiating clout with vendors, managed care plans, and the government.10 Since certificate of need laws largely inhibited the construction of new nursing home facilities,11 the simplest way to get bigger was sometimes through acquisitions. Rather than using cash from operations to make these purchases, companies increasingly relied on borrowing. As such, nursing home corporations, Wall Street, lenders, and REITs were placing bets that favorable industry trends would continue.
Changes in Reimbursement Policy
After experiencing phenomenal growth during the 1990s, the industry faced several major challenges, most notably the implementation of Medicares PPS for SNFs. In particular, Congress enacted provisions in the 1997 BBA to address the rapid increase in post-acute care expenditures, mandating PPS for SNFs and other Medicare-financed post-acute care. Beginning July 1998 under the PPS, Medicare paid nursing homes a preset, case-mix adjusted per-diem payment that covered all costs, including ancillary services. Beyond the SNF PPS, BBA provisions also included caps on the amount of rehabilitation therapy services that Medicare would pay for in a calendar year, further squeezing companies that owned rehabilitation subsidiaries. Importantly, however, these caps were in place for only short periods of time because of two subsequent moratoria on their enactment.
The impact of the BBA on the nursing home industry was substantial. Implementing PPS required costly administrative changes by corporations at a time when the chains were handling other integration issues stemming from substantial merger and acquisition activities. The payment changes led several publicly traded companies to report disappointing earnings in the period immediately following implementation.12, 13 Beyond the initial transition period, the financial impact of the payment changes was greater than some anticipated. The Congressional Budget Office (CBO) initially estimated that the law would cut payments by $9.5 billion over five years; one year after the law went into effect, CBO revised its estimate to almost twice that amount.14
Bankruptcies of the Major Chains
Many nursing home operators with large financial exposure to Medicare rapidly became distressed. Cuts in Medicare reimbursement were a major reason for the financial troubles facing highly leveraged nursing home chains, and other market forces negatively impacted the industry as well. The Office of the Inspector General and the Justice Department turned their attention to the nursing home industry, exercising increased scrutiny over billing, cost reporting, and patient care practices. Additionally, because of state fiscal crises, Medicaid programs began looking for ways to reduce costs including reducing the rate of increase in nursing home payments. At the same time, the nursing home industry started to face stronger competition from other provider settings, including the assisted living industry.
The confluence of these negative forces proved too much for many providers. Declines in cash flow led almost all of the publicly traded companies to default on their loans, and the distressed companies reportedly had few avenues by which to reverse the trend. Although some companies were able to sell off assets, at greatly reduced rates, bankruptcy was the final option for others. By the fall of 1999, a number of publicly traded companies began to seek protection under Chapter 11 of the bankruptcy code. By 2000, five of the seven largest nursing home operators were in bankruptcy protection (Beverly and Manor Care remained solvent). In each case, the companies attributed this outcome to cuts in Medicare as the primary cause;15 a General Accounting Office report at the time, however, noted that the companies brought some of the repercussions on themselves.16
Re-emergence of the Industry and New Challenges
The companies who sought Chapter 11 protection reorganized during the 2000-2003 period by focusing on core operations such as management and cost control. The nursing home industry also lobbied Congress successfully to restore some funding cuts. The Balanced Budget Refinement Act of 1999 and the Benefits Improvement Act of 2000 improved reimbursement by establishing temporary payment increases from Medicare. Most of these increased payment levels cliffed at the end of 2002, causing some financial stress within the industry. The remaining temporary payment increases were eliminated in 2006 when CMS refined the payment classification system.
Still, even with improved reimbursement from Medicare, most national chains opted to divest and restructure operations. Strikingly, some national chains emerged as smaller, differently focused companies. According to analysts, divestitures typically were driven by three factors, including high malpractice expenses, poor Medicaid reimbursement, and geographic dissonance with other company holdings, all of which could lead particular facilities to under-perform financially.
Nursing home litigation grew dramatically after 2000 and became recognized as one of the fastest growing areas of health care litigation,5 leading to substantially higher liability insurance premiums and overall increased practice costs. To reduce medical malpractice exposure, publicly traded companies began to divest their assets and exit from states with the highest risk.
In January 2001, for example, Beverly announced that it was exiting Florida and other states with higher-than-average malpractice expenses.17 Over a six-month period in 2003, Beverly divested 73 facilities that accounted for 18 percent of the companys revenues but 34 percent of its malpractice expense.17 Other companies followed the same strategy. Genesis, Kindred, Extendicare, and Mariner all exited Florida, and Manor Care has divested some of its assets in the state. Companies also partially or completely exited other states with high malpractice insurance rates, such as Texas, California, Mississippi, Arkansas, and Alabama.17
Although the divestiture trends can be explained partly by malpractice concerns, there were other considerations. Medicaid reimbursement varies considerably across states, and the nursing home industry posits that these payments fall short of costs in some markets.18 Reflecting these factors, some publicly traded nursing home operators shed assets in states with lower Medicaid payment. Between 1999 and 2003, for example, publicly traded companies reportedly divested more than 25 percent of their holdings in states with highly unprofitable Medicaid nursing home reimbursement levels, in states such as Arizona, Delaware, and Massachusetts.17, 18
Finally, companies re-structured assets to concentrate operations in a smaller number of states, a principle some term regional dominance. In particular, operators divested holdings in states where they did not have much presence, reflecting a more conservative strategic approach. Companies can obtain a greater understanding of rules and regulations in a particular state and possibly a greater influence over them as well. Strong regional concentration allows for economies of scale in purchasing and overhead and could enable companies to manage admissions across facilities.
The publicly traded companies sold many facilities to smaller, regional operators who found acquisition prices for these assets attractive. In addition, the smaller companies often had a strong regional presence, so the additional purchases enhanced their geographic strength. For the larger chains, divestitures helped improve their balance sheets and shed under-performing facilities.
As companies emerged from bankruptcy protection, they also benefited from the return of more generous government reimbursement levels. Ultimately, the combination of more rational asset portfolios, greater concentration within regional markets, and better Medicare payments allowed nursing homes to improve their financial condition.
The Nursing Home Industry Today
Today, the nursing home industry maintains a moderately healthy capital structure and strong earnings, according to Wall Street analysts and long-term care executives. While most nursing home companies still generate the majority of their revenues from their nursing home business, some focus has been shifted toward faster growing complimentary businesses such as hospice care, assisted living, and home health. Some divestiture proceeds have gone toward purchasing complimentary businesses, but much has been used to decrease companies debt levels. Publicly traded companies reduced their aggregate debt by nearly $1 billion, or approximately 45 percent, from 2000 to 2004,19 helping the industrys overall financial condition.
Although some companies improved their balance sheets, others still have faced difficulty securing financing from the capital markets over the past five years. Reflecting these difficulties, alternative financing strategies, such as selling real estate assets to REITs, continued to be employed. The degree to which companies rely on REITs varies considerably. In 2004, Manor Care owned 94 percent of its facilities whereas Kindred owned only 3 percent.17 A related trend is that private equity groups recently have purchased nursing homes, in part, to divide the operations from the real estate. Integrated Health Services, Mariner Health Care, and, most recently, Beverly, are examples where equity groups purchased chains with the intention of separating the real estate and operations with the goals of limiting liability and enhancing profitability. While REITs have grown in prominence, the implications for care delivery and quality are unclear.
Summary
In summary, the nursing home industry has gone through a tumultuous two decades. Policy, demographic, and market incentives led the industry to expand substantially in the years leading up to the BBA of 1997. At that time, many nursing home chains were highly leveraged in anticipation of favorable market conditions that ultimately were not sustained. Our review found that the subsequent bankruptcies of major nursing home chains and the reorganization of the industry have resulted in multi-facility companies that are smaller and differently focused than they were ten years ago. Medicare is still vitally important to these companies, but their corporate structure is also heavily influenced by other factors such as litigation, state reimbursement climates, and geographic considerations.
DATA ANALYSES
Introduction
Conclusions and themes from the literature review guided the analytic component of this study. The trends identified through the review indicated areas where more in-depth and detailed analyses were warranted in order to quantify these trends nationally and across the major national chains. In particular, we sought to characterize the expansion, contraction, and reorganization of the nations largest nursing home chains, in some cases relative to the rest of the nursing home industry. In the analyses below, we describe aggregate trends across specific chains and states, chain-specific occupancy rates and payer-mix, and the targeted exit of chains from selected states.
Data and Methods
To analyze trends in the nursing home industry and document ownership trends over the last decade, we analyzed data from the OSCAR system. OSCAR is a longitudinal database containing survey and certification information for providers that are Medicaid and Medicare certified. Nursing homes submit facility, resident, and staffing information. Deficiency data are based on findings from state survey agencies and entered by these agencies when nursing homes do not meet federal regulatory standards. OSCAR data are collected through regular surveys every 9-15 months, and these data are submitted to CMS. Data from the years of 1993-2004 were obtained for this project; these data were cleaned and merged to pursue the analyses. Facilities included in OSCAR data account for almost 96 percent of all nursing homes nationwide, and provide a comprehensive snapshot of the industry as a whole. Facilities not certified by Medicare and Medicaid (e.g., private pay facilities) are not included in the OSCAR dataset.
To create the longitudinal analytic file, we merged OSCAR data from 1993-2004 for each facility. Specific variables, such as the address text fields, were cleaned to ensure the tracking of individual facilities over time. The final longitudinal analytic file contained a total of 197,787 records, where each record represents one facility survey observation, and approximately 800 variables.
We grouped facilities into particular multi-facility organizations (or chains), assigning numeric identifiers based on the Name of Multi-Facility Organization free-text field (item F14 of CMS form 671). OSCAR defines a multi-facility organization as an organization that owns two or more facilities. The owner may be an individual or a corporation and this definition includes leasing of facilities by corporate chains. Of the 197,787 OSCAR records, 53 percent (n=104,495) had multi-facility ownership indicated; we coded 42 percent (n=43,747) of these records into 84 of the largest national chains.
Because the CMS-issued provider identification numbers used in the OSCAR do not uniquely identify facilities (which we define as a specific bricks and mortar location), unique facility identifiers were created based on a combination of variables, including the CMS-issued provider identification numbers, address fields, survey dates, and facility size. A total of 25,193 unique facility identifiers were created and added to the analytic file. These facility identifiers were used to generate annual nursing home counts for the analysis in combination with survey date. Because OSCAR surveys are required every 9-15 months, an algorithm was needed to ensure that the most accurate estimates were obtained. The average facility is surveyed every 12 months (mean=373 days), making it possible that an operating nursing home may not have been surveyed or that it was surveyed more than once during a particular calendar year. To address these issues in our facility counts, we added a two-year window around each survey date to count facilities while systematically addressing duplicates and closed facilities. Unadjusted counts for 2003 and 2004 are tentative because they do not remove facilities that may have closed; it is possible that these data are incomplete and that additional data from these years will be included in the 2005 data file. Where noted, we adjust the national number of facilities in 2003 and 2004 based on previous closure rates observed in the data.
Results
Description of Nursing Home Industry and Chain Presence. Figure 1 provides an overview of the nursing home industry at the national level from 1993-2004. Industry bed capacity increased from 1,658,420 beds nationally (15,450 facilities) in 1993 to peak in 1998 with 1,861,925 beds (17,355 facilities), before declining slightly to 1,734,735 beds (15,915 facilities) in 2004. Focusing on more recent years, the relative decline from the industry peak in 1998 to 2004 was a 7 percent and 8 percent decline in beds and facilities, respectively. Across the study years, there were approximately 16,700 nursing homes and a corresponding 1.8 million nursing home beds on average. Not surprisingly, states differed considerably in the size of their nursing home industries. Facilities in California, Texas, and Ohio alone accounted for almost 23 percent of all facilities nationwide in 2004 (not shown).
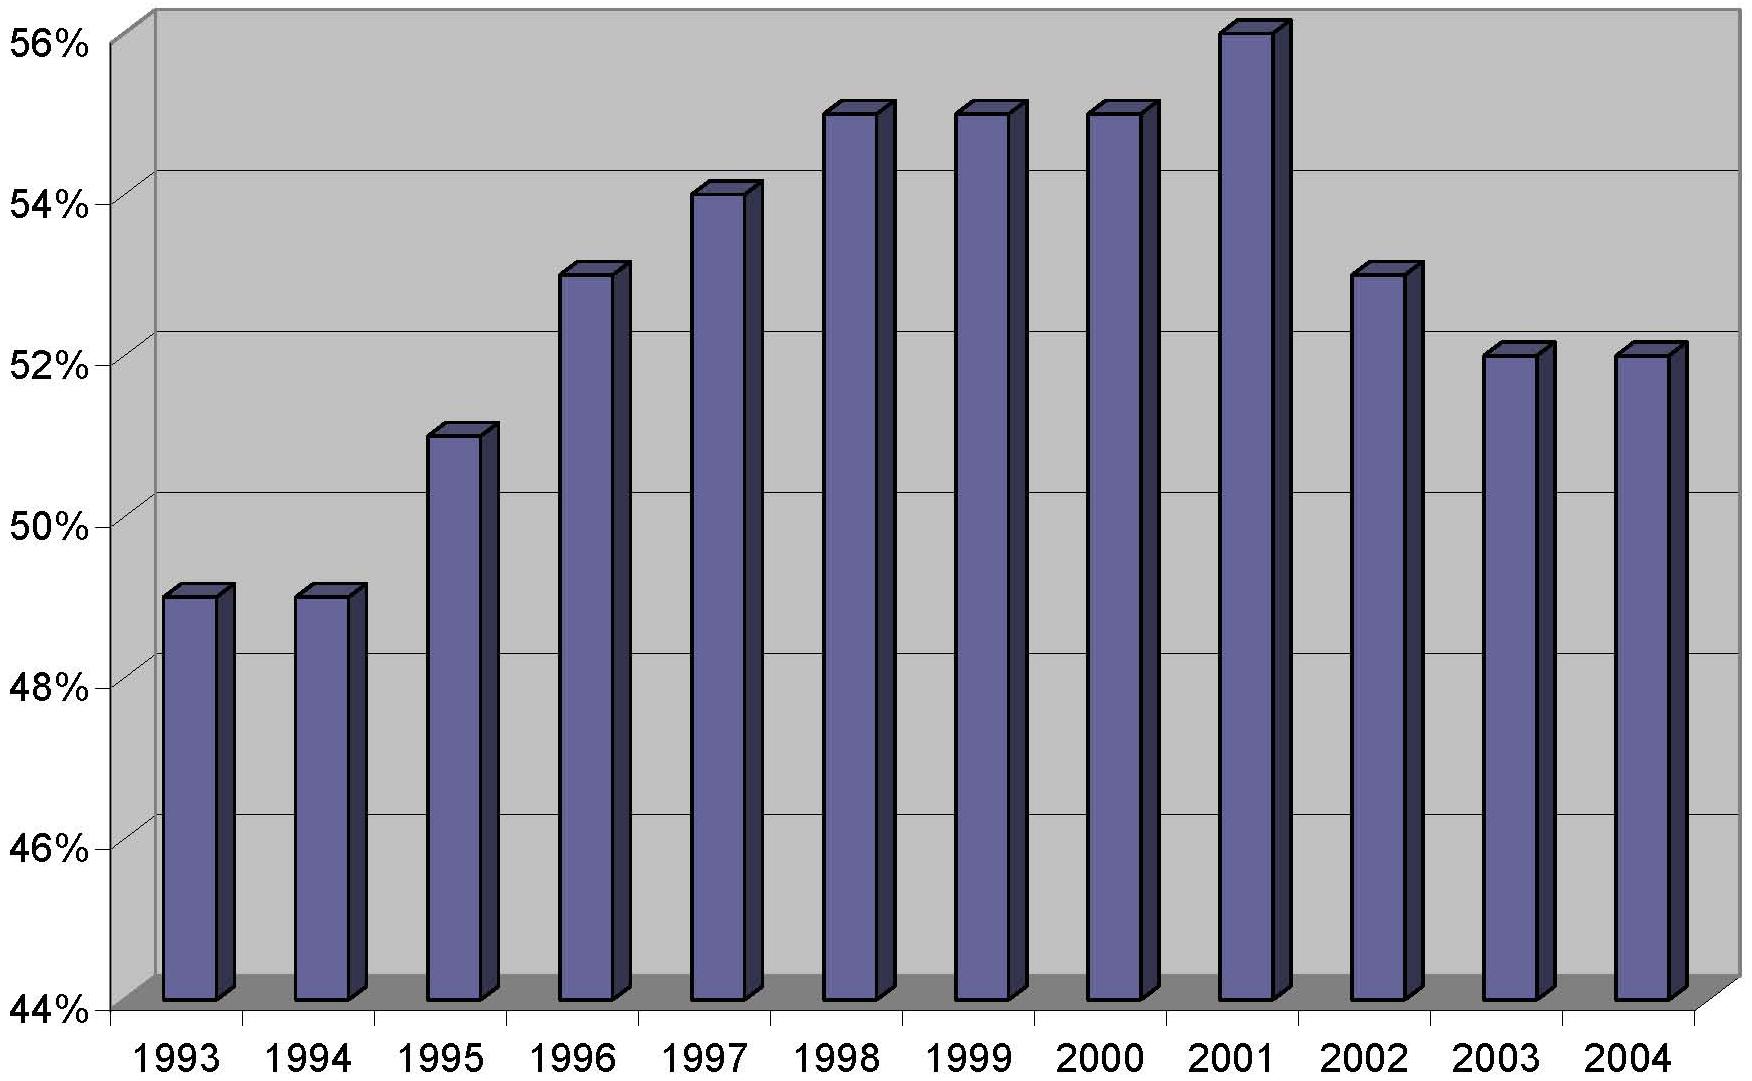
Figure 2 shows the percent of chain providers over the study period. Similar to bed capacity, the percent of facilities operating as chains increased from its 1993 level of 49 percent to peak in 2001 at 56 percent, before declining slightly in 2004 to 52 percent. Although this percentage varied across states, ranging from 10-73 percent in 2004, it was generally in the 40-60 percent range for states across the study years (not shown). Table 1 displays these data in tabular form and also includes the proportion of chain facilities owned by the major nursing home chains. The proportion of chain facilities owned by the largest (or top) five and ten chains averaged 16 percent and 24 percent, respectively, over the study period.
Table 2 provides an introduction to the major chains by highlighting the top ten nursing home chains (based on number of facilities) in any study year, for a total of 20 chains. Importantly, many of the chains listed have undergone organizational changes such as mergers, bankruptcies and divestitures over the study period, some of which are detailed in the text-box below.
Summary of Mergers, Bankruptcies, and Purchases (1993-2004)
- HCR merges with Manor Care in 1998.
- Paragon and Mariner merged in 1998 and were named the Mariner Post Acute Network.
- Hillhaven facilities were acquired by Vencor.
- Vencor filed for bankruptcy in 1999 and re-emerged as Kindred in March 2001.
- In 1994, Columbia and HCA merged into Columbia/HCA.
- Horizon/CMS facilities were purchased by Integrated Health Services.
- Integrated Health Services went bankrupt and their facilities were taken over by Trans Healthcare in 2000.
- Sun Healthcare went bankrupt in 1999 and emerged in 2002.
- Genesis went bankrupt in 2000 and emerged in 2001.
- Mariner went bankrupt in 2000 and later merged with National Senior Care in 2004.
Beverly Enterprises was consistently ranked as the largest chain on both number of facilities and beds across study years, despite having less than half as many beds in 2004 as in 1993. The table notes the bankruptcy of Vencor and its re-emergence as Kindred. Also included is the 2001 merger of the Health Care and Retirement Corporation (HCR) with Manor Care, which has become one of the largest nursing home chains in the country. Finally, the table notes the exit of three major chains, Hillhaven, Horizon/CMS Health Care, and Unicare Health Facilities. Although trends in size varied across companies, several chains have become smaller in recent years, including Beverly, Kindred, Mariner, Genesis, and, perhaps most strikingly, Sun Healthcare.
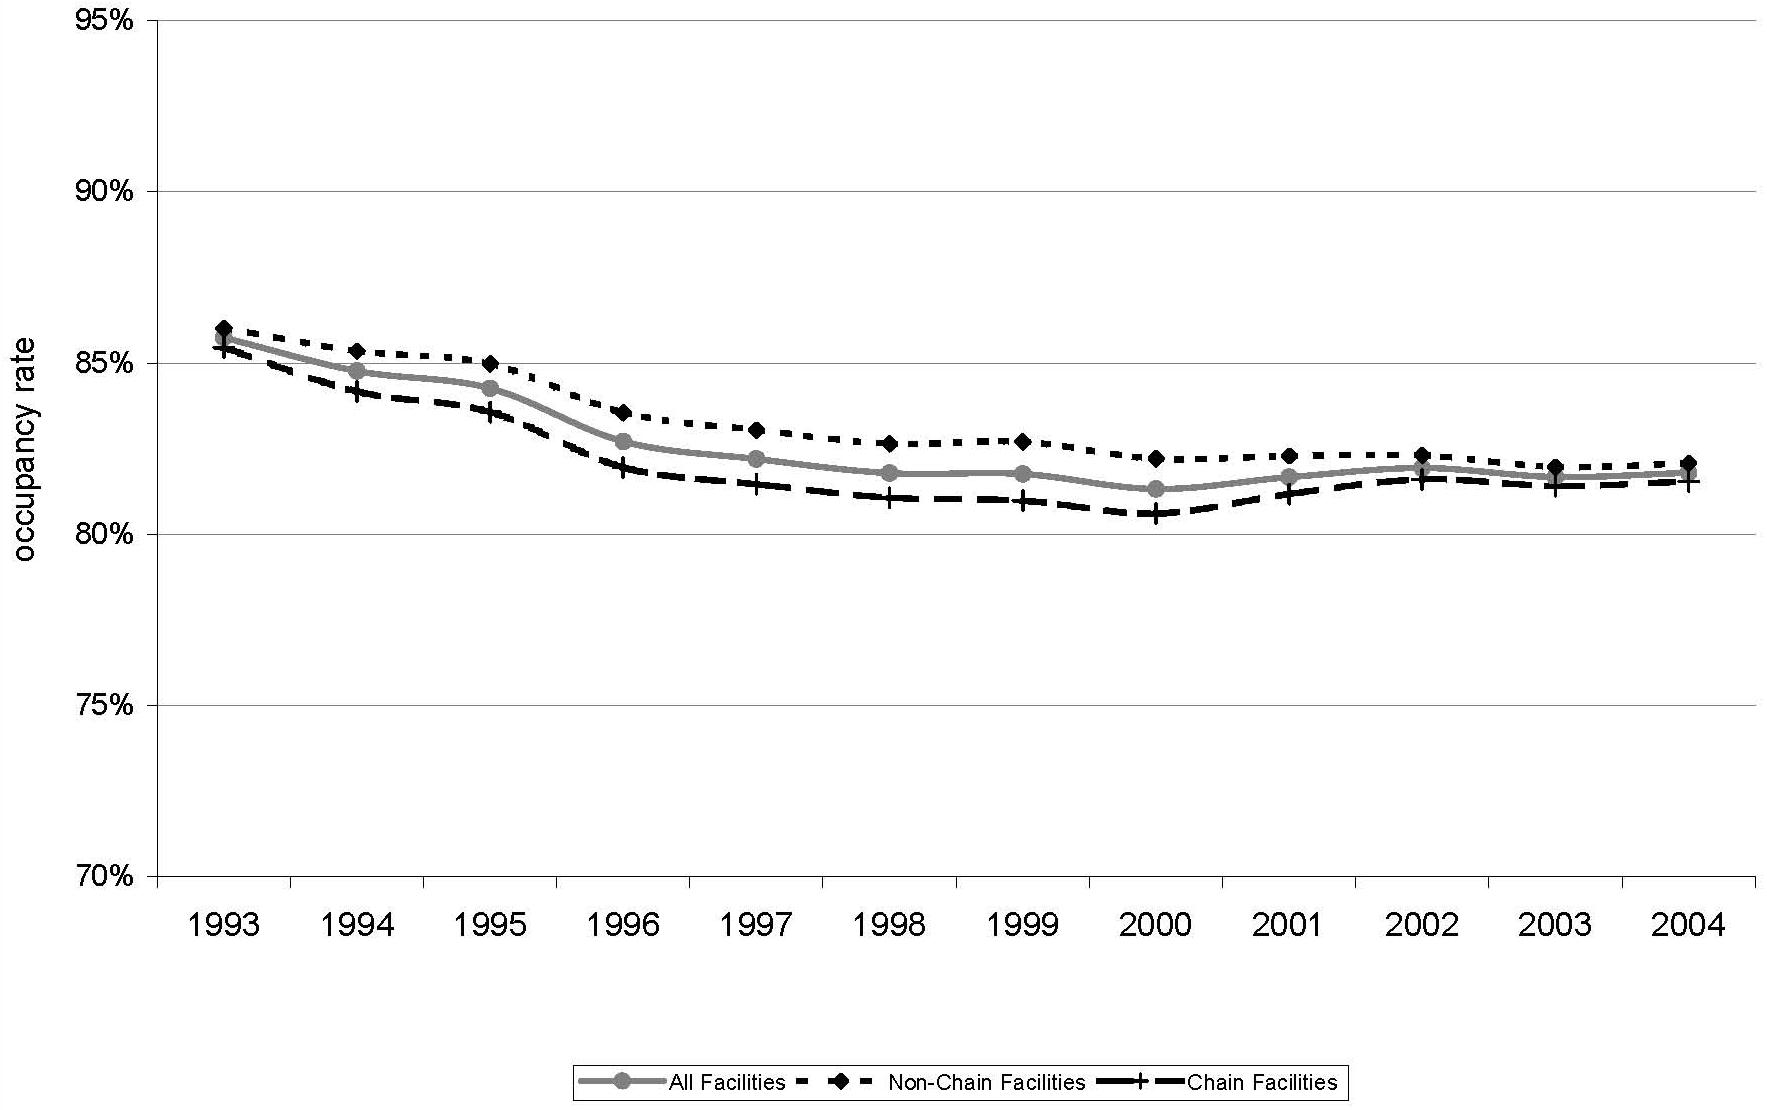
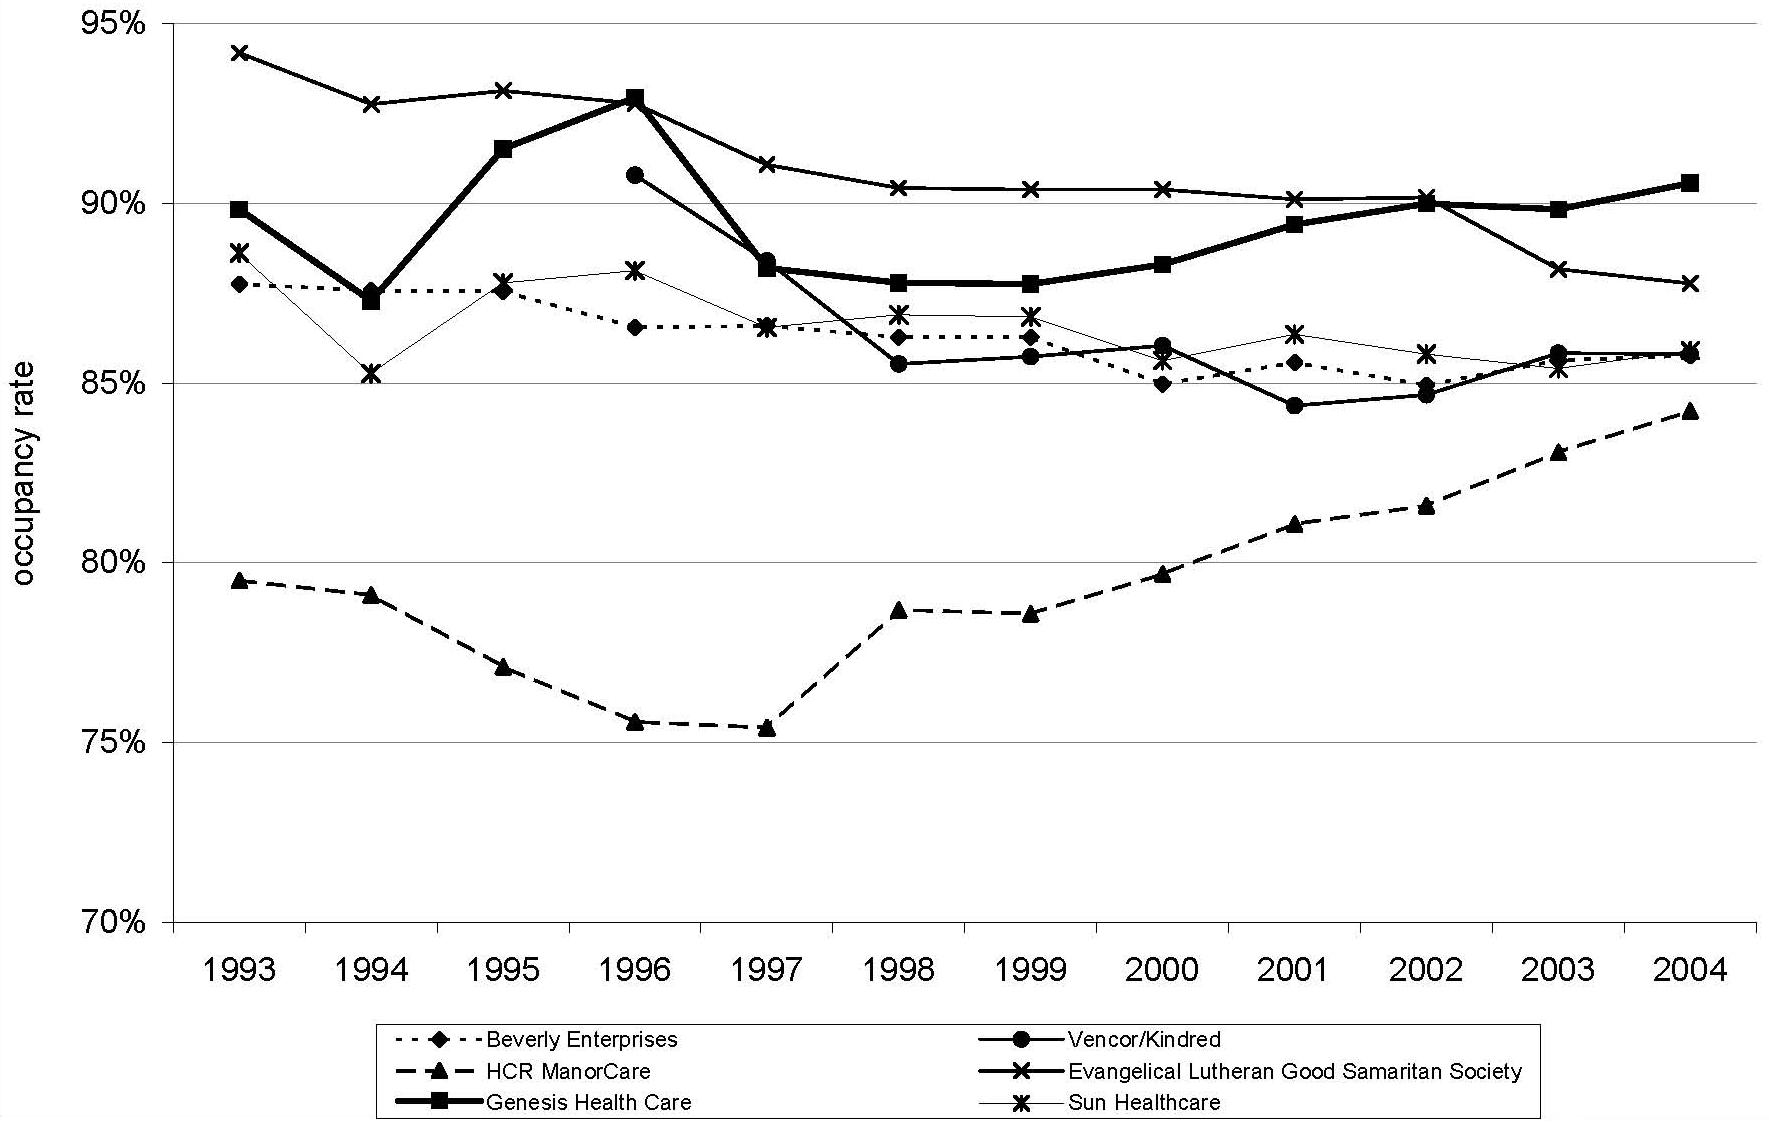
Figure 3 displays national occupancy rates, illustrating differences by chain and non-chain ownership. Defined as the number of total residents divided by the number total number of beds (both of which are facility-reported in OSCAR), occupancy rates have decreased between 1993 and 2004. In 1993, the rate was 86 percent which decreased to 82 percent in 1997 and has remained relatively stable since then. Differences in occupancy rates among the national chains are illustrated in Figure 4. The largest nursing home chains generally have maintained higher occupancy rates than the national averages with the exception of HCR Manor Care which -- until more recent years -- had lower than average occupancy rates.
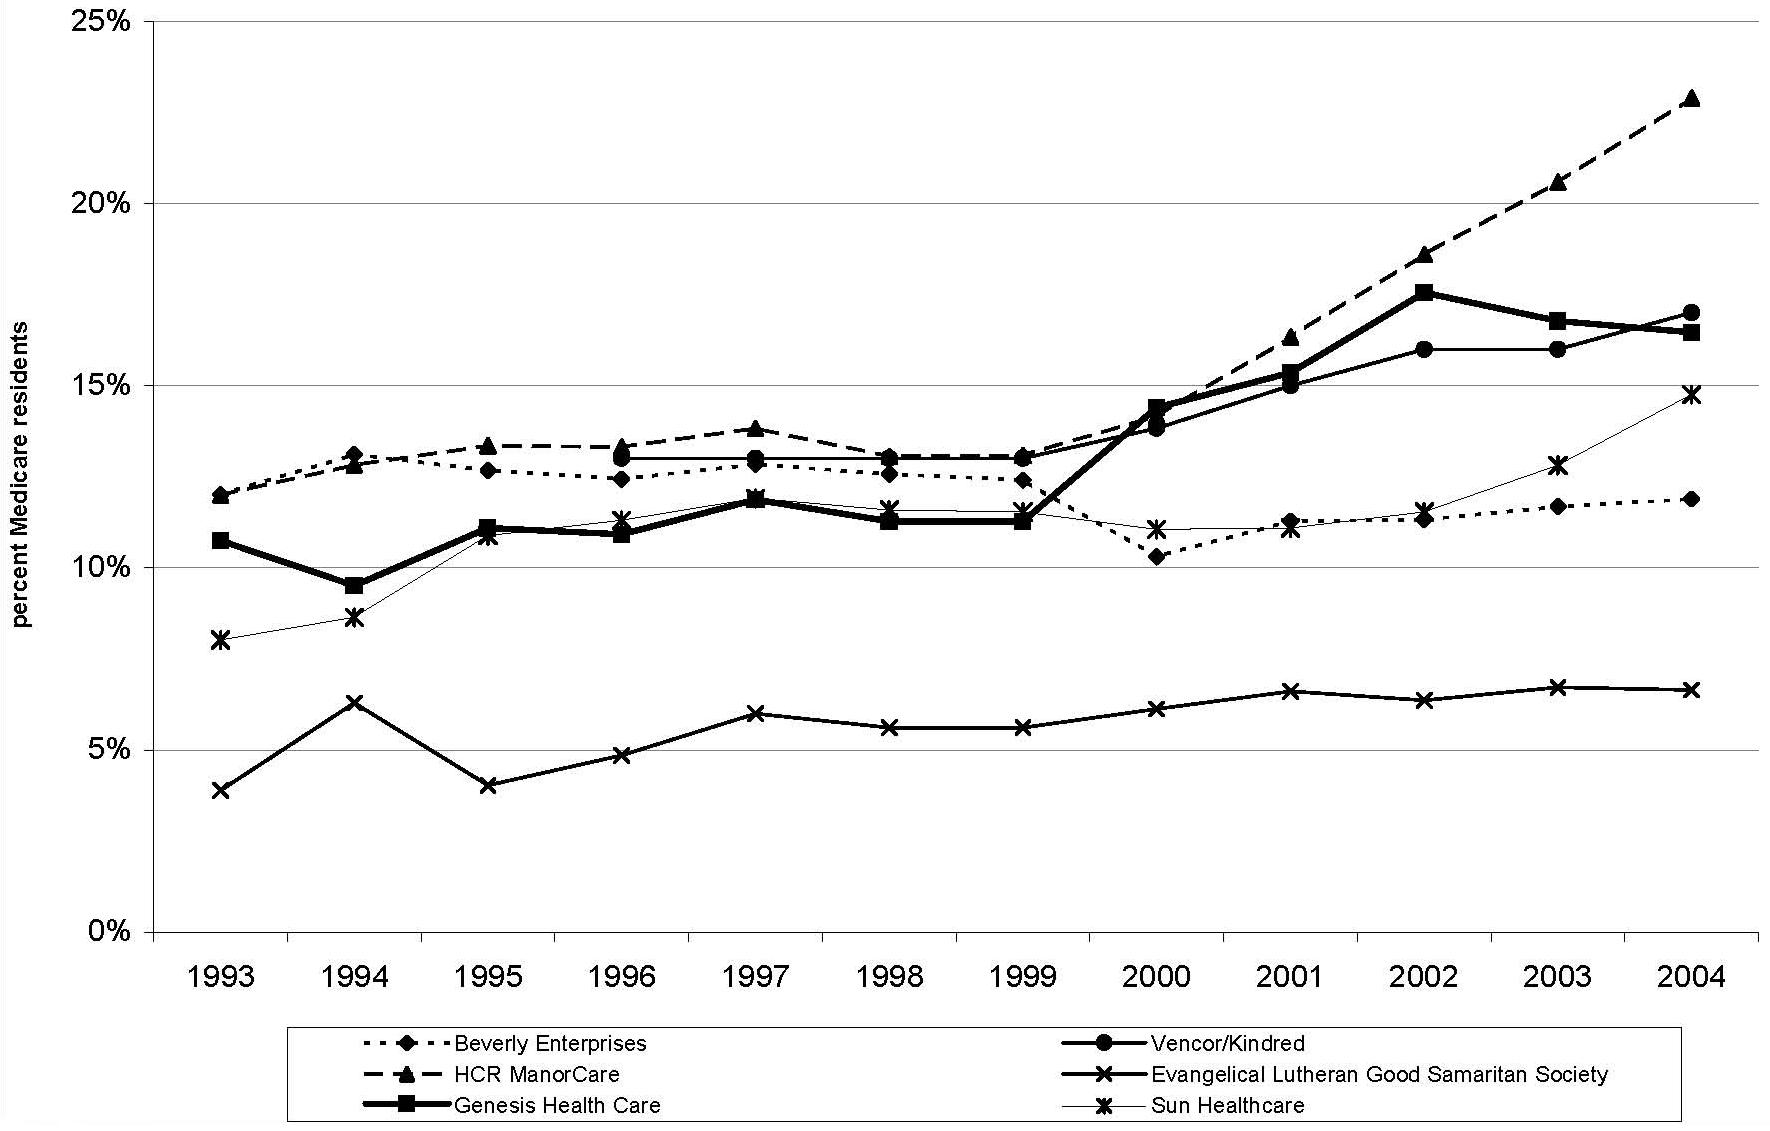
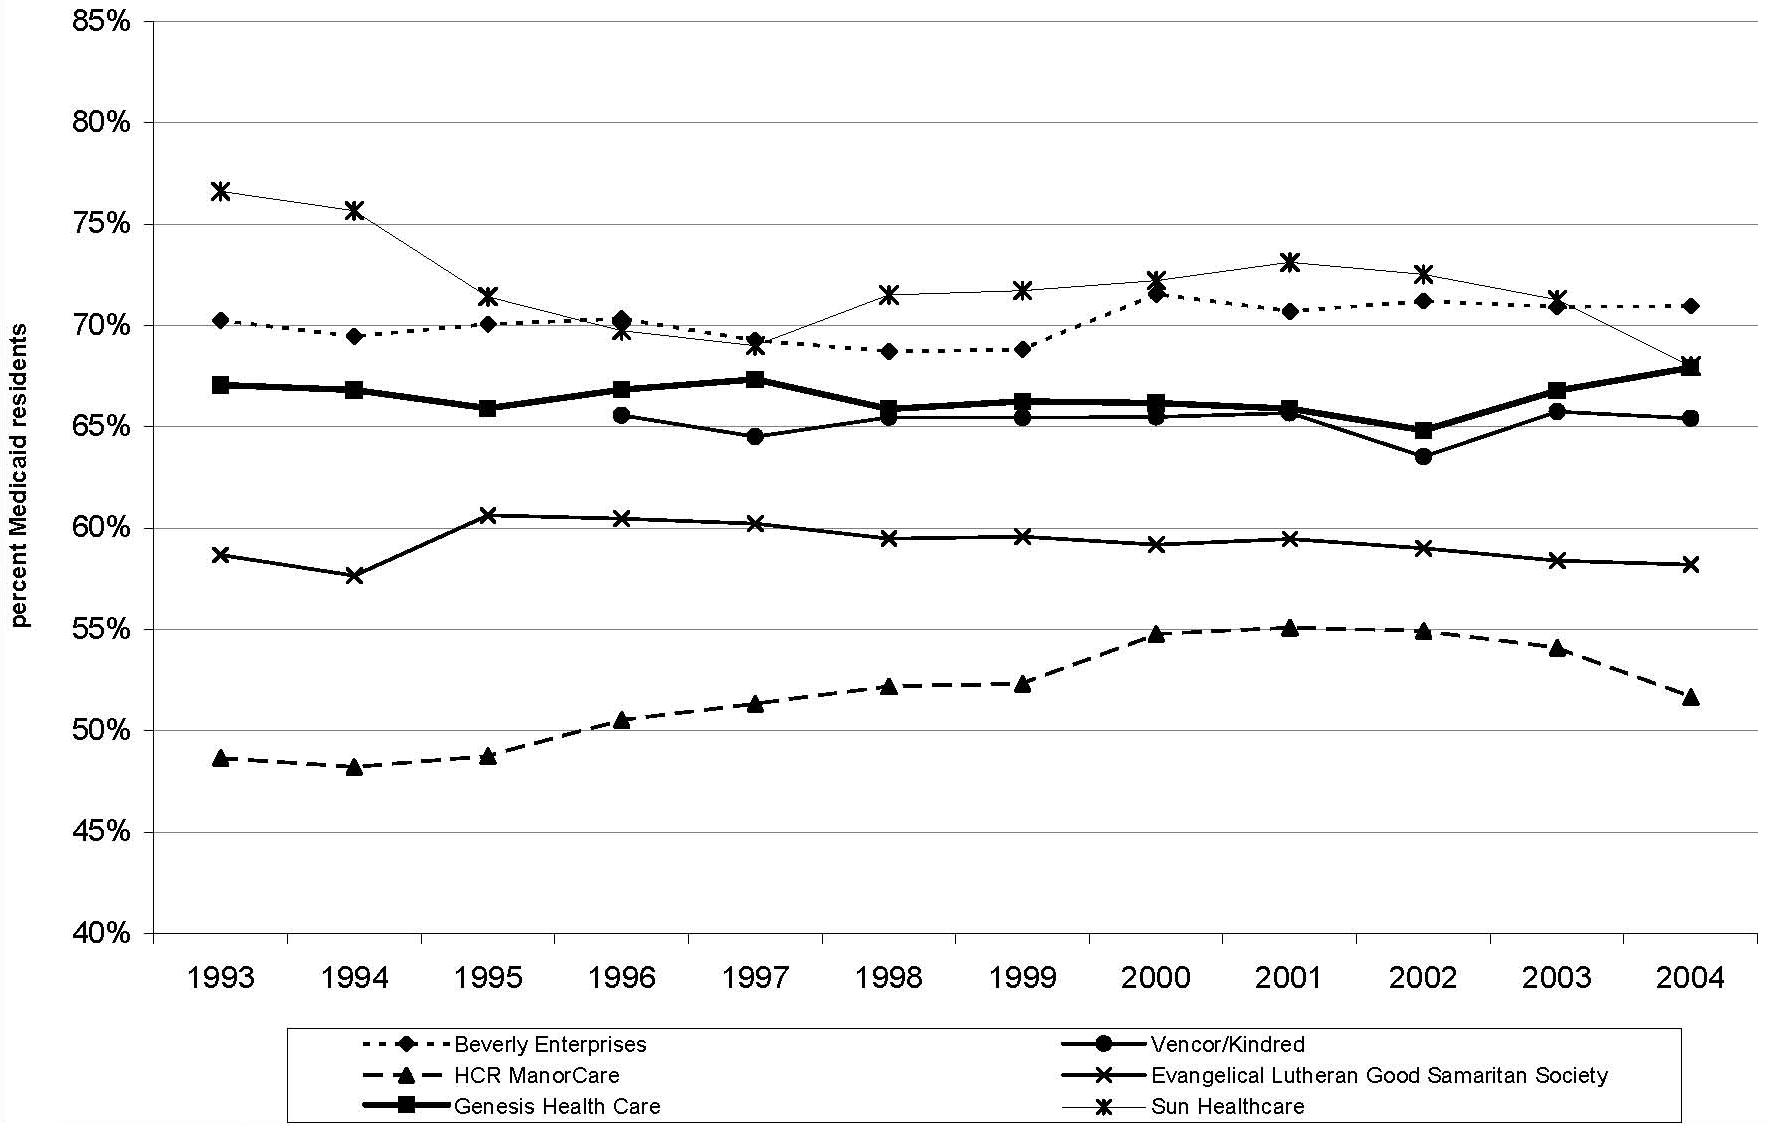
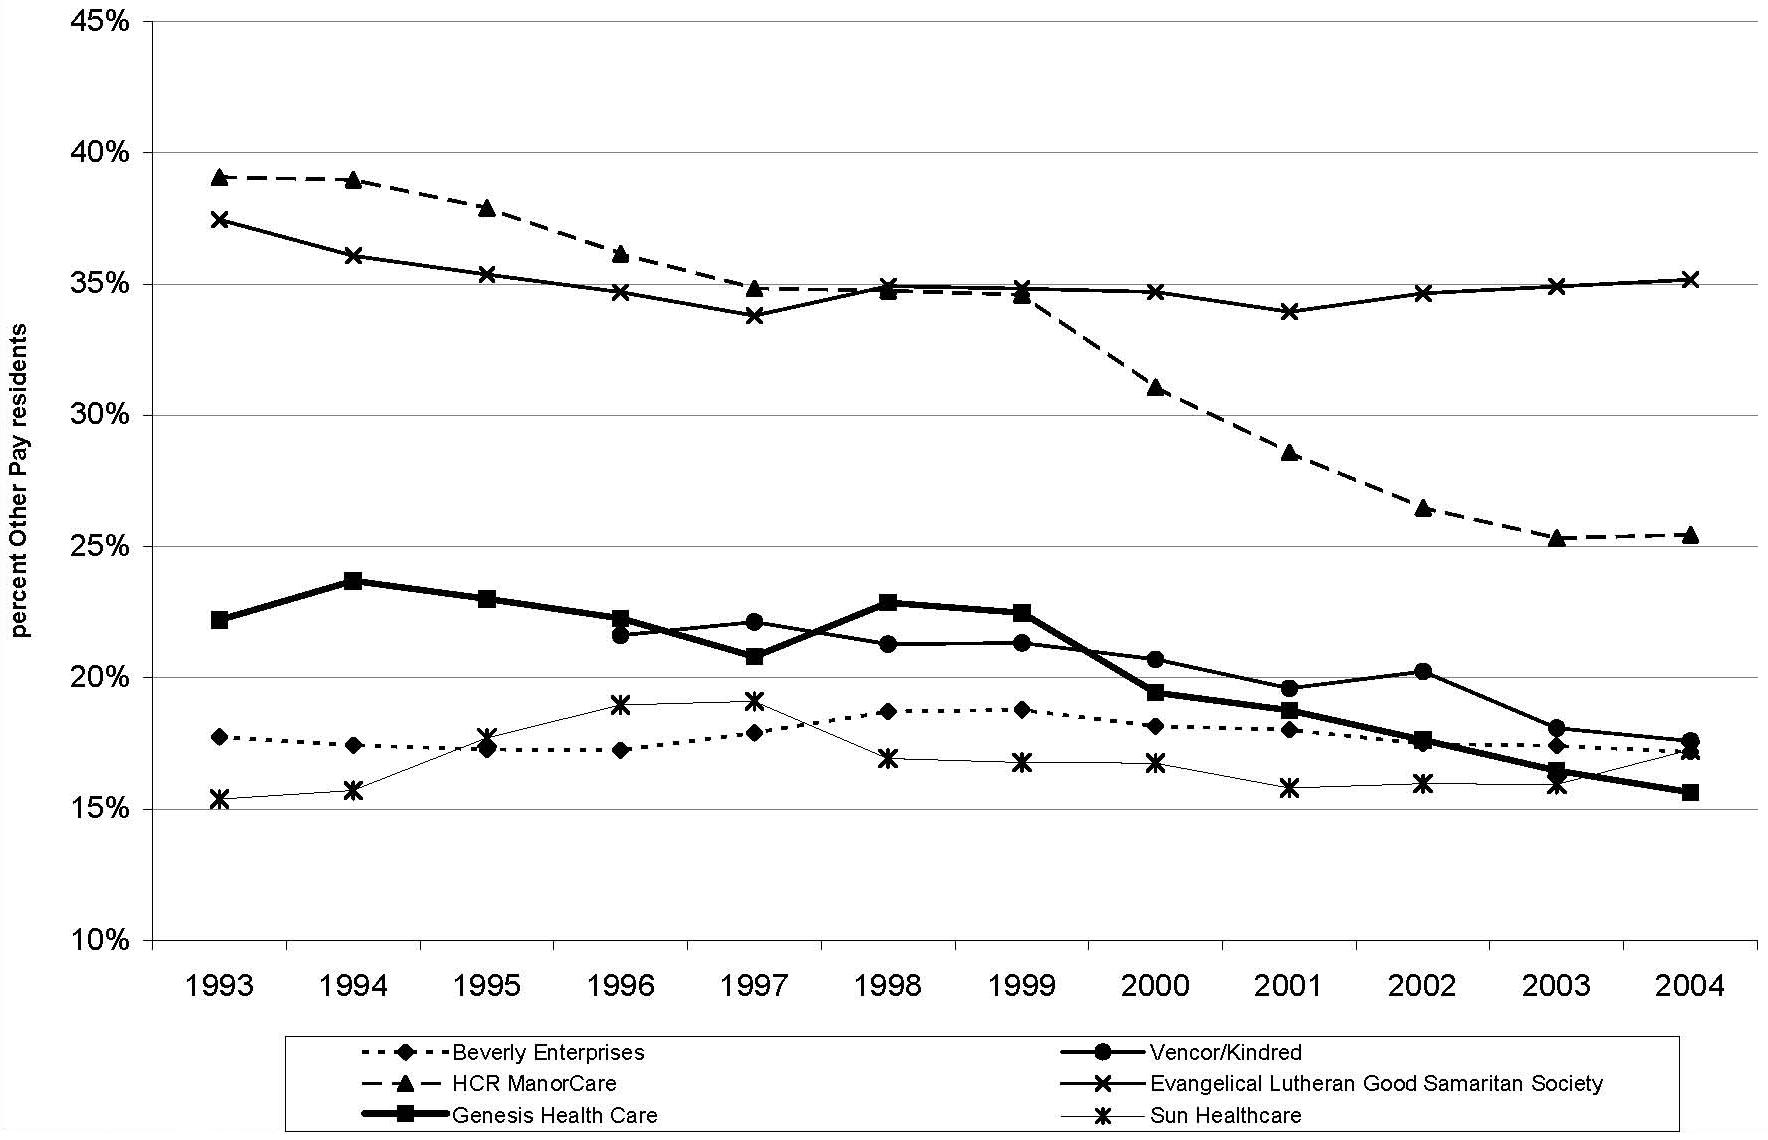
As shown in Figure 5, Figure 6 and Figure 7, providers vary in the extent to which their residents rely on different payer sources. In our most recent year of data (2004), the reliance on Medicare ranges from 7-23 percent; the reliance on Medicaid ranges from 52-71 percent; and the reliance on private/other sources ranges from 16-35 percent. Several of the largest chains, including Beverly, Genesis, Vencor/Kindred, and Sun, show similar trends over time in the proportion of residents across the respective payer categories. Among these larger providers, Manor Care and Good Samaritan are somewhat distinctive in their payer-mix. Both chains have relatively high proportions of residents relying on private/other payers, and relatively low proportions of residents relying on Medicaid. These two providers diverge in their reliance on Medicare, with Manor Cares reliance relatively high and Good Samaritans relatively low. As a whole, with some exceptions, the larger chains exhibit greater reliance on Medicare and lesser reliance on Medicaid and other payer sources than the rest of the nursing home industry.
Analyses of State Trends. Table 3 summarizes the number of states in which each chain operates across study years. As detailed, some chains -- such as Beverly, Genesis, and Sun Healthcare -- were more aggressive in contracting their operations geographically than others. Beverly went from a high of 708 facilities in 36 states in 1995 to 377 facilities in 27 states in 2004. Even more striking, between 2000 and 2004, Sun Health went from 272 facilities in 25 states to 95 facilities in 14 states in 2004. Based on our previous analyses, Florida and Texas are two states of particular interest because of the reported departures by many national chains responding to the litigation climates. Table 4 and Table 5 list chain providers that owned or operated at least ten facilities in Florida and Texas during the study period.
Of the national chains still operating in 2004, Beverly, Genesis, Kindred (formerly Vencor), Extendicare, and Mariner all exited Florida (Table 4). During the period when these chains were exiting the Florida market, some other chains emerged. Specifically, the Delta Health Group, Sea Crest Health Care Management, and Tandem Health Care increased their numbers of facilities during this period. As of 2002, Delta operated the majority of its 267 facilities in Florida, Sea Crest operated its 131 facilities exclusively in Florida, and Tandem operated many of its 233 facilities in Florida (also operating in New Jersey, Ohio, Pennsylvania, Tennessee, and Virginia).
As shown in Table 5, Texas experienced similar trends to Florida in recent years, with some national chains exiting the state. Among currently operating chains, exiting companies included Beverly, Extendicare, Sun, and Integrated Health Services. During this same period, Daybreak Healthcare, Senior Living Properties, and Mariner Health Care increased their number of facilities in Texas. As of 2002, Daybreak operated its 183 facilities exclusively in Texas, and Senior Living Properties operated its 301 facilities across Illinois and Texas. Mariner operates its 258 facilities across several states.
POLICY IMPLICATIONS AND THE NEED FOR FUTURE RESEARCH
Analyses of OSCAR data provide a descriptive look at the nursing home industry. In particular, these data provide the ability to chart the trends in acquisitions and divestitures of nursing facilities by national chains over time, as was the focus of this study. Analyses of these data nationally, within states, and across specific chains, revealed several broad themes. Nationally, nursing home chains have consistently owned or operated half of all facilities. However, these aggregate numbers mask state and chain-specific trends of importance.
Analysis of large national chains indicated a current trend toward consolidation in the industry, exemplified by smaller chains operating in fewer states and, in some states, emergent regional chains replacing the national chains. The strategic withdrawal from certain key states suggests a benefit to geographic concentration and a movement away from certain states in particular. Occupancy rates have declined across the nursing home industry, reflecting increased competition from nursing home alternatives such as assisted living, reduced lengths of stay among current residents, and lower than expected demand for services resulting from declining disability rates. The larger chains vary in the extent to which their residents rely on different payer sources; however, most share a trend toward greater reliance on Medicare and post-acute care. These analyses indicate that the nursing home industry over the past 12 years was a dynamic one marked by extensive acquisitions, mergers, bankruptcies, and divestitures.
These descriptive analyses highlight several issues for policymakers, stakeholders, and researchers, including areas where future research is needed. Importantly, a variety of factors extrinsic to demographic trends influence the demand and utilization of nursing home care. The findings show that federal and state policy and market conditions greatly impact the behavior and corporate structure of large nursing home chains. Not only did federal payment reforms of the late 1990s impact the overall health of the national chains, state level factors such as litigation and reimbursement impacted the manner in which organizations emerged from bankruptcies and remained solvent during challenging economic times.
As organizations move forward, it is difficult to overstate the importance of Medicare and Medicaid payment policies. Payment policies not only impact providers profitability, but also the composition of companies themselves. For instance, many of the nursing home closures that happened following the BBA were hospital-based facilities with smaller than average bed size and higher acuity.20 Although providers learned many lessons from the impact of SNF PPS almost a decade ago, many of the largest chain providers have a considerable, although differently focused, investment in these services today. It should be noted that the impact of Medicare payments policies on nursing home chains extends beyond SNF payments. Home health, rehabilitation, long-term care hospital, and hospice payments all can impact nursing homes, either directly or indirectly. Many of the larger nursing home chains have significant investments in these other services. For instance, Manor Care has a sizeable hospice operation, and Kindred is heavily invested in long-term care hospitals. In addition, as nursing home companies become more geographically concentrated, the impact of specific states Medicaid policies will grow in magnitude. Although general trends have pointed to Medicaid rate stability in recent years, states can vary considerably in their payment and related policies.21 Some states, for instance, are taking a lead in promoting Medicaid-financed alternatives to nursing home care and transitioning individuals from these settings.20
Overall, the emphasis of nursing home chains on specific geographic markets, ancillary/complementary services, and payers sources could signify one of two things. The new business model for chains may be to concentrate their operations in specific market niches (e.g., geographic areas, product types, etc.) to develop competitive advantages in their areas of focus. Alternately, the business models now employed by chains could reflect different bets, the outcomes of which will become more apparent over time. For example, providers such as Manor Care are focusing on Medicare post-acute care stays and on increasing their development of hospice services, demonstrating a willingness to trade increased resident turnover (and potentially lower occupancy rates) for higher profitability per resident day.
One important trend influencing nursing home corporate strategy is the spread of litigation against nursing homes. As noted above, nursing home litigation has grown substantially over the last decade, especially in states such as Florida and Texas. The financial impact of this litigation is substantial, with one study estimating the overall magnitude of litigation in Florida and Texas in 2001 to be 23 percent and 15 percent of annual nursing home expenditures in those states, respectively.5 In response, chains have divested of most facilities in these states, a phenomenon documented in our analyses. Although litigation trends appear to have abated somewhat in recent years,22 it is unclear whether litigation will spread to new and greater numbers of states in future years, potentially undercutting organizations abilities to avoid these risks.
Importantly, the findings of our analyses show that there is substantial variation across chain providers in their practices and strategies by which they navigate policy and market conditions. Thus, in researching nursing home chains in comparison to the rest of the nursing home industry, it is important to focus beyond the dichotomous Yes/No of whether a facility is part of a chain and to investigate more about the specific characteristics of the parent company. Is the chain regional or national? Is the chain in a period of expansion, contraction, or stability? Which resident payer sources are most important to the parent company (e.g., does the company emphasize Medicare and post-acute care)? Does the chain have a substantial investment in rehabilitation, hospice, home health, or assisted living? Does the chain have a substantial reliance on REIT financing or does it own most of its real estate assets? Although the answers to these and other questions influence the potential impact of future policy and market conditions on the industry as a whole, they also give insights into their likely differential impact on particular providers.
Some of the trends outlined above have unclear implications for the quality of care received by nursing home residents. For example, it is unclear whether the current trend toward REIT financing has any implications for nursing home quality. Although the same entities may remain as operators, the landlords from which they rent have strategic interests that are separate from the health care mission of their tenants. These landlords may have little experience or interest in nursing home care per se, perhaps influencing the ability of operating companies to institute changes to improve quality of care (e.g., at least related to the physical capital). Moreover, if a REIT seeks increased rent payments (as recently has happened with Kindred and its landlord Ventas), the nursing home operator could be constrained in its ability to meet increased costs. In particular, the profit and loss model of nursing homes is relatively fixed, with limited places to seek additional resources (e.g., lower insurance costs, reduced operating expenses, and reduced capital expenditures). In addition, because of the highly leveraged structure of this arrangement, operators can be vulnerable to future negative impacts from reimbursement changes.
Another side-effect of separating real estate assets from operations is that it reduces the assets available to potential litigants, possibly reducing incentives for plaintiffs and their attorneys to bring lawsuits. In fact, the trends toward REIT financing and those of incorporating individual facilities as separate entities can be undertaken primarily to address litigation exposure.22 REITs typically create special purpose bankruptcy remote limited liability corporations to mitigate the high cost of insurance and to minimize the chain of liability; thus the companies -- as tenants -- have much lower levels of exposure. Although it remains unclear how successful these strategies will be in limiting liability exposure, it is apparent that liability risk has emerged as an important component of nursing home corporate strategy.
At this point, the implications of national chains departing from states like Florida and Texas are also unclear. These emerging stories are made more complicated by the composition of regional operators that have taken the national chains place in these states and the role of REIT financing. In Florida for example, Formation Capital LLC, a privately held REIT that emphasizes senior housing, purchased facilities from Beverly, Genesis, and Mariner Healthcare and then hired Sea Crest Health Care Management to operate the facilities.23 OSCAR data show only the emergent role of Sea Crest Health Care Management in operating the facilities (described above) but not the role of Formation Capital in the financial transactions.b The purchasing entities in these states presumably anticipate that they can successfully limit their liability exposure, either through their corporate structuring, through improved litigation environments in these states (e.g., post tort reform), or through a combination of both. Although it is debatable whether such operator-owner relationships could impact quality of care or other practices, it is important to investigate these arrangements and inform policymakers and other stakeholders with objective data on the matter.
Unfortunately, research into topics of nursing home ownership is made difficult by the lack of comprehensive data on ownership. OSCAR data list nursing homes operating companies over time, but they do not include data about whether these same companies own the real estate at particular locations, nor do they include any information about companies that might have substantial real estate holdings across the nursing home industry. For this project, it was hoped that data from CMSs Provider Enrollment, Chain, and Ownership System would prove useful on these matters. However, analyses with these data did not proceed because of concerns with data quality and completeness.
In conclusion, the nursing home industry today seems to be enjoying a period of relative financial health with increases in Medicare payments from initial BBA levels and recent stability, an increased role for profitable hospice and rehabilitation services in nursing homes, more reasonable acquisition and debt strategies relative to previous years, and relatively stable Medicaid payments in recent years. Looking at past trends, however, demonstrates that these conditions can change quickly as a result of policy, market, or other factors. If Medicare further constrains SNF or hospice payments (e.g., as MedPAC has recently recommended24, 25), if malpractice litigation costs continue to increase in particular states,22 if assisted living continues to erode nursing home occupancy rates and access to private pay residents,1 or if states begin to limit Medicaid spending by reducing increases in nursing home rates,21 chain nursing homes and the industry as a whole could be pressed financially. The debt structures and corporate positioning of national chains should make many of these companies better able to weather coming storms and to protect against possible financial shocks. As outlined above, however, further research is ultimately needed to investigate these trends more thoroughly and to analyze whether they have had any impact on nursing home residents quality of care or quality of life.
REFERENCES
-
Grabowski DC, Stevenson DG. Assisted Living Expansion and the Market for Nursing Home Care. Health Aff (Millwood). In press.
-
Bourdon TW, Dubin S. Long-Term Care: General Liability and Professional Liability, Actuarial Analysis. New York, NY: Aon Actuarial Solutions, Inc.; 2002.
-
Bourdon TW, Dubin S. Long-Term Care: General Liability and Professional Liability, Actuarial Analysis. New York, NY: Aon Risk Consultants, Inc.; 2003.
-
Bourdon TW, Dubin S. Long-Term Care: General Liability and Professional Liability, Actuarial Analysis. New York, NY: Aon Risk Consultants, Inc.; 2004.
-
Stevenson DG, Studdert DM. The rise of nursing home litigation: findings from a national survey of attorneys. Health Aff (Millwood). March-April 2003; 22(2):219-229.
-
Manton KG, Gu X, Lamb VL. Change in chronic disability from 1982 to 2004/2005 as measured by long-term changes in function and health in the U.S. elderly population. Vol 103; 2006:18374-18379.
-
Liu K, Gage B, Harvell J, Stevenson D, Brennan N. Medicare's Post-Acute Care Benefit: Background, Trends, and Issues to Be Faced. Washington, DC: The Urban Institute; January 1999. Contract: HHS-100-97-0010. Available at http://aspe.hhs.gov/daltcp/reports/mpacb.htm.
-
Hearing on Nursing Home Bankruptcies. Special Committee on Aging. John Ransom, Political Transcripts by Federal Document Clearing House; 2000.
-
Irving Levin Associates. The Senior Care Acquisition Market: Decade in Review. New Canaan, CT: Irving Levin Associates, Inc.; July 2000.
-
Peck RL. "People will pay us to keep them home..." Interview with Genesis Health Ventures Chairman and CEO Michael R. Walker. Nursing Homes. July 17, 1997; 46(7).
-
Wiener JM, Stevenson DG, Goldenson SM. Controlling the supply of long-term care providers in thirteen states. J Aging Soc Policy. 1999; 10(4):51-72.
-
Business Brief-Sun Healthcare Group Inc. Earnings for Third Quarter Won't Meet Expectations. The Wall Street Journal. September 29, 1998.
-
Genesis Health Warns 4th-Quarter Results Will Miss Estimates. November 2, 1998.
-
Crippen DL. Hearing On the Impact of Balanced Budget Act on the Medicare Fee-for-Service Program. Committee on Commerce. Washington, DC; 1999.
-
Kumpel JJ, Dewhurst A. Skilled Nursing Facilities: The Phoenix Rises Again. December 20, 2004.
-
U.S. General Accounting Office. SNF, Medicare Payments Exceed Costs for Most but Not All Facilities. December 2002.
-
Fischbeck K, Feinstein AT. Lehman Health Care Facilities SNF Report: Monthly Analysis of Statistics, Numbers, and Financials for the Skilled Nursing Facility Industry. Lehman Brothers; June 7, 2004.
-
BDO Seidman, LLP. A Report on Shortfalls in Medicaid Funding for Nursing Home Care. April 2005.
-
Fischbeck K, Feinstein AT. SNF Report: Monthly Analysis of Statistics, Numbers, and Financials for the Skilled Nursing Facility Industry. Lehman Brothers; January 4, 2005.
-
MedPAC. Report to the Congress: Medicare Payment Policy. Section 3C Skilled Nursing Facility Services. Available at http://www.medpac.gov/publications/congressional_reports/Mar04_Entire_reportv3.pdf.
-
Grabowski DC, Feng Z, Intrator O, Mor V. Recent trends in state nursing home payment policies. Health Aff (Millwood). January-June 2004; Suppl Web Exclusives:W4-363-373.
-
Bourdon TW, Dubin SC. Long Term Care: 2005 General Liability and Professional Liability Benchmark Analysis. Aon Risk Consultants. Available at http://www.ahca.org/brief/aon_ltcanalysis2005.pdf.
-
Formation Capital Deals. Senior Care Investor. July 2006. Accessed at http://www.levinassociates.com/publications/sci/sciheadlines/06%20scihea....
-
MedPAC. Skilled Nursing Facility Services. Washington, DC; March 2006.
-
MedPAC. Hospice in Medicare: Recent Trends and a Review of the Issues. Washington, DC; 2006.
NOTES
-
Four the purposes of this study, we define corporate restructuring as the reorganization of corporate assets to achieve an organizations strategic objectives. Divestiture is a subcomponent of restructuring and represents the targeted sale of facilities in particular geographic or market areas. Divestiture might be initiated in response to an unfavorable reimbursement or litigation climate in a state or market or a response to other geographic specific factors that affect a companys bottom line.
-
A more recent addendum to these Formation Capital deals was the June 2006 sale of 186 SNFs and more than 21,000 beds (the facilities stretched across 21 states, but almost half were in Florida alone) to GE Healthcare Financial Services for $1.4 billion.
FIGURES AND TABLES
| FIGURE 1. Number of Nursing Home Facilities and Beds, United States, 1993-2004 |
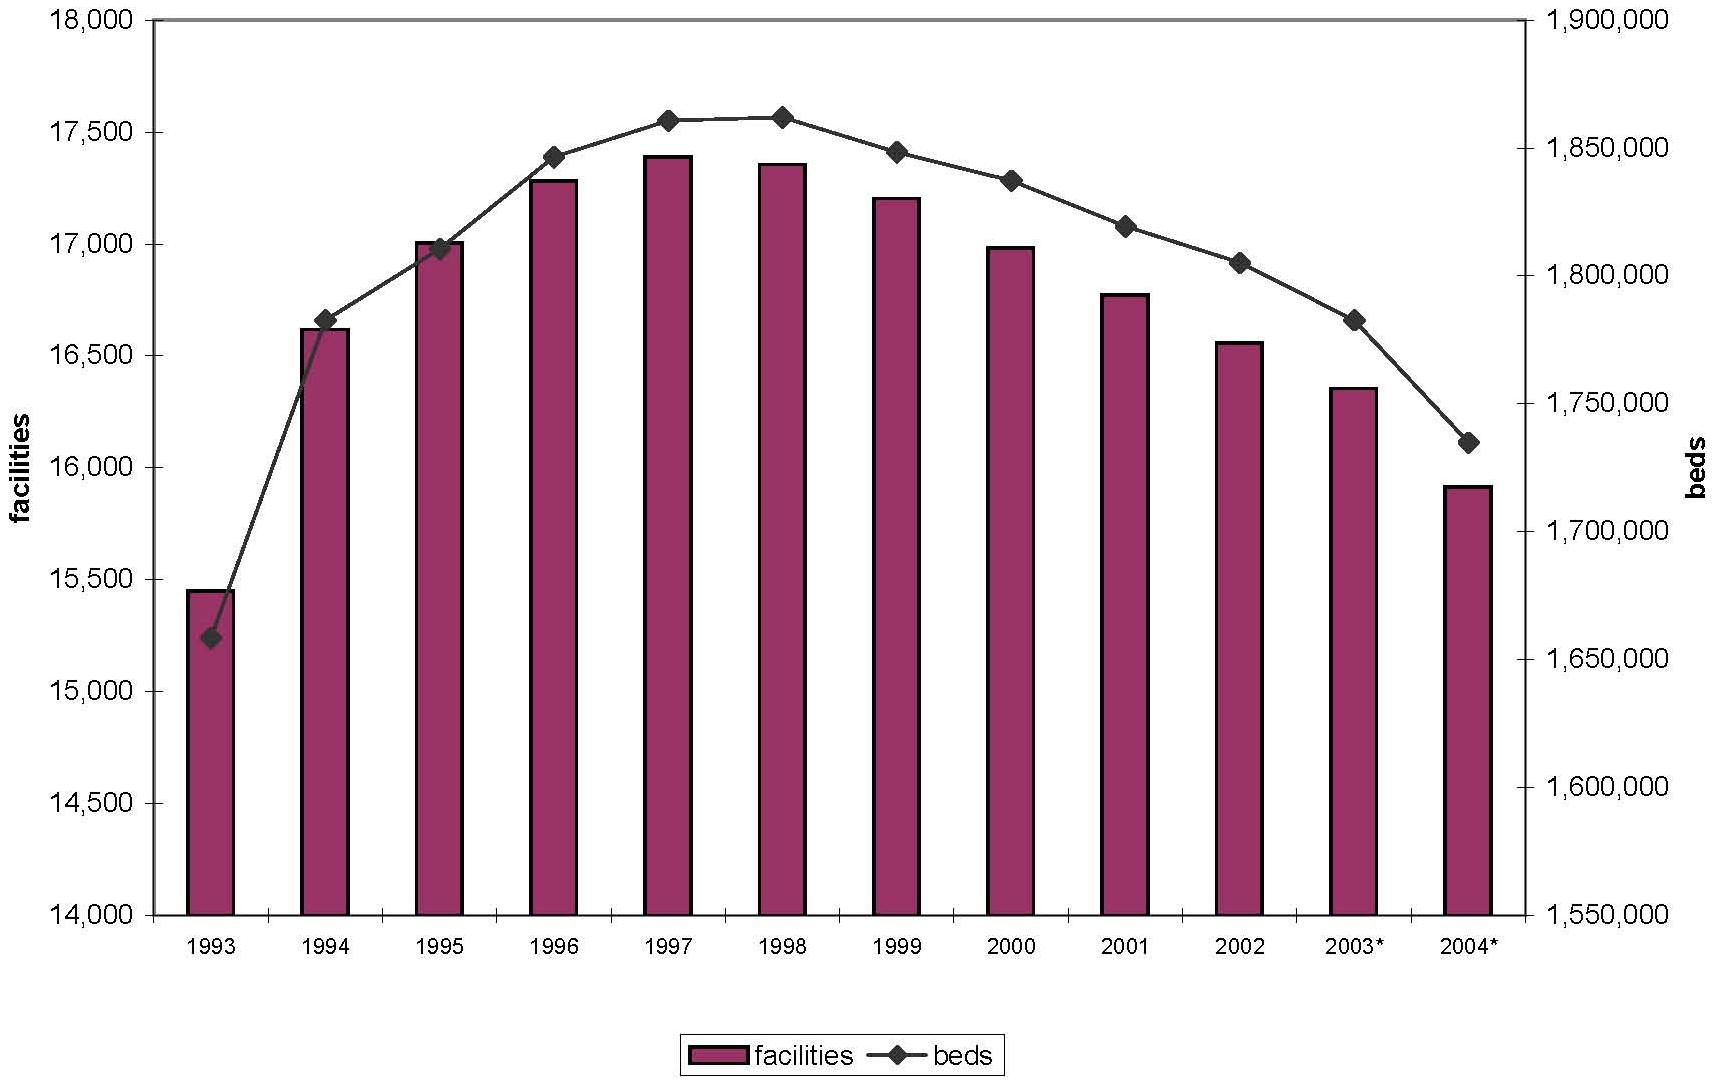 |
| * National facility counts for 2003 and 2004 are adjusted to reflect closure rates previously observed in OSCAR data (which are determined as subsequent data become available). These totals are subject to revision. |
| FIGURE 2. Percent Chain Nursing Home Providers, United States, 1993-2004 |
 |
| FIGURE 3. Nursing Home Occupancy Rates by Chain and Non-Chain Facilities, 1993-2004 |
 |
| FIGURE 4. Nursing Home Occupancy Rates by Chain and Year, 1993-2004 |
 |
| FIGURE 5. Percent Medicare Residents by Chain and Year, 1993-2004 |
 |
| FIGURE 6. Percent Medicaid Residents by Chain and Year, 1993-2004 |
 |
| FIGURE 7. Percent Other Pay Residents by Chain and Year, 1993-2004 |
 |
| TABLE 1. Percent of Chain Nursing Homes by Year | |||||
| Year | Chain Facilities | Total Facilities | Percent | Top 5 Chains** as a Percent of the Total Chain Facilities | Top 10 Chains** as a Percent of the Total Chain Facilities |
| 1993 | 7,508 | 15,450 | 49% | 19% | 25% |
| 1994 | 8,197 | 16,618 | 49% | 17% | 23% |
| 1995 | 8,667 | 17,003 | 51% | 16% | 22% |
| 1996 | 9,078 | 17,280 | 53% | 14% | 21% |
| 1997 | 9,313 | 17,388 | 54% | 14% | 22% |
| 1998 | 9,471 | 17,355 | 55% | 16% | 24% |
| 1999 | 9,433 | 17,204 | 55% | 16% | 24% |
| 2000 | 9,376 | 16,982 | 55% | 17% | 27% |
| 2001 | 9,309 | 16,772 | 56% | 16% | 26% |
| 2002 | 8,717 | 16,559 | 53% | 17% | 26% |
| 2003* | 9,180 | 17,585 | 52% | 15% | 23% |
| 2004* | 8,921 | 17,113 | 52% | 15% | 22% |
| * 2003 and 2004 counts are unadjusted and likely include facilities that have closed. In particular, our methodology for identifying closures relies on using two subsequent years of OSCAR data.** Top 5 and Top 10 chains vary by year and are ranked based on number of facilities. | |||||
| TABLE 2. Total Number of Facilities and Beds by Chain and Year, 1993-2004 (Top 10 Chains in Any Year) | ||||||||||||
| Chain Provider | 1993 | 1994 | 1995 | 1996 | 1997 | 1998 | 1999 | 2000 | 2001 | 2002 | 2003 | 2004 |
| facilities (beds) | facilities (beds) | facilities (beds) | facilities (beds) | facilities (beds) | facilities (beds) | facilities (beds) | facilities (beds) | facilities (beds) | facilities (beds) | facilities (beds) | facilities (beds) | |
| BEVERLY ENTERPRISES | 766(81,372) | 743(79,675) | 708(76,042) | 652(72,342) | 593(65,809) | 555(61,464) | 552(60,775) | 532(58,642) | 484(52,969) | 454(49,020) | 426(45,258) | 377(39,196) |
| KINDRED HEALTHCARE1 | 42(4,990) | 291(37,438) | 277(35,463) | 259(32,990) | 252(31,887) | |||||||
| VENCOR1 | 1(16) | 3(105) | 10(1,022) | 144(18,364) | 223(28,677) | 264(34,395) | 260(33,301) | 241(30,896) | ||||
| HILLHAVEN1 | 200(24,609) | 189(22,765) | 171(21,405) | 55(6,851) | 16(2,265) | 8(1,086) | 8(1,086) | 2(242) | ||||
| HEALTH CARE & RETIREMENT (HCR)2 | 115(14,477) | 118(14,338) | 122(14,794) | 120(14,653) | 104(12,668) | 1(100) | ||||||
| MANOR CARE2 | 148(20,351) | 148(20,646) | 154(21,564) | 156(21,666) | 179(25,507) | 281(37,746) | 280(37,746) | 292(39,264) | 289(38,974) | 282(38,291) | 292(39,647) | 279(37,375) |
| MARINER HEALTH CARE3 | 8(859) | 14(1,575) | 26(2,907) | 55(6,911) | 68(9,041) | 136(16,881) | 137(17,164) | 241(29,566) | 238(28,895) | 266(32,455) | 238(29,286) | 201(24,542) |
| EVANG. LUTHERAN GOOD SAMARITAN SOC. | 192(16,354) | 198(16,691) | 208(17,406) | 205(17,229) | 202(16,797) | 201(16,605) | 204(16,802) | 196(15,620) | 194(15,421) | 188(14,837) | 196(15,417) | 189(14,650) |
| GENESIS HEALTH CARE4 | 31(4,326) | 47(6,467) | 59(8,452) | 81(10,952) | 127(17,392) | 190(24,947) | 190(25,051) | 200(25,659) | 188(24,477) | 182(23,971) | 176(22,809) | 167(21,630) |
| HORIZON/CMS HEALTH CARE5 | 75(8,521) | 93(11,096) | 124(15,092) | 134(15,262) | 104(12,206) | 25(3,308) | 25(3,361) | 10(1,710) | 7(1,149) | |||
| INTEGRATED HEALTH SERVICES6 | 39(5,084) | 81(10,585) | 106(13,365) | 126(16,134) | 139(17,384) | 228(26,927) | 230(27,028) | 238(29,130) | 222(27,274) | 174(21,188) | 89(10,194) | 12(1,247) |
| TRANS HEALTHCARE6 | 9(685) | 32(2,360) | 40(3,467) | 85(9,087) | 125(13,077) | |||||||
| SUN HEALTHCARE7 | 41(4,407) | 72(7,978) | 102(11,596) | 128(14,717) | 164(19,155) | 260(29,848) | 262(30,259) | 272(31,123) | 234(26,606) | 213(24,310) | 169(17,986) | 95(9,288) |
| COLUMBIA/HCA HEALTHCARE8 | 5(83) | 36(1,005) | 91(2,497) | 136(4,326) | 143(4,979) | 121(3,235) | 113(2,870) | 67(1,605) | 29(799) | 5(203) | 13(267) | 4(205) |
| UNICARE HEALTH FACILITIES | 113(12,136) | 117(12,338) | 116(12,358) | 111(11,580) | 72(7,255) | 11(1,178) | 11(1,178) | 4(446) | ||||
| LIFE CARE CENTERS OF AMERICA | 74(10,000) | 99(12,920) | 114(14,904) | 132(17,057) | 137(18,062) | 136(17,863) | 137(17,894) | 148(19,103) | 139(18,221) | 126(16,012) | 127(16,146) | 133(17,180) |
| EXTENDICARE HEALTH SERVICES | 3(186) | 3(210) | 3(210) | 15(1,123) | 64(6,238) | 157(16,339) | 163(16,829) | 152(15,280) | 149(15,101) | 132(13,464) | 132(13,418) | 133(13,650) |
| TEXAS HEALTH ENTERPRISES | 97(10,803) | 99(11,126) | 93(10,316) | 99(10,676) | 95(9,982) | 99(10,581) | 102(10,914) | 68(7,337) | 60(6,515) | 3(256) | 1(102) | |
| FIRST HEALTHCARE | 74(10,244) | 96(13,569) | 98(12,987) | 74(9,889) | 53(7,429) | 29(4,170) | 29(4,170) | 11(1,748) | 9(1,564) | 7(1,413) | 6(1,155) | 2(315) |
| LIVING CENTERS OF AMERCA | 85(9,252) | 109(11,652) | 119(13,625) | 131(14,374) | 131(14,619) | 62(7,241) | 62(7,241) | 39(4,540) | 28(3,214) | 1(60) | ||
| ||||||||||||
| TABLE 3. Number of States* in which Chains Operated by Year, 1993-2004 | ||||||||||||
| Chain Provider | 1993 | 1994 | 1995 | 1996 | 1997 | 1998 | 1999 | 2000 | 2001 | 2002 | 2003 | 2004 |
| BEVERLY ENTERPRISES | 34 | 36 | 36 | 34 | 33 | 33 | 32 | 30 | 30 | 28 | 27 | 27 |
| VENCOR/KINDRED | 1 | 3 | 7 | 27 | 29 | 32 | 32 | 31 | 32 | 32 | 32 | 29 |
| HILLHAVEN CORPORATION | 32 | 31 | 31 | 21 | 10 | 5 | 5 | 1 | 0 | 0 | 0 | 0 |
| HCR/MANORCARE | 33 | 32 | 31 | 31 | 31 | 31 | 31 | 31 | 31 | 31 | 30 | 30 |
| MARINER HEALTH CARE | 3 | 8 | 11 | 17 | 17 | 23 | 23 | 23 | 24 | 23 | 23 | 21 |
| EVANG. LUTHERAN GOOD SAMARITAN SOC. | 25 | 26 | 26 | 25 | 25 | 25 | 25 | 24 | 23 | 25 | 24 | 24 |
| GENESIS HEALTH CARE | 7 | 11 | 12 | 13 | 16 | 19 | 19 | 17 | 16 | 16 | 15 | 14 |
| HORIZON/CMS HEALTH CARE | 14 | 16 | 20 | 23 | 21 | 12 | 11 | 3 | 3 | 0 | 0 | 0 |
| INTEGRATED HEALTH SERVICES | 17 | 22 | 24 | 29 | 29 | 31 | 31 | 29 | 28 | 24 | 21 | 10 |
| SUN HEALTHCARE | 8 | 11 | 14 | 17 | 22 | 25 | 25 | 25 | 24 | 25 | 25 | 14 |
| COLUMBIA/HCA HEALTHCARE CORPORATION | 3 | 13 | 21 | 28 | 29 | 27 | 27 | 21 | 14 | 4 | 10 | 4 |
| UNICARE HEALTH FACILITIES | 13 | 13 | 12 | 10 | 10 | 6 | 6 | 2 | 0 | 0 | 0 | 0 |
| * Includes the District of Columbia. | ||||||||||||
| TABLE 4. Number of Chain-Operated Facilities in Florida by Chain and Year | ||||||||||||
| Chain Provider | 1993 | 1994 | 1995 | 1996 | 1997 | 1998 | 1999 | 2000 | 2001 | 2002 | 2003 | 2004 |
| BEVERLY ENTERPRISES | 59 | 62 | 60 | 58 | 55 | 49 | 50 | 36 | 6 | 0 | 0 | 0 |
| HEALTH CARE & RETIREMENT CORP1 | 19 | 20 | 22 | 22 | 19 | 0 | 0 | 0 | 0 | 0 | 0 | 0 |
| UNICARE HEALTH FACILITIES | 13 | 14 | 12 | 14 | 12 | 2 | 2 | 0 | 0 | 0 | 0 | 0 |
| NATIONAL HEALTHCARE CORPORATION | 11 | 11 | 11 | 10 | 11 | 12 | 12 | 1 | 0 | 2 | 0 | 1 |
| MANOR CARE1 | 9 | 9 | 10 | 12 | 16 | 34 | 33 | 37 | 36 | 33 | 34 | 30 |
| HILLHAVEN CORPORATION2 | 8 | 8 | 10 | 2 | 0 | 0 | 0 | 0 | 0 | 0 | 0 | 0 |
| LIFE CARE CENTERS OF AMERICA | 3 | 3 | 6 | 7 | 9 | 9 | 10 | 12 | 9 | 8 | 12 | 11 |
| INTEGRATED HEALTH SERVICES | 2 | 16 | 23 | 26 | 27 | 34 | 34 | 49 | 41 | 21 | 5 | 1 |
| COLUMBIA/HCA HEALTHCARE CORP3 | 2 | 5 | 13 | 23 | 18 | 19 | 19 | 10 | 1 | 0 | 1 | 0 |
| DELTA HEALTH GROUP | 0 | 0 | 2 | 5 | 6 | 12 | 14 | 26 | 28 | 31 | 33 | 33 |
| SEA CREST HEALTH CARE MANAGEMENT | 0 | 0 | 0 | 0 | 0 | 0 | 0 | 0 | 3 | 47 | 54 | 25 |
| TANDEM HEALTH CARE | 0 | 0 | 0 | 0 | 0 | 1 | 1 | 18 | 19 | 21 | 21 | 21 |
| HOME QUALITY MANAGEMENT | 0 | 0 | 0 | 0 | 0 | 0 | 0 | 1 | 3 | 10 | 11 | 14 |
| MARINER HEALTH CARE | 0 | 0 | 7 | 18 | 23 | 25 | 25 | 28 | 28 | 28 | 4 | 1 |
| KINDRED HEALTHCARE2 | 0 | 0 | 0 | 0 | 0 | 0 | 0 | 4 | 19 | 18 | 3 | 0 |
| EXTENDICARE HEALTH SERVICES | 0 | 0 | 0 | 0 | 3 | 16 | 17 | 1 | 2 | 0 | 0 | 0 |
| GENESIS HEALTH CARE | 0 | 1 | 5 | 6 | 13 | 13 | 12 | 9 | 9 | 7 | 1 | 0 |
| VENCOR2 | 0 | 0 | 0 | 4 | 10 | 13 | 12 | 14 | 0 | 0 | 0 | 0 |
| ||||||||||||
| TABLE 5. Number of Chain-Operated Facilities in Texas by Chain and Year | ||||||||||||
| Chain Provider | 1993 | 1994 | 1995 | 1996 | 1997 | 1998 | 1999 | 2000 | 2001 | 2002 | 2003 | 2004 |
| BEVERLY ENTERPRISES | 109 | 77 | 46 | 49 | 21 | 1 | 0 | 0 | 0 | 0 | 0 | 0 |
| TEXAS HEALTH ENTERPRISES | 94 | 97 | 92 | 98 | 94 | 98 | 101 | 68 | 60 | 3 | 1 | 0 |
| LIVING CENTERS OF AMERICA | 48 | 56 | 61 | 61 | 53 | 24 | 24 | 18 | 17 | 0 | 0 | 1 |
| LIVING CENTERS OF TEXAS | 44 | 42 | 37 | 31 | 32 | 20 | 19 | 22 | 17 | 8 | 8 | 15 |
| UNICARE HEALTH FACILITIES | 13 | 15 | 15 | 15 | 9 | 0 | 0 | 0 | 0 | 0 | 0 | 0 |
| MANOR CARE1 | 7 | 7 | 10 | 6 | 10 | 10 | 10 | 11 | 11 | 17 | 16 | 11 |
| SUMMIT CARE CORPORATION | 5 | 8 | 20 | 22 | 22 | 23 | 22 | 20 | 19 | 14 | 10 | 2 |
| SUN HEALTHCARE2 | 4 | 14 | 15 | 21 | 24 | 26 | 27 | 25 | 20 | 8 | 4 | 0 |
| INTEGRATED HEALTH SERVICES | 3 | 12 | 19 | 15 | 14 | 27 | 27 | 32 | 34 | 24 | 14 | 0 |
| COLUMBIA/HCA HEALTHCARE3 | 2 | 15 | 33 | 38 | 39 | 32 | 28 | 18 | 10 | 2 | 4 | 1 |
| DAYBREAK HEALTHCARE | 0 | 0 | 0 | 0 | 0 | 0 | 0 | 0 | 1 | 47 | 59 | 74 |
| MARINER HEALTH CARE4 | 0 | 0 | 0 | 9 | 10 | 23 | 23 | 45 | 49 | 63 | 63 | 54 |
| SENIOR LIVING PROPERTIES | 0 | 0 | 0 | 0 | 0 | 27 | 27 | 43 | 44 | 46 | 48 | 47 |
| TRANS HEALTHCARE | 0 | 0 | 0 | 0 | 0 | 0 | 0 | 0 | 0 | 0 | 3 | 18 |
| TENET HEALTHCARE | 0 | 0 | 4 | 10 | 14 | 13 | 14 | 6 | 5 | 4 | 6 | 5 |
| EXTENDICARE HEALTH SERVICES | 0 | 0 | 0 | 0 | 8 | 18 | 18 | 17 | 14 | 0 | 1 | 0 |
| HEALTHCARE CENTERS OF TEXAS | 0 | 24 | 52 | 57 | 55 | 23 | 22 | 10 | 7 | 1 | 1 | 0 |
| PARAGON HEALTH NETWORK4 | 0 | 0 | 0 | 0 | 0 | 19 | 19 | 7 | 6 | 0 | 0 | 0 |
| ||||||||||||