
Marc A. Cohen, PhDChief Research and Development OfficerLifePlans, Inc.
Ramandeep Kaur, MAHeller School, Brandeis University
Bob Darnell, ASA, MAAAIndependent Consultant
"This report was prepared under contract #HHSP23320100022WI between the U.S. Department of Health and Human Services (HHS), Office of Disability, Aging and Long-Term Care Policy (DALTCP) and Thomson Reuters. For additional information about this subject, you can visit the DALTCP home page at http://aspe.hhs.gov/office_specific/daltcp.cfm or contact the ASPE Project Officer, Samuel Shipley, at HHS/ASPE/DALTCP, Room 424E, H.H. Humphrey Building, 200 Independence Avenue, S.W., Washington, D.C. 20201. His e-mail address is: Samuel.Shipley@hhs.gov.
The opinions and views expressed in this report are those of the authors. They do not necessarily reflect the views of the Department of Health and Human Services, the contractor or any other funding organization.
Acknowledgments
We would like to gratefully acknowledge the partial support that we received for the survey development, analysis, and report writing for this project from the Office of the Assistant Secretary for Planning and Evaluation (ASPE), U.S. Department of Health and Human Services (HHS), Washington, D.C. and specifically our Project Officer, Sam Shipley.
We would also like to thank all of the executives from long-term care insurance and reinsurance companies who participate in this survey and set of unstructured discussions who shared their views in a candid and honest manner.
As well, a number of individuals both inside and outside HHS provided valuable input and insights into earlier drafts of this paper. We would like to thank Brian Burwell, Eileen Tell, Al Schmitz, Jodi Anatole, Malcolm Cheung, Richard Frank and the staff of ASPE for their important contributions to this report.
Of course any and all errors in this report are the sole responsibility of the authors.
Introduction
Paying for long-term care (LTC) continues to be one of the great financial risks facing Americans during retirement. Current estimates suggest that the annual costs of care in a nursing home are roughly $85,000 and that home health care can cost upwards of $25,000 per year.1 Given that one-in-five individuals can expect to spend more than two years in need of care, this represents a significant financial risk. In 2010, total spending for LTC was $208 billion or roughly 8% of all personal health care spending.2 For the most, part such care is provided and paid for by families whereas the largest public payer of LTC services is the means-tested Medicaid program, which pays more than 40% of costs. Medicaid is one of the fastest growing health programs in the country, and is creating significant budgetary pressures on the states. Private insurance covers a small -- less than 10% -- but growing share of LTC expenses.
Throughout the 1980s and 1990s a growing number of private insurers began providing insurance for LTC, as an alternative to public coverage (i.e., Medicaid) or to out-of-pocket payments by the elderly and their families. At first, such insurance policies covered care provided only in a nursing home. Gradually, coverage expanded to include payments for home care services, assisted living, adult day care, and other community options. By the mid to late 1990s more than 100 companies were selling policies to individuals and to individuals in group markets (i.e., employer settings).3 Moreover, annual sales increased almost every year throughout the decade. In 1990, 380,000 individual policies were sold; by 2002, 755,000 policies were sold in that year.4
In 2003, the pattern of annual increases in sales came to an abrupt end. In fact, LTC policy sales began to decline rapidly. Between 2003 and 2009 individual policy sales declined by 9% per year.5 Thus, in 2009, fewer policies were sold than had been sold in 1990. Moreover, while in 2002, there were 102 companies selling policies by 2009, most of these companies had exited the market; that is, they had stopped selling new policies.6
The sheer magnitude of the projected growth in the retiree population -- from 12 million today to 27 million by 2050 -- along with the significant exposure to financial risk suggests that a business opportunity exists for companies to provide LTC coverage. As well, there has been consistent public policy support in the form of state and federal tax incentives, Partnership Programs across a growing number of states, and public awareness and education campaigns in support of private insurance. All of this points to a strong desire on the part of public policymakers that the private insurance market prospers and grows. Yet, this has clearly not happened, and in fact, the number of companies actively selling LTC insurance continues to decline at a pace far in excess of the small number of companies entering the market.
Purpose
The purpose of this study is to provide a systematic understanding of the growth and development of the LTC insurance market with a particular focus on the reasons why companies both entered and exited the market. We will characterize the market and how it has changed over time in terms of its size, product offerings, consumer characteristics, regulatory framework, and financial performance. We will also focus on firms' initial motivations for entering the market, their expectations and experience, and ultimately why so many exited the market.
Specifically, we provide information on the following issues or questions:
-
What were the primary motivations and expectations of firms when they began providing LTC insurance?
-
How has the market changed in terms of product, pricing, consumer profile, regulatory environment, supplier characteristics, aggregate market characteristics and performance indicators?
-
What are the primary reasons why companies who actively marketed LTC insurance ceased selling policies?
-
What would be required for such companies to consider re-entering the market?
By addressing these issues we intend to paint a picture of the industry in terms of its historical growth and development, as well as its current and future challenges.
Method and Analysis
In order to address these issues, we relied on a variety of sources of published information as well as on new information provided by discussions with insurance executives from 29 companies who had been in the market and chosen to exit.
A. Published Information Sources
We rely on data and information from America's Health Insurance Plans (AHIP), the Life Insurance Marketing and Research Association (LIMRA), industry analyst reports from Moody's and Standard & Poors, the academic research literature, and the National Association of Insurance Commissioners (NAIC) Long-Term Care Experience Reports for 2000, 2009, 2010 and 2011.7, 8, 9, 10, 11 Reports from this latter source present the most accurate information on key market parameters regarding premiums, claims, growth of in-force business, as well as historical performance indicators like actual-to-expected claims experience and data that enables calculation of measures of volatility in performance. Almost all companies are required to file detailed data on an annual basis with the NAIC, and such data is compiled and published in these annual reports.
These reports typically provide country-wide experience for companies. While the forms are relatively consistent, there have been a number of changes in 2010. The reports now provide additional information related to lapsation of policies but there is no longer detailed durational loss-ratio information provided in these reports. Thus, after 2009, one can no longer track the year-by-year loss-ratio (incurred claims divided by earned premiums) for a specific policy, based on how long that policy has been in-force. Nevertheless, the data in these reports is extremely valuable and allows us to "size the market" for companies still selling policies and for companies who exited the market.
An important caveat is that one of the large carriers to exit the market, Penn Treaty Network America, is currently in rehabilitation status under the auspice of the State of Pennsylvania. For this reason, the company was not required to provide data to the NAIC in 2009 and 2010. We solicited such information directly from the company and this allowed us to include their data with the aggregate NAIC reports.
B. Survey of Industry Executives
The second source of information was discussions with key executives who were either directly involved in the decision making process relating to leaving the market, or to those with intimate knowledge about their company's decision to exit the market. The instrument was administered in two ways: (1) in-person and telephonic interviews with executives, and (2) a web-based survey that was sent to those individuals who did not complete the in-person/telephonic interview. In total, executives from 29 companies that have exited the market or exited specific market segments over the last 15 years responded to the survey. Of these companies, three surveys were with executives from reinsurance companies, and the other 26 from direct writers of LTC insurance. In-person or telephonic interviews were completed with executives from16 companies and the other 13 were completed on-line.
Executives from the following companies were interviewed and/or provided responses to the survey.
| TABLE 1. Participating Companies | |
|
|
|
|
Based on an analysis of data for 2010 (and excluding Transamerica, which is now back in the market), these companies represent slightly more than 95% of the total earned premium and 90% of covered lives of companies among the top 100 of all companies who have left the market. Thus, the results of the survey can be generalized to the population of companies that have left the market.
The survey instrument itself typically resulted in an interview time of between 30 minutes to an hour. All data was captured and put into an analytic database so that frequencies and cross-tabulations could be completed. Additional information from the interviewees provided contextual information to many of the responses. This too is included where appropriate. The survey results that are reported here focus exclusively on the direct writers of LTC insurance; when appropriate, the issue of reinsurance is addressed separately and responses from the three participating reinsurance companies are reported.
Analytic Lens for Understanding Insurer Behavior
A primary focus of this study is to understand why firms have recently left the market. Therefore, having a frame for understanding such behavior can be helpful in interpreting the aggregate data as well as company-specific information. We use the frame of "profit maximization" which posits that firms either enter a market or exit a market depending on whether they are able to obtain a target return or profit level commensurate with their expectations. Thus, the basic concept is that companies exist and make decisions in order to maximize profits.12 Clearly, the model of profit maximization is a simplification of reality and assumes that profits are not the only relevant goal of the firm. In fact, additional objectives may affect profits indirectly or be equally as important such as sales maximization, public relations, gaining market share, increasing the attractiveness of complementary products, acquiring power and prestige, and other goals more related to managers maximizing their own utility rather than insurer profit maximization. We do not ignore these other goals and in fact test their validity by asking direct questions to the executives about the various motivations underlying their decision making.
We begin by presenting information on why firms entered the market and then present abridged summaries of key historical developments in the market focusing on changes in product design, marketing and sales, risk management, consumer profiles, and the regulatory framework that has developed over the past 30 years.13 This is followed by a discussion of why in recent years most firms have left the market. We focus on a number of key issues affecting profitability such as pricing strategies, capital requirements and distribution challenges. We conclude with an examination of the factors that might influence firms to consider re-entering the market, and present some specific actions that might encourage them do to so.
Findings
A. Entering the Long-Term Care Insurance Market
LTC insurance has been selling in the marketplace for the better part of 30 years. Early versions of the insurance were called "nursing home insurance." This is because such policies only covered care provided in nursing homes, primarily skilled facilities. In the late 1970s, early 1980s there were a small number of companies providing such coverage some of whom included Penn Treaty, Equitable, and Medico. They entered the market at a time when expenditures on LTC were less than $20 billion which then quickly grew to $30 billion in 1980 and over $70 billion within a decade.14, 15 Most of the costs were borne by individuals and their families and already such care represented an uncovered and potentially catastrophic expense. The problem of LTC financing was recognized by policymakers who in the late 1980s debated a number of bills aimed at paying for substantial LTC costs.16 This occurred against the backdrop of more than 1.7 million private policies having been sold to individuals during that time.
Most of the firms providing nursing home products in the 1980s also distributed other types of insurance. All were multi-line companies, the most prominent of which was the Fireman's Fund, which then became Amex Life in the late 1980s and G.E. Capital and Genworth Financial (1990s). These early pioneers were motivated by the perceived opportunity represented by demographic trends, but more importantly, the sense that this coverage was not all that different from the Medicare Supplement policies that were beginning to proliferate in the market. In some sense early nursing home policies were viewed as a variant of such policies. This view, shaped early approaches toward pricing, which will be discussed in a subsequent section.
We asked executives in the sample to recount why their company had initially entered the market. Three of these companies began selling policies in the 1970s, ten in the 1980s and almost all of the remainder in the 1990s. When these companies entered the market most (73%) offered a nursing home-only policy -- many having entered in the 1970s or 1980s -- and slightly more than half (57%) also offered comprehensive policies covering both nursing home and home care services -- all companies that entered the market in the late 1980s and early 1990s.
Consistent with our model of firm behavior, Figure 1 shows that almost half of the companies entered the market because they believed it represented a profitable opportunity. However, profit maximization was not the only reason for entering this market. Many companies felt that such a strategy supported efforts to show market leadership and to provide new product to their sales force to keep them engaged and committed to selling the company's other products. During detailed discussions with respondents, it was clear that compelling demographics and a perception of increasing consumer need drove many companies to enter this market to take advantage of an opportunity that they knew existed, even if they were not completely certain about how to exploit it profitably. Not shown in the figure is the fact that among these companies who left the market, 80% had senior management that was either supportive or very supportive of the decision to initially enter the marketplace.
FIGURE 1. Primary Motivations for Entering the Market
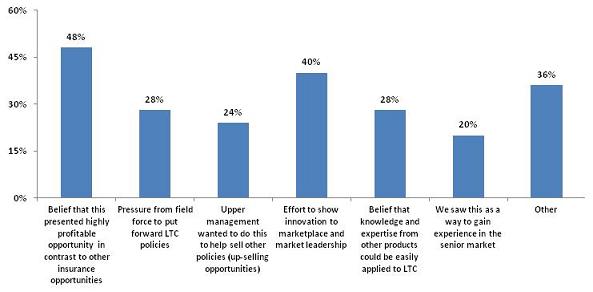
SOURCE: Survey of executives from 26 LTC carriers who exited the market or exited segment of the market.
NOTE: Numbers sum to more than 100% because respondents could check more than a single motivation.
Even 30 years later, the need for a product addressing the catastrophic costs associated with LTC needs persists. The consequence of demographic trends, a lack of comprehensive public solutions, and an inadequate private market is that LTC remains the largest unfunded health-related liability faced by elders during retirement. While demographics and consumer need have remained constant over the period, perceptions about the actual profit opportunity presented by this market have definitely changed.
Figure 2 highlights the initial business strategy of companies and demonstrates that for 40% of the companies that left the market, their initial business strategy was to grow modestly in order to learn the business and improve their management of the product over time. Only 16% had aspirations of becoming market leaders.
FIGURE 2. Initial Business Strategy
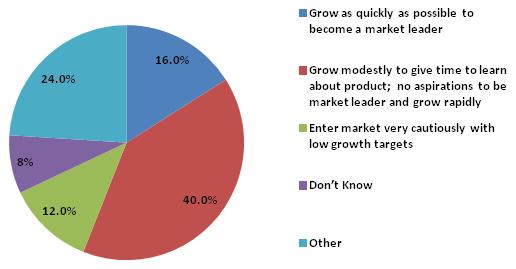
SOURCE: Survey of executives from 26 LTC carriers who exited the market or exited segment of the market.
We also asked which business metric was viewed as the most important to measuring the success of the endeavor during the first five years after market entry. Slightly less than half (48%) of companies indicated that meeting sales targets was most important. Profitability and meeting underlying pricing assumptions during the first few years of sales were cited by fewer than 25% of respondents; this suggests that there was a realistic understanding that given the long-term nature of the underlying risk, as well as the relatively high initial costs associated with selling and underwriting new policies, profit emergence and credible actuarial experience would be relatively slow in developing. The first measurable goal would be sales.
Most companies tried to differentiate themselves from their competitors through innovative product design as well as sales incentive plans. Some of the innovation proved to be confusing for consumers, and in particular, competition related to the benefit eligibility trigger. Some companies made eligibility for benefits dependant on the ability to perform varying numbers of activities of daily living (ADLs) and instrumental activities of daily living. It was nearly impossible for an individual to know which set of conditions they were likely to meet 20 years into the future to qualify for insurance payments. Benefit trigger standardization did not occur until the passage of the Health Insurance Portability and Accountability Act (HIPAA) of 1996. Companies also expanded coverage for more community services including caregiver support and respite care, restoration of benefits, transportation services, and other ancillary benefits.
Figure 3 shows how companies evaluated the key risks associated with this product. More than half of companies were most concerned with the future claims risk or the fact that this risk had a "long-tail". In other words, they were not certain how long an individual with LTC needs would require paid services. A relatively high percentage of policies had lifetime or uncapped benefit durations, which meant that they would pay benefits for as long as someone had continued need -- which represented an uncapped liability to the company.
FIGURE 3. Evaluation of Most Volatile or Greatest "Potential Future Challenge" at the Time of Market Entry
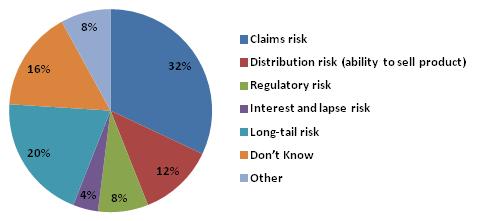
SOURCE: Survey of executives from 25 LTC carriers who exited the market or exited segment of the market.
It is somewhat ironic that few companies were concerned with what turned out to be the two most significant drivers of future poor financial performance -- the interest rate and voluntary lapse rate assumptions built into the product. Lower than expected interest rates and voluntary lapse rates have forced almost all companies to seek rate increases, and this may have contributed negatively to sales as well as to the reputation of both the product and to a number of companies. As will be demonstrated in a subsequent section, errors in these assumptions had a major negative impact on product profitability.
We also asked companies which objectives were not met during the first five years of market entry. Roughly two-in-five indicated that sales objectives had not been met and half indicated that either underlying pricing objectives (25%) or initial profitability targets (25%) had not been met. Thus, fairly early on, for a clear majority of these companies, the key metrics established to judge whether the initial decision to enter the market had been a good one, were not being met. Moreover, early undefined goals may have led to later disappointments.
Since the time when most firms entered the market, the industry has experienced a number of major changes, many of them directly and indirectly contributing to the current picture of the industry. These include changes in product, risk management strategy, sales approaches, and the regulatory and public policy environment. We summarize these key trends in order to provide an historical view of industry developments through the first decade of this century.
B. Market Evolution
1. Product Design
As mentioned, LTC insurance -- nursing home insurance -- has been selling in the marketplace for the better part of 30 years. Thus, it may still be considered a relatively new insurance product that continues to evolve. The implication is that one might reasonably expect "wrong turns" along the way, as the product and industry adapts to new information, changing market conditions, and accumulated actuarial experience. Through the 1970s and up to the late 1980s, the coverage was linked to the structure of Medicare coverage. Like many supplemental private health insurance policies, nursing home insurance focused on what Medicare "did not cover". Medicare paid for skilled nursing home care for up to 100 days and private insurance began coverage when Medicare ceased providing benefits. For this reason, early product configurations had elimination periods (i.e., deductibles) that were typically defined as 100 days -- the period of care that Medicare covered -- and the coverage was focused exclusively on skilled nursing home care resulting from a prior three day hospitalization -- precisely in line with Medicare policy. If care was initially considered to be "medically necessary", private insurance carriers would continue to pay benefits even when the need for skilled care ceased and only custodial (i.e., maintenance) care was required. Thus, while these early private policies "keyed off" of Medicare coverage, their innovation was that they paid for custodial care, where Medicare did not. In essence, this extended coverage from a limited amount of skilled nursing care (paid by Medicare) to a much more generous amount of skilled and custodial nursing home care (paid by private insurance and also by Medicaid for selected populations).
Early Medicaid policy also shaped the conception of LTC as synonymous with nursing home care.17 Over time, LTC -- and now long-term services and supports -- has come to reflect the reality that the need for care, which is based on functional limitations and/or cognitive impairment, requires a broader set of service responses. These include home and community-based care and a variety of residential care settings such as assisted living, adult day care and others.
Regarding the pricing of early policies, there was little basis on which to develop an estimate for future morbidity (i.e., the chance that someone would develop a condition that required use of LTC services) in the context of private insurance. In order to price these early policies actuaries relied on national data sources like the 1977 and 1985 National Nursing Home Surveys. As they considered home care coverage, they focused on the 1982, 1984, and 1994 National Long-Term Care Surveys for incidence and continuance data; again, such data was not directly transferrable to the private insurance context since it was neither insured data nor was the underlying population likely to reflect purchasers of insurance. For other pricing parameters, like voluntary lapse rates and mortality, there was a reliance on the experience of Medicare Supplement policies and standard mortality tables. For this reason, voluntary lapse rates priced into initial policies were much higher than what they ultimately turned out to be. (In fact, there is no other voluntary insurance product in the market that has experienced lower voluntary lapse rates than what is found in LTC insurance policies.)
Policies were always sold as guaranteed renewable -- they could only be cancelled for non-payment of premium -- and as level-funded. That is, while the premium charged varied by age at purchase, once an individual purchased a policy, the premium was designed to be level for life. Theoretically, an individual buying a policy at age 65 for a premium of $1,000 per year could be expected to pay that same annual premium throughout their lifetime, so long as the underlying pricing assumptions employed by the actuaries were accurate. The level-funded nature of the product persists to this day, and poses unique challenges to insurers. This will be discussed in a subsequent section. Finally, almost all policies reimbursed the actual costs of care up to a daily benefit maximum.
Relatively sluggish sales of LTC insurance policies in the 1980s suggested that the then current product design was not going to reach a broader part of the public. Selling insurance to cover something that no one wanted to access, except under the most extreme of circumstances, did not seem to be an attractive value proposition for fueling growth in the market. Moreover, Medicare, as well as certain Medicaid plans under special waivers, began to pay for support services in peoples' homes. Medicare covered such services primarily when they were deemed to be medically necessary. Medicaid also expanded its coverage for home and community-based care but still severely restricted access to these services.
As agents and brokers came to play a larger role in the LTC product development process, it was clear that for the coverage to sell, it needed to pay for custodial services where people desired them most -- in their own homes. This presented a dilemma for insurers because the primary risk management tool for managing claims was based on policyholder behavior: no policyholder really wanted to go into a nursing home, and this served as a brake on potential moral hazard and over-utilization of services. If policies began covering services in settings that people desired, like the home, this "brake" on moral hazard would disappear with the potential for making the underlying economics of the product unsustainable.
It became clear that in order for the market to grow, the product would have to cover home and community-based services in a manner that enabled insurers to effectively manage what were viewed to be the primary risks of the product: adverse selection and moral hazard. This was accomplished in part by changing the basis on which benefits were paid from a medical necessity model to a functional and cognitive impairment model. There had been a growing realization, encouraged by professionals with geriatric experience who entered the industry or consulted with it, that measures of functional abilities were most closely related to the need for covered services -- including home care.
In the mid to late 1980s and early 1990s, carriers began to provide limited coverage for home and community-based care -- either through riders or as part of the underlying basic policy design. They felt comfortable doing so because access to insurance benefits was made contingent on an insuredsinability to perform a certain number of ADLs or the need for assistance due to a severe cognitive impairment. These were more easily measurable and predictable benefit eligibility criteria. Also, a number of third party assessment companies entered the market to assist insurers in evaluating whether such deficits existed. It is not surprising, therefore, that consumer demand, coupled with the sense that companies could manage the underlying risk, fueled rapid growth in market share of comprehensive policies. This is clearly displayed in Table 2, which highlights the changes in product design over the past 20 years.
| Policy Characteristics | Average for 1990 | Average for 1995 | Average for 2000 | Average for 2005 | Average for 2010 |
| SOURCE: LifePlans analysis of 8,099 policies sold in 2010, 8,208 policies sold in 2005, 5,407 policies sold in 2000, 6,446 policies sold in 1995 and 14,400 policies in 1990. Reported in: Who Buys Long-Term Care Insurance in 2010-2011? A Twenty-Year Study of Buyers and Non-Buyers (in the Individual Market), AHIP, 2012. | |||||
| Policy Type | |||||
| Nursing Home-Only | 63% | 33% | 14% | 3% | 1% |
| Nursing Home & Home Care | 37% | 61% | 77% | 90% | 95% |
| Home Care Only | --- | 6% | 9% | 7% | 4% |
| Daily Benefit Amount for Nursing Home Care | $72 | $85 | $109 | $142 | $153 |
| Daily Benefit Amount for Home Care | $36 | $78 | $106 | $135 | $152 |
| Nursing Home-Only Deductible Period | 20 days | 59 days | 65 days | 80 days | 85 days |
| Integrated Policy Deductible Period | --- | 46 days | 47 days | 81 days | 90 days |
| Nursing Home Benefit Duration | 5.6 years | 5.1 years | 5.5 years | 5.4 years | 4.8 years |
| Inflation Protection | 40% | 33% | 41% | 76% | 74% |
| Annual Premium | $1,071 | $1,505 | $1,677 | $1,918 | $2,283 |
Coverage limited to nursing home or institutional alternatives only has virtually disappeared from the market. Deductible periods have increased and are roughly equal to three months of care. Moreover, the percentage of individuals purchasing some level of protection for increasing LTC costs is about three-in-four with roughly half buying compound inflation protection.
The average daily nursing home benefit has increased significantly over the period -- by an annual rate of roughly 4%. Given the mix of home care and nursing home service use, this is roughly in line with the rate of inflation in these services over the period; the $153 daily benefit amount in 2010 would cover 70% of the average daily cost of nursing home, 155% of the daily cost of assisted living, and roughly eight hours of home care a day seven days a week.18 Over the period, there has been a decline in the number of policies with unlimited benefits, a particularly risky policy design, given the uncapped liability faced by the insurer. The desire of companies to move away from this policy design stems in part from pressure by ratings agencies and fewer reinsurance options.19 It represents one of a number of actions insurers have taken to "de-risk" the product.
Finally, annual premiums have increased significantly over the period, as policy value has increased and as insurers have a body of credible experience on which to make changes to a number of key underlying pricing assumptions. Clearly new policies reflect a more conservative set of pricing assumptions, especially with respect to interest rates and voluntary lapses. This will be discussed in more detail in a subsequent section.
2. Marketing and Sales
Like other types of insurance, LTC insurance is sold in a variety of ways and through a number of distribution channels. Most policies are sold by agents and brokers directly to individuals. The distribution channel which is growing the most quickly, however, is the employer group market. Here agents are able to market and sell group policies to a large number of individuals, each of whom receives an individual certificate of insurance under a group plan. In 2000, new individual sales accounted for 75% of the market and group sales -- primarily employer-sponsored -- represented only 25% of new sales. By 2010, new individual sales had fallen to 58% of the market and group channels comprised 42% of new sales.20, 21
While most agents are independent -- this indicating that they can represent and sell policies from a variety of insurers -- a number of companies do have what are called "captive agents". In these companies agents can only sell that company's specific policy. Only a very few companies have specialist LTC agents, whose sole focus is selling LTC insurance policies. Currently there are fewer than 10,000 agents selling any meaningful number of policies.
Commissions for LTC insurance tend to be "heaped". This means that first-year commissions relative to premiums are high -- 40%-60% of premium with some companies approaching 100% -- and then they tend to drop down to between 5% and 15% of ongoing renewal premiums.22 This compensation structure does cause significant first-year cash flow challenges for companies. Moreover, it delays the timing of profit emergence as companies may be in a loss position for the first year after a policy is sold.
The 1990s were characterized by companies competing for the allegiance of large distribution forces by paying higher commissions to attract and encourage them to represent and sell their, rather than competitors', policies. This led to a situation where the costs of the product increased and market share shifted rapidly between companies as agent groups focused on selling the product that paid the highest commissions. The higher commissions did not appear to draw enough new agents into the market to effectively increase overall market size significantly over the past decade.
It is often said by industry participants that LTC insurance is not "bought" by consumers, but rather, it is "sold" to consumers. Challenges related to individuals' lack of understanding about future risk, an incorrect belief that government will pay for LTC, confusion about products, belief that other products already address the risk, its cost in relation to the value that people believe it has, and a lack of belief in the underlying value proposition have all contributed to the overall challenge of growing the market.23, 24 Even in the presence of such challenges, however, two-thirds of surveyed individuals from the general population age 50 and over in 2010 indicated that they were aware of companies that offer this insurance, and about 40% had been approached or had considered purchasing it.25
It often takes agents 2-3 visits to close a sale. Still agents are critical in the process and are viewed very positively by buyers; in a study of buyers in 2000, more than 90% reported that the agent they had dealt with was knowledgeable, explained the product well, and helped them select a policy that met their needs. Moreover, after a spouse, agents were seen to be the most important in individuals' decision to purchase a policy.26
In terms of overall sales and market penetration, the first half of the 1990s represented the fastest growth over the 20 year period and coincided with the proliferation of policies covering home care and nursing home care. The precipitous decline in sales in the early part of this century coincides with a growing number of companies exiting the market, the general declines in the stock market which affected demand, and the significant price increases in new policies offered by insurers.
Figure 4 shows sales patterns for new individual policies over the past 20 years.27
FIGURE 4. New Sales of Individual Policies(thousands)
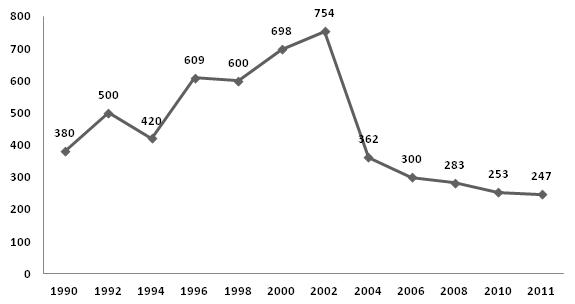
SOURCE: Survey of executives from 25 LTC carriers who exited the market or exited segment of the market.
Clearly, as policies became more attractive to consumers in the 1990s, the market grew significantly both in terms of covered lives and insurance premium. It is also worth noting that during the 1990s, there were minimal changes in the underlying pricing assumptions of policies. In fact, between 1990 and 2000, the average value in policies -- as measured by changes in average value of policy benefits -- increased more quickly than the average premium during the period.28 This trend foreshadowed a later criticism and concern with LTC policies expressed by ratings agencies that early designs of policies offered benefits that were too generous relative to factors like actual benefit utilization.29, 30
Figure 5 shows that in 2010, the total number of individuals with LTC insurance coverage was 7.3 million. This does not represent all people who have ever had policies, only those who still have them. Changes in covered lives reflect both growth in annual sales as well as changes in the number of policyholders who maintain their coverage over time.
FIGURE 5. Number of Insured Lives Covered by Year(thousands)
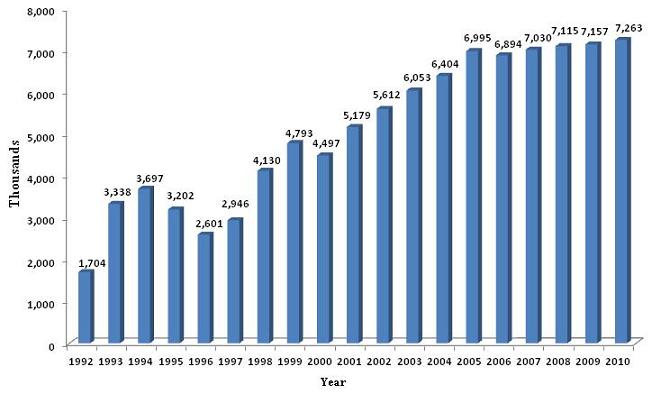
Figure 6 shows the annual change in covered lives over the period. As shown, between 1992 and 2000 there was tremendous variation in the growth rate of covered lives and after 2003, there has been a relatively steady yet small annual increase in covered lives. Given the aging of the individuals with policies, this suggests that the growth in sales throughout the decade has declined or been relatively flat.
FIGURE 6. Annual Growth in Total Covered Lives(thousands)
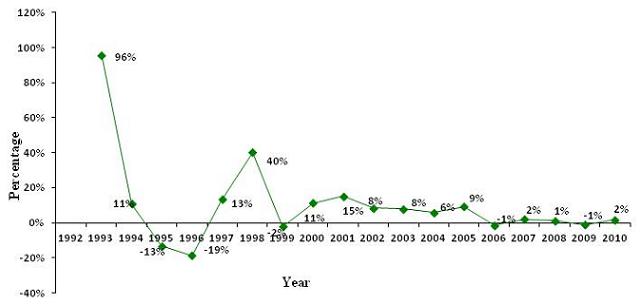
SOURCE: LifePlans analysis of NAIC data, 2010.
3. Risk Management
For first generation policies sold in the 1970s and 1980s, insurers were convinced that because nursing homes were viewed as places of last resort to receive care, there would be little moral hazard because it was well known that most people viewed nursing home residency as a "dreaded event". Not surprisingly, little attention was paid to underwriting and claims management for these early policies. So long as an applicant was not already in a nursing home, they could apply for coverage and would likely be issued a policy. Given that the average age of new buyers at the time was 68, most carriers still expected to see significant claims activity only 10-15 years in the future.
As companies began to market and sell comprehensive coverage they well understood that the aversion to using nursing homes was no longer an impediment to moral hazard; hence, companies felt a need to invest in more robust approaches to managing the two primary risks associated with product performance that were completely under their control: underwriting to guard against adverse selection, and claims management, to protect against moral hazard.
In the early 1990s, insurers began to employ more vigorous approaches to the underwriting of policies; these approaches focused on two broad dimensions: (1) medical criteria; and (2) tools and requirements gathering. Regarding medical criteria, the three domains on which companies focused their attention were the medical, functional, and cognitive status of individuals. Risk managers tried to better identify factors that put the individual at immediate or near term need for the services that were being insured for, namely, human assistance required to compensate for an individual's inability to perform ADLs due to functional deficits or to cognitive issues. Diagnoses were viewed as markers for current or future manifestations of functional need. Data mining, as well as more comprehensive reviews of the medical literature resulted in the development of detailed medical underwriting guides by companies. The information in these guides was considered proprietary, since the ability to perform more effective risk selection was seen as a competitive advantage for a company. At the same time, cognitive testing was adopted in the early 1990s and became a standard business practice. The availability of third party assessment companies serving the industry significantly enhanced the ability of insurers to perform their risk management functions both for underwriting and for claims management.
Companies also invested in more robust information gathering. The most common tools included information provided from the application, telephone interviews, medical records or attending physician statements, medical exams, in-person assessments and pharmacy databases. Many of these tools are in use today. An analysis of underwriting practices across the industry suggested that over the last decade, as companies have been able to link their up-front underwriting strategies with back-end claims experience, there has been a marked shift toward more conservative underwriting practices.31 In 2009, underwriting rejection rates across the industry were at 19.4%. For applicants under age 45, declination rates are below 10% whereas for those over age 80, rates increase to more than two-in-five.32
Regarding claims, insurers focused on managing three major types of risks associated with a claim: (1) the incidence risk, which is the risk that someone becomes disabled and requires LTC services covered by the policy; (2) the intensity risk, which focuses on the level of service and associated expenditure required to compensate for the individual's functional or cognitive deficits; and (3) the continuance risk, the amount of time that an individual would require paid services. Companies typically deploy -- through third party vendors -- nurses into the homes of claimants to measure whether the benefit eligibility trigger has been met and these same nurses are also involved in the development of care plans. These benefit assessments are fairly standard across the industry, especially when someone is claiming home care or assisted living benefits.
For nursing home care, many companies rely on nursing notes or the Minimum Dataset Survey to obtain the information necessary to adjudicate a claim. The latter is an assessment that must be completed on all nursing home residents. Companies also conduct regular follow-up with claimants to assure that they remain eligible for benefits under the terms of the insurance contract. Over the last decade insurers have invested significant resources into claims management systems and are far more active in terms of helping claimants navigate the LTC system and get services in place.33
This investment is clearly warranted given the rapid growth in claims payments. Figure 7 shows the growth in new claims over the period. The average growth in annual incurred claims over the period is 13%. Although not shown in the figure, through 2010, companies reported paying out on a cumulative basis over the last two decades slightly less than $50 billion in incurred claims; on an annual basis, the liability covered from private LTC insurance is roughly $6 billion, which is less than 5% of total expenditures on LTC services in the United States.
FIGURE 7. Industry-Wide Actual Annualized Incurred Claims
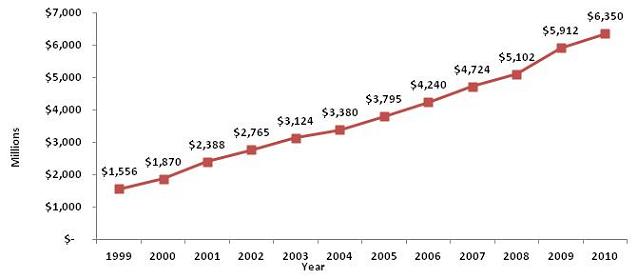
SOURCE: NAIC Experience Reports, 2011.
NOTE: The growth in incurred claims in and of itself does not translate to underlying profitability or performance for the industry, nor does its relationship to changes in earned premiums (which are not shown in Figure 4) relate directly to profitability. Profitability is related in part to the actual relationship between claims and premiums over the life of a policy.
4. Consumers of Long-Term Care Insurance
Roughly seven million individuals have a LTC insurance policy. The LTC Financing Strategy Group estimated that penetration among individuals who are considered to be suitable purchasers (i.e., have incomes in excess of $20,000 and are not currently eligible for Medicaid) is 16% of the over age 65 group and about 5% of the age 45-64 age group.34 The profile of individuals purchasing LTC insurance has changed dramatically over the last 20 years. As products have become more comprehensive and costly, the proportion of middle income buyers of insurance has declined. Table 3 summarizes key characteristics of buyers in the individual market. The average age of buyers continues to decline, and most purchasers are working, married college-educated and have significant levels of income and assets. In the group market, the average age is roughly 46 years. Not shown in the table is the fact that most people purchase the insurance to protect current consumption patterns (e.g., maintain standard of living, avoid dependence, maintain affordability of services) rather than to protect assets.35
| Socio-Demographic Characteristics | 1990 | 1995 | 2000 | 2005 | 2010 |
| SOURCE: Who Buys Long-Term Care Insurance in 2010-2011? A Twenty-Year Study of Buyers and Non-Buyers (in the Individual Market), AHIP, 2012. | |||||
| Average Age | 68 | 69 | 67 | 61 | 59 |
| 70 and over | 42% | 49% | 40% | 16% | 8% |
| Percent Female | 63% | 61% | 55% | 57% | 54% |
| Percent married | 68% | 62% | 70% | 75% | 72% |
| Median Income | $27,000 | $30,000 | $42,500 | $62,500 | $87,500 |
| % Greater than $50,000 | 21% | 20% | 42% | 71% | 77% |
| Median Assets | N.A. | $87,500 | $225,000 | $275,000 | $325,000 |
| % Greater than $75,000 | 53% | 49% | 77% | 83% | 82% |
| Percent College-Educated | 33 | 36 | 47 | 61 | 71 |
| Percent Employed | N.A. | 23% | 35% | 71% | 69% |
One of the ways policymakers have worked to expand the private insurance market to reach middle income adults is to support Partnership Programs. These programs -- which represent a partnership between state Medicaid programs and the private insurance industry -- are designed to enable individuals who purchase qualified LTC insurance policies to access Medicaid benefits without having to spend down their assets to Medicaid levels, if and when their LTC insurance benefits are exhausted. A growing number of states -- upwards of 45 by the end of 2012 -- have implemented such programs.36 Even so, few people age 50 and over -- less than 25% -- actually know whether or not their state has a Partnership Program. However, the Program does hold appeal: fully 45% of a random sample of individuals over age 50 indicated that they would be likely to purchase a policy if their state participated in a Partnership Program.37
For individuals who have been approached by agents and choose not to buy a policy, most cite cost as the primary impediment to purchase. Other far less prevalent reasons typically include the difficulty of choosing a policy, a lack of confidence in insurers to pay benefits as stated, and the desire to wait to see if better policies come on the market.38
5. Regulatory Framework and Public Policy
The first reported interest in developing a regulatory framework for private LTC insurance was in 1985 when a series of conferences between legislators, regulators and industry representatives were held; there was also growing interest in Congress in the area of nursing home insurance.39 As a result of a sustained effort, NAIC adopted the first Model Act in December 1986, followed by the first model regulation in 1987. Many states adopted these model regulations. In fact, by 1989, more than two-thirds of states had adopted the NAIC model act and/or regulation.40 The model regulations became the reference point for companies developing or modifying policies they were selling -- or intended to sell -- in the marketplace. The model regulation provides guidance and requirements related to many issues affecting the product including capital requirements, pricing, marketing and sales, agent licensing and education, and consumer protections, to name but a few.
In December 1988, the first attempt aimed at modifying insurance contracts occurred. The regulation included prohibitions against prior hospitalization requirements as a condition for receipt of institutional benefits and in 1989, the same requirement was eliminated for home care benefits. It was not until 1995, however, that a new section -- Section 27 -- was added to the Act that provided for standards on the conditions under which insurance benefits would be paid. Regulators, consumer representatives and the industry expressed widespread support for greater standardization.
In 1998, the Senior Issues Task Force (which was part of the NAIC) was charged with the task of reviewing the LTC Insurance Model Act and Regulation for compliance with the HIPAA of 1996. Among other things, HIPAA set benefit eligibility standards for tax-qualified LTC insurance policies. The federal requirement -- detailed in Section 213, 7702B and 4980C of the Internal Revenue Code -- was that benefits would be triggered when the insured could not perform at least two of five ADLs, or had severe cognitive impairment and six ADLs were specified in the Act. In 2000, an update to the Model Regulation was completed which added a new section -- Section 28. The purpose of this section was to assure that standards for qualified LTC insurance policies were consistent with HIPAA.
Finally, there have been a number of changes at the NAIC level related to the pricing of policies. Until the early part of this decade, insurers needed to certify that policies were priced to achieve a 60% lifetime loss-ratio. This meant that at a statutory interest rate (of 3.5%-4.5% depending on state) the policy had to pay out 60% in benefits (claims payments) to consumers. As pricing became inadequate and insurers had to increase rates, insurers had to certify that the pricing took into account "moderately adverse conditions" and the minimum loss-ratio requirement was removed. The intent was to assure that companies would not under-price their policies and that premiums would be more stable over the life of the policy. To this day, the NAIC remains the focal point for the regulation of LTC insurance.
The passage of HIPAA conferred favorable tax treatment to LTC policies that met a series of standards set out in the law, the most important of which related to benefit eligibility standards. HIPAA clarified the treatment of premiums for qualified plans as medical expenses for individuals deducting medical expenses beyond 7.5% of their gross income and by not taxing LTC insurance benefits up to certain limits. In addition to standardizing policies, the law helped to signal to the market, that LTC insurance was something that should be considered by the public. It appeared as a line item on every federal income tax return.
On the other hand, few individuals actually purchasing the insurance would benefit from the favorable tax treatment. This is because a policyholder would have to have taxable income, very high medical expenses, and itemize expenses (rather than take the standard deduction.)41 The law did encourage states to begin to provide tax deductions and exemptions for the purchase of insurance. In fact more than half the states provide tax incentives for the purchase of LTC policies, and most of these are linked to qualified policies.42 Even so, there is little evidence that such policies have led to a discernible effect on LTC insurance take-up rates. This is not too surprising given that the value of incentives is fairly low compared to the costs of the policies themselves.43
There are a number of clear trends in the development of the industry in the 1990s that laid the groundwork for many of the market exits that occurred in the subsequent decade. These included the development of more comprehensive policies without commensurate adjustments to premiums, pressure from agents to add benefit features that served to confuse consumers and make the purchase decision more difficult, and a likely underinvestment in risk management given the unknown nature of the morbidity risk. While there was a rapidly developing regulatory infrastructure, many insurers felt that the NAIC model act imposed requirements that added to the cost of the product without a commensurate level of actual consumer benefit. Finally, tax benefits were considered to be more ephemeral than real and were seen to have little impact on the overall level of demand. Taken together, these factors all resulted in challenges to the underlying profitability of the product, which is discussed in more detail below.
6. Long-Term Care Insurance Pricing and Profitability
The issue of profitability is one of many factors relating to why companies entered the market but it is an absolutely central factor in understanding why many of these same companies ultimately exited the market. Clearly, there was a belief that LTC insurance could be priced and managed in a way that assured reasonable returns to companies. The key drivers of profitability are embedded in the underlying pricing assumptions used to develop premiums and are a function of company strategies related to underwriting and claims management, product design, premium structure, inflation adjustment rates, sales and marketing costs and investment strategies. Table 4 shows the key assumptions underlying the pricing of LTC insurance.
| Pricing Parameter | Description | Typical Assumptions |
| Morbidity | The claims that are expected to be paid out based on the specific benefit design of the policy. | SOA Experience reports National public data sources Insured Experience. |
| Mortality | The underlying mortality table employed to determine how long individuals who have policies are expected to live and pay premiums and collect benefits. | Annuitant mortality tables (e.g., 1994, 2000). |
| Interest Rate | Because the product is level-funded, there is a great deal of pre-funding occurring at early durations of policy ownership and this is the rate or return assumed on invested premiums and risk-based capital (RBC). |
1990s: 5% - 8% 2000s: 3% - 5% Current: 2% - 4% |
| Voluntary Lapse Rates | Not all individuals will hold their policies until death. For a variety of reasons people may cease paying premiums. High voluntary lapse rates lead to lower premiums because premium reserves from a lapsed policy are retained by the company without related future claim expenses. |
1990s : 8% first year declining to 4% 2000s: 6% first year declining to 3% Current: 4% first year declining to 0.5% |
| Underwriting Selection Effect | A group that is underwritten tends to be healthier than a non-underwritten group and this has a positive impact on the morbidity. | Claims reductions factors typically wearing off within 5-7 years of policy issue. |
| Acquisition Costs and Administration | These are the costs associated with "producing" and servicing the policy and include marketing and sales expenses (commissions), underwriting, claims management, ongoing policyholder billing and premium collection and other administrative expenses. | Sales costs typically greater than 60% of first year premiums and then leveling out at lower levels. Ongoing policyholder administration and claims management as a fixed per policy fee or percent of premium. |
| Profit | This is the amount of load or additional charge put into the product to assure an adequate return for the insurer. | Profit measures including pre-tax profits, post-tax profits, internal rate of return (IRR), pricing to lifetime loss-ratio. |
Small variations in actual experience compared to expected performance of each of the pricing assumptions can have a major impact on product profitability. In order to demonstrate this, we developed a LTC insurance pricing model that allows us to evaluate the impact of small changes in various pricing assumptions on overall product profitability. Table 5 shows these impacts. Baseline profitability is defined as the addition of a 10% margin on the premium that is generated to cover the present value of all claims and expenses. Thus, the pre-tax profit margin is set at 10% of the premium.
What this model shows, for example, is that if a company assumed that it would be able to earn 6.5% on its reserves, and instead, earned 5.5%, then depending on age, premiums would have to increase between 5% and 10% to maintain the initial 10% level of profitability as defined above. Again, depending on age, if the actual interest rate earned on reserves was 5.5%, compared to the priced interest assumption of 6.5%, then the profit margin would vary between 0.5% and 5.2%. This represents declines in the margin of between 48% and 95%.
| Change in Profit Margin (no change in premium) | Profit Margin (no change in premium) | Required Change in Premium Level to Maintain 10% Profit Level | Premium Needed to Maintain 10% Profit Level | Age | Lapse | Interest | Morbidity | Mortality |
| SOURCE: LifePlans Long-Term Care Insurance Pricing Model, 2012.
Assumptions: 5 year policy; $100/ day; 10% margin; 60% minimum loss-ratio. Better claims = 10% lower than priced; Worse claims = 10% higher than priced. Better mortality = 10% higher than priced; Worse mortality = 10% lower than price. Better lapse = 1 percentage point higher than priced; Worse = 1 percentage point lower than priced & year 7+ ultimate lapse rate of 0.25% versus 0.75%. |
||||||||
| BASE CASE | ||||||||
| 0% | 10.0% | 0% | $713 | 55 | Standard | 6.50% | Standard | Standard |
| 0% | 10.0% | 0% | $1,379 | 65 | ||||
| 0% | 10.0% | 0% | $2,149 | 70 | ||||
| -95% | 0.5% | 10% | $781 | 55 | Actual | 5.50% | Standard | Standard |
| -67% | 3.3% | 7% | $1,472 | 65 | ||||
| -48% | 5.2% | 5% | $2,252 | 70 | ||||
| -208% | -10.8% | 21% | $861 | 55 | Actual | 4.50% | Standard | Standard |
| -142% | -4.2% | 14% | $1,575 | 65 | ||||
| -100% | 0.0% | 10% | $2,364 | 70 | ||||
| -339% | -23.9% | 34% | $955 | 55 | Actual | 3.50% | Standard | Standard |
| -224% | -12.4% | 22% | $1,688 | 65 | ||||
| -156% | -5.6% | 16% | $2,485 | 70 | ||||
| -492% | -39.2% | 49% | $1,064 | 55 | Actual | 2.50% | Standard | Standard |
| -315% | -21.5% | 31% | $1,813 | 65 | ||||
| -216% | -11.6% | 22% | $2,614 | 70 | ||||
| 102% | 20.2% | -10% | $640 | 55 | Better | 6.50% | Standard | Standard |
| 75% | 17.5% | -7% | $1,276 | 65 | ||||
| 54% | 15.4% | -5% | $2,034 | 70 | ||||
| -52% | 4.8% | 5% | $750 | 55 | Worse | 6.50% | Standard | Standard |
| -39% | 6.1% | 4% | $1,433 | 65 | ||||
| -30% | 7.0% | 3% | $2,213 | 70 | ||||
| 90% | 19.0% | -9% | $649 | 55 | Actual | 6.50% | Lower | Standard |
| 94% | 19.4% | -9% | $1,250 | 65 | ||||
| 96% | 19.6% | -10% | $1,943 | 70 | ||||
| -90% | 1.0% | 9% | $777 | 55 | Actual | 6.50% | Higher | Standard |
| -94% | 0.6% | 9% | $1,509 | 65 | ||||
| -96% | 0.4% | 10% | $2,355 | 70 | ||||
| 22% | 12.2% | -2% | $697 | 55 | Actual | 6.50% | Standard | Higher |
| 23% | 12.3% | -2% | $1,347 | 65 | ||||
| 21% | 12.1% | -2% | $2,104 | 70 | ||||
| -25% | 7.5% | 3% | $731 | 55 | Actual | 6.50% | Standard | Lower |
| -25% | 7.5% | 3% | $1,414 | 65 | ||||
| -22% | 7.8% | 2% | $2,196 | 70 | ||||
As shown, a percentage point difference in the underlying interest rate assumption has a very major impact on underlying profitability. Moreover, the impact is most pronounced at the younger ages. As well, even small errors on multiple assumptions can lead to major changes in the product's underlying profitability. Finally, the assumptions are subject to a wide degree of volatility given changes in the provider landscape, trends in disability rates, macro-economic policy vis-à-vis aggregate interest rates, and other factors. Thus, it is not surprising that given the level-funded nature of this product, along with the long-tail morbidity risk, the product is viewed as inherently more risky than other insurance products, and regulated in a way that requires greater levels of capital to support it.
Noteworthy is the fact that since the late 1990s, all of these major determinants of premium and product profitability have been going in the wrong direction: interest rates are significantly lower than what was priced for, voluntary lapse rates are lower than for any other insurance product, morbidity is somewhat worse than expected and mortality is actually improving. For these reasons, the prior decade saw a major exodus of companies from the market, as returns on the product have been significantly below expectation. More recently, major ratings agencies have highlighted the poor profit results of companies and issued reports cautioning about the future of the industry.44
C. The Decision to Exit the Market
With few exceptions, most companies that stopped selling LTC policies did so over the past decade. Table 6 shows the distribution of companies by market exit year. It shows that more than half of companies in the sample have exited the market (or specific market segments) in the past eight years. The largest number of companies exited the market in 2003 and 2010.
There does not seem to be any discernible difference between those companies that chose to exit the market earlier rather than more recently. Most companies made the decision to exit the market within a year of considering such a strategy and roughly a quarter within six months. Thus, once these companies seriously began re-evaluating the desirability of remaining active in the market, it did not take long for them to make a final decision to leave the market.
| Year of Market Exit | Sample |
| SOURCE: Survey of executives from 26 LTC carriers who exited the market or exited segment of the market and analysis of NAIC Experience Exhibit Reports from 2000, 2009, 2010 and 2011 | |
| 1996 |
|
| 2001 |
|
| 2002 |
|
| 2003 |
|
| 2004 |
|
| 2005 |
|
| 2006 |
|
| 2008 |
|
| 2009 |
|
| 2010 |
|
| 2011 |
|
| 2012 |
|
We asked executives to highlight all of the reasons why the company left the market (Table 7) and the single most important reason for doing so (Figure 8). In broad terms the reasons can be related to profit, risk, internal management, sales and distribution, public and regulatory policy, or other issues posing challenges to companies.
As shown, product performance, that is, not hitting profit objectives was the most cited reason for leaving the market. Incorrect assumptions about two underlying pricing assumptions -- voluntary lapses and interest rates -- have had a lot to do with this and have been key drivers behind the need of many companies to increase rates on products. The concern about the ability to obtain needed rate increases from state insurance departments was the second most cited reason for market exit. Slightly more than half of respondents also cited high capital requirements as a reason for exiting the market. It is noteworthy that only a single company cited an unfavorable public policy environment specifically as a reason for exiting the market.
| Reasons | Percent | Responses |
| SOURCE: Survey of executives from 26 LTC carriers who exited the market or exited segment of the market. | ||
| Profit Issues | ||
| Product performance--not hitting profit objectives | 69% | 18 |
| Product performance not hitting profit objectives quickly | 8% | 2 |
| High capital requirements | 54% | 14 |
| Risk Issues | ||
| Concern about ability to get rate increases if necessary | 62% | 16 |
| New evaluation/assessment of the risk of product and market | 50% | 13 |
| Lack of confidence in ability to manage risk | 42% | 11 |
| Could not get reinsurance or partner with whom to share risk | 19% | 5 |
| Internal Management Issues | ||
| Reputation Risk | 23% | 6 |
| Pressure from Rating Agencies | 23% | 6 |
| Pressure from Board of Directors | 8% | 2 |
| New Senior Management not interested in the product | 39% | 10 |
| Sales and Distribution Issues | ||
| Too difficult to sell (consumer-related) | 27% | 7 |
| Distribution issues (agent-related) | 23% | 6 |
| Intense competition | 15% | 2 |
| Regulatory/Public Policy Issues | ||
| New regulatory requirements | 19% | 5 |
| Unfavorable public policy | 4% | 1 |
| Other (please specify) | 50% | 13 |
Figure 8 highlights the point that a high capital requirement to support the product was cited most frequently as the most important reason for market exit. Product performance is the second most cited reason. Some of the other reasons cited include a concern that a continued focus on LTC insurance detracted from other core products, that tax qualification guidelines inhibited certain innovative product designs, and others. In terms of classifying these reasons into major categories, slightly less than half are related to profitability, about a quarter to risk issues and a quarter split out across the other reasons.
It is important to note that some of the reasons -- particularly those related to changes in the outlook of upper management -- are likely "intermediate" factors. That is, if senior management wanted to exit the market, it was likely related to the fact that business objectives were not being met, or they had a different evaluation of the risk, etc. In some cases, it likely required a new CEO to take a fresh look at the business which led to a market exit.
FIGURE 8. Single Most Important Reason that the Company Left the Market
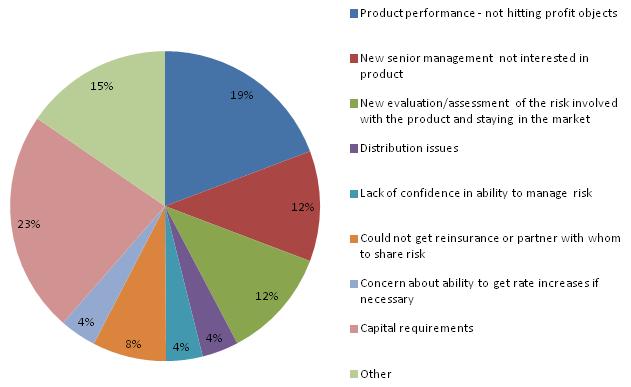
SOURCE: Survey of executives from 26 LTC carriers who exited the market or exited segment of the market.
Concerns related to capital requirements and rate increases may represent something unique about the structure and regulatory requirements relating to LTC insurance that have a major impact on profitability. LTC insurance is a guaranteed renewable product which means that as long as an individual pays premiums, the insurance company must continue to honor the coverage. Premiums are not guaranteed, although they are designed to be level-funded over the life of the policy. This means that if the actual experience of any of a number of underlying pricing assumptions (claims, interest rate, mortality, voluntary lapse rates, etc.) varies from what was anticipated, the financial viability of the product can be threatened, unless there is an adjustment to rates.
Rate adjustments can only occur with the permission of individual state insurance departments. Rate increases would typically be sought for policies that have been in the market for enough time to gain credible experience. This means that policyholders would typically be older and more likely to be on fixed incomes at the time that a company might be seeking a rate adjustment. Given the sensitivity around increasing rates for older policyholders, it is not surprising that companies are concerned about their ability to raise rates; in fact, many companies have experienced significant challenges obtaining the level of rate increases that they request, even when such increases may be actuarially justified. For example, a company may request (and require) a 35% rate increase, yet be allowed to adjust premiums by only 15%. This does not mean that regulators have ignored requests for rate adjustments. With few exceptions, most companies have increased rates on some if not all of their policy series, and clearly the increases have been significant.45
The failure to hit profitability targets as a reason to leave the market was pervasive in the interviews with executives. Therefore it is important to understand what is meant by profitability and how it is measured in evaluating the success of a product. Profit can be defined differently by companies and the application of various standards affects premium levels. Some of the more common profit standards include: (1) a pre-tax measure (e.g., 10% of gross premium); (2) a post-tax measure (e.g., 5% of some level of the RBC allocated to support the product); (3) pricing to a specific lifetime loss-ratio standard (e.g., 60% at a conservative earnings or interest assumption); or (4) an IRR (e.g., 15%). Even when all other assumptions are held constant, use of an alternative profit standard can yield significant differences in premiums. For example, for a 62 year old, everything else held constant, using a 10% pre-tax standard compared to a 15% IRR calculation leads to a premium that is roughly 10% lower.46 The post-tax profit measure focuses on a target rate of return on RBC -- which is the level of capital that a company is required to allocate to support the product.
The calculation behind the level of capital required to support insurance products was set by the Risk-Based Capital for Insurers Model Act which went into effect in 1992/1993 for life and health companies. A company's RBC is monitored by both state regulators and A.M. Best or other rating agencies. State regulators use an RBC model that is developed and maintained by the NAIC. The purpose is to require companies to measure their capital allocation compared to a standard risk-based calculation of needed capital.47 In essence, the idea is to determine the minimum capitalization that is appropriate to a company's risks. While the exact formula will depend on the specific type of insurance, in general there are four risk areas that are typically considered: C1 is credit risk; C2 is pricing risk; C3 is interest rate risk, and; C4 is other business risks. The key risks that are the focus of LTC insurance include C2 and C3.
At the core of the NAIC model is a formulaic approach to developing a "Company Action Level (CAL)" of capital and then generally relating actual capital to this CAL. For example, if a company's CAL is $100M and its actual capital is $400M it would have a 400% RBC ratio. Regulators monitor this ratio and various actions generally result if this ratio falls below certain target levels.48 For many years, the RBC level on the C2 (i.e., pricing risk) had been to establish a level equal to 5% of claim reserves, plus $25 million of the first $50 million in premiums and 15% on all additional premium beyond that. The formula now reflects a lower percentage (10% instead of 25%) applied to premiums and an additional component related to claims. The intent was to hold higher levels of RBC as claims increased and to match the level of required capital to the actual pattern of risk in the product.
Again, the capital requirements for LTC insurance are high relative to other products such as health and life insurance. High capital requirements are due to the long-term nature of the coverage and other "unknowns" which make the product inherently more risky. Thus, the actual required capital is very high per dollar of earned premium or reserves because of the perceived product risk, the long-term nature of the guaranteed renewable coverage, and the fact that rating action impacts are muted as policyholders continue to age.49 Also, and in particular, with respect to policies with inflation protection, the capital strain is often large in the early years of a policy because sales commissions, underwriting and issue, taxes, and administrative expenses are large relative to earned premium. For that reason, it is not uncommon for companies to show financial losses in the first 2-3 years after a policy is sold and then show ever increasing reserves for many years and continued losses. While claims may be low during these initial years, expenses are high and for inflation policies, reserves high. Thus, at the very least, for the product to be profitable over its lifetime, it must generate returns that take account of the initial 1-3 years of expense-associated losses.
FIGURE 9. Moody's Yield on Seasoned Corporate Bonds--All Industries, AAA and Ten Year U.S. Treasury Note Yield Rate
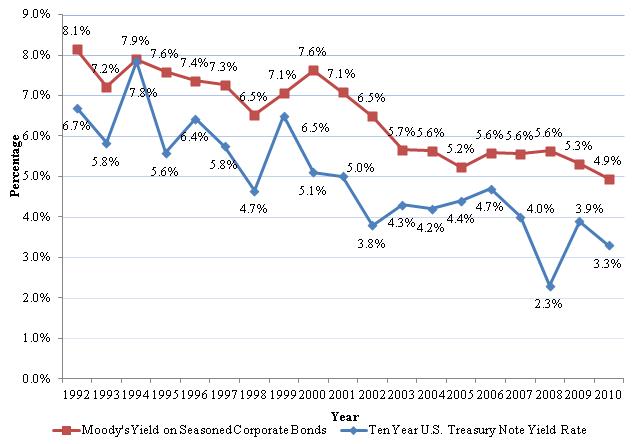
This would not be a major issue if the actual or expected returns on capital were strong. However, that has rarely been the case. In addition to voluntary lapses being lower than anticipated (resulting in premiums being lower than necessary), interest rates have also been lower than anticipated, resulting in earnings on invested reserves that are lower than anticipated. More specifically, an analysis of rates of return on Triple A (AAA) corporate bonds and U.S. Treasure Notes over the last two decades highlights why so many companies exited the market in the last 7-10 years -- yields on both types of investments have experienced very major declines.50 Between 1992 and 2002, yields on Corporate Bonds were typically above 6.5% whereas in 2003, they began a precipitous decline such that by 2010, they had fallen to below 5%. For Treasuries, yields dropped to below 4%. The vast majority (85%) of companies that exited the market did so from 2003 through 2010, which correlates closely to this decline in yields.
In addition to absolute declines in returns on invested capital, when carriers point to required capital as a reason for exiting the market, they are also viewing constrained capital in light of expected returns from other lines of business. If profits do not emerge at either the rate or levels expected, then economic pressures will lead companies to allocate such capital to products offering higher returns. The high "hurdle rate" needed to justify the allocation of capital to the LTC insurance product line is particularly sensitive to the interest rate environment, given the level-funded nature of the product.
While for most companies the primary motivations for leaving the market were related to high capital requirements and the seeming inability to meet profit objectives, many factors converged and played a role in the decision. Some of these were related to challenges around marketing and sales, risk management strategies, regulatory policy, the lack of reinsurance coverage and others. Executives were asked to indicate whether a specific factor "Strongly influenced the decision to leave the market", "Somewhat influenced the decision to leave the market" or "Did not influence the decision to leave the market at all". Table 8 on the following page summarizes results.
There are a number of important points to be made about the data presented in Table 8. First, consistent with prior results, the factors cited most often as having the strongest influence on the decision to exit the market included high capital requirements and pressure to reallocate capital to other more profitable business lines due to profitability challenges. As well, roughly one-in-three respondents indicated that the level-funded nature of the product made it particularly susceptible to investment risk (i.e., interest earnings), and there were few ways to successfully mitigate this risk.
| Factor | Strongly Influenced theDecision | Somewhat Influenced theDecision | Did Not Influenced theDecision |
| SOURCE: Survey of executives from 26 LTC carriers who exited the market or exited segment of the market. | |||
| Marketing and Sales | |||
| The required commission schedules to attract agents made the product very expensive. | --- | 19% | 81% |
| It was difficult to recruit agents to sell the product. | 8% | 8% | 84% |
| The amount of agent training required by regulations was excessive. | 8% | 8% | 84% |
| LTC insurance was too difficult to sell. | 8% | 15% | 77% |
| Marketing of and education about the product became too costly. | --- | 15% | 85% |
| Risk Management | |||
| Finding experienced actuaries became difficult. | 8% | 12% | 80% |
| Finding underwriters and claims adjudicators who knew about LTC insurance risk became difficult. | --- | 15% | 85% |
| Underwriting and claims management tools were not adequate to manage the risk. | --- | 19% | 81% |
| In a rapidly changing service environment it became difficult to enforce original provisions of the policy. | --- | 24% | 76% |
| Denying claims became too much of a reputation risk. | --- | 11% | 89% |
| It became too difficult to mitigate investment risk. | 28% | 24% | 48% |
| There was too much bad publicity regarding rate increases. | --- | 27% | 73% |
| The costs associated with managing the product became too high. | 15% | 43% | 42% |
| Morbidity was worse than expected. | --- | 50% | 50% |
| The incidence of fraudulent claims was too high. | --- | 8% | 92% |
| Regulatory Policy | |||
| Regulations encumbered product development/innovation and sales. | 15% | 15% | 70% |
| Regulations encumbered the ability to do adequate risk management. | 27% | 35% | 38% |
| The cost of regulatory compliance became too high. | 15% | 19% | 66% |
| State insurance departments would not approve necessary rate increases (at all or in a timely manner). | 23% | 31% | 47% |
| We were concerned that the NAIC or state insurance department would pass a model regulation that would be applied to policies retroactively. | 12% | 19% | 69% |
| Availability of Reinsurance | |||
| It was difficult to acquire high value reinsurance coverage. | 15% | 31% | 54% |
| Requirements of the reinsurer were too stringent for us. | 15% | 12% | 73% |
| Capital Costs and Profits | |||
| Capital requirements became too high | 50% | 15% | 35% |
| High capital costs caused constant pressure to reallocate capital to products with more rapidly emerging profits | 31% | 12% | 58% |
| Emergence of profits was too slow | 35% | 15% | 50% |
| Level funding made the product too dependent on interest earnings | 35% | 31% | 34% |
| Other Factors | |||
| We were concerned that a negative rating on LTC insurance business would negatively affect other business lines | 23% | 38% | 39% |
| Public policy was unsupportive of the product | --- | 15% | 85% |
Second, issues relating to marketing and sales were not cited frequently as having a major or even moderate influence on the decision. Third, finding skilled staff for underwriting, claims and actuarial analysis has not played much of a role in the decision nor have issues related to enforcing policy provisions in the context of a changing provider landscape. In contrast, half of respondents indicated morbidity experience was worse than they had anticipated and this influenced their decision to exit the market. On a cumulative basis, most of these companies actual claims experience was better than what was anticipated; that is, the actual-to-expected loss-ratio was less than 100%. However, more recent claims experience suggested that claims costs were increasing at a rate higher than expected, and that this did not bode well for projected future profitability. (See Figure 11.)
Clearly, all of the activity related to risk management has costs which must be absorbed or built into the underlying pricing of the product. As morbidity experience has deteriorated for a growing number of companies, it is not surprising that companies are investing significant resources in risk management -- not sales -- activities. Roughly two-in-five respondents indicated that the costs associated with managing the product have become too high and this has been one of the factors that hasled them to exit the market.
Regarding regulatory policy, the most cited factors having a moderate influence on a company's decision to exit the market have to do with the ability to obtain rate increases in a timely manner or at all, as well as having the necessary flexibility to engage in appropriate risk management activities; roughly one-in-three companies indicated that this had a moderate impact on their decision. The costs of regulatory compliance and the possibility that such compliance encumbers product innovation were not seen as factors in the market exit decision.
A number of companies have reinsurance partners that enable them to share or spread the underlying risks in the product. For some companies, the ability to obtain reinsurance coverage is a pre-requisite to either entering or staying in the market. For two of the companies, the difficulty of obtaining such coverage or of meeting the requirements of the reinsurer proved to be very important to their decision to leave the market. For roughly one-in-three carriers, the difficulty of obtaining such coverage had some level of influence on their decision, but it was clearly not a dominant factor. It is noteworthy that over the last five years the number of reinsurance companies providing coverage for stand-alone LTC insurance policies has declined and that today, only 1-2 companies provide such coverage. Surveys of executives in these reinsurance companies suggest that capital requirements and inadequate returns were primary drivers of their exit from the market as well. The fact that these companies have also exited the market reinforces findings about the inherent level of risk in the product (as it is currently configured).
Finally, more than half of companies were concerned that a negative rating on their LTC insurance business would adversely affect other business lines, and this played some role in their decision to leave the market. This is because most writers of LTC insurance are multi-line companies and for the most part this insurance represents a small component of their overall portfolio. Again, it is worth mentioning that very few companies felt that an unsupportive public policy played a role in their decision to exit the market.
In addition to "missing" the interest and voluntary lapse assumptions, another reason for falling short on profitability assumptions relates to morbidity. Companies typically focus on two performance measures related to this parameter: the annual and cumulative loss-ratio and the actual-to-expected loss-ratio. The loss-ratio focuses on the relationship between claims and premiums and can be viewed on the basis of a single year (e.g., claims incurred during the year compared to premiums earned during the year) or on a cumulative basis (e.g., total claims incurred to date compared to total premiums earned to date). The higher the loss-ratio, the greater are claims in relation to earned premiums. Over the life of a group of policies, claims payments will ultimately exceed the amount of annual premium payments; the difference is expected to be paid for by the reserve that the company sets up. The reserve is funded in large part during the years where annual premium exceeds the level of annual claims incurred. It is the excess premium plus the interest earned on that excess premium that funds the future gap between premiums and claims.
Figure 10 highlights the annual industry-wide loss-ratio as well as the cumulative loss-ratio.
As expected, claims represent a growing percentage of premium payments over time. This reflects both the aging of the in-force policyholder base as well as the wearing off of the underwriting effect on morbidity. The slow-down in sales of new policies -- with lower initial annual loss-ratios -- also contributes to the rate at which such ratios are increasing for the industry. The growth in the loss-ratio does not represent a problem for the industry so long as the premiums collected are sufficient to fund the expected liabilities priced into the policy. What it does show is how claims are growing and this is typically compared to what the ratio was expected to be. Thus, the most important performance measure is whether or not the actual incurred claims by a company are in line with expected claims paid.
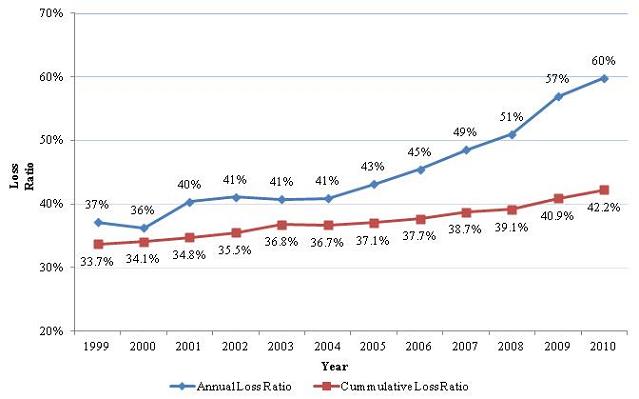
If a company anticipated that during a specific year its incurred claims compared to its earned premiums would be 50%, and in fact the ratio of incurred claims to premiums was actually 55%, this would indicate worse than anticipated experience. The converse is also true: if a company expected to pay out in claims the equivalent of 50% of its earned premium, and instead paid out 45%, this would suggest better than anticipated experience. An actual-to-expected ratio of 100% suggests experience is exactly in line with what was anticipated.
The expected claims underlying the pricing in a policy represent the best estimate for the amount of money that the insurer is going to need to pay out on an annual basis, given the age, gender, marital status, and health status of policyholders. Typically companies develop this "morbidity" or "claims cost" curve based on a set of assumptions related to: (1) the probability of someone becoming disabled in a certain year (incidence rate); (2) the probability that once disabled, an individual will require paid care for a certain amount of time (continuance risk); (3) the intensity of care required while the individual is disabled (intensity risk), and; (4) the level of service cost in relation to the daily benefit chosen by the individual to pay for care. The claims cost assumptions are a key input to the overall pricing of the policy -- see Table 4 -- and once filed with the state, these assumptions become the basis on which reporting and performance is monitored. If the actual experience does not conform to the initially priced assumptions, companies can request rate relief from state insurance departments and they would be required to file a new set of claims assumptions, which would result in changes to premiums.
Figure 11 shows industry-wide average cumulative actual-to-expected losses between 1992 and 2009.
FIGURE 11. Industry-Wide Actual Losses to Expected Losses
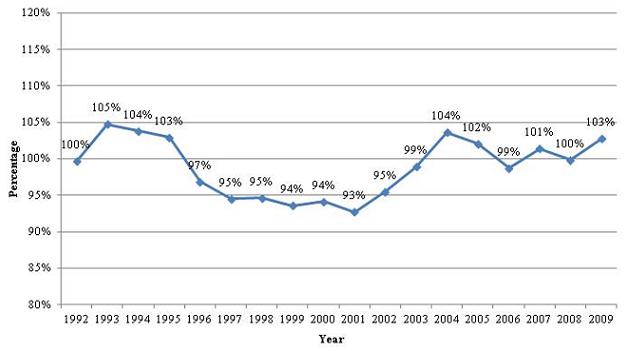
SOURCE: LifePlans Analysis of NAIC Experience Reports, 2010.
As shown, there has been variability in cumulative industry performance over the last decade. If we focus exclusively on the last six years, in four of six of these years the actual-to-expected loss experience has been over 100%; the average ratio over the past six years has been 102%; this compares to a ratio of 95% in the preceding eight years. Moreover, given this represents cumulative experience, for the ratio to increase by three percentage points between 2008 and 2009 suggests that the annual performance for that year must have been much worse than this.
As mentioned, in 2009 the NAIC changed its reporting format for companies and experience tracking for the new format. Data in these reports is not directly comparable to data from earlier reports because certain methodologies had changed regarding calculation of the actual-to-expected loss percentages. In the context of the new reporting, and as shown in Figure 12, based on recent data on the annual actual-to-expected incurred claims, experience over the last three years has been worse than what was priced for.
FIGURE 12. Industry Actual to Expected Annual Incurred Claims: 2009-2011
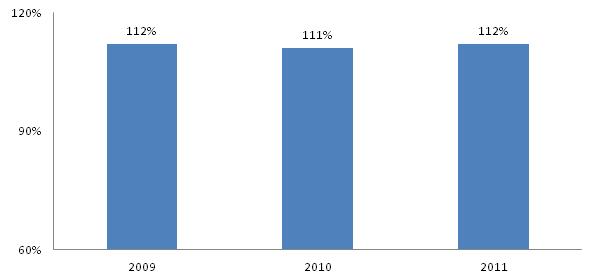
SOURCE: NAIC Experience Reports, 2012.
To obtain a summary view of industry change on key market indicators, we present data from the beginning and end of the decade, including information on market concentration. As shown in Table 9, market concentration has increased over the decade, with the top ten companies now accounting for slightly more than two-thirds of covered lives and the top five accounting for more than half of all policyholders. Given the recent exodus of additional companies from the market, such concentration is likely to grow.
| Industry Parameter | 2000 | 2010 | Change |
SOURCE: LifePlans Analysis of NAIC Experience Reports, 2011.
|
|||
| Earned Premium | $5,155,000 | $10,614,816 | 106% |
| Incurred Claims | $1,870,000 | $6,350,413 | 240% |
| Loss-Ratio | 36% | 60% | 67% |
| Actual Losses Incurred to Premiums Earned (%) | 34% | 42% | 24% |
| Actual losses Incurred to Expected Losses Incurred (cumulative) | 94% | 103%a | 10% |
| Number of Covered Lives | 4,497,120 | 7,263,283 | 62% |
| Industry Concentration: Number of Covered Lives | |||
| Top 5 | 41% | 55% | 34% |
| Top 10 | 63% | 69% | 10% |
| Top 15 | 74% | 78% | 5% |
| Top 20 | 81% | 84% | 4% |
| Carrier with Largest Market Share | 10% | 15% | 50% |
In addition to identifying the motivations for leaving the market, we also asked if there were specific actions that were taken in support of staying in the market. Figure 13 shows that most companies changed product design and also changed rates on existing products. As well, more than two-in-five and one-third respectively changed their risk management techniques and tried new approaches to marketing and sales. Not shown in the figure is the fact only three of these companies (12%) have not raised rates on existing policies. For the remainder of companies, roughly two-thirds raised rates before they left the market. Only three companies left the market because of a sense that they needed to raise rates and this would make ongoing sales extremely difficult.
FIGURE 13. Actions taken Prior to Leaving the Market
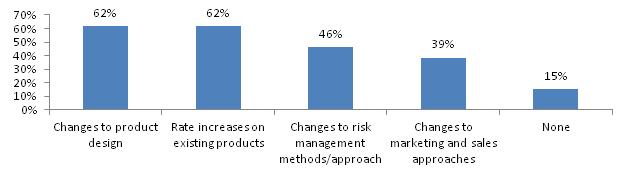
SOURCE: Survey of executives from 26 LTC carriers who exited the market or exited segment of the market.
Clearly, these actions represent most of the "levers" that a company can pull to influence underlying product profitability. We know for example that companies changed product designs, tightened up their approaches to underwriting and claims management, and increased premiums. Some of these actions can only influence performance on new policies issued (e.g., underwriting approach, marketing approaches, and policy design changes) whereas others can also affect the performance of older policies (e.g., rate increases and claims management strategies).
Although not explicitly addressed in this study, we also know that the specific investment strategy vis-à-vis RBC and premium reserves has a major effect on profitability. While companies have little control over general interest or inflation rates, there are hedging strategies that can be undertaken to improve product performance. Such strategies are important because insurers are paying fixed rates on forward contracts; that is, premiums are received on an ongoing basis and they have to be invested in assets that mature around the expected payout dates.51 This can cause a mismatch between future cash inflows and outflows because payouts can be influenced by macro-economic trends that are outside of the control of the carrier.
Although few companies indicated that the need for rate increase activity is what drove them to leave the market, there was general concern across companies about the impact that this would have on sales. We asked respondents how concerned they were with being able to continue selling the product if rates on the product had to be raised. Figure 14 shows that roughly two-in-five respondents were somewhat or very concerned, and this had more to do with reputation risk and the impact on consumer confidence than it did with losing business to a competitor.
FIGURE 14. Level of Concern about Selling the Product if In-force Rates had to be Raised

SOURCE: Survey of executives from 26 LTC carriers who exited the market or exited segment of the market.
D. Current Market Activity
Given the dramatic changes in market participation over the last decade, it is challenging to obtain an accurate count of the total number of companies selling policies in the marketplace. Some companies report sales of less than ten policies a year and others show no policies in one year and then a small number of policy sales in a subsequent year. In the year 2000, AHIP conducted a survey and found that 125 companies were selling policies in the marketplace; by 2002, however, this number had fallen to 104 -- a 17% decline in just two years.52 This survey has not been replicated since 2002.
Today, the most reliable source of information on company-specific activity is provided by the NAIC. Their most recent report, published in 2011, focuses on the top 100 companies reporting premium and claims information on any LTC insurance policies that they have in-force in 2010. The report showed that fewer than 20 companies were actively selling stand-alone LTC policies in 2010; by 2012, only 11 companies were selling at least 2,500 new stand-alone individual or group policies annually in the marketplace.53, 54 It is important to note that these figures do not include companies that are selling various combination-products such as Life-LTC or Annuity-LTC products. These products still account for a very small -- but growing -- part of the overall market. Some view such combination-products as the wave of the future for the industry and the most promising way to increase the number of people covered by insurance. Moreover, given some of the off-setting risks in these products, they may also exhibit more premium stability over time, thus enhancing their attractiveness in the market.
During 2012, companies writing at least 2,500 policies include:55
- Bankers Life and Casualty
- Genworth Financial
- John Hancock Financial Services (Individual Market)
- Knights of Columbus
- MassMutual Financial Group
- MedAmerica Insurance Company
- Mutual of Omaha
- New York Life Insurance
- Northwestern Long Term Care Insurance Company
- Prudential56
- State Farm
- TransAmerica Life Insurance
As of the end of 2011, policy sales for these companies totaled 223,000 which were below 1990 levels.
Table 10 shows the top ten companies selling individual LTC policies in 1995 and their status as of 2012.57 Noteworthy is the fact that six of the companies are no longer actively selling policies in the market and three have been acquired by others in the top ten. Moreover, in 1995 these companies together sold slightly less than 300,000 policies, and by 2011, had experienced a net decline of 43% in annual policy sales.
| Company | # Policies Sold 1995 | # Policies Sold 2011 | Exit/ Acquisition Date |
| Total | 299,300 | 128,819 | |
| Aegon/Transamerica | 22,000 | 7,095 | Exited in 2005 and 2010 re-entry |
| CNA | 24,000 | 0 | Exited individual in 2000 and Group in 2003 although continuing to take enrollments on existing groups. |
| Bankers Life and Casualty | 38,800 | 10,948 | In Market |
| American Travellers (Conseco) | 51,700 | 0 | Exited in 1996 |
| Amex/Genworth | 58,100 | 90,190 | In Market |
| IDS | 24,000 | 0 | Acquired by Genworth in 1995 |
| John Hancock | 16,700 | 20,586 | In Market (2010 pause in Group Market) |
| Penn Treaty | 27,400 | 0 | Exited in 2008 |
| Fortis LTC | 18,600 | 0 | Acquired by John Hancock 2000 |
| Travelers | 18,000 | 0 | Exited in 2000 and reinsured by Genworth in 2000 |
Currently, individuals with LTC insurance policies are either being serviced by companies who continue to sell in the market or by those who have exited and are no longer selling policies. The latter are considered to be in "closed-blocks".58 In order to determine the size of the closed-block market, we analyzed and updated information from the 2010 NAIC Experience Exhibit reports. Table 11 shows the current state of the market for companies that comprise 95% of total market share, and are selling at least 2,500 policies a year. For the purposes of this analysis, we define a company as having left the market to be one that ceases selling new policies to any part of the market or to a particular market segment (e.g., group versus individual).59 For companies that have only pulled back from a specific market segment, all reported performance-based data applies only to that market segment.
In general, company size, product offering, and geographic location do not differentiate firms that have left the market versus those that have remained. In 2010, annual premiums for companies still selling policies in the market totaled $5.3 billion compared to $4.7 billion for those who exited the market and were administering "closed-blocks" of business -- 53% compared to 47% of the total. On a cumulative premium basis, however, closed-blocks represented 55% of all earned premiums. Regarding claims, in 2010, closed-block companies represented 53% and 57% of annual and cumulative total claims costs. As demonstrated below, just one year earlier, the picture looked very different.
| Companies Still Selling in the Market | Companies Out of the Market |
| SOURCE: Analysis of NAIC Experience Exhibit Reports, 2011 and LifePlans Sales Survey 2012. | |
|
|
The 2009 NAIC Experience Exhibit Report is the last that contains detailed information on actual-to-expected loss experience by company. In that year, 192 companies reported their individual claims experience. We extracted and analyzed information from that study in order to determine whether or not the experience of companies that left the market differed from those that remained in the market. At that time, there were about 27 companies (among those reporting that year) that were actively selling policies. The remainder administered closed-blocks or had negligible sales. Figure 15 summarizes key market size and performance indicators for each of these distinct segments in 2009. As indicated, quite a few companies left the market between 2010-2012, so the picture would likely look different today than it did just a few short years ago.
FIGURE 15. Market Indicators by Company Sales Status 2009
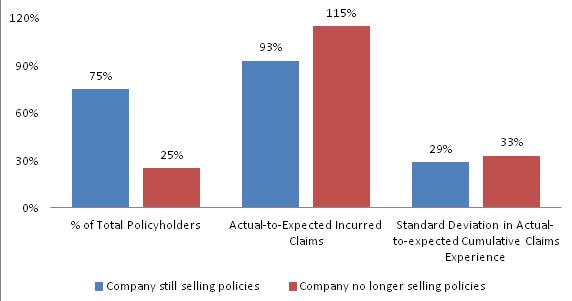
SOURCE: LifePlans Analysis of NAIC Experience Reports, 2010.
There are a number of important issues of note. First, in 2009, a majority of individuals with LTC insurance policies were being serviced by companies selling policies (75%). However, not shown in Figure 15 is the fact that by 2010 -- when additional companies exited the market -- the percentage of policies serviced by companies' still selling policies in the market had fallen to 45%. Second, on a premium-weighted basis, the actual-to-expected incurred claims experience in closed-blocks was 115% compared to 93% for companies still selling policies at that time. Thus, experience was markedly worse for the companies that had already left the market, and the impact on profitability was clearly negative. Finally, there was also somewhat greater volatility in the cumulative actual-to-expected claims experience among companies that exited the market. Volatility is an important performance indicator, because the greater the level of volatility, the greater is the range of possible negative (and positive) outcomes. Typically, when there is more variability in expected outcomes, to attract capital, the return needs to be greater than for products or industries with less volatile results. Taken together, these data suggest that unless there are significant new entrants to the market, over time overall financial performance will be increasingly dominated by the experience of closed-block companies, and such experience to date, has been less positive than for companies still selling policies in the market. To some degree, the relative difference in performance is not unsurprising given that closed-blocks tend to derive from companies whose policies were sold many years ago when there was less certainty around key pricing parameters affecting premiums and claims.
E. Factors that Might Lead Companies to Re-Enter the Market
Many of the same reasons that compelled companies to enter the LTC insurance marketplace 20-30 years ago remain relevant today. Foremost among them is the fact that LTC represents the single largest unfunded or uncovered liability during retirement and demographic trends suggest a growing need for the product. Yet it is clear from the data presented thus far, that a variety of factors have made the product in its current form a difficult business proposition for companies. The underlying risk in the product, which results in significant capital requirements and the need for a meaningful rate of return on that capital make it difficult to generate an attractive level of profit at an affordable price to support robust sales. We asked all respondents whether they believed that their own company had left the door open to coming back into the market at some point in the future. About 42% of respondents affirmed their belief that the "door remained open". When queried further, only one-quarter indicated that the chance was greater than 25% and the other 75% said that the chance was very low or that it simply was not going to happen. Not shown is that roughly one-third estimated that if they returned to the market, it would be within the next five years.
FIGURE 16. Chance that the Company would begin Selling LTC Insurance Again

SOURCE: Survey of executives from 25 LTC carriers who exited the market or exited segment of the market.
We also queried respondents on what might be needed to have them reconsider their decision. We asked about regulatory, public or other policy design changes that might make it more attractive for them to again develop and sell policies in this market. More specifically, for a series of policy design and regulatory changes, we asked whether the recommended change would "Definitely", "Maybe", "Probably Not", or "Definitely Not" influence their decision to reconsider entering the market. In the survey instrument, background information was provided for each recommended change so that the respondent knew precisely what was being asked. In Table 12, we paraphrase the changes that were offered.
It is important to note that many of the changes that we asked about have been put forward by industry advocates as positive and supportive of the private market. The focus of our inquiry, however, was not on their desirability, but rather, whether they would make a difference in the decision to re-enter the market. Thus, if a respondent indicated that a particular change would "Definitely Not" make a difference regarding market re-entry, this does not mean that the change would not be viewed positively or important to efforts to support the private market.
| Change | Would the Recommended Change InfluenceCompany to Reconsider Entering the Market? | ||||
| Definitely | Maybe | Probably Not | Definitely Not | Undecided/ Other | |
|
SOURCE: Survey of executives from 25 LTC carriers who exited the market or exited segment of the market. NOTE: It is not always clear that a number of the policy designs are not currently allowed; however, there is enough uncertainty about regulatory and tax treatment, that it might be the case that this represents a barrier.
|
|||||
| Having premium rates vary by interest rate. That is, having the ability to file multiple sets of new business premium rates the use of which is automatically determined by an external interest rate index for new business premium rates and in-force premium rates.a | 4% | 36% | 20% | 36% | 4% |
| Having premium rates vary by interest rate. That is, having the ability to file multiple sets of new business premium rates the use of which is automatically determined by an external interest rate index. | 4% | 32% | 24% | 36% | 4% |
| Allowing stand-alone LTC and/or combination-products to be funded with pre-tax dollars. | 8% | 25% | 33% | 29% | 4% |
| Being able to offer other combination-products for example, disability income with LTC, or critical illness with LTC rather than just life and annuity combination-products. | 4% | 28% | 28% | 40% | --- |
| Being able to offer a Universal LTC policy design which would allow for premium flexibility, interest crediting, cash values, age and/or duration adjusted insurance charges (current and guaranteed) for LTC, and surrender charges. | 8% | 20% | 24% | 40% | 8% |
| Allowing stand-alone LTC and combination-products to be offered in cafeteria plans. | --- | 21% | 42% | 38% | --- |
| Changing the mandatory offer of 5% compound inflation protection to a mandatory offer of 2% inflation protection. | --- | 20% | 32% | 40% | 8% |
| Removing the requirement of offering 5% compound inflation protection on a combination-annuity product. | --- | 16% | 16% | 52% | 16% |
| Removing the requirement for a minimum benefit period. | 4% | 8% | 38% | 42% | 8% |
| Requiring all agents to get LTC education to obtain their life/health license and continuing education. | --- | 8% | 36% | 52% | 4% |
| Changing the application to remove questions about other health coverage, financial questions, or reconfirming benefit choices.b | 4% | 4% | 16% | 72% | 4% |
| Allowing longer Elimination Periods like 180 day period. | --- | 4% | 44% | 48% | 8% |
| Allowing Waiting Periods for those who are insurable today, but want benefits in later years or using a Waiting Period as an underwriting tool. | --- | 4% | 36% | 52% | 8% |
| Allowing multiple policyholders to share one pool of benefits so that benefits are not "saved" but are exhausted when used up, regardless of who uses them. | --- | --- | 20% | 72% | 8% |
| Last-survivor policies which would pay benefits only after one spouse had died. | --- | --- | 28% | 64% | 8% |
As shown in Table 12, there are very few specific policy design changes or regulatory modifications presented to respondents that would lead companies to definitely reconsider their decision to exit the market. On the other hand, the ability to file multiple business rates -- which in part helps to mitigate the investment (interest rate) risk -- was cited most frequently as a change that would potentially lead to a reconsideration of the decision. Filing multiple business rates would allow companies to charge alternative premiums depending on the level of the interest rates and these premiums would be pre-approved by state insurance departments. As well, expansion of combination-products to include LTC-disability, LTC-critical illness, LTC-annuity products, or others was viewed as something that might cause companies to think about getting back into the market.
Noteworthy is the fact that one-in-three respondents suggested that allowing policies to be funded with pre-tax dollars also would lead them to potentially reconsider their decision. This is a lower percentage than those citing the ability to file multiple rates which suggests that issues related to consumer demand are less important drivers of the decision than are risk management issues; more specifically, risk management on the investment side.
Respondents were given an additional opportunity to express what it might take for them to consider returning to the market. They were asked to indicate the circumstances under which they would consider doing so. They were provided with broad categories and then requested to provide specific suggestions within each category. The categories included changes to regulatory policy, distribution approaches, policy design features, tax status, and consumer attitudes.
Figure 17 shows that product structure changes were cited most often as likely to have a meaningful influence; many of these had to do with the level-funded nature of the product, the "long-tail risk", and the fact that the product is complicated. Those citing regulatory requirements pointed to high capital requirements, as well as a general sense that carriers needed to have more flexibility in product design. Finally, consumer attitude changes that insurers felt might influence a decision to re-enter the market were focused primarily on the need for additional education so that consumers would be aware of the risks that they faced and how the product is designed to address this risk.
FIGURE 17. Circumstances under which the Company would Consider Re-Entering the Market
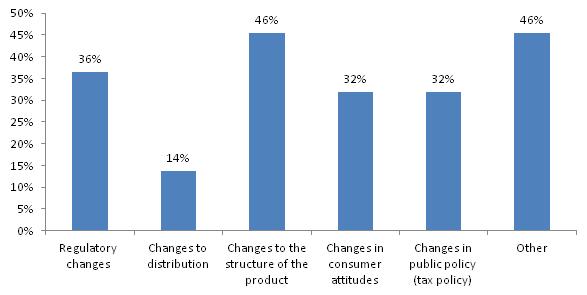
SOURCE: Survey of executives from 25 LTC carriers who exited the market or exited segment of the market.
Implications
By almost all measures, the private market for LTC insurance is not meeting the initial expectations of companies that entered the market as well as current expectations of those that continue to sell policies. Yet no one disputes the need for a product that insures against the financial risk associated with LTC services nor is there an argument about the fact that this need will increase over time. Even so, as companies have entered the market to fill this need, most have fallen short on meeting sales and profitability objectives and it is this latter failure that has driven most of them from the market.
Clearly companies can do little to influence macro-economic trends affecting interest rates and in fact, many companies have exited the market over the past seven years because of the extremely low interest rate environment. Simply put, they could not generate sufficient income on reserves and RBC to fund future liabilities. Yet there are a number of actions that carriers can take to improve the overall profitability of products. The results presented in this study suggest that the ability to generate a reasonable level of profit is critical to assuring that companies remain in the market and that new companies will find the market attractive.
First, change to the underlying funding structure of products should be considered. Currently, products are level-funded, but they could be priced on a "term-basis", much like life insurance. This may be particularly relevant for individuals purchasing policies at younger ages. For example, the premium could be set to cover the risk (expected claim costs) over the term (e.g., one year) and there would be an understanding that every year the premium would increase to cover the increase in expected claims. At a certain point the premium would be fixed and level-funded, say at age 70 or 75. The schedule may also include a small amount of pre-funding.60 Because the annual increase in premiums could approach 10%, in addition to limiting the age at which premiums can be increased, it may also make sense to limit annual increases to smaller amounts.61
Such an approach minimizes the importance of interest earnings, makes the product more affordable and attractive at younger ages and makes awareness of future LTC risk more pervasive. This in turn, should help to reduce selling costs and "mainstream" the product as part and parcel of a standard retirement plan. Results presented here suggest that it may also draw companies back into the market.
A second approach involves indexing both premiums and benefits to account for increases in the cost of services. Such an approach should be tied to actual changes in the cost of LTC services which many companies track on an annual basis.62 This method has the virtue of reducing the uncertainty around the inflation risk, as well as lowering initial premiums, since a fixed inflation adjustment (e.g., 5%) is not built into the initial premium. It makes the product more affordable for consumers but even more importantly, reduces the level of initial reserves that must be set up by the company, which in turn eases the amount of capital required to support the product.
Clearly, a focus on restructuring the product is an important direction to consider for the industry as well as for regulators, who have a great deal to say about what is and is not acceptable in terms of product design. The industry will need to work with the NAIC as well as consumer groups to assure acceptance of such designs. Even though current regulations do not prohibit such approaches, insurers have not offered them in part because of a concern about introducing additional complexity into the product. Moreover, there is a legitimate concern that increasing premiums for people who are on fixed incomes will cause them to drop their policies. Designs that begin with term or indexed pricing, and then adjust the indexing rate downward at a certain point can reduce these concerns. As well, new combination-product approaches are also designed (in part) to lower the inherent risk in the product or even provide for off-setting risks (mortality and morbidity) within a single product (e.g., annuity-LTC products).
Another strategy involves deploying more sophisticated investment strategies. Even with major changes in product design, there will always be some need for an investment strategy that maximizes returns on invested premiums and capital. While companies have little control over general interest rates, there are mechanisms that can minimize some of the risk associated with the mismatch between future cash inflows and outflows. Helwig et al. (2007), identify a number of financial market innovations that can mitigate interest and inflation risk in products. For example, a carrier can use what is called a "Forward Interest Rate Swap" to lock in future interest rates; it then replaces these contracts with assets funded by future premiums which can help to match the asset/liability of their profile.63 The same principle holds for Inflation Swaps; the carrier pays a fixed inflation rate in exchange for the realized inflation rate for a period of time, thus eliminating any uncertainty about future inflation. These strategies are designed to hedge against the inflation and interest rate risks and they do require a level of sophistication in managing investment portfolios.
Providing companies with more certainty regarding the anticipated actions of state insurance departments vis-à-vis requested rate adjustments is also very important. Many companies were uncertain how they would be treated by regulators when making rate increase requests. While it is true that the vast majority of companies have increased rates on exiting policyholders, in many cases the approved rate change is less than what carriers demonstrated they required to cover anticipated losses, let alone earn a minimum return on their investment. Insurance regulators must of course balance insurer solvency and consumer protection, and it is not the role of insurance regulators to guarantee a certain level of profit to companies. Nevertheless, the concern about being able to obtain rate changes, when state-approved actuarial assumptions have not been met, is real: the product is priced to be guaranteed renewable but not non-cancellable.64 This means that companies have approached this market with the knowledge that if experience is not consistent with underlying pricing assumptions -- all of which are reviewed and approved by state insurance departments -- they have the ability to make adjustments prospectively. One approach to dealing with this issue and viewed positively by many companies is the ability to file multiple business rates that could be pre-approved and triggered when events occur outside of the control of the individual company such as precipitous declines in interest rates. This has the virtue of reducing the inherent risk in the product and thus may attract more capital and firms into the marketplace.
By taking some of the most risky elements out of the product, one could argue that relatively high capital requirements would no longer be justified. High capital requirement have been both a major barrier to entry as well as a major reason why companies have not been able to justify staying in the market. New arrangements with reinsurers may also reduce some of the need for capital, but this would also require changes in product to make the business opportunity attractive to reinsurers.
Finally, actions designed to reduce the costs of producing the product will enhance profitability. The most important non-claims related cost is sales commissions. Many view them as high today, in large part because of challenges in selling the product and the need to attract more agents to sell LTC insurance. As noted, however, given the challenges involved in selling the product, commissions are not out of line with what is paid for other voluntary insurance products in the individual market. There are a variety of reasons why it is difficult to sell the product and these have been outlined -- along with potential solutions -- in Frank et al. (2013).65 Some of the reasons relate to household behaviors associated with savings, purchase of insurance, and health-related behaviors (i.e., demand) and others with the efficiency of the private insurance market (i.e., supply). Solutions include strategies linking LTC insurance to health insurance, simplifying the product, providing more support for employer-sponsorship of insurance, educating the public about the risk and costs of LTC, forcing active choice, providing state-based organized reinsurance pools to provide a "back-stop" for industry experience, implementing targeted subsidies, and others. All of these strategies are designed to increase demand -- both through lowering selling costs and through changing peoples' attitudes about the value of LTC insurance -- and help address risk challenges facing the industry.
While not directly related to the central issue of product profitability, it is worth noting again that a majority of policyholders are in closed-blocks of business. These tend to perform less favorably than open blocks and in fact, a small number of large companies are responsible for this experience among both closed and open blocks. Thus, negative performance is to some degree skewed by a few companies and may not represent the overall experience of the industry as a whole. Unless there is a dramatic increase in new sales, the experience of these blocks will increasingly characterize overall industry performance. Because such blocks may not represent significant profit or growth opportunities for companies, it may become increasingly difficult to attract necessary levels of investment to service the policyholders in these blocks. As well, it may become increasingly difficult to attract and retain top risk management talent to work with a segment of the business that has been deemed unprofitable.
This poses potential risks to policyholders and challenges to regulators who may face unique issues associated with closed-blocks of business. A certain level of regulatory flexibility may be required to work through new and unknown issues. There may be circumstances where carriers desire to take actions that will benefit consumers as well as reduce costs or mitigate risks to the carrier, and it may not be clear whether such actions are allowable under existing regulations. For example, adding no-cost riders to policies that enable a more proactive approach to managing care, offering policyholders the ability to change the underlying structure of benefits to keep premiums more stable, supporting flexible approaches to applying alternate benefit provisions that take account of changes in the service delivery environment and so on.
Conclusion
Although the market has experienced a very major contraction in the number of companies actively selling policies, it is worth noting that the LTC insurance market covers more than seven million Americans and is larger than the individual disability market. Significant reserves have been established to pay for future LTC costs and the increasing flow of private insurance dollars to LTC providers is growing in importance. As essential, there is a core of major insurers highly committed to this market and under the right circumstances more carriers could be drawn back into the market.
While many early market entrants learned the "hard way" about what is required to price and manage the risks in this product, there have been many valuable lessons learned. Such lessons can help set the industry on a more solid financial foundation and make entry for new carriers a more attractive proposition. Identifying strategies that produce a level of profitability attractive enough to draw capital into the market is a key to assuring that the growing demand for the product can be met by a robust and competitive market of insurers. Public policy and regulatory approaches designed to lower the cost of policies, allow greater product funding-flexibility, support new forms of combination-products, and encourage strategies that help to minimize risks outside of the control of companies, could provide needed support for a market "re-set".
Notes
-
Mature Market Institute (2011). Market Survey of Long-Term Care Costs: The 2011 MetLife Market Survey of Nursing Home, Assisted Living, Adult Day Services, and Home Care Costs. October.
-
O'Shaughnessy, CV. The Basics: National Spending for Long-Term Services and Supports. National Health Policy Forum, 2012. http://www.nhpf.org/library/the-basics/Basics_LongTermServicesSupports_…. Washington, DC.
-
America's Health Insurance Plans (2004). Long-Term Care Insurance in 2002. Research Findings, Washington, DC. June.
-
LifePlans, Inc. (2012). 2011 Long-Term Care Top Writers Survey Individual and Group Association Final Report, Waltham, MA. March.
-
America's Health Insurance Plans (2004). Long-Term Care Insurance in 2002. Research Findings, Washington, DC. June.
-
National Association of Insurance Commissioners (2001). Long-Term Care Insurance Experience Reports for 2000.Kansas City, KS. November.
-
National Association of Insurance Commissioners (2010). Long-Term Care Insurance Experience Reports for 2009.Kansas City, KS. November.
-
National Association of Insurance Commissioners (2011). Long-Term Care Insurance Experience Reports for 2010.Kansas City, KS. November.
-
National Association of Insurance Commissioners (2012). Long-Term Care Insurance Experience Reports for 2011.Kansas City, KS. November.
-
While interim years were available from NAIC, in order to capture the trend over the decade, we focused exclusively on these years.
-
This theory of the firm parallels the theory of the consumer which states that consumers seek to maximize their overall well-being (utility).
-
It is important to note that the information about firm entry to the market is based primarily on interviews with companies that have since left the market. The exception is the presentation of some historical information on Amex Life -- currently Genworth Financial.
-
Long-Term Care for the Elderly and Disabled (1977). Congressional Budget Office, Congress of the United States, Washington, DC. February.
-
Health Care Financing Administration, Office of the Actuary, Data from the Office of National Health Statistics in Health Care Financing Review, Fall 1994, Volume 16, Number 1.
-
Among others, these included the Mitchell Bill, which proposed paying for the care of individuals who stayed more than two years in a nursing home and the Kennedy Bill which proposed paying for front-end LTC costs.
-
Kemper Peter (2010). Long-Term Services and Supports. The Basics: National Spending for Long-Term Services and Supports. Presentation to the National Health Policy Forum, Washington, DC. June 18.
-
Market Survey of Long-Term Care Costs (2010). The 2010 MetLife Market Survey of Nursing Home, Assisted Living, Adult Day Services, and Home Care Costs. MetLife Mature Market Institute.
-
Moody's: Long-Term Care Insurers Face Uncertain Future (2012). Moody's Investor Service, Global Credit Research, New York, NY. September 19.
-
Cohen, M. (2011). Financing Long-Term Care: The Private Insurance Market. Presentation to the National Health Policy Forum, Washington, DC. April 15.
-
It is important to note that a number of companies exiting the market have transferred their group business to other carriers and in some cases this may be counted as a "sale", even if individuals purchased their coverage years beforehand. Thus, some of the 42% of new sales could have been comprised of such takeover activity, which was particularly prevalent in 2010-2012.
-
Note that for life insurance first-year commissions are commonly above 100% and the dollar value of annuity commissions is often greater than the value of LTC commissions. Thus, LTC commissions are not out of line with other voluntary insurance products.
-
Stevenson, D., Cohen, M., Tell, E. and Burwell, B. (2010). The Complementarityof Public And Private Long-Term Care Coverage. Health Affairs, 29:1. January.
-
Brown, J.R., Coe, N.B., and Finkelstein, A. (2007). Medicaid Crowd-Out of Private Long-Term Care Insurance Demand: Evidence from the Health and Retirement Survey. In J.M.Poterba, Ed., Tax Policy and the Economy, Vol. 21, pp.1-34.
-
Based on analysis of 500 individuals age 50 and over surveyed in 2010, 2005, and 2000 as well as 1,000 individuals age 55 and over surveyed in 1995 as reported in Who Buys Long-Term Care Insurance in 2010-2011? A Twenty-Year Study of Buyers and Non-Buyers (in the Individual Market), AHIP, 2012.
-
Long-Term Care Insurance 2000: A Decade of Study of Buyers and Non-Buyers. The Health Insurance Association of America, July 2000.
-
Note that the decline in sales in 1994 coincided with the Clinton health care reform debates which included provisions for expanded home and community-based care. This was seen to depress demand as potential buyers waited to see whether or not the legislation would pass.
-
Authors calculations based on policy design data from more than 10,000 policies in 1990, 1995 and 2000 as reported in Who Buys Long-Term Care Insurance in 1994? Profiles and Innovations in a Dynamic Market (2005). Health Insurance Association of America, Washington, DC, and Who Buys Long-Term Care Insurance in 2005? A Fifteen Year Study of Buyers and Non-Buyers (2006). America's Health Insurance Plans, Washington, DC.
-
Bazer, L. (2012). An Outsiders View: The State of the LTCI Industry--Long Term Care from a Rating Agency Perspective. Presentation at the 12th Annual Intercompany Long Term Care Insurance Conference, Las Vegas, March. Moody's: Long-Term Care Insurers Face Uncertain Future (2012). Moody's Investor Service, Global Credit Research, New York. September 19.
-
Meyer, D. (2012). Why Get in? Why Get out? Ratings Agency Perspective on Long-Term Care. Fitch Ratings, presentation at the 12th Annual Intercompany Long Term Care Insurance Conference, Las Vegas, March.
-
Tolerating Risk: A Look at LTC Underwriting Strategies. Behind the Data, Issue 2, January 2011. LifePlans, Inc., Waltham, MA.
-
U.S. Department of Health and Human Services, Office of Disability, Aging and Long-Term Care Policy (2008). Private Long-Term Care Insurance: Following an Admission Cohort over 28 Months to Track Claim Experience, Service Use and Transitions. Final Report. Washington, DC. April. http://aspe.hhs.gov/daltcp/reports/2008/coht28mo.htm.
-
LTC Financing Strategy Group, 2008. Washington, DC.
-
Authors' analysis of data summarized in AHIP Study of Buyers and Non-Buyers of Private LTC Insurance in 2010, Washington, DC.
-
Website on Partnership Programs: http://w2.dehpg.net/LTCPartnership.
-
Who Buys Long-Term Care Insurance in 2010-2011? A Twenty-Year Study of Buyers and Non-Buyers (in the Individual Market), AHIP, 2012.
-
National Association of Insurance Commissioners (2009). Long-Term Care Insurance Model Act, Legislative History, 640-21. October.
-
Ibid, 2009.
-
Baer, D. and O'Brien, E. (2010). Federal and State Income Tax Incentives for Private Long-Term Care Insurance. AARP Public Policy Institute. Washington, DC.
-
Stevenson, D., Frank, R. and Tau, J. (2009). Private Long-Term Care Insurance and State Tax Incentives. Inquiry 46:305-321. Fall.
-
Wiener, J.M., Tilly, J., and Goldenson, S.M. (2000). Federal and State Initiatives to Jump Start the Market for Private Long-Term Care Insurance. Elder Law Journal 8(1):57-99.
-
Moody's Investor Services. (2012). Special Comment: Long-Term Care Insurance: Sector Profile. September 18.
-
California Department of Insurance Website relating to rate histories of LTC insurance companies. http://www.insurance.ca.gov/0100-consumers/0060-information-guides/0050-health/ltc-rate-history-guide/index.cfm.
-
Helwig, D. (2005). The Basics of Long-Term Care Insurance, New Orleans Life Spring Meeting, May 22-24, Record, Volume 31, Number 1, Society of Actuaries.
-
Meilender, B. (2003). Risk Based Capital, 2003 Valuation Actuary Symposium, SanDiego, CA. September 11-12, 2003. Session 37 PD, Society of Actuaries, 2004.
-
Charsky, D., FSA and Nelson, R., FSA (2012). Personal Communication. December 28.
-
Personal communication with Don Charsky, FSA President of Ability Re and Ray Nelson, FSA Senior Actuary at Ability Re.
-
Note that not all companies hold assets in AAA bonds, but many of them do. In general and across various asset classes in which companies typically invest, returns have declined over the period.
-
Helwig, D., Bhandula, R. and Barrett, N. (2007). Long-Term Care: Hedging Your Bet. Long-Term Care News, Long-Term Care Insurance Section, Society of Actuaries. December.
-
America's Health Insurance Plans (2004). Long-Term Care Insurance in 2002. Research Findings, Washington, DC. June.
-
LifePlans, Inc. (2012). 2011 Long-Term Care Top Writers Survey Individual and Group Association Final Report, Waltham, MA. March.
-
This figure is difficult to determine with precision. Broker World estimates that in 2010 there were 25 companies selling stand-alone policies, but many of these were selling a very small number on an annual basis.
-
Other companies include Auto-Owners Insurance Group, Blue Cross Blue Shield of Michigan (LifeSecure), Country Life, Humana, United of Omaha, and United Security as reported in Brokers World, 2012.
-
Prudential announced its exit from the individual market but took applications through March 2012 and in July it announced its exit from the group market but is taking applications through the middle of 2013.
-
We focus on the individual market due to data limitations associated with group carrier experience in the 1990s.
-
A "closed-block" means that while policyholders who hold policies continue to receive services from the company, no new sales are occurring and hence, no additional individuals are being added to the risk pool.
-
A company may decide to exit one market segment but stay in another if it perceives greater risk or unique challenges in a particular market segment. For example, the administrative burden of implementing rate increases in the group market may be perceived as far greater than in the individual market, and therefore exiting this market may be more attractive to some carriers.
-
This is similar to designing LTC insurance like Universal Life. An account value is credited with premiums and interest earnings and charged with current insurance charges, withdrawals, and expenses. As the account value increases, the net amount-at-risk decreases. The early pre-funding is available to the policyholder in the event of lapse or early death.
-
Mohoric, E. (2013). Long-Term Care Product Design: Two Common-Sense Recommendations. Long-Term Care News, Long-Term Care Insurance Section, Society of Actuaries. January.
-
Both Genworth Financial and MetLife conduct annual cost of care surveys that track changes in the cost of key LTC services including nursing home care, assisted living, and home health care.
-
Helwig, D.,Bhandula, R. and Barrett, N. (2007). Long-Term Care: Hedging YourBet. Long-Term Care News, Long-Term Care Insurance Section, Society of Actuaries. December.
-
A guaranteed renewable product in this context means that the insurer cannot cancel a policy if the individual continues to pay premiums but the company does have the right to change premiums based on credible experience for a class of individuals. A non-cancellable policy implies that the company cannot change premiums once they are set, regardless of whether or not pricing assumptions are met.
-
See Frank, R., Cohen, M. and Mahoney, N. (2013). Making Progress: Expanding Risk Protection for Long-Term Services and Supports through Private Long-Terms Care Insurance. Unpublished policy brief submitted to the SCAN Foundation. January.