
ASPE ISSUE BRIEF
Child Care Eligibility and Enrollment Estimates for Fiscal Year 2003
April 2005
This Issue Brief is available on the Internet at:http://aspe.hhs.gov/hsp/05/cc-elig-est03/
Printer Friendly Version in PDF
Contents
- Summary
- Key Components of the Estimate
- Percentage Served by Age and Poverty Status
- Discussion of Estimate
- Conclusion
Summary
Over eight million children were potentially eligible for child care subsidies in 2003, under the eligibility rules of the Child Care and Development Fund (CCDF). While we do not know how many of these children were in families that needed help paying for child care, 28 percent of the potentially eligible children received subsidized care through CCDF or related funding streams in fiscal year 2003. An even larger percentage of children in families with income below poverty were served.
The 28 percent estimate reflects the fact that while an estimated 8.33 million children are potentially eligible for assistance under the CCDF eligibility guidelines set by the states, 2.36 million children were actually enrolled in HHS-funded child care assistance programs and 2.36 million enrolled out of 8.33 million eligible is a coverage rate of 28 percent. 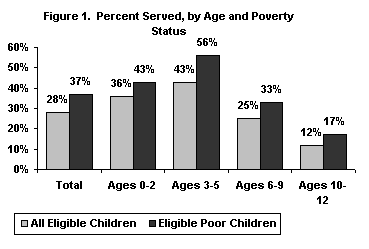
Younger children are more likely to receive child care subsidies than older children. In addition, states clearly target subsidies to poorer families. Poor 3-, 4- and 5-year old children with working parents have the highest coverage rate among all eligible children 56 percent (see Figure 1). In contrast, eligible children ages 10 to 12 have the lowest coverage rate 12 percent.
Some of the families classified as eligible for assistance have little interest in child care subsidies. In fact, research indicates that many parents prefer unpaid care provided by relatives, especially for very young children, while school and after-school activities meet some of the need for care for school-aged children. Thus these estimates should not be misinterpreted as a participation or take-up rate among those needing assistance. As a final caveat, both eligibility and enrollment estimates have changed over time, due in part to actual changes and in part to improvements in estimation techniques, as explained in a technical appendix to the Issue Brief.
[ Go to Contents ]
Key Components of Estimate
Eligibility Estimate. An estimated 8.33 million children were eligible for child care assistance in an average month in 2003, under the eligibility rules of the Child Care and Development Fund (CCDF). Under CCDF, the Federal government provides $4.8 billion to the states, tribes and territories to provide child care assistance vouchers to low-income families when the parents work or participate in education or training. States are required to contribute state funding to CCDF, and also may transfer funds from the Federally-funded Temporary Assistance for Needy Families (TANF) program to CCDF. Within broad Federal parameters, states have considerable flexibility in setting income eligibility guidelines, setting parental co-payment fees, determining reimbursement rates to child care providers, and giving priority for services to particular target populations.
The 2003 estimate relies upon data from the Current Population Survey for calendar year 2003 and state eligibility rules in the two-year CCDF plans that were effective as of October 1, 2003. Though these rules vary by state, they generally require the following:
- Eligible children must be under age 13 (unless the child has special needs);
- The income of the child's family must fall below levels set by the state. For example, the income guidelines for a family of three in Oct 2003 ranged from $15,000 in Ohio to over $46,000 in Alaska);(1) and
- The child's parents must be working or in school. In nineteen states, parents must be working a certain number of minimum hours (ranging from 15 to 40 hours per week) to qualify as working. For this eligibility estimate, HHS has defined working in the other states to mean working one hour or more for children under 4 years old and working 20 hours or more for children age 4 or older.
To produce the eligibility estimate, the Office of the Assistant Secretary for Planning and Evaluation (ASPE) of HHS contracted with the Urban Institute to add the state-specific CCDF eligibility rules to the Transfer Income Model (TRIM). TRIM is a microsimulation model that converts annual data from the Current Population Survey into monthly data, compares these data on family income and work status to CCDF rules, and generates monthly estimates of children and families eligible for CCDF. These monthly estimates are averaged to produce an average monthly estimate for the year.(2)
While the model is able to determine technical eligibility based on child's age, parental work and education status, and family income, it does not have the capability of predicting which families actually need subsidies. For example, the model includes all children ages 10, 11, and 12 whose families meet the work and income requirements, regardless of the parents' work schedule, the children's school and activity schedule, and the living arrangements and proximity of family and relatives. It also includes all 4-year olds, without taking into account whether they are already enrolled in Head Start programs or state pre-kindergarten programs.
Enrollment Estimate. In fiscal year 2003, an estimated 2.36 million children received care services through the Child Care and Development Fund (CCDF) and other HHS funding streams in an average month. While the majority of these children received assistance through CCDF, this enrollment estimate includes subsidies funded directly through the TANF program or the Social Services Block Grant (SSBG). More specifically, the enrollment figure includes:
- 1.75 million children funded through CCDF, based on data reported by states to HHS;(3) plus
- an estimated 610,000 children served through three other funding streams TANF funds spent directly on child care, state funds claimed for TANF maintenance of effort (MOE) funds, and SSBG funds. Because states do not report the number of children served through these funding streams, the 610,000 figure is an HHS estimate based on expenditures from each stream, divided by average subsidy costs reported in CCDF.(4)
Some analyses of CCDF coverage rates include the children funded by TANF transfers but do not include the children receiving child care directly through TANF or SSBG programs, because these children are not included in the state caseload reports and are difficult to estimate.(5) Excluding these children, however, ignores the substantial amounts of child care subsidies provided through TANF, TANF MOE, and SSBG funding. For example, these three sources accounted for nearly one-fourth of the $11.5 billion in Federal and related state funds available for HHS-funded child care programs in 2003.(6) Even adding TANF and SSBG programs does not fully address all programs meeting some or all of children's needs for child care; most notably, these enrollment estimates do not include children served through Head Start, pre-Kindergarten programs, or other state-funded programs.
Percentage Served. An enrollment of 2.36 million children out of 8.33 million eligible children indicates that 28 percent of children meeting the basic eligibility criteria were served (2.36 divided by 8.33).
[ Go to Contents ]
Percentage Served by Age and Poverty Status
Some children are more likely to receive child care services than others. Differences by age are particularly significant (see Table A). For example, the percentage served is much higher among pre-school aged children than school aged children (43 percent for children ages 3 to 5, compared to 12 percent for children ages 10 to 12). This variation by age is not surprising, given the higher use of formal child care arrangements for pre-school aged children in the general population, and the wider array of after-school activities available to older children.
| Ages 0 - 2 | Ages 3 - 5 | Ages 6 - 9 | Ages 10 - 12* | Total Children 0 - 12* | |
| Enrollment in CCDF-, TANF- and SSBG-Funded Care (FY 2003) | 0.66 | 0.86 | 0.61 | 0.24 | 2.36 |
| Potentially Eligible Children (2003, based on State Eligibility Rules as of Oct 2003) | 1.84 | 1.99 | 2.46 | 2.04 | 8.33 |
| Percentage Served | 36% | 43% | 25% | 12% | 28% |
| * Includes a few children 13 and older who are eligible for subsidies because of special needs. Numbers may not add to totals due to rounding. | |||||
States generally target child care assistance to families with the greatest need, including families in welfare-to-work programs, and working families with the lowest incomes. The clear effects of this targeting can be seen in Table B, which examines the subset of eligible and enrolled children in families with incomes below the Federal poverty threshold.(7) Less than half of all children eligible for child care subsidies live in families with income below poverty 3.66 million children out of the 8.33 million total. Because of service priorities, poor eligible children have a higher than average likelihood of receiving child care assistance. An estimated 37 percent of poor children were served (compared to 28 percent of all eligible children).
| Ages 0 - 2 | Ages 3 - 5 | Ages 6 - 9 | Ages 10 - 12* | Total Children 0 - 12* | |
| Enrollment of Poor Children in CCDF-, TANF- and SSBG-Funded Care (FY 2003) | 0.41 | 0.47 | 0.34 | 0.14 | 1.37 |
| Potentially Eligible Children below Poverty (2003) | 0.96 | 0.85 | 1.04 | 0.81 | 3.66 |
| Percentage Served | 43% | 56% | 33% | 17% | 37% |
| * Includes a few children 13 and older who are eligible for subsidies because of special needs. Numbers may not add to totals due to rounding. | |||||
As shown in Figure 1, the proportion of poor eligible children served is higher than the proportion of all eligible children served, for each age group. Furthermore, poor 3-, 4- and 5-year old children with working parents have the highest coverage rate among all eligible children 56 percent. In contrast, children ages 10 to 12 from families with incomes below the CCDF eligibility guidelines have the lowest coverage rate 12 percent.
[ Go to Contents ]
Discussion of Estimate
This analysis produces a coverage rate (28 percent) defined as the proportion of children served out of the eligible population. At times, this number has been assumed to be the participation or take-up rate among all children who have applied for, or need, child care assistance. This is a misinterpretation, because the eligibility estimate includes an unknown number of children who have never applied for nor shown any interest in child care assistance due to their family's preference for informal child care arrangements. Research indicates that many working families find unpaid care by family, friends, and neighbors more convenient than more formal arrangements and more consistent with what they want for their children
Family preferences contribute to the observed variation in coverage rates by age. In particular, care by relatives, or by parents working staggered shifts, is often preferred for infant care, while school and programs like the 21st Century Community Learning Centers can meet some of the need for school-aged care. Although these patterns of formal and informal care arrangements are well documented, it is hard to translate such patterns into a quantifiable estimate of how many families would have a real interest in subsidies for paid child care arrangements if such subsidies were universally available. Moreover, even children in the 3- to 5-year old age group, who use the formal arrangements the most, may have their child care needs at least partially met through other options, such as Head Start and pre-kindergarten programs, as well as informal care. Thus it is hard to know how many eligible families need help paying for child care.
[ Go to Contents ]
Conclusion
This analysis has shown that over eight million children are in the broad pool of children and families whose age, income, and parental work status indicate a possible need for child care subsidies. About 2.4 million children, or 28 percent of those eligible, received HHS-funded child care subsidies in an average month of fiscal year 2003, with coverage rates varying significantly by age and poverty status. Interpretation of these coverage rates is complicated by the fact that many of the families classified as eligible for assistance have never applied for subsidies, and are unlikely to ever do so, given their preference for unpaid arrangements.
[ Go to Contents ]
Technical Appendix on Changes in Enrollment and Eligibility over Time
ASPE has produced estimates of the eligible population and the percent served for several years. Estimates of the eligible population have fluctuated over time, from a low of 8.33 million in 2003 to a high of 9.58 million in 2001 (see Appendix Table 1). Reported enrollment has also shown some variation, from a low of 2.15 million in 1999 to a high of 2.52 million in 2001. As discussed below, it is difficult to disentangle real changes in eligibility and enrollment from changes caused by measurement error and revisions to methods of estimation. Interestingly enough, despite the fluctuations in both enrollment and eligibility, the percentage served has been fairly stable since 2000, at 28 percent. It was lower (26 percent) in 2001, but that year was subject to a number of measurement problems, as discussed below.
| Oct 99 Two-Year Plan | Oct 01 Two-Year Plan | Oct 03 Two-Year Plan | |||
| 1999 | 2000 | 2001 | 2002 | 2003 | |
| Enrollment in CCDF, TANF and SSBG Funded Care (Fiscal Year) | 2.15 | 2.45 | 2.52 | 2.44 | 2.36 |
| Potentially Eligible Children (Calendar Year, based on State Plan) | 9.29 | 8.87 | 9.58 | 8.68 | 8.33 |
| Percentage Served | 23% | 28% | 26% | 28% | 28% |
| Trends over time should be interpreted with caution due to changes in method of estimation. | |||||
Changes in enrollment estimates
As noted in the Issue Brief, the caseload estimates are composed of two primary components: CCDF-funded children as reported by the states, and TANF- and SSBG- funded children estimated on the basis of reported expenditures, as shown in Figure A-1.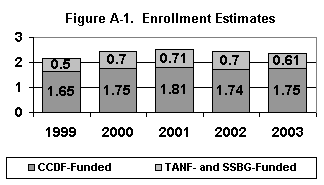 The apparent decline in CCDF average monthly caseload from 1.81 million in 2001 to 1.74 million in 2002 is largely due to improvements in CCDF data reports submitted by California and New York. Specifically, the 2001 estimate may have counted some children twice, and included children funded with state-only funds rather than CCDF-related funds. The Child Care Bureau estimates that the monthly CCDF caseload in FY 2001 would have been 1.72 million rather than 1.81 million if comparable methodologies had been used over time. In other words, the 2001 estimate of enrollment is probably high. Consequently, much of the increase in caseload between 2000 and 2001, and subsequent decrease between 2001 and 2002, is due to data reporting, rather than real changes in numbers of children served.
Changes in eligibility estimates
Changes in the estimated eligible population are due to a variety of factors, including state policy changes, changes in the population and economy, sampling error in the Current Population Survey, and technical changes in the TRIM3 model. While these are difficult to quantify, the text below attempts to give a sense of how these various factors affected the 1.25 million difference between the eligibility estimate of 9.58 million in 2001 and 8.33 million in 2003.
State policy changes that increase or decrease the eligible population. States can tighten or broaden the pool of eligible children and families by adjusting the level of their state's CCDF income eligibility guidelines. Between 2001 and 2003, for example, 26 states decreased eligibility limits, 13 states left them unchanged (expressed as a percentage of state median income), and 12 states increased them. Results from the TRIM microsimulation model suggest the changes in state plans between October 2001 and October 2003 reduced the eligible population by about 230,000 children. While this represents only a 2.4 percent decline in the eligible population, it represents about 20 percent of the total difference between eligibility estimates in 2001 and 2003.(9)
Changes in population demographics and economic conditions. The number of eligible children is also strongly influenced by demographic and economic factors, such as the total number of children, maternal employment rates, and the income levels of working parents. Overall, data from the TRIM3 model suggest that the average monthly number of children under age 13 with working or student parents and income less than 200 percent of poverty dropped by approximately 500,000 children between the time period used for the 2001 estimate, and the 2003 estimate. This decline occurred despite a concurrent increase in the overall child poverty rate. One reason for this apparent inconsistency is that the decline in the TRIM estimates was concentrated among families with incomes below 200 percent of poverty yet above 100 percent of poverty (and so not in the overall poverty rate). In addition, the overall child poverty rate includes non-working families not included in the TRIM estimates and is based on annual rather than monthly income. Finally, some of the decline in children of working parents observed in the TRIM model may reflect sampling error in the CPS or technical changes to the model between 2001 and 2003, as discussed below.(10)
Sampling error in the Current Population Survey. Because the Current Population Survey data are drawn from a sample, all estimates are subject to a degree of sampling error, reflecting the possibility that the particular sample drawn may not fully represent the underlying population. For example, the point estimate of 8.33 million children in an average month in 2003 was the midpoint of a 95 percent confidence interval ranging from approximately 8.04 to 8.62 million children.
Technical changes to the model. While versions of TRIM have been in operation for more than 30 years, the capacity for estimating child care eligibility was just added five years ago, and is still undergoing some refinements. For example, the first eligibility estimate (9.85 million children eligible in 1997) was primarily based on state income eligibility limits, and did not capture state variation in minimum hours requirements and income disregards. These were added for the estimate in 1999, and refined in 2001 (when the state plan instructions were revised to ask for more explicit information on such topics).
Between 2001 and 2003, there were two further refinements that may have affected estimates of children eligible for CCDF. The first refinement only affected states that have a higher eligibility limit for families already receiving subsidies than families newly applying for subsidies about one-fourth of the states. While these higher continuing eligibility limits were used in both 2001 and 2003, they were applied in a more crude way in 2001, which resulted in a slight overestimate of eligibility.(11) The largest change was in Florida, not only because it is the largest state with two sets of thresholds, but also due to an error in interpreting the 2001 rules. The second refinement involved smoothing out estimates of monthly earnings between 4- and 5-week months to avoid the situation where some families move in and out of eligibility over the course of the year solely due to the number of weeks in the month. This refinement also may have contributed to some of the eligibility differences between 2001 and 2003. Finally, there may be some residual difference between the two estimates that is difficult to attribute to any particular policy, economic, or technical change, and may be a result of interactions among them.
[ Go to Contents ]
Endnotes
1. Though stated as annual amounts here, the income is actually measured monthly, with family income based on the income of the parents (or adult relative caretakers) of the children.
2. See Oliver, H., Phillips, Katherin R., Giannarelli, L, and Chen, An-Lon, June 2002, Eligibility for CCDF-funded child care subsidies under the October 1999 Program Rules: Results from the TRIM3 Microsimulation Model (http://aspe.hhs.gov/hsp/05/elig-ccsub/index.htm) for further explanation of TRIM methodology.
3. As defined in data reporting regulations, CCDF-funded children include children funded through Federal CCDF funds, state CCDF funds, and transfers of TANF funds to the CCDF program. While some states include children other than CCDF-funded children in their child care data reports (generally because they combine funds from several funding streams into one child care program), these states also report the percentage of pooled funding coming from CCDF, and this percentage is used to estimate the CCDF-funded children.
4. The estimate assumes that children funded by TANF, TANF MOE, and SSBG have the same subsidy costs per child as CCDF-funded children about $370 per month. Moreover, the subgroup analysis assumes the additional children have the same age and poverty distribution as the CCDF children. (Note that the CCDF subsidy cost is based on expenditures for direct services, excluding CCDF spending on administrative costs and activities to improve child care quality and accessibility. This is appropriate for estimating TANF and SSBG caseloads, because the child care expenditures reported in TANF and SSBG are generally equivalent to direct services expenditures.
5. For example, the Government Accountability Office recently reported a much lower coverage rate 18 percent in 2001 because the GAO estimate did not include the TANF- and SSBG-funded children. See Government Accountability Office (March 2005), Means-Tested Programs. Information on Program Access Can be an Important Management Tool, GAO-05-22).
6. The $11.5 billion includes $4.8 billion in Federal CCDF funds, $2.2 billion in state matching and maintenance of effort funds for CCDF, $1.8 billion in transfers from TANF to CCDF, $1.7 billion in TANF direct funds, $0.9 billion in excess TANF MOE (state child care expenditures claimed as TANF MOE to the extent such amounts are above the amounts already claimed as CCDF MOE), and $0.2 billion in SSBG expenditures related to child care.
7. The poverty population was estimated by comparing monthly family income to one-twelfth of the Census Bureau poverty thresholds, adjusted for family size. This measure of the poverty population is not comparable to the poverty population measured in previous ASPE analyses (e.g., Child Care Eligibility and Enrollment Estimates for Fiscal Year 2001, ASPE/DHHS, April 2003) because of data improvements. Most notably, information on family size was added to the enrollment data in 2003, and so the current estimate uses poverty levels adjusted for actual family size whereas previous estimates assumed a family size of three for the poverty estimates.
8. HHS also produced estimates for rules as of October 1997, but these estimates are too different to include in the table. Primary differences are that the earlier enrollment estimates do not include the additional children funded through TANF-related and SSBG funding sources and the earlier eligibility estimates simulate hypothetical eligibility if all states raised income eligibility to 85 percent of state median income (the level currently used in five states). This lower estimate of enrollment and higher estimate of eligibility resulted in a much lower percentage served (10 percent in an earlier estimate for 1997, and 12 percent for 1999).
9. In addition to setting income limits, states can also affect eligibility by modifying the minimum hour requirements of work, changing the definition of countable family income (e.g., deciding whether or not to count TANF cash benefits as countable income), adjusting the age limit for youth with special needs, etc. Note that the TRIM model only captures those policies that are clearly stated in states' two-year state plans, and so may not capture all state policies. Also, the model applies policies for October 2001 to all of calendar years 2001 and 2002, when in fact, states may make policy changes mid-year, and at more frequent intervals than once every two years. Finally, the pattern of higher estimates in the first years of the two-year plan (1999 and 2001) and lower estimates in the second years (2000 and 2002) may be partly explained by the fact the model applies an unchanging set of income guidelines across two years of data (even though family incomes rise with inflation between the two years).
10. Note that the 2001 eligibility estimate was based on three years of CPS data (calendar years 1999, 2000, and 2001), whereas the 2003 eligibility estimate relies on one year (2003). Therefore, the decline of approximately 500,000 children is measured from the 1999-2001 average to 2003. The decline of approximately 500,000 children would have been half as large if measured from 2001 to 2003.
11. In 2001, all families simulated as eligible for CCDF subsidies in one month were considered to be continuing on CCDF the subsequent month; by the 2003 estimate, the model had been refined so that only families simulated as recipients of CCDF subsidies in one month were considered continuing recipients.