
ABOUT THIS ISSUE BRIEF
This ASPE issue brief on federal child care assistance eligibility and receipt shows that approximately 17 percent of federally-eligible children received subsidized care through CCDF or related government funding streams in an average month in fiscal year 2011.
Office of the Assistant Secretary for Planning and Evaluation
Office ofman Services Policy
US Department of Health and Human Services
Washington, DC 20201
This brief provides descriptive information on child care eligibility and receipt. The brief reports that of the 14.3 million children eligible for child care subsidies under federal rules, only 17% receive subsidies. The population of eligible children is divided into age and poverty categories. The percent of children eligible who receive subsidies is provided for different ages and poverty categories. Characteristics of children who are eligible for subsidies are compared against the subgroup of children who receive subsidies. Data on children eligible under federal and state rules are each provided separately. Data sources are TRIM microsimulation output and 801 child care administrative data.
"Overview
Child care subsidies help parents pay for child care to enable parents to work or attend education and training activities. This ASPE issue brief provides an overview of the numbers and characteristics of children who were eligible for and who received child care subsidies in fiscal year 2011. The main findings are as follows:
- Of the 14.3 million children eligible for child care subsidies under federal rules, 17 percent received subsidies.
- Of the 8.4 million children eligible for child care subsidies under state rules, 29 percent received subsidies.
- Poorer children were more likely to receive subsidies than less poor children.
In fiscal year 2011, federal and state spending totaled roughly $11.3 billion to support child care services to improve the affordability and availability of child care for low-income working families. Funding for child care subsidies was from the Child Care and Development Fund (CCDF) and related government funding streams.1 Typically, CCDF funds are used to subsidize child care services through vouchers, although some states also provide services through grants or contracts. In 2011, over $1 billion was also spent on activities to improve the quality of child care.
Approximately 17 percent of federally-eligible children received subsidized care through CCDF or related government funding streams in an average month in fiscal year 2011 (see Table 1). In this brief, we define federally-eligible children to include all children who are potentially eligible to receive subsidized care based on the federal eligibility parameters of CCDF. Federal statute permits states to provide child care subsidies to qualifying families with incomes below 85 percent of state median income.
Within federal eligibility parameters, states have flexibility in setting more restrictive rules for income eligibility. This issue brief also explores estimates of child care assistance eligibility and receipt based on state-defined eligibility rules, as well as the age and poverty status of eligible children and those who receive assistance.
Table 1: Number of Children Potentially Eligible and Percentage of Eligible Children Receiving Child Care Subsidies, Average Monthly, 2011
| Children Potentially Eligible for CCDF Under Federal Parameters | Children Receiving Subsidies | Percentage of Potentially Eligible Children Receiving Subsidies | |
|---|---|---|---|
| All Children | 14,259,000 | 2,401,000 | 17% |
1 The estimated $11.3 billion spent through CCDF and related government funding streams in fiscal year 2011 includes estimated expenditures on direct child care services of $7.6 billion in federal CCDF funds (including the Child Care and Development Block Grant and supplemental funds appropriated through the American Recovery and Reinvestment Act , the Child Care Entitlement to States, state matching and maintenance of effort (MOE) funds for CCDF, and transfers from the Temporary Assistance for Needy Families Block Grant (TANF) to CCDF). Additional expenditures include $1.4 billion in TANF funding spent directly on child care services, $1.9 billion in “excess TANF MOE” (state child care expenditures claimed as TANF MOE to the extent such amounts are above the amounts already claimed as CCDF MOE), and $0.4 billion in Social Services Block Grant expenditures related to child care.
Child Care Estimates Based on Federal Eligibility Parameters
Seventeen percent of federally-eligible children received subsidized care through CCDF or related government funding streams in fiscal year 2011. This number is based on estimates of the number of children eligible for child care under federal eligibility parameters and the number of children receiving subsidized care.Children Eligible for Child Care Subsidies
An estimated 14.3 million children were potentially eligible for child care assistance under the federal eligibility parameters of CCDF in an average month in 2011 (see Table 1).2 Federal eligibility parameters include:
- Children must be under age 13 (unless the child has special needs and is age 13-18);
- The income of the child’s family must be less than 85 percent of the state median income for a family of the same size;3 and
- The child’s parents must be working or participating in education or training activities.4
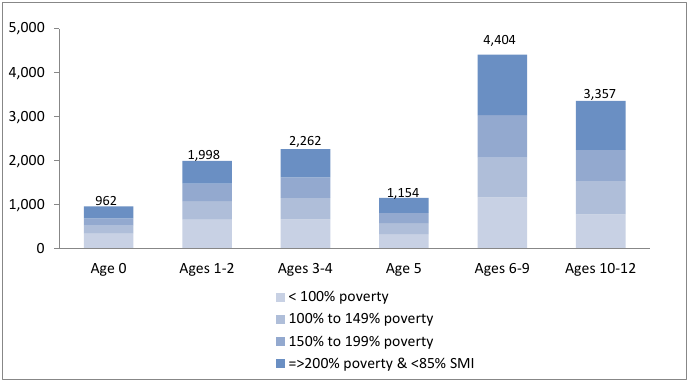
Figure 1 shows estimates of the number of federally-eligible children by age and poverty status. At age 0, approximately 1.0 million children are eligible; at ages 1 and 2, approximately 2.0 million children are eligible; at ages 3 and 4, approximately 2.3 million children are eligible; and at age 5, approximately 1.2 million children are eligible.
Figure 1: Number of Children Potentially Eligible Under Federal Parameters, by Age and Poverty Status, Average Monthly, 2011 (1,000s)
2 The estimates of eligibility were produced using the Transfer Income Model (TRIM), a micro-simulation model developed and maintained by the Urban Institute under contract with ASPE. TRIM converts annual data from the Annual Social and Economic Supplement of the Current Population Survey (CPS-ASEC) into monthly data, compares these monthly data on family income and work status to CCDF rules, and generates monthly estimates of children and families eligible for CCDF child care subsidies. Monthly estimates are averaged to produce an average monthly estimate for the year. The 2011 estimate of eligibility relies upon data from the CPS for calendar year 2011, federally-permitted eligibility rules under CCDF, and state-defined eligibility rules reported in ACF’s CCDF Policies Database as of October 2011. For purposes of these estimates the definition of the assistance unit is based on the subfamily, as defined by the Census Bureau, and family members outside of the subfamily unit are not included in the benefit determination formulas.
3 States are given broad flexibility in deciding what family income is countable for purposes of determining a child’s eligibility. For example, states could disregard TANF payments in income eligibility determinations. States could also exclude income from some adult family members (e.g., an adult sibling or an aunt). As a result, some states may serve children in families with unadjusted incomes greater than 85 percent of the state median income, as defined in this issue brief. In FY 2011, the mean value of the federal maximums (i.e., 85% state median income) for three person families was $4,453 per month ($53,437 annually). However, the average initial eligibility limit before applying disregards for the states was $2,846 monthly ($34,156 annually) as of October 2011. State median income is based on estimates published for fiscal year 2011 in the Federal Register: May 12, 2010 (Volume 75, Number 91).
4 For this eligibility estimate “working” includes all work of one hour or more in a month. The majority (84 percent) of federally-eligible children come from families where the single parent or both parents were employed at least 20 hours per week. An estimated 8 percent of federally-eligible children lived with a parent who was employed between 1 and 19 hours per week. An estimated 8 percent of federally-eligible children lived with a parent that was not working but was in school. Families who are eligible because of participation in TANF-approved work-related activities (e.g., job search) are not included in the eligibility estimate based on federal rules or the eligibility estimate based on state rules).
Children Who Received Child Care Subsidies
An estimated 2.4 million children received child care services through CCDF or related government funding streams in an average month in fiscal year 2011 (see Table 1).5 While the majority of these children, 1.6 million, received assistance through CCDF, this estimate of receipt also includes roughly 800,000 total children with subsidies funded through the following: Temporary Assistance for Needy Families (TANF) program, the Social Services Block Grant (SSBG), and state expenditures claimed as TANF maintenance of effort (MOE) funds.6
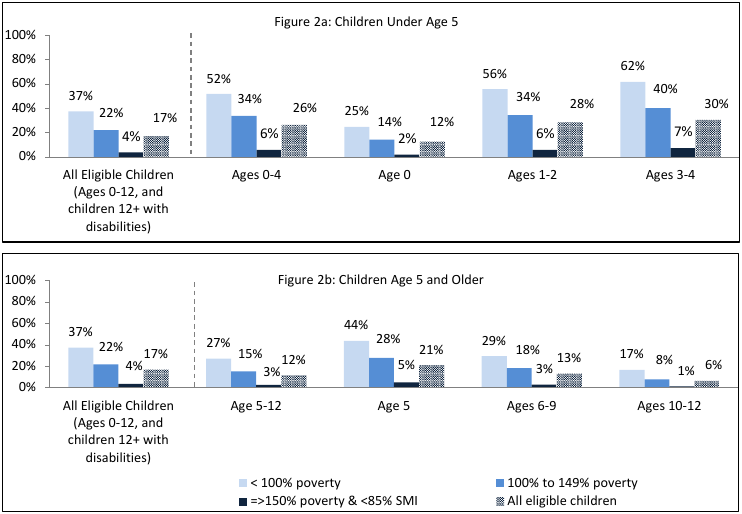
Some children were more likely to receive services than others. Eligible children from the lowest-income families were the most likely to receive child care assistance. Roughly 37 percent of federally-eligible children from families with incomes below 100 percent of poverty and 22 percent of those from families with incomes between 101 percent and 150 percent of poverty were served (see Figures 2a and 2b).7
By comparison, 4 percent of federally-eligible children from families with incomes greater than 150 percent of poverty were served. In the case of families with one adult and two children, eligible children from families with incomes greater than 150 percent of poverty would include those from families with incomes greater than roughly $27,200 (about $2,300 when measured monthly) but less than 85 percent of their state’s median income.
Figures 2a and 2b show that federally-eligible children between ages 0 and 4 were much more likely to receive subsidized care than eligible children older than age 5. In 2011, 26 percent of federally-eligible children ages 0 to 4 were served (including 12 percent of infants, 28 percent of children ages 1 to 2, and 30 percent of children ages 3 to 4). By comparison, 13 percent of federally-eligible children ages 6 to 9 and 6 percent of federally-eligible children ages 10 to 12 received subsidized care. Figures 2a and 2b also show differences in the proportion of federally-eligible children served by family income.
Figure 2: Percentage of Children Eligible under Federal Parameters that Receive Child Care Subsidies, by Age and Poverty Status, Average Monthly, 2011
5 This estimate of receipt excludes about 18,400 children served in U.S. territories as well as children receiving services from only Head Start, state pre-kindergarten programs, or other early childhood programs without funding from CCDF or related government funding streams. This estimate also excludes children served through subsidies administered solely by Indian reservations/tribes.
6 CCDF-funded children include children funded through federal CCDF funds, state CCDF funds, and transfers of TANF funds to the CCDF program. While some states include children other than CCDF-funded children in their child care data reports (generally because they combine funds from several funding streams into one child care program), these states also report the percentage of pooled funding coming from CCDF, and this percentage is used to estimate the CCDF-funded children. The estimate assumes that children funded by TANF, TANF MOE, and SSBG have the same subsidy costs per child as CCDF-funded children, about $382 per month based on state-reported ACF-801 administrative data, and the same age and poverty distribution as CCDF-funded children.
7 Poverty figures are based on 2011 poverty thresholds published by the U.S. Census Bureau, Housing and Household Economic Statistics Division. The Census Bureau threshold is divided by twelve to create a monthly, rather than yearly, threshold. For purposes of determining recipients’ poverty status for this estimate, recipient income is measured after any applicable state-determined income disregards are applied. This estimation process likely overestimates to a small degree the number and percent of children from families below 100 percent of poverty who are served.
Child Care Estimates Based on State Eligibility Rules
Within the federal eligibility parameters of CCDF, states have flexibility in setting income eligibility guidelines, parental co-payment fees, reimbursement rates to child care providers, target populations receiving priority for services, the number of work or education/training hours required, and the length of certification periods.8 Based on state-defined eligibility rules for fiscal year 2011, the average initial income eligibility limits for three-person families across the 50 states and the District of Columbia was $2,800.9 Some states allow counties and other localities to set income eligibility limits lower than the limit set by the state. Some states also allow higher income eligibility limits for families already receiving child care subsidies.
8 Based on data from ACF’s CCDF Policies Database as of October 1, 2011, recipient eligibility was redetermined every twelve months in 22 states and every six months in 27 states.
9 The range of income eligibility limits is based on data as of October 1, 2011. In some states eligibility limits differ for certain groups, such as TANF and SSI recipients. Expressed in terms of state median income, state limits for initial income eligibility in CCDF plans for fiscal year 2011 ranged from 35 percent to 80 percent of state median income. This estimate of state median income for fiscal year 2011 is based on the U.S. Census Bureau calculations published in the Federal Register: May 12, 2010 (Volume 75, Number 91). While the law restricts eligibility to children from families below 85 percent of state median income, states are able to determine the method used to calculate state median income which may differ from the method used in this issue brief.
Children Eligible for Child Care Subsidies
An estimated 14.3 million children were federally-eligible for child care assistance in an average month in 2011. Under state-defined eligibility rules, an estimated 8.4 million children were eligible for child care assistance in an average month in 2011 (see Figure 3).10
Figure 3: Number of Children Eligible and Number of Children Receiving Child Care Subsidies (1,000s), Average Monthly, 2011
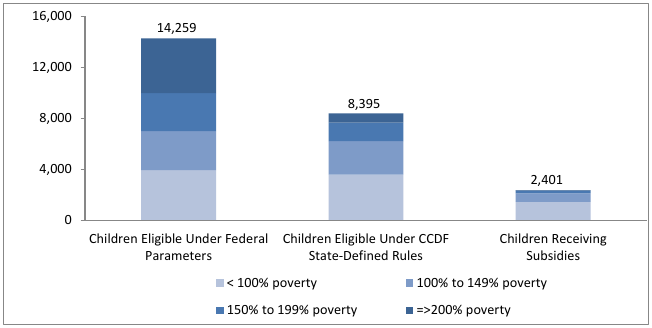
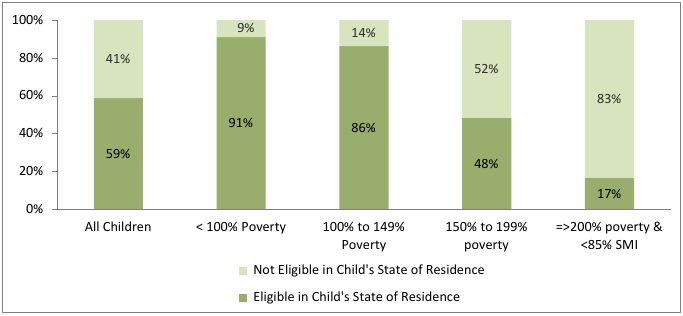
Figure 4 shows the extent to which children eligible for child care subsidies based on federal parameters were eligible under the rules defined by their state of residence. Almost 3 out of 5 (59 percent) of federally-eligible children were eligible for subsidies under state-defined rules. Almost all (91 percent) federally-eligible children from families with incomes less than 100 percent of poverty were eligible under state-defined eligibility rules. By comparison, about half (48 percent) of federally-eligible children from families with incomes between 150 and 199 percent of poverty were eligible for services in their state. This figure11 shows only the percentage of children eligible for subsidies based on federal parameters that also were eligible under state rules and does not indicate rates of participation.
Figure 4: Percentage of Children Potentially Eligible Under Federal Parameters that are also Eligible Under CCDF State-Defined Rules, by Poverty Status, Average Monthly, 2011
10 Some of ASPE’s previous eligibility estimates excluded children age 4 and older who lived with at least one parent working between 1 and 19 hours per week. The estimates shown in this issue brief include this population when it is otherwise eligible. Had the previous methodology been used, the estimated number of children eligible under state-defined rules would have been about 3 percent lower (8,142,200 instead of 8,394,700) and the percentage of children served who were eligible under CCDF state rules would have been about 1 percentage point higher (30 percent instead of 29 percent). This change in methodology was made to provide greater internal consistency with the numerator of the calculation, which includes all children receiving subsidies, including school-aged children living with parents working less than 20 hours per week. This change does not impact the estimated number of children potentially eligible under federal parameters.
11 These numbers overstate to a small degree the percentages of children that are eligible under federal parameters that are also eligible under state-defined rules because some states define the eligibility units differently than what is used to define the eligibility units under federal parameters in this issue brief. This issue is discussed further in Appendix I.
Children Who Received Child Care Subsidies
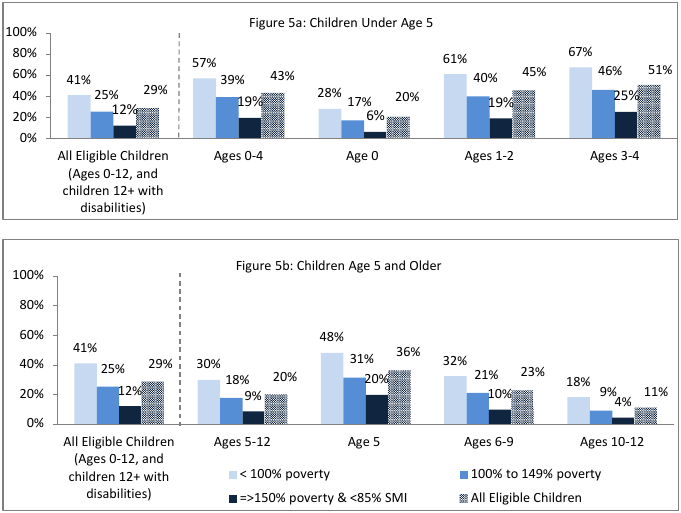
Approximately 29 percent of all children eligible under state-defined rules received subsidized care through CCDF or related government funding streams in fiscal year 2011 (see Figures 5a and 5b). As was the case when considering federally-eligible children, children eligible for assistance under state-defined rules who were between the ages of 1 and 4 (45 percent of children ages 1-2 and 51 percent of children ages 3-4) or from families with incomes below poverty (41 percent of all eligible children from families with incomes below 100 percent of poverty) were the most likely to be served.
Figure 5: Percentage of Children Eligible Under CCDF State-Defined Rules that Receive Child Care Subsidies, by Age and Poverty Status, Average Monthly, 2011
Fewer Children Are Eligible Under 2011 State Eligibility Rules than 2009 State Eligibility Rules
The model we use also has the ability to apply alternative eligibility rules and provide an estimate of the number of children who would be eligible under alternative rules, that is, an alternative simulation. The alternative rules could involve different income thresholds, different job requirements, or the entire set of rules from another year.
We use an alternative simulation to answer this question: given an identical sample of children and families, are 2011 state eligibility rules more or less generous compared to 2009 rules? Within our model, 2009 state eligibility rules (inflated to 2011 dollars) were applied to 2011 CPS data, resulting in a simulated 9.0 million children eligible. Recall that when 2011 state eligibility rules were applied to 2011 CPS data, the result was 8.4 million children eligible. Thus, state rules appear to be somewhat less generous in 2011 compared to 2009; fewer children are eligible under the 2011 rules. This likely results from a combination of state rules not keeping pace with inflation and state rules being changed to reduce the number of children eligible.
Conclusion
Based on federal parameters that determine permissible eligibility, an estimated 14.3 million children were potentially eligible to receive child care subsidies in 2011. Roughly 2.4 million children, or 17 percent of federally-eligible children, received subsidized care through CCDF or related government funding streams in an average month of fiscal year 2011.
Rates of coverage vary by age and poverty status. Poorer children were more likely to receive subsidies than less poor children. Younger children were also more likely to receive subsidies than older children.
While current funding levels do not meet the child care needs of all working parents, poorer children are more likely to receive child care subsidy assistance, suggesting that funds are generally targeted to those most in need.
Appendix I. Recent Changes to the Estimates of Child Care Subsidy Eligibility and Receipt
Improvements over Previous Estimates
ASPE has produced estimates of eligibility for and receipt of subsidized care through CCDF and related government funding streams for several years. During this time ASPE has sought to make continuous improvements to the estimation model and methodology. These improvements allow the most precise estimate to be shown at the time of their release, but they also increase the difficulty in interpreting differences in estimates across years.12
12 For additional information on previous changes in the estimation of eligibility and receipt through 2009 see Estimates of Child Care Eligibility and Receipt for Fiscal Year 2006 (http://aspe.hhs.gov/hsp/10/cc-eligibility/ib.pdf) and Estimates of Child Care Eligibility and Receipt for Fiscal Year 2009 (http://aspe.hhs.gov/hsp/12/childcareeligibility/ib.pdf).
Weights
Approximately every 10 years, using information from the decennial census, a new set of CPS weights are computed that produce better weighted estimates of the United States population. A new set of weights were first made available used for the calendar year 2011 (CPS 2012) data, based on the 2010 decennial census. The new weights produce a smaller and more accurate number of children than the older set of weights used for the 2009 estimates (which produced an overestimate of the number of children). Therefore, the decrease in the estimated number of eligible children from 2009 to 2011 is also partially attributable to these new weights.
Eligibility Under State Parameters
About 173,000 children are defined as eligible under state parameters in this issue brief, but are not considered eligible under federal parameters in this issue brief. There are two primary reasons for this discrepancy. First, approximately 114,000 of these children are considered child-only units under state parameters (making them eligible), but are not considered child-only units under federal parameters. Second, some states may exclude certain family members from the assistance unit (when considering family size and family total income) who are included under federal parameters. For example, the earnings of an older sister residing in the household are included under federal parameters in this issue brief, but are not included under some states’ parameters.
Trends in Eligibility and Receipt Using Alternative Methodologies
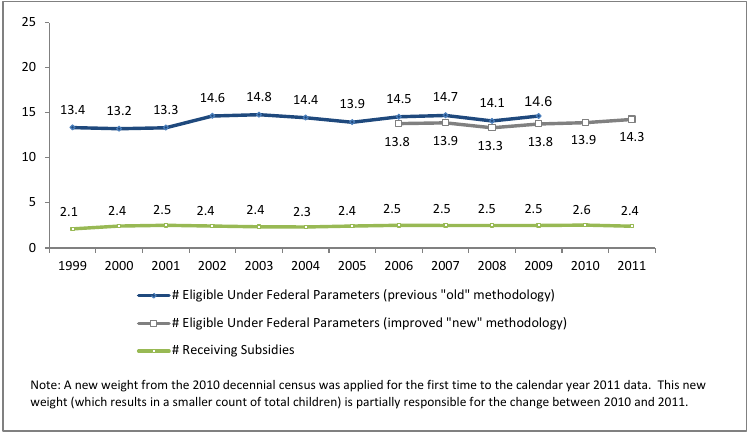
Appendix Figure 1 provides a comparison of alternative methodologies for computing federal eligibility by displaying the number of children eligible for subsidies from 1999 to 201113 using the “old” method and the “new” method. The number of children receiving subsidies during this period is also shown for reference. The “old” method (used in the 2006 brief and earlier) omits the following two improvements: the exclusion of children that are unlikely to be eligible based on their citizenship status, and the inclusion of unmarried partners in the eligibility determination process. The “new” method (used in the 2009 brief and the current brief) includes these two improvements.
Providing a comparison of the eligibility trend using the “old” and “new” method allows readers to clearly see the impact of changes in methodology. However, the trends shown in the graph should be interpreted with caution due to other more minor changes in estimation methods and measurement error. Some of the methodological improvements described in this section have been applied retrospectively and the estimates may not match exactly the estimates shown in ASPE’s previous issue briefs.
Additionally, these trendlines provide a way of seeing how trends in eligibility over time change with the economy and with demographic shifts.
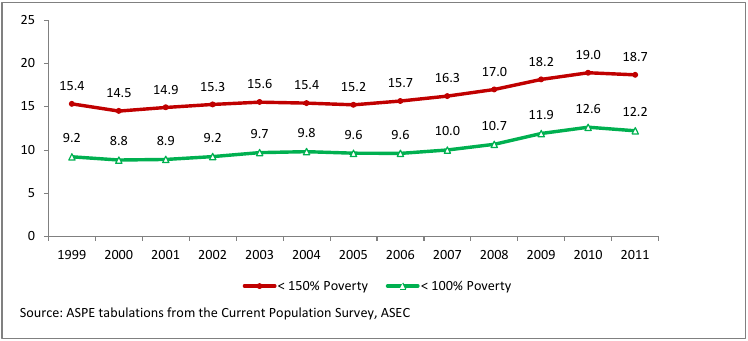
For reference, Appendix Figure 2 shows the total number of children, regardless of child care eligibility, estimated to have been living in households with incomes below 100 percent and 150 percent of poverty thresholds from 1999 to 2011.
Appendix Figure 1: Number of Children Federally-Eligible and Number of Children Receiving Child Care Subsidies Considering Changes Added to the Model, Average Monthly, 1999-2011 (Millions)
Appendix Figure 2: Number of Children Under Age 13 living in Families with Annual Incomes Below 100% and 150% Poverty Thresholds, 1999-2011 (Millions)
13 Where possible, improvements in the methodology and model for child care estimation have been applied to estimates of child care eligibility and receipt in previous years. For this reason, prior year estimates shown in Appendix Figure 1 will not match estimates published in previous issue briefs.
Appendix II. Child Care Eligibility and Receipt - Tables
Appendix Table 1: Number of Children Potentially Eligible for Child Care Subsidies under Federal Parameters, Average Monthly, Calendar Year 2011
| Age of Child | Parent is Student | Parent Employed 1-19 Hours | Parent Employed 20+ Hours | Family Income <100% Poverty | Family Income 100-149% Poverty | Family Income 150 - 199% Poverty | Family Income =>200% Poverty | All Eligible Children |
|---|---|---|---|---|---|---|---|---|
| 0 | 167,100 | 87,700 | 706,800 | 344,600 | 180,200 | 166,900 | 269,900 | 961,600 |
| 1 | 170,400 | 88,700 | 790,800 | 358,800 | 220,900 | 189,600 | 280,600 | 1,049,900 |
| 2 | 95,200 | 87,600 | 765,600 | 301,000 | 200,600 | 206,900 | 239,900 | 948,400 |
| 3 | 83,400 | 111,800 | 913,400 | 327,700 | 229,500 | 237,500 | 313,800 | 1,108,600 |
| 4 | 82,700 | 109,000 | 961,900 | 336,200 | 261,900 | 226,800 | 328,700 | 1,153,600 |
| 5 | 89,300 | 97,100 | 968,000 | 328,100 | 252,600 | 231,600 | 342,100 | 1,154,400 |
| 6-9 | 246,200 | 321,100 | 3,836,200 | 1,163,800 | 906,400 | 962,100 | 1,371,200 | 4,403,600 |
| 10-12 | 215,400 | 224,300 | 2,917,600 | 776,300 | 762,200 | 706,300 | 1,112,600 | 3,357,300 |
| 13+ | ** | ** | 97,300 | ** | ** | ** | ** | 121,400 |
| All | 1,166,500 | 1,134,600 | 11,957,600 | 3,965,700 | 3,041,200 | 2,977,500 | 4,274,400 | 14,258,700 |
** Cells with estimated populations under 50,000 are not shown.
Totals may not sum due to rounding.
See Notes on Appendix II Tables.
Source: Current Population Survey, ASEC, analyzed with the TRIM3 Microsimulation Model
Appendix Table 2: Number of Children Eligible for Child Care Subsidies under CCDF State-Defined Rules, Average Monthly, Calendar Year 2011
| Age of Child | Parent is Student | Parent Employed 1-19 Hours | Parent Employed 20+ Hours | Family Income <100% Poverty | Family Income 100-149% Poverty | Family Income 150 - 199% Poverty | Family Income =>200% Poverty | All Eligible Children |
|---|---|---|---|---|---|---|---|---|
| 0 | 145,100 | ** | 399,400 | 305,000 | 146,900 | 88,900 | ** | 579,800 |
| 1 | 143,600 | ** | 465,000 | 321,600 | 189,300 | 84,300 | ** | 639,600 |
| 2 | 85,100 | ** | 489,800 | 281,400 | 175,500 | 102,100 | ** | 608,400 |
| 3 | 68,600 | ** | 564,600 | 300,300 | 200,800 | 110,100 | 51,400 | 662,600 |
| 4 | 66,100 | ** | 585,500 | 308,100 | 227,000 | 100,600 | 55,400 | 691,100 |
| 5 | 73,100 | ** | 562,500 | 298,500 | 222,600 | 95,600 | 52,600 | 669,300 |
| 6-9 | 210,500 | 104,900 | 2,215,400 | 1,057,800 | 785,100 | 471,100 | 216,800 | 2,530,800 |
| 10-12 | 165,200 | 70,400 | 1,692,700 | 711,800 | 656,000 | 357,700 | 202,700 | 1,928,300 |
| 13+ | ** | ** | 65,000 | ** | ** | ** | ** | 84,900 |
| All | 973,200 | 381,700 | 7,039,800 | 3,613,500 | 2,624,900 | 1,439,400 | 716,900 | 8,394,700 |
** Cells with estimated populations under 50,000 are not shown.
Totals may not sum due to rounding.
See Notes on Appendix II Tables.
Source: Current Population Survey, ASEC, analyzed with the TRIM3 Microsimulation Model
Appendix Table 3: Estimated Number of Children Receiving Child Care Subsidies through All Funding Streams (CCDF, SSBG, TANF-Direct, and Excess TANF MOE), Average Monthly, Fiscal Year 2011
| Age of Child | < 100% Poverty | 100% to 149% Poverty | 150% to 199% poverty | =>200% poverty | All |
|---|---|---|---|---|---|
| 0 | 85,070 | 25,160 | 6,910 | 1,010 | 118,150 |
| 1 | 166,360 | 60,290 | 18,890 | 2,800 | 248,350 |
| 2 | 200,310 | 84,610 | 26,900 | 4,490 | 316,300 |
| 3 | 211,900 | 100,010 | 33,150 | 5,710 | 350,770 |
| 4 | 197,200 | 96,190 | 34,280 | 6,260 | 333,940 |
| 5 | 143,300 | 69,930 | 24,970 | 4,070 | 242,260 |
| 6-9 | 342,160 | 165,090 | 57,750 | 8,680 | 573,680 |
| 10-12 | 129,280 | 59,130 | 20,470 | 3,250 | 212,140 |
| 13+ | 3,320 | 1,760 | 700 | 90 | 5,870 |
| All | 1,478,900 | 662,170 | 224,010 | 36,360 | 2,401,450 |
Totals may not sum due to rounding.
See Notes on Appendix II Tables.
Source: Form-801 CCDF Administrative Records, U.S. Department of Health and Human Services, Administration for Children and Families
Appendix Table 4: Number of Children Potentially Eligible for Child Care Subsidies by State, Two-Year Average Monthly Estimates, Calendar Year 2010-2011
| Children Potentially Eligible Under Federal Parameters (Family Incomes < 85% State Median Income) | Children Eligible Under State-Defined Rules | ||||||
| State | Estimate | 95% Confidence Interval, 2-Year Average (Low-High) | Estimate | 95% Confidence Interval, 2-Year Average (Low-High) | |||
| Alabama | 183,560 | 147,840 | 219,270 | 87,740 | 60,430 | 115,050 | |
| Alaska | 36,510 | 29,920 | 43,100 | 25,700 | 20,400 | 31,010 | |
| Arizona | 275,550 | 228,210 | 322,880 | 161,860 | 123,630 | 200,090 | |
| Arkansas | 117,200 | 94,230 | 140,160 | 74,420 | 55,400 | 93,450 | |
| California | 1,637,550 | 1,521,450 | 1,753,650 | 1,340,520 | 1,231,470 | 1,449,570 | |
| Colorado | 208,030 | 167,400 | 248,660 | 121,540 | 89,720 | 153,350 | |
| Connecticut | 154,550 | 124,550 | 184,550 | 92,300 | 68,770 | 115,820 | |
| Delaware | 48,020 | 39,660 | 56,380 | 31,540 | 24,990 | 38,090 | |
| DC | 16,970 | 12,480 | 21,470 | 17,650 | 12,540 | 22,770 | |
| Florida | 692,060 | 620,500 | 763,610 | 377,730 | 325,050 | 430,410 | |
| Georgia | 510,700 | 450,320 | 571,090 | 239,460 | 194,730 | 284,190 | |
| Hawaii | 78,210 | 65,970 | 90,460 | 62,750 | 51,540 | 73,960 | |
| Idaho | 79,610 | 65,840 | 93,380 | 33,160 | 24,250 | 42,070 | |
| Illinois | 612,850 | 545,260 | 680,450 | 404,650 | 351,330 | 457,960 | |
| Indiana | 342,580 | 293,110 | 392,050 | 166,290 | 132,800 | 199,780 | |
| Iowa | 147,950 | 120,490 | 175,410 | 52,680 | 35,800 | 69,560 | |
| Kansas | 168,590 | 140,060 | 197,120 | 105,450 | 82,020 | 128,890 | |
| Kentucky | 206,620 | 168,770 | 244,480 | 126,490 | 99,760 | 153,230 | |
| Louisiana | 229,180 | 189,280 | 269,080 | 170,970 | 133,990 | 207,940 | |
| Maine | 39,460 | 29,370 | 49,550 | 38,550 | 28,520 | 48,570 | |
| Maryland | 294,990 | 248,030 | 341,940 | 116,820 | 87,060 | 146,570 | |
| Massachusetts | 246,160 | 204,620 | 287,700 | 114,200 | 83,980 | 144,420 | |
| Michigan | 396,440 | 342,980 | 449,890 | 150,160 | 116,900 | 183,410 | |
| Minnesota | 289,910 | 244,610 | 335,210 | 116,020 | 87,700 | 144,340 | |
| Mississippi | 168,500 | 140,370 | 196,640 | 122,330 | 96,970 | 147,680 | |
| Missouri | 283,350 | 237,750 | 328,960 | 113,670 | 83,950 | 143,380 | |
| Montana | 46,970 | 38,330 | 55,610 | 22,240 | 16,140 | 28,350 | |
| Nebraska | 106,570 | 88,560 | 124,580 | 34,670 | 24,850 | 44,490 | |
| Nevada | 125,240 | 101,670 | 148,800 | 113,950 | 90,740 | 137,160 | |
| New Hampshire | 48,810 | 38,320 | 59,290 | 29,710 | 21,350 | 38,070 | |
| New Jersey | 359,610 | 308,010 | 411,210 | 157,250 | 122,540 | 191,970 | |
| New Mexico | 104,520 | 84,490 | 124,540 | 101,520 | 82,300 | 120,750 | |
| New York | 776,790 | 699,310 | 854,270 | 477,820 | 415,160 | 540,470 | |
| North Carolina | 422,580 | 366,890 | 478,270 | 289,400 | 242,850 | 335,960 | |
| North Dakota | 29,360 | 23,780 | 34,930 | 14,420 | 10,540 | 18,300 | |
| Ohio | 550,030 | 487,100 | 612,950 | 266,670 | 223,010 | 310,330 | |
| Oklahoma | 188,580 | 154,880 | 222,280 | 161,360 | 130,610 | 192,110 | |
| Oregon | 143,810 | 112,810 | 174,820 | 91,780 | 66,080 | 117,480 | |
| Pennsylvania | 481,690 | 422,820 | 540,560 | 242,390 | 200,380 | 284,400 | |
| Rhode Island | 45,860 | 36,320 | 55,400 | 23,820 | 16,730 | 30,910 | |
| South Carolina | 237,950 | 197,110 | 278,790 | 111,620 | 83,520 | 139,710 | |
| South Dakota | 42,140 | 35,260 | 49,030 | 27,710 | 21,500 | 33,930 | |
| Tennessee | 279,980 | 235,280 | 324,680 | 132,240 | 102,900 | 161,580 | |
| Texas | 1,307,760 | 1,202,710 | 1,412,810 | 1,152,330 | 1,052,250 | 1,252,400 | |
| Utah | 164,090 | 139,880 | 188,300 | 81,950 | 65,210 | 98,690 | |
| Vermont | 25,560 | 20,050 | 31,080 | 16,310 | 11,800 | 20,820 | |
| Virginia | 345,860 | 296,160 | 395,560 | 144,850 | 113,350 | 176,350 | |
| Washington | 282,360 | 236,020 | 328,700 | 155,240 | 117,920 | 192,560 | |
| West Virginia | 59,680 | 47,300 | 72,060 | 34,700 | 26,960 | 42,440 | |
| Wisconsin | 287,180 | 241,460 | 332,890 | 164,240 | 130,140 | 198,330 | |
| Wyoming | 27,000 | 21,820 | 32,170 | 22,480 | 17,590 | 27,380 | |
See Notes on Appendix II Tables.
Source: Current Population Survey, ASEC, analyzed with the TRIM3 Microsimulation Model
Appendix Table 5: Number of Children Potentially Eligible for Child Care Subsidies under Federal Parameters with Families Incomes Under 100% and 150% Poverty, by State, Two-Year Average Monthly Estimates, Calendar Year 2010-2011
| Children Potentially Eligible Under 100% Poverty | Children Potentially Eligible Under 150% Poverty | ||||||
| State | Estimate | 95% Confidence Interval, 2-Year Average (Low-High) | Estimate | 95% Confidence Interval, 2-Year Average (Low-High) | |||
| Alabama | 69,730 | 47,710 | 91,750 | 113,450 | 85,380 | 141,530 | |
| Alaska | 6,850 | 4,000 | 9,690 | 12,930 | 9,010 | 16,840 | |
| Arizona | 90,440 | 63,340 | 117,530 | 146,030 | 111,550 | 180,510 | |
| Arkansas | 36,400 | 23,600 | 49,190 | 82,980 | 63,670 | 102,290 | |
| California | 444,990 | 384,350 | 505,640 | 800,300 | 719,020 | 881,570 | |
| Colorado | 57,340 | 36,000 | 78,670 | 102,320 | 73,830 | 130,810 | |
| Connecticut | 19,000 | 8,490 | 29,510 | 40,220 | 24,930 | 55,520 | |
| Delaware | 11,580 | 7,470 | 15,680 | 22,030 | 16,360 | 27,690 | |
| DC | 6,760 | 3,930 | 9,600 | 9,640 | 6,250 | 13,030 | |
| Florida | 190,500 | 152,920 | 228,070 | 341,860 | 291,540 | 392,190 | |
| Georgia | 156,160 | 122,790 | 189,530 | 278,900 | 234,290 | 323,520 | |
| Hawaii | 15,240 | 9,840 | 20,650 | 29,680 | 22,130 | 37,230 | |
| Idaho | 20,050 | 13,140 | 26,960 | 43,570 | 33,380 | 53,760 | |
| Illinois | 159,900 | 125,470 | 194,330 | 287,950 | 241,640 | 334,260 | |
| Indiana | 127,340 | 97,180 | 157,510 | 195,780 | 158,380 | 233,170 | |
| Iowa | 27,250 | 15,470 | 39,040 | 61,630 | 43,910 | 79,360 | |
| Kansas | 41,710 | 27,510 | 55,900 | 78,370 | 58,920 | 97,820 | |
| Kentucky | 80,140 | 56,560 | 103,730 | 136,110 | 105,360 | 166,850 | |
| Louisiana | 82,260 | 58,350 | 106,170 | 155,150 | 122,340 | 187,960 | |
| Maine | 9,770 | 4,760 | 14,790 | 17,340 | 10,650 | 24,020 | |
| Maryland | 51,110 | 31,560 | 70,650 | 97,240 | 70,320 | 124,170 | |
| Massachusetts | 38,250 | 21,930 | 54,570 | 68,240 | 46,370 | 90,100 | |
| Michigan | 103,570 | 76,260 | 130,870 | 174,170 | 138,730 | 209,610 | |
| Minnesota | 46,760 | 28,560 | 64,960 | 89,870 | 64,640 | 115,100 | |
| Mississippi | 75,460 | 56,640 | 94,280 | 106,500 | 84,160 | 128,840 | |
| Missouri | 86,240 | 61,080 | 111,390 | 143,530 | 111,070 | 176,000 | |
| Montana | 12,170 | 7,780 | 16,560 | 22,480 | 16,510 | 28,460 | |
| Nebraska | 23,350 | 14,920 | 31,780 | 46,290 | 34,420 | 58,160 | |
| Nevada | 33,590 | 21,390 | 45,790 | 60,280 | 43,930 | 76,630 | |
| New Hampshire | 6,790 | 2,890 | 10,690 | 13,690 | 8,140 | 19,240 | |
| New Jersey | 72,850 | 49,690 | 96,010 | 129,470 | 98,550 | 160,380 | |
| New Mexico | 47,820 | 34,300 | 61,350 | 83,180 | 65,310 | 101,050 | |
| New York | 210,960 | 170,560 | 251,360 | 362,100 | 309,170 | 415,040 | |
| North Carolina | 133,520 | 102,210 | 164,820 | 240,880 | 198,820 | 282,930 | |
| North Dakota | 8,220 | 5,270 | 11,170 | 12,770 | 9,090 | 16,440 | |
| Ohio | 162,640 | 128,380 | 196,890 | 293,070 | 247,110 | 339,030 | |
| Oklahoma | 61,720 | 42,440 | 81,010 | 119,750 | 92,910 | 146,590 | |
| Oregon | 39,870 | 23,600 | 56,130 | 71,070 | 49,270 | 92,870 | |
| Pennsylvania | 106,510 | 78,870 | 134,160 | 181,820 | 145,790 | 217,850 | |
| Rhode Island | 13,090 | 8,010 | 18,180 | 20,350 | 14,000 | 26,710 | |
| South Carolina | 58,950 | 38,610 | 79,290 | 130,480 | 100,220 | 160,730 | |
| South Dakota | 11,570 | 7,960 | 15,180 | 18,850 | 14,240 | 23,450 | |
| Tennessee | 90,050 | 64,810 | 115,290 | 146,230 | 114,010 | 178,450 | |
| Texas | 450,720 | 388,970 | 512,480 | 779,380 | 698,210 | 860,550 | |
| Utah | 33,960 | 22,960 | 44,960 | 62,640 | 47,680 | 77,590 | |
| Vermont | 4,480 | 2,170 | 6,780 | 9,860 | 6,430 | 13,290 | |
| Virginia | 63,210 | 42,030 | 84,400 | 113,350 | 84,910 | 141,800 | |
| Washington | 51,770 | 31,950 | 71,600 | 104,810 | 76,600 | 133,020 | |
| West Virginia | 16,450 | 10,050 | 22,860 | 34,860 | 25,460 | 44,260 | |
| Wisconsin | 60,870 | 39,850 | 81,900 | 105,740 | 78,000 | 133,480 | |
| Wyoming | 6,040 | 3,600 | 8,490 | 10,480 | 7,260 | 13,710 | |
See Notes on Appendix II Tables.
Source: Current Population Survey, ASEC, analyzed with the TRIM3 Microsimulation Model
Notes on Appendix II Tables
Poverty Status: In Appendix Tables 1, 2, 3, and 5, poverty status is based on 2011 poverty thresholds published by the U.S. Census Bureau, Housing and Household Economic Statistics Division. Since state-submitted Form-801 CCDF monthly child care data reports show recipients’ monthly income, the Census Bureau threshold is divided by twelve to create a comparable monthly threshold. Due to the source and limitations of data, different methods are used to calculate family income (and thus, poverty status) for children who receive subsidies versus children who are eligible for subsidies. Poverty status of recipients is based on family income used to determine child care subsidy eligibility, as reported by the state on Form-801 CCDF monthly child care data report for fiscal year 2011. As such, family income is reported after any relevant income disregards have been applied. Poverty status of eligible children, on the other hand, is determined based on full family income reported to the Current Population Survey for calendar year 2011 prior to application of any relevant income disregard.
Parent is Employed or Student Status: In Appendix Tables 1 and 2, “parent is student” status indicates that an eligible recipient lives in a household with a parent who is not employed because he or she is in school. Eligible recipients living with an employed parent who is also in school would not be included in the “parent is student” category. In the case of two-parent households, children are categorized by the parent with the least amount of employment hours. For example, if an eligible child has one parent working 40 hours per week and another parent working 18 hours per week, the child will be categorized as “parent employed 1-19 hours.” Eligible recipients living with a parent who is employed and a parent who is not employed because he or she is in school would be included in the “parent is student” category.
State by State Estimates of Eligibility: In Appendix Table 4, the estimate of potentially eligible children under federal parameters does not consider state-allowable income disregards when determining whether a child’s family income is below 85 percent of state median income. In some states, income disregards could lead to a higher estimate of children eligible under state-defined rules than under federal parameters. In Appendix Tables 4 and 5, the two-year average monthly estimates for calendar years 2010 and 2011 use the state median incomes published in the Federal Register: March 13, 2009 (Volume 74, Number 48) and May 12, 2010 (Volume 75, Number 91). For the two-year averages, the 2010-based simulation used state policies in effect as of October 2010 (and as mentioned earlier, the 2011-based simulation used state policies in effect as of October 2011). Updated weights from the 2010 decennial census were used for both calendar year 2010 and 2011 data.