
| This brief summarizes information on income and poverty in 2010, based on data released by the Census Bureau. Cited statistics include median household income in 2010, the number and rate of all persons in poverty, children in poverty, all persons and children under 50% of the poverty threshold, and African-American and Hispanic children in poverty from 2000 to 2010. The data are based on information collected in the 2011 and earlier Current Population Survey Annual Social and Economic Supplements (CPS ASEC) conducted by the Census Bureau. |
Overview
- The Census Bureau today released data indicating that the overall poverty rate in 2010 was 15.1 percent — a statistically significant increase from 14.3 percent in 2009. This represents 46.2 million people living in poverty in 2010. This is the third consecutive statistically significant increase in the poverty rate.
- Median household income was $49,445 in 2010, which is a statistically significant decrease of 2.3 percent from 2009.
- Today’s data indicate that there were 16.4 million children living in poverty in 2010, up from 15.5 million in 2009. The child poverty rate was 22.0 percent, which is a statistically significant increase from the 2009 rate of 20.7 percent. For African-American children, the poverty rate reported today was 38.2 percent for 2010. The rate for Hispanic children was 35.0 percent. Children living in female-headed families with no spouse present had a poverty rate of 46.9 percent, about four times the rate of children in married-couple families (11.6 percent). The poverty rate for people age 65 and over was 9.0 percent, statistically unchanged from 8.9 percent in 2009. In 2010, 6.7 percent of all people, or 20.5 million people, lived in deep poverty (had income below one-half the poverty threshold, or $11,157 for a family of four). This is a statistically significant increase of 1.5 million people from 2009.
- The data released today indicate that the overall poverty rate was the highest since 1993, and the highest number of people in poverty ever recorded. The overall poverty rate in 2010 has increased from a recent low of 11.3 percent in 2000.
- These figures reflect money income only and do not reflect the ARRA-funded expansions in SNAP (formerly food stamps) and reductions in the payroll tax. Data incorporating these and other noncash benefits will not be available until October.
The following charts summarize key points about the poverty data released September 13, 2011.
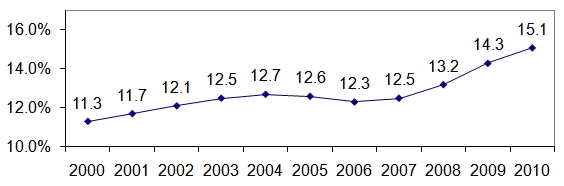
Poverty for All Persons, 2000 to 2010
Figure 1. Poverty for All Persons, 2000 to 2010, shows the percentage in poverty for all persons starting in 2000 through 2010 as 11.3, 11.7, 12.1, 12.5, 12.7, 12.6, 12.3, 12.5, 13.2, 14.3, and 15.1
Overall Poverty
- For calendar year 2010, the official overall poverty rate was 15.1 percent.
- This is a statistically significant increase from 14.3 percent in 2009.
- In 2010, the total number of people in poverty was 46.2 million, up from 43.6 million in 2009.
- The poverty rate in 2010 was 3.8 percentage points higher than in 2000.
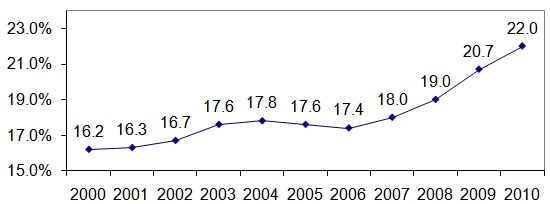
Child Poverty, 2000 to 2010
Figure 2. Child Poverty, 2000 to 2010, shows the percentage of children in poverty from 2000 through 2010 as 16.2, 16.3, 16.7, 17.6, 17.8, 17.6, 17.4, 18.0, 19.0, 20.7, and 22.0
Child Poverty — All Children
- For calendar year 2010 the percentage of children under 18 in poverty was 22.0 percent.
- This rate represents a statistically significant increase from 20.7 percent in 2009 and is the highest rate since 1993.
- The total number of children in poverty in 2010 was 16.4 million, up from 15.5 million in 2009.
- Children living in female-headed families with no spouse present had a poverty rate just over four times that of children in married-couple families in 2010 (46.9 percent compared to 11.6 percent).
- The child poverty rate in 2010 was 5.8 percentage points higher than in 2000.
All Persons and Children Under 50% of Poverty Threshold, 2000 to 2010
Figure 3. All Persons and Children Under 50% of Poverty Threshold, 2000 to 2010 shows poverty for all persons and children under 50% separately from 2000 through 2010 as increasing steadily from 4.5% for all persons to 6.7% over those years. For children, it increases steadily from 6.7% in 2000 to 9.9% in 2010.
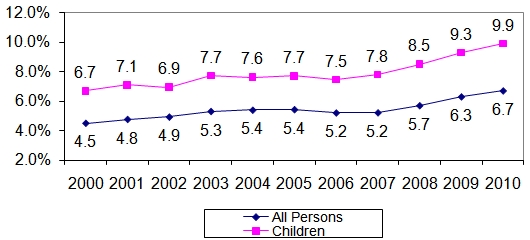
Deep Poverty
- In 2010, 6.7 percent of all people, or 20.5 million people, had income below one-half the poverty threshold. In 2010, 50 percent of the poverty threshold for a family of four was $11,157.
- This represents 44.3 percent of the poverty population in 2010 and an increase of 1.5 million people from 2009.
- In 2010, 9.9 percent or 7.4 million children under 18 lived in families with income below one-half of the poverty threshold.
African-American Child Poverty, 2000 to 2010
Figure 4. African-American Child Poverty, 2000 to 2010, shows the percentage in poverty of African-American children as 31.2, 30.2, 31.5, 33.6, 33.2, 33.5, 33.0, 33.7, 33.9, 35.4, and 38.2
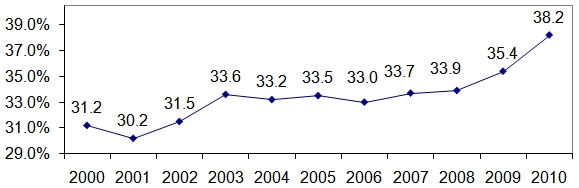
Note: In 2002, the Census Bureau began reporting data for people describing themselves as Black or African-American Alone and also Black or African-American Alone or in Combination with another race category. The Black or African-American Alone or in Combination percentage is shown on the chart. For 2010, the Black or African-American Alone percentage was 39.1 percent.
Child Poverty
Children in African-American and Hispanic Families
- For African-American children, the poverty rate in 2010 was 38.2 percent, up from 35.4 percent in 2009.
- The poverty rate for African-American children in 2010 was 8.0 percentage points higher than the recent low in 2001.
Hispanic Child Poverty, 2000 to 2010
Figure 5. Hispanic Child Poverty, 2000 to 2010, shows the percentage in poverty of Hispanic children as 28.4, 28.0, 28.6, 29.7, 28.9, 28.3, 26.9, 28.6, 30.6, 33.1, and 35.0
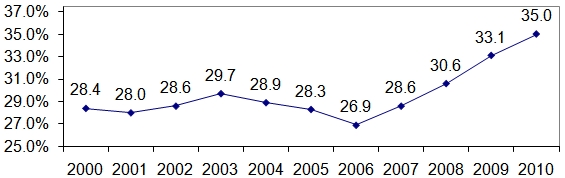
- For Hispanic children, the poverty rate in 2010 increased to 35.0 percent from 33.1 percent in 2009.
- The poverty rate for Hispanic children in 2010 was 8.1 percentage points higher than the recent low in 2006.
Poverty Rates for All Persons, 1979 to 2010
Figure 6. Poverty Rates for All Persons, 1979 to 2010, shows the percentage of all persons in poverty from 1979 through 2010 for all persons, African-Americans, and Hispanics. These have the pattern of rising to a peak in 1982, then declining until 1985, then remaining fairly constant until they start to rise in 1990 and a peak in 1993, then declining until 2000, and then fairly constant until 2007 when they begin to rise.
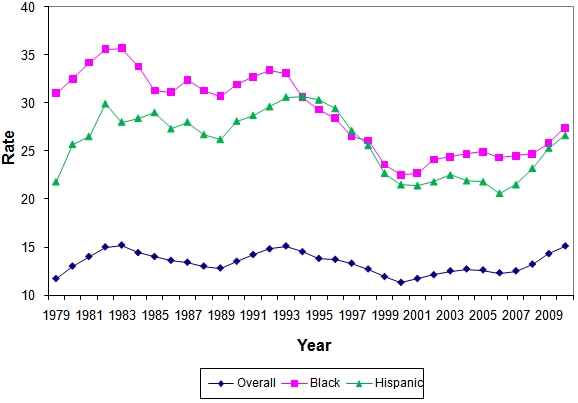
Historical Poverty Rates for All Persons
- The percentage of all persons living in poverty in 2010, 15.1 percent, was at or above the poverty rates experienced during the 1980s and 1990s.
- In calendar year 2010, the poverty rate for all African-American persons was 27.4 percent. This is up significantly from 25.9 percent in 2009, but it is below the recent peak poverty rate of 33.4 percent attained in 1992.
- In calendar year 2010, the poverty rate for all Hispanic persons was 26.6 percent. This is up significantly from 25.3 percent in 2009, but well below the peak poverty rate of 30.7 percent in 1994.