
Contents
- Data for Analysis
- Incidence of Unemployment
- UI Application
- UI Eligibility
- Receipt of UI Benefits
- Relationship between UI receipt and return to TANF
- Contrasting TANF and UI as Income Support
- Trends in UI and TANF Caseloads
- Conclusions and Future Research
The Personal Responsibility and Work Opportunity Reconciliation Act (PRWORA) established Temporary Assistance for Needy Families (TANF) in 1996 as the main federally funded program for cash assistance to needy families. Since that time, the number of benefit recipients has declined dramatically. While many TANF recipients left for employment, a substantial proportion experienced subsequent joblessness within the first few years following their exits. Using program administrative data, this study examines the role of regular unemployment insurance (UI) benefits in maintaining self-sufficiency for TANF leavers who experience subsequent job loss.
To receive UI, both monetary and non-monetary requirements must be met. Eligibility for UI benefits requires that claimants have adequate recent employment and earnings, and involuntary job separations not due to things like poor job performance or misconduct. Furthermore, UI beneficiaries must be able, available, and actively seeking full-time work.
Among TANF recipients who left the program for employment, this study examines subsequent joblessness, application for UI benefits, eligibility for UI benefits, and rates of UI benefit receipt. The levels of TANF and UI income support are compared, and the rate of return to TANF is contrasted between UI beneficiaries, non-applicants, and ineligible applicants. Findings are compared to results from earlier studies measuring UI eligibility and receipt among those who left social assistance programs.
[ Go to Contents ]
Data for Analysis
TANF exit and UI receipt were studied with administrative data from four of the eight largest states: Florida, Ohio, Michigan, and Texas. Access to administrative data on UI and TANF for Florida, Ohio, and Texas was provided through the Administrative Data Analysis and Research (ADARE) consortium. Michigan directly provided the Upjohn Institute administrative data for research under a separate data sharing agreement.
Analysis cohorts were set up within time ranges covered in two or more states. Cohorts include TANF receipt and exit in the years 1997, 2000, and 2001. To provide additional evidence on a key relationship concerning job separations, a 2003 Texas cohort was added. These years witnessed a growing aggregate economy with tightening labor markets, a recession with rising unemployment, then the beginnings of a modest economic recovery. Eleven cohorts of TANF leavers were examined. For the purpose of this study, we define TANF leavers as those who left the TANF program for employment. These samples totaled 556,427 TANF leavers with 406,481 newly unemployed within 3 years after leaving TANF (Table E1). They represent a census of TANF leavers in the states studied during these years. Each of the analysis cohorts studied is composed of adult grantees in TANF recipient households who left TANF for employment.(1)
| All Cohorts | |
|---|---|
| TANF Leavers | 556,427 |
| Newly Unemployed | 406,481 |
| UI Applicants | 98,760 |
| Monetarily Eligible for UI Benefits | 89,806 |
| Non-monetarily Eligible for UI Benefits | 35,661 |
| UI Beneficiaries | 54,341 |
| Newly Unemployed rate | 73% |
| UI Applicant rate for New Unemployment | 24% |
| Monetarily Eligible rate for UI Applicants | 91% |
| Non-monetarily Eligible rate for UI Applicants | 36% |
| UI Beneficiary rate among Applicants | 55% |
| Weeks of UI Entitlement (mean) | 19 |
| Weeks of UI Drawn (mean) (*1) | 15 |
| Percentage of UI Entitlement Drawn | 80% |
| UI Exhaustion Rate | 56% |
| UI Weekly Benefit Amount (mean) | $167 |
| UI Payments received over the full Benefit Year (mean) | $2,545 |
| UI Actual Monthly Amount Received (mean) (*2) | $533 |
| TANF Actual Monthly Amount Received (mean) (*3) | $148 |
| Ratio of Mean Actual UI to Mean Actual TANF | 3.6 |
| Note: Percentages and means in this table are rounded to the nearest whole number. (*1) This is full-time equivalent weeks of UI computed as total dollars of UI benefits received divided by the beneficiarys UI weekly benefit amount (WBA) for joblessness throughout a full week. (*2) Computed as total dollars of UI received in the benefit year divided by maximum entitled weeks of UI benefits times four. The duration of entitlement and level of WBA depend directly on the level and duration of recent prior earnings and employment. (*3) TANF payments received in the two calendar quarters completed before TANF exit divided by six. | |
[ Go to Contents ]
Incidence of Unemployment
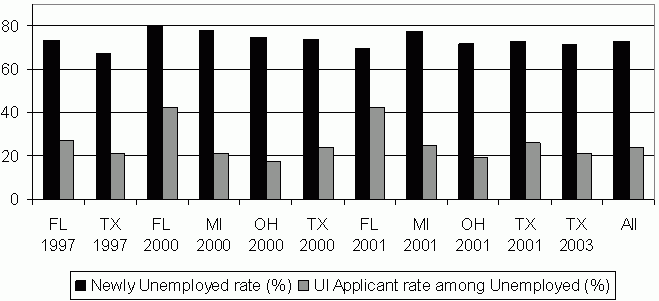
To learn about the relationship between UI and return to TANF, cohorts of TANF leavers experiencing unemployment were created. Within three years after TANF exit, the cumulative rates of TANF leavers ever experiencing unemployment ranged from 68 to 80 percent across the analysis cohorts with a weighted mean rate of 73 percent of all TANF leavers experiencing a new spell of unemployment. Figure E1 shows the nearly uniform distribution of cumulative unemployment rates across the analysis cohorts.
[ Go to Contents ]
UI Application
Across the cohorts, between 18 and 43 percent of newly unemployed TANF leavers applied for UI benefits within 3 years after leaving TANF (Figure E1). There is wide variation across the cohorts in UI application rates with the mean across cohorts being 24 percent. UI application rates tend to be considerably higher when the first instance of unemployment occurs in the second year after TANF exit than in the first, suggesting that jobless TANF leavers may understand that sufficient employment and earnings are required to qualify. Based on data from states for which the date of job separation is available, the mean lag from job separation to the date of application for UI benefits is 5.8 weeks with a median of 2.0 weeks.
Figure E1.
Unemployment and UI Application Rates.
[ Go to Contents ]
UI Eligibility
Among TANF leavers who become newly unemployed and apply for UI, the percentages who are initially eligible for UI based on monetary requirements were above 90 percent in eight of the eleven cohorts analyzed (Figure E2). The rates were 85 percent in the Florida 2001 cohort, 66 percent in the Ohio 2000 cohort, and 61 percent in the Ohio 2001 cohort. The lower monetary eligibility rates in Ohio result from the strict requirement for 20 or more weeks of work earning at least 27.5 percent of the state average weekly wage in UI covered employment. For Ohio in the year 2000 a week of insured employment required earnings of at least $172, or more than 33 hours of work at the federal minimum wage of $5.15 per hour. Including Ohio, the mean rate of UI monetary eligibility across all cohorts is 91 percent.
Figure E2.
UI Eligibility and Beneficiary Rates Among Newly Unemployed TANF Leavers
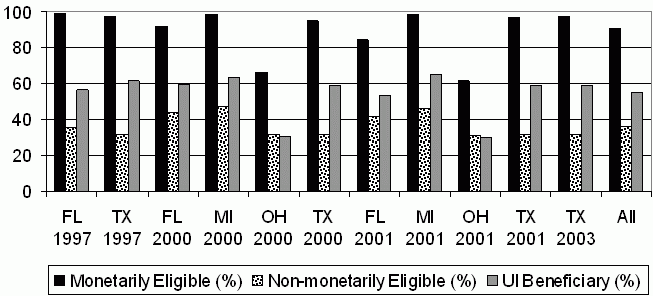
While TANF leavers compare favorably to those not recently involved with TANF in terms of monetary eligibility for UI, they have much lower rates of UI eligibility based on initial non-monetary eligibility factors. These relate to circumstances surrounding the job separation. For TANF leavers, higher rates of voluntary job quits and justifiable dismissals result in lower rates of non-monetary eligibility (Figure E2). UI claimants must also be able, available, and actively seeking full-time work. Among newly unemployed TANF leavers who applied for UI, the weighted mean rate of initial qualification for UI based on non-monetary factors across all cohorts was 36 percent.
[ Go to Contents ]
Receipt of UI Benefits
Among TANF leavers who are UI applicants, the proportions receiving UI benefits in the analysis cohorts range from 30 percent in the Ohio 2001 cohort to 65 percent in the Michigan 2001 cohort (Figure E2). The overall mean rate of benefit receipt was 55 percent (Table E1). Note that to receive benefits, claimants must satisfy both monetary and non-monetary requirements.
For monetary eligibility, TANF leavers with more employment and earnings in their UI base period satisfy monetary eligibility requirements at higher rates than those with less employment and earnings. The UI base period is the first four of the five completed calendar quarters preceding UI application. Therefore, we find that UI beneficiary rates among applicants in the first year after TANF exit are lower than among those who apply for UI benefits in their second or third year after leaving TANF. That is, those for whom more time has elapsed between leaving TANF and applying for UI may have had more employment and earnings to help them meet monetary eligibility requirements.
UI applicants who are denied for non-monetary reasons may qualify at a later point in their benefit year. Thus, UI beneficiary rates can be higher than initial rates of non-monetary eligibility. The UI benefit year is the 52-week period starting with the week of UI application. Those who are initially denied UI for non-monetary reasons can become eligible later in their benefit year if they satisfy state-specific requirements for re-employment and earnings. These denied applicants can qualify for UI if they acquire adequate additional employment and earnings and satisfy non-monetary eligibility requirements after a new job separation.
Comparing TANF leaver UI applicants to all other applicants, beneficiary rates among TANF leavers were uniformly lower than for those not recently involved with TANF. This is true even though, as noted above, some TANF leaver UI applicants eventually receive benefits after being initially denied for non-monetary reasons.
Among TANF leavers who qualify for UI, mean weekly benefit amounts are $167, mean entitled durations of UI benefits are more than 19 weeks, and on average 80 percent of entitled UI benefits are drawn. Mean UI payments are $2,545 over the full benefit year, or a mean of about 15 weeks of UI at the average weekly benefit amount for this sample. Benefit entitlements are fully exhausted by 56 percent of TANF leaver UI beneficiaries, which is a higher rate of UI benefit exhaustion than among UI beneficiaries not recently involved with TANF.
Eligibility rates for monetary and non-monetary reasons, together with UI beneficiary rates are summarized graphically in Figure E2 for newly unemployed TANF leavers. Over time, rates are stable within states, but differ across states. There are very high rates of monetary eligibility exceeding 90 percent in Florida, Michigan, and Texas. Beneficiary rates hover around 60 percent for these three states. Non-monetary eligibility rates for the Ohio cohorts are low at around 30 percent, but on par with Texas. Beneficiary rates in Ohio are slightly below the non-monetary eligibility rates. In all other states, however, the UI beneficiary rates far exceed the non-monetary eligibility rates.
[ Go to Contents ]
Relationship between UI receipt and return to TANF
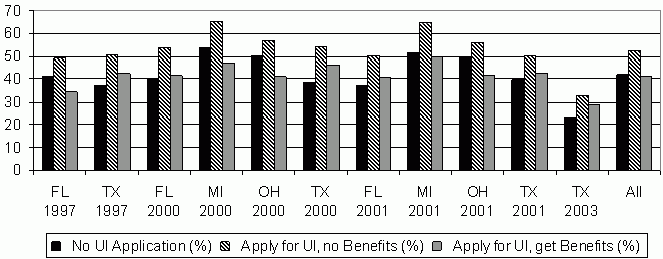
Among newly unemployed TANF leavers who apply for UI benefits, receipt of UI compensation is correlated with a significantly lower rate of return to TANF. Figure E3 summarizes rates of return to TANF among the three key groups of newly unemployed TANF leavers: (1) those who do not apply for UI, (2) those who apply for UI, but do not receive UI benefits, and (3) UI applicants who become beneficiaries. For each of the eleven cohorts, the rate of return to TANF is highest for UI applicants who do not receive benefits. This result holds for every cohort regardless of the state rules for monetary and non-monetary UI eligibility and no matter what phase of the business cycle.
The mean rate of return to TANF among newly unemployed TANF leavers in our combined samples is 43 percent (Table E2). Among those who apply for UI, the return to TANF rate is 41 percent for beneficiaries, and 53 percent for non-beneficiaries, a statistically significant difference of 12 percentage points. This simple unadjusted difference of means is consistent with estimates computed on samples pooled across cohorts and controlling for claimant characteristics and UI program parameters. The percentage point difference in rates of return translates into a 22 percent lower rate of return to TANF among UI beneficiaries than non-beneficiary UI applicants. This result could be driven partly by some returning TANF applicants instructed to claim UI to demonstrate the absence of alternative income sources. That question requires further investigation.
Figure E3.
Return to TANF Rates by UI Application Groups
| All Cohorts | |
|---|---|
| Total Newly Unemployed TANF Leavers | 406,481 |
| No UI Application | 307,721 |
| Apply for UI but no Benefits | 44,419 |
| Apply for UI and get Benefits | 54,341 |
| Total Returns to TANF by Leavers | 173,717 |
| No UI Application | 128,494 |
| Apply for UI but no Benefits | 23,370 |
| Apply for UI and get Benefits | 22,388 |
| Total Return to TANF Rate | 43% |
| No UI Application | 42% |
| Apply for UI but no Benefits | 53% |
| Apply for UI and get Benefits | 41% |
| Note: Figures rounded to nearest whole percentage point for this table. | |
[ Go to Contents ]
Contrasting TANF and UI as Income Support
Among TANF leavers who experience unemployment, those who qualify for and draw UI benefits receive income replacement at rates much higher than is paid by TANF. Across the analysis cohorts the mean monthly TANF payment is $148 while the mean monthly UI payment is $533. The UI-to-TANF ratio of mean payments is 3.6 (Table E1).
Mean monthly TANF payments range from $113 to $226 across cohorts, while monthly UI receipt ranges from $389 to $693. The ratio of UI-to-TANF ranges from 2.0 to 4.6. The UI-to-TANF ratio in Ohio is about half that of Florida, however the rates of return to TANF are similar in the two states. The ratio for Michigan lies between Florida and Ohio, but the rate of return in Michigan is significantly higher than either of the other two states.
A very small correlation was estimated between the UI-to-TANF ratio and the rate of return to TANF using regression models. This suggests that UI benefit receipt might be serving as a proxy for strong labor force attachment. In other words, it might not be the income replacement function of UI that reduces return to TANF, but more importantly those who receive UI benefits have better prospects for maintaining self-sufficiency through employment.
[ Go to Contents ]
Trends in UI and TANF Caseloads
In the states studied, the numbers of TANF recipients declined since 1996 with rates of decline faster before the year 2000 than after. Influenced by trends in aggregate business activity, counts of UI recipients tended to rise in the quarters leading up to the start of 2002 then gradually declined.(2) But there is no identifiable link between aggregate declines in TANF recipients and trends in total UI recipients at the state level.
Person-level analysis suggests, however, that UI plays an important role in supporting TANF leavers, but only a small fraction of TANF leavers receive UI benefits. Among TANF leavers, about 73 percent become unemployed within 3 years, 24 percent of these apply for UI benefits, with 55 percent of applicants becoming beneficiaries. This suggests that about 10 percent of TANF leavers receive UI benefits.
Analysis of the composition of UI claims showed that the numbers of recent TANF recipients among UI applicants were steady over the period of years examined (OLeary 2007). Furthermore, the share of UI beneficiaries who previously held high paying jobs increased sharply between 1997 and 2003, meaning that recent TANF recipients declined as a share of all UI beneficiaries.
Conclusions and Future Research
This study estimates that among TANF leavers who become newly unemployed and apply for UI benefits, nearly 91 percent will be eligible for monetary reasons, 36 percent will be eligible for non-monetary reasons, and 55 percent will ultimately draw UI benefits. In previous research, the highest estimated rate of UI benefit receipt among TANF leavers was 33 percent. Our results suggest that UI may serve as a safety net for TANF leavers.
We also find evidence that receipt of UI benefits is associated with a lower rate of return to TANF. Among TANF leavers who apply for UI, receipt of benefits reduces the rate of return to TANF by 22 percent compared to the rate observed for applicants who do not qualify and receive UI benefits.
On a monthly basis, UI benefits are two to five times more generous than TANF payments. But small changes in the relative generosity of UI-to-TANF do not affect the rate of return to TANF. Taken together, these results suggest that UI benefit receipt might be serving as a proxy for strong labor force attachment. It might not be the income replacement function of UI that reduces return to TANF, but instead those who receive UI benefits might simply have better prospects for maintaining self-sufficiency through employment. Further investigation into the relative importance of UI income support and labor force attachment could inform policy.
Also, it is worth investigating why rates of return to TANF are similar after a new spell of unemployment for UI beneficiaries and those who do not apply for UI benefits. What characteristics do these two groups share and how are they different from TANF leavers who apply but fail to receive UI benefits?
Finally, among all UI applicants, TANF leavers have lower rates of qualifying for UI benefits. The main reasons for lower rates of UI eligibility among TANF leavers are voluntary job quits and dismissals for cause by employers. Analysis of the characteristics of TANF leavers who voluntarily quit or get fired from new jobs could provide guidance for efforts to promote job retention and advancement among recent TANF leavers.
[ Go to Contents ]
Endnotes
(1) Child-only TANF cases were not included in the analysis.
(2) The UI counts include all beneficiaries in the states and are not limited to TANF leavers.