
Nga T. Thach, BS, and Joshua M. Wiener, PhD
RTI International
May 2018
Printer Friendly Version in PDF Format (34 PDF pages)
ABSTRACT
This report examines the role of long-term services and supports (LTSS) in Medicaid. It also examines how sociodemographic changes are likely to affect the demand for LTSS in the future, and as a result, Medicaid use and expenditures. The report shows: the demand for LTSS is likely to increase dramatically; LTSS is a major part of the Medicaid program, accounting for about a third of total expenditures, and Medicaid is the dominant payer of LTSS.
DISCLAIMER: The opinions and views expressed in this report are those of the authors. They do not necessarily reflect the views of the Department of Health and Human Services, the contractor or any other funding organization.
| ASPE would like to acknowledge Joshua Weiner and his steadfast commitment to bettering the lives of older adults and people with disabilities. He was a lion in the field of long-term care policy research and a long-time contributor to ASPE's policy work. Josh died in early 2018. |
TABLE OF CONTENTS
MAIN DEMOGRAPHIC TRENDS DRIVING DEMAND FOR LTSS
- Overview of Medicaid
- Medicaid LTSS Services
- Medicaid Enrollment Trends
- LTSS Share of Medicaid Expenditures
- Future Projections
- LTSS Funding Streams
- Medicaid Expenditures Across LTSS Settings
- Medicaid and HCBS
- Managed LTSS
LIST OF FIGURES
- FIGURE 1: Medicaid Beneficiaries, FYs 1975-2013
- FIGURE 2: Estimated Medicaid Enrollment and Expenditures by Enrollment Group, as Share of Total, FY 2015
- FIGURE 3: Distribution of Medicaid Enrollment and Benefit Spending by Users and Non-Users of LTSS, FY 2013
- FIGURE 4: LTSS as a Percentage of Total Medicaid Expenditures, FYs 1995-2014
- FIGURE 5: Medicaid Share of Payments for National LTSS Spending, 2013
- FIGURE 6: Medicaid HCBS Expenditures as a Percentage of Total Medicaid LTSS Expenditures, FYs 1995-2014
- FIGURE 7: Growth in Medicaid HCBS Participants, by Program, 2003-2013
- FIGURE 8: Medicaid LTSS Expenditures by Service Category, FYs 1995-2014
- FIGURE 9: Medicaid HCBS Expenditures as a Percentage of Total Medicaid LTSS Expenditures, by State, FY 2014
LIST OF TABLES
- TABLE 1: Medicaid Federal and State LTSS Expenditures, 1985-2014
- TABLE 2: Total State/Federal Medicaid LTSS Expenditures and LTSS as Percentage of Total Medicaid, by State, FY 2014
Acronyms
The following acronyms are mentioned in this report.
| ACA | Affordable Care Act |
|---|---|
| ADL | Activity of Daily Living |
| AIDS | Acquired Immune Deficiency Syndrome |
| CBO | Congressional Budget Office |
| CHIP | Children's Health Insurance Program |
| CMS | Centers for Medicare and Medicaid Services |
| FMAP | Federal Medical Assistance Percentage |
| FY | Fiscal Year |
| GDP | Gross Domestic Product |
| HCBS | Home and Community-Based Services |
| HIPAA | Health Insurance Portability and Accountability Act |
| HIV | Human Immunodeficiency Virus |
| IADL | Instrumental Activity of Daily Living |
| IDD | Intellectual and Developmental Disabilities |
| KCMU | Kaiser Commission on Medicaid and the Uninsured |
| LTSS | Long-Term Services and Supports |
| MACPAC | Medicaid and CHIP Payment and Access Commission |
| MedPAC | Medicare Payment Advisory Commission |
| SSI | Supplemental Security Income |
Executive Summary
This report examines the role of formal long-term services and supports (LTSS) in Medicaid. It also examines how sociodemographic changes are likely to affect the demand for LTSS in the future, and as a result, Medicaid use and expenditures. The analysis suggests three main themes.
First, the demand for LTSS services is likely to increase dramatically. The increased demand is largely, although not entirely, driven by the aging of the baby boom population. Of particular importance is that the age group with the highest risk of requiring LTSS services is growing faster than the overall population and faster than the population age 65 and older. Dementia related to Alzheimer's disease will play a major role in the increase in demand for LTSS.
Second, LTSS is a major part of the Medicaid program, accounting for about a third of total expenditures, although the percentage has been declining steadily over time. Although the number of Medicaid beneficiaries who are younger people with disabilities has grown substantially over time, the number of elderly Medicaid beneficiaries has barely increased since the early 1990s, despite the growth in the number of older people in the general population. Because people using LTSS have high medical needs and because many younger people with disabilities do not qualify for Medicare, users of LTSS account for 42 percent of total Medicaid medical and LTSS expenditures; older people and younger persons with disabilities account for 56 percent of expenditures. Also, because states have considerable latitude over financial eligibility, covered services and reimbursement, the percentage of total Medicaid spending on LTSS varies widely among states, from 18 percent in Arizona to 61 percent in North Dakota.
Third, Medicaid is the dominant payer for LTSS; for example, 62 percent of nursing home residents have their care paid by Medicaid. Although Medicaid historically has primarily financed institutional services, such as nursing homes and institutions for people with intellectual and developmental disabilities (IDD), federal and state policies have fostered a greater emphasis on home and community-based services (HCBS). This trend has been especially notable for people with IDD and less so for older people and younger persons with physical disabilities.
Long-term services and supports (LTSS) encompass a variety of health, health-related, and social services that assist individuals with functional limitations due to physical, cognitive, or mental conditions or disabilities. LTSS includes assistance with activities of daily living (ADLs, such as eating, bathing, and dressing) and instrumental activities of daily living (IADLs, such as housekeeping and managing money) over an extended period of time. The goal of LTSS is to facilitate optimal functioning among people with disabilities. While most LTSS is delivered by informal, unpaid caregivers (such as family or friends), this paper focuses on the formal, paid LTSS industry. LTSS are delivered in a variety of settings, some institutional (e.g., intermediate care facilities for people with intellectual and developmental disabilities [IDD] and nursing homes), and some home and community-based (e.g., adult day services, assisted living facilities, and personal care services). The financing and delivery systems have historically favored institutional settings, although government policies and advocacy efforts have facilitated a shift toward greater home and community-based services (HCBS) use.
Medicaid, the federal-state health care and LTSS program for the low-income population, is a critical part of financing for LTSS. This report reviews the main demographic trends likely to drive demand for future LTSS services and expenditures, the role of LTSS within the Medicaid program, and the role of Medicaid LTSS within the overall LTSS industry.
Main Demographic Trends Driving Demand for LTSS
Virtually all demographic changes in the United States point to large future increases in demand for LTSS. By 2040, the United States population is projected to increase from 318.7 million in 2014 to over 380 million people, with the elderly population increasing from 48 million to slightly more than 83 million people (Colby & Ortman, 2015). The changing age structure in the United States reflects the aging of the Baby Boom population (people born from 1946 to 1964), as well as an ongoing trend of increased longevity among Americans. Shifts in health behaviors such as declines in smoking, motor vehicle fatalities, and heavy consumption of alcohol have resulted in increased life expectancy across most sociodemographic groups (Stewart & Cutler, 2014). Concurrently, risk behaviors such as limited physical activity, poor nutrition, and substance use contribute to higher incidences of obesity and chronic health conditions. The Centers for Disease Control and Prevention estimates that at least half of all adults in 2012 (117 million people) exhibited at least one chronic health condition, and more than a quarter had two or more (Ward, Schiller, & Goodman, 2014). The simultaneous aging of the population and increasing prevalence of chronic health conditions is expected to substantially increase the number of people with disabilities and, in turn, the demand, use, and expenditures for personal health services and LTSS.
Disability is highly related to age, so the projected growth in the elderly population suggests a large increase in the need for LTSS. Among non-institutionalized adults, the prevalence of any disability (including disability in vision, cognition, mobility, self-care, and independent living) is 16 percent among adults age 18-44, 26 percent among adults age 45-64, and 36 percent among adults age 65 and older. Of these types, disability in mobility and independent living are observed to increase with age (Courtney-Long et al., 2015). Surveys from 1999-2000 to 2008 showed slight increases in the prevalence of functional limitations among older adults living in the community and middle-aged adults who will soon age into the 65 and older group (Freedman et al., 2013). Further, more than 5 million Americans have dementia, the large majority of whom are age 65 and older (Hebert, Weuve, Scherr & Evans, 2013). The number of people with Alzheimer's disease, the most common cause of dementia, is projected to increase to 13.8 million by 2050 (Hebert et al., 2013; National Institute on Aging, 2016).
Based on the increase in the number of older people, various microsimulation models have projected large increases in the number of people with disabilities. For example, the Urban Institute's DYNASIM3 model projected that between 2015 and 2065, the number of Americans age 65 or older with Health Insurance Portability and Accountability Act (HIPAA) of 1996 level disabilities, a relatively severe level of disability, will increase from 6.3 million to 15.7 million.1 People in older age groups, women, people with less education, and people who are not married tend to be at a greater risk of developing HIPAA-level disabilities (Drabek & Marton, 2015). More than half (52 percent) of Americans aged 65 and older in 2015 are projected to develop HIPAA-level disabilities and require LTSS. The average person turning 65 in 2015 can also expect to live another 20.9 years and incur $138,000 in LTSS costs (Favreault & Dey, 2016).
Changing family structures and shifting roles for women in the United States population will also have significant effects on the supply of LTSS. Informal caregivers are an essential provider of uncompensated LTSS. In 2009, informal caregivers, typically women, provided up to three-quarters of these services, amounting to an estimated $450 billion in unpaid care (Feinberg, Reinhard, Houser & Choula, 2011). Along with the growth of the population age 65 and older, however, is the likely decrease in the availability of the population that typically fills the role of informal caregivers. Transformations in societal norms, such as more women working full time, decreasing birth rates and smaller family size, and an increase in the number of people who never marry, contribute to additional gaps in the supply of informal care. In addition, informal caregivers are increasingly tasked with more complex and demanding care activities, such as medication management, wound care, and incontinence care, yet they often do not have adequate support or training (Thomas & Applebaum, 2015).
The aging of the population, the concomitant increase in the number of people with disabilities, and the use of LTSS is a worldwide phenomenon not limited to the developed world (European Commission, 2015; De la Maissonneuve & Martins, 2013; World Bank, 2016). Globally, the average public expenditure on LTSS is less than 1 percent of gross domestic product (GDP) (United Nations, 2016). The Organization for Economic Co-operation and Development projects that the average percentage of GDP spent on public long-term care services will roughly double from 2006-2010 to 2030 (from 0.8 percent to 1.7 percent) in member countries, including the United States (De la Maissonneuve & Martins, 2013). In East Asian and Pacific countries, increased exposure to health risks among adults is expected to drive disability rates higher in the future, yet only a handful of countries have introduced a formal LTSS system (World Bank, 2016). Institutional services are available to small proportions of the population, and most individuals rely on informal caregiving.
The Urban Institute and other long-term care financing simulation models are largely driven by demographic changes over time (Rivlin & Wiener, 1988; Wiener, Illston & Hanley, 1994; Johnson, Toohey & Wiener, 2007; and Favreault & Dey, 2016). Despite the underlying demographics of more people with disabilities, utilization of services can change dramatically over time in ways that do not simply reflect demographic changes. For example, although the number of people age 75 and older increased by approximately 57 percent between 1980 and 2010, the average number of nursing home residents has remained constant at about 1.4 million (Hing, Sekscenski & Strahan, 1989; Hobbs & Stoops, 2002; Harrington, Carrillo & Garfield, 2015). The reasons for this decline in utilization rates are not well understood, but likely involve the increased use of home care and assisted living facilities, increased longevity by men (so there are more married couples who can care for each other; Lakdawalla & Schoeni, 2003), and reduced smoking (Warner, 2013). A study by Wiener, Anderson & Brown (2009) found only a weak relationship between home care and the supply of residential care facilities with nursing home use. In contrast, Kaye, LaPlante and Harrington (2009) did find a negative relationship between increased home care and Medicaid long-term care spending. Some studies project that nursing home use will rise again as the population of younger people with obesity and other chronic conditions increases (Lakdawalla & Schoeni, 2003).
LTSS need and utilization will also be affected by other demographic trends. The United States population is becoming more diverse, including among adults aged 65 and older. By 2050, approximately 42 percent of the 65 and older population are expected to be a racial or ethnic minority, more than doubling the proportion in 2010 (Vincent & Velkoff, 2010). Nearly one out of five adults aged 65 and older is projected to be Hispanic by 2050 (West, Coe, Goodkind & He, 2014). Among adults aged 18 and older, higher percentages of Black and Hispanic Americans have limitations in ADLs and IADLs than White Americans, and even higher percentages of these lower-income minority groups have limitations (National Center for Health Statistics, 2013). The proportion of non-White Americans receiving LTSS is increasing across service settings. In 2014, Hispanic and non-Hispanic Black Americans composed nearly one-fifth of the population receiving LTSS in nursing homes, and more than 6 percent of all users of residential care. Hispanics represented one-fifth and non-Hispanic Black Americans represented 17.3 percent of all adult day service users (Harris-Kojetin et al., 2016).
Although older people and younger people with physical disabilities are important users of LTSS, they are not the only groups with disabilities. In 2013, estimates of the total number of Americans with IDD were as high as 6.2 million persons (Larson et al., 2016). The population of individuals with IDD is also expected to grow substantially over time. As with most other groups, life expectancy among individuals with IDD continues to increase. Adults with severe IDD are expected to live to their mid-50s, while adults with mild or moderate IDD may reach their early 70s, similar to life expectancy of the general population (Heller, Stafford, Davis, Sedlezky & Gaylord, 2010). LTSS are essential to supporting individuals with IDD, most who live in the community with their families (Larson et al., 2016). Large institutional settings, such as intermediate care facilities for people with IDD, are declining in use and, in some states, closing entirely (Braddock et al., 2015). Although the provider landscape is changing rapidly for this population, LTSS utilization is high, with more than 1.1 million receiving LTSS through the IDD system in 2013 (Larson et al., 2016). Many families remain on wait lists for Medicaid-funded HCBS, and many need additional services (Heller et al., 2010; Larson et al., 2016)
Role of LTSS in Medicaid
Overview of Medicaid
Medicaid is a means-tested, joint federal-state health and LTSS program for the low-income population who meet certain income, eligibility, assets requirements. While guided by federal law and regulations, Medicaid is administered by states, which have substantial authority to vary coverage of services, eligibility requirements, and provider reimbursement. The Federal Government provides most of the funding for Medicaid, although the amount provided depends on the Federal Medical Assistance Percentage (FMAP) for each state, which is based on per capita income. Under standard match rates, states cover the costs of health and social services for eligible beneficiaries and receive a portion of their expenditures back from the Federal Government. The minimum FMAP is 50 percent and in fiscal year (FY) 2018, the highest is 75.65 percent in Mississippi (ASPE, 2015). Through disproportionate share payments, provider taxes, and use of upper payment limit payments, actual federal match rates are higher. Under the Affordable Care Act (ACA) of 2010, states were eligible for enhanced and administrative match rates for special initiatives, generally unrelated to LTSS (Snyder & Rudowitz, 2015). Medicaid is the largest health program by enrollment and second largest by expenditures. Medicaid expenditures, including federal and state spending, reached $575.9 billion in FY 2016, accounting for 17 percent of total United States health expenditures and 3.1 percent of GDP (Truffer, Wolfe & Rennie, 2016).
Financial and other requirements for Medicaid are complicated and there are multiple pathways to becoming eligible. Federal law mandates inclusion of certain groups, including low-income families, qualified pregnant women and children, older people and people with blindness and disabilities. In general, except for eligibility provided through the ACA expansions and demonstration projects, non-disabled individuals under age 65 are not eligible for Medicaid unless they are caring for a dependent child. Some individuals qualify for Medicaid because of disability status, which may include people with multiple sclerosis, epilepsy, blindness, HIV/AIDS, spinal cord and traumatic brain injuries, disabling mental health conditions, and IDD. Medicaid generally follows Social Security Disability Insurance/Supplemental Security Income (SSI) rules, which define disability as an inability to work rather than by functional or cognitive impairment.
Medicaid eligibility depends primarily on income and assets. In most states, people who are eligible for SSI are automatically eligible for Medicaid. SSI income levels are about three-quarters of the federal poverty level. In general, aged, blind, and disabled beneficiaries may not have more than $2,000 in countable assets for individuals and $3,000 for couples, a level that has not changed since 1989 (Colello, 2017). States may elect to use alternative or optional eligibility pathways to determine which groups qualify for Medicaid:
-
In 2015, ten states used the Section 209(b) option, which permits states to apply their own more restrictive eligibility requirements rather than SSI determination. States using this option must allow older people and people with disabilities to "spend down" to the states' eligibility levels.
-
In 2015, 21 states made use of the "poverty level" option, which covers older people and people with disabilities above the SSI limit (up to 100 percent of the federal poverty level).
-
Thirty-two states included older adults and younger adults with disabilities in their "medically needy" option, which covers individuals whose incomes do not meet standard eligibility criteria but who have high medical expenses. This is a common eligibility pathway for people in nursing homes.
-
For people who need an institutional level of care, 44 states (including some that provide for the medically needy option) use the "special income rule" to provide Medicaid eligibility for individuals with incomes up to 300 percent of the SSI level. This standard is used for eligibility for institutional care and Medicaid HCBS waivers.
-
Seventeen states made state plan amendments for Section 1915(i) services, allowing coverage for individuals who receive state plan HCBS and who do not have a nursing home level of care. (Section 1915(i), which allows states to offer HCBS as part of the state plan benefits package, was modified by the ACA; Watts, Cornachione & Musumeci, 2016).
As of September 2016, 32 states also chose to expand Medicaid under the ACA, offering Medicaid coverage to individuals at or below 133 percent of the federal poverty level (Rudowitz, Valentine & Smith, 2016). This option provides coverage for low-income people with disabilities who do not qualify for SSI, including those whose disabilities are not severe, people who are working despite their disabilities, or people whose income or assets exceed the normal Medicaid eligibility levels. The expansion population is not eligible for Medicaid LTSS services.
Medicaid LTSS Services
Medicaid covers a wide range of LTSS, but coverage varies across states. All states are required to provide coverage for nursing facility services and home health services. States may also offer optional services, including intermediate care facilities for IDD, state plan personal care services, Community First Choice state plan option (Section 1915(k)), and the HCBS state plan option (Section 1915(j)). Services provided through the Medicaid state plan must be provided on an entitlement basis; waiting lists are not permitted, although states have wide authority to limit the amount of services and the functional eligibility that is required.
In addition, there are also two waiver programs through which states can provide HCBS: Section 1915(c) and Section 1115. Section 1915(c) (commonly known as Medicaid HCBS waivers) allows states to waive regular Medicaid program income and resource limits and provide HCBS to beneficiaries who would otherwise need institutional care. In FY 2014, Medicaid HCBS waivers accounted for 51.5 percent of total Medicaid spending for HCBS (Eiken, Sredl, Saucier & Burwell, 2016). There are 290 1915(c) waivers nationwide distributed across every state (except those that have research and demonstration waivers) (Kaiser Family Foundation, 2015). Under Section 1915(c), states can use higher financial eligibility criteria and provide coverage for a wide range of medical and non-medical services that are often not otherwise covered (including case management, respite, home health, personal care, residential care, habilitation and day care, nursing, therapy, and respite care). States are also required to target people meeting an institutional level of care criteria and to limit the number of people who receive services to a number approved by the Centers for Medicare and Medicaid Services (CMS). In some states, there are more individuals who need services than the maximum number of waiver slots available. States may establish waiting lists when waiver slots are filled or when there is limited state funding to cover waiver services, something not normally permitted in Medicaid. The number of people on HCBS waiver waiting lists has steadily increased over the past decade, increasing from 260,916 individuals in 2005 to 641,841 individuals in 2015 (Ng, Harrington, Musumeci & Ubri, 2016). There is great variation in the use and size of wait lists. Some states have none at all while others have wait lists of many years. Most people on waiting lists (67 percent in 2015) are persons with IDD.
Arizona, Rhode Island, and Vermont do not have Section 1915(c) waivers but offer HCBS through Section 1115 waivers (Kaiser Family Foundation, 2015). Section 1115 allows states to apply to the U.S. Department of Health and Human Services for demonstration projects that have potential to generate savings or improve outcomes for the Medicaid population. As of 2016, 11 states were operating Medicaid managed LTSS programs under a Section 1115 waiver. In addition, Money Follows the Person and the Balancing Incentive Program, provisions in the ACA, provide enhanced federal matching to states to rebalance LTSS towards HCBS. Money Follows the Person allows states to transition Medicaid beneficiaries from institutions to community-based settings, while the Balancing Incentive Program incentivizes states to expand HCBS options, make infrastructural changes to facilitate HCBS and meet a 50 percent target for LTSS expenditures spending on HCBS (Kaiser Family Foundation, 2013; Wiener et al., 2015).
Medicaid Enrollment Trends
The average monthly Medicaid enrollment for all populations was approximately 76 million in 2015, of which 6 million enrollees were aged and 10 million were blind or disabled. This enrollment is projected to reach 86 million by 2026, including 8 million aged and 11 million disabled beneficiaries (CBO, 2016). Despite the aging of the population, Medicaid enrollment of older adults is growing at a slow rate, while enrollment of younger adults with a disability is growing more quickly (Figure 1). In the period between 1975 and 2013, Medicaid beneficiaries (enrollees for whom payments are made) aged 65 and older increased from 3.6 million to 4.5 million, a 25 percent increase. In contrast, during the same time period, Medicaid beneficiaries who are blind or disabled more than tripled, increasing from 2.5 million to 10.1 million people, a 400 percent increase (MACPAC, 2016a).
| FIGURE 1. Medicaid Beneficiaries, FYs 1975-2013 (in thousands) |
|---|
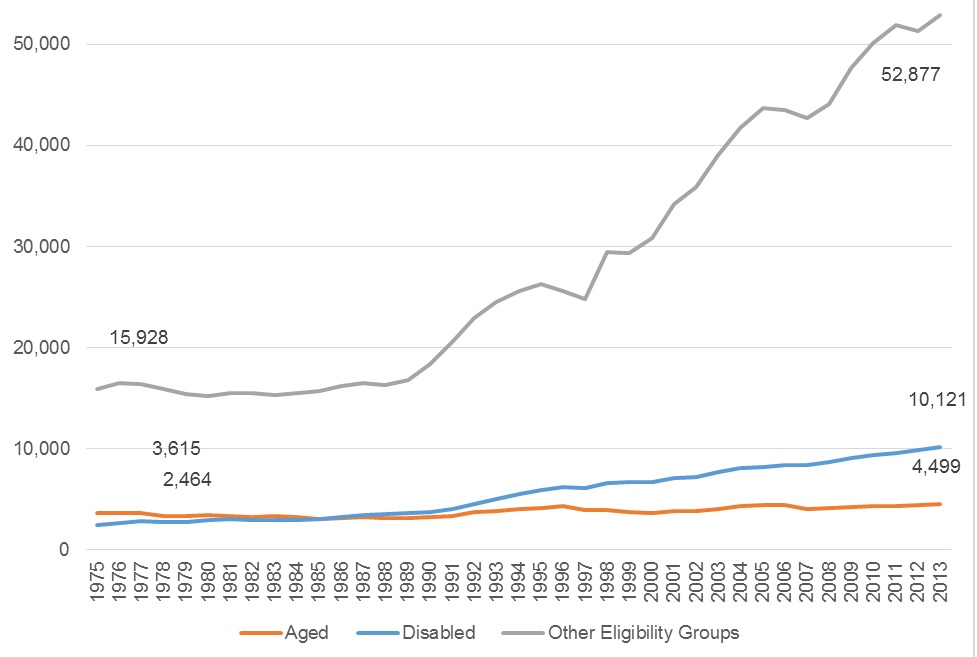 |
| SOURCE: MACPAC, 2016 analysis of MSIS data; for FYs 1975-1998: Centers for Medicare and Medicaid Services, Medicare & Medicaid statistical supplement, 2010 edition, Table 13.4. https://www.macpac.gov/publication/medicaid-beneficiaries-persons-served-by-eligibility-group/. NOTE: Other eligibility groups include children, adults, and unknown. Beneficiaries are defined as Medicaid enrollees for whom payments are made. |
Because of differences in demographics and Medicaid eligibility criteria, these trends vary among states. In FY 2011, adults aged 65 and older ranged from 4 percent of the total Medicaid enrollment population in Utah, to 18 percent of total enrollment in Maine. Adults with disabilities ranged from 9 percent of Medicaid enrollment in California to 28 percent of Medicaid enrollment in West Virginia (Kaiser Family Foundation, n.d.).
The Medicaid population also includes "dual eligible" beneficiaries, enrollees who are enrolled in both Medicare and Medicaid. There are more than 10 million dual eligible beneficiaries in the United States, or one out of every seven Medicaid beneficiaries (MedPAC & MACPAC, 2017). While Medicare typically provides payment for acute and primary care for this population, Medicaid is the primary payer of LTSS. More than three-fifths (62 percent) of Medicaid expenditures for dual eligibles in 2011 were for LTSS (Reaves & Musumeci, 2015).
LTSS Share of Medicaid Expenditures
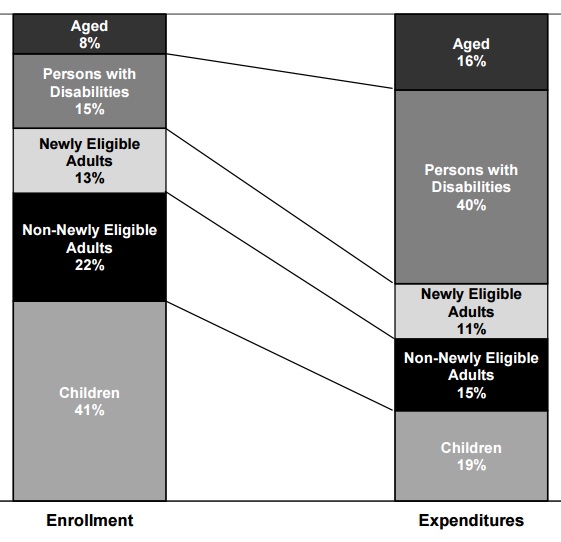
Although the proportions of aged and disabled beneficiaries are small compared to children and adults ages 18-64, these two populations account for most Medicaid spending. In federal FY 2015, total Medicaid outlays exceeded $553 billion. Although aged beneficiaries made up only 8 percent of the enrollment population, they accounted for 16 percent of all Medicaid expenditures. Similarly, while persons with disabilities represented 15 percent of total Medicaid enrollment population, they accounted for 40 percent of Medicaid spending. (Figure 2). This disproportionate role is due to significantly higher per enrollee spending for these two eligibility groups, totaling $19,478 for persons with disabilities and $14,323 for older adults in 2015. In comparison, per enrollee spending was less than $6,500 for all other eligibility groups (e.g., children, adults, and expansion adults) (Truffer, Wolfe, & Rennie, 2016).
| FIGURE 2. Estimated Medicaid Enrollment and Expenditures by Enrollment Group, as Share of Total, FY 2015 |
|---|
 |
| SOURCE: U.S. Department of Health and Human Services. 2016 Actuarial Report on the Financial Outlook for Medicaid, Figure 1. https://www.medicaid.gov/medicaid/financing-and-reimbursement/downloads/medicaid-actuarial-report-2016.pdf. NOTE: Totals and components exclude Disproportionate Share Hospital expenditures, Territorial enrollees and expenditures, and adjustments. Totals may not add to 100 percent due to rounding. |
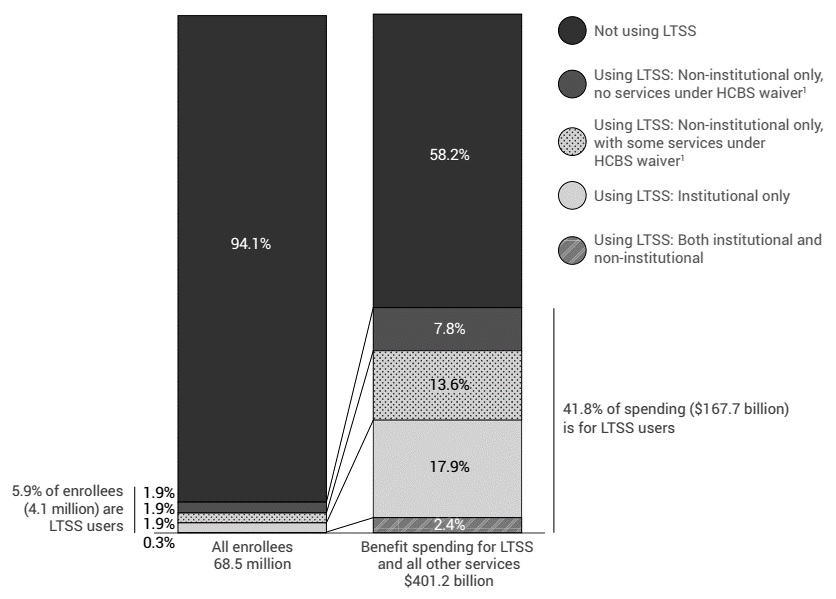
As shown in Figure 3, the large majority of Medicaid enrollees are not LTSS users. Despite representing a small proportion of total Medicaid enrollees (5.9 percent in 2013), LTSS users represent a substantial proportion of Medicaid benefit spending (41.8 percent, or $167.7 billion in 2013). This includes spending on both institutional and non-institutional services (MACPAC, 2016b).
| FIGURE 3. Distribution of Medicaid Enrollment and Benefit Spending by Users and Non-Users of LTSS, FY 2013 |
|---|
 |
| SOURCE: Medicaid and CHIP Payment and Access Commission (MACPAC). (2016, December). MACStats: Medicaid and CHIP Data Book, Exhibit 20. https://www.macpac.gov/wp-content/uploads/2016/12/MACStats_DataBook_Dec2016.pdf. NOTES: Spending includes federal and state funds; excludes spending on administration, the territories, and Medicaid expansion Children's Health Insurance Program (CHIP) enrollees. Excludes Idaho, Louisiana, and Rhode Island due to data completeness and data reliability concerns.
|
As evident in expenditure data, LTSS for these populations can be very costly. Older adults and people with disabilities who rely on Medicaid to finance their care often "spend down" to Medicaid eligibility, meaning that they have exhausted their personal savings by paying out-of-pocket for care. Spending down is common among people using LTSS, particularly among those who require nursing home care. From 1996-1998 to 2008, nearly 10 percent of adults aged 50 and older spent down to Medicaid eligibility; more than half of these beneficiaries utilized personal care services, nursing home services, or both (Wiener, Anderson, Khatutsky, Kaganova & O'Keeffe, 2013).
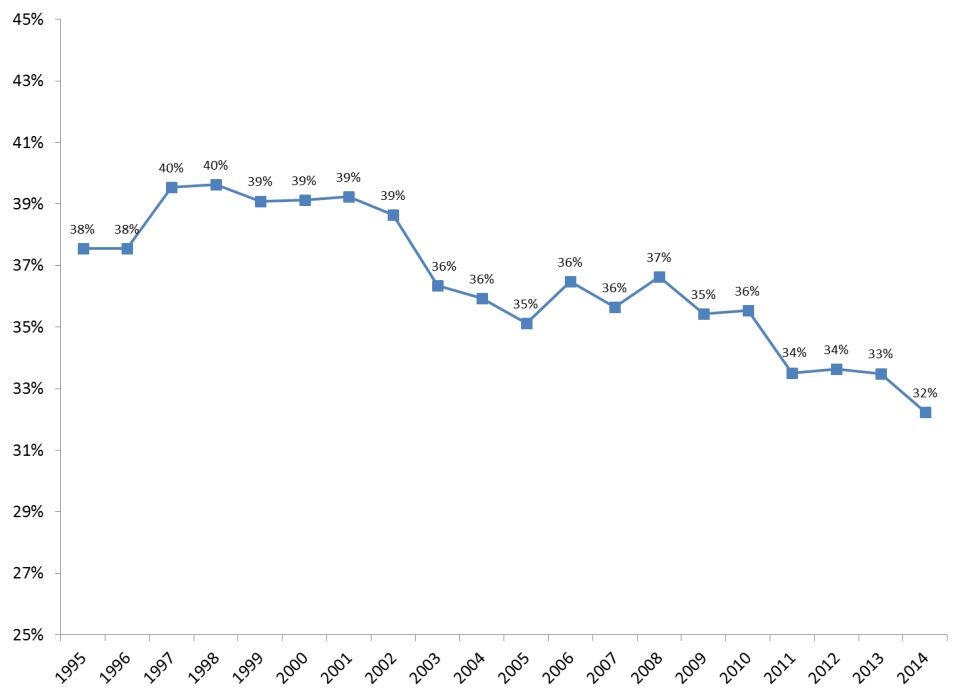
Total Medicaid spending for LTSS, including services provided through managed care programs, totaled $152 billion in FY 2014 (Eiken at al., 2016). Because of Medicaid expansion to new eligibility groups, provision of new benefits, and lower rates of increase in expenditures other than for acute care, LTSS are gradually becoming a smaller proportion of total Medicaid expenditures. Between 1995 and 2014, LTSS as a share of total Medicaid expenditures declined from 38 percent to 32 percent, after peaking at 40 percent in 1996 and 1997 (Figure 4).
| FIGURE 4. LTSS as a Percentage of Total Medicaid Expenditures, FYs 1995-2014 |
|---|
 |
| SOURCE: Eiken, S., Sredl, K., Burwell, B., & Saucier, P. (2016). Medicaid Expenditures for Long-Term Services and Supports (LTSS) in FY 2014, Figure 5. Truven Health Analytics. https://www.medicaid.gov/medicaid/ltss/downloads/ltss-expenditures-2014.pdf. |
Despite making up a smaller share of total Medicaid spending, total Medicaid LTSS spending continues to increase over time. This growth in LTSS spending is particularly pronounced for HCBS (Colello, Girvan, Mulvey & Talaga, 2012; Eiken et al., 2016; Ng et al., 2016). HCBS expenditures grew by nearly 36 percent between FY 2010 and FY 2014 (from $66.6 billion to $80.6 billion). In contrast, growth in expenditures for institutional settings has slowed over the last decade (Table 1). Between FY 2010 and FY 2014, institutional LTSS expenditures remained constant at approximately $71 billion.
| TABLE 1. Medicaid Federal and State LTSS Expenditures, 1985-2014 | |||||||
|---|---|---|---|---|---|---|---|
| Service Type | 1985 ($) | 1990 ($) | 1995 ($) | 2000 ($) | 2005 ($) | 2010 ($) | 2014 ($) |
| Institutional LTSS | 17,846,646,874 | 27,454,054,915 | 46,533,983,600 | 55,251,893,668 | 67,680,179,781 | 72,606,567,296 | 71,220,200,421 |
| Nursing Facilities | 11,803,618,774 | 17,985,880,904 | 30,354,138,234 | 39,582,996,026 | 47,481,182,259 | 51,876,179,023 | 55,154,595,336 |
| ICF/IID | 4,751,915,827 | 7,639,156,811 | 9,608,453,702 | 9,955,040,629 | 12,483,291,935 | 13,891,344,370 | 10,359,003,414 |
| HCBS | 1,367,454,590 | 3,924,783,069 | 10,349,396,963 | 20,778,323,393 | 39,328,133,836 | 66,574,131,413 | 80,649,914,113 |
| Total LTSS | 19,214,101,464 | 31,378,837,984 | 56,883,380,563 | 76,030,217,061 | 107,008,313,617 | 139,180,698,709 | 151,870,114,534 |
| SOURCE: Wenzlow, A., Eiken, S., & Sredl, K. (2016). Improving the Balance: The Evolution of Medicaid Expenditures for Long-Term Services and Supports (LTSS), FY 1981-2014. Truven Health Analytics. https://www.medicaid.gov/medicaid/ltss/downloads/evolution-ltss-expenditures.pdf. | |||||||
Older people and people with physical disabilities represent the largest portion of Medicaid LTSS expenditures. Moreover, nearly half (45 percent) of Medicaid LTSS beneficiaries in 2012 were adults aged 65 and older (Eiken, 2016). In FY 2014, LTSS expenditures for older people and people with physical disabilities totaled $93 billion, or 61 percent of total LTSS expenditures. LTSS for people with IDD totaled $42 billion--28 percent of expenditures--and LTSS for people with severe mental illness or serious emotional disturbance and other populations made up the remaining $17 billion, or 11 percent (Eiken et al., 2016).
On a national scale, LTSS expenditures and its relative size within the Medicaid program varies substantially across states. While state variations partly mirror the demographics of each state, much of the variation is a function of how each state has designed LTSS coverage, eligibility and reimbursement (Artiga, Hinton, Rudowitz & Musumeci, 2017). In 2014, LTSS expenditures ranged from $267 million in Wyoming to $22 billion in New York, and LTSS as a percentage of total Medicaid expenditures ranged from 18 percent to 61 percent of total Medicaid spending (Table 2). In general, states with the most restrictive general coverage and eligibility had the highest proportion of their Medicaid program accounted for by LTSS, largely because there are fewer people receiving non-LTSS services.
| TABLE 2. Total State/Federal Medicaid LTSS Expenditures and LTSS as Percentage of Total Medicaid, by State, FY 2014 | ||
|---|---|---|
| State | Total Medicaid LTSS Expenditures ($) | Total LTSS as a Percentage of Total Medicaid (%) |
| Alabama | 1,714,039,123 | 32.8 |
| Alaska | 471,407,909 | 36.3 |
| Arizona | 1,638,279,179 | 18.1 |
| Arkansas | 1,992,179,862 | 41.0 |
| California | 15,334,647,746 | 24.7 |
| Colorado | 1,904,328,207 | 31.8 |
| Connecticut | 3,078,643,339 | 42.9 |
| Delaware | 515,859,512 | 30.0 |
| District of Columbia | 791,442,952 | 33.2 |
| Florida | 5,927,300,484 | 28.9 |
| Georgia | 2,418,939,567 | 25.9 |
| Hawaii | 465,495,713 | 24.3 |
| Idaho | 582,038,837 | 34.5 |
| Illinois | 4,908,963,287 | 26.6 |
| Indiana | 3,484,735,825 | 39.1 |
| Iowa | 2,060,386,322 | 50.8 |
| Kansas | 1,088,442,743 | 38.4 |
| Kentucky | 1,862,441,054 | 23.9 |
| Louisiana | 2,201,676,070 | 30.9 |
| Maine | 947,878,157 | 38.4 |
| Maryland | 2,975,995,766 | 31.9 |
| Massachusetts | 5,245,392,496 | 34.4 |
| Michigan | 2,982,160,809 | 22.2 |
| Minnesota | 4,159,573,466 | 41.4 |
| Mississippi | 1,506,667,723 | 30.8 |
| Missouri | 3,117,791,576 | 34.8 |
| Montana | 443,457,069 | 40.7 |
| Nebraska | 799,368,968 | 44.2 |
| Nevada | 522,096,322 | 22.5 |
| New Hampshire | 772,872,125 | 55.7 |
| New Jersey | 5,055,683,417 | 40.3 |
| New Mexico | 950,229,778 | 22.3 |
| New York | 22,115,418,860 | 41.0 |
| North Carolina | 3,122,238,425 | 25.5 |
| North Dakota | 573,759,682 | 61.2 |
| Ohio | 7,117,019,254 | 38.1 |
| Oklahoma | 1,366,822,021 | 27.6 |
| Oregon | 1,969,617,499 | 29.3 |
| Pennsylvania | 8,680,447,547 | 36.8 |
| Rhode Island | 854,400,801 | 34.7 |
| South Carolina | 1,418,027,666 | 25.5 |
| South Dakota | 312,478,416 | 40.8 |
| Tennessee | 2,438,388,124 | 26.3 |
| Texas | 8,576,468,172 | 28.0 |
| Utah | 522,205,513 | 25.3 |
| Vermont | 386,764,857 | 25.2 |
| Virginia | 2,834,634,946 | 36.8 |
| Washington | 2,687,755,088 | 25.9 |
| West Virginia | 1,429,278,398 | 42.7 |
| Wisconsin | 3,277,268,045 | 43.2 |
| Wyoming | 266,705,817 | 48.9 |
| Total | 151,870,114,534 | 32.0 |
| SOURCE: Eiken, S., Sredl, K., Burwell, B., & Saucier, B. (2016). Medicaid Expenditures for Long-Term Services and Supports (LTSS) in FY 2014. Truven Health Analytics. https://www.medicaid.gov/medicaid/ltss/downloads/ltss-expenditures-2014.pdf. | ||
Future Projections
Given current demographic, utilization, and Medicaid enrollment trends, Medicaid LTSS spending is expected to increase steadily over the next decade. Under current law, Medicaid expenditures for federal and state combined are projected to exceed $957 billion by 2025, with Federal Government spending accounting for 61 percent of this amount. Although capitation payments and premiums will compose the largest share of Medicaid expenditures, Medicaid LTSS spending is projected to increase more slowly than the rest of Medicaid, increasing from $113 billion in 2015 to $154 billion in 2025 (Truffer et al., 2016). Using the DYNASIM microsimulation model, the Urban Institute projects that the number of Medicaid LTSS beneficiaries age 65 and older will increase from about 2.4 million in 2014 to about 3.4 million in 2050 (personal communication with Melissa Favreault, Urban Institute, May 26, 2017). Low and unchanging Medicaid asset levels is the probable reason why the number of elderly beneficiaries does not increase more in that time period. Over the same time period, Medicaid expenditures for this population are projected to increase from about $68 billion in 2014 to $401 billion in 2050.
Role of Medicaid in LTSS
LTSS Funding Streams
Not only does LTSS represent a large proportion of Medicaid outlays, but Medicaid plays an important role in the LTSS system, accounting for about 51 percent of LTSS (O'Shaughnessy, 2014; Reaves & Musumeci, 2015). Private spending, including private long-term care insurance and out-of-pocket payments, make up 27 percent of LTSS expenditures. Approximately two-thirds of private spending is for nursing home care2 (Colello et al., 2012). Medicare and other public programs (e.g., Veterans Health Administration, State CHIP, general assistance programs, and state and local programs) make up the remaining public share of LTSS expenditures (21 percent) (Figure 5).
LTSS is generally not covered by Medicare or general private health insurance. Medicare provides coverage for short-term post-acute care, but it does not cover LTSS over an extended period. In addition, few Americans have a long-term care insurance policy, yet most do not expect assistance from the Medicaid system as they age (Tompson et al., 2013). In 2014, 11 percent of the population aged 40-70 had private long-term care insurance (Khatutsky, Wiener, Greene & Thach, 2016). Because of the high cost of LTSS and the lack of other insurance coverage, LTSS financing relies heavily on Medicaid and out-of-pocket payments (Colello et al., 2012).
| FIGURE 5. Medicaid Share of Payments for National LTSS Spending, 2013 |
|---|
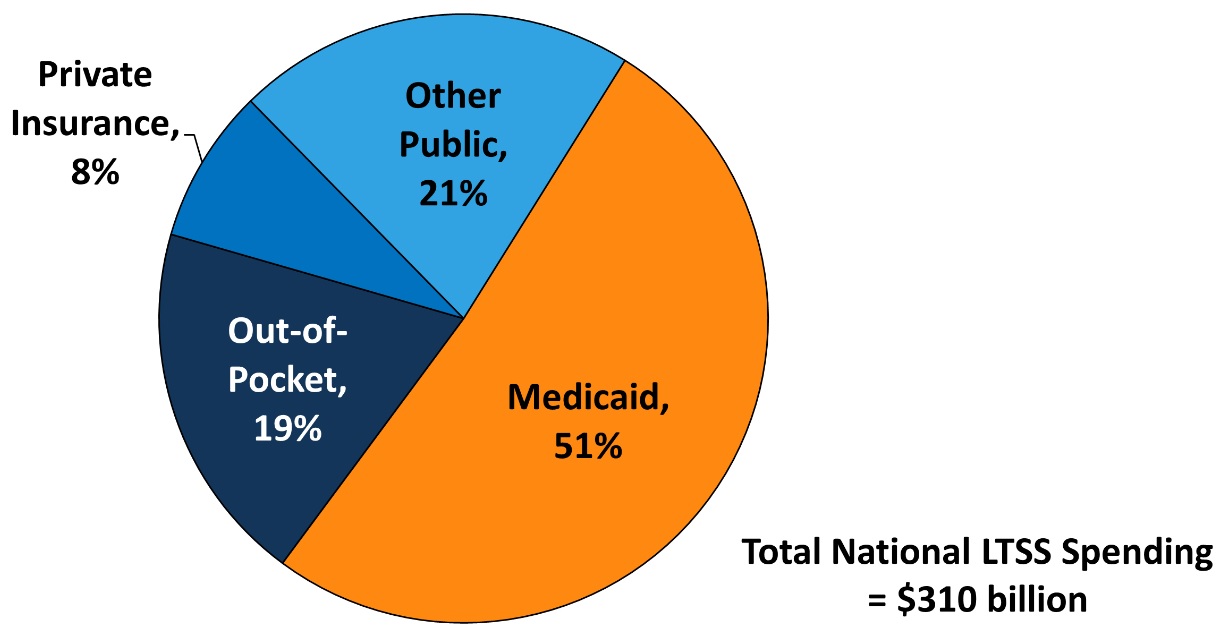 |
| SOURCE: Reaves, E.L., & Musumeci, M. (2015). Medicaid and Long-Term Services and Supports: A Primer, Figure 3. http://kff.org/medicaid/report/medicaid-and-long-term-services-and-supports-a-primer/. Kaiser Commission on Medicaid and the Uninsured (KCMU) estimates based on CMS National Health Expenditure Accounts data for 2013. NOTES: Total LTSS expenditures include spending on residential care facilities, nursing homes, home health services, and home and community-based waiver services. Expenditures also include spending on ambulance providers and some post-acute care. This chart does not include Medicare spending on post-acute care ($74.1 billion in 2013). All home and community-based waiver services are attributed to Medicaid. |
Medicaid Expenditures Across LTSS Settings
Formal LTSS services are distributed across three main settings: nursing homes, home care, and residential facilities. The Medicaid share of spending is larger for LTSS than for any other setting or service category (including hospital care, physician and clinical services, and prescription drugs (Truffer, Wolfe & Rennie, 2015). The Medicaid share of nursing home care is particularly high; in 2014, an estimated 63 percent of long-term care service users residing in nursing homes had Medicaid as a payer source (Harris-Kojetin et al., 2016). Medicaid beneficiaries access LTSS in a variety of other settings as well. During the same time, Medicaid beneficiaries made up 54 percent of users of adult day services centers, 15 percent of users of residential care communities, and 9 percent of home health agencies. For older adults residing in the community, the more ADL assistance needed, the higher the likelihood of being enrolled in Medicaid. Among older results who need assistance with three or more ADLs, approximately one-quarter were enrolled in Medicaid in 2010 (compared to 5 percent who had no functional limitations; CBO, 2013).
For adults ages 18-64 who use LTSS, expenditures and utilization patterns are significantly different, especially as the LTSS system for some subpopulations is more oriented toward HCBS. In 2014, most LTSS expenditures (61 percent) were spent on older adults and adults with physical disabilities, but the data are not further disaggregated by age. Spending on younger adults with IDD, serious mental illness, or severe emotional disturbance, and other populations accounted for about two-fifths of Medicaid LTSS expenditures, mostly for people with IDD (Eiken et al., 2016). Although these groups make up a relatively smaller share of total Medicaid LTSS expenditures, service users rely heavily on Medicaid to finance their LTSS. For example, in FY 2013, Medicaid represented 78 percent ($48 billion) of total IDD spending on LTSS. These totals included expenditures on HCBS waivers and public and private intermediate care facilities for individuals with IDD. In the same FY, Medicaid spending on LTSS for individuals with IDD accounted for one-tenth of the total federal Medicaid expenditures (Braddock et al., 2015).
Medicaid and HCBS
Historically, Medicaid funding for LTSS was primarily spent on institutional care, with very little spending for HCBS. Medicaid LTSS expenditure began shifting toward HCBS in the 1980s. In FY 2013, HCBS Medicaid expenditures made up a majority (51 percent) of the total Medicaid LTSS expenditures, exceeding spending on institutional care for the first time (Eiken et al., 2016; Ng et al., 2016). The proportion of Medicaid LTSS expenditures reached a high of 53 percent in FY 2014 (Figure 6).
| FIGURE 6. Medicaid HCBS Expenditures as a Percentage of Total Medicaid LTSS Expenditures, FYs 1995-2014 |
|---|
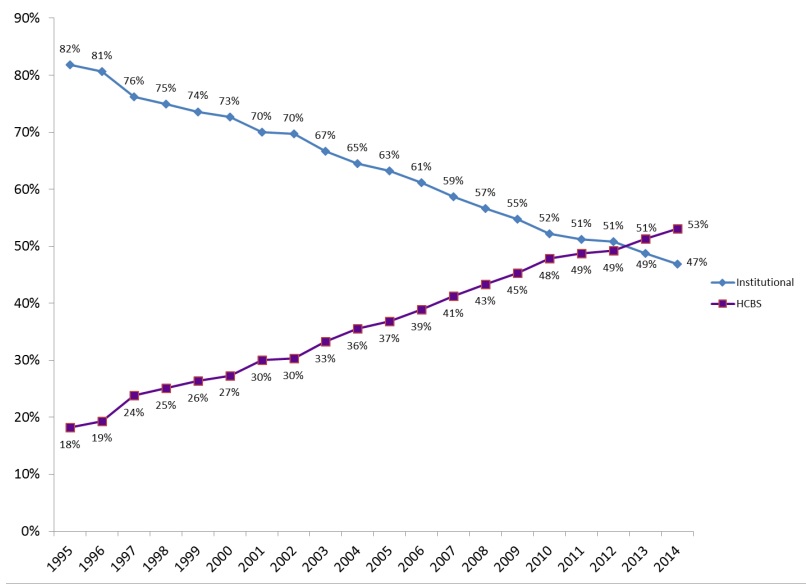 |
| SOURCE: Eiken, S., Sredl, K., Burwell, B., & Saucier, P. (2016). Medicaid Expenditures for Long-Term Services and Supports (LTSS) in FY 2014, Figure 6. Truven Health Analytics. https://www.medicaid.gov/medicaid/ltss/downloads/ltss-expenditures-2014.pdf. |
This shift reflects years of rebalancing efforts at both the federal and state levels, principally through growth in 1915(c) waivers, although state plan personal care and home health increased as well. Also, contributing to the increase in HCBS expenditures has been ACA provisions such as the Money Follows the Person Demonstration, the Balancing Incentive Program, the Section 1915(i) HCBS state plan option, and the Section 1915(k) Community First Choice state plan option; 45 states participate in at least one of these options (Reaves & Musumeci, 2015). The three main Medicaid HCBS programs (i.e., 1915(c) waivers, state plan personal care, and state plan home health) increased the number of beneficiaries served from 2.5 million people in 2003 to 3.2 million people in 2012. The largest growth during this time occurred among the Section 1915(c) waiver population, which increased from 984,000 in 2003 to 1.5 million participants in 2012 (Ng et al., 2016) (Figure 7). The decrease in the number of HCBS beneficiaries for 2013 in Figure 7 is because the data exclude services through Community First Choice, Section 1915(i), and Section 1115 waivers that include HCBS, which have been growing in importance.
| FIGURE 7. Growth in Medicaid HCBS Participants, by Program, 2003-2013 |
|---|
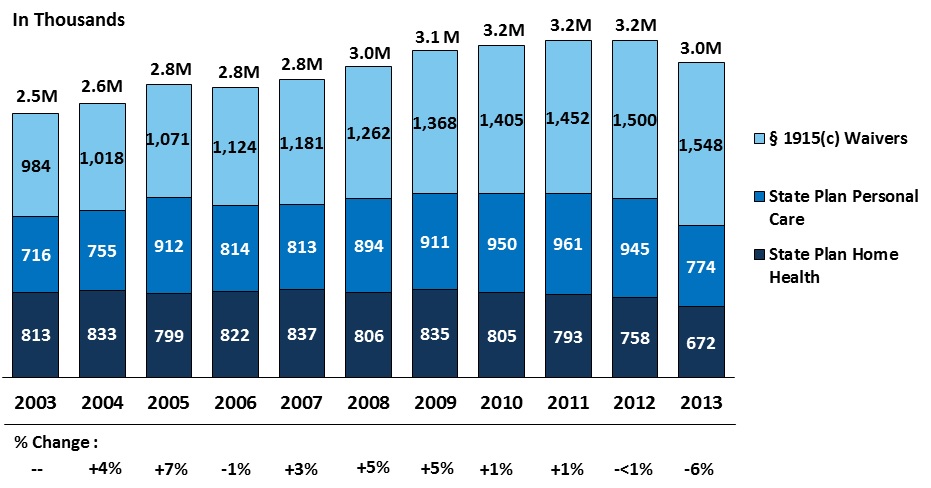 |
| SOURCE: Ng, T., Harrington, C., Musumeci, M., & Ubri, P. (2016). Medicaid Home and Community-Based Services Programs: 2013 Data Update, Figure 1. http://kff.org/medicaid/report/medicaid-home-and-community-based-services-programs-2013-data-update/. KCMU and University of California at San Francisco analysis of CMS Form 372 data and program surveys. NOTE: Figures updated annually and may not correspond with previous KCMU reports. Data exclude enrollment in Community First Choice, Section 1915(i), and Section 1115 waivers that include HCBS. |
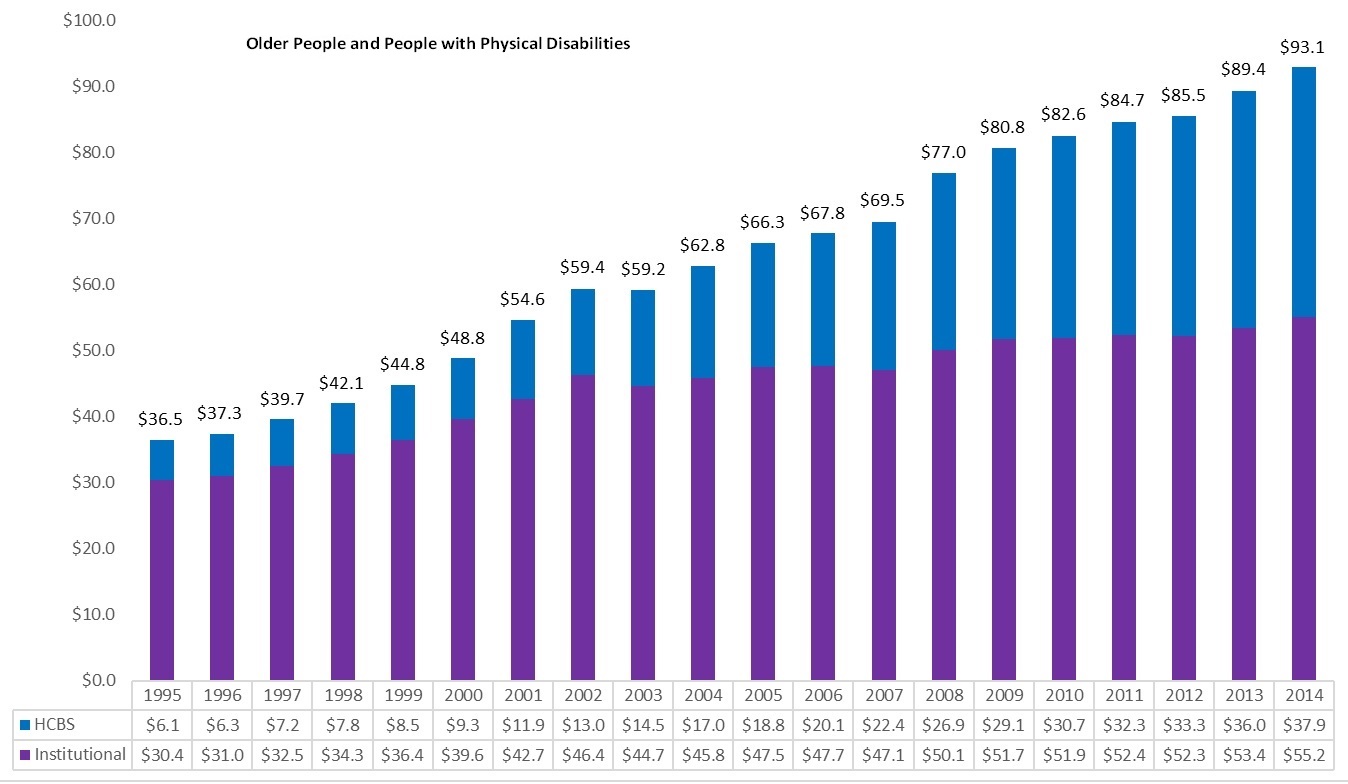
Although the share of HCBS spending continues to rise (Eiken et al., 2016), national data masks variation between states and populations. For example, the HCBS share of Medicaid LTSS expenditures is much higher among beneficiaries with IDD (75 percent) than among older people and people with physical disabilities (41 percent) (Figure 8). Spending on LTSS for beneficiaries with IDD was $41.7 billion in 2014, including $31 billion spent on HCBS. In contrast, spending on LTSS for older people and people with physical disabilities totaled $93 billion in 2014, with $38 billion spent on HCBS. When broken down further, the HCBS share of LTSS expenditures is higher for people with physical disabilities than for people age 65 and older (46 percent vs. 26 percent in 2006; Wenzlow, Borck, Miller, Doty & Drabek, 2013).
| FIGURE 8. Medicaid LTSS Expenditures by Service Category, FYs 1995-2014 (in billions) |
|---|
| Older People and People with Physical Disabilities |
 |
| People with Developmental Disabilities |
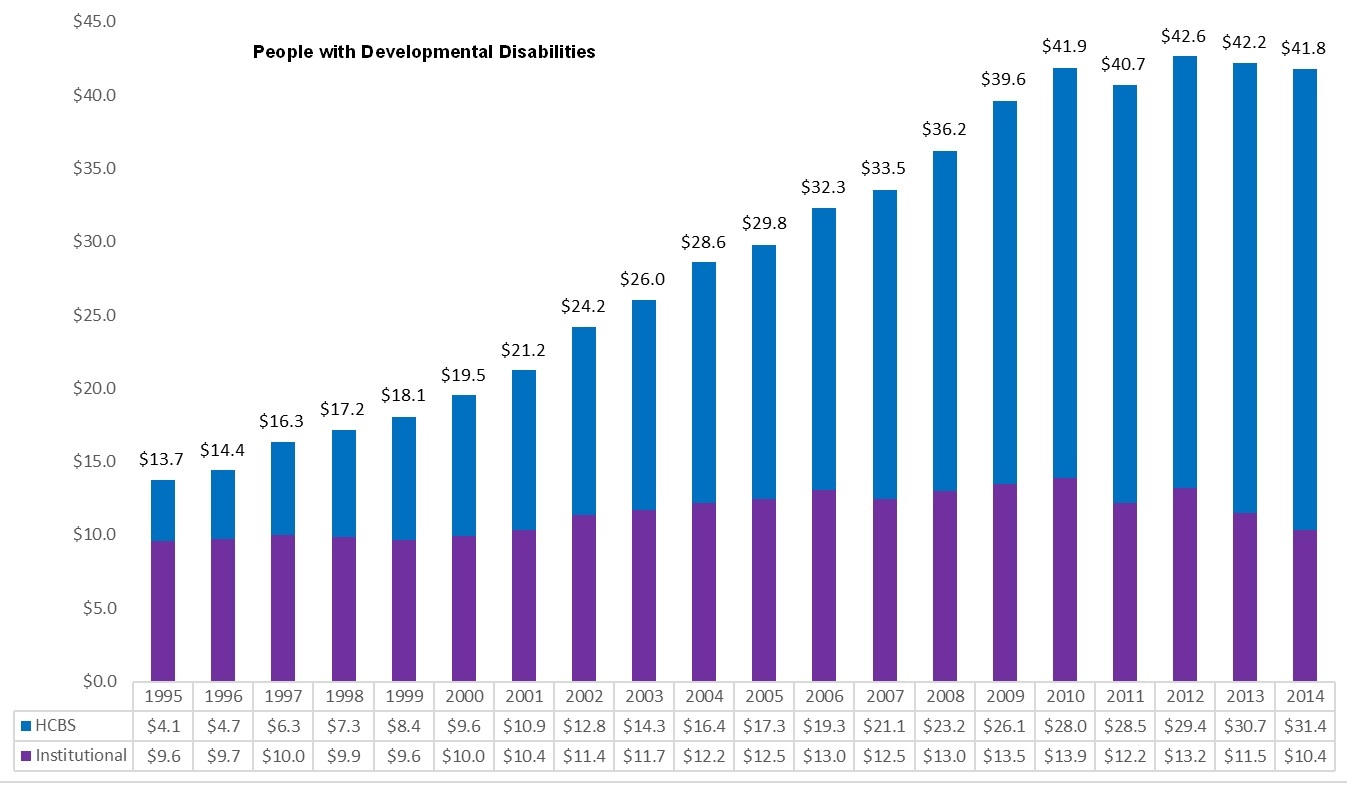 |
| SOURCE: Eiken, S., Sredl, K., Burwell, B., & Saucier, P. (2016). Medicaid Expenditures for Long-Term Services and Supports (LTSS) in FY 2014. Truven Health Analytics. https://www.medicaid.gov/medicaid/ltss/downloads/ltss-expenditures-2014.pdf. |
Among states, the proportion of Medicaid HCBS expenditures as share of total Medicaid LTSS expenditures ranges from 27 percent in Mississippi to 79 percent in Oregon. Approximately half of states have HCBS spending below 50 percent, and half have HCBS spending above 50 percent (Eiken et al., 2016) (Figure 9).
| FIGURE 9. Medicaid HCBS Expenditures as a Percentage of Total Medicaid LTSS Expenditures, by State, FY 2014 |
|---|
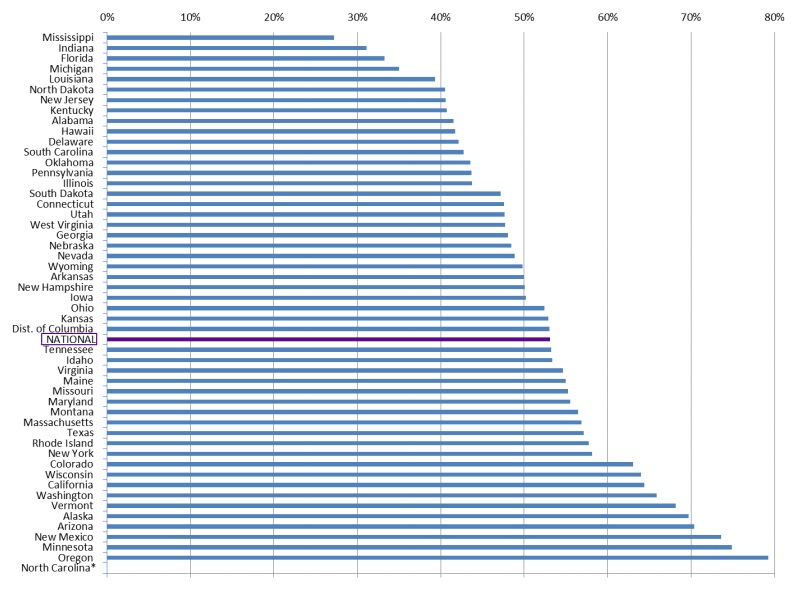 |
| SOURCE: Eiken, S., Sredl, K., Burwell, B., & Saucier, P. (2016). Medicaid Expenditures for Long-Term Services and Supports (LTSS) in FY 2014, Figure 7. Truven Health Analytics. https://www.medicaid.gov/medicaid/ltss/downloads/ltss-expenditures-2014.pdf. NOTES: North Carolina was excluded from this analysis because it has a high proportion of LTSS delivered through managed care and detailed information about the state's managed care expenditures was not available for FY 2014. |
Managed LTSS
Through Medicaid, the LTSS delivery system is also introducing more managed care options for eligible beneficiaries. Managed LTSS provide an opportunity to improve care coordination and access to HCBS for beneficiaries, as well as achieve cost savings or improved health outcomes (Reaves & Musumeci, 2015). As of 2016, 11 states were operating Section 1115 Medicaid managed LTSS waivers and had enrolled nearly 900,000 beneficiaries, most of whom were seniors, people with physical disabilities, and to a smaller extent, people with IDD (Watts, Musumeci & Ubri, 2017). These waivers require health plans to provide comprehensive benefit packages, including coverage of nursing home services, HCBS, acute and primary care, and behavioral health services. The waivers also incentivize plans to increase community integration, HCBS access, and self-direction of services for beneficiaries, and develop innovative initiatives to increase nursing home diversion and transitions (Watts et al., 2017).
Additionally, CMS and states are testing models under the Financial Alignment Initiative, which aim to align the Medicare and Medicaid delivery systems and improve care coordination for dually eligible Medicare-Medicaid enrollees across 13 states. Eleven states are operating capitated model demonstrations, in which CMS, a state, and a health plan enter a three-way contract to provide integrated services under a Medicare-Medicaid product to dual eligible enrollees. Health plans receive a blended payment, and are responsible for coordinating the full range of enrollees' care needs, including primary care, acute care, behavioral health services, and LTSS. Early results of these demonstrations look promising, but it will be important to follow their progress as implementation continues and understand their role in the larger LTSS system.
Conclusion
This report examined the role of LTSS in Medicaid and the role of Medicaid within the larger LTSS industry. It also examined how sociodemographic changes are likely to affect the demand for LTSS in the future, and as a result, Medicaid use and expenditures. The analysis suggests three main themes. First, the changing demographics make large increases in demand for LTSS likely as well as increased expenditures, including Medicaid. Second, LTSS is an integral part of the Medicaid program and has been almost since its inception. Older people and younger people with disabilities account for a small percentage of Medicaid beneficiaries, but a disproportionate share of expenditures, in large part because of their high LTSS spending. The role of LTSS within state Medicaid programs varies greatly. Third, Medicaid plays a major role in financing LTSS services. Thus, major changes to the Medicaid program would have a major impact on the LTSS industry in general.
References
Artiga, S., Hinton, E., Rudowitz, R., & Musumeci, M. (2017). Current Flexibility in Medicaid: An Overview of Federal Standards and State Operations. Washington, DC: Kaiser Family Foundation. Available at: http://kff.org/medicaid/issue-brief/current-flexibility-in-medicaid-an-overview-of-federal-standards-and-state-options/.
Braddock, D., Hemp, R., Rizzolo, M.C., Tanis, E.S., Haffer, L., & Wu, J. (2015). The State of the States in Intellectual and Developmental Disabilities: Emerging from the Great Recession. Washington, DC: American Association on Intellectual and Developmental Disabilities.
Colby, S.L., & Ortman, J.M. (2015). Projections of the size and composition of the U.S. population: 2014 to 2060. Current Population Reports: P25-1143. U.S. Census Bureau. Available at: https://www.census.gov/content/dam/Census/library/publications/2015/demo/p25-1143.pdf.
Colello, K.J. (2017). Medicaid financial eligibility for long-term services and supports. Congressional Research Service: R43506. Washington, DC: Congressional Research Service. Retrieved from )"&did=799453">https://www.hsdl.org/?view&did=799453.
Colello, K.J., Girvan, G.A., Mulvey, J., & Talaga, S.R. (2012). Long-term services and supports: Overview and financing. Congressional Research Service, Report for Congress: R42345. Washington, DC: Congressional Research Service. Available at: https://www.hsdl.org/?view&did=707282.
Congressional Budget Office [CBO]. (2013). Rising Demand for Long-Term Services and Supports for Elderly People. Available at: https://www.cbo.gov/sites/default/files/113th-congress-2013-2014/reports/44363-ltc.pdf.
Congressional Budget Office [CBO]. (2016). Detail of Spending and Enrollment for Medicaid for CBO's March 2016 Baseline. Available at: https://www.cbo.gov/sites/default/files/recurringdata/51301-2016-03-medicaid.pdf.
Courtney-Long, E.A., Carroll, D.D., Zhang, Q.C., Stevens, A.C., Griffin-Blake, S., Armour, B. S., & Campbell, V.A. (2015). Prevalence of disability and disability type among adults--United States, 2013. MMWR Morb Mortal Wkly Rep, 64(29), 777-83.
De La Maisonneuve, C. & Martins, J.O. (2013). Public spending on health and long-term care: A new set of projections. OECD Economic Policy Papers: No. 6. Available at: https://www.oecd.org/eco/growth/Health%20FINAL.pdf.
Drabek, J., & Marton, W. (2015). Measuring the Need for Long-Term Services and Supports Research Brief. Washington, DC: U.S. Department of Health and Human Services, Office of the Assistant Secretary for Planning and Evaluation. Available at: https://aspe.hhs.gov/basic-report/measuring-need-long-term-services-and-supports-research-brief.
Eiken, S. (2016). Medicaid Long-Term Services and Supports Beneficiaries in 2012. Centers for Medicare and Medicaid Services & Truven Health Analytics: Contract No. HHSM-500-2010-00026I. Available at: https://www.medicaid.gov/medicaid/ltss/downloads/ltss-beneficiaries-2012.pdf.
Eiken, S., Sredl, K., Saucier, P., & Burwell, B. (2016). Medicaid Expenditures for Long-Term Services and Supports (LTSS) in FY 2014. Centers for Medicare and Medicaid Services & Truven Health Analytics: Contract No. HHSM-500-2010-00026I. Available at: https://www.medicaid.gov/medicaid/ltss/downloads/ltss-expenditures-2014.pdf.
European Commission. (2015). The 2015 ageing report: Economic and budgetary projections for the 28 EU member states (2013-2060). European Economy: 3. Available at: http://ec.europa.eu/economy_finance/publications/european_economy/2015/pdf/ee3_en.pdf.
Favreault, M., & Dey, J. (2016). Long-Term Services and Supports for Older Americans: Risks and Financing Research Brief. Washington, DC: U.S. Department of Health and Human Services, Office of the Assistant Secretary for Planning and Evaluation. Available at: https://aspe.hhs.gov/basic-report/long-term-services-and-supports-older-americans-risks-and-financing-research-brief.
Feinberg, L., Reinhard, S.C., Houser, A., & Choula, R. (2011). Valuing the Invaluable: 2011 Update, the Growing Contributions and Costs of Family Caregiving. Washington, DC: AARP Public Policy Institute.
Freedman, V.A., Spillman, B.C., Andreski, P.M., Cornman, J.C., Crimmins, E. M., Kramarow, E., Lubitz, J., Martin, L.G., Merkin, S.S., Schoeni, R.F., Seeman, T.E. & Waidmann, T.A. (2013). Trends in late-life activity limitations in the United States: An update from five national surveys. Demography, 50(2), 661-671.
Harrington, C., Carrillo, H., Garfield, R. (2015). Nursing Facilities, Staffing, Residents and Facility Deficiencies, 2009 through 2014. Available at: http://kff.org/medicaid/report/nursing-facilities-staffing-residents-and-facility-deficiencies-2009-through-2014/.
Harris-Kojetin, L., Sengupta, M., Park-Lee, E., Valverde, R., Caffrey, C., Rome, V., & Lendon, J. (2016). Long-term care providers and services users in the United States: Data from the National Study of Long-Term Care Providers, 2013-2014. Vital & health statistics: Series 3, Analytical and epidemiological studies, (38), 1-118. U.S. Department of Health and Human Services, Public Health Service, National Center for Health Statistics. Available at: https://www.cdc.gov/nchs/data/series/sr_03/sr03_038.pdf.
Hebert, L.E., Weuve, J., Scherr, P.A., & Evans, D.A. (2013). Alzheimer disease in the United States (2010-2050) estimated using the 2010 Census. Neurology, 80(19), 1778-1783.
Heller, T., Stafford, P., Davis, L.A., Sedlezky, L., & Gaylord, V. (Eds.). (2010). People with intellectual and developmental disabilities growing old: An overview. Impact: Feature Issue on Aging and People with Intellectual and Developmental Disabilities, 23(1). Minneapolis, MN: University of Minnesota, Institute on Community Integration.
Hing, E., Sekscenski, E., & Strahan, G. (1989). The National Nursing Home Survey: 1985 summary for the United States. Vital and Health Statistics: Series 13, Data from the National Health Survey, (97), 1-249.
Hobbs, F., & Stoops, N. (2002). Demographic Trends in the 20th Century (Vol. 4). Washington, DC: US Census Bureau. Available at: https://www.census.gov/prod/2002pubs/censr-4.pdf.
Johnson, R.W., Toohey, D., & Wiener, J.M. (2007). Meeting the Long-Term Care Needs of the Baby Boomers: How Changing Families will Affect Paid Helpers and Institutions. The Retirement Project. Washington, DC: The Urban Institute. Available at: http://www.urban.org/sites/default/files/publication/43026/311451-Meeting-the-Long-Term-Care-Needs-of-the-Baby-Boomers.PDF.
Kaiser Family Foundation. (nd). Distribution of Medicaid Enrollees by Enrollment Group, FY 2011 [online]. Washington, DC: Kaiser Commission on Medicaid and the Uninsured and Urban Institute. Available at: https://www.kff.org/medicaid/state-indicator/distribution-of-medicaid-enrollees-by-enrollment-group/?currentTimeframe=0&sortModel=%7B%22colId%22:%22Location%22,%22sort%22:%22asc%22%7D.
Kaiser Family Foundation. (2013). Chartpack: Medicaid and its Role in State/Federal Budgets and Health Reform. Washington, DC: Kaiser Family Foundation, Kaiser Commission on Medicaid and the Uninsured. Available at: https://kaiserfamilyfoundation.files.wordpress.com/2013/04/8162-03.pdf.
Kaiser Family Foundation. (2015). Total Number of Medicaid Section 1915(c) Home and Community-Based Services Waivers, 2012 [online]. Washington, DC: Kaiser Commission on Medicaid and the Uninsured and University of California at San Francisco. Available at: https://www.kff.org/health-reform/state-indicator/total-number-of-medicaid-section-1915c-home-and-community-based-services-waivers/?currentTimeframe=0&sortModel=%7B%22colId%22:%22Location%22,%22sort%22:%22asc%22%7D.
Kaye, H.S., LaPlante, M.P., & Harrington, C. (2009). Do noninstitutional long-term care services reduce Medicaid spending? Health Affairs, 28(1), 262-272.
Khatutsky, G., Wiener, J.M., Greene, A.M., & Thach, N.T. (2017). Experience, knowledge, and concerns about long-term services and supports: Implications for financing reform. Journal of Aging & Social Policy, 29(1), 51-69.
Lakdawalla, D.N., & Schoeni, R. (2003). Is nursing home demand affected by the decline in age difference between spouses? Demographic Research, 8, 279-304.
Larson, S.A., Hallas-Muchow, L., Aiken, F., Taylor, B., Pettingell, S., Hewitt, A., Sowers, M., & Fay, M.L. (2016). In-Home and Residential Long-Term Supports and Services for Persons with Intellectual or Developmental Disabilities: Status and Trends through 2013. Minneapolis, MN: University of Minnesota, Research and Training Center on Community Living, Institute on Community Integration. Available at: file:///C:/Users/tthach/Downloads/RISP2013_WEB%20(3).pdf.
Medicaid and CHIP Payment and Access Commission [MACPAC]. (2016a). Medicaid Beneficiaries (Persons Served) by Eligibility Group, FYs 1975-2013. Available at: https://www.macpac.gov/wp-content/uploads/2015/01/EXHIBIT-7.-Medicaid-Beneficiaries-Persons-Served-by-Eligibility-Group-FYs-1975%E2%80%932013-thousands.pdf.
Medicaid and CHIP Payment and Access Commission [MACPAC]. (2016b). MACStats: Medicaid and CHIP Data Book. Available at: https://www.macpac.gov/wp-content/uploads/2016/12/MACStats_DataBook_Dec2016.pdf.
Medicare Payment Advisory Commission [MedPAC] and Medicaid and CHIP Payment and Access Commission [MACPAC]. (2017). Data Book: Beneficiaries Dually Eligible for Medicare and Medicaid. Washington, DC. Available at: https://www.macpac.gov/wp-content/uploads/2017/01/Jan17_MedPAC_MACPAC_DualsDataBook.pdf.
National Center for Health Statistics, Centers for Disease Control and Prevention. (2013). Summary health statistics for US adults: National Health Interview Survey, 2012: Data from the National Health Interview Survey. Vital and Health Statistics: Series 10, (259). Available at: https://www.cdc.gov/nchs/data/series/sr_10/sr10_259.pdf.
National Institute on Aging. (2016). About Alzheimer's Disease: Alzheimer's Basics. Bethesda, MD. Retrieved from https://www.nia.nih.gov/alzheimers/topics/alzheimers-basics#dementia.
Ng, T., Harrington, C., Musumeci, M., & Ubri, P. (2016). Medicaid Home and Community-Based Services Programs: 2013 Data Update. Washington, DC: Kaiser Family Foundation, Kaiser Commission on Medicaid and the Uninsured. Available at: http://kff.org/medicaid/report/medicaid-home-and-community-based-services-programs-2013-data-update/.
O'Shaughnessy, C.V. (2014). The basics: National spending for long-term services and supports (LTSS), 2012. National Health Policy Forum. Washington, DC: George Washington University.
Office of the Assistant Secretary for Planning and Evaluation [ASPE]. (2015). Federal Medical Assistance Percentages or Federal Financial Participation in State Assistance Expenditures. Washington, DC: Washington, DC: U.S. Department of Health and Human Services, Office of the Assistant Secretary for Planning and Evaluation. Available at: https://aspe.hhs.gov/federal-medical-assistance-percentages-or-federal-financial-participation-state-assistance-expenditures.
Reaves, E.L., & Musumeci, M. (2015). Medicaid and Long-Term Services and Supports: A Primer. Washington, DC: The Kaiser Family Foundation, May 8. Available at: http://kff.org/medicaid/report/medicaid-and-long-term-services-and-supports-a-primer/.
Rivlin, A.M., & Wiener, J.M. (1988). Caring for the Disabled Elderly: Who Will Pay? Washington, DC: Brookings Institution.
Rudowitz, R., Valentine, A., & Smith, V.K. (2016). Medicaid Enrollment and Spending Growth: FY 2016 and 2017. Washington, DC: Kaiser Family Foundation, Kaiser Commission on Medicaid and the Uninsured. Available at: http://kff.org/medicaid/issue-brief/medicaid-enrollment-spending-growth-fy-2016-2017/.
Snyder, L. & Rudowitz, R. (2015). Medicaid Financing: How Does It Work and What Are the Implications? Washington, DC: Kaiser Family Foundation. Available at: http://kff.org/medicaid/issue-brief/medicaid-financing-how-does-it-work-and-what-are-the-implications/.
Stewart, S.T., & Cutler, D.M. (2014). The contribution of behavior change and public health to improved U.S. population health. National Bureau of Economic Research, Working Paper No. 20631. Available at: http://www.nber.org/papers/w20631.
Thomas, K.S., & Applebaum, R. (2015). Long-term services and supports (LTSS): A growing challenge for an aging America. Public Policy & Aging Report, 25(2), 56-62.
Tompson, T., Benz, J.K., Agiesta, J., Junius, D., Nguyen, K., & Lowell, K. (2013). Long-Term Care: Perceptions, Experiences, and Attitudes Among Americans 40 or Older. Associated Press-NORC Center for Public Affairs Research. Available at: http://www.apnorc.org/PDFs/Long%20Term%20Care/AP_NORC_Long%20Term%20Care%20Perception_FINAL%20REPORT.pdf.
Truffer, C., Wolfe, C., & Rennie, K. (2015). 2015 Actuarial Report on the Financial Outlook for Medicaid. Office of the Actuary, Centers for Medicare & Medicaid Services, and the U.S. Department of Health and Human Services. Available at: https://www.medicaid.gov/medicaid/financing-and-reimbursement/downloads/medicaid-actuarial-report-2015.pdf.
Truffer, C., Wolfe, C., & Rennie, K. (2016). 2016 Actuarial Report on the Financial Outlook for Medicaid. Office of the Actuary, Centers for Medicare & Medicaid Services, and the U.S. Department of Health and Human Services. Available at: https://www.cms.gov/Research-Statistics-Data-and-Systems/Research/ActuarialStudies/Downloads/MedicaidReport2016.pdf.
United Nations. (2016). The Growing Need for Long-Term Care: Assumptions and Realities. Available at: http://www.un.org/esa/socdev/ageing/documents/un-ageing_briefing-paper_Long-term-care.pdf.
Vincent, G.K., & Velkoff, V.A. (2010). The Next Four Decades: The Older Population in the United States: 2010 to 2050 (No. 1138). U.S. Department of Commerce, Economics and Statistics Administration, Bureau of the Census.
Ward, B.W., Schiller, J.S., & Goodman, R.A. (2014). Multiple chronic conditions among U.S. adults: A 2012 update. Preventing Chronic Disease. Available at: https://www.cdc.gov/pcd/issues/2014/13_0389.htm.
Warner, K. (2013). An endgame for Tobacco? Tobacco Control, 22: i3-i5.
Watts, M., Cornachione, E., & Musumeci, M. (2016). Medicaid Financial Eligibility for Seniors and People with Disabilities in 2015. Washington, DC: Kaiser Family Foundation, Kaiser Commission on Medicaid and the Uninsured. Available at: http://kff.org/medicaid/report/medicaid-financial-eligibility-for-seniors-and-people-with-disabilities-in-2015/.
Watts, M., Musumeci, M., & Ubri, P. (2017). Medicaid Section 1115 Managed Long-Term Services and Supports Waivers: A Survey of Enrollment, Spending, and Program Policies. Washington, DC: Kaiser Family Foundation. Available at: http://kff.org/medicaid/report/medicaid-section-1115-managed-long-term-services-and-supports-waivers-a-survey-of-enrollment-spending-and-program-policies/view/footnotes/.
Wenzlow, A., Borck, R., Miller, D., Doty, P., & Drabek, J. (2013). An Investigation of Interstate Variation in Medicaid Long-Term Care Use and Expenditures Across 40 States in 2006. Washington, DC: Office of the Assistant Secretary of Planning and Evaluation & Mathematica Policy Research. Available at: https://aspe.hhs.gov/report/investigation-interstate-variation-medicaid-long-term-care-use-and-expenditures-across-40-states-2006.
West, L.A., Coe, S., Goodkind, D., & He, W. (2014). 65+ in the United States: 2010. Current Population Reports. Washington, DC: U.S. Department of Commerce, Bureau of the Census. Available at: https://www.census.gov/content/dam/Census/library/publications/2014/demo/p23-212.pdf.
Wiener, J.M., Anderson, W.L., & Brown, D. (2009). Why are Nursing Home Utilization Rates Declining? Report to the Centers for Medicare & Medicaid Services. Baltimore, MD: U.S. Department of Health and Human Services. Available at: http://www.nasuad.org/sites/nasuad/files/hcbs/files/160/7990/SCGNursing.pdf.
Wiener, J.M., Anderson, W.L., Khatutsky, G., Kaganova, Y., & O'Keeffe, J. (2013). Medicaid Spend Down: New Estimates and Implications for Long-Term Services and Supports Financing Reform. Washington, DC: RTI International. Available at: http://www.thescanfoundation.org/sites/default/files/tsf_ltc-financing_medicaid-spend-down-implications_wiener-tumlinson_3-20-13.pdf.
Wiener, J.M., Karon, S.L., McGinn-Shapiro, M., Lyda-McDonald, B., Thach, T., Justice, D., Holladay, S., Mooney, K. & Sowers, M. (2015). Descriptive Overview and Summary of Balancing Incentive Program Participating States at Baseline. Washington, DC: U.S. Department of Health and Human Services, Office of the Assistant Secretary for Planning and Evaluation. Available at: https://aspe.hhs.gov/basic-report/descriptive-overview-and-summary-balancing-incentive-program-participating-states-baseline.
Wiener, J.M., Illston, L.H., & Hanley, R.J. (1994). Sharing the Burden: Strategies for Public and Private Long-Term Care Insurance. Washington, DC: Brookings Institution.
World Bank Group. (2016). Live Long and Prosper: Aging in East Asia and Pacific. Washington, DC: World Bank. doi:10.1596/978-1-4648-0469-4. License: Creative Commons Attribution CC BY 3.0 IGO. Available at: https://openknowledge.worldbank.org/bitstream/handle/10986/23133/9781464804694.pdf.
NOTES
-
HIPAA established the level of disability needed to obtain benefits from tax-qualified long-term care insurance policies. As defined in the Section 7702 (B) of the Internal Revenue code, there are two ways to qualify for HIPAA-level disability: (1) a person cannot perform two or more ADLs for at least 90 days due to loss of functional capacity; or (2) a person has severe cognitive impairment and requires supervision to prevent threats to health and safety.
-
Payments by Medicaid beneficiaries receiving nursing home services toward their cost of care are considered out-of-pocket payment rather than Medicaid payment. Thus, these estimates understate the role of Medicaid in financing the LTSS system.
Analyses of Disability, Aging, and Long Term Care Policy and Data
This report was prepared under contract #HHSP233201600021I between the U.S. Department of Health and Human Services (HHS), Office of Disability, Aging and Long-Term Care Policy (DALTCP) and RTI International. For additional information about this subject, you can visit the DALTCP home page at http://aspe.hhs.gov/office-disability-aging-and-long-term-care-policy-daltcp or contact the ASPE Project Officer, Emily Rosenoff, at HHS/ASPE/DALTCP, Room 424E, H.H. Humphrey Building, 200 Independence Avenue, S.W., Washington, D.C. 20201; Emily.Rosenoff@hhs.gov.
Reports Available
An Overview of Long-Term Services and Supports and Medicaid: Final Report
-
HTML: https://aspe.hhs.gov/basic-report/overview-long-term-services-and-supports-and-medicaid-final-report
-
PDF: https://aspe.hhs.gov/pdf-report/overview-long-term-services-and-supports-and-medicaid-final-report
State and Local Policy Levers for Increasing Treatment and Recovery Capacity to Address the Opioid Epidemic: Final Report