
by:
Signe-Mary McKernan and Caroline Ratcliffe
The Urban Institute
Prepared for:
U.S. Department of Health and Human Services
Office of the Assistant Secretary for Planning and Evaluation
Contract # HHS-100-99-0003
Project Officers:
Laura Chadwick and Susan Hauan
Acknowledgements
The Transition Events in the Dynamics of Poverty project was funded by the Assistant Secretary for Planning and Evaluation (ASPE), U.S. Department of Health and Human Services (DHHS) under a contract to the Urban Institute. The project benefited greatly from the oversight and input of Laura Chadwick and Susan Hauan, the ASPE Project Officers. We also thank Kelleen Kaye, Julia Isaacs, and Don Oellerich from ASPE for excellent comments and advice.
At the Urban Institute, we thank Robert I. Lerman and Katherin Ross for helpful comments and advice. We also thank Neal Parikh, Stephanie Riegg, Yasmeen A. Salahuddin, Kristen Erwin, and especially Emily Rosenberg for their excellent research assistance. This report draws in part on related papers by McKernan and Ratcliffe (2001) and McKernan, Ratcliffe, and Riegg (2001). This report also benefited from comments received from Steven Haidar at the 2002 Econometric Society Meetings in Atlanta, GA.
Chapter I: Introduction
The poverty rate has fallen from over 15 percent in 1993—one of its highest levels in three decades, to 11.3 percent in 2000—its lowest level in two decades.(1) What events triggered entries into and exits from poverty during the last three decades? What role do events such as changes in household composition, employment status, and disability status play in individuals’ entries into and exits from poverty? Understanding why individuals enter and exit poverty may be useful for effective policy, yet little is known about the events associated with poverty.
Several researchers have examined the relationship between events and poverty transitions, where these “trigger events” include changes in household composition, employment status, and disability status. Surprisingly, most studies use only descriptive analyses. While informative, descriptive analyses provide limited information because individuals can experience more than one event at a time, thereby making it impossible to disentangle the relationship between one event and a poverty transition from that of other events or demographic characteristics. This study adds to our understanding of the role events play in individuals’ entries into and exits from poverty by using a multivariate framework, which disentangles the relationship between different events and poverty transitions.
This study sheds light on three questions that remain largely unanswered in the poverty literature:
- What are the dynamics behind changes in the poverty rate over time?
- What events increase individuals' likelihood of entering and exiting poverty? Do changes in household composition, labor supply, disability status, or economic status play a role? Have these events changed over time—from the late 1980s to the late 1990s? Do the events differ for short and long poverty spells?
- What is the likelihood of entering and exiting poverty given these different events?
We answer the questions posed above using two longitudinal data sets. We use yearly data from the 1975-97 panels of the Panel Study of Income Dynamics (PSID) as well as monthly data from the 1988, 1990, and 1996 panels of the Survey of Income and Program Participation (SIPP). Using both the PSID and SIPP allows us to examine: (1) poverty dynamics measured with monthly (SIPP) and yearly (PSID) reporting periods; (2) events associated with poverty spells that last only a few years and last five or more years (PSID); (3) events over two decades (PSID) and since the 1996 federal welfare reform (SIPP); and (4) the extent to which the results differ across the two data sets.
We examine poverty dynamics over time and measure transitions into and out of poverty using the official definition of poverty. Developed during the 1960s, the official definition of poverty compares families’ resources, defined as annual before-tax money income, with official poverty thresholds to determine whether or not a family is poor. Thresholds are based on expenditures for minimally acceptable amounts of food times a multiplier for all other expenses. While there are shortcomings associated with the official poverty measure, it is the most commonly used measure of poverty in transitions research and offers an easily implemented, straightforward method for measuring the economic status of individuals.(2)
In brief, we find that poverty entries and exits have changed over the past two decades, with the mid 1990s seeing an increase in both entries into poverty and exits from poverty. Descriptive analyses of poverty entries and exits show that shifts in household structure (i.e., transitions from a two-adult to a female-headed household and vice versa) are relatively rare events in the population, but individuals who experience these events are the most likely to transition into or out of poverty. While individuals who experience employment shifts are somewhat less likely to experience a poverty transition (than those with a household structure shift), shifts in employment are more common events in the population at large, and so are associated with a larger share of transitions into and out of poverty. Controlling for demographic and economic factors in the multivariate analyses, we find the likelihood of entering or exiting poverty to be highest for persons living in households with employment changes, followed by persons living in households with a shift in headship.
This report is organized as follows. In Section II we review prior poverty transitions research and discuss our contribution to the literature. In this literature review section we describe the theories and findings from studies of poverty transitions. In Section III we present a conceptual model of poverty. This model draws on the human capital and other existing theories presented in Section II and provides the basis for the specification of the empirical model. Section IV lays out the empirical methods, including both the count method and the multivariate hazard models, which are used to analyze events that trigger individuals' entries into and exits from poverty. This section also describes the specific events included in the analysis. Section V presents a discussion of the two data sets used in this study—the Panel Study of Income Dynamics (PSID) and the Survey of Income and Program Participation (SIPP). The results are discussed in Section VI. We first describe the dynamics behind changes in the poverty rate over time, and then describe the events related to poverty entries and exits. Section VII concludes.
1. Individual poverty rates from the U.S. Census Bureau (2000).
2. For a discussion of potential weaknesses of the official definition and measure see McKernan, Ratcliffe, and Riegg (2001) or Citro and Michael (1995).
Chapter II: Literature Review
A review of the poverty transitions literature finds two broad questions that have been examined: (1) What are the probabilities associated with entries into, exits from, and reentries into poverty? and (2) What are the events associated with entries into and exits from poverty? (Table 1). The first question has been addressed by numerous studies, most thoroughly in a recent study by Stevens (1999). The second question has not been fully addressed in the literature and is the focus of this study. Below we review the theories and findings from the poverty transitions literature, focusing especially on results pertaining to events associated with poverty entries and exits.(3) As the poverty literature is large, we narrowly focus on the U.S. poverty transitions literature and do not review related literatures such as those on poverty transitions in developing countries, poverty duration, or transition events in the dynamics of such programs as welfare, food stamps, and foster care.
| Study | Data | Years | Primary Sample Studied | Research Question(s) Addressed |
|---|---|---|---|---|
| Bane and Ellwood 1986 | PSID | 1970-1982 | Persons Under Age 65 | Exits, Events |
| Blank 1997 | PSID | 1979-1991 | Total U.S. | Events |
| Duncan and Rodgers 1988 | PSID | 1968-1982 | Children | Events |
| Eller 1996 | SIPP | Oct. 1991 - Apr. 1994 | Total U.S. | Exits, Events |
| Gottschalk and Danziger 1993 | CPS | 1968, 1986 | Children | Events |
| Iceland 1997b | PSID | 1970-1985 | Adults Ages 18-64 in Metropolitan Areas | Exits, Events |
| Naifeh 1998 | SIPP | Oct. 1992 - Dec. 1995 | Total U.S. | Entries, Exits |
| Rank and Hirschl 1999a | PSID | 1968-1992 | Adults Ages 60-90 | Entries |
| Rank and Hirschl 1999b | PSID | 1968-1992 | Adults Ages 20-85 | Entries |
| Ruggles 1990 | CPS, SIPP | 1984 | Total U.S. | Entries |
| Ruggles and Williams 1987 | SIPP | 1983-1984 | Total U.S. | Entries |
| Stevens 1994 | PSID | 1970-1987 | Total U.S. | Exits, Reentries |
| Stevens 1999 | PSID | 1967-1988 | Total U.S. | Exits, Reentries |
| Zick and Smith 1991 | PSID | 1970-1984 | Widows and Widowers | Events |
| Zick and Holden 2000 | SIPP | Feb. 1990 - Apr. 1995 | Widows Ages 40+ | Events |
II.1. Theories Used to Explain Poverty
What theory is appropriate for analyzing poverty dynamics? Sawhill (1988) concludes in her survey of the poverty persistence literature that the literature lacks “a widely accepted theory of income distribution that might help one choose between competing model specifications and their varying results” (p. 1112). She finds that “few researchers have approached the task of analyzing the effects of different variables on the poverty rate in the context of a coherent overall model of the process by which income is generated” and that “we are swamped with facts about people’s incomes and about the number and composition of people who inhabit the lower tail, but we don’t know very much about the process that generates these results” (p. 1085).
This review of the literature indicates this is still the case. The literature provides many poverty statistics and some empirical results, but little theory to explain them.(4) Perhaps this is because a theory of poverty is complex to model. As Duncan (1984) notes, a complete explanation of why people are poor would require many interrelated theories—theories of family composition, earnings, asset accumulation, and transfer programs, to name a few.(5) Further complicating the task, a complete poverty theory would need to be based upon the family, while most theories are based upon individuals (Duncan, p. 46). If there is not a complete theory of poverty, are there theories that can be used to explain some aspects of poverty?
Most theories used to explain poverty focus on able-bodied, non-elderly adults, whose potential for escaping poverty rests on their ability to work enough hours at a sufficiently high wage rate. Many theories of poverty, as a result, become theories of labor supply and wage rates (Duncan 1984, p. 46). Human capital theory is one example. Among other strengths, human capital theory has much empirical support and so is the primary focus of this review. This review presents a brief description of human capital theory and other relevant theories, including the permanent income hypothesis, culture of poverty theory, and dual labor market theory.
Human Capital Theory
Human capital theory is a theory of earnings, one of the major determinants of poverty. First developed by Becker and Mincer, this theory explains both individuals’ decisions to invest in human capital (education and training) and the pattern of individuals' lifetime earnings. Individuals’ different levels of investment in education and training are explained in terms of their expected returns from the investment. Investments in education and training entail costs both in the form of direct expenses (e.g., tuition) and foregone earnings during the investment period, so only those individuals who will be compensated by sufficiently higher lifetime earnings will choose to invest. People who expect to work less in the labor market and have fewer labor market opportunities, such as women or minorities, are less likely to invest in human capital. As a result, these women and minorities may have lower earnings and may be more likely to be in poverty.
Human capital theory also explains the pattern of individuals' lifetime earnings. In general, the pattern of individuals’ earnings are such that they start out low (when the individual is young) and increase with age (Becker 1975, p. 43), although earnings tend to fall somewhat as individuals near retirement. The human capital theory states that earnings start out low when people are young because younger people are more likely to invest in human capital and will have to forego earnings as they invest. Younger people are more likely to invest in human capital than older people because they have a longer remaining work life to benefit from their investment and their foregone wages—and so costs of investing are lower. Earnings then increase rapidly with age as new skills are acquired. Finally, as workers grow older, the pace of human capital investment and thus productivity slows, leading to slower earnings growth. At the end of a person’s working life, skills may have depreciated, as a result of lack of continuous human capital investment and the aging process. This depreciation contributes to the downturn in average earnings near retirement age (Ehrenberg and Smith 1991).
To the extent that poverty follows earnings, we might predict a similar relationship between age and poverty, with poverty more likely for the young and elderly. Consistent with this prediction, Bane and Ellwood (1986) find that a sizable portion of all poverty spells begin when a young man or woman moves out of a parent’s home—an event often associated with getting further education or training—and that these poverty spells are relatively short with an average duration of less than three years (p. 16-17). Also, our literature review indicates that persons age 65 and over are especially vulnerable to poverty because once they enter, they are less likely to exit.
While much empirical work tends to support the human capital theory,(6) it is a theory of human capital investment and labor market earnings, not poverty. As discussed below, earnings are only one of the main determinants of poverty. Non-earnings income and family composition are other important determinants that human capital theory does not shed light on. Thus human capital theory cannot be considered a complete theory of poverty. Are there other theories that shed light on these other aspects of poverty?
Permanent Income and Life-Cycle Hypotheses
The permanent income and life-cycle hypotheses—associated primarily with Nobel prize winners Modigliani and Friedman—highlight the important role of unearned income and future earned income, as well as current income (Dornbusch and Fischer 1990). An advantage of the permanent income and life-cycle hypotheses, over the human capital theory, is that they incorporate both earned and unearned income. The foundation of the theories is that people have a permanent income stream (from current and future earnings and assets), but that their income can have short-term (transitory) deviations from the permanent stream. Lillard and Willis (1978) propose the components-of-variance method as a link between poverty data and the life cycle framework of these hypotheses. Several researchers use this method to try and measure the permanent and transitory components of income and poverty (Lillard and Willis; Duncan and Rodgers 1991; Stevens 1999). However, the theory is difficult to adapt to poverty (Bane and Ellwood 1986) and results from the empirical model do not reproduce observed patterns of poverty persistence as well as other methods (Stevens 1999). In addition, the permanent income hypothesis does not allow for an individual’s income stream to change if, for example, they become disabled. This is a serious drawback for analyzing poverty transitions where one of the primary aims is to analyze the effect of events—such as a change in disability or marital status—on poverty.
Other Theories
Still other theories highlight the role that character and opportunity play in poverty. Schiller (1976) groups theories focusing on able-bodied, nonelderly adults into categories of “flawed character” and “restricted opportunity.” The flawed character theories assume that the poor have ample opportunities for improving their economic status, but lack the initiative and diligence necessary to take advantage of them (Duncan 1984). Oscar Lewis’ “culture of poverty” theory (1968) is an example of a flawed character theory. This theory maintains that a culture of poverty forms among a significant minority of the poor such that people are not psychologically geared to take advantage of opportunities that may come their way (Duncan 1984).(7) Using the PSID to examine the earnings of prime-aged white men Duncan confirms the findings of earlier studies and finds no support for the culture of poverty theory: “educational attainment is relatively powerful in distinguishing individuals with different levels of earnings, while attitudes and a simple measure of cognitive ability are not” (p. 123).
The restricted opportunity theories contend that the poor lack sufficient access to economic opportunities and cannot avoid poverty unless their economic opportunities improve (Duncan 1984). The dual labor market theory is an example. In this theory the labor market is split into two sectors with little mobility between them—the primary sector offering steady employment, higher wages, and better promotion opportunities, and the secondary sector with low wages, poor working conditions, and few promotion opportunities.(8) Using the PSID, Duncan (1984) finds little support for the dual labor market theory: “The fact that very few male workers appear to be locked into a given economic position, coupled with the movement found from ‘bad’ jobs to ‘good’ ones, contradicts rigid theories of dual labor markets” (p. 124). With these theories in mind, we now turn to findings in the poverty transitions literature.
II.2. Findings from the Literature
What do we know about the probabilities and events associated with changes in poverty over the last three decades? This section presents results from the various poverty studies discussed above. Turning back to the two questions addressed in this review of the poverty transitions literature, we present some answers to the following: (1) What are the probabilities associated with entries into, exits from, and reentries into poverty? and (2) What are the events associated with entries into and exit from poverty?
1. Probabilities Associated with Entries into, Exits from, and Reentries into Poverty
Poverty Entries
The literature examining entry rates into poverty is somewhat limited, particularly as compared to studies that examine exits from poverty. Nonetheless, several studies have examined entries into poverty. The rate of entry into poverty for the total U.S. population during the early 1990s has been estimated at roughly three percent per year. Using SIPP data, Eller’s (1996) analysis suggests that 3.0 percent of all people entered poverty in 1993 (p. 5). Naifeh (1998), also using SIPP data, finds a very similar entry rate of 3.2 percent during the 1993-94 period (p. 6).(9) Both researchers find that blacks, Hispanics, female-headed families, and children are the groups most likely to enter poverty.
Researchers also use PSID data to study poverty entry. Rank and Hirschl (1999a and 1999b) use the PSID to estimate the proportion of the population that will have experienced poverty by a particular age, rather than estimating entry rates for a particular year. Using a life table based approach, they find that 27.1 percent of adults will have experienced poverty by age 30, 41.8 percent will have experienced poverty by age 50, and 51.4 percent will have experienced poverty by age 65 (Rank and Hirschl 1999b, p. 206). Consistent with the findings of Eller (1996) and Naifeh (1998), Rank and Hirschl find that blacks are more likely to experience poverty than whites.
Poverty Exits
PSID. Some of the key papers in the literature examine exits from poverty. Bane and Ellwood (1986), Stevens (1994), and Stevens (1999) examine poverty exit rates using the PSID, while papers by Eller (1996) and Naifeh (1998) examine exit rates using the SIPP. The three PSID studies produce similar results. In general, the results suggest that the longer a person has been poor, the less likely it is that he or she will escape poverty. Using the 1970-82 waves of the PSID, Bane and Ellwood find that the probability of exiting a poverty spell starts at 0.45 for one-year spells, falls to 0.29 for two-year spells, and falls further to 0.21 for four-year spells. Using an additional six waves of the PSID, Stevens replicates Bane and Ellwood's results. Stevens also reestimates the exit probabilities on data that are not smoothed to eliminate some one-year spells, a procedure used by Bane and Ellwood,(10) and obtains slightly higher exit probabilities: 0.53 for one-year spells, 0.36 for two-year spells, and 0.23 for four-years spells.
SIPP. The SIPP data examined in the literature contain a maximum of 44 months of information, so the exit probabilities estimated by Eller (1996) and Naifeh (1998) based on SIPP data are not directly comparable to those based on PSID data. Using the 1991 and 1992 SIPP panels, Eller calculates the proportion of persons who were poor in 1992, but no longer poor in 1993. Unlike Bane and Ellwood (1986) and Stevens (1994, 1999), persons defined as poor in 1992 have various poverty spell lengths. Eller finds 21.6 percent of persons exited poverty between 1992 and 1993. This estimate is similar to that found by Naifeh, who calculates an exit rate of 23.8 during 1993-94 using the 1993 SIPP panel.
Sub-groups. Poverty exit rates have been found to be quite different across population sub-groups. Analyses carried out separately by race show that poverty exit rates are higher for whites than for blacks (Eller 1996, Naifeh 1998, Stevens 1999). Stevens (1994) examines whether the growth rate in real GDP differentially affects whites’ and blacks’ probability of exiting poverty, and finds that GDP growth has a smaller impact on the probability of escaping poverty for blacks than for whites. In other words, a strong economy reduces poverty among whites to a greater degree than it reduces poverty among blacks. Persons age 65 and over and persons living in central cities also have lower exit rates from poverty (Naifeh), while persons with greater education levels have higher exit rates (Iceland 1997b, Stevens 1999). Several studies have also examined exits from poverty by type of household head, such as female-headed or married-couple household, and in general find that households headed by females are disproportionately less likely to exit poverty (Eller, Naifeh, Stevens 1994).(11)
Over Time. Stevens (1994) also examines how exits from poverty changed over the period from 1970 to 1987. She finds that during this period, households headed by females experienced decreases in mobility from poverty, while households headed by males experienced no significant change in mobility from poverty. These differences across gender occur for households headed by both whites and blacks. Stevens investigates whether the decreased mobility for female-headed households can be explained by changes in the characteristics of these households or by differences in the events leading into our out of poverty, but finds no solid evidence of either.
Poverty Reentry
Once an individual exits poverty, are they likely to reenter? Stevens (1994, 1999) examines reentries into poverty and finds relatively high reentry rates. She finds that the probability of entering a poverty spell is 0.27 after being out of poverty one year, 0.16 after being out of poverty for two years, and 0.08 after being out five years. With these reentry rates, she calculates that more than one-half of those who previously escaped poverty will return to poverty within five years (Stevens 1994, p.36). For the subset of persons who were poor for at least five years before exiting, more than two-thirds will return to poverty within five years (Stevens 1994, p.37). Consistent with findings on entry and exit rates by race, Stevens (1999) finds that blacks have a higher reentry rate than whites. Households headed by females and by individuals with less than a high school education are also more likely to reenter poverty. Examining trends in reentry rates, Stevens (1994) finds that the tendency to experience repeated poverty spells has increased between 1970 and 1987 for people living in households headed by white females.
2. Events Associated with Entries into and Exits from Poverty
Poverty Entries
Descriptive analyses by Bane and Ellwood (1986), Ruggles and Williams (1987), and Blank (1997), who study all individuals, and Duncan and Rodgers (1988), who study children, find similar results concerning events associated with transitions into poverty. These analyses find that changes in labor supply and earnings are more commonly associated with poverty entries than changes in household structure and composition. Ruggles and Williams find that of the people who enter poverty, 40 percent live in a household that experienced a job loss by the head, spouse, or other household member (p. 13). Bane and Ellwood find that almost half (49.3 percent) of poverty spells begin when the household experiences a decline in earnings: 37.9 percent of poverty entries coincide with a fall in heads' earnings and 11.4 percent of entries coincide with a fall in wives’ or other family members’ earnings (pp. 14-15). Blank also finds that a large share of poverty entries (42.8 percent) occur with a fall in heads’ earnings (p. 26). Other events experienced by persons who enter poverty include transitions to female headship, young adults set up their own household, and child born into household (Bane and Ellwood and Blank). Bane and Ellwood, for example, find that the percentage of poverty spells that begin with these events are 11.1 percent, 14.7 percent, and 8.6 percent, respectively (p.13-14). Contrary to the results for all individuals, shifting to a female-headed household is more often associated with poverty entry than changes in earnings for the sub-population of female-headed households with children (Bane and Ellwood p. 13-14).
Duncan and Rodgers (1988) find that the labor supply of individuals in the household other than the mother or father is the event that coincides most with children's transitions into poverty. Fewer work hours of the male head, as well as unemployment of the male head, also coincides with poverty entries of children. Shifting into a single-parent family and having a head who becomes disabled are somewhat less important than these labor supply measures.
Poverty Exits
Similar to events associated with poverty entry, descriptive analyses using both the SIPP and PSID find that changes in labor supply and earnings are more commonly associated with poverty exits than changes in household structure and composition. Using the SIPP, Ruggles and Williams (1987) find that almost 47 percent of those leaving poverty had a family member gain a job, while the various household structure changes (including marriage) were experienced by less than one percent of those households leaving poverty. Using the PSID, Bane and Ellwood (1986) find that nearly three-quarters (73.2 percent) of poverty spells end with a rise in earnings: 50.2 percent with a rise in the head's earnings and 23.0 percent with a rise in a wife’s or other household members’ earnings. Transitions from a female-headed household to a male-headed household were experienced by 10.1 percent of individuals who exited poverty (p. 19). Examining female-headed households separately from male-headed households, Bane and Ellwood show that changes in household structure are quite important for this subset of the population, though not more important than earnings. For example, they find that 26.4 percent of female-headed households with children exit poverty when they shift to a male-headed household and 51.4 percent exit because head or others’ earnings rose (p. 19).
Again, Duncan and Rodgers (1988) find that children's transitions out of poverty most often coincide with changes in labor supply. Moving from a one-parent to a two-parent family is also associated with transitions out of poverty, although gaining a parent is more important for transitions out of poverty for blacks than nonblacks (Duncan and Rodgers). Iceland (1997b) uses a multivariate framework to examine “the effect of four structural characteristics on individual poverty exits: (1) economic restructuring, (2) skills mismatches, (3) racial residential segregation, and (4) welfare benefit levels. Results show that these factors play a role in explaining African-Americans’ economic disadvantages, but they have a weaker and often contrary impact on whites’ poverty exit” (p. 429).
Summary of Literature Review Findings
Results from the literature can be summarized into the following key findings:
Probabilities Associated with Entries into, Exits from, and Reentries into Poverty
- Analyses with SIPP data from the early 1990s find that the poverty entry rate for the total U.S. population was about three percent per year and poverty exit rate for the total U.S. population was about 23 percent per year.
- About one-half of adults will experience poverty by age 65.
- The longer a person has been poor, the less likely it is that he or she will escape poverty.
- Poverty reentry rates are relatively high. More than one-half of those who escaped poverty will return to poverty within five years.
- Blacks, Hispanics, female-headed families, persons with low levels of education, and children are vulnerable to poverty.
Events Associated with Entries into and Exits from Poverty
- Changes in labor supply and/or earnings are identified as the major events associated with transitions into and transitions out of poverty.
- Female headship is also related to transitions into and out of poverty. Roughly one-quarter of female-headed households exit poverty because of a shift to a male-headed household.
- Black children are more likely than white children to enter poverty when the household shifts from two-adult headed to female-headed.
II.3. Contributions to the Literature
This study sheds light on three questions that remain largely unanswered in the poverty literature:
- What are the dynamics behind changes in the poverty rate over time?
- What events increase individuals' likelihood of entering and exiting poverty? Have these events changed over time? Do the events differ for short and long poverty spells?
- What is the likelihood of entering and exiting poverty given these different events?
These questions and our contribution to the literature are discussed below.
What are the dynamics behind changes in the poverty rate over time?
The poverty rate is a static statistic that measures the percentage of the population living below the poverty line during some fixed time interval, usually a year. While the poverty rate in a particular year provides information about the prevalence of poverty, what we learn from the poverty rate is limited. In particular, it does not provide information on the dynamics of poverty (i.e., transitions into and out of poverty). The numerous studies on poverty dynamics do not tie dynamics to changes in the overall poverty rate. Our analysis decomposes the poverty rate providing a better understanding of changes in the poverty rate over time. This analysis allows us to answer questions such as “In periods where poverty rates remained high, was it because the number of entries and exits were high or low?”
What are the events that increase individuals' likelihood of entering and exiting poverty?
While several studies examine the relationship between events and poverty transitions, most use only descriptive analyses (Bane and Ellwood 1986, Blank 1997, Duncan 1984, Duncan and Rodgers 1988, Ruggles and Williams 1987). Descriptive analyses examining this relationship are somewhat problematic because this approach does not identify the relative importance of the different events in individuals' transitions. We add to the literature by using a multivariate framework to examine how events such as changes in marital status, disability status, and employment status affect poverty entries and exits. This multivariate approach allows us to disentangle the relationship between one event and poverty transition from that of other events or demographic characteristics. We further add to the literature by examining whether the events that trigger poverty entries and exits have changed over time and whether these events differ for long versus short spells of poverty.
What is the likelihood of exiting and reentering poverty given these different events?
Our framework for examining what events increase individuals' likelihood of entering and exiting poverty (question 2) allows us to easily calculate how the probability (i.e., the likelihood) of entering and exiting poverty is affected by different events. We also examine how the probabilities have changed over time and the extent to which they differ for long and short spells of poverty.
Endnotes
3. For a more thorough review of the poverty literature that includes a discussion of poverty measures, data, and methods, see McKernan, Ratcliffe, and Riegg (2001).
4. Lillard and Willis (1978), Duncan (1984), and to some extent Iceland (1997b) are exceptions.
5. Under the broad view of poverty set forth in the World Bank’s (2001) recent World Development Report “Attacking Poverty,” additional theories, such as theories of empowerment and social capital, would also be required. The World Development Report groups the causes of poverty into three main categories: (1) “lack of income and assets to attain basic necessities;” (2) “sense of voicelessness and powerlessness in the institutions of state and society;” and (3) “vulnerability to adverse shocks, linked to inability to cope with them” (p. 34), but does not provide a theory of poverty.
6. Willis (1986), in his survey of human capital earnings functions, concludes the theory has been “repeatedly confirmed with data from around the world” (p. 598). Also, using the PSID, Duncan (1984) finds “a fair amount of evidence supporting the human capital model” (p. 124).
7. Poverty for this significant minority will be persistent because the culture of poverty is passed from generation to generation.
8. Doeringer and Piore 1971, as cited in Duncan 1984.
9. Entry and exit rates were calculated only for those with no change in family status over the period. Five percent of the sample were excluded from the calculations because of changes in family status.
10. Bane and Ellwood eliminate one-year spells in which income fell by less than one-half of the poverty threshold.
11. While Stevens examines households, Eller and Naifeh focus on families.
Chapter III: Conceptual Framework
III.1. A Simple Model of Poverty
Our conceptual model, which draws on human capital and other existing theories, motivates the variables included in our empirical model. Our model is based on the utility maximization framework where individuals choose the outcomes that are best for themselves and their families. Individuals choose, for example, how many goods to consume and how many children to have. In this model, individuals' choices are constrained by the resources available to them, such as their income. We briefly present the main features of the model, as they provide information about the factors that affect individuals' poverty statuses.
Choose Outcomes to Maximize Family Utility: In this model, a family’s level of well-being (i.e., utility) is based on several factors: (1) the amount of market purchased goods they jointly consume; (2) the number of children they have; (3) the amount of time spent on leisure (both the male and female); (4) the quality of their home life; and (4) preferences. Family members choose the outcomes that maximize their family's well-being, but these choices are constrained. Individuals face two constraints—a constraint on their time and a constraint on the amount of market goods they can purchase. Examining these constraints provides information about the trade-offs that individuals face when making decisions, for example about work versus leisure, which in turn have an impact on their poverty status.
Time Constraint: An individual’s time is constrained such that the amount of time spent (1) working in the wage labor market, (2) working on home production (where home production includes time caring for children, preparing meals, or other activities geared toward improving the quality of children and home life), and (3) leisure cannot exceed the amount of time available, where this maximum amount of time can be thought of as the number of hours in a week, month, or year. Each person in the family faces this constraint. This constraint tells us that a reduction in time spent working in the wage labor market does not necessarily imply an increase in the amount of leisure time. The trade-off may be between working in the wage labor market and working on home production. This trade-off may be particularly important for single-parent families as there is only one adult to perform these two work activities. The time constraint suggests that a family’s number of children and age of those children may affect hours worked, since the need for home production is higher both with more and younger children.
Consumption Constraint: What families consume in goods is restricted by family income. Family income is made up of both earned and unearned income. Unearned (or non-labor) income is comprised of government transfers, private transfers (e.g., money received from family members), and asset income. Family earned income is simply the product of hours spent in the wage labor market and the wages individuals in the family command.
Determinants of Poverty
This discussion of individuals' choices and the constraints that they face (i.e., our utility maximization framework) provides information on the factors that directly affect families' poverty statuses. They are:
- family earned income,
- family unearned income, and
- family size.
These components are discussed in turn below.
1. Determinants of Family Earned Income
Family earned income is directly determined by the total number of hours family members worked in the wage labor market and the wage rate.
Determinants of hours worked in wage labor market: Total family hours worked in the wage labor are determined by:
- wages,
- unearned income,
- number of adults in the family,
- number of children in the family,
- age of the children and adults in the family,
- family members’ health or disability status,
- state of the economy, and
- family preferences.
Higher wages have two offsetting effects on hours worked. On the one hand, higher wages increase hours because the cost of leisure and home production increases.(12) On the other hand, higher wages decrease hours worked because individuals do not need to work as many hours to reach a particular level of income.(13) Higher unearned income has only one effect and is expected to lower family hours spent in the wage labor market.(14) Additional unearned income means family members can spend less time in the wage labor market and consume the same amount of goods. Additional adults in the family should increase family hours spent in the wage labor market by providing another potential wage earner and additional help with home production. The number of children in the family is expected to reduce hours spent in the wage labor market, due to the need for additional time spent caring for the child. This is particularly true for families with young children.
Human capital theory suggests that family labor should also vary with age. As described above, young adults are more likely to invest in human capital and so spend less time in the wage labor market, working-age adults will spend more hours as they reap the benefits of their investments, and adults nearing retirement age will spend fewer hours. Family members’ health status will affect hours worked if a family member misses work due to illness or is unable to work due to a disability. The economy captures demand side effects of the labor market, such as whether part-time, full-time, or over-time jobs are available. Family preferences such as taste for work, taste for government transfers (as it affects unearned income), and the value put on home production will also affect the amount of time family members spend in the wage labor market.
Determinants of wages: The wage rate is another important determinant of family earned income. The wage available to individuals in a family will depend primarily on their:
- human capital (education level and on-the-job training level),
- age,
- gender,
- race,
- state of the economy, and
- government policies.
Human capital theory predicts that individuals with higher levels of education and training will have higher wages. It also predicts wages will be affected by age, where young and older individuals are expected to have lower wage rates. Gender may affect wage rates to the extent that women have taken time out of the labor market to rear children and there is discrimination in the labor market. Similarly, we may see differences in wage rates by race to the extent that our measure of educational attainment does not capture the level of human capital (since school quality differs substantially across the country and minorities are more likely than non-minorities to attend low quality schools) and to the extent that discrimination exists in the labor market. The economy will affect wage rates—a strong economy and high demand for workers will result in higher wages. Finally, government policy such as the minimum wage may also affect wages.
As an individual’s earnings are simply the product of his/her labor market hours and wage, and family earned income is the sum of all individual earnings within a family, the determinants of a family’s earnings will be all the determinants of family wage labor hours and family members’ wages.
2. Determinants of Family Unearned Income
Family unearned income is the sum of government transfers, private transfers, and asset income. The amount of government and private transfers a family receives is in part a function of individuals’ preferences. All else equal, families with little taste for receiving transfers will have less unearned income from either government or private transfers than their counterparts who have more of a taste for transfers. The economy may also play a role in altering family unearned income as returns on investments will affect asset income.
With both the determinants of earned income and unearned income in hand, we have identified the determinants of family income. We now turn our attention to family size, the final component of poverty.
3. Determinants of Family Size
Family size is an important determinant of whether a family or individual is in poverty because the official poverty measure incorporates family size. Family size depends on:
- family income,
- cost of children,
- wages,
- government transfers, and
- preferences.
Becker’s (1991) theory of the demand for children predicts that the number of children in a family will depend on family income and the costs of children. Income plays a role in determining family size because families with higher incomes are more able to afford additional children. In terms of the cost of children, direct costs associated with having children include, among others, food, clothing, and health-care expenses. In addition to these direct costs there is also the relative cost. The relative cost of having a child is affected by the opportunity cost of child rearing as measured by the female wage, to a lesser extent the male wage, and government transfers. Government transfers may affect the number of children and adults in a family by altering the relative cost of having a child and creating incentives or disincentives to marry. Finally, individual preferences will affect family size.
Putting It All Together—the Underlying Determinants of Poverty
Combining the determinants of family income and family size, we arrive at the determinants of poverty. Whether a family is in poverty is determined by:
- health or disability status of family members,
- age of adults,
- race/ethnicity of adults,
- human capital (education and on-the-job training level) of working age adults,
- gender of adults,
- number of adults,
- number of children,
- age of the children,
- cost of children,
- government policies,
- state of the economy, and
- family preferences.
Note that some of these factors, such as the number of children, are determined by the family, while others, such as the state of the economy, are not. These variables will be included in the empirical model that examines the relationship between family poverty status, family characteristics, and the events that families experience. We now turn to examine the events that may affect families' poverty status.
Events Hypothesized to Affect Poverty
The conceptual model identifies the types of events that might be associated with entries into and exits from poverty:
- Changes in family composition
- the birth of a child—through its negative effect on wage labor hours and its effect on family size,
- a change in marital status—through its effect on wage labor hours,
- a young adult sets up her/his own family—through the effect of age and family composition on wage labor hours and wages;
- Change in employment status—through its effect on earnings;
- Changes in disability or health status—through their effect on wages or wage labor hours;
- Changes in educational attainment—through their effect on the wage;
- Changes in government policies—through their effect on earned income, unearned income, and family size; and
- Changes in economic status—through their effect on the hours family members can choose to work (e.g., job loss) and wages
III.2. Poverty Rate
The poverty rate measures the percentage of the population living below the poverty line during some fixed time interval, usually a year. While the poverty rate itself is a static measure, much can be learned by decomposing the poverty rate to look at the dynamics behind its year to year changes. Equation 1 below provides such a poverty rate decomposition:
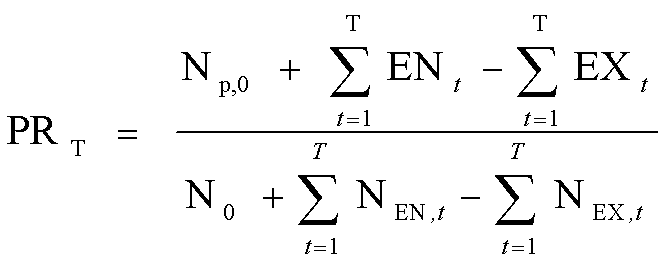 . [1]
. [1]
The numerator of the decomposed poverty rate breaks down the number of people living in poverty at the time of interest, T. It says the number of people in poverty at time T is the number of people who were in poverty at some initial time (Np,0), plus the number of people who have entered poverty since the initial time period, minus the number of people who have exited poverty since the initial time period. The denominator breaks down the number of people in the population at the time of interest, T, in a similar manner. It says the number of people in the population at time T is the number of people who were in the population at some initial time (N0), plus the number of people who have entered the population (through births or immigration) since the initial time period, minus the number of people who have exited the population (through deaths or emigration) since the initial time period.
The decomposed poverty rate highlights the variables responsible for changes in the poverty rate: the number of people who enter and exit poverty and the number of people who enter and exit the population. It will be used to help us answer one of our primary research questions: What are the dynamics behind changes in the poverty rate over time? We now turn to the empirical model.
Endnotes
12. Economists refer to this as a "substitution effect."
13. Economists refer to this as an "income effect."
14. This is an income effect.
Chapter IV: Empirical Methods
This section describes the methods used to analyze our three research questions: (1) What are the dynamics behind changes in the poverty rate over time? (2) What events increase individuals' likelihood of entering and exiting poverty? and (3) What is the likelihood of entering and exiting poverty given these different events? We answer the first research question using the count method and answer the second and third research questions using the multivariate hazard method. While some researchers have used the count method to examine the relationship between events and transitions, using this descriptive approach is problematic because individuals can experience more than one event at a time, thereby making it impossible to identify the relative importance of the different events in the individuals' transitions.
IV.1. Count Method
The count method is used to examine both the absolute number of individuals entering and exiting poverty, as well as the probability of entering and exiting poverty at a point in time. The number of people entering and exiting poverty is obtained by calculating changes in individuals’ poverty statuses across two years. The number of people who enter poverty in year t is defined as the number of persons not poor last year, at t-1, who are poor this year, at t. Similarly, the number of people who exit poverty in year t is defined as the number of persons poor last year, at t-1, who are not poor this year, at t. For our notation, let ENt represent the number of individuals who enter poverty in year t and EXt represent the number of persons who exit poverty in year t. Equation 1 (presented in the previous section) shows that these are two of the components needed to decompose the poverty rate.
Looking at entries and exits in the context of the poverty rate equation (Equation 1) provides answers to one of the primary questions: What are the dynamics behind changes in the poverty rate over time? This descriptive analysis provides information about the relative importance of poverty entries and poverty exits in defining the overall poverty rate. For example, we can examine whether poverty rates remained high in some years because the number of entries and exits were low or because both entries and exits were high. A simple table, like the one shown below, is used to identify whether there are any patterns in poverty entry and/or poverty exits between the mid-1970s and mid-1990s.
| Year | Number Poor | Number Enter Poverty | Number Exit Poverty | Net Change in Number Poor | Population | Poverty Rate |
|---|---|---|---|---|---|---|
| 1974 | NP,74 | |||||
| 1975 | NP,75 | EN75 | EX75 | EN75 – EX75 | N75 | 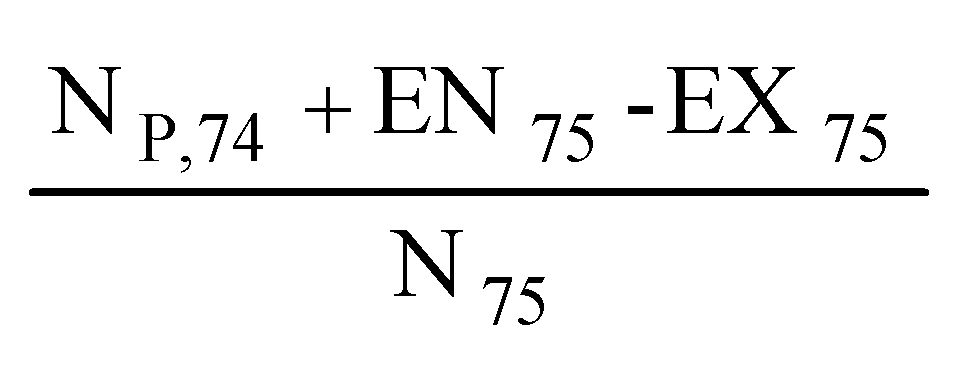 |
| 1976 | NP,76 | EN76 | EX76 | EN76 – EX76 | N76 | 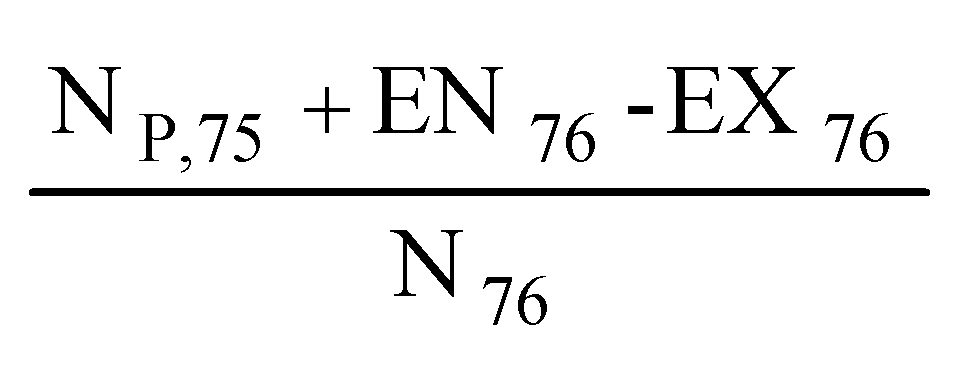 |
| 1977 | NP,77 | EN77 | EX77 | EN77 – EX77 | N77 | 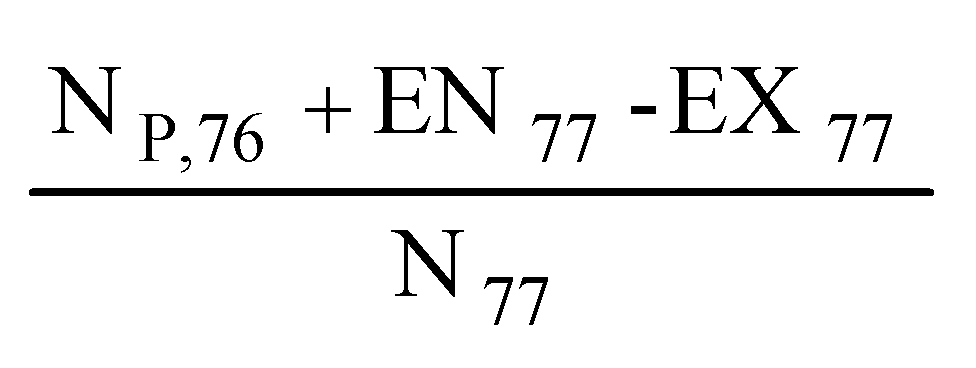 |
| 1978 | NP,78 | EN78 | EX78 | EN78 – EX78 | N78 | 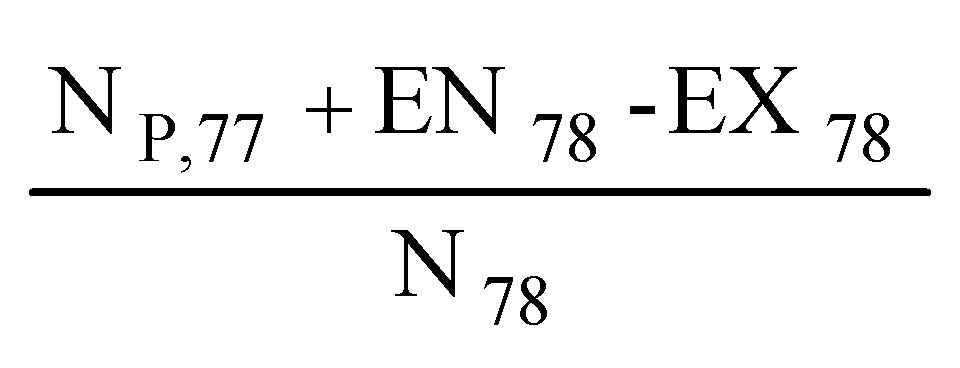 |
The number of entries and exits are used to calculate the probability of entering or exiting poverty at a point in time. The probability of entering poverty is defined as the ratio of the number of people who enter poverty in year t (ENt) and the number of people not poor in year t-1 (Nnp,t-1), or
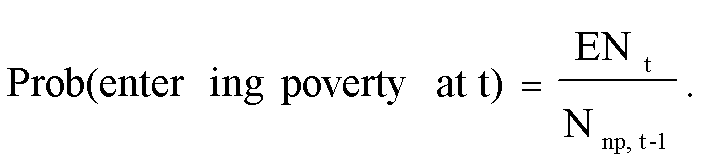 [2]
[2]
Similarly, the probability of exiting poverty is defined as the ratio of the number of people who exit poverty in year t (EXt) and the number of people poor in year t-1 (Np,t-1), or
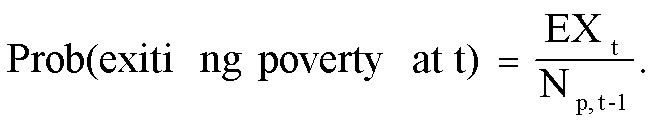 [3]
[3]
Note that the sum of Nnp,t-1 and Np,t-1 is the total population in year t-1.
The definitions above highlight, for example, that for an individual to enter poverty in year t, that individual cannot be poor in year t-1. While this appears obvious, it is very important to keep in mind when examining poverty entry and exit rates. The percentage of individuals entering poverty is calculated from the population of individuals not poor, which is the majority of the U.S. population, while the percentage of individuals exiting poverty is calculated from the population of individuals who are poor, which is small fraction of the U.S. population. So, even if the same number of individuals enter and exit poverty in a year, the poverty entry rate will be substantially lower than the poverty exit rate. Eller (1996), for example, finds a 3.0 percent poverty entry rate in 1993 and a 21.6 poverty exit rate in 1993. These percentages provide no information about whether more people entered or exited poverty in 1993. The absolute numbers of entries and exits, defined as ENt and EXt above, do provide this information.
IV.2. Multivariate Hazard Model
A discrete-time multivariate hazard model is used to analyze events that trigger individuals’ entries into and exits from poverty. A hazard model simply provides information about the likelihood (i.e., probability) of experiencing an event at time t (e.g., exiting poverty) given that the event has not occurred prior to time t (e.g., the person is in poverty in the period prior to t, t-1).(15) Our multivariate hazard model allows the probability of experiencing an event at time t (e.g., exiting poverty) to depend on a set of explanatory variables, which includes among other characteristics, age, race, gender, and educational attainment, as well as the trigger events. This multivariate framework allows us to determine the relative importance of multiple events in poverty transitions, something that cannot be learned from a descriptive analysis. Separate poverty entry and exit equations are estimated.
Our discrete-time hazard model assumes that the probability of entering (or exiting) poverty in a given period (e.g., year) is represented by a logit specification.(16) The logit specification is popular as it is very tractable and restricts the transition probabilities to lie between zero and one (Allison 1984). Several studies of poverty dynamics have used the logit specification (Stevens 1994 and 1999, Iceland 1997b). With this assumption, the probability of entering (or exiting) poverty for person i at time t can be written as:
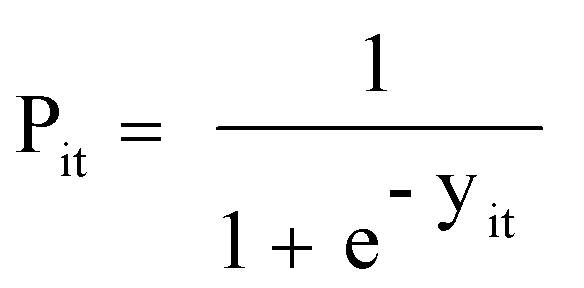 [4]
[4]
where
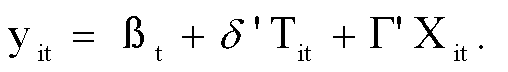 [5]
[5]
In this model, the vector T represents transition events, the primary focus of this analysis, and the vector X represents control variables.(17) The transition and control variables are based on our conceptual model. Our model of poverty entries includes the following transition events: (1) child under age six enters household, (2) two-adult household becomes female-headed household,(18) (3) young adult (under age 25) sets up own household, (4) loss of employment (of head, spouse, and other household members)—measured as a change from positive to zero hours work (PSID) and from with job to no job (SIPP), (5) nondisabled household head becomes disabled, and (6) weakening economy (change in state unemployment rate and change in GDP).
Our model of poverty exits include similar, although slightly different transition events: (1) female-headed household becomes two-adult household, (2) gain in employment (of head, spouse, and other household members)—measured as a change from zero to positive hours work (PSID) and from no job to with job (SIPP), (3) disabled household head becomes nondisabled, (4) household head receives high school degree, (5) household head receives advanced degree (associates degree or higher), and (6) strengthening economy (change in state unemployment rate and change in GDP). Because some of these events are choice variables (and thus potentially endogenous), this model does not necessarily identify causal relationships. Instead, it measures conditional relationships—the relationship after controlling for other events and characteristics.
An important issue is the extent to which events that occur in earlier periods are allowed to affect transitions in the current period. That is, to what extent lags enter the model. An immediate fall in income, say due to the loss of a job, may not cause a household to instantly fall below the poverty threshold if it is eligible for unemployment insurance. A household may fall below the poverty threshold only when unemployment insurance benefits run out. Similarly, a young adult who sets up her/his own household may only fall into poverty after private transfers from parents stop; and a change in educational attainment may only help an individual out of poverty after she/he obtains a higher paying job. Based on this theory of the timing between events and a poverty transition, we allow lags to enter the model for up to one year. In the yearly PSID data, we include a measure of the event at time t and a one year lag (t-1). In the monthly SIPP data, we include the event at time t and four quarterly lags.
Control variables include characteristics of the household head (age, race, and educational attainment), household (female-headed household, single male-headed household, number of adults 18-61, number of children), geographic characteristics (region and MSA), economic indicators (state unemployment rate and GDP), poverty spell information (observed duration of current spell at time t, observed number of prior spells, left censored spell identifier), and year identifiers.
Control variables that are tied to the event variables, such as female-headed household, are defined so that the event variable captures the full effect of the event. Using female-headed household as an example, three categories are created such that the first category captures the event at time t, the second category captures the event at time t-1 (lagged one period), and the third category captures the control (or level) variable: (1) female-headed household at time t and became female-headed at t (i.e., between t-1 and t); (2) female-headed household at time t and became female-headed at t-1 (i.e., between t-2 and t-1); and (3) female-headed household at time t and became female-headed prior to time t-1. To capture all possible household combinations at time t, single male-headed household at time t is included as a control variable, leaving two-adult household at time t as the omitted variable. In this example, the third variable (female-headed household at time t and became female-headed prior to time t-1) provides information about how living in a female-headed household for two or more years affects the probability of entering and exiting poverty relative to living in a two-adult household. The following six control variables are defined with their interaction with the event variable in mind: (1) female-headed household for two or more years; (2) number of adults 18-61 in the household, less the head and wife; (3) number of children in the household less those who enter at time t and t-1; (4) graduated from high school two or more years ago; and (5) received an associates degree or higher two or more years ago.(19)
Our analysis with PSID data further examines whether the events that trigger entries and exits differ for persons in long versus short poverty spells. It may be the case that changes in household composition, such as a shift from a two-adult to a female-headed household, result in long spells of poverty, whereas changes in employment cause only short poverty spells. We define a "long" poverty spell as one that has lasted four or more years and a "short" poverty spell as one that has lasted less than four years. We estimate separate models for short and long poverty spells.
Calculating the Likelihood an Event Occurs
The value of the estimated coefficients from the discrete-time multivariate hazard models do not have a straightforward interpretation. We can use these coefficients to determine whether an event increases or decreases an individuals' likelihood of experiencing a poverty transition, but alone, they do not provide information about the degree to which individuals are more or less likely to transition. We can, however, use these estimated coefficients and individuals' own characteristics to calculate the likelihood of entering poverty (or exiting poverty) when an event occurs. To calculate the likelihood of entering poverty with a shift from a two-adult to a female-headed household, for example, we (1) calculate each individual's estimated probability (i.e., likelihood) of entering poverty when the event is assumed to occur(20) and (2) average these estimated probabilities (i.e., likelihoods) across individuals. The average of these estimated probabilities gives the average likelihood of entering poverty when the event occurs.
We also calculate how the likelihood of entering/exiting poverty changes when the event occurs. To do this we first calculate (1) the average likelihood of entering poverty when the event occurs and (2) the average likelihood of entering poverty when the event does not occur.(21) Next, we calculate the difference between these two likelihoods, where this difference provides an estimate of how the likelihood of entering/exiting poverty changes when an event occurs. To quantify, for example, how a shift from a two-adult to a female-headed household affects poverty entries, we calculate the difference in the probability of entering poverty when the household structure shift does occur versus the probability of entering poverty when the household structure shift does not occur. This difference in the probabilities provides an estimate of how the likelihood of entering poverty changes with a shift from a two-adult to a female-headed household.
Left and Right Censoring
Our proposed discrete-time logit hazard estimation approach takes account of right-censored spells, while left-censored spells are more problematic. Whether including or excluding left-censored spells in an analysis produces misleading results depends on whether the analysis is trying to answer questions regarding poverty transitions or poverty duration. Iceland (1997a) looks at this exact topic in his paper "The Dynamics of Poverty Spells and Issues of Left-Censoring." He recommends that "when studying poverty transitions, using discrete-time logistic regression, all observations from left-censored spells should be included in [the] model to avoid selection bias." Iceland finds that omitting left-censored cases potentially introduces greater bias in poverty transitions than including them because it would systematically exclude individuals in the midst of long-term poverty.(22) Iceland (1997b) does not omit left-censored cases from his model because his focus is on how urban labor market characteristics affect transitions out of poverty, not the precise duration of poverty.(23) As our analysis focuses on poverty transitions, we incorporate left-censored spells. We do, however, identify left-censored spells in the model using a dummy variable. With this design, the model of poverty entries that includes left-censored spells, for example, examines "first observed poverty entry," not "first entry."
Summary: To summarize, we use the count method and the multivariate hazard model to answer our three research questions on the dynamics of poverty. We use the count method to examine the dynamics behind the poverty rate and the multivariate hazard model to examine events associated with poverty entries and exits. These methods are chosen because they are well-suited to answering the research questions.
Endnotes
15. The basic hazard model is defined in detail in Appendix A. The basic hazard model can be used to measure individuals’ likelihood of exiting poverty, but this more basic form of the model does not provide information about how different factors (i.e., transition events) affect the likelihood of exiting poverty.
16. We use a discrete-time, not a continuous-time, multivariate hazard model because poverty transitions are observed in large discrete time periods—a month or a year.
17. Some individuals enter (or exit) poverty more than once, so are included in the model more than once. Our standard errors are adjusted for this.
18. See discussion of control variables that are tied to event variables below for additional information on how this event is measured relative to other household combinations.
19. Changes in educational attainment are events only in the poverty exit model, so these last two variables pertain only to the exit model.
20. For the poverty entry models, the probability individual i enters poverty at time t is expressed as 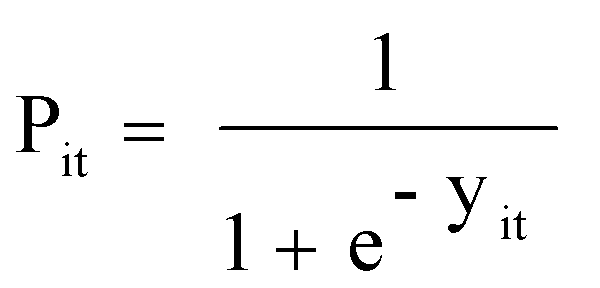 , where
 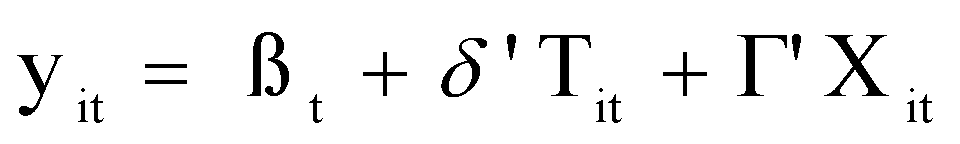 and Xi and Ti represent individual i's own characteristics (see Equations 4 and 5). When calculating the estimated probability of entering poverty when an event is assumed to occur, individual's own characteristics are used except for the one transition event that is assumed to occur (i.e., the event indicator variable is set to one).
21. These average likelihood values are calculated as described above.
22. Stevens (1999) is also concerned about bias from omitting left-censored spells from her examination of demographic characteristics (i.e., not transition events) associated with poverty exit and reentry. She finds the bias from omitting left-censored spells from her exit and reentry probabilities is extremely small (p. 572).
23. Stevens (1999) is also concerned about bias from omitting left-censored spells from her models that estimate exit and reentry rates. She similarly argues that omitting left-censored spells may over-estimate poverty exit rates at long durations. Stevens (1999) estimates her models both with and without left-censored spells. She finds the bias from omitting left-censored spells from her exit and reentry probabilities is extremely small (p. 572).
Chapter V: Data
Our analysis uses data from the 1975 through 1997 waves of the Panel Study of Income Dynamics (PSID) as well as the 1988, 1990, and 1996 panels of the Survey of Income and Program Participation (SIPP). We supplement these data with state unemployment rates (not seasonally adjusted) from the U.S. Department of Labor (2001) and real gross domestic product (GDP) from the U.S. Department of Commerce (2001).(24) Both the PSID and SIPP are well-suited for research on the dynamics of poverty. The variables outlined in the empirical model can be obtained from both data sets. Each data set is discussed in turn below.
V.1. Panel Study of Income Dynamics (PSID)
The PSID is a longitudinal data set with a single panel that begins in 1968 and extends through 1997. It contains annual data on roughly 4,800 families, for a total of roughly 18,000 family members. We use data from the 1975 through 1993 final release files, and from the 1994 through 1997 early release files.(25) Our unit of analysis for defining poverty status is the PSID family unit. A PSID family includes persons related by blood, marriage, adoption, as well as unrelated long-term cohabitors.(26) A PSID family can also be made up of a single person who lives alone or shares a household with a non-relative. The PSID family is broader than the U.S. Census Bureau's family unit definition, as it includes cohabitors, single person households, and persons related by blood.(27) Including persons related by blood allows, for example, an uncle or cousin to be included in the family unit. Since the PSID family includes several members of the U.S. Census Bureau's definition of a household, we refer to the “PSID family unit” as a “household.”
The most significant advantage of the PSID is that it contains over 20 years of data, making it possible to track long poverty spells and multiple transitions into and out of poverty. Another strength of the PSID is that it oversamples low-income families, providing relatively large sample sizes of people near the poverty line. Moreover, it collects detailed household income information each year.
It is well established that poverty rates in the PSID are lower than official poverty rates produced by the U.S. Census Bureau using the March Current Population Survey (CPS)—the data used to calculate official U.S. poverty statistics. Many studies using PSID data adjust the poverty rates upward to be comparable with the CPS. Bane and Ellwood (1986), Iceland (1997a), and Stevens (1994, 1999) multiply the government’s needs standard by 1.25 to make their figures comparable to those reported by the Office of Management and Budget and the Census Bureau. Other studies acknowledge the difference in incomes reported in the PSID when compared to the CPS and Census Bureau figures, but they do not mention any adjustments to their figures (Duncan and Rodgers 1988, 1991; Rank and Hirschl 1999a, 1999b).(28) Evidence suggests that the lower poverty rates in the PSID are due to more complete income reporting at the lower end of the income distribution in the PSID than in the CPS (Citro and Michael 1995, p. 403). As a result, we make no adjustments to the poverty calculations.
The longitudinal nature of the PSID is a strength of these data, but it creates a potential weakness—attrition bias. Research investigating the degree of attrition bias measurable in the PSID concludes that “PSID estimates of low-income families do not appear biased by differential attrition” (Citro and Michael 1995, p. 403). There are, however, weaknesses of the PSID. First, Gottschalk, McLanahan, and Sandefur (1994) highlight that the PSID provides only annual data, when monthly data may be preferable. Researchers using PSID data have no choice but to base their poverty estimate on these annual measures. A second drawback of the PSID is that it represents only the non-immigrant U.S. population (Rank and Hirschl 1999a). Corcoran and Chaudry (1997) remark that the PSID ignores the poverty experiences of Latinos and immigrants. Perhaps for lack of data, these groups are consistently not analyzed in studies using the PSID. Third, the latest publicly available income data are for 1996, making a post-federal welfare reform (TANF) poverty analysis impossible. Finally, income and household composition are measured at different points in time. While household structure is measured at the time of the interview, income is reported for the previous year—potentially mismatching poverty thresholds and making it difficult to pinpoint the timing of events leading to poverty. This analysis, however, compares income and household structure in the same calendar year using information provided in the PSID. The PSID data file contains a measure of family income that is adjusted for shifts in household structure during the two years. While the PSID does have some weaknesses it is a very powerful data set for analyzing poverty dynamics, and some of these weaknesses are offset by our use of the SIPP.
V.2. Survey of Income and Program Participation (SIPP)
Each panel of the SIPP is a nationally representative (non-institutional) sample of households whose members are interviewed at four-month intervals over approximately a two- to four-year period. The sample sizes for each panel range from 14,000 to 36,700 households. At each interview, data are collected on income for each of the preceding four months.
We analyze the 1988, 1990, and 1996 SIPP panels. The 1988 panel interviews households from February 1988 through January 1990, enabling us to analyze poverty dynamics prior to welfare reform and during a strong economy.(29) The 1990 SIPP panel interviews households from February 1990 through September 1992, and brings the benefits of capturing poverty dynamics prior to welfare reform, during a weak economy—including the July 1990 to March 1991 recession (NBER 2001), and during a period of dramatic increases in the annual family poverty rate (from 10.7 percent in 1990 to 11.5 percent in 1991 and 11.9 percent in 1992).(30) The 1996 SIPP panel is the most recently available and interviews households from April 1996 through March 2000, allowing us to capture poverty dynamics post-welfare reform and during a strong economy.(31)
The unit of analysis for defining poverty status is the SIPP household, not the SIPP family. A SIPP household consists of all persons who occupy a housing unit (including all unrelated persons), whereas a SIPP family is a group of two or more persons related by birth, marriage, or adoption who reside together. There are three main reasons for choosing the SIPP household over the SIPP family: (1) the SIPP household is similar to the “family” definition used in the PSID, in that the SIPP household includes cohabitors, whereas the SIPP family does not; (2) the SIPP household will provide us with a better understanding of the economic status of single parents, because it includes the income of a cohabiting partner; and (3) the SIPP household includes single-person households, whereas the SIPP family excludes them. The downsides of choosing the SIPP household, rather than the SIPP family, to define poverty include: (1) the SIPP household differs from the PSID family in that the SIPP household includes unrelated persons who share the housing unit; and (2) the SIPP household deviates from the “official poverty” definition, which is based on families.(32) While there are drawbacks to using the household rather than the family in the SIPP, we think the benefits of using the household outweigh the drawbacks.
A primary strength of the SIPP lies in its monthly data on income and household composition. These monthly data allow for detailed analyses of short poverty spells and the events that cause them. The SIPP also does a better job of capturing the current Hispanic and immigrant populations than the PSID. These populations may be particularly important in measuring poverty. Another advantage of the SIPP is that it has more recent data than the PSID, allowing us to look at changes through 1999—in the post-welfare reform period. Still, in contrast to the long panel length of the PSID, the SIPP can only track households for two to four years, making it impossible to examine long poverty spells.
As with the PSID, the longitudinal nature of the SIPP creates a concern of attrition bias. Research suggests that poorer persons are more likely to leave the SIPP sample prior to the end of the panel (Citro and Michael 1995, pp. 414-15). However, even with this limitation, the NAS Panel recommends that the SIPP replace the March CPS to become the official source of U.S. poverty statistics (Citro and Michael 1995, p. 391).
The monthly SIPP data make it possible to measure monthly poverty rates, but researchers must make some adjustments to the annual poverty thresholds to create a monthly poverty measure. Eller (1996) and Naifeh (1998) adjust poverty thresholds each month according to changes in the consumer price index.(33) Ruggles (1990), using the 1984 SIPP panel, divides the government’s annual poverty thresholds by twelve and compares it to income each month. We adopt the approach used by Ruggles.
Studies of welfare program dynamics (i.e., AFDC/TANF and food stamps) using SIPP data have been concerned with the “seam phenomenon”—transitions are more likely to occur between interview waves than months within the same wave—and have used wavely data rather than monthly data. Researchers using the SIPP to study poverty, however, have used monthly data (Ruggles 1990, Eller 1996, and Naifeh 1998). The seam phenomenon is of less concern when studying poverty status then program dynamics, as indicated by the NAS panel’s recommendation that the SIPP be used to study poverty in part because of its monthly income data. To avoid capturing arbitrary one month changes in poverty, we smooth poverty in the SIPP so that a household must remain in or out of poverty for two months before we consider it a change in poverty status. Similarly, Eller (1996) avoids arbitrary changes in poverty by focusing on poverty spells of two months or more. Overall, using both SIPP and PSID data allows us to examine poverty on both a monthly and annual basis, over the past two and a half decades, and since welfare reform.
Endnotes
24. We use monthly unemployment rates and quarterly GDP for the SIPP analysis, since the SIPP provides monthly data, and yearly unemployment rates and yearly GDP for the PSID, since the PSID provides only yearly data.
25. The early release PSID data are preliminary and should be viewed as such. Also, the early release files do not include all information that is available in the final release files. For example, hours of work and state of residence are not available in the early release files. We impute values for these missing data using variable means from final release years and include a dummy variable for the early release years in our analysis. Similarly, we impute mean values for lagged variables where necessary.
26. A long-term cohabitor is an individual who has been observed in the PSID household for one or more consecutive years.
27. Citro and Michael (1995) p.397.
28. Rank and Hirschl (1999a) do, however, look at the “near-poor”—those at 125% of the poverty threshold, offering results comparable to those calculated by Bane and Ellwood and Stevens.
29. The economy was expanding from November 1982 to July 1990 (NBER 2001).
30. US Census Bureau 2000.
31. Due to the large size of the 1996 SIPP person-month entry sample, we limit the sample to the 1997-2000 time period (dropping observations for 1996 and the first quarter of 1997).
32. The National Research Council recommends that the official poverty measure continue to use families and unrelated individuals as the unit of analysis, but that the definition of “family” be broadened to include cohabiting couples (Citro and Michael 1995, p. 13).
33. Eller and Naifeh also examine annual poverty with the SIPP. They both calculate annual poverty by summing the family’s monthly income over the entire year and comparing it to the sum of the family’s monthly poverty thresholds. An advantage of this calculation is that it can account for changes in family composition throughout the year.
Chapter VI: Results
VI.1. Dynamics Behind Changes in the Poverty Rate Over Time
Decomposing the Annual Poverty Rate
How has the poverty rate changed over time and what dynamics lie behind those changes? In periods where poverty rates remained high, was it because the number of entries and exits were high or low? With its many years of data, the PSID can be used to analyze how the poverty rate has changed from 1975 through 1996 and the dynamics behind those changes. In the mid-to-late 1970s the annual poverty rate was relatively low, followed by relatively high poverty rates through the early-to-mid 1980s, and moderate poverty rates in the mid-to-late 1980s (Table 2). The early-to-mid 1990s saw a return to high poverty rates, with a peak of 13 percent in 1993.(34)
| Year | Sample Size | Number Poor | Number Enter Poverty | Number Exit Poverty | Net Change in Number Poor | Poverty Rate |
|---|---|---|---|---|---|---|
| 1975 | 18,521 | 22,424 | ||||
| 1976 | 18,672 | 20,303 | 7,417 | 9,133 | -1,716 | 7.8 |
| 1977 | 18,811 | 18,977 | 6,739 | 7,567 | -828 | 7.4 |
| 1978 | 18,954 | 17,997 | 6,625 | 7,317 | -693 | 7.0 |
| 1979 | 19,254 | 19,908 | 7,117 | 7,344 | -227 | 6.2 |
| 1980 | 19,548 | 21,736 | 8,674 | 6,938 | 1,737 | 7.6 |
| 1981 | 19,614 | 23,793 | 9,538 | 7,059 | 2,479 | 8.6 |
| 1982 | 19,875 | 23,893 | 8,328 | 8,159 | 169 | 8.5 |
| 1983 | 20,119 | 23,261 | 7,493 | 7,940 | -447 | 8.4 |
| 1984 | 20,202 | 24,001 | 8,187 | 10,231 | -2,044 | 7.0 |
| 1985 | 20,446 | 24,428 | 9,329 | 8,510 | 820 | 8.2 |
| 1986 | 20,192 | 22,609 | 6,968 | 8,630 | -1,662 | 7.7 |
| 1987 | 20,235 | 22,322 | 6,937 | 6,904 | 33 | 7.7 |
| 1988 | 20,272 | 22,674 | 7,860 | 7,631 | 229 | 7.7 |
| 1989 | 20,223 | 25,355 | 7,727 | 9,197 | -1,470 | 6.5 |
| 1990 | 20,498 | 25,508 | 9,309 | 9,136 | 174 | 7.8 |
| 1991 | 20,532 | 26,030 | 9,074 | 8,435 | 639 | 8.1 |
| 1992 | 21,933 | 28,584 | 10,951 | 8,339 | 2,612 | 8.8 |
| 1993 | 22,942 | 41,749 | 22,019 | 8,811 | 13,208 | 12.6 |
| 1994 | 25,044 | 37,603 | 12,324 | 18,087 | -5,763 | 10.7 |
| 1995 | 24,340 | 36,056 | 12,195 | 14,561 | -2,366 | 10.1 |
| 1996 | 23,530 | 29,762 | 11,979 | 9,712 | 2,267 | 11.5 |
| Notes: Poverty rates in the PSID are lower than official poverty rates produced by the U.S. Census Bureau from the March Current Population Survey (CPS). Evidence suggests that the lower poverty rates are due to the more complete income reporting at the lower end of the income distribution in the PSID than in the CPS (Citro and Michael 1995, p. 403). The 1993-96 income data are from the early release PSID files and thus, are preliminary. Population numbers in thousands. Numbers do not sum precisely due to minor changes in the PSID sample over time. | ||||||
The poverty rate measures the number of poor persons (numerator) as a fraction of the total population (denominator). As described in the Conceptual Model (Section III.2), the poverty rate can be decomposed to highlight the variables responsible for its changes: the number of people who enter and exit poverty, and the number of people who enter and exit the total population. We focus on the number of people who enter and exit poverty because our main objective is to explain poverty dynamics, not population dynamics, and the PSID is not a strong data source for explaining population dynamics.(35)
Our examination of the dynamics behind changes in the poverty rate over time illustrates that, not surprisingly, the number of people entering poverty is greater than the number of people exiting poverty when the poverty rate is increasing. Conversely, the number of people entering poverty is smaller than the number exiting poverty when the poverty rate is decreasing (Table 2).
While there were year-to-year changes in the number entering and exiting poverty, these numbers fluctuated within a band between roughly 7 and 10 million per year from 1975 until the early 1990s. Then, both entries and exits jumped dramatically. The number of entries hit a peak in 1993, doubling between 1992 and 1993, and the number of exits hit a peak in 1994, more than doubling from its 1993 level.(36)
The high levels of poverty entries and exits in the mid 1990s suggest that poverty rates remained high over this period because entries and exits were both high, not because they were both low. Many people were cycling in and out of poverty rather than a few people staying in poverty. A look at the early-to-mid 1980s, another period where poverty rates remained high, reveals that this was not always the case. The number of people entering and exiting poverty in this period was comparatively low. The early-to-mid 1980s were characterized by fewer people staying in poverty rather than many people cycling through.
In summary, our examination of changes in the poverty rate and the dynamics behind it over the 22 years from 1975 through 1996, using PSID data, suggests that the early-to-mid 1990s look different from earlier time periods. The early-to-mid 1990s were characterized by relatively high poverty rates and high numbers of people cycling in and out of poverty. These differences are also reflected in the likelihood of entering and exiting poverty over time.
Likelihood of Entering and Exiting Poverty Over Time
The likelihood of entering and exiting poverty in each year, from the mid-1970s through the mid-1990s, is presented in Table 3. Our analysis of PSID data suggests that the likelihood of entering poverty averaged 2.8 percent in the mid-to-late 1970s, 3.0 percent in the 1980's, and 4.2 percent in the early to mid-1990s, a substantial jump from the previous decades (Table 3, column 1). These estimates of poverty entry in the 1970s and 1980s are similar to estimates in the early 1990s by Eller (1996) and Naifeh (1998). Eller and Naifeh both find a roughly three percent likelihood of entering poverty per year, using SIPP data from the early 1990s. We find, however, a substantial jump in the likelihood of entering poverty to 7.4 percent in 1993—the year in which poverty rates hit record highs. Poverty entry rates were somewhat lower in 1994 through 1996—3.8 to 4.3 percent—but remained higher than the rates experienced over the 1970s and 1980s.
The likelihood of exiting poverty has fallen somewhat across the three decades examined. The likelihood of exiting poverty averaged 39.3 percent in the mid to late 1970s, 35.5 percent in the 1980's, and 34.4 percent in the early to mid 1990s (Table 3, column 2). These estimates are considerably higher than estimates by Eller (1996) and Naifeh (1998), who use SIPP data. They find that the likelihood of exiting poverty was between 22 and 24 percent per year in the early 1990s. Interestingly, as the likelihood of entering poverty was increasing during the 1991 through 1993 period, the likelihood of exiting poverty was declining. For example, the likelihood of exiting poverty stood at 36.0 percent in 1990 and fell to 30.8 percent in 1993. While the likelihood of exiting poverty declined through the early 1990s, it increased to 43.3 percent in 1994. Consistent with results in Table 2, we find that the early to mid 1990s look different than earlier periods. The likelihood of entering poverty was substantially higher, on average, than in the prior one and a half decades and the likelihood of exiting poverty was slightly lower.
| Likelihood of: | ||
|---|---|---|
| Year | entering poverty | exiting poverty |
| 1976 | 3.0 | 40.7 |
| 1977 | 2.7 | 37.3 |
| 1978 | 2.7 | 38.6 |
| 1979 | 2.9 | 40.8 |
| Avg. 1976-1979 | 2.8 | 39.3 |
| 1980 | 3.2 | 34.8 |
| 1981 | 3.6 | 32.5 |
| 1982 | 3.2 | 34.3 |
| 1983 | 2.9 | 33.2 |
| 1984 | 3.2 | 44.0 |
| 1985 | 3.3 | 35.5 |
| 1986 | 2.5 | 35.3 |
| 1987 | 2.5 | 30.5 |
| 1988 | 2.9 | 34.2 |
| 1989 | 2.9 | 40.6 |
| Average 1980s | 3.0 | 35.5 |
| 1990 | 3.1 | 36.0 |
| 1991 | 3.0 | 33.1 |
| 1992 | 3.7 | 32.0 |
| 1993 | 7.4 | 30.8 |
| 1994 | 4.3 | 43.3 |
| 1995 | 4.1 | 38.7 |
| 1996 | 3.8 | 26.9 |
| Average 1990-1996 | 4.2 | 34.4 |
| Note: Numbers multiplied by 100. | ||
Our examination of changes in the poverty rate over the 22 years from 1975 through 1996, using PSID data, finds that the annual poverty rate was relatively low in the mid-to-late 1970s, moderate in the mid-to-late 1980s, and high in the early-to-mid 1980s and early-to-mid 1990s. Analysis of poverty entries and exits over these two decades shows that the early-to-mid 1990s look different from earlier years. The high poverty rates in the mid-1990s were characterized by many people cycling through poverty, while the high poverty rates in the early-to-mid 1980s were characterized by fewer people staying in poverty.
VI.2. Events Associated with Poverty Entries and Exits
Descriptive Analysis
The PSID and SIPP samples are each split into two separate samples: (1) persons at risk of entering poverty in the current period t, (i.e., persons not in poverty in the prior period t-1) and (2) persons at risk of exiting poverty in the current period t (i.e., persons in poverty in the prior period t-1). In this section we provide basic descriptive statistics for each of these samples and a description of the relationship between events and poverty transitions.
Events Associated with Poverty Entries
PSID: Of the 217,427 person-year (20,741 person) observations at risk of entering poverty in the PSID, 3.4 percent enter poverty as measured on an annual basis (Table 4, column 2). Examining the key trigger events, we find that changes in each of the events affect a small, but significant portion of the sample over the course of a year (1.2 to 6.9 percent, column 1). A loss of employment by the wife or other household members is the most common event (6.5 and 6.9 percent of the sample), followed by the household head becoming disabled (5.5 percent) and by the birth of a child (4.8 percent). Other changes in household composition—including a change from a two-adult to a female-headed household and a young adult setting up his or her own household—are relatively rare events experienced by less than two percent of the sample.
The PSID descriptive results presented in Table 4 suggest that persons who experience these key trigger events in a given year are significantly more likely to enter poverty that year than the overall sample. For example, of those who have a child under age six enter the household, 5.7 percent enter poverty as compared with 3.4 percent of the total sample (column 2). Persons who shift from living in a two-adult household to a female-headed household, a fairly rare event, are by far the most likely to enter poverty (12.4 percent). Persons experiencing changes in labor supply are less likely to enter (4.5 to 6.4 percent), as are persons living in a household where the head becomes disabled (6.8 percent), a young child is born (5.7 percent), or a young adult sets up his or her own household (5.2 percent).
|
Entry Trigger Events |
PSID | SIPP | ||||
|---|---|---|---|---|---|---|
| Event Mean | Enter Poverty | 1998 & 1990 | 1996 | |||
| Event Mean | Enter Poverty | Event Mean | Enter Poverty | |||
| (1) | (2) | (3) | (4) | (5) | (6) | |
| Total Sample | 3.36 | 1.07 | 1.25 | |||
| Change in Household Composition | ||||||
| Child under age 6 enters household | 4.8 | 5.73 | 0.47 | 5.93 | 0.38 | 6.48 |
| Two-adult becomes female-headed household | 1.74 | 12.4 | 0.11 | 27.94 | 0.1 | 20.05 |
| Young adult sets up own household | 1.23 | 5.18 | -- | -- | -- | -- |
| Change in Labor Supply | ||||||
| Loss of employment, head | 2.61 | 6.41 | 0.44 | 17.84 | 0.7 | 19.2 |
| Loss of employment, wife | 6.54 | 5.38 | 0.84 | 6.97 | 0.75 | 10.47 |
| Loss of employment, others in household | 6.92 | 4.54 | 1.2 | 6.45 | 1.24 | 8.83 |
| Change in Disability Status | ||||||
| Head becomes disabled | 5.51 | 6.76 | 0.81 | 4.03 | 0.45 | 6.36 |
| Number of person-years/months | 217,427 | 2,034,658 | 2,211,724 | |||
| Number of persons | 20,741 | 97,936 | 93,267 | |||
| Notes: Table presents weighted means multiplied by 100. Summary statistics based on person-years for the PSID and person-month for the SIPP. Events are measured as a change between time t and t-1, where t is measured in years for the PSID and months for the SIPP. Summary statistics for changes in economic status and control variables are shown in Appendix Table B1. | ||||||
While those who shift to a female-headed household are the most likely to enter poverty, this event does not explain why most people are poor, because only a small fraction of the population experiences this event. Employment loss is a far more likely explanation. In descriptive analyses of those entering poverty (not shown here), we see that employment is indeed the most common event associated with poverty entry. Nearly 40 percent of those entering poverty had a household member lose a job. A change in disability status plays the next largest role (11 percent of those entering poverty), followed by a young child entering the household (8 percent), a shift to a female-headed household (6 percent), and a young adult setting up their own household (2 percent).
SIPP: The SIPP descriptive results highlight the lower likelihood of entering poverty or experiencing an event when measured monthly in the SIPP than annually in the PSID (Table 4). Only one percent of the SIPP person-month sample enters poverty in a given month as compared with three percent of the PSID person-year sample in a given year (Table 4, columns 2, 4, and 6). And, not surprisingly, persons are much less likely to experience an event in a month, than at any time over the past year. Only 0.1 to 1.3 percent experience each of the events in the SIPP monthly data as compared with 1.2 to 6.9 percent in the PSID annual data. The combined 1988/1990 SIPP sample and 1996 SIPP sample each have over two million person-month observations and over 93,000 persons.(37)
The SIPP monthly data also confirm the general findings from the PSID annual data: (1) Persons who experience each of the key trigger events in a given month are significantly more likely to enter poverty that month than the overall sample (columns 4 and 6); (2) Persons who shift from living in a two-adult household to a female-headed household, a relatively rare event, are the most likely to enter poverty (columns 4 and 6); and (3) Even though persons who shift to a female-headed household are the most likely to enter poverty, this event accounts for a much smaller percent of poverty entries than a loss of employment because relatively few people experience a shift to a female-headed household.
Events Associated with Poverty Exits
PSID: Of the 35,445 person-year (7,948 person) observations at risk of exiting poverty measured annually in the PSID, 35.8 percent exit poverty (Table 5, column 2). Changes in labor supply are the most common trigger events (6.2 to 10.5 percent, column 1), followed by a change in disability status (8.8 percent), and a shift from a female-headed to a two-adult household (1.4 percent). Less than one percent of the sample experienced a change in the household head’s education status. Persons experiencing each of the key exit trigger events in a given year are significantly more likely to exit poverty that year than the overall sample, with the exception of those whose household head received an associate’s degree or higher. Similar to the findings for poverty entry, persons who shift from living in a female-headed to a two-adult household are the most likely to experience a poverty transition—55.7 percent exit poverty. However, because relatively few people experience this event, it is less associated with poverty exits. Changes in labor supply are often associated with poverty exits in the total population.
SIPP: The SIPP data reveal a lower likelihood of exiting poverty when measured monthly than when measured annually in the PSID (Table 5 columns 2, 4, and 6). Only nine to 11 percent of the SIPP person-month samples exit poverty as compared with 36 percent of the PSID person-year sample. The other general descriptive results remain unchanged. Persons who shift from living in a female-headed to a two-adult household are the most likely to exit poverty (52 to 65 percent, columns 4 and 6), though relatively few people experience this event.
| Exit Trigger Events | PSID | SIPP | ||||
|---|---|---|---|---|---|---|
| Event Mean | Exit Poverty | 1988 & 1990 | 1996 | |||
| Event Mean | Exit Poverty | Event Mean | Exit Poverty | |||
| (1) | (2) | (3) | (4) | (5) | (6) | |
| Total Sample | 35.8 | 10.9 | 9.1 | |||
| Change in Household Composition | ||||||
| Female-headed becomes two-adult household | 1.4 | 55.7 | 0.2 | 65.2 | 0.1 | 51.9 |
| Change in Labor Supply | ||||||
| Gain of employment, head | 10.4 | 38.9 | 1.7 | 36.9 | 2.9 | 37.6 |
| Gain of employment, wife | 6.2 | 42.5 | 1.1 | 39.3 | 1.2 | 46.8 |
| Gain of employment, others in household | 10.5 | 39.5 | 1.7 | 40.3 | 1.8 | 40.5 |
| Change in Disability Status | ||||||
| Head ceases to be disabled | 8.8 | 39.8 | 0.4 | 30.4 | 0.8 | 21.7 |
| Change in Education with stable household composition | ||||||
| Head graduated high school | 0.6 | 44.1 | 0.2 | 26.8 | 0.2 | 23.4 |
| Head received associates degree or higher | 0.3 | 34.9 | 0.1 | 32.3 | 0.1 | 33.3 |
| Number of person-years/months | 35,445 | 272,639 | 517,902 | |||
| Number of persons | 7,948 | 27,409 | 40,153 | |||
| Notes: Table presents weighted means multiplied by 100. Summary statistics based on person-years for the PSID and person-month for the SIPP. Events are measured as a change between time t and t-1, where t is measured in years for the PSID and months for the SIPP. Summary statistics for changes in economic status and control variables are shown in Appendix Table B2. | ||||||
Summary of Descriptive Analysis and Comparison to the Literature
Our descriptive analysis highlights an important finding and confirms earlier findings in the literature. The main finding—that persons who experience a major shift in household composition are the most likely to transition into and out of poverty—is consistent with earlier findings from Ruggles and Williams (1987). This finding is largely missed in much of the literature, however, because most studies examine events only for those who enter (or exit) poverty (Bane and Ellwood 1986, Blank 1997). Since a very small portion of the population experiences a shift from a two-adult to a female-headed household (or vice versa), especially relative to those who experience a change in employment, the shift in household composition appears less important than a change in employment. Duncan and Rodgers (1988) highlight a similar finding in their analysis of child poverty: family breakups are relatively rare among children, but they have devastating effects when they do occur (pp. 1014-1015).
Our descriptive results that measure the percent of individuals experiencing each event only for those who enter (or exit) poverty confirm earlier findings in the literature. Consistent with Bane and Ellwood (1986), Ruggles and Williams (1987), Duncan and Rodgers (1988) and Blank (1997), these descriptive results suggest that changes in employment are more important than changes in household composition for the overall likelihood of entering poverty. As Ruggles and Williams explain, “employment-related events, because they are so common in the population as a whole, are associated with a much higher proportion of all transitions into and out of poverty than demographic events” (p. 14). However, as with the findings from the literature, in making these comparisons it is important to bear in mind that these descriptive statistics do not control for persons experiencing multiple events and other household and economic characteristics. Next we turn to our multivariate results, which do control for multiple events and other household and economic characteristics.
Multivariate Analysis
Our multivariate analyses show that employment changes are the events most closely associated with entries into and exits from poverty. This is, in general, followed by shifts in household structure—two-adult to female-headed households and vice versa. These and other results are presented in Tables 6 through 9.(38) First, we discuss the poverty entry results for the PSID and SIPP (Tables 6 and 7) and then discuss the poverty exit results (Tables 8 and 9).
For the explanatory variables in each table, three numbers are presented—the coefficient, standard error, and change in the likelihood (i.e., probability) of entering/exiting poverty with a change in the explanatory variable. This third number provides a straightforward interpretation of the relationship between the explanatory variable and poverty, something the regression coefficient does not provide.(39) To calculate, for example, how a shift from a two-adult to a female-headed household affects the likelihood of entering poverty, we (1) calculate the likelihood of entering poverty when the household structure shift occurs, (2) calculate the likelihood of entering poverty when the household structure shift does not occur, and (3) calculate the difference between these two likelihoods.(40) This difference in the likelihood of entering poverty in these two scenarios provides an estimate of how the probability of entering poverty changes with a shift from a two-adult to a female-headed headed household.
| Explanatory Variables | All | Poverty spell of four or less years | Poverty spell of more than four years |
|---|---|---|---|
| Entry Trigger Events (at t and lagged) | |||
| Change in Household Composition | |||
| Child under age 6 enters household, t | 0.351 | 0.138 | 0.045 |
| (0.094)** | -0.194 | -0.286 | |
| [0-1] | [0.011] | [0.020] | [0.007] |
| Child under age 6 enters household, t-1 | 0.406 | 0.111 | 0.334 |
| (0.099)** | -0.027 | -0.384 | |
| [0-1] | [0.013] | [0.016] | [0.051] |
| Two-adult becomes female-headed household, t | 1.521 | 1.477 | 1.371 |
| (0.132)** | (0.270)** | (0.523)** | |
| [0-1] | [0.074] | [0.266] | [0.225] |
| Two-adult becomes female-headed household, t-1 | 1.081 | 0.522 | -0.248 |
| (0.143)** | -0.286 | -0.561 | |
| [0-1] | [0.045] | [0.083] | [-0.036] |
| Young adults sets up own household, t | 0.031 | 0.289 | 0.032 |
| -0.179 | -0.369 | -0.599 | |
| [0-1] | [0.001] | [0.044] | [-0.005] |
| Young adults sets up own household, t-1 | 0.385 | 0.276 | -0.917 |
| (0.138)** | -0.299 | -0.626 | |
| [0-1] | [0.012] | [0.042] | [-0.122] |
| Change in Labor Supply | |||
| Loss of employment, head, t | 1.797 | 1.593 | 1.847 |
| (0.087)** | (0.181)** | (0.275)** | |
| [0-1] | [0.095] | [0.292] | [0.317] |
| Loss of employment, head, t-1 | 0.969 | 0.769 | 1.011 |
| (0.112)** | (0.227)** | (0.388)** | |
| [0-1] | [0.038] | [0.129] | [0.163] |
| Loss of employment, spouse, t | 1.078 | 0.622 | 0.186 |
| (0.084)** | (0.187)** | -0.433 | |
| [0-1] | [0.043] | [0.099] | [0.028] |
| Loss of employment, spouse, t-1 | 0.392 | 0.21 | -0.081 |
| (0.107)** | -0.208 | -0.438 | |
| [0-1] | [0.012] | [0.032] | [-0.012] |
| Loss of employment, others in household, t | 0.837 | 0.925 | 0.842 |
| (0.084)** | (0.168)** | (0.321)** | |
| [0-1] | [0.030] | [0.154] | [0.133] |
| Loss of employment, others in household, t-1 | 0.275 | -0.017 | 0.794 |
| (0.104)** | -0.216 | (0.349)* | |
| [0-1] | [0.008] | [-0.002] | [0.126] |
| Change in Disability Status | |||
| Head becomes disabled, t | 0.490 | -0.113 | 0.233 |
| (0.083)** | -0.179 | -0.371 | |
| [0-1] | [0.016] | [-0.016] | [0.035] |
| Head becomes disabled, t-1 | 0.255 | 0.131 | 0.231 |
| (0.089)** | -0.173 | -0.307 | |
| [0-1] | [0.008] | [0.019] | [0.035] |
| Change in Economic Status | |||
| Change in state unemployment rate, t | 0.057 | 0.051 | 0.046 |
| (0.028)* | -0.058 | -0.103 | |
| [0-0.5] | [0.001] | [0.004] | [0.003] |
| Change in state unemployment rate, t-1 | 0.01 | -0.009 | 0.058 |
| -0.027 | -0.06 | -0.116 | |
| [0-0.5] | [0.000] | [-0.001] | [0.004] |
| Change in GDP, t (in billions) | 0.001 | 0.000 | 0.000 |
| 0 | -0.001 | -0.001 | |
| [0-180] | [0.003] | [0.003] | [0.004] |
| Change in GDP, t-1 (in billions) | 0 | -0.001 | 0 |
| 0 | -0.001 | -0.001 | |
| [0-180] | [-0.000] | [-0.019] | [-0.001] |
| Demographic Characteristics of Household Head | |||
| Age: | |||
| Less than 25 | 0.248 | 0.337 | 0.117 |
| (0.087)** | -0.172 | -0.376 | |
| [0-1] | [0.007] | [0.052] | [0.018] |
| Greater than or equal to 55 | 0.162 | 0.21 | -0.008 |
| (0.070)* | -0.149 | -0.251 | |
| [0-1] | [0.005] | [0.031] | [-0.001] |
| Race: | |||
| Black | 0.558 | 0.229 | 0.652 |
| (0.059)** | -0.129 | (0.216)** | |
| [0-1] | [0.018] | [0.034] | [0.100] |
| Educational attainment: | |||
| Equal to high school | -0.525 | -0.345 | -0.449 |
| (0.058)** | (0.127)** | -0.236 | |
| [0-1] | [-0.014] | [-0.049] | [-0.065] |
| More than high school | -1.017 | -0.303 | -0.531 |
| (0.064)** | (0.149)* | -0.307 | |
| [0-1] | [-0.026] | [-0.042] | [-0.075] |
| Household Composition | |||
| Female-headed household for two or more years | 1.105 | 0.528 | 0.837 |
| (0.064)** | (0.141)** | (0.245)** | |
| [0-1] | [0.041] | [0.081] | [0.129] |
| Single male-headed household | 1.069 | 0.824 | 1.302 |
| (0.074)** | (0.177)** | (0.375)** | |
| [0-1] | [0.043] | [0.136] | [0.210] |
| Number of adults (less head and wife) | -0.038 | -0.127 | -0.140 |
| -0.035 | (0.064)* | -0.108 | |
| [0-1] | [-0.001] | [-0.018] | [-0.021] |
| Number of children | 0.255 | 0.195 | 0.223 |
| (less children that enter at t and t-1) | (0.024)** | (0.047)** | (0.071)** |
| [0-1] | [0.006] | [0.032] | [0.032] |
| Geographic Characteristics | |||
| Region at t-1: | |||
| Northeast | -0.140 | 0.326 | 0.58 |
| -0.074 | -0.171 | -0.344 | |
| [0-1] | [-0.004] | [0.049] | [0.090] |
| Midwest | 0.003 | 0.059 | -0.082 |
| -0.06 | -0.14 | -0.228 | |
| [0-1] | [-0.000] | [0.009] | [-0.012] |
| West | -0.082 | -0.103 | -0.098 |
| -0.076 | ( 0.171)* | -0.457 | |
| [0-1] | [-0.002] | [-0.015] | [-0.015] |
| Pacifica | 0.044 | -- | -- |
| -0.525 | -- | -- | |
| [0-1] | [0.001] | -- | -- |
| Urban area | |||
| MSA | -0.293 | -0.18 | -0.478 |
| (0.052)** | -0.113 | -0.248 | |
| [0-1] | [-0.008] | [-0.026] | [-0.071] |
| Economic Characteristics | |||
| State unemployment rate, t | 0.027 | 0.045 | -0.003 |
| -0.015 | -0.03 | -0.054 | |
| [0-0.5] | [0.000] | [0.003] | [-0.000] |
| GDP, t (in ten billions) | -0.004 | 0.032 | 0.046 |
| -0.009 | (0.020)* | -0.03 | |
| [0-180] | [-0.016] | [0.841] | [0.905] |
| Spell Information, Non-Poverty | |||
| Observed duration | |||
| 1 year | -0.711 | -0.552 | -0.542 |
| (0.094)** | (0.186)** | -0.297 | |
| 2 years | -1.037 | -0.96 | -0.983 |
| (0.102)** | (0.219)** | (0.332)** | |
| 3 years | -1.044 | -1.027 | -0.595 |
| (0.111)** | (0.218)** | -0.383 | |
| 4 years | -1.324 | -0.926 | -0.963 |
| (0.114)** | ( 0.235)** | (0.367)** | |
| 5 years | -1.382 | -0.991 | -0.88 |
| (0.124)** | (0.257)** | (0.444)* | |
| 6 years | -1.589 | -0.711 | -1.492 |
| (0.131)** | (0.270)** | (0.526)** | |
| 7 years | -1.667 | -1.557 | -1.588 |
| (0.133)** | (0.332)** | (0.472)** | |
| 8 years | -1.469 | -0.771 | -0.756 |
| (0.143)** | (0.306)* | -0.523 | |
| 9 years | -1.445 | -0.496 | -0.967 |
| (0.152)** | -0.341 | -0.619 | |
| 10 years | -1.649 | -1.001 | 0.139 |
| (0.155)** | -0.307 | -0.578 | |
| 11 years | -1.708 | -0.736 | -0.89 |
| (0.163)** | (0.403)** | -0.733 | |
| 12 years | -1.906 | -1.152 | -4.154 |
| (0.165)** | (0.391)** | (0.784)** | |
| 13 years or more years | -1.603 | -0.636 | -0.222 |
| (0.127)** | -0.329 | -0.619 | |
| Other | |||
| Left-censored spell | -0.468 | -0.326 | -0.816 |
| (0.066)** | (0.148)** | (0.289)** | |
| Number of previous spells (observed) | 0.228 | 0.103 | -0.209 |
| (0.036)** | ( 0.085)** | -0.139 | |
| Year at t-1 | |||
| 1980-1989 | 0.397 | 0.095 | 0.36 |
| (0.128)** | -0.266 | -0.442 | |
| 1990-1996 | 0.530 | 0.181 | 1.681 |
| (0.232)* | -0.506 | (0.839)* | |
| Sample size | 217,427 | 9,039 | 3,537 |
| Notes: a) The variable for Pacific was dropped from the models in columns 2 and 3 because too few people were identified as living in the Pacific region. b) * denotes statistical significance at the 5 percent level; ** denotes statistical significance at the 1 percent level. c) Standard errors are in parenthesis. The numbers in brackets are the simulated percentage point change in the likelihood of entering poverty when the explanatory variable changes by the value indicated in the column labeled "Explanatory Variables" (typically from 0 to 1 [0-1]). |
|||
Poverty Entries
PSID: Individuals experiencing many of our “trigger events” are significantly more likely to enter poverty, even after controlling for other events that may occur during the same time period as well as demographic characteristics and economic conditions (Table 6, column 1).(41) We find that household events including household composition changes, employment changes, and disability changes are related to poverty entries. We also find that increases in the unemployment rate increase poverty entries. Of the trigger events examined, individuals living in households that experience a loss of employment are the most likely to enter poverty, followed by individuals in households that shift from being headed by two adults to being headed by only a female. This finding differs from those in our descriptive analysis, as the descriptive results suggest that shifts in household structure are more important than changes in employment. Controlling for characteristics of the household, many of which are related to female headship including minority status and having low levels of education, reduces the observed relationship between household structure shifts and poverty, and employment changes emerge as most strongly related to poverty entries. Our findings also suggest that many of the household, geographic, and economic characteristics are significantly related to poverty entries, as well as the poverty and non-poverty spell information.
Individuals experiencing all three household composition trigger events are more likely to enter poverty than individuals not experiencing these events. Persons who have a child under age six enter their household or shift from a two-adult to a female-headed household this year (at time t) or last year (at time t-1) are more likely to enter poverty this year, whereas young adults (under age 25) who set up their own households are not more likely to enter poverty in the year they make this transition, but are more likely to enter poverty one year later (i.e., a shift last year, t-1, is related to poverty entry this year, t). It may be that young adults who set up their own households receive financial support from a parent or other relative in the first year they live on their own, but that the support discontinues in subsequent years.
The probability of entering poverty is 2.4 percentage points higher for persons living in households that have a child under age six enter. If the child entered the household this year, the probability of entering poverty is higher by 1.1 percentage points and if the child entered last year the probability is higher by 1.3 percentage points, providing the total effect of 2.4 percentage points. The likelihood of entering poverty increases considerably if the household shifts from a two-adult to a female-headed household. The probability of entering poverty is 11.9 percentage points higher for persons who experience this shift in household structure—the probability of entering poverty is higher by 7.4 percentage points if the shift occurred this year and by 4.5 percentage points if the shift occurred last year. Setting up ones’ own household in the previous year is associated with a higher likelihood of entering poverty in the current year by 1.2 percentage points.
All three employment transition events and their lags are significantly related to poverty entry. The loss of employment by the household head has the largest impact on poverty entry. The probability of entering poverty is higher by 9.5 percentage points if the household head lost his/her job this year and by 3.8 percent if the job loss occurred last year—for a total effect of 13.3 percentage points. The loss of employment by a spouse or other household members has a smaller, yet significant, relationship with poverty entries—the likelihood of entering poverty is higher by a total (this year and last year) of 5.5 percentage points if the spouse loses a job and by a total of 3.8 percentage points if another household member loses a job. Our finding that the loss of employment in the previous year is related to poverty entries in the current year suggests that some individuals are able to keep themselves out of poverty in the year the job loss occurs, perhaps because of government transfers such as unemployment insurance benefits, but that they enter poverty in the following year.
Individuals living with a household head who becomes disabled are more likely to enter poverty. The probability of entering poverty when the household head becomes disabled is higher by a total of 2.4 percentage points. The final two events are changes in economic conditions. We find that a 0.5 percentage point increase in the unemployment rate increases the likelihood of entering poverty by only 0.1 percentage points, and that GDP has no significant effect on poverty entries.(9)
Many of the model’s control variables also help to explain poverty entry. Characteristics of the household head including his/her age, race, and educational attainment are related to poverty entry. Persons living in a household headed by an individual under age 25 or age 55 or older are more likely to enter poverty than persons whose household head is between ages 25 and 54. Consistent with analyses by Eller (1996), Naifeh (1998), and Rank and Hirschl (1999a and 1999b), persons who live in households headed by black individuals are more likely to enter poverty than persons who live in households headed by non-black individuals. We also find that higher educational attainment of the household head is associated with a lower probability of entering poverty. Persons who live in households headed by individuals with more than a high school degree are the least likely to enter poverty, followed by persons in households where the head has a high school degree only, and finally, those in households headed by persons with no high school degree are the most likely to enter poverty.
Household structure also plays a role in poverty entries. Person in households that have been female-headed for two or more years, as well as persons in single male-headed households (i.e., a male heads the household without a female partner), are more likely to enter poverty than persons in two-adult households.(10) The presence of dependent children in the household is also related to entries—the likelihood of entering poverty is higher for persons in households with more children. We also find that individuals who live in metropolitan areas are less likely to enter poverty, which may be due to the fact that there tends to be more employment opportunities in metropolitan areas as compared to non-metropolitan areas. The level of the state unemployment rate also matters. Facing a high unemployment rate increases the likelihood of entering poverty.
In terms of spell information, we find that the length of the non-poverty spell matters. The probability of entering poverty declines as we observe the individual out of poverty for more years, although the largest difference occurs in the first few years. This pattern in the coefficients suggests that one of the following is taking place: (1) persons who have longer non-poverty spells are different from persons with shorter non-poverty spells in a way that the model does not capture (e.g., more disciplined and hard-working), and that these unobserved differences produce the pattern;(11) (2) there is duration dependence; or (3) a combination of the two. Because it is unlikely that our model captures all differences between individuals, it is unlikely that this series of coefficients is identifying a pure duration dependence effect.
Having a prior (observed) non-poverty spell, which indicates that a poverty spell has occurred, increases ones’ probability of entering poverty. That is to say, persons who have previously experienced a spell of poverty are more likely to enter poverty than persons who have never been in poverty. Finally, we find that individuals whose spell information is left-censored are less likely to enter poverty. This finding is not surprising as persons whose non-poverty spells are left-censored likely have a longer non-poverty spell than what is observed in the data.
Likelihood of Entering Poverty if Event Occurs: From these multivariate estimates we calculate the overall likelihood of entering poverty if an individual experiences a particular event (not shown in table).(12) Recall from our descriptive analysis that the average likelihood of entering poverty in a year is 3.4 percent. The multivariate results suggest that the likelihood of entering poverty is higher for persons living in households with an employment loss, a shift in household composition, and the onset of a disability. The likelihood of entering poverty is highest, all else equal, for persons living in households with a head who loses employment, 16.7 percent, which is significantly higher than the average entry likelihood of 3.4 percent. The likelihood of entering poverty if one shifts from two-adult to female-headed household is slightly lower at 15.3 percent. If the spouse loses employment, another household member loses employment, or the head becomes disabled the likelihood of entering poverty is 8.9 percent, 7.2 percent, and 5.8 percent, respectively. For the two remaining household composition shifts—child under age six enters household and young adult sets up own household—the likelihood of entering poverty if these events occur are 5.8 percent and 4.6 percent, respectively.
Short and Long Poverty Spells: The relationship between the trigger events and poverty entries may differ for persons entering short and long poverty spells, so we examine them separately. For example, a young adult who sets up his or her own household may enter a short poverty spell, but not a long poverty spell. A short poverty spell is defined as lasting four or less years and a long spell as lasting five or more years. It is not possible, however, to categorize every poverty spell as either short or long. The problem arises because some poverty spells have an observed duration of four or less years but the true duration is unknown because the end of the poverty spell is not observed (i.e., the spell is censored). In this case, the true length of the spell could be more than four years, and since it is not known whether it is a short or long spell, these spells are not included in either group. This categorization and elimination of censored spells results in 9,039 person-year observations in the analysis of entries into short poverty spells and 3,537 person-year observations in the analysis of entries into long poverty spells.(46)
Looking at the results for short and long spells, one general pattern emerges—fewer events are associated with entries into long poverty spells than short poverty spells. This lower level of statistical significance could, in part, be due to the smaller sample that these models are estimated on.
The only household composition trigger event significantly related to entries into short and long poverty spells is a shift from a two-adult to a female-headed household (Table 6, columns 2 and 3). Among those who experience a short spell of poverty, the probability of entering poverty increases by 26.6 percentage points if this household shift occurs. For those individuals who experience a long spell of poverty, the probability of entering poverty increases by 22.5 percentage points if the household shifts from two-adult to female-headed.
The employment loss of the household head and other household members are associated with higher probabilities of poverty entry for both groups, and these probabilities are similar. For both groups, employment of the head is the most important employment shift. The employment loss of the spouse is related only to entries into short poverty spells, not long poverty spells. We find no significant relationship between changes in the disability status of household heads and entries into long or short poverty spells. In addition, changes in the unemployment rate and in GDP are not found to affect entries into either short or long poverty spells.
SIPP: Even though the SIPP analysis examines monthly poverty entries and the PSID examines yearly poverty entries, the SIPP and PSID results are quite similar. This multivariate analysis of poverty entry with SIPP data confirms many of the PSID findings. Similar to the PSID entry results, we find that the loss of employment among family members is the event most related to poverty entries. Results from the 1996 SIPP panel analysis are presented first, and then are compared with findings from 1988-90 SIPP panels.
The 1996 SIPP results suggest that many of the entry trigger events are significantly related to individuals’ likelihood of entering poverty (Table 7). Employment losses are identified as the event most often associated with poverty entries. This is not, however, followed by shifts from two-adult to female-headed households, as in the PSID analysis. The next most important event is the entry of a child under age six into the household, followed by the onset of a disability of the household head and then a shift in household structure.
Loss of employment by the household head has the largest impact on poverty entry. The likelihood of entering poverty is higher by 12.3 percentage points for individuals living in a household where the household head stops working.(14) Losses of employment by the spouse and other family members have smaller, yet significant, effects: 6.0 percentage points for the spouse and 5.3 percentage points for others in the household. The percentages from the PSID analysis are quite similar—the likelihood of entering poverty increases by 13.3 percentage points if the head loses employment, 5 percentage points if the spouse loses employment, and 3.8 percentage points if another household member loses employment.
| Explanatory Variables | 1988 & 1990 Panels | 1996 Panel |
|---|---|---|
| Entry Trigger Events (at t and lagged) | ||
| Change in Household Composition | ||
| Child under age 6 enters household, t | 1.349 | 1.311 |
| (0.140)** | (0.114)** | |
| [0-1] | [0.025] | [0.027] |
| Child under age 6 enters household, t-1 | 0.342 | 0.261 |
| (0.116)** | (0.104)* | |
| [0-1] | [0.004] | [0.003] |
| Child under age 6 enters household, t-2 | 0.395 | 0.297 |
| (0.116)** | (0.097)** | |
| [0-1] | [0.005] | [0.004] |
| Child under age 6 enters household, t-3 | 0.066 | 0.318 |
| -0.138 | (0.101)** | |
| [0-1] | [0.001] | [0.004] |
| Child under age 6 enters household, t-4 | 0.235 | 0.168 |
| -0.136 | -0.096 | |
| [0-1] | [0.003] | [0.002] |
| Two-adult becomes female-headed household, t | 2.52 | 0.817 |
| (0.159)** | (0.153)** | |
| [0-1] | [0.083] | [0.013] |
| Two-adult becomes female-headed household, t-1 | 0.456 | 0.135 |
| (0.209)* | -0.194 | |
| [0-1] | [0.006] | [0.002] |
| Two-adult becomes female-headed household, t-2 | 0.141 | 0.237 |
| -0.216 | -0.186 | |
| [0.001] | [0.003] | |
| Two-adult becomes female-headed household, t-3 | 0.26 | 0.309 |
| -0.237 | -0.187 | |
| [0-1] | [0.003] | [0.004] |
| Two-adult becomes female-headed household, t-4 | 0.123 | 0.03 |
| -0.262 | -0.186 | |
| [0-1] | [0.001] | [0.000] |
| Change in Labor Supply | ||
| Loss of employment, head, t | 2.639 | 2.796 |
| (0.085)** | (0.052)** | |
| [0-1] | [0.090] | [0.111] |
| Loss of employment, head, t-1 | 0.747 | 0.704 |
| (0.114)** | (0.067)** | |
| [0-1] | [0.010] | [0.011] |
| Loss of employment, head, t-2 | 0.008 | 0.217 |
| -0.128 | (0.067)** | |
| [0-1] | [0.000] | [0.003] |
| Loss of employment, head, t-3 | -0.133 | -0.148 |
| -0.138 | (0.071)* | |
| [0-1] | [-0.001] | [-0.002] |
| Loss of employment, head, t-4 | 0.123 | 0.07 |
| -0.134 | 0.063 | |
| [0-1] | [0.001] | [0.001] |
| Loss of employment, spouse, t | 0.797 | 1.886 |
| (0.118)** | (0.076)** | |
| [0-1] | [0.011] | [0.049] |
| Loss of employment, spouse, t-1 | 0.1 | 0.52 |
| -0.091 | (0.081)** | |
| [0-1] | [0.001] | [0.007] |
| Loss of employment, spouse, t-2 | -0.002 | 0.164 |
| -0.108 | (0.082)* | |
| [0-1] | [-0.000] | [0.002] |
| Loss of employment, spouse, t-3 | 0.003 | 0.048 |
| -0.116 | -0.085 | |
| [0-1] | [0.000] | [0.001] |
| Loss of employment, spouse, t-4 | -0.067 | 0.162 |
| -0.128 | (0.077)* | |
| [0-1] | [-0.001] | [0.002] |
| Loss of employment, others in household, t | 1.329 | 1.878 |
| (0.103)** | (0.052)** | |
| [0-1] | [0.024] | [0.048] |
| Loss of employment, others in household, t-1 | 0.093 | 0.348 |
| -0.084 | (0.062)** | |
| [0-1] | [0.001] | [0.005] |
| Loss of employment, others in household, t-2 | 0.056 | 0.112 |
| -0.085 | -0.065 | |
| [0-1] | [0.001] | [0.001] |
| Loss of employment, others in household, t-3 | 0.064 | 0.054 |
| -0.086 | -0.061 | |
| [0-1] | [0.001] | [0.001] |
| Loss of employment, others in household, t-4 | -0.05 | 0.008 |
| -0.108 | -0.063 | |
| [0-1] | [-0.000] | [0.000] |
| Change in Disability Status | ||
| Head becomes disabled, t | 0.124 | 1.017 |
| -0.132 | (0.102)** | |
| [0-1] | [0.001] | [0.018] |
| Head becomes disabled, t-1 | 0.049 | -0.618 |
| -0.1 | (0.113)** | |
| [0-1] | [0.000] | [-0.005] |
| Head becomes disabled, t-2 | -0.044 | 0.302 |
| -0.102 | (0.082)** | |
| [0-1] | [-0.000] | [0.004] |
| Head becomes disabled, t-3 | 0.236 | 0.261 |
| (0.104)* | (0.080)** | |
| [0-1] | [0.003] | [0.003] |
| Head becomes disabled, t-4 | 0.172 | 0.068 |
| -0.14 | -0.078 | |
| [0-1] | [0.002] | [0.001] |
| Change in Economic Status | ||
| Change in state unemployment rate, t | 0.089 | -0.011 |
| (0.033)** | -0.033 | |
| [0-0.5] | [0.000] | [-0.000] |
| Change in state unemployment rate, t-1 | -0.054 | -0.059 |
| -0.042 | -0.035 | |
| [0-0.5] | [-0.000] | [-0.000] |
| Change in state unemployment rate, t-2 | -0.062 | -0.079 |
| -0.049 | (0.031)* | |
| [0-0.5] | [-0.000] | [-0.000] |
| Change in state unemployment rate, t-3 | -0.143 | -0.042 |
| (0.044)** | -0.031 | |
| [0-0.5] | [-0.001] | [-0.000] |
| Change in GDP, t (in billions) | 0 | 0 |
| 0 | 0 | |
| [0-180] | [0.000] | [-0.001] |
| Change in GDP, t-1 (in billions) | 0.004 | 0 |
| (0.001)** | 0 | |
| [0-180] | [0.008] | [-0.000] |
| Change in GDP, t-2 (in billions) | -0.001 | 0.001 |
| -0.001 | (0.000)** | |
| [0-180] | [-0.002] | [0.002] |
| Change in GDP, t-3 (in billions) | 0 | 0 |
| -0.001 | 0 | |
| [0-180] | [0.000] | [-0.000] |
| Demographic Characteristics of Household Head | ||
| Age: | ||
| Less than 25 | 0.544 | 0.259 |
| (0.054)** | (0.048)** | |
| [0-1] | [0.007] | [0.003] |
| Greater than or equal to 55 | -0.41 | -0.215 |
| (0.046)** | (0.036)** | |
| [0-1] | [-0.004] | [-0.002] |
| Race: | ||
| Hispanic | 0.474 | 0.261 |
| (0.051)** | (0.043)** | |
| [0-1] | [0.006] | [0.003] |
| Black | 0.464 | 0.3 |
| (0.050)** | (0.037)** | |
| [0-1] | [0.005] | [0.004] |
| Educational attainment: | ||
| Equal to high school | -0.444 | -0.363 |
| (0.042)** | (0.036)** | |
| [0-1] | [-0.004] | [-0.004] |
| More than high school | -0.755 | -0.582 |
| (0.044)** | (0.037)** | |
| [0-1] | [-0.007] | [-0.007] |
| Household Composition | ||
| Female-headed household for two or more years | 0.276 | 0.504 |
| (0.059)** | (0.033)** | |
| [0-1] | [0.003] | [0.007] |
| Number of adults (less head and wife) | -0.242 | -0.238 |
| (0.025)** | (0.024)** | |
| [0-1] | [-0.003] | [-0.003] |
| Number of children | 0.144 | 0.117 |
| (less children that enter at t and t-1) | (0.016)** | (0.011)** |
| [0-1] | [0.001] | [0.001] |
| Geographic Characteristics | ||
| Region at t-1: | ||
| Northeast | -0.154 | -0.031 |
| (0.048)** | -0.037 | |
| [0-1] | [-0.001] | [-0.000] |
| Midwest | -0.053 | -0.06 |
| -0.042 | -0.036 | |
| [0-1] | [-0.001] | [-0.001] |
| West | -0.029 | -0.077 |
| -0.044 | (0.038)* | |
| [0-1] | [-0.000] | [-0.001] |
| Urban area | ||
| MSA | -0.265 | -0.256 |
| (0.037)** | (0.032)** | |
| [0-1] | [-0.003] | [-0.003] |
| Economic Characteristics | ||
| State unemployment rate, t | 0.038 | 0.054 |
| (0.012)** | (0.015)** | |
| [0-0.5] | [0.000] | [0.000] |
| GDP, t (in ten billions) | -0.022 | 0.003 |
| -0.025 | -0.014 | |
| [0-180] | [-0.038] | [0.007] |
| Spell Information, Non-Poverty | ||
| Observed duration | ||
| 0 months | -3.289 | -7.82 |
| (0.114)** | (1.001)** | |
| 4-6 months | -0.7 | -0.603 |
| (0.061)** | (0.050)** | |
| 7-9 months | -0.714 | -0.46 |
| (0.068)** | (0.051)** | |
| 10-12 months | -1.027 | -0.887 |
| (0.080)** | (0.057)** | |
| 13-15 months | -1.327 | -1.059 |
| (0.093)** | (0.056)** | |
| 16-18 months | -1.762 | -1.633 |
| (0.101)** | (0.068)** | |
| 19-21 months | -1.151 | -1.145 |
| (0.093)** | (0.061)** | |
| 22-24 months | -1.49 | -1.227 |
| (0.105)** | (0.068)** | |
| 25-27 months | -1.455 | -1.459 |
| (0.124)** | (0.075)** | |
| 28 or more months | -1.836 | -1.638 |
| (0.143)** | (0.063)** | |
| Other | ||
| Left-censored spell | -1.474 | -0.947 |
| (0.053)** | (0.040)** | |
| Number of previous spells (observed) | -0.394 | -0.016 |
| (0.049)** | -0.027 | |
| Year at t-1 | ||
| 1990 Panel | 0.355 | |
| (0.083)** | ||
| 1998 | 0.084 | |
| -0.054 | ||
| 1999 | 0.034 | |
| -0.099 | ||
| Sample size | 2,034,658 | 2,211,724 |
| Notes: a) * denotes statistical significance at the 5 percent level; ** denotes statistical significance at the 1 percent level. b) Standard errors are in parenthesis. The numbers in brackets are the simulated percentage point change in the likelihood of entering poverty when the explanatory variable changes by the value indicated in the column labeled "Explanatory Variables" (typically from 0 to 1 [0-1]). |
||
Having a child under age six enter the household increases the likelihood of entering poverty by 3.8 percentage points, which is similar to the 2.4 percentage point increase found in the PSID analysis. Our second household composition trigger event has a substantially smaller relationship with poverty entries. Shifting from a two-adult to a female-headed household is found to increase the likelihood of entering poverty by only 1.3 percentage points, which is considerably smaller than the 11.9 percentage point increase found in our analysis of PSID data.
Changes Over Time: The SIPP results suggest that over the 1988-92 (i.e., 1988/1990 SIPP panels) to 1997-99 (i.e., 1996 SIPP panel) time period, shifts from two-adult to female-headed households—measured while controlling for shifts in employment—became less important in individuals' poverty entries.(48) Shifting from a two-adult to a female-headed household is important in the both periods, but is found to increase the likelihood of entering poverty by 8.9 percentage points in the 1988-92 period and only 1.3 percentage points in the 1997-99 period. Because changes in household structure are often associated with changes in employment, we estimated a second set of models that exclude employment changes (not shown). The results from these models show a similar relationship between poverty entries and household structure shifts in the 1988-92 and 1997-99 periods. One possible explanation for this pattern is that in the latter period changes in household structure are operating through employment to a greater extent than in the earlier period. Our analysis also suggests that the loss of employment became more important in individuals' poverty entries over this time period, particularly the employment of the spouse and other household members. For example, the loss of employment by the spouse increased the likelihood of entering poverty by 1.1 percentage points in the 1988-92 period, while the same employment loss increased the likelihood of entering poverty by 6.0 percentage points in the 1997-99 period.
Similar to the PSID results, many of the model’s control variables help to explain poverty entry. Race and educational attainment are both important. One difference is the relationship between age and poverty exits. In both SIPP analyses, we find that individuals in households headed by older adults (age 55 or older) are less likely to enter poverty, which differs from our PSID finding, but is consistent with a similar finding by Naifeh (1998), also using SIPP data (p. 70-63).
Like our PSID findings, we find that household composition also plays a role in poverty entry in the SIPP analyses. Persons in households that have been female-headed for two or more years are more likely to enter poverty than persons in two-adult and single male-headed households. The number of adults in the household and the presence of dependent children in the household also affects poverty entries—the likelihood of entering poverty decreases with the number of adults and increases with the number of children in the household.
Consistent with our findings from the PSID analysis, we find that individuals who live in metropolitan areas are less likely to enter poverty. Finally, the results suggest that economic conditions matter. An increase in the state unemployment rate is found to increase individuals' likelihood of entering poverty in both SIPP models. Again, we find that the duration of the poverty spell matters. The longer individuals are out of poverty the less likely they are to enter poverty.
Likelihood of Entering Poverty if Event Occurs: Again, the coefficients from the multivariate models are used to calculate the overall likelihood of entering poverty if an individual experiences a particular event (not shown in table).(16) The descriptive analysis shows that the average likelihood of entering poverty in a month is 1.1 percent in the 1988-92 period and 1.3 percent in the 1997-99 period. In the 1997-99 period, employment loses dominate the other events and are more likely to lead to a poverty entry. The likelihood of entering poverty in a month is 13.6 percent if the head loses employment, 7.3 percent if the spouse losses employment, and 6.6 percent if another family member loses employment—significantly higher than the average entry likelihood of 1.3 percent. In the 1988-92 period, these probabilities are somewhat lower: 11.1 percent, 2.2 percent, and 3.5 percent, respectively. As mentioned above, the most significant difference between the 1988-92 and 1997-99 period is the estimated relationship between household composition shifts and poverty entries. The likelihood of entering poverty if the household shifts from two-adult to female-headed (controlling for employment changes in the model) is 10.0 percent in the 1988-92 period, and is 2.6 percent in the 1997-99 period. If a child under age six enters the household, the likelihood of entering poverty is roughly 5 percent in both the 1988-92 and 1997-99 periods.
Poverty Exits
PSID: Similar to the poverty entry model, individuals experiencing many of the trigger events are significantly more likely to exit poverty, even after controlling for other events, demographic characteristics, and economic conditions (Table 8, column 1). Like our examination of poverty entries, the results suggest that shifts in employment are the most important events followed by shifts in household structure. These differ from our descriptive results which identified shifts in household structure as more important than shifts in employment. As discussed above, the events included in the poverty exit models differ somewhat from those included in the poverty entry models. A shift in household structure—from a female-headed to a two-adult household—is the only family composition trigger event included in the poverty exit models and we allow a change in educational attainment to affect exits.
We find that individuals living in households that shift from female-headed to two-adult headed are more likely to exit poverty than those who do not experience the shift. This impact is immediate—a shift last year (t-1) is not related to poverty exits this year (t). The likelihood of exiting poverty is higher by 12.4 percentage points if an individual experiences this event. In terms of employment transition events, the employment gain of a spouse is the most important, followed by another household member and then the household head. The likelihood of exiting poverty is higher by a total of 29.4 percentage points if the spouse gains employment, 15.0 percentage points if another household member gains employment, and 7.3 percentage points if the head gains employment.
| Explanatory Variables | All | Poverty spell of four or less years |
Poverty spell of more than four years |
|---|---|---|---|
| Exit Trigger Events (at t and lagged) | |||
| Change in Household Composition | |||
| Female-headed becomes two-adult household, t | 0.632 | 0.662 | 0.352 |
| (0.325)* | -0.61 | -0.694 | |
| [0-1] | [0.124] | [0.089] | [0.047] |
| Female-headed becomes two-adult household, t-1 | -0.309 | -0.523 | -1.588 |
| -0.22 | -0.585 | (0.638)* | |
| [0-1] | [-0.056] | [-0.073] | [-0.119] |
| Change in Labor Supply | |||
| Gain of employment, head, t | 0.379 | 0.571 | 0.732 |
| (0.110)** | (0.206)** | (0.264)** | |
| [0-1] | [0.073] | [0.078] | [0.105] |
| Gain of employment, head, t-1 | -0.024 | 0.083 | 0.076 |
| -0.125 | -0.225 | -0.301 | |
| [0-1] | [-0.004] | [0.012] | [0.009] |
| Gain of employment, spouse, t | 1.082 | 0.709 | 1.28 |
| (0.144)** | (0.250)** | (0.440)** | |
| [0-1] | [0.217] | [0.096] | [0.209] |
| Gain of employment, spouse, t-1 | 0.397 | 0.194 | 0.71 |
| (0.178)* | -0.346 | -0.44 | |
| [0-1] | [0.077] | [0.027] | [0.103] |
| Gain of employment, others in household, t | 0.764 | 0.58 | 0.632 |
| (0.131)** | (0.252)* | (0.290)* | |
| [0-1] | [0.150] | [0.079] | [0.088] |
| Gain of employment, others in household, t-1 | 0.282 | -0.015 | 1.013 |
| -0.158 | -0.269 | (0.370)** | |
| [0-1] | [0.054] | [-0.002] | [0.152] |
| Change in Disability Status | |||
| Head ceases to be disabled, t | 0.087 | 0.129 | 0.072 |
| -0.105 | -0.235 | -0.272 | |
| [0-1] | [0.016] | [0.018] | [0.009] |
| Head ceases to be disabled, t-1 | -0.136 | -0.120 | -0.052 |
| -0.113 | -0.238 | -0.294 | |
| [0-1] | [-0.025] | [-0.017] | [-0.006] |
| Change in Education Status | |||
| Head graduated high school, t | 0.583 | 1.605 | |
| -0.386 | (0.782)* | ||
| [0-1] | [0.114] | [0.185] | |
| Head graduated high school, t-1 | -0.429 | -0.999 | |
| -0.357 | -0.557 | ||
| [0-1] | [-0.076] | [-0.137] | |
| Head education increase to high school, t or t-1, accompanied by household shift | -0.302 | -0.633 | |
| -0.208 | -0.411 | ||
| [0-1] | [-0.055] | [-0.089] | |
| Head received advanced degree (associates | 0.375 | 0.605 | |
| degree or higher), t | -0.575 | -0.766 | |
| [0-1] | [0.072] | [0.089] | |
| Head received advanced degree (associates | 0.7 | 0.907 | |
| degree or higher), t-1 | -0.522 | -1.087 | |
| [0-1] | [0.137] | [0.117] | |
| Head education increase beyond high school | 0.256 | -0.661 | |
| degree, t or t-1, but due to household shift | -0.377 | -0.649 | |
| [0-1] | [0.049] | [-0.092] | |
| Change in Economic Status | |||
| Change in state unemployment rate, t | 0.003 | -0.058 | -0.018 |
| -0.036 | -0.074 | -0.105 | |
| [0-0.5] | [0.000] | [-0.004] | [-0.001] |
| Change in state unemployment rate, t-1 | -0.015 | -0.101 | -0.163 |
| -0.035 | -0.072 | -0.102 | |
| [0-0.5] | [-0.001] | [-0.007] | [-0.010] |
| Change in GDP, t (in billions) | 0.001 | -0.000 | 0.002 |
| 0 | -0.001 | -0.001 | |
| [0-180] | [0.026] | [-0.004] | [0.036] |
| Change in GDP, t-1 (in billions) | 0.001 | -0.001 | -0.001 |
| 0 | -0.001 | -0.001 | |
| [0-180] | [0.020] | [-0.032] | [-0.016] |
| Demographic Characteristics of Household Head | |||
| Age: | |||
| Less than 25 | -0.213 | 0.171 | 0.426 |
| (0.088)* | -0.177 | -0.274 | |
| [0-1] | [-0.039] | [0.024] | [0.057] |
| Greater than or equal to 55 | 0.196 | 0.469 | 0.29 |
| (0.092)* | (0.208)* | -0.25 | |
| [0-1] | [0.037] | [0.065] | [0.037] |
| Race: | |||
| Black | -0.306 | 0.048 | -0.262 |
| (0.074)** | -0.155 | -0.21 | |
| [0-1] | [-0.058] | [0.007] | [-0.032] |
| Educational attainment: | |||
| Graduate high school two or more years ago | 0.442 | 0.193 | 0.094 |
| (0.080)** | -0.163 | -0.248 | |
| [0-1] | [0.084] | [0.027] | [0.012] |
| Received an associates degree or higher two or | 0.596 | 0.045 | 0.268 |
| more years ago | (0.093)** | -0.186 | -0.29 |
| [0-1] | [0.116] | [0.006] | [0.035] |
| Household Composition | |||
| Female-headed household for two or more years | -0.504 | -0.415 | -0.655 |
| (0.076)** | (0.155)** | (0.267)* | |
| [0-1] | [-0.096] | [-0.059] | [-0.084] |
| Single male-headed household | -0.318 | -0.082 | -0.43 |
| (0.095)** | -0.208 | -0.322 | |
| [0-1] | [-0.058] | [-0.012] | [-0.047] |
| Number of adults (less head and wife) | 0.197 | 0.274 | 0.128 |
| (0.044)** | (0.101)** | -0.09 | |
| [0-1] | [0.037] | [0.038] | [0.016] |
| Number of children (less children who enter at t and t-1) | -0.231 | -0.094 | -0.18 |
| (0.029)** | -0.058 | (0.069)** | |
| [0-1] | [-0.046] | [-0.013] | [-0.025] |
| Geographic Characteristics | |||
| Region: | |||
| Northeast | 0.061 | 0.064 | 0.038 |
| -0.103 | -0.206 | -0.329 | |
| [0-1] | [0.011] | [0.009] | [0.005] |
| Midwest | 0.022 | -0.024 | 0.006 |
| -0.079 | -0.167 | -0.217 | |
| [0-1] | [0.004] | [-0.003] | [0.001] |
| West | 0.201 | 0.379 | -0.075 |
| -0.116 | -0.243 | -0.447 | |
| [0-1] | [0.038] | [0.052] | [-0.009] |
| Pacifica | 0.039 | 4.845 | -- |
| -0.746 | (0.957)** | -- | |
| [0-1] | [0.007] | [0.292] | -- |
| Urban area: | |||
| MSA | 0.083 | 0.168 | 0.303 |
| -0.071 | -0.145 | -0.226 | |
| [0-1] | [0.015] | [0.024] | [0.037] |
| Economic Characteristics | |||
| State unemployment rate, t | -0.048 | -0.115 | -0.159 |
| (0.018)** | (0.036)** | (0.052)** | |
| [0-0.5] | [-0.005] | [-0.007] | [-0.016] |
| GDP, t (in ten billions) | -0.026 | -0.042 | -0.077 |
| (0.011)* | (0.021)* | (0.031)* | |
| [0-180] | [-0.621] | [0.569] | [-0.920] |
| Spell Information, Non-Poverty | |||
| Observed duration | |||
| 1 year | -0.571 | 8.465 | |
| (0.085)** | (0.728)** | ||
| 2 years | -1.008 | 8.141 | |
| (0.109)** | (0.736)** | ||
| 3 years | -1.103 | 8.778 | |
| (0.125)** | (0.749)** | ||
| 4 years | -1.224 | ||
| (0.163)** | |||
| 5 years | -1.413 | ||
| (0.200)** | |||
| 6 years | -0.996 | 0.576 | |
| (0.236)** | (0.287)* | ||
| 7 years | -1.016 | 0.45 | |
| (0.241)** | -0.306 | ||
| 8 years | -1.547 | -0.107 | |
| (0.264)** | -0.347 | ||
| 9 years or more years | -1.656 | 0.051 | |
| (0.172)** | -0.287 | ||
| Other | |||
| Left-censored spell | -0.239 | -0.049 | |
| (0.117)* | -0.218 | ||
| Number of previous spells (observed) | -0.14 | -0.254 | 0.182 |
| (0.038)** | (0.074)** | -0.133 | |
| Year | |||
| 1980-1989 | 0.209 | 0.605 | -0.719 |
| -0.151 | (0.298)* | -0 | |
| 1990-1996 | 0.632 | 1.373 | -- |
| (0.278)* | (0.533)* | -- | |
| Sample size | 35,445 | 9,039 | 7,534 |
| Notes: a) The variable for Pacific was dropped from the models in column 3 because too few people were identified as living in the Pacific region. b) * denotes statistical significance at the 5 percent level; ** denotes statistical significance at the 1 percent level. c) Standard errors are in parenthesis. The numbers in brackets are the simulated percentage point change in the likelihood of exiting poverty when the explanatory variable changes by the value indicated in the column labeled "Explanatory Variables" (typically from 0 to 1 [0-1]). |
|||
While individuals living with a household head who becomes disabled are more likely to enter poverty, individuals who live with a household head who ceases to be disabled are not more likely to exit poverty. We also examine whether a change in educational attainment is related to the probability of exiting poverty, but find no relationship.(50)
Many of the model’s control variables help to explain poverty exits. Characteristics of the head including his/her age, race, and educational attainment are related to poverty exits. Persons living in a household headed by individuals under age 25 are less likely to exit poverty than persons whose household head is age 25 to 54. Surprisingly, the results suggest that individuals who live in a household headed by an older person, over age 54, are more likely to exit poverty. This is counter to Stevens’ (1999) finding that persons over age 54 are less likely to exit poverty than those age 25 to 54. Our findings on race and educational attainment are, however, consistent with the literature. We find that persons living in households headed by black individuals are less likely to exit poverty than persons living in households headed by non-black individuals (Eller 1996, Naifeh 1998, and Stevens 1999). Like Stevens (1999), we find that higher educational attainment is associated with a higher probability of exiting poverty.
Household composition also plays a role in poverty exits. Persons in households that have been female-headed for two or more years, as well as persons in single male-headed households, are less likely to exit poverty than persons in two-adult households. The presence of dependent children in the household is also related to poverty exits—the likelihood of exiting poverty is lower for individuals in households with more children. We also find that individuals who live in metropolitan areas are more likely to exit poverty, which may be due to the fact that there tends to be more employment opportunities in metropolitan areas as compared to non-metropolitan and rural areas. The level of the state unemployment rate also matters, although GDP does not significantly affect poverty exits. Facing a high unemployment rate decreases the likelihood of exiting poverty.
We also find that the poverty spell information matters. Persons who have previously experienced a poverty spell are less likely to exit poverty than persons who are experiencing their first poverty spell. And, persons with long poverty spells are less likely to exit poverty than persons with short poverty spells.
Likelihood of Exiting Poverty if Event Occurs: As with the poverty entry models, coefficients from the multivariate analysis are used to calculate the overall likelihood of exiting poverty if an individual experiences a particular event (not shown in table).(51) First, recall from the descriptive analysis that the average likelihood of exiting poverty in a year is 35.8 percent. The multivariate results suggest that the likelihood of exiting poverty is above average for persons living in households with a gain in employment (of the head, spouse, or others) and those living in households that shift from female-headed to two-adult headed. The likelihood of exiting poverty in a year is 65.2 percent if the spouse gains employment, 50.8 percent if another household member gains employment, and 43.1 percent if the head gains employment—significantly higher than the average exit likelihood of 35.8 percent. For persons living in a household that shifts from female-headed to two-adult headed, the likelihood of exiting poverty in a year is 48.2 percent. Individuals in a household where the head increases his/her educational attainment or ceases to be disabled are no more or less likely to exit poverty than those individuals who do not experienced the event.
Short and Long Poverty Spells: Next, we examine whether the exit trigger events differentially affect individuals exiting “long” versus “short” poverty spells. We again define a short poverty spell as one that lasts four or less years and a long spell as one that lasts five or more years. As mentioned in the discussion of poverty entries, some poverty spells cannot be identified as short or long because the full spell is not observed. If the beginning or the end of a one to four year spell is not observed (i.e., the spell is left censored—the beginning of the spell is not observed, or right censored—the end of the spell is not observed), the spell is not categorized as either long or short. The true length of these censored poverty spells could be more than four years, so they are omitted. This categorization and elimination of censored spells results in 9,039 person-year observations in the analysis of short poverty spells and 7,534 person-year observations in the analysis of long poverty spells.
Like the model estimated on the full sample, the short and long poverty spell results suggest that poverty exits are more strongly related to employment gains than shifts in household structure. In fact, individuals in households that shift from female-headed to two-adult headed are no more likely than their counterparts who did not experience the event to exit a short poverty spell (Table 6, column 2). Further, this household structure shift is negatively related to the likelihood of exiting long poverty spells, an unanticipated sign (Table 6, column 3).
Employment gains by the household head, spouse, and other household members are associated with higher probabilities of exiting poverty for both groups, although more important for persons exiting long versus short poverty spells. For example, the probability of exiting poverty if the spouse gains employment is higher by 20.9 percentage points for individuals exiting long poverty spells but is higher by only 9.6 percentage points for individuals exiting short poverty spells.
Like the model estimated on the full sample, living with a household head who ceases to be disabled is not related to exits from long or short poverty spells. In terms of educational gains, individuals in households where the head completed high school are more likely to exit a short poverty spell—their probability of exiting poverty increases by a total of 18.4 percentage points. We do not include changes in educational attainment in our examination of exits from long poverty spells because very few household heads in the midst of a long poverty spell had a change in educational attainment. Finally, we find that neither economic change variable—change in unemployment or GDP—affects exits from short or long poverty spells.
SIPP: Again, individuals experiencing many of our trigger events are substantially more likely to exit poverty. This SIPP analysis shows the importance of employment gains in individuals' exits from poverty, but employment gains do not dominate the other events in the SIPP analysis as they do in the PSID analysis. So, while the SIPP results are similar to the PSID, there are differences. When comparing the SIPP and PSID results, it is important to keep in mind that the SIPP analysis examines monthly poverty exits and the PSID examines yearly poverty exits. Results from the 1996 SIPP panel analysis are presented first, and then are compared with findings from 1988/1990 SIPP panels.
The 1996 SIPP results suggest that employment gains are most often associated with exits from poverty. This, however, is not followed by shifts from female-headed to two-adult households as in the PSID analysis. Instead, we find that increases in educational attainment—completing a high school or higher-level degree—is the next most important event, followed then by shifts in household structure, and then changes in disability status.
Employment gains by the head, spouse, and other household members are of roughly equal importance in helping individuals exit poverty. The likelihood of exiting poverty in a month is higher by a total of 28.3 percentage points if the head gains employment, 28.4 percentage points if the spouse gains employment, and 29.6 percentage points if another household member gains employment (Table 9, column 2).(52, 53) Increases in educational attainment have a similarly large impact on the likelihood of exiting poverty. An individual’s likelihood of exiting poverty is higher by a total of 27.0 percentage points if the household head receives an advanced degree (associate’s degree or higher). If the household head receives a high school degree, the likelihood of exiting poverty is higher by a smaller, yet substantial 7.4 percentage points. This increased likelihood of exiting poverty upon completing a schooling degree may be due to the higher wages individuals generally command with higher levels of education, as well as increased hours of work which may coincide with the completion of school. The PSID analysis finds no statistically significant relationship between changes in educational attainment and poverty exits for the full sample (Table 8, column 1), but the results do suggest that completing a high school degree increases the likelihood of exiting a short poverty spell by 18.4 percentage points (Table 8, column 2). Identifying a relationship between school completion and poverty exits may be easier with the monthly SIPP data than the annual PSID. If individuals tend to complete school in the middle of the year (say, May or June), then the effect of completing school may get clouded in the annual PSID measure, but would not be clouded in the monthly SIPP data.
| Explanatory Variables | 1988 & 1990 Panels | 1996 Panel |
|---|---|---|
| Exit Trigger Events (at t and lagged) | ||
| Change in Household Composition | ||
| Female-headed becomes two-adult household, t | 2.295 | 0.847 |
| (0.259)** | (0.173)** | |
| [0-1] | [0.351] | [0.078] |
| Female-headed becomes two-adult household, t-1 | -0.652 | -0.121 |
| (0.256)* | -0.196 | |
| [0-1] | [-0.046] | [-0.008] |
| Female-headed becomes two-adult household, t-2 | -0.868 | -0.051 |
| (0.312)** | -0.217 | |
| [0-1] | [-0.056] | [-0.004] |
| Female-headed becomes two-adult household, t-3 | -0.057 | 0.244 |
| -0.289 | -0.197 | |
| [0-1] | [-0.005] | [0.019] |
| Female-headed becomes two-adult household, t-4 | 0.045 | -0.496 |
| -0.272 | (0.184)** | |
| [0-1] | [0.004] | [-0.030] |
| Change in Labor Supply | ||
| Gain of employment, head, t | 1.120 | 1.818 |
| (0.090)** | (0.043)** | |
| [0-1] | [0.135] | [0.214] |
| Gain of employment, head, t-1 | 0.47 | 0.734 |
| (0.082)** | (0.047)** | |
| [0-1] | [0.047] | [0.064] |
| Gain of employment, head, t-2 | 0.195 | 0.225 |
| -0.103 | (0.055)** | |
| [0-1] | [0.018] | [0.017] |
| Gain of employment, head, t-3 | 0.031 | -0.183 |
| -0.094 | (0.062)** | |
| [0-1] | [0.003] | [-0.012] |
| Gain of employment, head, t-4 | -0.211 | -0.03 |
| -0.135 | -0.059 | |
| [0-1] | [-0.017] | [-0.002] |
| Gain of employment, spouse, t | 1.231 | 1.93 |
| (0.112)** | (0.072)** | |
| [0-1] | [0.153] | [0.235] |
| Gain of employment, spouse, t-1 | 0.367 | 0.584 |
| (0.095)** | (0.079)** | |
| [0-1] | [0.036] | [0.049] |
| Gain of employment, spouse, t-2 | 0.133 | -0.091 |
| -0.11 | -0.088 | |
| [0-1] | [0.012] | [-0.006] |
| Gain of employment, spouse, t-3 | -0.035 | 0.149 |
| -0.121 | -0.081 | |
| [0-1] | [-0.003] | [0.011] |
| Gain of employment, spouse, t-4 | -0.044 | 0.079 |
| -0.141 | -0.081 | |
| [0-1] | [-0.004] | [0.006] |
| Gain of employment, others in household, t | 1.531 | 1.965 |
| (0.090)** | (0.061)** | |
| [0-1] | [0.204] | [0.240] |
| Gain of employment, others in household, t-1 | 0.212 | 0.655 |
| (0.086)* | (0.061)** | |
| [0-1] | [0.020] | [0.056] |
| Gain of employment, others in household, t-2 | -0.032 | 0.086 |
| -0.090 | -0.066 | |
| [0-1] | [-0.003] | [0.006] |
| Gain of employment, others in household, t-3 | 0.045 | -0.092 |
| -0.09 | -0.064 | |
| [0-1] | [0.004] | [-0.006] |
| Gain of employment, others in household, t-4 | -0.058 | -0.113 |
| -0.132 | -0.066 | |
| [0-1] | [-0.005] | [-0.008] |
| Change in Disability Status | ||
| Head ceases to be disabled, t | 0.281 | 0.785 |
| -0.168 | (0.094)** | |
| [0-1] | [0.027] | [0.071] |
| Head ceases to be disabled, t-1 | -0.632 | -0.62 |
| (0.137)** | (0.087)** | |
| [0-1] | [-0.045] | [-0.036] |
| Head ceases to be disabled, t-2 | -0.343 | -0.04 |
| (0.157)* | -0.072 | |
| [0-1] | [-0.027] | [-0.003] |
| Head ceases to be disabled, t-3 | -0.154 | -0.023 |
| -0.19 | -0.074 | |
| [0-1] | [-0.013] | [-0.002] |
| Head ceases to be disabled, t-4 | 0.119 | -0.117 |
| -0.189 | -0.081 | |
| [0-1] | [0.011] | [-0.008] |
| Change in Education | ||
| Head graduated high school, t | 0.872 | 0.814 |
| (0.237)** | (0.195)** | |
| [0-1] | [0.099] | [0.074] |
| Head graduated high school, t-1 | -0.444 | -0.160 |
| -0.238 | -0.202 | |
| [0-1] | [-0.033] | [-0.011] |
| Head graduated high school, t-2 | 0.229 | 0.282 |
| -0.202 | -0.185 | |
| [0-1] | [0.021] | [0.022] |
| Head graduated high school, t-3 | 0.284 | -0.234 |
| -0.224 | -0.211 | |
| [0-1] | [0.027] | [-0.015] |
| Head graduated high school, t-4 | -0.086 | -0.176 |
| -0.296 | -0.211 | |
| [0-1] | [-0.007] | [-0.012] |
| Head education increase to high school, t to t-4, accompanied by household shift | -0.031 | -0.03 |
| -0.158 | -0.105 | |
| [0-1] | [-0.003] | [-0.002] |
| Head received advanced degree (associates degree or higher), t | 1.069 | 1.057 |
| (0.281)** | (0.260)** | |
| [0-1] | [0.128] | [0.104] |
| Head received advanced degree (associates degree or higher), t-1 | 0.273 | -0.011 |
| -0.256 | -0.224 | |
| [0-1] | [0.026] | [-0.001] |
| Head received advanced degree (associates degree or higher), t-2 | 0.672 | 0.459 |
| (0.310)* | (0.206)* | |
| [0-1] | [0.072] | [0.038] |
| Head received advanced degree (associates degree or higher), t-3 | 0.217 | 0.786 |
| -0.308 | (0.194)** | |
| [0-1] | [0.020] | [0.071] |
| Head received advanced degree (associates degree or higher), t-4 | 0.326 | 0.659 |
| -0.338 | (0.215)** | |
| [0-1] | [0.031] | [0.057] |
| Head education increase beyond high school degree, t to t-4, but due to household shift | 0.394 | 0.076 |
| -0.245 | -0.11 | |
| [0-1] | [0.039] | [0.006] |
| Change in Economic Status | ||
| Change in state unemployment rate, t | 0.077 | 0.038 |
| (0.030)* | -0.027 | |
| [0-0.5] | [0.003] | [0.001] |
| Change in state unemployment rate, t-1 | -0.047 | 0.008 |
| -0.038 | -0.029 | |
| [0-0.5] | [-0.002] | [0.000] |
| Change in state unemployment rate, t-2 | -0.109 | 0.022 |
| (0.046)* | -0.029 | |
| [0-0.5] | [-0.005] | [0.001] |
| Change in state unemployment rate, t-3 | -0.068 | 0.015 |
| -0.046 | -0.028 | |
| [0-0.5] | [-0.003] | [0.001] |
| Change in GDP, t (in billions) | 0.001 | 0 |
| (0.000)* | (0.000)** | |
| [0-180] | [0.014] | [-0.005] |
| Change in GDP, t-1 (in billions) | 0.005 | 0.001 |
| (0.001)** | (0.000)** | |
| [0-180] | [0.107] | [0.008] |
| Change in GDP, t-2 (in billions) | 0 | -0.001 |
| -0.001 | (0.000)** | |
| [0-180] | [-0.007] | [-0.007] |
| Change in GDP, t-3 (in billions) | -0.002 | -0.001 |
| (0.001)** | (0.000)** | |
| [0-180] | [-0.029] | [-0.009] |
| Demographic Characteristics of Household Head | ||
| Age: | ||
| Less than 25 | -0.197 | -0.260 |
| (0.056)** | (0.039)** | |
| [0-1] | [-0.016] | [-0.017] |
| Greater than or equal to 55 | -0.142 | -0.107 |
| (0.046)** | (0.028)** | |
| [0-1] | [-0.012] | [-0.007] |
| Race: | ||
| Hispanic | -0.214 | -0.100 |
| (0.051)** | (0.035)** | |
| [0-1] | [-0.014] | [-0.007] |
| Black | -0.463 | -0.196 |
| (0.053)** | (0.031)** | |
| [0-1] | [-0.037] | [-0.013] |
| Educational attainment: | ||
| Graduate high school more than one year ago | 0.384 | 0.212 |
| (0.067)** | (0.029)** | |
| [0-1] | [0.035] | [0.015] |
| Received an associates degree more than one year ago | 0.485 | 0.373 |
| (0.070)** | (0.029)** | |
| [0-1] | [0.046] | [0.028] |
| Household Composition | ||
| Female-headed household for two or more years | -0.393 | -0.274 |
| (0.062)** | (0.028)** | |
| [0-1] | [-0.032] | [-0.019] |
| Number of adults (less head and wife) | 0.304 | 0.152 |
| (0.026)** | (0.018)** | |
| [0-1] | [0.026] | [0.011] |
| Number of children (less children who enter at t and t-1) | -0.052 | -0.069 |
| (0.017)** | (0.009)** | |
| [0-1] | [-0.005] | [-0.005] |
| Geographic Characteristics | ||
| Region: | ||
| Northeast | -0.132 | 0.049 |
| (0.053)* | -0.032 | |
| [0-1] | [-0.011] | [0.004] |
| Midwest | -0.081 | -0.029 |
| -0.047 | -0.03 | |
| [0-1] | [-0.007] | [-0.002] |
| West | 0.030 | 0.079 |
| -0.049 | (0.034)** | |
| [0-1] | [0.003] | [0.006] |
| Urban area: | ||
| MSA | 0.039 | 0.04 |
| -0.039 | -0.026 | |
| [0-1] | [0.003] | [0.003] |
| Economic Characteristics | ||
| State unemployment rate, t | -0.085 | -0.06 |
| (0.013)** | (0.013)** | |
| [0-0.5] | [-0.005] | [-0.003] |
| GDP, t (in ten billions) | -0.117 | -0.015 |
| (0.024)** | -0.012 | |
| [0-180] | [-0.990] | [-0.195] |
| Spell Information, Non-Poverty | ||
| Observed duration | ||
| 0 months | -0.592 | -7.005 |
| (0.049)** | (0.474)** | |
| 4-6 months | -0.717 | -0.809 |
| (0.057)** | (0.034)** | |
| 7-9 months | -0.713 | -0.662 |
| (0.062)** | (0.041)** | |
| 10-12 months | -1.032 | -0.881 |
| (0.092)** | (0.048)** | |
| 13-15 months | -1.733 | -1.071 |
| (0.126)** | (0.057)** | |
| 16-18 months | -1.835 | -1.687 |
| (0.139)** | (0.079)** | |
| 19-21 months | -1.662 | -1.307 |
| (0.132)** | (0.080)** | |
| 22-24 months | -1.638 | -1.329 |
| (0.179)** | (0.091)** | |
| 25-27 months | -1.507 | -1.271 |
| (0.212)** | (0.095)** | |
| 28 or more months | -1.993 | -1.632 |
| (0.496)** | (0.071)** | |
| Other | ||
| Left-censored spell | -0.54 | -0.647 |
| (0.050)** | (0.034)** | |
| Number of previous spells (observed) | 0.071 | -0.14 |
| (0.025)** | (0.019)** | |
| Year | ||
| 1990 Panel | -0.555 | — |
| (0.073)** | — | |
| 1997 | — | 0.184 |
| — | (0.058)** | |
| 1998 | — | 0.271 |
| — | (0.091)** | |
| 1999 | — | 0.289 |
| — | (0.130)* | |
| Sample size | 272,639 | 517,902 |
| Notes: a) The variable for Pacific was dropped from the models in columns 2 and 3 because too few people were identified as living in the Pacific region. b) * denotes statistical significance at the 5 percent level; ** denotes statistical significance at the 1 percent level. c) Standard errors are in parenthesis. The numbers in brackets are the simulated percentage point change in the likelihood of exiting poverty when the explanatory variable changes by the value indicated in the column labeled "Explanatory Variables" (typically from 0 to 1 [0-1]). |
||
A shift in household structure, from a female-headed to a two-adult headed household, has the next largest effect, although this effect is considerably smaller—the likelihood of exiting poverty in a month is higher by only 4.8 percentage points. Findings with PSID data suggest that the likelihood of exiting poverty in a year is higher by 12.4 percentage points if the individual experiences this household shift. Individuals living in households whose head ceases to be disabled are also more likely to exit poverty (by 3.5 percentage points). We found no relationship between this event and poverty exits with the PSID data, although once again, it may be more difficult to pick up this relationship with the annual PSID data as compared to the monthly SIPP data. The final events examined are changes in economic conditions. The results suggest that changes in the state unemployment rate do not affect the likelihood of exiting poverty, but that higher state unemployment rates (i.e., the level variable, not the change variable) lower the likelihood of exiting poverty.(21) We also find that an increase in GDP reduces the likelihood of exiting poverty, an unanticipated sign.
Changes Over Time: Similar to the SIPP poverty entry models, a comparison of the 1988/1990 and 1996 SIPP panel results show some differences. The results suggest that over the 1988-92 (i.e., 1988/1990 SIPP panel) to 1996-99 (i.e., 1996 SIPP panel) time period, shifts from female-headed to two-adult headed households—measured while controlling for shifts in employment—became less important in individuals' poverty exits. With a shift from a female-headed to a two-adult household, an individual’s likelihood of exiting poverty in the 1988-92 period increased by 24.9 percentage points (Table 9, column 1),(22) whereas in the 1996-99 period it only increased by 4.8 percentage points (Table 9, column 2). Because changes in household structure are often associated with changes in employment, we estimated a second set of models that exclude employment changes (not shown). The results from these models show a similar relationship between poverty exits and household structure shifts in the 1988-92 and 1996-99 periods. One possible explanation for this pattern is that in the latter period changes in household structure are operating indirectly through employment to a greater extent than in the earlier period. Our analysis also suggests that employment gains became more important in individuals' poverty exits over this time period. An employment gain by someone in the household increased the likelihood of exiting poverty by 18 to 22 percentage points in the 1988-92 period, while the same employment gain increased the likelihood of exiting poverty by roughly 28 percentage points in the 1996-99 period.
The results suggest that the effect of increases in educational attainment are similar across the two periods, and receiving an advanced degree (associate’s degree or higher) is more important than receiving a high school degree. The relationship between economic conditions and poverty exits differs somewhat between the two time periods, although individuals who live in states with high unemployment rates are less likely to exit poverty in both periods. Unlike the 1996-99 period, changes in economic conditions are found to affect poverty exits in the 1988-92 period. The 1988-92 SIPP results suggest that increases in the unemployment rate reduced poverty exits and that increases in GDP increased poverty exits, both are the anticipated sign. The results suggest that an increase in the state unemployment rate by 0.5 percentage points decreases the likelihood of exiting poverty by 0.4 percentage points, and an increase in GDP of $180 billion (the average change in GDP across the 1975-96 period) increases the likelihood of exiting poverty by 9.2 percentage points.
Many of the control variables that are statistically significant in the PSID analysis are also significant in the SIPP analysis. As with the poverty entry models, one difference is the relationship between age and poverty exits. In both SIPP analyses, we find that individuals in households headed by young adults (under age 25) and older adults (age 55 and or older) are less likely to exit poverty, but in the PSID we find that individuals in households headed by older adults are more likely to exit poverty. The race and educational attainment of the household are important. Persons in households headed by black and Hispanic individuals are less likely to exit poverty than persons in households headed by whites and other minority groups. Persons who live in households headed by individuals with higher educational attainment are more likely to exit poverty.
Like our PSID findings, we find that household structure also plays a role in poverty exits in the SIPP analyses. Persons in households that have been female-headed for two or more years are less likely to exit poverty than persons in two-adult and single male-headed households. The number of adults in the household and the presence of dependent children in the household are also related to poverty exits—the likelihood of exiting poverty is lower for individuals in households with more adults and fewer children. Again, we find that the duration of the poverty spell matters. As individuals' poverty spells get longer, they are less likely to exit poverty.
Likelihood of Exiting Poverty if Event Occurs: Again, the coefficients from the multivariate models are used to calculate the overall likelihood of exiting poverty if an individual experiences a particular event (not shown in table).(56) In comparing results from the SIPP and PSID, we find that many more of the trigger events are significantly related to poverty exits in the monthly SIPP analysis as compared to the annual PSID analysis. While we did not find this in the poverty entry models, this finding is not particularly surprising. Ruggles and Williams (1987) point out that associating an annual change in poverty status with an event that occurs at some point during the year (i.e., what is done in the PSID analysis) is more difficult than identifying a relationship between poverty status changes and events when the timing is more precisely identified (i.e., what is done with the monthly SIPP analysis) (pp. 1-2). The multivariate PSID results suggest that the likelihood of exiting poverty is above average for persons living in households with a gain in employment (of the head, spouse, or others) and those living in households that shift from female-headed to two-adult headed. In analyses with SIPP data, these trigger events plus changes in disability status, educational attainment, and economic conditions are important.
The average likelihood of exiting poverty in a month is 10.9 percent in the 1988-92 SIPP period and 9.1 percent in the 1996-99 SIPP period. In the 1996-99 period, employment gains are most likely to lead to a poverty exit. The likelihood of exiting poverty in a month is 37.4 percent if the head gains employment, 37.5 percent if the spouse gains employment, and 38.7 percent if another family member gains employment—significantly higher than the average exit likelihood of 9.1 percent. In the 1988-92 period, these likelihoods are similar, but slightly lower: 29.1 percent, 29.8 percent, and 33.3 percent, respectively. Increases in educational attainment also play an important role in poverty exits. The likelihood of exiting poverty when the household head receives an advanced degree is between 31 and 36 percent, close in magnitude to the employment gain likelihoods. The likelihood of exiting poverty if the household shifts from female-headed to two-adult headed is 35.8 percent in the 1988-92 period, while it is 13.9 percent in the 1996-99 period.(57) This is similar to 1996-99 likelihood of exiting poverty if the individual is living in a household where the head ceased to be disabled, 12.6 percent.
Endnotes
34. The 1993 peak was 15 percent when measured using the March CPS (U.S. Census Bureau 2000) rather than the PSID. It is well established that poverty rates in the PSID are lower than official poverty rates produced by the U.S. Census Bureau from the March Current Population Survey (CPS). Evidence suggests that the lower poverty rates are due to more complete income reporting at the lower end of the income distribution in the PSID than in the CPS (Citro and Michael 1995, p. 403). In addition, the PSID represents the non-immigrant population and the CPS captures immigrants. While the poverty rates reported in Table 2 are lower, the trends over time are similar to the official rates produced by the CPS. See U.S. Census Bureau (2000) Historical Poverty Table 2 for comparable official poverty rates.
35. The PSID is not a strong data source for explaining population dynamics because it does not capture changes in immigration, a key component behind changes in the total U.S. population.
36. The 1993-96 data are from the early release PSID files and thus, are preliminary.
37. Due to the large size of the 1996 SIPP person-month entry sample, we limit the sample to the 1997-2000 time period (dropping observations for 1996 and the first quarter of 1997).
38. As discussed in the methods section (Section VI.2), this model does not necessarily identify a causal relationship, but rather a conditional relationship (the relationship after controlling for other events and characteristics). This occurs because some of the events, such as employment status changes, are choice variables (i.e., potentially endogenous).
39. The value of the estimated coefficients from the discrete-time multivariate hazard models do not have a straightforward interpretation. The coefficients can be used to determine whether an event increases or decreases an individuals' likelihood of experiencing a poverty transition, but alone, they do not provide information about the degree to which individuals are more or less likely to transition.
40. We calculate the likelihood of entering poverty (or exiting poverty) when an event occurs (or does not occur) using the estimated coefficients from the hazard model and individuals' characteristics. For details on how the probabilities are calculated, see Calculating the Likelihood an Event Occurs in Section IV.2.
41. Recall that trigger events are defined as a change in status between two periods. So, an event defined as occurring at time t occurred between the current period t and the pervious period t-1, where t is measured in years for the PSID and months for the SIPP (with the exception of GDP, which is measured in quarters for the SIPP). And, an event defined as occurring at time t-1 occurred between t-2 and t-1.
42. We examine whether the estimated relationship between poverty entries and changes in economic conditions are mitigated by the inclusion of employment changes in the model. Our analysis suggests this is not the case. We estimate a second set of models that exclude the employment change variables, and compare results across models that include and exclude the employment change variables. We find little difference in the relationship between poverty entries and the economic change variables across the two models.
43. Recall that the categories of headship capture all possible household structure combinations at time t: female-headed household at time t and became female-headed at t (i.e., between t-1 and t), at t-1, or prior to t-1; single male-headed household at time t; and two-adult household at time t.
44. In other words, the coefficient is picking up unobserved heterogeneity.
45. The likelihood of entering poverty when an event occurs is calculated using the estimated coefficients from the hazard model and individuals' characteristics. For more details on calculations, see Calculating the Likelihood an Event Occurs in Section IV.2.
46. Note that non-poverty spells that do not result in a transition into poverty are not captured in either of these two models, since the individual neither entered a short or long poverty spell.
47. This percentage is calculated by summing the estimated effects (the third number presented in the tables) in the time periods where the coefficients are statistically significant at the five percent level. So, for this event we sum the time t, t-1, t-2, and t-3 effects, where the effects at these time periods are 11.1 percentage points, 1.1 percentage points, 0.3 percentage points, and -0.2 percentage points. The effects for other variables are calculated in this same way.
48. Recall from the descriptive analysis section that the poverty entry models estimated with the 1996 SIPP panel do not use data from 1996 due to computer constraints encountered when estimating the models on nearly 3 million observations.
49. For details on how the probabilities are calculated, see Calculating the Likelihood an Event Occurs in Section IV.2.
50. The change in educational attainment is defined separately for households that experienced no change in household structure and those that experienced a change in household structure. This construct produces model results that provide information about whether education could increase individuals likelihood of exiting poverty, rather than mixing this with information about whether marrying or cohabiting with a more educated individual pulls a household out of poverty.
51. For details on how the probabilities are calculated, see Calculating the Likelihood an Event Occurs in Section IV.2.
52. The estimated likelihood of exiting poverty in a year using PSID data is higher by a total of 7.3 percentage points, 29.4 percentage points, and 15.0 percentage points, respectively.
53. These percentages are calculated by summing the estimated effects (the third number presented in the tables) in the time periods where the coefficients are statistically significant at the five percent level. So, for the event “other household member gains employment” we sum the time t and t-1 effects. If another household member gains employment this month (t), the probability of exiting poverty this month (t) is higher by 24.0 percentage points (Table 9, column 2) and if another household member gained employment in the last quarter (t-1) the probability of exiting poverty is higher by 5.6 percentage points (Table 9, column 2). These two pieces provide the total effect of 29.6 (24.0 plus 5.6) percentage points. The effects for other variables are calculated in this same way.
54. We examine whether the estimated relationship between poverty exits and changes in economic conditions are mitigated by the inclusion of employment changes in the model. Our analysis suggests this is not the case. We estimate a second set of models that exclude the employment change variables, and compare results across models that include and exclude the employment change variables. We find little difference in the relationship between poverty exits and the economic change variables across the two models.
55. The increase in the likelihood of exiting poverty by 24.9 percentage points is calculated by summing the effects in the three time periods that are statistically significant: t (35.1), t-1 (-4.6) and t-2 (- 5.6).
56. For details on how the probabilities are calculated, see Calculating the Likelihood an Event Occurs in Section IV.2.
57. As discussed above, models that exclude employment changes find a similar relationship between poverty exits and household structure shifts in the 1988-92 and 1997-99 periods. This suggests that changes in household structure may be operating indirectly through employment to a greater extent in the 1997-99 period than in the 1988-92 period.
Chapter VII: Conclusion
This study examines both the dynamics behind changes in the poverty rate over time and the events that trigger entries into and exits from poverty. We decompose the poverty rate and examine how the number of entries into and exits from poverty relate to changes in the poverty rate over time. This decomposition answers questions such as “In periods where poverty rates remained high, was it because the number of entries and exits were high or low?”
In analyzing events that trigger entries into and exits from poverty, we use both descriptive statistics and discrete-time multivariate hazard models. The events examined are motivated by the conceptual model, and include changes in household composition, labor supply, disability status, educational attainment, and economic conditions. Our multivariate approach disentangles the relationship between one event and poverty transitions from that of other events and demographic characteristics, thereby providing information about the role specific events play in individuals' entries into and exits from poverty. Several studies have examined the relationship between events and poverty transitions, but most use only descriptive analyses. While informative, descriptive analyses provide limited information because individuals can experience more than one event at a time, thereby making it impossible to disentangle the relationship between one event and a poverty transition from that of other events or demographic characteristics. This study also examines whether the events that trigger poverty entries and exits differ for long versus short spells of poverty and whether they have changed over time.
We examine poverty transitions using two nationally representative longitudinal data sets. We use yearly data from the 1975 panels of the Panel Study of Income Dynamics (PSID) and monthly data from the 1988, 1990, and 1996 panels of the Survey of Income and Program Participation (SIPP). Our analysis of PSID data includes an examination of whether trigger events differ for persons entering/exiting poverty spells of four or less years (short spells) and more than four years (long spells). And, using the SIPP, we examine whether the trigger events differ in the 1988-92 period—prior to welfare reform—and the 1997-99 period—after welfare reform. Our three research questions and findings are discussed below.
What are the dynamics behind changes in the poverty rate over time?
Our examination of changes in the poverty rate over the 22 years from 1975 through 1996, using PSID data, finds that the annual poverty rate was relatively low in the mid-to-late 1970s, moderate in the mid-to-late 1980s, and high in the early-to-mid 1980s and early-to-mid 1990s. The dynamics behind these changes in the poverty rate illustrate that, not surprisingly, the number of people entering poverty is greater than the number of people exiting poverty when the poverty rate is increasing and vice versa when the poverty rate is decreasing.
The number of people entering and exiting poverty remained relatively constant from 1975 until the early 1990s, when both jumped dramatically. The high levels of poverty entries and exits in the mid-1990s suggest that poverty rates remained high over this period because entries and exits were both high, not because both were low. Many people were cycling in and out of poverty. But this has not always been the case. A look at the early-to-mid 1980s, another period where poverty rates remained high, finds the number of people entering and exiting poverty comparatively low. In general, the early-to-mid 1990s look different from earlier time periods. The early-to-mid 1990s were characterized by relatively high poverty rates and high numbers of people cycling in and out of poverty.
What events increase individuals' likelihood of entering and exiting poverty?
Many events throw people into poverty and many events help people exit from poverty. There appears to be no single path into or out of poverty. We find that household events—including changes in composition, employment, and disability status—are important, as well as economic conditions. These findings suggest that multiple policies can be considered to help alleviate poverty.
Descriptive statistics suggest that those who shift from a two-adult household to a female-headed household and vice versa are the most likely to transition in and out of poverty, although individuals experiencing all of these trigger events are more likely to enter and exit poverty than those not experiencing the events. While the multivariate results confirm that many events affect individuals’ likelihood of entering and exiting poverty, a different event is identified as most important in poverty transitions. Individuals living in a household that experience a loss or gain of employment are the most likely to enter and exit poverty, followed by individuals in households that shift from being headed by two adults to being headed by only a female, and vice versa. Controlling for household characteristics and other variables reduces the observed relationship between household structure shifts and poverty, and employment changes emerge as being most strongly related to poverty entries. Our findings also suggest that many of the household, geographic, and economic characteristics are significantly related to poverty entries, as well as the poverty and non-poverty spell information.
Consistent with the findings from the total sample, changes in employment are also identified as most important in individuals' entries into and exits from long and short poverty spells. We do, however, find some differences across the two groups. For example, we find that a spouse’s employment loss is related to entries into short poverty spells, but not long poverty spells. And, that employment gains of other household members are more important for exiting a long versus short poverty spell.
A comparison of the 1988/1990 and 1996 SIPP panel results shows many similarities, but one substantial difference. Over the 1988-92 (i.e., 1988/1990 SIPP panel) to 1997-99 (i.e., 1996 SIPP panel) time period, shifts from two-adult to female-headed households and vice versa—measured while controlling for shifts in employment—became less important in individuals' poverty transitions. Further analysis suggests that one possible explanation for this pattern is that in the latter period changes in household structure are operating through employment to a greater extent than in the earlier period.
What is the likelihood of entering and exiting poverty given these different events?
We find the likelihood of entering or exiting poverty is highest for persons living in households with employment changes. In the pre-1996 period, this is followed by persons living in households with a shift in headship, but this event has a relatively small relationship with poverty transitions in the 1997-99 time period. The monthly SIPP results highlight the role that completing an educational degree can play in helping individuals to exit poverty.
The likelihood of entering poverty is relatively similar for the annual and monthly data. It ranges from an average of roughly two percent for the total PSID and SIPP samples to a high of nearly 17 percent for persons living in households where the head loses employment. The likelihood of exiting poverty differs in the annual and monthly data. In the annual PSID data, it ranges from an average of 35 percent for the total sample to a high of 65 percent for persons living in households where the spouse gains employment. In the monthly SIPP data, it ranges from the sample average of roughly 10 percent to a high of 38 percent for persons living in households with employment gains.
Summary
The annual poverty rate was relatively low in the mid-to-late 1970s, moderate in the mid-to-late 1980s, and high in the early-to-mid 1980s and early-to-mid 1990s. Analysis of poverty entries and exits over these two decades, using PSID data, shows that the early-to-mid 1990s look different from earlier years. The high poverty rates in the mid-1990s were characterized by many people cycling through poverty, while the high poverty rates in the early-to-mid 1980s were characterized by fewer people staying in poverty.
This study’s main descriptive finding—that persons who experience a major shift in household structure are the most likely to transition into and out of poverty—is somewhat overlooked in the literature because most studies examine events only among those who enter or exit poverty. In doing so, these studies place emphasis on the likelihood of experiencing an event among poor persons rather than on the likelihood of entering/exiting poverty among persons who experience an event. Since the likelihood of experiencing a shift from a two-adult to a female-headed household or vice versa is low, especially relative to the likelihood of experiencing a change in employment, the shift in household structure appears less important than a change in employment. As descriptive analyses by Ruggles and Williams (1987) and Duncan and Rodgers (1988) find, major changes in household composition are rare, but they are associated with large changes in the likelihood of a change in poverty status when they do occur.
The main finding from the multivariate analyses—that changes in employment, not household composition, are the most strongly related to poverty transitions—is a new finding in that earlier studies have not examined the relationship between household events and poverty in a multivariate framework. Changes in employment are even more important in the recent 1997 to 1999 time period—after federal welfare reform and during a booming economy—than in the 1988 to 1992 time period. In addition, changes in household composition—measured while controlling for changes in employment—became less important in this time period. Future research should examine how these events differ for important subgroups in the population such as children and minorities.
References
Allison, Paul D., Event History Analysis. A Sage University Paper. (Newbury Park: Sage Publications, 1984).
Bane, Mary Jo and David Ellwood, “Slipping Into and Out of Poverty: The Dynamics of Spells,” Journal of Human Resources, Volume 21, No. 1, Winter, 1-23 (1986).
Becker, Gary, A Treatise on The Family, Chap. 5 (Cambridge and London: Harvard University Press, 1991).
Becker, Gary, Human Capital. 2nd Ed., Chap. 2 (New York: Columbia University Press, 1975).
Blank, Rebecca M., It Takes a Nation: A New Approach to Fighting Poverty. (New York: Princeton University Press, Russell Sage Foundation, 1997).
Citro, C.F. and R.T. Michael, Measuring Poverty: A New Approach. (Washington, DC: National Academy Press, 1995).
Corcoran, Mary E. and Ajay Chaudry, “The Dynamics of Childhood Poverty,” The Future of Children, Vol. 7, No. 2, Summer/Fall, 40-54 (1997).
Dornbusch, Rudiger and Stanley Fischer, Macroeconomics. 5th Ed. (New York: McGraw-Hill, 1990).
Duncan, Greg J., Years of Poverty, Years of Plenty. (Ann Arbor: Institute for Social Research, The University of Michigan, 1984)
Duncan, Greg J. and Willard Rodgers, “Has Children’s Poverty Become More Persistent?” American Sociological Review. Vol. 56, No. 4, 538-550 (1991).
Duncan, Greg J. and Willard Rodgers, “Longitudinal Aspects of Childhood Poverty,” Journal of Marriage and the Family, Vol. 50, Issue. 4, November, 1007-1022 (1988).
Ehrenberg, Ronald G. and Robert S. Smith, Modern Labor Economics, 4th edition. (New York: Haper Collins Publishers Inc., 1991).
Eller, T. J., “Who Stays Poor? Who Doesn’t?” Current Population Reports. Dynamics of Economic Well-Being: Poverty 1992-1993 (1996). http://www.census.gov/hhes/www/prevsipp.html
Gottschalk, Peter, Sara McLanahan, and Gary D. Sandefur, “The Dynamics of Intergenerational Transmission of Poverty and Welfare Participation” in Confronting Poverty: Prescriptions for Change, ed. Sheldon Danziger, Gary Sandefur, and Daniel Weinberg (Cambridge: Harvard University Press, 85-108, 1994).
Iceland, John, “The Dynamics of Poverty Spells and Issues of Left-Censoring,” Research Report No. 97-378 (Population Studies Center, University of Michigan-Ann Arbor, 1997a).
Iceland, John, “Urban Labor Markets and Individual Transitions out of Poverty,” Demography, Vol. 34, No. 3 August, 429-441 (1997b).
Lewis, Oscar, La Vida. (London: Panther Books, 1968).
Lillard, Lee A. and Robert J. Willis, “Dynamic Aspects of Earning Mobility,” Econometrica Vol. 46, 985-1012 (1978).
McKernan, Signe-Mary, Caroline Ratcliffe, and Stephanie Riegg. “Transition Events in the Dynamics of Poverty: A Review of Issues and Results,” The Urban Institute. Washington, D.C. (2001).
Naifeh, Mary, “Trap Door? Revolving Door? Or Both?” Current Population Reports. Dynamics of Economic Well-Being: Poverty 1993-1994 (1998). http://www.census.gov/hhes/www/poverty.html
Pavetti, Ladonna, “The Dynamics of Welfare and Work: Exploring the Process by Which Women Work Their Way Off Welfare” The Malcolm Weiner Center for Social Policy, The Kennedy School of Government, Harvard University, Dissertation Series #D-93-1, May (1993).
Rank, Mark and Thomas Hirschl, “Estimating the Proportion of Americans Ever Experiencing Poverty During their Elderly Years” The Journals of Gerontology, Vol. 54B, Issue 4, S184-194 (1999a).
Rank, Mark and Thomas Hirschl, “The Likelihood of Poverty across the American Adult Life Span,” Social Work, Vol. 44, No. 3, May 201-216 (1999b).
Ruggles, Patricia, Drawing the Line: Alternative Poverty Measures and Their Implications for Public Policy. (Washington, DC: The Urban Institute Press, 1990).
Ruggles, Patricia and Robert Williams, “Transitions In and Out of Poverty: New Data from the Survey of Income and Program Participation,” U.S. Department of Commerce, Bureau of the Census, No. 8716, December (1987).
Sawhill, Isabel V., “Poverty in the U.S.: Why Is It So Persistent?” Journal of Economic Literature. Vol. 26, September 1073-1119 (1988).
Schiller, Bradley The Economics of Poverty and Discrimination. 2nd ed. (Englewood Cliffs, NJ: Prentice-Hall, 1976).
Stevens, Ann Huff, “Climbing out of Poverty, Falling Back In: Measuring the Persistence of Poverty over Multiple Spells,” Journal of Human Resources, Summer (1999).
Stevens, Ann Huff, “The Dynamics of Poverty Spells: Updating Bane and Ellwood”, AEA Papers and Proceedings, Volume 84, No. 2, May 1994, 34-37 (1994).
U.S. Census Bureau, Historical Poverty Tables, (2000). http://www.census.gov
U.S. Department of Commerce, Bureau of Economic Analysis, National Accounts Data. “Current-Dollar and ‘Real’ Gross Domestic Product.” Accessed August 15 (2001). http://www.bea.doc.gov/bea/dn1.htm
U.S. Department of Labor, Bureau of Labor Statistics, Local Area Unemployment Statistics. “Table 4. Civilian labor force and unemployment by state and selected areas, not seasonally adjusted.” Accessed August 15 (2001). http://stats.bls.gov/lauhome.htm?H4
Willis, Robert J., “Wage Determinants: A Survey and Reinterpretation of Human Capital Earnings Functions.” Chapter 10 of the Handbook of Labor Economics, Volume I, Edited by O. Ashenfelter and R. Layard, Elsevier Science Publishers BV (1986).
World Bank, World Development Report 2000/200/: Attacking Poverty. New York: Oxford University Press (2001).
Appendices
Appendix A: Hazard Rate model
The hazard rate is the probability of experiencing an event at time t (i.e., making a transition) given that the event has not occurred prior to time t. The table below provides an example of the information necessary to calculate the hazard rate over four periods (e.g., years). Time t goes from 1 to 4, Nr people are initially at risk of an event (e.g., exiting poverty), and the last row represents the number of individuals who experience an event (e.g., transition out of poverty) at each time t, which is represented by Tt.
| Time | 1 | 2 | 3 | 4 |
|---|---|---|---|---|
| Number at Risk | Nr | Nr-T1 | Nr-T1-T2 | Nr-T1-T2-T3 |
| Number who Transition | T1 | T2 | T3 | T4 |
In each period, the hazard rate is simply the number who experience an event over the number at risk. So, the hazard rate at time t equal one to four, Pt, is
P1 = Prob(exit poverty at t = 1, given one period in poverty) = T1/Nr
P2 = Prob(exit poverty at t = 2, given not exit at t = 1) = T2/(Nr-T1) [A1]
P3 = Prob(exit poverty at t = 3, given not exit at t = 1 or t = 2) = T3/(Nr-T1-T2)
P4 = Prob(exit poverty at t = 4, given not exit at t = 1, t = 2, or t = 3) = T4/(Nr-T1-T2-T3)
This is the Kaplin-Meier hazard estimator. The notation for the hazard rate for person i at time t, Pit, can be condensed and written as:
Pit = Prob(t = Ti | t d Ti). [A2]
This simply says that the hazard rate is the probability of exiting poverty (or entering poverty) at time t (Ti = t) given that the individual exits poverty (or enters poverty) at time t or later (Ti >= t).
Moving to a multivariate hazard framework allows the hazard rate to depend not only on time, but also on a set of explanatory variables, call them X. The hazard rate in the multivariate framework can be simply modified from the above equation to include these explanatory variables, X, and be written as:
Pit = Prob(t = Ti | t <= Ti, X). [A3]
Moving from this form of the hazard rate to the estimating equation requires an assumption about how the hazard rate depends on the explanatory variables. With this assumption, the hazard rate for person i at time t can be written as:
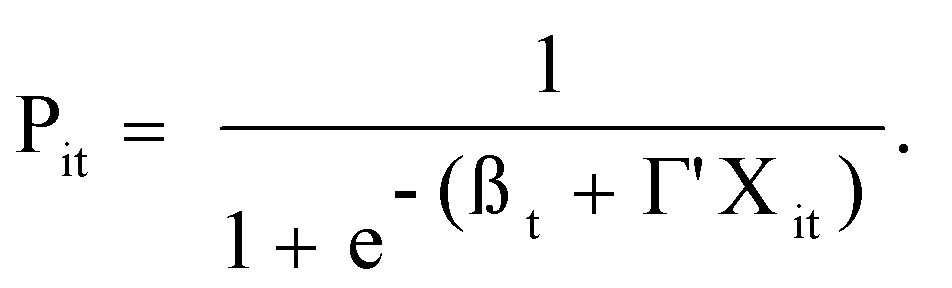 [A4]
[A4]
Appendix B: Tables
| PSID | SIPP | |||||
|---|---|---|---|---|---|---|
| Mean | SD | 1988 & 1990 | 1996 | |||
| Mean | SD | Mean | SD | |||
| Change in Economic Status | ||||||
| Change in state unemployment rate, t | -0.09 | 0.00 | 0.03 | 0.00 | -0.03 | 0.00 |
| Change in GDP, t (in billions) | 164.86 | 0.29 | 24.02 | 0.04 | 95.95 | 0.04 |
| Demographic Characteristics of Household Head | ||||||
| Age: | ||||||
| Less than 25 | 0.05 | 0.00 | 0.04 | 0.00 | 0.03 | 0.00 |
| Greater than or equal to 55 | 0.25 | 0.00 | 0.27 | 0.00 | 0.26 | 0.00 |
| Race/Ethnicity: | ||||||
| Black | 0.10 | 0.00 | 0.09 | 0.00 | 0.10 | 0.00 |
| Hispanic | -- | -- | 0.07 | 0.00 | 0.10 | 0.00 |
| Educational attainment: | ||||||
| Equal to high school | 0.34 | 0.00 | 0.32 | 0.00 | 0.31 | 0.00 |
| More than high school | 0.46 | 0.00 | 0.47 | 0.00 | 0.56 | 0.00 |
| Household Composition | ||||||
| Female-headed household (for more than 2 years) | 0.13 | 0.00 | 0.10 | 0.00 | 0.11 | 0.00 |
| Single male-headed household | 0.06 | 0.00 | -- | -- | -- | > -- |
| Number of adults less head and wife | 0.36 | 0.00 | 0.79 | 0.00 | 0.44 | 0.00 |
| Number of children (less children that enter at t and t-1) | 1.10 | 0.00 | 1.02 | 0.00 | 1.07 | 0.00 |
| Geographic Characteristics | ||||||
| Region: | ||||||
| Northeast | 0.23 | 0.00 | 0.21 | 0.00 | 0.20 | 0.00 |
| Midwest | 0.29 | 0.00 | 0.26 | 0.00 | 0.25 | 0.00 |
| West | 0.18 | 0.00 | 0.20 | 0.00 | 0.21 | 0.00 |
| Pacific | 0.00 | 0.00 | -- | -- | -- | -- |
| Urban area: | ||||||
| MSA | 0.58 | 0.00 | 0.74 | 0.00 | 0.81 | 0.00 |
| Economic Characteristics | ||||||
| State unemployment rate | 6.98 | 0.01 | 6.02 | 0.00 | 4.47 | 0.00 |
| GDP (in ten billions) | 57.21 | 0.02 | 66.11 | 0.00 | 85.65 | 0.00 |
| Spell Information | ||||||
| Left-censored spells (observed) | 0.73 | 0.00 | 0.90 | 0.00 | 0.80 | 0.00 |
| Number of previous spells (observed) | 0.14 | 0.00 | 0.07 | 0.00 | 0.21 | 0.00 |
| Time Period | ||||||
| 1980-1989 | 0.56 | 0.00 | -- | -- | -- | -- |
| 1990-1996 | 0.18 | 0.00 | -- | -- | -- | -- |
| 1990 SIPP Panel (10/89-8/92) | -- | -- | 0.57 | 0.00 | -- | -- |
| 1997 | -- | -- | -- | -- | 0.26 | 0.00 |
| 1998 | -- | -- | -- | -- | 0.36 | 0.00 |
| 1999 | -- | -- | -- | -- | 0.38 | 0.00 |
| Number of person-years/months |
217,427 |
2,034,658 |
2,211,724 |
|||
| Notes: Table presents weighted means. Summary statistics based on person-years for the PSID and person-months for the SIPP. See Table 4 for weighted means of entry trigger events. | ||||||
| PSID | SIPP | |||||
|---|---|---|---|---|---|---|
| Mean | SD | 1988 & 1990 | 1996 | |||
| Mean | SD | Mean | SD | |||
| Change in Economic Status | ||||||
| Change in state unemployment rate, t | -0.08 | 0.01 | 0.02 | 0.00 | -0.04 | 0.00 |
| Change in GDP, t (in billions) | 163.10 | 0.94 | 28.65 | 0.11 | 61.29 | 0.21 |
| Demographic Characteristics of Household Head | ||||||
| Age: | ||||||
| Less than 25 | 0.13 | 0.00 | 0.09 | 0.00 | 0.08 | 0.00 |
| Greater than or equal to 55 | 0.23 | 0.00 | 0.21 | 0.00 | 0.21 | 0.00 |
| Race/Ethnicity: | ||||||
| Black | 0.43 | 0.00 | 0.27 | 0.00 | 0.24 | 0.00 |
| Hispanic | -- | -- | 0.17 | 0.00 | 0.22 | 0.00 |
| Educational attainment: | ||||||
| Graduate high school (two or more years ago) | 0.32 | 0.00 | 0.30 | 0.00 | 0.31 | 0.00 |
| Received an associate's degree or higher (two or more years ago) | 0.17 | 0.00 | 0.22 | 0.00 | 0.26 | 0.00 |
| Household Composition | ||||||
| Female-headed household (for two or more years) | 0.47 | 0.00 | 0.35 | 0.00 | 0.34 | 0.00 |
| Single male-headed household | 0.09 | 0.00 | -- | -- | -- | -- |
| Number of adults (less head and wife) | 0.40 | 0.01 | 0.53 | 0.00 | 0.38 | 0.00 |
| Number of children (less children that enter at t and t-1) | 1.71 | 0.01 | 1.89 | 0.00 | 1.85 | 0.00 |
| Geographic Characteristics | ||||||
| Region: | ||||||
| Northeast | 0.16 | 0.00 | 0.16 | 0.00 | 0.17 | 0.00 |
| Midwest | 0.29 | 0.00 | 0.23 | 0.00 | 0.20 | 0.00 |
| West | 0.10 | 0.00 | 0.17 | 0.00 | 0.22 | 0.00 |
| Pacific | 0.00 | 0.00 | -- | -- | -- | -- |
| Urban area: | ||||||
| MSA | 0.52 | 0.00 | 0.66 | 0.00 | 0.75 | 0.00 |
| Economic Characteristics | ||||||
| State unemployment rate | 7.34 | 0.02 | 6.37 | 0.00 | 4.92 | 0.00 |
| GDP (in ten billions) | 58.11 | 0.07 | 66.15 | 0.00 | 83.48 | 0.01 |
| Spell Information | ||||||
| Left-censored spell | 0.15 | 0.00 | 0.56 | 0.00 | 0.46 | 0.00 |
| Number of previous spells (observed) | 0.62 | 0.01 | 0.35 | 0.00 | 0.44 | 0.00 |
| Time Period | ||||||
| 1980-1989 | 0.61 | 0.00 | -- | -- | -- | -- |
| 1990-1996 | 0.19 | 0.00 | -- | -- | -- | -- |
| 1990 SIPP Panel (10/89-8/92) | -- | -- | 0.57 | 0.00 | -- | -- |
| 1997 | -- | -- | -- | -- | 0.26 | 0.00 |
| 1998 | -- | -- | -- | -- | 0.25 | 0.00 |
| 1999 | -- | -- | -- | -- | 0.25 | 0.00 |
| Number of person-years/months | 35,445 | 272,639 | 517,902 | |||
| Notes: Table presents weighted means. Summary statistics based on person-years for the PSID and person-months for the SIPP. See Table 5 for weighted means of entry trigger events. | ||||||