
Annual Report to Congress
October 1998
U.S. Department of Health and Human Services
"
Executive Summary
The Welfare Indicators Act of 1994 requires the Department of Health and Human Services to prepare annual reports to Congress on indicators and predictors of welfare dependence. This Annual Report on Welfare Indicators, October 1998 is the second of these annual reports.
Welfare dependence, like poverty, is a continuum, with variations in degree and in duration. Families may be more or less dependent if larger or smaller shares of their total resources are derived from welfare programs. The amount of time over which a family depends on welfare might also be considered in assessing their degree of dependency. Although recognizing the difficulties inherent in defining and measuring dependence, the bipartisan Advisory Board on Welfare Indicators proposed the following definition:
A family is dependent on welfare if more than 50 percent of its total income in a one-year period comes from AFDC/TANF, Food Stamps and/or SSI, and this welfare income is not associated with work activities. Welfare dependence is the proportion of all families who are dependent on welfare.
The proposed definition, unfortunately, cannot be measured precisely at this time with currently available data. Most importantly, current data do not distinguish between cash benefits where work is required and cash benefits that are paid without work. Thus it was not possible to construct one single indicator of dependence. Instead this report includes a number of indicators addressing welfare recipiency, dependence, and labor force attachment. Selected findings discussed in more detail include the following:
- In 1994, the most recent year for which SIPP data are available, 5.6 percent of the total population were dependent in the sense of receiving more than half of total income from AFDC, Food Stamps, and SSI (see Indicator 1). This is approximately the same rate as the previous two years. This dependency rate would be lower if adjusted to exclude welfare assistance associated with working.
- Long-term dependency is relatively rare. Only 4 percent of those who were recipients in 1982, or less than 1 percent of the total population, received more than 50 percent of their income from AFDC and Food Stamps in 9 or 10 years over the next decade. Half of the 1982 recipients never received more than 50 percent of their income from AFDC and Food Stamps over the 1982-1991 time period (see Indicator 1, Figure IND 1b).
- In 1994, 46 percent of AFDC recipients, 38 percent of SSI recipients and 57 percent of Food Stamp recipients were in families with at least one person in the labor force (see Indicator 4).
- Individuals who receive AFDC or Food Stamps as children are more likely to receive benefits as adults (see Indicator 12).
Since the causes of welfare receipt and dependence are not clearly known, the report also includes a larger set of risk factors associated with welfare receipt. Indicators of deprivation are included as a supplement to the dependence indicators, ensuring that dependence measures are not assessed in isolation. The risk factors are loosely organized into three categories: economic security measures, measures related to employment and barriers to employment, and measures of teen behavior, including nonmarital childbearing. Additional data on welfare programs, poverty, and non-marital births are included in three appendices.
Chapter I. Introduction
The Welfare Indicators Act of 1994 (Pub. L. 103-432) directed the Secretary of Health and Human Services to develop indicators of the extent to which American families depend upon income from welfare programs and to publish annual reports on welfare dependency. These reports are to address questions concerning the extent to which American families depend on income from welfare programs such as Aid to Families with Dependent Children (AFDC), the Supplemental Security Income Program (SSI) and the Food Stamp Program (FSP). (Data shown for 1997 and later years will include the Temporary Assistance for Needy Families (TANF) program in place of AFDC.) Specific issues that HHS is directed to address are the rate of welfare dependency, the degree and duration of welfare recipiency and dependence, and predictors of welfare dependence.
An Advisory Board on Welfare Indicators was established under the Act to assist the Secretary in defining welfare dependence and in choosing appropriate data for inclusion in the first annual report. The Board consisted of a bipartisan group of experts appointed by the Senate, the House of Representatives and the President. Before its termination in October 1997, the Board developed a statistical definition of welfare dependence and oversaw the production of the first of these Annual Reports. This second annual report gives updated data on the measures of welfare recipiency, dependency, and predictors of welfare dependence developed for last year's report.
Organization of Report
This introductory chapter provides an overview of the specific summary measures of welfare dependence proposed by the Advisory Board. It also discusses summary measures of poverty, following the Board’s recommendation that dependence measures not be assessed in isolation from measures of deprivation. Analysis of both measures is important because changes in dependence measures could result either from increases in work activity and other factors that would raise family incomes, or from sanctions in welfare programs that would reduce welfare program participation but might not improve the material circumstances of these families. The introduction concludes with a brief discussion of data sources used for the report.
Chapter II of the report, Indicators of Dependence, presents a broader group of indicators of welfare recipiency and dependence. These indicators include measures of the extent of recipiency for each of the three programs considered separately, as well as information on income from all three programs in combination. Interactions of AFDC, SSI and FSP benefits with periods of employment and with benefits from other programs are also shown. The second chapter also includes data on movements onto and off of welfare programs, and on the extent to which welfare recipiency in adolescence is correlated with later adult recipiency.
Chapter III, Predictors and Risk Factors Associated with Welfare Receipt, focuses on predictors of welfare dependence -- risk factors believed to be associated with welfare receipt in some way. These predictors are shown in three different groups
- Economic security – including measures of poverty, receipt of child support, health care coverage, and so forth -- is important in predicting dependence in the sense that families with fewer economic resources are more likely to rely on welfare programs for their support.
- Measures of work status of adult family members also are important, because families must generally receive an adequate income from employment in order to avoid dependence without severe deprivation.
- Finally, teen behaviors are very important since a high proportion of long-term welfare recipients became parents as teens, often outside of marriage. Starting a family in these circumstances may lead to dependence because teens generally lack adequate skills, preparation and resources to support a child.
Additional data are presented in three appendices. Appendix A gives basic data on each of the three main welfare programs and their recipients over the past several years. These three programs are the Aid to Families with Dependent Children (AFDC) program, the Food Stamp Program, and the Supplemental Security Income (SSI) program. The Personal Responsibility and Work Opportunity Reconciliation Act (PRWORA) (Pub. L. 104-193), enacted in 1996, ended the AFDC program and replaced it with the Temporary Assistance for Needy Families (TANF) Program, which is run directly by the states. This year=s annual report includes data on the first year of the new program whenever those data have been available. The available data on TANF in 1997 are shown in Appendix A.
Appendix B provides additional detail on potential risk factors that could not be included in Chapter III because of space considerations. These risk factors are primarily measures of poverty and economic security. Finally, additional data on nonmarital childbearing are included in Appendix C.
Measuring Welfare Dependence
Welfare dependence, like poverty, is a continuum, with variations in degree and in duration. Families may be more or less dependent if larger or smaller shares of their total resources are derived from welfare programs. The amount of time over which a family depends on welfare might also be considered in assessing their degree of dependency. Nevertheless, a summary measure of dependence to be used as an indicator for policy purposes must have some fixed parameters that allow one to determine which families should be counted as dependent, just as the poverty line defines who is poor under the official standard. The definition of dependence developed by the Advisory Board for this purpose is as follows:
A family is dependent on welfare if more than 50 percent of its total income in a one-year period comes from AFDC/TANF, Food Stamps and/or SSI, and this welfare income is not associated with work activities. Welfare dependence is the proportion of all families who are dependent on welfare.
This measure is not without its limitations. The Advisory Board recognized that no single measure could fully capture all aspects of dependence and that the proposed measure should be examined in concert with other key indicators of dependence and deprivation. In addition, while the proposed definition would count unsubsidized and subsidized employment and work required to obtain benefits as work activities, currently available data do not permit distinguishing between welfare income associated with work activities and non-work-related welfare benefits. As a result, the data shown in this report overstate the incidence of dependence (as defined above) because welfare income associated with work required to obtain benefits is classified as welfare and not as income from work. This proposed definition capture also represents an essentially arbitrary choice of a percentage (50 percent) of income from welfare beyond which families will be considered dependent. However, it is relatively easy to measure and to track over time, and is likely to be associated with any very large changes in total dependence, however defined. For example, as the recent changes in welfare law move more recipients into employment or workrelated activities, dependence under this definition is expected to decline.
In 1994, the most recent year for which complete population data are available on monthly income and benefit recipiency, 18.0 percent of the population received means-tested assistance, and close to one-third of this group, or 5.6 percent of the total population, would be considered dependent under the above definition, as shown in Table SUM1. Recipiency and dependency rates are higher in both 1993 and 1994 than they were in 1987 and 1990. Recipiency rates, for example, rose from rates of about 14 to 15 percent in 1987 and 1990, to rates of 17 to 18 percent in 1993 and 1994. This rise in consistent with administrative data showing higher than average AFDC and Food Stamp caseloads in 1993 and 1994. What is not apparent from administrative records, but is shown in these national survey data, is that dependency rates also were higher in 1993 and 1994, in the range of 5 to 6 percent, as opposed to the rates of between 4 and 5 percent, seen in 1987 and 1990.
Table SUM 1. Percentage of the Total Population with More than 50 Percent of Income from Means-Tested Assistance Programs
| 1987 | 1990 | 1993 | 1994 | |||||
|---|---|---|---|---|---|---|---|---|
| Any Receipt of Assistance | More than 50% of Income | Any Receipt of Assistance | More than 50% of Income | Any Receipt of Assistance | More than 50% of Income | Any Receipt of Assistance | More than 50% of Income | |
|
Note: Means-tested assistance includes AFDC, SSI and Food Stamps. While only affecting a small number of cases, General Assistance income is included within AFDC income. The 1993 data have been revised based on the 1993 SIPP panel; the 1993 data in earlier reports were drawn from an earlier SIPP panel. Source: Unpublished data from the SIPP, 1987, 1990, and 1993 panels. |
||||||||
| All Persons | 14.9 | 4.7 | 14.1 | 4.2 | 17.0 | 5.9 | 18 | 5.6 |
| Racial Categories | ||||||||
| Non-Hispanic White | 9.3 | 2.2 | 8.9 | 2.1 | 10.9 | 2.8 | 11.1 | 2.6 |
| Non-Hispanic Black | 40.9 | 15.7 | 36.6 | 14.6 | 41.8 | 16.7 | 43.2 | 16.8 |
| Hispanic | 28.3 | 10.9 | 29.5 | 8.3 | 33.9 | 14.2 | 37.1 | 12.9 |
| Age Categories | ||||||||
| Children Age 0 - 5 | 24.5 | 10.0 | 24.0 | 10.3 | 29.0 | 13.3 | 32.4 | 12.5 |
| Children Age 6 - 10 | 23.2 | 10.1 | 20.2 | 8.5 | 24.0 | 12.3 | 28.6 | 12.0 |
| Children Age 11 - 15 | 19.8 | 8.0 | 18.8 | 6.4 | 22.6 | 10.5 | 24.9 | 9.3 |
| Women Age 16 - 64 | 14.4 | 4.6 | 14.1 | 4.6 | 17.3 | 5.8 | 17.5 | 5.5 |
| Men Age 16 - 64 | 10.1 | 2.0 | 9.5 | 1.5 | 12.0 | 2.7 | 12.3 | 2.5 |
| Adults Age 65 & over | 13.6 | 2.6 | 12.1 | 1.9 | 12.2 | 2.0 | 12.3 | 2.2 |
In Table SUM 2, the dependence indicator is calculated in more detail for specific combinations of programs. The first column shows dependency when counting income from all three programs as welfare (as was done in Table SUM 1), while the second and third columns show dependency when counting AFDC and Food Stamp benefits only, or counting SSI only. In general, about three-fourths of families who are dependent based on income from all three programs also are dependent under a definition that considers AFDC and Food Stamps alone. As might be expected, the one exception involves adults aged 65 and over. Whereas two percent of elderly recipients are dependent under the definition that includes AFDC, Food Stamps and SSI, less than one-half percent are dependent when SSI is excluded. Table SUM 2 also shows that non-whites and the very young are more likely to be dependent than other racial and age categories, and they are primarily dependent on AFDC and Food Stamps. Even in these populations, however, the vast majority of families do not meet the criteria for dependence.
Table SUM 2. Percentage of the Total Population with More than 50 Percent of Income from Various Means-Tested Assistance Programs, 1994
| AFDC, SSI and Food Stamps | AFDC and Food Stamps | SSI only | |
|---|---|---|---|
| All Persons | 5.6 | 4.1 | 0.9 |
| Racial Categories | |||
| Non-Hispanic White | 2.6 | 1.8 | 0.5 |
| Non-Hispanic Black | 16.8 | 11.9 | 2.9 |
| Hispanic | 12.9 | 10.3 | 0.9 |
| Age Categories | |||
| Children Age 0 - 5 | 12.5 | 10.6 | 0.5 |
| Children Age 6 - 10 | 12.0 | 9.3 | 0.9 |
| Children Age 11 - 15 | 9.3 | 6.6 | 0.7 |
| Women Age 16 - 64 | 5.5 | 3.8 | 1.1 |
| Men Age 16 - 64 | 2.5 | 1.2 | 0.8 |
| Adults Age 65 and over | 2.2 | 0.3 | 1.4 |
A third measure of dependence, shown in Table SUM 3, indicates the proportion of the welfare population that meets the dependence definition over an extended period of time, as well as the proportion receiving any welfare benefits over time. During each of the two time periods presented, about half of all recipients did not receive more than 50 percent of their income from AFDC and Food Stamp benefits in any of the ten years examined. About one-quarter (23 percent in the 1982-1991 time period) were dependent for one to two years, with lower proportions dependent for longer periods of time. Only 4 percent of those who were received welfare in 1982, for example, were dependent for 9 to 10 years. This is a smaller percentage than the proportion of recipients that received welfare of any amount for 9 to 10 years (11 percent). There is a small tendency for the proportion of spells of welfare dependence that are longer to grow over this period, but the change is not large enough to be statistically significant. Child recipients have longer spells of welfare receipt and welfare dependence than do recipients in general, as shown in the bottom half of the table.
Table SUM 3. AFDC Receipt and Percentage of Recipients with More than 50 Percent of Income from AFDC and Food Stamps by Number of Years
| All Recipients 1972 – 1981 | All Recipients 1982 – 1991 | |||
|---|---|---|---|---|
| Years | Any AFDCReceipt | AFDC & Food Stamps >50% of Income | Any AFDC Receipt | AFDC & Food Stamps >50% of Income |
| 0 Years | -- | 55 | -- | 50 |
| 1 - 2 Years | 49 | 22 | 47 | 23 |
| 3 - 5 Years | 28 | 14 | 28 | 15 |
| 6 - 8 Years | 13 | 5 | 15 | 9 |
| 9 - 10 Years | 11 | 4 | 11 | 4 |
| 100% | 100% | 100% | 100% | |
| Children 0 - 5 in 1972: 1972 - 1981 | Children 0 - 5 in 1982: 1982 - 1991 | |||
|---|---|---|---|---|
| Years | Any AFDC Receipt | AFDC & Food Stamps >50% of Income | Any AFDC Receipt | AFDC & Food Stamps >50% of Income |
|
Note: Recipients include all individuals receiving at least $1 in AFDC or Food Stamp benefits in the first year of the ten-year time period (1972 or 1982). “AFDC Receipt” is defined as whether the person received AFDC at any time during the year. “AFDC & Food Stamps, >50% of Income” is defined as whether the person’s AFDC and Food Stamps benefit was more than 50% of their yearly income. “0 Years” means that while the person received means-tested assistance, their benefits were 50% of their income for zero years during the time period. For example, a person listed as receiving AFDC for 6 - 8 years (“Any AFDC Receipt”) may never have received benefits greater than 50% of their income (0 years, AFDC and Food Stamps >50% of Income). Source: Unpublished data from the PSID, 1972 - 1991. |
||||
| 0 Years | -- | 39 | -- | 34 |
| 1 - 2 Years | 37 | 25 | 34 | 28 |
| 3 - 5 Years | 29 | 21 | 29 | 16 |
| 6 - 8 Years | 15 | 6 | 17 | 13 |
| 9 - 10 Years | 19 | 9 | 20 | 8 |
| 100% | 100% | 100% | 100% | |
Figure SUM 4. Trends in Poverty with and without Means-Tested Benefits: All Persons, 1979-1996
Percent of Total Population in Poverty
Source: Table SUM 4.
Measuring Deprivation
Changes in dependence may or may not be associated with changes in the level of deprivation, depending on the alternative sources of support found by families who might otherwise be dependent on welfare. To assess the social impacts of any change in dependence, changes in the level of poverty or deprivation also must be considered. One way of measuring deprivation is to look at changes in the level of need over time. Elsewhere in this document, for example, measures of food insecurity and of the poverty gap – the amount of income that would be needed to bring all of those below poverty to the poverty line – are presented. (See Table ECON 9 in Chapter III for measures of food insecurity and Tables B-1 and B-2 in Appendix B for poverty gap measures.)
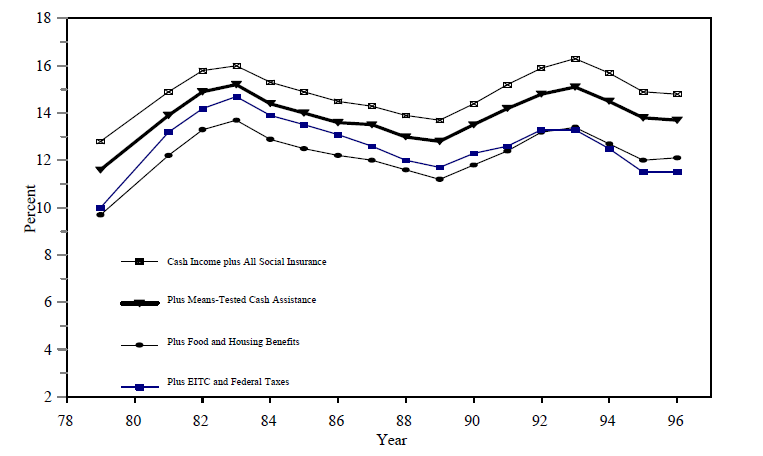
The deprivation measure presented in this chapter, however, focuses directly on changes in the anti-poverty effectiveness of welfare and related programs. Table SUM 4 (and its associated figure) shows how much welfare programs have reduced poverty rates for all persons since 1979.
Similar data are shown for persons in families with related children under age 18 in Figure SUM 5 and Table SUM 5.
Table SUM 4. Percentage of Persons in Poverty before and after the Inclusion of Means-Tested Benefits: All Persons, Selected Years 1979 – 1996
| 1979 | 1981 | 1983 | 1986 | 1989 | 1991 | 1993 | 1995 | 1996 | |
|---|---|---|---|---|---|---|---|---|---|
|
Note: The first measure of poverty, labeled cash income plus all social insurance, includes social security but not means-tested cash transfers. Adding means-tested cash transfers yields the official census definition of poverty, the second line in the table. Food and housing benefits may be received either as cash or (more generally) as in-kind benefits in which case the market value of food and housing benefits is added. EITC refers to the refundable Earned Income Tax Credit, which is always positive whereas Federal payroll and income taxes are a negative adjustment. The fungible value of Medicare and Medicaid is not included. Source: Congressional Budget Office tabulations. Additional calculations by DHHS. |
|||||||||
| Cash Income plus All Social Insurance | 12.8 | 14.9 | 16.0 | 14.5 | 13.7 | 15.2 | 16.3 | 14.9 | 14.8 |
| Plus Means-Tested Cash Assistance | 11.6 | 13.9 | 15.2 | 13.6 | 12.8 | 14.2 | 15.1 | 13.8 | 13.7 |
| Plus Food and Housing Benefits | 9.7 | 12.2 | 13.7 | 12.2 | 11.2 | 12.4 | 13.4 | 12.0 | 12.1 |
| Plus EITC and Federal Taxes | 10.0 | 13.2 | 14.7 | 13.1 | 11.7 | 12.6 | 13.3 | 11.5 | 11.5 |
| Reduction in Poverty Rate | 2.8 | 1.7 | 1.3 | 1.4 | 2.0 | 2.6 | 3.0 | 3.4 | 3.3 |
As can be seen by the figures and tables, many more families would be poor if they did not receive welfare benefits. Counting only cash income and social insurance (excluding welfare), the poverty rate for all individuals would be 14.8 percent in 1996, as shown in the top line in Figure SUM 4 and Table SUM 4. The official poverty rate, which adds means-tested cash assistance, was about one percentage point lower, as shown in the second line in the table and figure. The rate is further reduced when counting food and housing benefits (see third line in figure and table) and when counting taxes, including refunds through the Earned Income Tax Credit (EITC) (see fourth line). This final poverty rate – taking into account all sources of support – is a more complete measure of deprivation than is the official poverty rate or other measures that exclude some types of support. Breaking it down in this fashion allows the relative contribution of different sources – including cash welfare and relatively fungible in-kind welfare benefits – to the alleviation of poverty to be observed.
Poverty rates of all types began to increase in 1990 as the economy went into a recession, reaching a peak in 1993. As economic conditions have started to improve rates have come down, both before and after means-tested assistance. The gap between poverty rates before and after public assistance has increased slightly over time, particularly in the last few years as the size of the EITC has grown. The EITC is a work-related benefit, however, and is not included as assistance in estimating dependence. The contribution of all sources of means-tested support (including cash assistance, food and housing benefits, and the EITC and taxes) to the reduction in poverty has remained roughly constant, except that during the recession of the early 1980s these programs did somewhat less to reduce total poverty. Current poverty-reduction rates for assistance programs are about the same as in 1979, although a bit more of the reduction comes in the form of non-cash benefits. In general, the net effect of means-tested support has been to reduce poverty rates by about three percentage points for all individuals (as shown in Table SUM 4) and by about five percentage points for individuals in families with related children under six (as shown in Table SUM 5).
Figure SUM 5. Trends in Poverty before and after Including Means-Tested Benefits: All Persons in Families with Related Children Under 18 Years of Age, 1979 – 1996
Percent of Population in Poverty
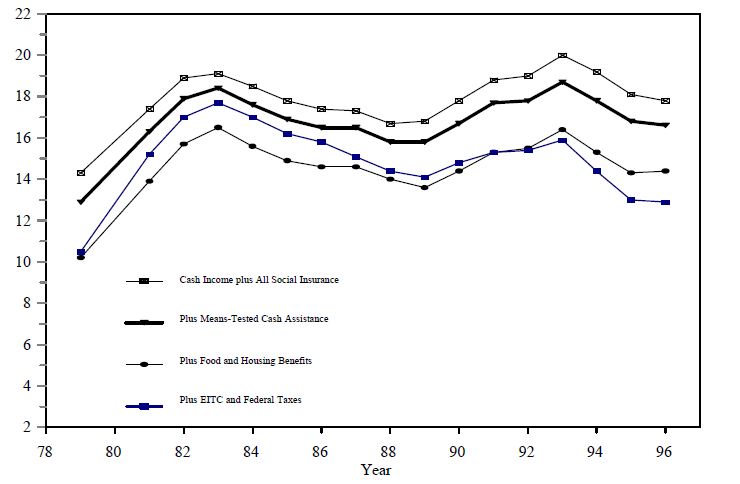
Source: Table SUM 5.
Table SUM 5. Percentage of Persons in Poverty before and after Including Means-Tested Benefits: All Persons in Families with Related Children under 18 Years of Age, 1979-1996
| 1979 | 1981 | 1983 | 1986 | 1989 | 1991 | 1993 | 1995 | 1996 | |
|---|---|---|---|---|---|---|---|---|---|
|
Note: The first measure of poverty, labeled cash income plus all social insurance, includes social security but not means-tested cash transfers. Adding means-tested cash transfers yields the official census definition of poverty, the second line in the table. Food and housing benefits may be received either as cash or (more generally) as in-kind benefits in which case the market value of food and housing benefits is added. EITC refers to the refundable Earned Income Tax Credit, which is always positive whereas Federal payroll and income taxes are a negative adjustment. The fungible value of Medicare and Medicaid is not included. Source: Congressional Budget Office tabulations. Additional calculations by DHHS. |
|||||||||
| Cash Income plus All Social Insurance | 14.3 | 17.4 | 19.1 | 17.4 | 16.8 | 18.8 | 20.0 | 18.1 | 17.8 |
| Plus Means-Tested Cash Assistance | 12.9 | 16.3 | 18.4 | 16.5 | 15.8 | 17.7 | 18.7 | 16.8 | 16.6 |
| Plus Food and Housing Benefits | 10.2 | 13.9 | 16.5 | 14.6 | 13.6 | 15.3 | 16.4 | 14.3 | 14.4 |
| Plus EITC and Federal Taxes | 10.5 | 15.2 | 17.7 | 15.8 | 14.1 | 15.3 | 15.9 | 13.0 | 12.9 |
| Reduction in Poverty Rate | 3.8 | 2.2 | 1.4 | 1.6 | 3.5 | 3.5 | 4.1 | 5.1 | 4.9 |
The relatively small changes in the level of overall deprivation since the late 1980s are consistent with the small changes in the dependence rate seen earlier. As larger changes in dependence occur under PRWORA, it will be both necessary and interesting to track changes in these deprivation rates as well. If this legislation succeeds in its aims, dependence should fall noticeably while deprivation measures remain largely unchanged.
Data Sources
For purposes of this report, the Survey of Income and Program Participation (SIPP) has been used the most extensively and is considered the most useful national survey. Its strengths are its longitudinal design, system of monthly accounting, and detail concerning employment, income and participation in federal income-support and related programs. These features make the SIPP particularly effective for capturing the complexities of program dynamics and many of the indicators and predictors, or risk factors, associated with welfare receipt.
The SIPP does not, however, follow families for more than three years. Therefore, the Panel Study of Income Dynamics (PSID) and the National Longitudinal Survey of Youth (NLSY) also are used in this report. Both the PSID and NLSY collect annual income data, including transfer income, over a long time-period, providing vital data for indicators of long-term and intergenerational welfare receipt, dependence, and deprivation.
Some indicators in this report are based upon the annual Current Population Survey (CPS), which is available on a more timely basis than the SIPP. The CPS measures income and poverty over a single annual accounting period, and provides important information regarding childhood poverty.
Finally, the report also draws upon administrative data for the AFDC, Food Stamp and SSI programs.
Chapter II . Indicators of Dependence
Following the format of last year’s first annual report to Congress, this second chapter presents summary data related to twelve indicators of dependence. These indicators differ from other welfare statistics because of their emphasis on welfare dependence, rather than simple welfare receipt. As discussed in Chapter I, the Advisory Board on Welfare Indicators suggested consideration of the following proposed definition of dependence:
A family is dependent on welfare if more than 50 percent of its total income in a one-year period comes from AFDC/TANF, Food Stamps and/or SSI, and this welfare income is not associated with work activities. Welfare dependence is the proportion of all families who are dependent on welfare.
The indicators in Chapter II were selected to provide information about dependence, following, to the extent feasible, the definition of dependence proposed by the Advisory Board. Existing data from administrative records and national surveys, however, do not generally distinguish welfare benefits received in conjunction with work from benefits received without work. Thus it was not possible to construct one single indicator of dependence, that is, one indicator that measures both percentage of income from means-tested assistance and presence of work activities. Instead, this chapter includes some indicators that focus on the percentage of recipients’ income from meanstested assistance, while other indicators focus on presence of work activities at the same time as welfare receipt. Still other indicators present summary data and characteristics on all recipients, not limited to those with more than 50 percent of total income from welfare programs or those without work activities.
Overall, the twelve indicators of dependency were selected to reflect both the range and depth of dependence. The summary data provide information about:
- the degree to which recipients are dependent on assistance (Indicator 1),
- how long recipients receive welfare or remain dependent (Indicators 3, 5, 6),
- welfare and dependence transitions (Indicators 2 and 11),
- participation in the labor force while receiving assistance (Indicators 4),
- multiple program receipt (Indicator 7),
- events associated with entries and exits from welfare (Indicator 8),
- recipiency and participation rates over time (Indicators 9 and 10), and
- intergenerational dependence (Indicator 12).
Indicators in this chapter focus on recipients of three major means-tested cash and nutritional assistance programs: Aid to Families with Dependent Children (AFDC), Supplemental Security Income (SSI) for elderly and disabled recipients, and the Food Stamp Program. Only limited administrative data are available to report on recipients of the new Temporary Assistance for Needy Families (TANF) program. These are shown in Indicator 9a, which reports AFDC/TANF recipiency rates through 1997. For some indicators, data are presented for the most recent year only; for other indicators, trend data are provided.
Indicator 1. Degree of Dependence
This indicator captures the degree of dependence by examining total family income and the percentage of total family income from means-tested assistance programs.
Figure IND 1a. Percentage of Total Income from Means-Tested Assistance Programs for the Total Population, 1994
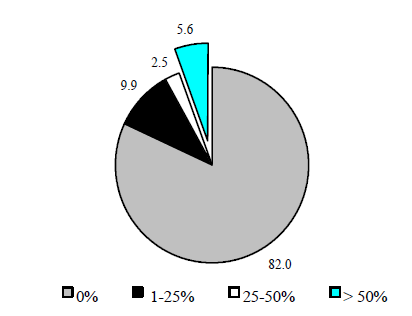
Source: Table IND 1a.
- Less than 6 percent of the total population in 1994 received more than half of their total income from AFDC, Food Stamps and SSI.
- Eighty-two percent of the total population received no means-tested assistance in 1994. Table IND 1a reveals a similar pattern for 1993 (82 percent), 1992 (83 percent), 1990 (86 percent) and 1987 (85 percent).
- For all persons who received some assistance, most received 25 percent or less of their total family income from AFDC, Food Stamps and SSI (10 percent of the total population). Table IND 1a shows similar percentages for other years (10 percent in 1993, 9 percent in 1992, 8 percent in 1990, and 8 percent in 1987).
- As shown in Table IND 1a, a larger percentage of non-Hispanic blacks received more than 50 percent of their income from means-tested assistance programs than Hispanics or non-Hispanic whites in all five years presented. However, even in these groups more than 80 percent were not dependent on welfare under the definition used here.
Table IND 1a. Percentage of Total Income from Means-Tested Assistance Programs for the Total Population, Selected Years
| 0% | > 0% and <= 25% | > 25% and <= 50% | Total > 50% | > 50% and <= 75% | Total > 75% | |
|---|---|---|---|---|---|---|
|
Note: Means-tested assistance includes AFDC, SSI and Food Stamps. While only affecting a small number of cases, general assistance income is included within AFDC income. Total > 50% includes all persons with more than 50 percent of their income from these means-tested programs. The 1993 data have been revised based on the 1993 SIPP panel; the 1993 data in earlier reports were drawn from an earlier SIPP panel. Source: Unpublished data from the SIPP, 1987, 1990, 1992 and 1993 panels. |
||||||
| 1994 | ||||||
| All Persons | 82 | 9.9 | 2.5 | 5.6 | 1.6 | 4 |
| Non-Hispanic White | 88.9 | 7.1 | 1.4 | 2.6 | 0.9 | 1.7 |
| Non-Hispanic Black | 56.8 | 20 | 6.3 | 16.8 | 5.1 | 11.7 |
| Hispanic | 62.9 | 17.9 | 6.3 | 12.9 | 3.2 | 9.7 |
| Children Age 0 - 5 | 67.6 | 14.6 | 5.3 | 12.5 | 2.8 | 9.7 |
| Children Age 6 - 10 | 71.4 | 12.6 | 4 | 12 | 3 | 9 |
| Children Age 11 - 15 | 75.1 | 11.8 | 3.9 | 9.3 | 2.6 | 6.7 |
| Women Age 16 - 64 | 82.5 | 9.7 | 2.3 | 5.5 | 1.7 | 3.8 |
| Men Age 16 – 64 | 87.7 | 8.4 | 1.4 | 2.5 | 0.9 | 1.6 |
| Adults Age 65 and over | 87.7 | 8.2 | 2 | 2.2 | 1 | 1.1 |
| 1993 | ||||||
| All Persons | 82.2 | 9.5 | 2.5 | 5.9 | 1.6 | 4.3 |
| Non-Hispanic White | 88.8 | 7 | 1.4 | 2.8 | 0.8 | 2 |
| Non-Hispanic Black | 58.6 | 17.7 | 6.9 | 16.7 | 5 | 11.8 |
| Hispanic | 62.9 | 17.2 | 5.7 | 14.2 | 3.2 | 11 |
| Children Age 0 - 5 | 68.5 | 13.9 | 4.3 | 13.3 | 2.9 | 10.4 |
| Children Age 6 - 10 | 72.8 | 11.1 | 3.9 | 12.3 | 2.7 | 9.7 |
| Children Age 11 - 15 | 75.9 | 10.2 | 3.4 | 10.5 | 2.8 | 7.6 |
| Women Age 16 - 64 | 82.2 | 9.5 | 2.5 | 5.8 | 1.7 | 4.1 |
| Men Age 16 – 64 | 87.7 | 8.2 | 1.4 | 2.7 | 0.8 | 1.9 |
| Adults Age 65 and over | 88.1 | 7.7 | 2.3 | 2 | 0.8 | 1.2 |
| 1992 | ||||||
| All Persons | 83.1 | 9.3 | 2.7 | 4.9 | 1.4 | 3.5 |
| Non-Hispanic White | 89 | 6.8 | 1.8 | 2.4 | 0.8 | 1.6 |
| Non-Hispanic Black | 59 | 18.3 | 6.9 | 15.9 | 4.1 | 11.7 |
| Hispanic | 66.7 | 17.6 | 5.1 | 10.5 | 2.5 | 8 |
| Children Age 0 - 5 | 71.1 | 12.1 | 4.6 | 12.2 | 3 | 9.3 |
| Children Age 6 - 10 | 76.2 | 10.7 | 3.6 | 9.5 | 2.6 | 6.9 |
| Children Age 11 - 15 | 76.8 | 11.9 | 3.8 | 7.5 | 2.1 | 5.4 |
| Women Age 16 - 64 | 83 | 9.2 | 2.8 | 5 | 1.3 | 3.7 |
| Men Age 16 – 64 | 88.2 | 8.2 | 1.6 | 1.9 | 0.7 | 1.3 |
| Adults Age 65 and over | 87.4 | 8 | 2.5 | 2 | 1 | 1.1 |
| 1990 | ||||||
| All Persons | 85.9 | 7.9 | 2 | 4.2 | 1.2 | 3 |
| Non-Hispanic White | 91.1 | 5.7 | 1.1 | 2.1 | 0.6 | 1.5 |
| Non-Hispanic Black | 63.4 | 16 | 6 | 14.6 | 5.2 | 9.3 |
| Hispanic | 70.5 | 16.8 | 4.4 | 8.3 | 2.1 | 6.2 |
| Children Age 0 - 5 | 76 | 11 | 2.8 | 10.3 | 2.4 | 7.9 |
| Children Age 6 - 10 | 79.8 | 9.2 | 2.6 | 8.5 | 2.4 | 6 |
| Children Age 11 - 15 | 81.2 | 9.6 | 2.8 | 6.4 | 1.8 | 4.5 |
| Women Age 16 - 64 | 85.9 | 7.7 | 1.8 | 4.6 | 1.3 | 3.2 |
| Men Age 16 – 64 | 90.5 | 6.7 | 1.3 | 1.5 | 0.5 | 1 |
| Adults Age 65 and over | 87.9 | 7.4 | 2.8 | 1.9 | 1 | 0.9 |
| 1987 | ||||||
| All Persons | 85.1 | 8.2 | 2.1 | 4.7 | 1.3 | 3.3 |
| Non-Hispanic White | 90.7 | 5.8 | 1.3 | 2.2 | 0.9 | 1.3 |
| Non-Hispanic Black | 59.1 | 18.7 | 6.5 | 15.7 | 3.9 | 11.8 |
| Hispanic | 71.7 | 13.6 | 3.8 | 10.9 | 2.2 | 8.7 |
| Children Age 0 - 5 | 75.5 | 10.9 | 3.7 | 10 | 2.7 | 7.3 |
| Children Age 6 - 10 | 76.8 | 10.5 | 2.6 | 10.1 | 2.8 | 7.3 |
| Children Age 11 - 15 | 80.2 | 9.2 | 2.6 | 8 | 1.6 | 6.4 |
| Women Age 16 - 64 | 85.6 | 7.9 | 1.9 | 4.6 | 1.1 | 3.5 |
| Men Age 16 – 64 | 89.9 | 6.8 | 1.4 | 2 | 0.8 | 1.2 |
| Adults Age 65 and over | 86.4 | 8.6 | 2.5 | 2.6 | 1.4 | 1.2 |
Figure IND 1b. Percentage of Recipients with More than 50 Percent of Income from AFDC and Food Stamps by Number of Years
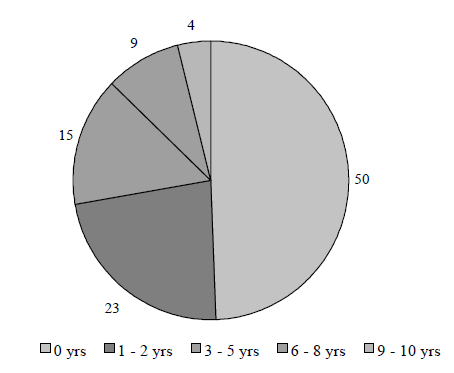
Source: Table IND 1b.
- For half of all recipients, AFDC and Food Stamps made up 50 percent or less of their total income in all years between 1982 and 1991. As shown in Table IND 1b, this was also true for 55 percent of all recipients between 1972 and 1981.
- The percentage of recipients who received more than 50 percent of their total income from AFDC and Food Stamps for 6 to10 years during the 1982 to 1991 period is considerably smaller than the corresponding percentage who were dependent for 1 to 5 years (13 percent compared to 38 percent).
- As shown in Table IND 1b, among child recipients, the percentage of black children who were not dependent—that is, were in families who did not receive more than 50 percent of their income from AFDC and Food Stamps in any year increased across the two time periods (from 24 percent to 31 percent). In comparison, the percentage of non-black recipient children who were not dependent decreased substantially across the two time periods (from 50 percent to 37 percent).
Table IND 1b. Percentage of Recipients with More than 50 Percent of Income from AFDC and Food Stamps by Number of Years
| All Recipients: 1982 - 1991 | |||
|---|---|---|---|
| Cumulative Years | All Recipients | Black | Non-Black |
| 100% | 100% | 100% | |
| 0 Years | 50 | 43 | 54 |
| 1 - 2 Years | 23 | 21 | 25 |
| 3 - 5 Years | 15 | 17 | 14 |
| 6 - 8 Years | 9 | 12 | 6 |
| 9 - 10 Years | 4 | 7 | 2 |
| Children 0 - 5 in 1982: 1982 - 1991 | |||
|---|---|---|---|
| Cumulative Years | All Child Recipients | Black | Non-Black |
| 100% | 100% | 100% | |
| 0 Years | 34 | 31 | 37 |
| 1 - 2 Years | 28 | 19 | 35 |
| 3 - 5 Years | 16 | 18 | 15 |
| 6 - 8 Years | 13 | 19 | 9 |
| 9 - 10 Years | 8 | 14 | 4 |
| All Recipients: 1972 - 1981 | |||
|---|---|---|---|
| Cumulative Years | All Recipients | Black | Non-Black |
| 100% | 100% | 100% | |
| 0 Years | 55 | 44 | 62 |
| 1 - 2 Years | 22 | 22 | 22 |
| 3 - 5 Years | 14 | 19 | 11 |
| 6 - 8 Years | 5 | 9 | 3 |
| 9 - 10 Years | 4 | 7 | 2 |
| Children 0 - 5 in 1972: 1972 - 1981 | |||
|---|---|---|---|
| Cumulative Years | All Child Recipients | Black | Non-Black |
| 100% | 100% | 100% | |
|
Note: Recipients are defined as individuals receiving at least $1 of AFDC or Food Stamps in the first year (1982 or 1972). Child recipients are defined by age in the first year. Source: Unpublished data from the PSID, 1972 - 1991. |
|||
| 0 Years | 39 | 24 | 50 |
| 1 - 2 Years | 25 | 27 | 23 |
| 3 - 5 Years | 21 | 27 | 17 |
| 6 - 8 Years | 6 | 9 | 4 |
| 9 - 10 Years | 9 | 12 | 6 |
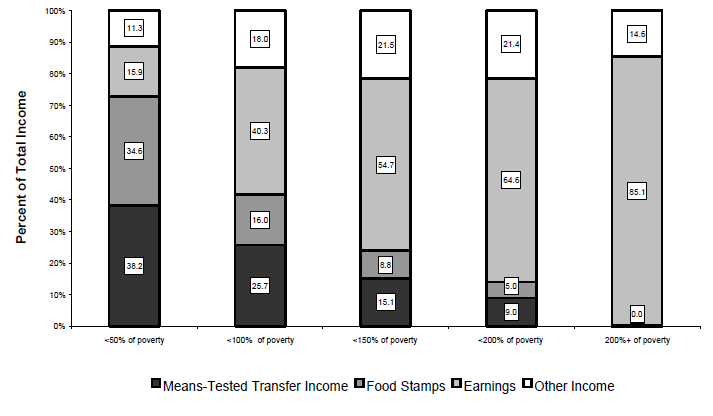
Figure IND 1c. Percentage of Total Income from Various Sources by Poverty Status, 1994
Source: Unpublished data from the SIPP, 1993 panel.
- Not surprisingly, poorer families received a larger percentage of their income from transfer programs and Food Stamps while wealthier families received a larger percentage of their income from earnings.
- Poor individuals (those in families with incomes below100 percent of poverty) received 42 percent of their total family income from means-tested assistance programs (transfer income and Food Stamps). In contrast, the percentage of total family income from means-tested assistance programs is much lower for those who are at least 200 percent above the poverty line (less than one percent).
- Those living in deep poverty (total family income less than 50 percent of the poverty line) relied heavily on transfer income from AFDC and SSI (38 percent of total family income) as well as Food Stamps (35 percent of total family income).
- The composition of income for all poor persons (less than 100 percent of poverty) is significantly different than the composition for those living in deep poverty (less than 50 percent of poverty). For example, the percentage of income from earnings for all poor individuals is more than twice the percent for those in deep poverty (40 percent compared to 16 percent). Those in deep poverty also rely much more heavily on income from transfer programs and Food Stamps compared to the full poverty population.
Table IND 1c. Percentage of Total Income from Various Sources by Poverty Status, 1994
| <50% of poverty | <100% of poverty | <150% of poverty | <200% of poverty | 200%+ of poverty | |
|---|---|---|---|---|---|
|
Note: Transfer income is defined as AFDC and SSI. While only affecting a small number of cases, general assistance income is included in AFDC income. Other income is non-means-tested, nonearnings income such as child support, alimony, pensions, Social Security benefits, interest and dividends. Poverty status categories are not mutually exclusive. Source: Unpublished data from the SIPP, 1993 panel. |
|||||
| All Persons | |||||
| Means-Tested Transfer Income | 38.2 | 25.7 | 15.1 | 9 | 0.2 |
| Food Stamps | 34.6 | 16 | 8.8 | 5 | 0 |
| Earnings | 15.9 | 40.3 | 54.7 | 64.6 | 85.1 |
| Other Income | 11.3 | 18 | 21.5 | 21.4 | 14.6 |
| Average Income | $ 6,946 | $ 10,708 | $ 13,377 | $ 16,740 | $ 57,249 |
| Racial Categories | |||||
| Non-Hispanic White | |||||
| Means-Tested Transfer Income | 28 | 20 | 10.5 | 5.5 | 0.2 |
| Food Stamps | 30.3 | 13.2 | 6.4 | 3.1 | 0 |
| Earnings | 24.2 | 42.9 | 55 | 64.8 | 84.3 |
| Other Income | 17.8 | 21.1 | 24.6 | 23.7 | 15.1 |
| Average Income | $ 5,296 | $ 9,589 | $ 12,609 | $ 16,448 | $ 58,188 |
| Non-Hispanic Black | |||||
| Means-Tested Transfer Income | 44.1 | 31.5 | 21.8 | 15.4 | 0.6 |
| Food Stamps | 40.5 | 20.2 | 12.7 | 8.8 | 0.2 |
| Earnings | 8.3 | 31 | 47.3 | 58.8 | 88.4 |
| Other Income | 6.5 | 17.5 | 18.1 | 16.8 | 10.4 |
| Average Income | $ 7,571 | $ 10,773 | $ 13,470 | $ 16,427 | $ 46,819 |
| Hispanic | |||||
| Means-Tested Transfer Income | 41 | 25.4 | 15.7 | 11.2 | 0.5 |
| Food Stamps | 34 | 16.6 | 9.8 | 6.5 | 0.1 |
| Earnings | 15.3 | 46.6 | 62 | 70 | 89.9 |
| Other Income | 6.2 | 14.7 | 16.2 | 15.6 | 10.4 |
| Average Income | $ 8,709 | $ 12,666 | $ 15,114 | $ 17,918 | $ 48,917 |
| Age Categories | |||||
| Children Age 0 - 5 | |||||
| Means-Tested Transfer Income | 44.4 | 28.6 | 17.9 | 11.8 | 0.2 |
| Food Stamps | 37.1 | 19.6 | 12.1 | 7.7 | 0.1 |
| Earnings | 11.2 | 40.8 | 58.8 | 70 | 93.4 |
| Other Income | 0 | 0 | 0 | 0 | 0 |
| Average Income | $ 7,825 | $ 11,813 | $ 14,763 | $ 18,236 | $ 59,336 |
| Children Age 6 - 10 | |||||
| Means-Tested Transfer Income | 39.9 | 28.2 | 18 | 11.4 | 0.2 |
| Food Stamps | 36.9 | 18.3 | 11.1 | 6.8 | 0 |
| Earnings | 14.7 | 40.9 | 58.1 | 70 | 93 |
| Other Income | 6.5 | 10.1 | 10.5 | 9.8 | 5.9 |
| Average Income | $ 8,675 | $ 12,802 | $ 15,688 | $ 19,408 | $ 63,068 |
| Children Age 11 - 15 | |||||
| Means-Tested Transfer Income | 37.2 | 27.7 | 16.7 | 9.7 | 0.2 |
| Food Stamps | 35.8 | 17.9 | 10.5 | 6 | 0 |
| Earnings | 16.9 | 39.9 | 56.7 | 68.9 | 92.4 |
| Other Income | 8.5 | 12.6 | 12.8 | 11.5 | 6.5 |
| Average Income | $ 8,628 | $ 12,822 | $ 15,718 | $ 19,780 | $ 65,892 |
| Women Age 16 - 64 | |||||
| Means-Tested Transfer Income | 36.9 | 26.6 | 15.5 | 9.2 | 0.2 |
| Food Stamps | 33.6 | 15.5 | 8.5 | 4.8 | 0 |
| Earnings | 17.2 | 40.6 | 57.4 | 68.4 | 87.8 |
| Other Income | 18.6 | 20.2 | 21.8 | 19.7 | 10.9 |
| Average Income | $ 6,126 | $ 9,808 | $ 12,636 | $ 16,045 | $ 57,632 |
| Men Age 16 - 64 | |||||
| Means-Tested Transfer Income | 23.5 | 18.7 | 10.7 | 6 | 0.2 |
| Food Stamps | 25.8 | 11.6 | 5.8 | 3 | 0 |
| Earnings | 27.1 | 50.3 | 63.1 | 72.7 | 89.1 |
| Other Income | 18.5 | 17.6 | 18.6 | 17.1 | 11.2 |
| Average Income | $ 4,837 | $ 10,173 | $ 13,488 | $ 17,335 | $ 58,751 |
| Adults Age 65 and over | |||||
| Means-Tested Transfer Income | 18.1 | 16.4 | 9.9 | 5.8 | 0.4 |
| Food Stamps | 16.2 | 4.1 | 1.9 | 1 | 0 |
| Earnings | 9.1 | 2.2 | 5.1 | 7.8 | 24.8 |
| Other Income | 25.4 | 26.4 | 26.4 | 25.1 | 17.3 |
| Average Income | $ 2,970 | $ 6,400 | $ 8,877 | $ 11,199 | $ 39,791 |
Indicator 2. Dependence Transitions
Whereas other indicators (Indicator 1a) illustrate the depth of dependence in a single year, this indicator reflects changes in the level of dependence over two years.
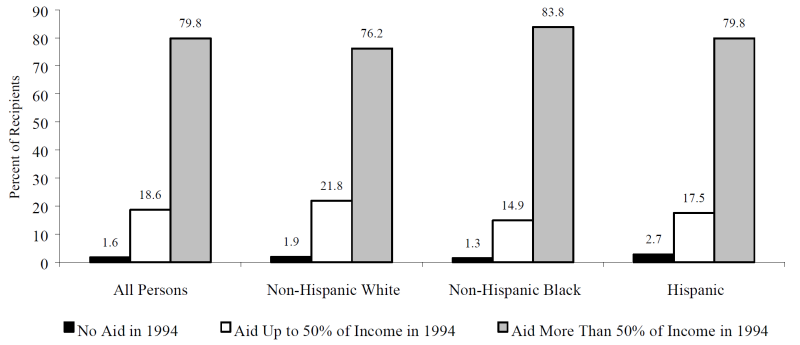
Figure IND 2. Dependency Status in 1994 of Persons who Received More Than 50 Percent of Income from Assistance in 1993
Source: Unpublished data from the SIPP, 1993 panel.
- Four-fifths of all recipients who received more than 50 percent of their total income from means-tested assistance programs in 1993 also received more than 50 percent of their total income from these same programs in 1994 (80 percent).
- Of recipients who received more than 50 percent of their total income from AFDC, Food Stamps and SSI in 1993, a larger percentage of non-Hispanic whites became “less dependent” in 1994 (received 50 percent or less of their total income from means-tested assistance programs) compared to Hispanics and non-Hispanic blacks, although the ratios were similar across all categories.
- While only a small percentage of all recipients who received more than 50 percent of their total income from means-tested assistance programs in 1993 received no aid in 1994, the corresponding percentage for Hispanics in 1994 (3 percent) is somewhat larger than the percentages for the other groups.
- As shown in Table IND 2, a slightly larger percentage of women who received more than half of their total income from means-tested assistance programs in 1993 remained “dependent” in 1994 compared to the same percentage for men (79 percent compared to 76 percent).
Table IND. 2. Dependency Status in 1994 of Persons Who Received More Than 50 Percent of Income from Means-Tested Assistance in 1993
| Percentage of Persons Receiving | ||||
|---|---|---|---|---|
| MORE THAN 50% TRANSFER INCOME IN 1993 | Total (thousands) | No Aid in 1994 | Up to 50% Aid in 1994 | More than 50% Aid in 1994 |
|
Note: Means-tested assistance is defined as AFDC, Food Stamps, and SSI. While only affecting a small number of cases, general assistance income is included within AFDC income. Source: Unpublished data from the SIPP, 1993 panel. |
||||
| All persons | 14810 | 1.6 | 18.6 | 79.8 |
| Racial Categories | ||||
| Non-Hispanic White | 5157 | 1.9 | 21.8 | 76.2 |
| Non-Hispanic Black | 4851 | 1.3 | 14.9 | 83.8 |
| Hispanic origin | 3623 | 2.7 | 17.5 | 79.8 |
| Age Categories | ||||
| Children Age 0−5 | 3639 | 1.3 | 18.1 | 80.6 |
| Children Age 6−10 | 2275 | 2.5 | 14.5 | 83.0 |
| Children Age 11−15 | 1800 | 1.1 | 22.2 | 76.7 |
| Men 16−64 | 1937 | 1.3 | 22.7 | 76.0 |
| Women 16−64 | 4588 | 2.0 | 19.0 | 79.0 |
| Adults 65 years and over | 571 | 0.0 | 9.1 | 90.7 |
Indicator 3. Dependence Spell Duration
In contrast to the indicator on duration of spells of means-tested assistance (Indicator 5), this indicator of dependence spell duration combines information on spells of receipt of means-tested assistance and paid employment.
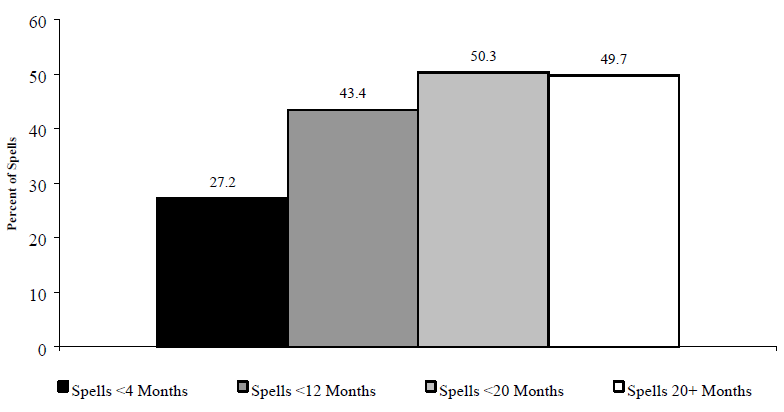
Figure IND 3. Duration of AFDC Spells of Individuals in Families Where No One Is in the Labor Force
Source: Table IND 3.
- Forty-three percent of AFDC spells for individuals in families with no one in the labor force ended within a year.
- Over one-quarter (27 percent) of AFDC spells for individuals in families where no one participated in the labor force were less than four months long.
- As shown in Table IND 3, a smaller percentage of AFDC spells to children in families with no labor force participants ended in less than four months compared to their adult counterparts (25 percent compared to 31 percent).
Table IND 3. Percentage of AFDC Spells for Individuals with No Family Member in the Labor Force by Length of Spell
| Percent of Spells | ||||
|---|---|---|---|---|
| Spells <4 months | Spells <12 months | Spells <20 months | Spells 20+ months | |
|
Note: Spell length categories are not mutually exclusive. Spells separated by only 1 month are not considered separate spells. Due to the length of the observation period, actual spell lengths for spells that lasted more than 20 months cannot be observed. AFDC spells are defined as those spells starting during the 1993 SIPP panel. For certain racial categories, data are not available (NA) because of insufficient sample size. Source: Unpublished data from the SIPP, 1993 panel. |
||||
| All persons | 27.2 | 43.4 | 50.3 | 49.7 |
| Racial Categories | ||||
| Non-Hispanic White | 30.2 | 40.7 | 43.0 | 57.0 |
| Non-Hispanic Black | 17.4 | 45.6 | NA | NA |
| Hispanic | 33.2 | NA | NA | NA |
| Age | ||||
| Children 0-15 | 24.7 | 41.9 | 49.1 | 50.9 |
| Adults Age 16-64 | 30.6 | 45.8 | 51.9 | 48.1 |
Indicator 4. Receipt of Means-tested Assistance and Labor Force Attachment
This indicator illustrates one aspect of the range of dependence by combining information on receipt of means-tested assistance and hours of employment.
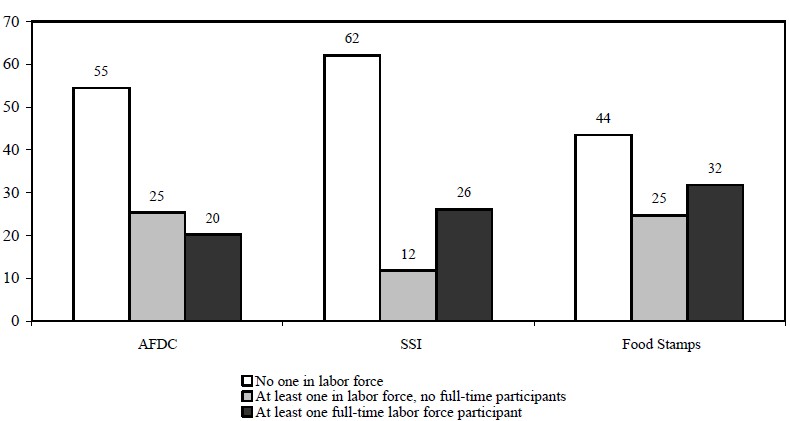
Figure IND 4a. Percentage of Recipients in Families with Labor Force Participants, 1994
Source: Unpublished data from the SIPP, 1993 panel.
- In 1994, 46 percent of individuals who received AFDC, 38 percent of individuals who received SSI, and 57 percent of individuals who received Food Stamps were in families with at least one person in the labor force.
- A larger percentage of individuals who received Food Stamps, compared to AFDC and SSI, were in families with at least one family member who participated in the labor force full-time.
- As shown in Table IND 4a, among AFDC recipients, a larger percentage of children under age 6 were in families with at least one full-time labor force participant compared to children age 6 to 15.
- As further shown in Table IND 4a, similar percentages of non-Hispanic white and non-Hispanic black AFDC recipients were in families with at least one full-time labor force participant (22 percent for both groups).
Table IND 4a. Percentage of Recipients in Families with Labor Force Participants, 1994
| No One in LF | At least 1 in LF No One FT | At least 1 FT Labor Force Participant | ||
|---|---|---|---|---|
|
Note: Full-time labor force participants are defined as those who usually work 35 or more hours per week. Data on receipt of SSI for young children is not available. Source: Unpublished data from the SIPP, 1993 panel. |
||||
| AFDC | All Recipients | 54.5 | 25.3 | 20.2 |
| Non-Hispanic White | 51.2 | 26.3 | 22.4 | |
| Non-Hispanic Black | 53.2 | 24.8 | 22.1 | |
| Hispanic | 62.5 | 20.7 | 16.8 | |
| Children Age 0 to 5 | 57.1 | 21.6 | 21.4 | |
| Children Age 6 to 10 | 59.3 | 23.8 | 16.9 | |
| Children Age 11 to 15 | 57.8 | 26.5 | 15.7 | |
| Women 16 to 64 | 52.5 | 25.7 | 21.8 | |
| Men 16 to 64 | 32.0 | 40.9 | 27.1 | |
| Adults 65 years and over | 68.7 | 29.4 | 1.9 | |
| SSI | All Recipients | 62.1 | 11.8 | 26.1 |
| Non-Hispanic White | 60.7 | 12.1 | 27.2 | |
| Non-Hispanic Black | 66.7 | 12.0 | 21.3 | |
| Hispanic | 61.5 | 11.3 | 27.1 | |
| Children Age 0 to 5 | NA | NA | NA | |
| Children Age 6 to 10 | NA | NA | NA | |
| Children Age 11 to 15 | 58.9 | 0.0 | 41.1 | |
| Women 16 to 64 | 56.7 | 14.9 | 28.4 | |
| Men 16 to 64 | 56.9 | 13.2 | 29.9 | |
| Adults 65 years and over | 73.1 | 6.8 | 20.1 | |
| FOOD STAMPS | All Recipients | 43.5 | 24.7 | 31.8 |
| Non-Hispanic White | 40.6 | 25.6 | 33.8 | |
| Non-Hispanic Black | 47.3 | 23.8 | 28.9 | |
| Hispanic | 44.2 | 22.3 | 33.6 | |
| Children Age 0 to 5 | 43.0 | 22.1 | 34.9 | |
| Children Age 6 to 10 | 44.6 | 24.2 | 31.2 | |
| Children Age 11 to 15 | 42.3 | 27.2 | 30.5 | |
| Women 16 to 64 | 31.0 | 30.4 | 38.6 | |
| Men 16 to 64 | 43.4 | 26.0 | 30.6 | |
| Adults Age 65 and over | 81.9 | 6.6 | 11.5 | |
Figure IND 4b. Percentage of AFDC Recipients in Families with Labor Force Participants, Selected Years
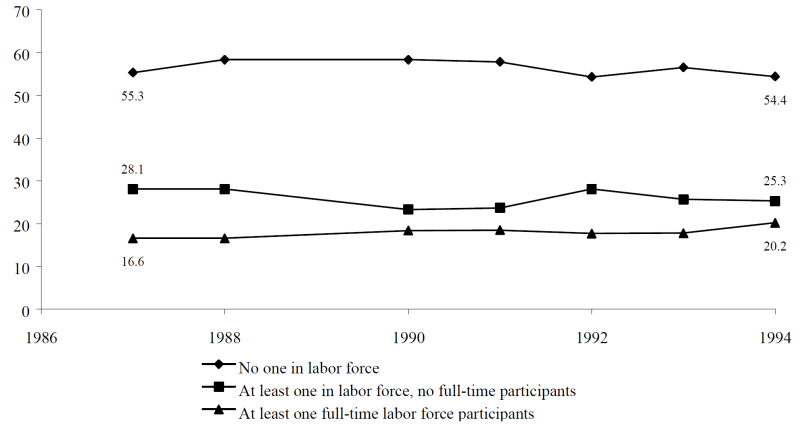
Source: Unpublished data from the SIPP, 1987, 1990, 1992, and 1993 panels.
As shown in Figure IND 4b, the percentage of all AFDC recipients living in families with at least one full-time labor force participant increased from 17 percent in 1987 to 20 percent in 1994.
In all years shown above, more than half of all AFDC recipients lived in families where no one participated in the labor force.
As shown in Table IND 4b, while 28 percent of AFDC recipients in 1992 lived in families with at least one labor force participant but no full-time participants, this percent decreased to 25 in 1994.
Table IND 4b. Percentage of AFDC Recipients in Families with Labor Force Participants, Selected Years
| No one In LF | At least 1 in LF No one FT | At least 1 FT Participant | |
|---|---|---|---|
|
Note: Full-time labor force participants are defined as those who usually work 35 or more hours per week. Source: Unpublished data from the SIPP, 1987, 1990, 1992, and 1993 panels. |
|||
| 1994 | 54.5 | 25.3 | 20.2 |
| 1993 | 56.5 | 25.7 | 17.8 |
| 1992 | 54.2 | 28.1 | 17.7 |
| 1991 | 57.8 | 23.7 | 18.5 |
| 1990 | 58.3 | 23.3 | 18.4 |
| 1988 | 58.3 | 28.1 | 16.6 |
| 1987 | 55.3 | 28.1 | 16.6 |
Indicator 5. Program Spell Duration
One critical aspect of dependence is how long individuals receive means-tested assistance. This indicator provides information on the length of individual spells.
Figure IND 5. Spells of Program Participation, 1993 SIPP Panel
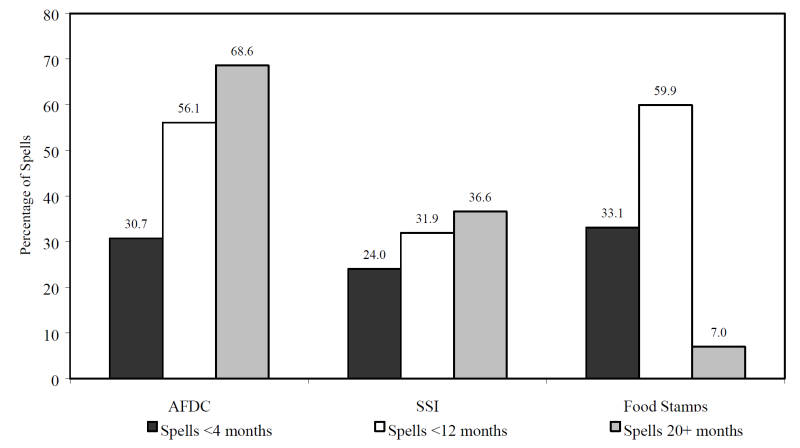
Source: Table IND 5.
Short spells lasting less than 4 months accounted for 31 percent of AFDC spells, 24 percent of SSI spells, and 33 percent of Food Stamp spells.
Over one-half of all AFDC and Food Stamp spells lasted less than one year (56 percent and 60 percent, respectively). In contrast, only 32 percent of SSI spells ended within one year. The percentage of SSI spells that lasted 20 or more months is twice the percentage of AFDC and Food Stamp spells that lasted this long.
As shown in Table IND 5, for AFDC spells, a larger percentage of short spells (lasting less than 4 months) and a smaller percentage of long spells (lasting 20 or more months) occurred among non-Hispanic whites compared to non-Hispanic blacks and Hispanics.
As further shown in Table IND 5, a larger percentage of AFDC and Food Stamp spells among adults age 16 to 64 ended within 4 months compared to spells among children age 0 to 15.
Table IND 5. Percentage of AFDC, Food Stamp and SSI Spells for Indiviudals Entering Programs During the 1993 SIPP Panel by Length of Spell
| Percentage of Spells | ||||
|---|---|---|---|---|
| Spells <4 months | Spells <12 months | Spells <20 months | Spells 20+ months | |
|
Note: Spell length categories are not mutually exclusive. Spells separated by only 1 month are not considered separate spells. Due to the length of the observation period, actual spell lengths for spells that lasted more than 20 months cannot be observed. For certain age and racial categories, data are not available (NA) because of insufficient sample size. Data on SSI recipiency for children are not available. Source: Unpublished data from the SIPP, 1993 Panel. |
||||
| AFDC | ||||
| Recipients | 30.7 | 56.1 | 68.6 | 31.4 |
| Racial Categories | ||||
| Non-Hispanic White | 35.6 | 62.2 | 72.3 | 27.7 |
| Non-Hispanic Black | 24.6 | 52.3 | 66.7 | 33.3 |
| Hispanic origin | 30.8 | 52.5 | 63.4 | 36.6 |
| Age Categories | ||||
| Children Age 0 to 15 | 28.1 | 53.6 | 65.6 | 34.4 |
| Adults 16 to 64 years | 33.5 | 59.0 | 72.2 | 27.8 |
| SUPPLEMENTAL SECURITY INCOME | ||||
| Recipients | 24.0 | 31.9 | 36.6 | 63.4 |
| Racial Categories | ||||
| Non-Hispanic White | 27.2 | 34.6 | 40.8 | 59.2 |
| Non-Hispanic Black | 20.5 | 26.2 | 30.0 | 70.0 |
| Hispanic origin | 20.0 | 32.2 | NA | NA |
| Age Categories | ||||
| Adults 16 to 64 years | 26.8 | 34.6 | 39.7 | 60.3 |
| FOOD STAMPS | ||||
| Recipients | 33.1 | 59.9 | 70.0 | 30.0 |
| Racial Categories | ||||
| Non-Hispanic White | 34.3 | 62.1 | 71.5 | 28.5 |
| Non-Hispanic Black | 28.4 | 53.4 | 64.9 | 35.1 |
| Hispanic origin | 35.4 | 64.0 | 71.1 | 28.9 |
| Age Categories | ||||
| Children Age 0 to 15 | 29.8 | 56.5 | 67.0 | 33.0 |
| Adults 16 to 64 years | 35.9 | 63.0 | 72.8 | 27.2 |
Indicator 6. Long-term Receipt
Lifetime welfare receipt often occurs in more than one episode. Indicators that measure the duration of receipt over a lifetime further reflect the depth of dependence.
Figure IND 6. Percentage of AFDC Recipients with Long-Term Receipt, 1982 – 1991
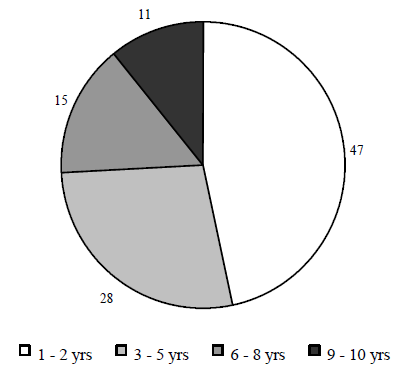
Source: Table IND 6.
Between 1982 and 1991, almost half of all recipients received AFDC in only one or two years (47 percent) and only about one-fifth of all recipients received AFDC for 9 to 10 years (11 percent). Table IND 6 shows that this was also true between 1972 and 1981 (49 percent and 11 percent respectively).
As shown in Table IND 6, compared to non-black recipients, a smaller percentage of black recipients received AFDC for only 1 to 2 years while a larger percentage received AFDC for 9 to 10 years in both ten-year time periods.
As further shown in Table IND 6, a smaller percentage of child recipients experienced shortterm receipt and a larger percentage experienced longer-term receipt in both time periods relative to the percentages for all recipients.
Table IND 6. Percentage of AFDC Recipients with Long-Term Receipt
| All Recipients 1982 - 1991 | |||
|---|---|---|---|
| Cumulative Years | All Recipients | Black | Non-Black |
| 1 - 2 Years | 47 | 37 | 53 |
| 3 - 5 Years | 28 | 27 | 28 |
| 6 - 8 Years | 15 | 19 | 12 |
| 9 - 10 Years | 11 | 17 | 6 |
| Children 0 - 5 in 1982: 1982-1991 | |||
|---|---|---|---|
| Cumulative Years | All Child Recipients | Black Children | Non-Black Children |
| 1 - 2 Years | 34 | 28 | 39 |
| 3 - 5 Years | 29 | 28 | 30 |
| 6 - 8 Years | 17 | 16 | 19 |
| 9 - 10 Years | 20 | 29 | 13 |
| All Recipients 1972 - 1981 | |||
|---|---|---|---|
| Cumulative Years | All Recipients | Black | Non-Black |
| 1 - 2 Years | 49 | 32 | 59 |
| 3 - 5 Years | 28 | 34 | 25 |
| 6 - 8 Years | 13 | 19 | 9 |
| 9 - 10 Years | 11 | 15 | 8 |
| Children 0 - 5 in 1972: 1972-1981 | |||
|---|---|---|---|
| Cumulative Years | All Child Recipients | Black Children | Non-Black Children |
|
Note: Recipients are defined as individuals receiving at least $1 of AFDC or Food Stamps in the past year (1982 or 1972). Child recipients are defined by age in the first year. Source: Unpublished data from the PSID, 1972 - 1991. |
|||
| 1 - 2 Years | 37 | 24 | 46 |
| 3 - 5 Years | 29 | 31 | 27 |
| 6 - 8 Years | 15 | 23 | 10 |
| 9 - 10 Years | 19 | 23 | 17 |
Indicator 7. Multiple Program Receipt
Data on multiple program receipt illustrates the nature of means-tested assistance “packages” and one aspect of the depth of dependence.
Figure IND 7. Percentage of Individuals in AFDC Families Receiving Other Assistance, 1994
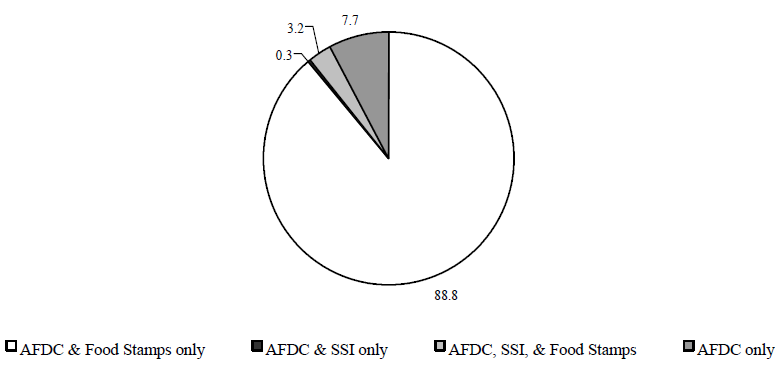
Source: Table IND 7.
- The vast majority of the AFDC population receives AFDC benefits in combination with Food Stamps, SSI, or both Food Stamps and SSI. Only about 8 percent received AFDC benefits without other means-tested assistance in 1994, as shown in Figure IND 7.
- The most common pattern of multiple program receipt in 1994, found among 89 percent of the AFDC population, was to receive both AFDC and Food Stamps. An additional 3 percent received AFDC, Food Stamps, and SSI. Finally, less than one-half percent received AFDC and SSI, but not Food Stamps. (Note that individuals may not receive both AFDC and SSI; however, a SSI recipient may be in a family where other members receive AFDC benefits.)
- Over time, the proportion of AFDC recipients also receiving Food Stamps has been constant varying only between 88 and 90 percent.
Table IND 7. Percentage of Individuals in AFDC Families Receiving Assistance from Other Programs
| AFDC and Food Stamps Only | AFDC and SSI Only | |||||||||
|---|---|---|---|---|---|---|---|---|---|---|
| 1990 | 1991 | 1992 | 1993 | 1994 | 1990 | 1991 | 1992 | 1993 | 1994 | |
| All Recipients | 88.4 | 88.6 | 89.6 | 89.9 | 88.8 | 0.3 | 0.4 | 0.4 | 0.2 | 0.3 |
| Racial Categories | ||||||||||
| Non-Hispanic White | 86.8 | 87.9 | 88.2 | 88.2 | 86.3 | 0.3 | 0.5 | 1.4 | 0.2 | 0.3 |
| Non-Hispanic Black | 88.3 | 87.0 | 90.1 | 90.6 | 89.8 | 0.4 | 0.5 | 0.6 | 0.5 | 0.4 |
| Hispanic | 91.0 | 92.3 | 90.1 | 91.4 | 89.1 | 0.2 | 0.1 | 0.4 | 0.0 | 0.3 |
| Age Categories | ||||||||||
| Children Age 0-5 | 90.7 | 89.7 | 92.3 | 93.1 | 93.7 | 0.0 | 0.0 | 0.0 | 0.0 | 0.0 |
| Children Age 6-10 | 91.5 | 93.4 | 92.5 | 94.3 | 92.4 | 0.0 | 0.0 | 0.0 | 0.0 | 0.0 |
| Children Age 11-15 | 92.0 | 92.1 | 94.5 | 93.2 | 92.2 | 0.0 | 0.2 | 0.0 | 0.0 | 0.0 |
| Women Age 16-64 | 84.9 | 85.0 | 85.8 | 84.5 | 82.4 | 0.7 | 0.7 | 0.9 | 0.6 | 0.7 |
| Men Age 16-64 | 85.1 | 84.6 | 83.4 | 86.4 | 84.9 | 0.4 | 1.1 | 1.1 | 0.2 | 0.3 |
| AFDC, SSIand Food Stamps | AFDC Only | |||||||||
|---|---|---|---|---|---|---|---|---|---|---|
| 1990 | 1991 | 1992 | 1993 | 1994 | 1990 | 1991 | 1992 | 1993 | 1994 | |
|
Note: Categories are mutually exclusive. Individuals may not receive both AFDC and SSI; however, an SSI recipient may be in a family where other members receive AFDC benefits. Source: Unpublished data from the SIPP, 1990, 1992, 1993 panels. |
||||||||||
| All Recipients | 1.7 | 1.9 | 2.4 | 2.9 | 3.2 | 9.5 | 9.1 | 7.6 | 7.0 | 7.7 |
| Racial Categories | ||||||||||
| Non-Hispanic White | 1.9 | 1.7 | 2.6 | 3.4 | 3.7 | 11.0 | 9.9 | 7.8 | 8.3 | 9.7 |
| Non-Hispanic Black | 1.7 | 2.4 | 2.7 | 2.8 | 3.2 | 9.6 | 10.1 | 6.5 | 6.2 | 6.7 |
| Hispanic | 1.3 | 1.6 | 1.5 | 2.2 | 2.8 | 7.6 | 6.0 | 8.0 | 6.4 | 7.7 |
| Age Categories | ||||||||||
| Children Age 0-5 | 0.0 | 0.0 | 0.0 | 0.0 | 0.0 | 9.3 | 10.3 | 7.7 | 6.9 | 6.3 |
| Children Age 6-10 | 0.0 | 0.0 | 0.0 | 0.0 | 0.0 | 8.5 | 6.6 | 7.5 | 5.7 | 7.6 |
| Children Age 11-15 | 0.0 | 0.0 | 0.1 | 0.2 | 0.2 | 8.0 | 7.7 | 5.3 | 6.7 | 7.7 |
| Women Age 16-64 | 4.1 | 4.6 | 5.8 | 7.8 | 8.9 | 10.3 | 9.6 | 7.6 | 7.2 | 8.0 |
| Men Age 16-64 | 4.4 | 5.2 | 4.7 | 3.8 | 3.4 | 10.1 | 9.1 | 10.8 | 9.6 | 11.3 |
Indicator 8. Events Associated with the Beginning and Ending of Receipt of Means-tested Assistance
The circumstances that are associated with beginnings or endings of receipt of assistance. reveal an important aspect of dependence that provides critical guidance for policy makers.
Table IND 8a. Percentage of First AFDC Spell Beginnings Associated with Specific Events
| Spell Began 1973 - 1979 | Spell Began 1980 - 1985 | Spell Began 1986 - 1991 | |
|---|---|---|---|
|
Note: Events are defined to be neither mutually exclusive nor exhaustive. Work limitation is defined as a self-reported physical or nervous condition that limits the type of work or the amount of work the respondent can do. Source: Unpublished data from the PSID, 1968 – 1992. |
|||
| First birth to an unmarried, non-cohabiting mother | 27.9 | 20.9 | 22.2 |
| First birth to a married and/or cohabiting mother | 13.3 | 17.4 | 11.3 |
| Second (or higher order) birth | 19.9 | 18.2 | 15.2 |
| Divorce/separation | 19.7 | 28.1 | 17.3 |
| Mother's work hours decreased by more than 500 hours per year | 26.3 | 18.8 | 26.2 |
| Other adults' work hours decreased by more than 500 hours, but no change in family structure | 34.8 | 27.9 | 21.6 |
| Other adults' work hours decreased by more than 500 hours, and a change in family structure | 4.7 | 7.9 | 11.4 |
| Householder acquired work limitation | 18.1 | 15.6 | 23.5 |
| Other transfer income dropped by $1,000 or more (in 1996$) | 4.5 | 6.5 | 4.1 |
| Changed state of residence | 4.5 | 10.6 | 5.4 |
- Between 1986 and 1991, the most common events associated with the beginnings of a first AFDC episode were work-related: a decrease in mother’s work hours (26 percent), a decrease in work hours of another adult (22 percent), and the acquisition of a work limitation (24 percent). In addition, over one-fifth (22 percent) of first spells were associated with a first birth to an unmarried, non-cohabiting mother.
- Between 1973 and 1979, first births to an unmarried, non-cohabiting mother were associated with 28 percent of first AFDC episodes. In contrast, such births were associated with 21 percent of first spells beginning between 1980 and 1985, and 22 percent beginning between 1986 and 1991.
- The percentage of first AFDC spell beginnings associated with a householder acquiring a work limitation was higher for spells that began between 1986 and 1991 (24 percent) than for spells that began between 1973 and 1979 (16 percent) or 1980 to 1985 (18 percent).
Table IND 8b. Percentage of First AFDC Spell Endings Associated with Specific Events
| Spell Ended 1973 - 1979 | Spell Ended 1980 – 1985 | Spell Ended 1986 - 1991 | |
|---|---|---|---|
|
Note: Events are defined to be neither mutually exclusive nor exhaustive. Work limitation is defined as a selfreported physical or nervous condition that limits the type of work or the amount of work the respondent can do. Source: Unpublished data from the PSID, 1968 - 1992. |
|||
| Mother married or acquired cohabitor | 16.1 | 17.1 | 21.7 |
| Children under 18 no longer present | 4.4 | 4.1 | 4.8 |
| Mother's work hours increased by more than 500 hours per year | 15.4 | 25.0 | 27.1 |
| Other adults' work hours increased by more than 500 hours, but no change in family structure | 21.8 | 16.8 | 16.7 |
| Other adults' work hours increased by more than 500 hours, and a change in family structure | 6.5 | 10.3 | 5.8 |
| Householder no longer reports work limitation | 13.0 | 19.2 | 15.8 |
| Other transfer income increased by $1,000 or more (in 1996$) | 5.0 | 5.5 | 5.8 |
| Changed state of residence | 5.9 | 11.0 | 5.9 |
- During the 1986 to 1991 time period, over one-fourth (27 percent) of first AFDC spell endings were associated with increases in mother’s work hours. The corresponding percentage was slightly smaller for spells ending in the 1980 to 1985 period (25 percent) and much smaller for spells ending between 1973 and 1979 (15 percent).
- In the 1973 - 1979 period, a greater percentage of spell endings was associated with an increase in work hours for other adults (22 percent) as compared to mothers (15 percent). In the more recent time period (1986 - 1991), a greater percentage of spell endings was associated with an increase in mother’s work hours (27 percent) compared to other adults (17 percent).
Indicator 9. Percent of the Population Receiving Means-tested Assistance
The rate of receipt reflects an important aspect of dependence by measuring the extent to which various population subgroups rely on the major means-tested programs.
Figure IND 9a. AFDC Recipients as a Percent of the Population
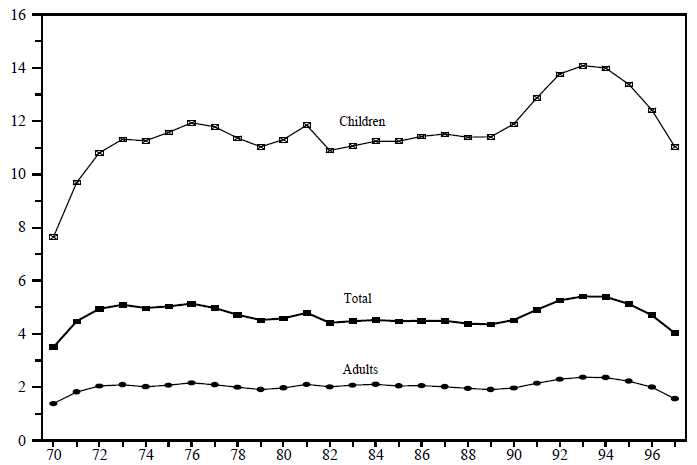
Source: U.S. Department of Health and Human Services, Administration for Children and Families, Office of Family Assistance and U.S. Bureau of the Census, Release PPL-91, United States Population Estimates, by Age, Sex, Race, and Hispanic Origin, 1990 to 1997, (Available online at http://www.census.gov).
- In all years between 1970 and 1997, the percentage of all children who received AFDC is much larger than that for adults.
- Participation for children under age 18 increased substantially between 1970 and 1976. While remaining relatively stable through most of the 1980s, the trend again increased dramatically from 1990 to 1994 before declining to its current level.
- Table IND 9a shows that between 1994 and 1997 the percentage of all children who received AFDC decreased more than three percentage points (from 14.0 percent to 10.8 percent).
Table IND 9a. AFDC/TANF Recipients as a Percent of the Population, Selected Years 1
| 1970 | 1975 | 1980 | 1985 | 1988 | 1990 | 1994 | 1996 | 1997 4 | |
|---|---|---|---|---|---|---|---|---|---|
|
1 The Personal Responsibility and Work Opportunity Reconciliation Act of 1996 repealed the AFDC Program as of July 1, 1997 and replaced it with the Temporary Assistance to Needy Families Program. 2 Does not include the territories. 3 Includes a small number of dependents 18 and older who are students. 4 Average number of adults and children based on the first three quarter of 1997 only; data on number of adults and children under TANF not currently available. Note: Only selected years of data presented in Figure IND 9a are included in the table. Source: U.S. Department of Health and Human Services, Administration for Children and Families, Office of Family Assistance and U.S. Bureau of the Census, release PPL-91, United States Population Estimates, by Age, Sex, Race, and Hispanic Origin, 1990 to 1997, (available online at http://www.census.gov). |
|||||||||
| AFDC/TANF Recipients (millions) 2 | |||||||||
| Total Recipients | 7.2 | 10.9 | 10.4 | 10.6 | 10.7 | 11.3 | 14.0 | 12.5 | 10.8 |
| Adult Recipients | 1.9 | 3.1 | 3.2 | 3.6 | 3.5 | 3.6 | 4.6 | 3.9 | 3.1 |
| Child Recipients 3 | 5.3 | 7.8 | 7.2 | 7.0 | 7.2 | 7.6 | 9.5 | 8.6 | 7.7 |
| AFDC/TANF RecipiencyRates (percent) | |||||||||
| Total | 3.5 | 5.0 | 4.6 | 4.5 | 4.4 | 4.5 | 5.4 | 4.7 | 4.0 |
| Adults | 1.4 | 2.1 | 2.0 | 2.0 | 2.0 | 2.0 | 2.4 | 2.0 | 1.6 |
| Children | 7.6 | 11.6 | 11.3 | 11.2 | 11.4 | 11.9 | 13.9 | 12.4 | 11.0 |
Figure IND 9b. Food Stamp Recipients as a Percent of the Population
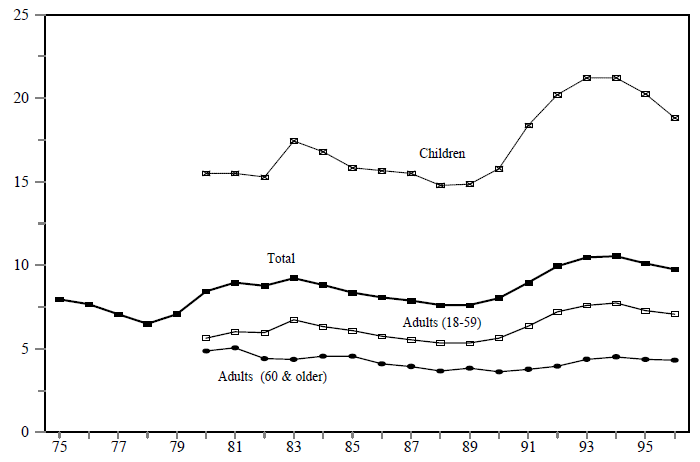
Source: USDA, Food and Nutrition Service, Office of Analysis and Evaluation, Characteristics of Food Stamp Households, Summer 1996, and earlier reports and U.S. Bureau of the Census, release PPL-91, United States Population Estimates, by Age, Sex, Race, and Hispanic Origin, 1990 to 1997, (Available online at http://www.census.gov).
- In all years between 1970 and 1997, the percentage of all children who received AFDC is much larger than that for adults.
- Participation for children under age 18 increased substantially between 1970 and 1976. While remaining relatively stable through most of the 1980s, the trend again increased dramatically from 1990 to 1994 before declining to its current level.
Table IND 9a shows that between 1994 and 1997 the percentage of all children who received AFDC decreased more than three percentage points (from 14.0 percent to 10.8 percent).
| 1975 | 1980 | 1985 | 1988 | 1990 | 1992 | 1994 | 1996 | |
|---|---|---|---|---|---|---|---|---|
|
1 Does not include the territories. Note: Only selected years of data presented in Figure IND 9b are included in the table. Source: USDA, Food and Nutrition Service, Office of Analysis and Evaluation, Characteristics of Food Stamp Households, Summer 1996, and earlier reports and U.S. Bureau of the Census, release PPL-91, United States Population Estimates, by Age, Sex, Race, and Hispanic Origin, 1990 to 1997, (Available online at http://www.census.gov.) |
||||||||
| Food Stamp Recipients (millions) 1 | ||||||||
| Total (all ages) | 17.1 | 19.2 | 19.8 | 18.6 | 20.0 | 25.4 | 27.4 | 25.5 |
| Adults (60 and over) | NA | 1.7 | 1.8 | 1.5 | 1.5 | 1.7 | 2.0 | 1.9 |
| Adults (18 to 59) | NA | 7.2 | 8.3 | 7.5 | 8.1 | 10.5 | 11.5 | 10.8 |
| Children | NA | 9.9 | 9.9 | 9.4 | 10.1 | 13.3 | 14.4 | 13.0 |
| Food Stamp Recipiency Rates (percent) | ||||||||
| Total (all ages) | 7.9 | 8.4 | 8.3 | 7.6 | 8.0 | 9.9 | 10.5 | 9.6 |
| Adults (60 and over) | NA | 4.9 | 4.5 | 3.7 | 3.6 | 4.0 | 4.5 | 4.3 |
| Adults (18-59) | NA | 5.6 | 6.1 | 5.3 | 5.6 | 7.2 | 7.7 | 7.1 |
| Children | NA | 15.5 | 15.8 | 14.8 | 15.8 | 20.2 | 21.2 | 18.8 |
Figure IND 9c. SSI Recipients as a Percent of the Population
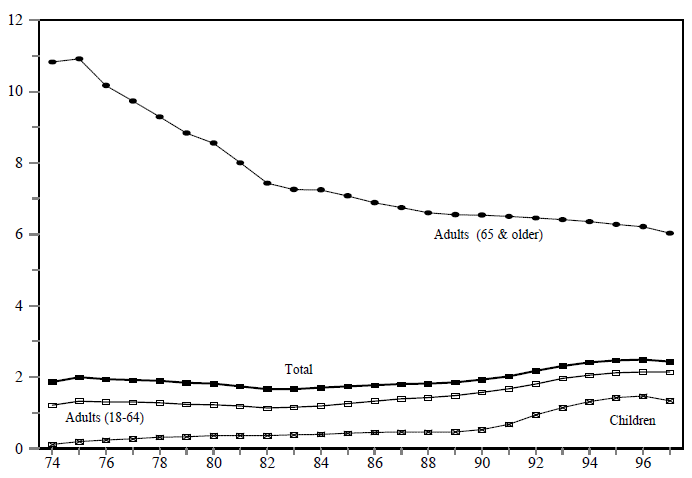
Note: Recipients are reported as of December in each year.
Source: Social Security Administration, Office of Research, Evaluation, and Statistics (data available online at http://www.ssa.gov/statistics/ores_home.html) and U.S. Bureau of the Census, Release PPL-91, United States Population Estimates, by Age, Sex, Race, and Hispanic Origin, 1990 to 1997, (Available online at http://www.census.gov).
- In all years between 1974 and 1996, the percentage of adults 65 and older who received SSI is much larger than that for all other age groups.
- Trends are similar for all persons under age 64 generally increasing between 1974 and 1996. For those 65 and older, the trend moves in the opposite direction decreasing dramatically from nearly 11 percent in 1974 to 6 percent in 1996.
Table IND 9c. SSI Recipients as a Percent of the Population, Selected Years
| Dec '75 | Dec '80 | Dec '85 | Dec '88 | Dec '90 | Dec '92 | Dec '94 | Dec '96 | Dec '97 | |
|---|---|---|---|---|---|---|---|---|---|
|
1 December population figures used as the denominators are obtained by averaging the Census’ July 1 population estimate for the current and the following year. 2 Children includes some recipients 18 and older who are students. Note: Only selected years of data presented in Figure IND 9c are included in the table. Source: Social Security Administration, Office of Research, Evaluation, and Statistics (data available online at http://www.ssa.gov/statistics/ores_home.html) and U.S. Bureau of the Census, release PPL-91, United States Population Estimates, by Age, Sex, Race, and Hispanic Origin, 1990 to 1997, (Available online at http://www.census.gov). |
|||||||||
| SSI Recipients (millions) | |||||||||
| Total (all ages) | 4.3 | 4.1 | 4.1 | 4.5 | 4.8 | 5.6 | 6.3 | 6.6 | 6.5 |
| Adults (65 and over) | 2.5 | 2.2 | 2.0 | 2.0 | 2.1 | 2.1 | 2.1 | 2.1 | 2.1 |
| Adults (18 to 64) | 1.7 | 1.7 | 1.8 | 2.2 | 2.4 | 2.8 | 3.3 | 3.5 | 3.5 |
| Children 2 | 0.1 | 0.2 | 0.3 | 0.3 | 0.3 | 0.6 | 0.9 | 1.0 | 0.9 |
| SSI Recipiency Rates (percent) | |||||||||
| Total (all ages) | 2.0 | 1.8 | 1.7 | 1.8 | 1.9 | 2.2 | 2.4 | 2.5 | 2.4 |
| Adults (65 and over) | 10.9 | 8.6 | 7.1 | 6.6 | 6.5 | 6.5 | 6.4 | 6.2 | 6.0 |
| Adults (18-64) | 1.3 | 1.2 | 1.2 | 1.4 | 1.6 | 1.8 | 2.1 | 2.1 | 2.1 |
| Children | 0.2 | 0.4 | 0.4 | 0.5 | 0.5 | 0.9 | 1.3 | 1.5 | 1.3 |
Indicator 10. Rates of Participation in Means-tested Assistance Programs
Not all eligible households participate in means-tested programs. This indicator reflects “take up rates” – the number of families that actually participate in the program as a percent of those who are eligible.
Figure IND 10a. AFDC Caseload versus Number of Eligible Families: Number of Cases & Percentage of Total Eligibles
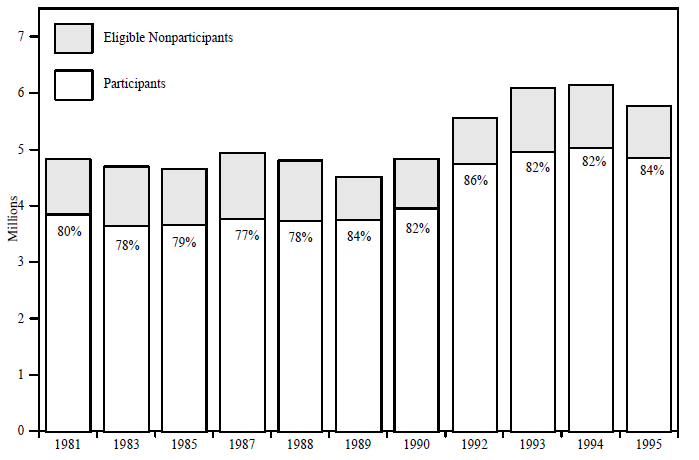
Source: Participation rates estimated by the Urban Institute using TRIM model simulations. Caseload based on data from DHHS, Administration for Children and Families.
- The percentage of all eligible families who participated in AFDC has varied between 77 percent and 86 percent according to estimates for selected years between 1981 and 1995. Estimates of the total eligible population varied from 4.5 million to over 6 million families over the same time period.
Table IND 10a. AFDC Caseload as a Percentage of Eligible Families
| 1981 | 1983 | 1985 | 1987 | 1989 | 1990 | 1992 | 1994 | 1995 | |
|---|---|---|---|---|---|---|---|---|---|
| Source: Participation rates estimated by the Urban Institute using TRIM model simulations. Caseload based on data from DHHS, Administration for Children and Families. | |||||||||
| Average Monthly Eligibles | 4,827 | 4,700 | 4,655 | 4,933 | 4,512 | 4,834 | 5,565 | 6,143 | 5,775 |
| Average Caseload | 3,871 | 3,651 | 3,692 | 3,784 | 3,771 | 3,974 | 4,768 | 5,046 | 4,869 |
| Participation rate | 80 | 78 | 79 | 77 | 84 | 82 | 86 | 82 | 84 |
Figure IND 10b. Food Stamp Households as a Percentage of Eligible Households
Source: Table IND 10b.
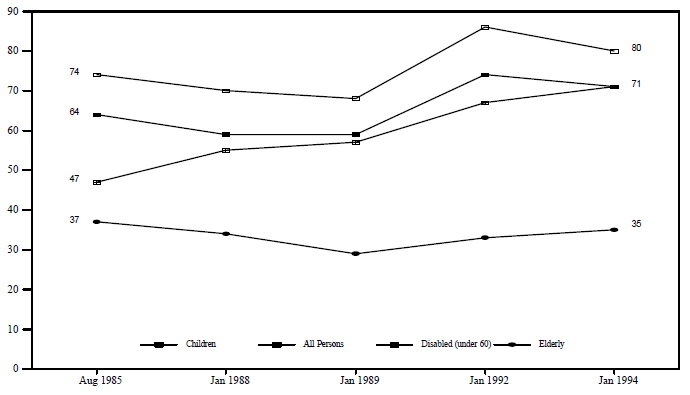
- In all years, larger percentages of children in eligible households received Food Stamps compared to other age groups, and smaller percentages of the elderly in eligible households received Food Stamps compared to other adults and children.
- For disabled persons under age 60, the percentage in eligible households who received Food Stamps increased substantially between 1985 and 1994, from 47 percent in 1985 to 71 percent in 1994.
Table IND 10b. Food Stamp Households as a Percentage of Eligible Households
| Persons | Households | Elderly | Children | Disabled Under 60 | Adults 18-59 | |
|---|---|---|---|---|---|---|
| Source: U.S. Department of Agriculture, Food and Nutrition Service, Trends in Food Stamp Program Participation Rates, various years. | ||||||
| August 1985 | 64 | 59 | 37 | 74 | 47 | 65 |
| January 1988 | 59 | 56 | 34 | 70 | 55 | 66 |
| January 1989 | 59 | 56 | 29 | 68 | 57 | 60 |
| January 1992 | 74 | 69 | 33 | 86 | 67 | 77 |
| January 1994 | 71 | 69 | 35 | 80 | 71 | 73 |
Figure IND 10c. SSI Adult Recipients as a Percentage of Eligible Adults
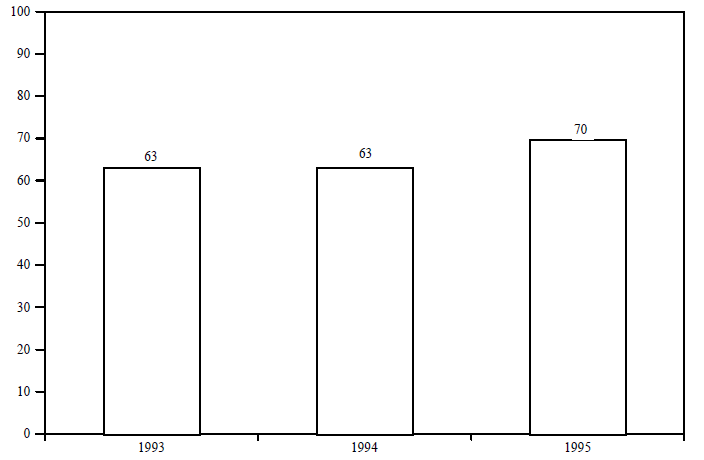
Source: Table IND 10c.
- For all adults, the percentage of those eligible that received SSI remained constant between 1993 and 1994 (63 percent) and increased substantially in 1995 (from 63 percent to 70 percent).
- For all adults in 1995, a larger percentage of eligible disabled adults in one-person units participated in the SSI program (74 percent) compared to both eligible aged adults in oneperson units (65 percent) and adults in married-couple units (52 percent).
Table IND 10c. SSI Adult Recipients by Type as a Percentage of Eligible Group
| 1993 | 1994 | 1995 | |
|---|---|---|---|
|
Note: The figure for married-couple units is based on very small sample sizes–married couple units were only about 5 percent of the adults units in the average month of 1995. Source: Participation rate estimated by the Urban Institute using the TRIM model. |
|||
| All adults | 63 | 63 | 70 |
| One-person units– aged | NA | NA | 65 |
| One-person units– disabled | NA | NA | 74 |
| Married-couple units | NA | NA | 52 |
Indicator 11. Means-tested Assistance Program Transition Rates
This indicator shows how many people have moved onto means-tested assistance programs and how many recipients have moved off means-tested assistance programs.
Figure IND 11a. Percentage of Non-Recipients Moving on to Assistance from 1993 to 1994
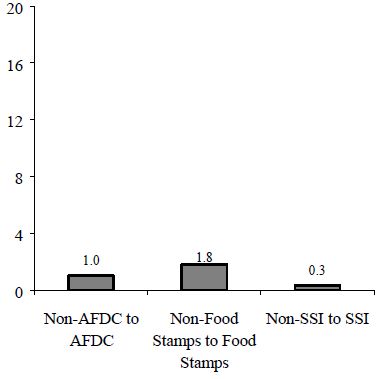
Figure IND 11b. Percentage of Recipients Moving off Assistance from 1993 to 1994
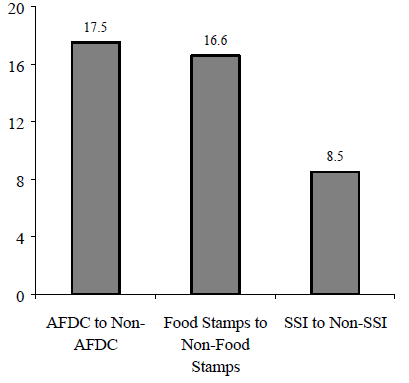
Source: Unpublished data from the SIPP, 1993 panel.
- As shown in Figure IND 11a, only a small percentage of individuals who did not receive AFDC in 1993 began receiving AFDC benefits in 1994 (1 percent). In comparison, the percentage of non-recipients who began receiving Food Stamps in 1994 was slightly higher (2 percent) and the percentage of non-recipients who began receiving SSI in 1994 was lower (less than 1 percent).
- As shown in Figure IND 11b, 18 percent of AFDC recipients in 1993 moved off AFDC in 1994. Similarly, 17 percent of Food Stamp recipients in 1993 were no longer receiving Food Stamp benefits in 1994. In contrast, only 9 percent of individuals who received SSI in 1993 left the SSI program in 1994.
- Non-Hispanic whites are somewhat less likely to move from non-assistance to assistance than non-Hispanic blacks and Hispanics, as shown in Table IND 11. For example, while only 1 percent of non-Hispanic white individuals who did not receive AFDC in 1993 began receiving AFDC benefits in 1994, the corresponding percentages for non-Hispanic blacks and Hispanics were somewhat higher (3 percent).
- As shown in Table IND 11, a much higher percentage of Hispanic AFDC recipients in 1993 exited AFDC in 1994 (25 percent) compared to both non-Hispanic whites and non-Hispanic blacks (17 percent and 12 percent, respectively).
- As further shown in Table IND 11, men are much more likely to move off AFDC and Food Stamps than are women. For example, while 18 percent of women who received AFDC in 1993 were no longer receiving AFDC benefits in 1994, 33 percent of men who received AFDC in 1993 left the AFDC program in 1994.
Table IND 11. Means-Tested Assistance Program Transition Rates, 1993 to 1994
| Number andPercentage of Non-RecipientsMoving onto Assistance | ||||||
|---|---|---|---|---|---|---|
| Non-AFDC to AFDC | Non-FS to FS | Non-SSI to SSI | ||||
| Number (thousands) | Percent | Number (thousands) | Percent | Number (thousands) | Percent | |
| All Persons | 2215 | 1.0 | 3878 | 1.8 | 702 | 0.3 |
| Racial Categories | ||||||
| Non-Hispanic White | 1159 | 0.6 | 2041 | 1.2 | 397 | 0.2 |
| Non-Hispanic Black | 503 | 3.0 | 922 | 4.7 | 155 | 0.6 |
| Hispanic | 437 | 2.7 | 734 | 4.3 | 114 | 0.5 |
| Age Categories | ||||||
| Children Age 0 - 5 | 403 | 2.4 | 573 | 3.9 | 0 | 0 |
| Children Age 6 - 10 | 313 | 1.9 | 518 | 3.6 | 0 | 0 |
| Children Age 11 - 15 | 348 | 2.1 | 361 | 2.4 | 0 | 0 |
| Women Age 16 - 64 | 780 | 1.0 | 1299 | 1.8 | 415 | 0.5 |
| Men Age 16 – 64 | 343 | 0.4 | 982 | 1.3 | 264 | 0.3 |
| Adults Age 65 and over | 28 | 0.1 | 145 | 0.6 | 23 | 0.1 |
| Number and Percentage of RecipientsMoving off Assistance | ||||||
|---|---|---|---|---|---|---|
| AFDC to Non-AFDC | FS to Non-FS | SSI to Non-SSI | ||||
| Number (thousands) | Percent | Number (thousands) | Percent | Number (thousands) | Percent | |
|
Note: Receipt is measured by at least one month of receipt in a given year and non-receipt is measured as no months of receipt in a given year. Source: Unpublished data from the SIPP, 1993 panel |
||||||
| All Persons | 2799 | 17.5 | 5184 | 16.6 | 453 | 8.5 |
| Racial Categories | ||||||
| Non-Hispanic White | 1493 | 16.6 | 2999 | 21.5 | 232 | 8.8 |
| Non-Hispanic Black | 641 | 11.9 | 1012 | 11.4 | 162 | 10.7 |
| Hispanic | 583 | 25.0 | 1070 | 15.4 | 35 | 4.3 |
| Age Categories | ||||||
| Children Age 0 - 5 | 610 | 15.3 | 818 | 13.7 | 0 | 0 |
| Children Age 6 - 10 | 408 | 14.0 | 602 | 13.2 | 0 | 0 |
| Children Age 11 - 15 | 308 | 14.3 | 464 | 12.6 | 0 | 0 |
| Women Age 16 - 64 | 992 | 18.3 | 1796 | 17.6 | 288 | 12.2 |
| Men Age 16 – 64 | 470 | 32.5 | 1418 | 26.2 | 118 | 9.3 |
| Adults Age 65 and over | 11 | 24.1 | 87 | 6.1 | 47 | 2.8 |
Indicator 12. Intergenerational Dependence
Another key aspect of dependence is the extent to which parental receipt of means-tested assistance is associated with receipt by their children when the children become adults.
Figure IND 12. Percentage of Youth Recipients (14 to 16) and Youth Non-Recipients (14 to 16) who Received Three Years of Benefits as Adults (25 to 27)
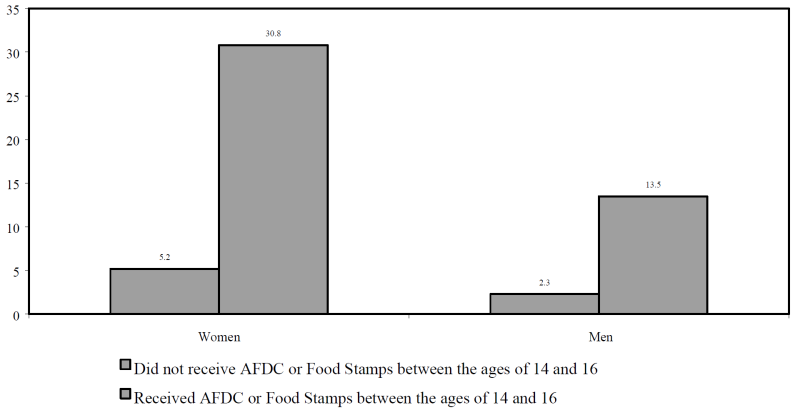
Source: Table IND 12.
- Individuals who receive AFDC or Food Stamps as children are more likely to receive benefits as adults, as shown in Figure IND 12. Almost one-third (31 percent) of women who received AFDC or Food Stamps in childhood between the ages of 14 and 16 also received AFDC or Food Stamps at ages 25, 26 and 27. In comparison, only 5 percent of women who did not receive AFDC or Food Stamps as youths received three years of benefits as adults.
- The same relationship exists among men, although they have lower rates of receipt of means-tested assistance. As shown in Table IND 12, 14 percent of men who received AFDC or Food Stamps between the ages of 14 and 15 also received three years of benefits in adulthood and a much lower percentage – 2 percent – of men who did not receive AFDC or Food Stamps as youths received benefits at age 25, 26, and 27.
- As shown in Table IND 12, 61 percent of women and 32 percent of men who received AFDC or Food Stamps between the ages of 14 and 16 also received AFDC or Food Stamp benefits in at least one year as adults between the ages of 25 and 27. These percentages are much larger than those for men and women who received benefits as children between the ages of 14 and 16 and received benefits as adults in all three years from age 25 to 27 (31 percent for women and 14 percent for men).
Table IND 12. Association of Benefit Receipt as Youth (14 to 16) with Benefit Receipt as Adults (25 to 27)
| Females born 1960 - 1964 | Males born 1960 - 1964 | |
|---|---|---|
|
Note: Receipt of AFDC or Food Stamps in a year refers to any amount at any point during the year. Source: Unpublished data from the PSID, 1974 - 1992. |
||
| Percent who did not receive AFDC or Food Stamps between the ages of 14 and 16 who received AFDC or Food Stamps in all 3 years from age 25 to 27. | 5.2 | 2.3 |
| Percent who received AFDC or Food Stamps for all 3 years between the ages of 14 and 16 who also received AFDC or Food Stamps in all 3 years from age 25 to 27. | 30.8 | 13.5 |
| Percent who did not receive AFDC or Food Stamps between the ages of 14 and 16 who received AFDC or Food Stamps in at least 1 year from age 25 to 27. | 10.0 | 8.5 |
| Percent who received AFDC or Food Stamps for all 3 years between the ages of 14 and 16 who received AFDC or Food Stamps in at least 1 year from age 25 to 27. | 61.3 | 31.8 |
Chapter III. Predictors and Risk Factors Associated with Welfare Receipt
The Welfare Indicators Act challenges the Department of Health and Human Services, and indirectly the Advisory Board on Welfare Indicators, to identify and set forth not only indicators of welfare dependence and welfare duration, but also predictors and causes of welfare receipt. Up to this point, welfare research has not established clear and definitive causes of welfare dependence. However, research has identified a number of risk factors associated with welfare utilization. For purposes of this report, the terms “predictors” and “risk factors” are used somewhat interchangeably, although the differences between them are acknowledged.
Where the Advisory Board recommended narrowing the focus of dependence indicators, it recommended an expansive view toward predictors and risk factors. The range of possible predictors is extremely wide, and until they are measured and analyzed over time as the PRWORA changes are implemented, their value will not be known. Some of the “predictors” included in this chapter may turn out to be simply correlates of welfare receipt, some may have a causal relationship, some may be consequences, and some may have predictive value.
For purposes of this report, the predictors/risk factors included in this chapter are grouped into three categories:
ECON. The first group includes measures associated with economic security. This group encompasses measures of poverty, child support receipt, food insecurity, health care coverage, household mobility, and adult incarceration. The poverty-related measures in this group include overall and child poverty rates, transitions in and out of poverty, lengths of poverty spells, events associated with entries and exits from poverty, intergenerational poverty, pre- and post-cash transfers poverty rates, and high-poverty neighborhoods. For ease of presentation, the tables and figures illustrating measures of economic security are labeled with the prefix ECON throughout this chapter.
WORK. The second grouping (labeled with the WORK prefix) includes factors related to employment and barriers to employment. Data on labor force attachment and earnings for low-skilled workers are included, as are data on barriers to work. The latter category includes incidence of adult disabilities and children with chronic health conditions, adult substance abuse, levels of educational attainment and school drop-out rates, and child care costs.
TEEN. The final group addresses behavioral issues primarily affecting teenagers. This category includes out-of-wedlock childbearing data, onset of sexual activity, teen substance abuse and arrest data, and information on teens who are neither in school nor working. The tables and figures in this subsection are labeled with the TEEN prefix.
As noted above, the predictors/risk factors included in this chapter do not represent an exhaustive list of measures. They are, in fact, a sampling of available data that address in some way the question of how a family is faring on the deprivation/well-being scale. Such questions are a necessary part of the dependence discussion during this time of major change in the welfare rules. It is important to examine whether decreases in dependence measures are accompanied by improvements in family well-being (as, for example, if work activities increase) or by reductions in family’s material circumstance (which could happen as families lose access to benefits because of time limits or sanctions).
Economic Security Risk Factor 1. Poverty Rates
Poverty rates illustrate the economic condition of families and, as such, a key risk factor of dependence.
Figure ECON 1a. Percentage in Poverty by Age
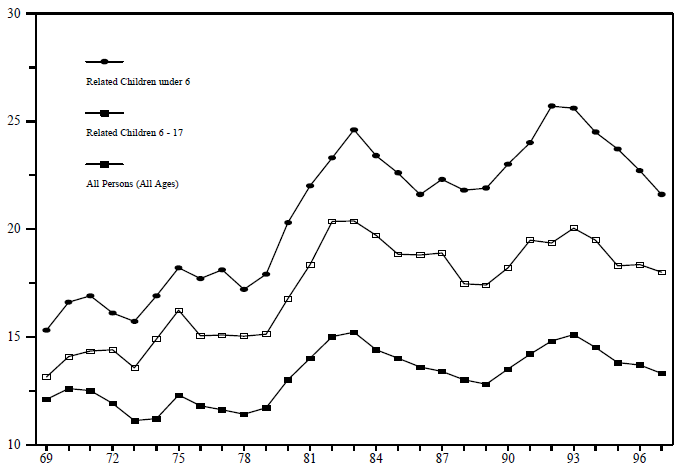
Source: U.S. Bureau of the Census, “Poverty in the United States: 1997," Current Population Reports, Series P60-201 and unpublished tables available online at http://www.census.gov/hhes/www/poverty.html.
- The percentage of people living in poverty fell from 13.7 percent to 13.3 percent between 1996 and 1997. This decline continues the trend since 1993, when poverty rates were at a ten-year high of 15.1 percent.
- Children, particularly young children, have much higher poverty rates than the overall population. The poverty rate for related children under 6 reached 25.7 percent in 1992. Since then it has declined, falling to 21.6 percent in 1997.
- Table Econ 1a shows that the poverty rate for blacks declined from 28.4 percent in 1996 to 26.5 percent in 1997. It still remains higher than the 11.0 percent rate for whites. The poverty rate for Hispanics also dropped between 1996 and 1997 from 29.4 percent to 27.1 percent.
Table ECON 1a. Number and Percentage of Persons in Poverty by Age, Sex, Race and Hispanic Origin, Selected Years
| Related Children | All Persons | ||||||||
|---|---|---|---|---|---|---|---|---|---|
| Year | Under 6 | 6-17 | Total | Under 181 | 18 to 64 | 65 & over | White | Black | Hispanic Origin2 |
|
1 Persons under 18 include both related children (own children, including stepchildren and adopted children, plus all other 2 Persons of Hispanic origin may be of any race. Source: U.S. Bureau of the Census, “Poverty in the United States: 1997," Current Population Reports, Series P60-201 and |
|||||||||
| 1959 | NA | NA | 22.4 | 27.3 | 17.0 | 35.2 | 18.1 | 55.1 | NA |
| 1963 | NA | NA | 19.5 | 23.1 | NA | NA | 15.3 | NA | NA |
| 1966 | NA | NA | 14.7 | 17.6 | 10.5 | 28.5 | 11.3 | 41.8 | NA |
| 1969 | 15.3 | 13.1 | 12.1 | 14.0 | 8.7 | 25.3 | 9.5 | 32.2 | NA |
| 1973 | 15.7 | 13.6 | 11.1 | 14.4 | 8.3 | 16.3 | 8.4 | 31.4 | 21.9 |
| 1976 | 17.7 | 15.1 | 11.8 | 16.0 | 9.0 | 15.0 | 9.1 | 31.1 | 24.7 |
| 1979 | 17.9 | 15.1 | 11.7 | 16.4 | 8.9 | 15.2 | 9.0 | 31.0 | 21.8 |
| 1980 | 20.3 | 16.8 | 13.0 | 18.3 | 10.1 | 15.7 | 10.2 | 32.5 | 25.7 |
| 1981 | 22.0 | 18.4 | 14.0 | 20.0 | 11.1 | 15.3 | 11.1 | 34.2 | 26.5 |
| 1982 | 23.3 | 20.4 | 15.0 | 21.9 | 12.0 | 14.6 | 12.0 | 35.6 | 29.9 |
| 1983 | 24.6 | 20.4 | 15.2 | 22.3 | 12.4 | 13.8 | 12.1 | 35.7 | 28.0 |
| 1984 | 23.4 | 19.7 | 14.4 | 21.5 | 11.7 | 12.4 | 11.5 | 33.8 | 28.4 |
| 1985 | 22.6 | 18.8 | 14.0 | 20.7 | 11.3 | 12.6 | 11.4 | 31.3 | 29.0 |
| 1986 | 21.6 | 18.8 | 13.6 | 20.5 | 10.8 | 12.4 | 11.0 | 31.1 | 27.3 |
| 1987 | 22.3 | 18.9 | 13.4 | 20.3 | 10.6 | 12.5 | 10.4 | 32.4 | 28.0 |
| 1988 | 21.8 | 17.5 | 13.0 | 19.5 | 10.5 | 12.0 | 10.1 | 31.3 | 26.7 |
| 1989 | 21.9 | 17.4 | 12.8 | 19.6 | 10.2 | 11.4 | 10.0 | 30.7 | 26.2 |
| 1990 | 23.0 | 18.2 | 13.5 | 20.6 | 10.7 | 12.2 | 10.7 | 31.9 | 28.1 |
| 1991 | 24.0 | 19.5 | 14.2 | 21.8 | 11.4 | 12.4 | 11.3 | 32.7 | 28.7 |
| 1992 | 25.7 | 19.4 | 14.8 | 22.3 | 11.9 | 12.9 | 11.9 | 33.4 | 29.6 |
| 1993 | 25.6 | 20.0 | 15.1 | 22.7 | 12.4 | 12.2 | 12.2 | 33.1 | 30.6 |
| 1994 | 24.5 | 19.5 | 14.5 | 21.8 | 11.9 | 11.7 | 11.7 | 30.6 | 30.7 |
| 1995 | 23.7 | 18.3 | 13.8 | 20.8 | 11.4 | 10.5 | 11.2 | 29.3 | 30.3 |
| 1996 | 22.7 | 18.4 | 13.7 | 20.5 | 11.4 | 10.8 | 11.2 | 28.4 | 29.4 |
| 1997 | 21.6 | 18.0 | 13.3 | 19.9 | 10.9 | 10.5 | 11.0 | 26.5 | 27.1 |
- The percentage of people living in poverty increased 2.3 percentage points to a level of 15.1 percent between 1989 and 1992 and has since declined to 13.3 percent as the economy has recovered from the recession.
Figure ECON 1b. Percentage of Population Below 50 and 100 Percent of Poverty
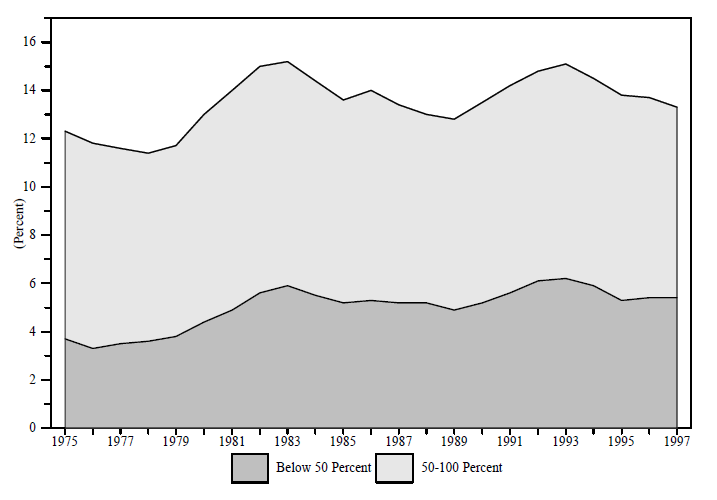
Source: U.S. Bureau of the Census, “Poverty in the United States: 1997," Current Population Reports, Series P60-201 and unpublished tables available online at http://www.census.gov/hhes/www/poverty.html.
- Since 1975, the percentage of the population with incomes below 50 percent of the poverty threshold has risen and fallen in a pattern that reflects to some degree the trend in the overall poverty rate. For example, the percentage of people below 50 percent of poverty rose from a low of 3.3 percent in 1976 to a high of 5.9 percent in 1983 and then after falling slightly, rose to a second peak of 6.2 percent in 1993. The overall poverty rate – the percentage of people below 100 percent of poverty – also peaked in 1983 and 1993 in a somewhat similar pattern, although with more pronounced peaks and valleys.
- Over the past two decades, however, there has been an overall increase in the proportion of the poverty population that falls below 50 percent of the poverty level. Whereas the population below 50 percent of the poverty threshold was 30 percent of the poverty population in 1975, it rose to 39 percent of the total poverty population by 1983, and to 41 percent by 1997.
- Between 1995 and 1997, the percentage of the total population with incomes below 50 percent of the poverty level increased slightly, from 5.3 percent to 5.4 percent, in contrast to the decline in the overall poverty level, from 13.8 percent to 13.3 percent.
Table ECON 1b. Number and Percentage of People Below 50, 75, 100, and 125 Percent of Poverty Level, 1975 – 1997
(in Thousands)
| Below 50 percent | Below 75 percent | Below 100 percent | Below 125 percent | ||||||
|---|---|---|---|---|---|---|---|---|---|
| Year | Total Population | Number | Percent | Number | Percent | Number | Percent | Number | Percent |
| Source: U.S. Bureau of the Census, “Poverty in the United States: 1997," Current Population Reports, Series P60-201 and unpublished tables available online at http://www.census.gov/hhes/www/poverty.html. | |||||||||
| 1975 | 210,900 | 7,700 | 3.7 | 15,400 | 7.3 | 25,900 | 12.3 | 37,100 | 17.6 |
| 1976 | 212,300 | 7,000 | 3.3 | 14,900 | 7.0 | 25,000 | 11.8 | 35,500 | 16.7 |
| 1977 | 213,900 | 7,500 | 3.5 | 15,000 | 7.0 | 24,700 | 11.6 | 35,700 | 16.7 |
| 1978 | 215,700 | 7,700 | 3.6 | 14,900 | 6.9 | 24,500 | 11.4 | 34,100 | 15.8 |
| 1979 | 222,900 | 8,600 | 3.8 | 16,300 | 7.3 | 26,100 | 11.7 | 36,600 | 16.4 |
| 1980 | 225,000 | 9,800 | 4.4 | 18,700 | 8.3 | 29,300 | 13.0 | 40,700 | 18.1 |
| 1981 | 227,200 | 11,200 | 4.9 | 20,700 | 9.1 | 31,800 | 14.0 | 43,800 | 19.3 |
| 1982 | 229,400 | 12,800 | 5.6 | 23,200 | 10.1 | 34,400 | 15.0 | 46,600 | 20.3 |
| 1983 | 231,700 | 13,600 | 5.9 | 23,600 | 10.2 | 35,300 | 15.2 | 47,000 | 20.3 |
| 1984 | 233,800 | 12,800 | 5.5 | 22,700 | 9.7 | 33,700 | 14.4 | 45,400 | 19.4 |
| 1985 | 236,600 | 12,400 | 5.2 | 22,200 | 9.4 | 33,100 | 13.6 | 44,200 | 18.7 |
| 1986 | 238,600 | 12,700 | 5.3 | 22,400 | 9.4 | 32,400 | 14.0 | 44,600 | 18.7 |
| 1987 | 241,000 | 12,500 | 5.2 | 21,700 | 9.0 | 32,200 | 13.4 | 43,100 | 17.9 |
| 1988 | 243,500 | 12,700 | 5.2 | 21,400 | 8.8 | 31,700 | 13.0 | 42,600 | 17.5 |
| 1989 | 246,000 | 12,000 | 4.9 | 20,700 | 8.4 | 31,500 | 12.8 | 42,600 | 17.3 |
| 1990 | 248,600 | 12,900 | 5.2 | 22,600 | 9.1 | 33,600 | 13.5 | 44,800 | 18.0 |
| 1991 | 251,200 | 14,100 | 5.6 | 24,400 | 9.7 | 35,700 | 14.2 | 47,500 | 18.9 |
| 1992 | 256,500 | 15,500 | 6.1 | 26,200 | 10.2 | 38,000 | 14.8 | 50,500 | 19.7 |
| 1993 | 259,300 | 16,000 | 6.2 | 27,200 | 10.5 | 39,300 | 15.1 | 51,900 | 20.0 |
| 1994 | 261,600 | 15,400 | 5.9 | 26,400 | 10.1 | 38,100 | 14.5 | 50,500 | 19.3 |
| 1995 | 263,700 | 13,900 | 5.3 | 24,500 | 9.3 | 36,400 | 13.8 | 48,800 | 18.5 |
| 1996 | 266,200 | 14,400 | 5.4 | 24,800 | 9.3 | 36,500 | 13.7 | 49,300 | 18.5 |
| 1997 | 268,500 | 14,600 | 5.4 | 24,200 | 9.0 | 35,600 | 13.3 | 47,800 | 17.8 |
- In 1997, there were 35.6 million people with family income below 100 percent of the poverty threshold, as shown in Table ECON 1b. This included 14.6 million people with incomes below 50 percent of the poverty threshold.
Economic Security Risk Factor 2. Poverty Transition Rates
Data on poverty transitions show the extent of new entries into and exits from poverty.
Figure ECON 2a. Percentage of Poor Individuals Moving out of Poverty from 1993 to 1994
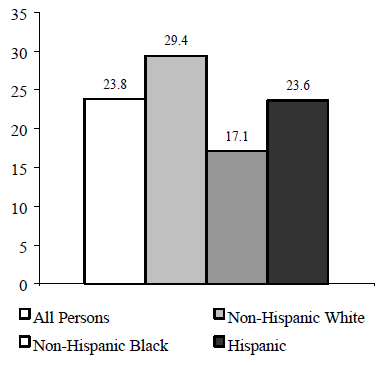
Figure ECON 2b. Percentage of Non-Poor Individuals Moving into Poverty from 1993 to 1994
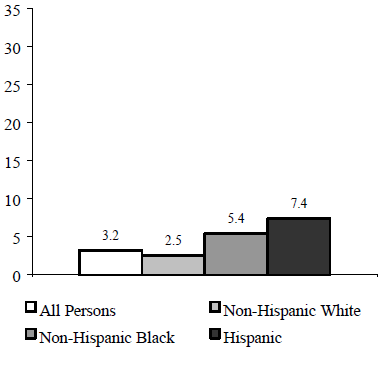
Source: Table ECON 2.
- As shown in Figure ECON 2a, nearly one-quarter (24 percent) of all individuals who were poor in 1993 moved out of poverty in 1994. The percentage of poor non-Hispanic whites who exited poverty in 1994 (29 percent) was larger than the corresponding percentages for non-Hispanic blacks (17 percent) and Hispanics (24 percent).
- Only 3 percent of all individuals who were above the poverty line in 1993 became poor in 1994, as shown in Figure ECON 2b. A larger percentage of Hispanic individuals who were not poor in 1993 entered poverty in 1994 (7 percent) compared to both non-Hispanic Blacks (5 percent) and non-Hispanic whites (3 percent).
- As shown in Table ECON 2, 33 percent of men age 16 to 64 who were poor in 1993 moved out of poverty in 1994, compared to only 27 percent of women age 16 to 64. Poor adults age 65 or older were even less likely to exit poverty than poor adults age 16 to 64: only 15 percent of the elderly poor population in 1993 exited poverty in 1994.
|
Table ECON 2. Percentage of Individuals Changing Poverty Status, 1993-1994 |
|
|---|---|
| Source: Unpublished data from the SIPP, 1993 panel. | |
| From Poor to Non-Poor | |
| All Poor Persons | 23.8 |
| Racial Categories | |
| Non-Hispanic White | 29.4 |
| Non-Hispanic Black | 17.1 |
| Hispanic | 23.6 |
| Age Categories | |
| Children Age 0 - 5 | 19.9 |
| Children Age 6 - 10 | 19.2 |
| Children Age 11 - 15 | 19.3 |
| Women Age 16 - 64 | 26.5 |
| Men Age 16 - 64 | 32.7 |
| Adults Age 65 and over | 14.9 |
| From Non-Poor to Poor | |
| All Non-Poor Persons | 3.2 |
| Racial Categories | |
| Non-Hispanic White | 2.5 |
| Non-Hispanic Black | 5.4 |
| Hispanic | 7.4 |
| Age Categories | |
| Children Age 0 - 5 | 5.0 |
| Children Age 6 - 10 | 4.9 |
| Children Age 11 - 15 | 3.4 |
| Women Age 16 - 64 | 3.5 |
| Men Age 16 - 64 | 2.6 |
| Adults Age 65 and over | 2.0 |
Economic Security Risk Factor 3. Poverty Spells
The length of a poverty episode illustrates one aspect of the risk of dependence.
Figure ECON 3. Length of Spells of Poverty for Persons Who Became Poor during the 1993 SIPP Panel
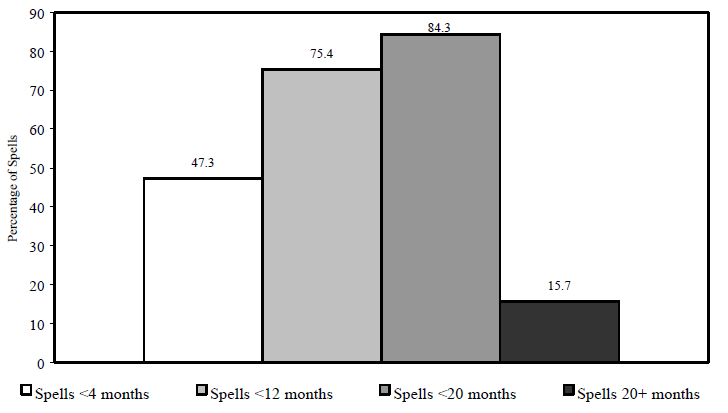
Source: Table ECON 3.
- Nearly half (47 percent) of all poverty spells ended within 4 months and three-quarters of all poverty spells ended within one year. Only 16 percent of all poverty spells were 20 months or longer.
- As shown in Table ECON 3, a larger percentage of poverty spells among non-Hispanic blacks were 20 months or longer (23 percent) than was the case for spells among non-Hispanic whites (14 percent) and among Hispanics (15 percent).
- Spells of poverty among adults age 65 and older tend to last longer than poverty spells among adults age 16 to 64 and spells among children age 0 to 15. As shown in Table ECON 3, only 65 percent of poverty spells among adults age 65 and older ended within one year compared to 80 percent for women age 16 to 64, 75 percent for men age 16 to 64, and 73 percent for children age 0 to 15.
Table ECON 3. Percentage of Poverty Spells for Individuals Entering Poverty during the 1993 SIPP Panel by Length of Spell
| Percent of Spells | ||||
|---|---|---|---|---|
| Spells <4 months | Spells <12 months | Spells <20 months | Spells 20+ months | |
|
Note: Spell length categories are not mutually exclusive. Spells separated by only 1 month are not considered separate spells. Due to the length of the observation period, actual spell lengths for spells that lasted more than 20 months cannot be observed. Source: Unpublished data from the SIPP, 1993 panel. |
||||
| All persons | 47.3 | 75.4 | 84.3 | 15.7 |
| Racial Categories | ||||
| Non-Hispanic White | 47.3 | 78.8 | 86.3 | 13.7 |
| Non-Hispanic Black | 39.9 | 64.1 | 76.7 | 23.3 |
| Hispanic origin | 42.5 | 74.4 | 84.7 | 15.3 |
| Age Categories | ||||
| Children Age 0 to 15 | 43.8 | 73.0 | 82.2 | 17.8 |
| Women Age 16 - 64 | 47.6 | 79.9 | 88.9 | 11.1 |
| Men Age 16 - 64 | 51.6 | 75.2 | 84.2 | 15.8 |
| 65 years and over | 40.7 | 65.4 | 73.0 | 27.0 |
Economic Security Risk Factor 4. Long-term Poverty
As with welfare, poverty experiences often occur in a number of discrete episodes. Measures that illustrate the total length of poverty episodes reveal an important aspect of the severity of the risk of dependence.
Figure ECON 4. Percentage of Children Ages 0 to 5 in 1982 Living in Poverty by Cumulative Number of Years in Poverty
Source: Table ECON 4.
- Among children who were age 0 to 5 in 1982, nearly three-quarters (73 percent) never lived in poverty for any year over the next ten years, as shown in Figure ECON 4. The percentage of children who remained above the poverty line in all years between 1972 and 1981 is similar although somewhat larger (76 percent), as shown in Table ECON 4.
- During the 1982 to 1991 period, 28 percent of black children experienced longer-term poverty of 6 to 10 years, a percentage much higher than that for non-black children during the same ten-year time period (3 percent).
- For both time periods, the percentages of all individuals who were poor for only one to two years are much larger than the percentages of all individuals who experienced longer-term poverty, as shown in Table ECON 4. For example, while 11 percent of all individuals were poor for only one to two years between 1982 and 1991, only 3 percent were poor for 6 to 8 years and only 2 percent were poor for 9 to 10 years during the same time period.
- As shown in Table ECON 4, a somewhat larger percentage of children compared to the percentage of total persons experienced long-term poverty in both time periods, especially long-term poverty of 9 to 10 years.
| Table ECON 4. Percentage of Individuals Living in Poverty by Number of Years in Poverty | |||
|---|---|---|---|
| Source: Unpublished data from the PSID, 1972 - 1991. | |||
| All Persons: 1982 – 1991 | |||
| Cumulative Years in Poverty | All Persons | Black | Non-Black |
| 0 Years | 78.8 | 50.6 | 82.9 |
| 1 - 2 Years | 11.3 | 14.9 | 10.7 |
| 3 - 5 Years | 5.3 | 14.4 | 4.0 |
| 6 - 8 Years | 2.8 | 11.2 | 2.0 |
| 9 - 10 Years | 1.8 | 8.9 | 0.7 |
| 100 | 100 | 100 | |
| Children 0 - 5 in 1982: 1982-1991 | |||
| Cumulative Years in Poverty | All Children | Black Children | Non-Black Children |
| 0 Years | 73.3 | 40.9 | 79.2 |
| 1 - 2 Years | 12.3 | 16.5 | 11.6 |
| 3 - 5 Years | 7.5 | 14.8 | 6.1 |
| 6 - 8 Years | 3.2 | 11.1 | 1.7 |
| 9 - 10 Years | 3.8 | 16.8 | 1.4 |
| 100 | 100 | 100 | |
| All Persons: 1972 - 1981 | |||
| Cumulative Years in Poverty | All Persons | Black | Non-Black |
| 0 Years | 79.2 | 45.6 | 83.7 |
| 1 - 2 Years | 12.3 | 20 | 11.3 |
| 3 - 5 Years | 4.6 | 16.6 | 3.1 |
| 6 - 8 Years | 2.5 | 10.4 | 1.5 |
| 9 – 10 Years | 1.2 | 7.5 | 0.4 |
| 100 | 100 | 100 | |
| Children 0 - 5 in 1972: 1972-1981 | |||
| Cumulative Years in Poverty | All Children | Black Children | Non-Black Children |
| 0 Years | 75.6 | 34.1 | 82.3 |
| 1 - 2 Years | 13.1 | 21.7 | 11.7 |
| 3 - 5 Years | 5.6 | 20.5 | 3.2 |
| 6 - 8 Years | 3.2 | 11.1 | 1.9 |
| 9 – 10 Years | 2.5 | 12.8 | 0.9 |
| 100 | 100 | 100 | |
Economic Security Risk Factor 5. Events Associated with the Beginning and Ending of a Poverty Spell
Events that trigger the beginning or ending of a poverty episode indicate an increased or decreased likelihood of future dependence.
Table ECON 5a. Percentage of First Poverty Spell Beginnings Associated with Specific Events
| Spell Began 1973 – 1979 | Spell Began 1980 - 1985 | Spell Began 1986 - 1991 | |
|---|---|---|---|
|
Note: Events are defined to be neither mutually exclusive nor exhaustive. Work limitation is defined as a self-reported physical or nervous condition that limits the type of work or the amount of work the respondent can do. Source: Unpublished data from the PSID, 1968 - 1992. |
|||
| First birth to an unmarried, non-cohabiting mother | 4.2 | 5.8 | 7.3 |
| First birth to other circumstances | 2.3 | 4.5 | 2.3 |
| Second (or higher order) birth | 9.2 | 10.2 | 17.9 |
| Divorce/separation | 10.9 | 16.2 | 14.6 |
| Mother's work hours decreased by more than 500 hours per year | 12.5 | 21.4 | 28.6 |
| Other adults' work hours decreased by more than 500 hours, but no change in family structure | 29.0 | 27.6 | 27.7 |
| Other adults' work hours decreased by more than 500 hours, and a change in family structure | 24.6 | 22.9 | 16.3 |
| Householder acquired work limitation | 13.9 | 17.2 | 23.7 |
| Other transfer income dropped by $1,000 or more (in 1996$) | 5.9 | 3.5 | 2.9 |
| Changed state of residence | 7.5 | 10.0 | 8.0 |
- During the 1986 to 1991 time period, first poverty spell beginnings were most often associated with a second or higher order birth (18 percent), a decrease in mothers’ work hours (29 percent), a decrease in other’s work hours (28 percent and 16 percent), or a work limitation (24 percent).
- The percentages of first poverty spell beginnings associated with decreases in mothers’ work hours increased dramatically over the three time periods, from 13 percent in the earliest period to 29 percent in the most recent period.
- The percentages of first poverty episodes associated with the householder acquiring a work limitation increased over time to nearly one-quarter (24 percent) of all first poverty spells beginning between 1986 and 1991.
Table ECON 5b. Percentage of First Poverty Spell Endings Associated with Specific Events
| Spell Ended 1973 – 1979 | Spell Ended 1980 - 1985 | Spell Ended 1986 - 1991 | |
|---|---|---|---|
|
Note: Events are defined to be neither mutually exclusive nor exhaustive. Work limitation is defined as a self-reported physical or nervous condition that limits the type of work or the amount of work the respondent can do. Source: Unpublished data from the PSID, 1968 - 1992. |
|||
| Mother married or acquired cohabitor | 14.2 | 14.0 | 11.5 |
| Children under 18 no longer present | 2.0 | 1.3 | 4.3 |
| Mother's work hours increased by more than 500 hours | 19.8 | 22.5 | 21.1 |
| Other adults' work hours increased by more than 500 hours, but no change in family structure | 23.7 | 29.5 | 22.5 |
| Other adults' work hours increased by more than 500 hours, and a change in family structure | 12.1 | 8.5 | 8.1 |
| Householder no longer reports work limitation | 14.3 | 19.1 | 20.1 |
| Other transfer income increased by $1,000 or more (in 1996$) | 4.2 | 5.3 | 3.8 |
| Changed state of residence | 8.9 | 14.0 | 9.5 |
- Between 1986 and 1991, most first poverty spell exits were associated with increased work hours of mothers (21 percent), increased work hours for other adults (23 percent) or a change in work limitations (20 percent).
- The percentage of first poverty spell endings associated with marriage or cohabitation decreased somewhat in the 1986 to 1991 time period relative to the earlier time periods (from 14 to 12 percent).
- The percentages of first poverty spell endings associated with increases in transfer income remained relatively stable over the three time periods (around 4 to 5 percent).
- The percentages of spell endings associated with a householder no longer reporting a work limitation increased between the first two time periods and remained stable between the last two time periods.
Economic Security Risk Factor 6. Intergenerational Poverty
The extent to which parental poverty is associated with poverty of their children as adults illustrates a significant risk to current and future dependence.
Figure ECON 6. Poverty Status in 1990 of Persons under 18 and Poor in 1970
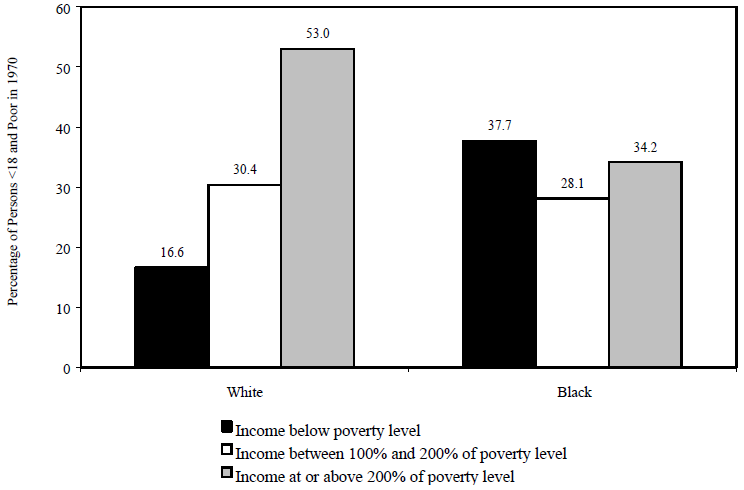
Source: Table ECON 6.
- Among children who were age 0 to 18 and lived in poor families in 1970, 17 percent of white children and 38 percent of black children also lived in poverty as adults in 1990. In other words, poor black children were more than twice as likely as poor white children to be poor as adults.
- Similar percentages of white and black children who were age 0 to 18 and poor in 1970 were “near-poor” (above 100 percent but less than 200 percent of the poverty level) as adults in 1990 (30 percent for whites and 28 percent for blacks). In contrast, white children were much more likely to be living above 200 percent of the poverty level as adults in 1990 (53 percent) than were black children (34 percent).
Table ECON 6. Poverty Status in 1990 of Persons Who Were under 18 and Poor in 1970
| Income under 100% of Poverty | Income between 100% and 200% of Poverty | Income at or above 200% of Poverty | |
|---|---|---|---|
| Source: Unpublished data from the PSID, 1970 and 1990. | |||
| White | 16.6 | 30.4 | 53.2 |
| Black | 37.8 | 28.1 | 34.2 |
Economic Security Risk Factor 7. Pre-transfer and Posttransfer Poverty Rates
Trends in the pre- and post-transfer rates of poverty which show the anti-poverty effectiveness of social security and of the major means-tested assistance program benefits.
Figure ECON 7. Poverty Rate of All Persons in Families with Related Children Under 18 Using Alternative Definitions of Income, 1979-1996
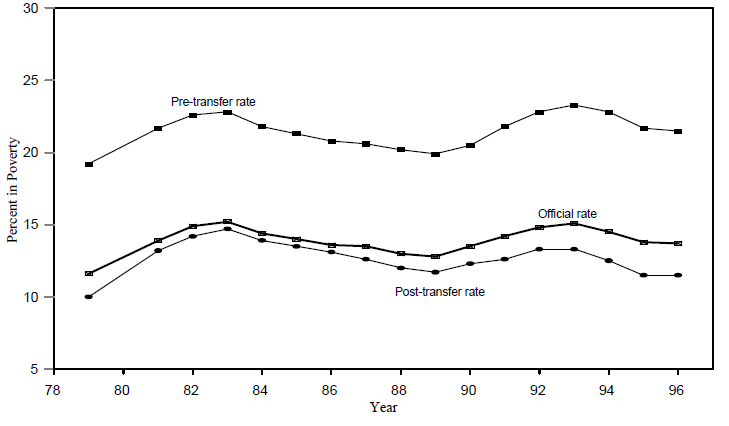
Note: The pre-transfer rate measures poverty in terms of cash income (only) before all transfers. The official rate measures it in terms of cash income plus social security and means-tested cash transfers. The post-transfer rate measures poverty after adding not only social security and means-tested cash transfers but also the market value of food and housing benefits plus taxes (including the refundable EITC as well as Federal payroll and income taxes); it does not include the fungible value of Medicare and Medicaid.
Source: Congressional Budget Office tabulations. Additional calculations by DHHS.
- In all years reported, the pre-transfer poverty rate for families with related children under age18 was much higher than both the official poverty rate and the post-transfer poverty rate.
- Table ECON 7 shows that the total effect of transfers and taxes was to reduce the poverty rate by 6.1 percentage points in 1972, 4.2 percentage points in 1983, and 6.7 percentage points in 1996.
Table ECON 7. Antipoverty Effectiveness of Cash and Near-Cash Transfers for All Persons in Families with Related Children Under 18, Selected Fiscal Years
| 1979 | 1983 | 1989 | 1993 | 1995 | 1996 | |
|---|---|---|---|---|---|---|
|
Note: EITC denotes Earned Income Tax Credit. The pre-transfer rate measures poverty in terms of cash income (only) before all transfers. The official rate measures it in terms of cash income plus social security and means-tested cash transfers. The post-transfer rate measures poverty after adding not only social security and means-tested cash transfers but also the market value of food and housing benefits plus taxes (including the refundable EITC as well as Federal payroll and income taxes); it does not include the fungible value of Medicare and Medicaid. Source: Congressional Budget Office tabulations. Additional calculations by DHHS. |
||||||
| Total Population (in millions) | 133.4 | 132.1 | 135.4 | 144.6 | 146.2 | 146.8 |
| Pre-Transfer Poor Population (in millions) | 22.1 | 28.9 | 25.2 | 32.2 | 29.2 | 28.7 |
| Percent of Poor Persons Removed from Poverty Due to: | ||||||
| Social Insurance (other than Social Security) | 4.4 | 6.9 | 3.4 | 4.2 | 3.5 | 2.7 |
| Social Security | 9.1 | 5.9 | 6.5 | 6.3 | 6.1 | 6.3 |
| Means-Tested Cash | 8.2 | 3.5 | 5.1 | 5.8 | 6.6 | 6.3 |
| Food and Housing Benefits | 16.5 | 8.7 | 11.7 | 10.2 | 12.5 | 11.2 |
| EITC and Fed. Payroll and Income Taxes | -1.7 | -5.8 | -2.8 | 2.3 | 6.6 | 7.6 |
| Total Percent of Pre-Transfer Poor Removed from Poverty by All Transfers | 36.6 | 19.1 | 23.9 | 28.9 | 35.2 | 34.1 |
| Poverty Rate (in percent): | ||||||
| Cash Income Before Transfers (pre-transfer) | 16.6 | 21.9 | 18.6 | 22.3 | 20.0 | 19.6 |
| Plus Social Ins. (other than Social Security) | 15.8 | 20.4 | 18.0 | 21.4 | 19.3 | 19.1 |
| Plus Social Security | 14.3 | 19.1 | 16.8 | 20.0 | 18.1 | 17.8 |
| Plus Means-Tested Cash Transfers (official poverty rate) | 12.9 | 18.4 | 15.8 | 18.7 | 16.8 | 16.6 |
| Plus Food and Housing Benefits | 10.2 | 16.5 | 13.6 | 16.4 | 14.3 | 14.4 |
| Plus EITC, less Fed. Payroll & Income Taxes (post-trans.) | 10.5 | 17.7 | 14.1 | 15.9 | 13.0 | 12.9 |
| Total Reduction in Poverty Rate | 6.1 | 4.2 | 4.5 | 6.4 | 7.0 | 6.7 |
- Table ECON 7 shows that a substantial percentage of the poor population was removed from poverty by transfers in all years shown. The percentage of poor persons removed from poverty due to transfers was 37 percent in 1979, declining to 19 percent in 1983, and rising to 34 percent in 1996.
- Table ECON 7 shows that the percentage of the poor population removed from poverty due to food and housing benefits is much larger in all reported years than the percentage removed due to other transfers. In 1996, more than 11 percent of the poor population was removed from poverty due to food and housing benefits.
- Table ECON 7 also shows that whereas tax policies, including the EITC and Federal payroll and income taxes, did not remove any poor individuals from poverty in 1979, 1983, and 1989, the trend reversed in 1993. By 1996, EITC net of Federal payroll and income taxes removed about 8 percent of the poor population from poverty
Economic Security Risk Factor 8. Child SUPPORT
Child support provides critical income to families with children and reduces the likelihood of dependence. These child support risk factors reflect the presence and magnitude of child support payments made by noncustodial parents for families receiving services from the Child Support Enforcement Program.
Figure ECON 8a. Total, Non-AFDC/TANF, and AFDC/TANF Title IV-D Child Support Collections, 1978 – 1997

Source: U.S. Department of Health and Human Services, Administration for Children and Families, Office of Child Support Enforcement, Preliminary Child Support Enforcement FY 1997 Data Report, 1998 (and earlier years), Washington, DC.
- Total collections paid through the Child Support Enforcement system (Title IV-D of the Social Security Act) grew at an annual rate of growth of 14.4 percent (current dollars) from FY 1978 to FY 1997. The average rate of growth was higher for collections on behalf of non-AFDC families (16.5 percent) than for collections on behalf of AFDC families (9.9 percent). This rate of growth is attributable to both increases in the number of noncustodial parents paying child support and increases in the amount of child support paid per case.
Table ECON 8a. Total, Non-AFDC/TANF, and AFDC/TANF Title IV-D Child Support Collections, 1978 to 1997
| Total Collections (In millions) | |||||||
|---|---|---|---|---|---|---|---|
| Total | AFDC Collections | ||||||
| Fiscal Year | Current Dollars | Constant '97 Dollars | Total | Payments to AFDC Families | Federal & State Share of Collections | Non-AFDC Collections | Total IV-D Administrative Expenditures |
|
Note: Not all states report current child support collections in all years. Constant dollar adjustments to 1997 level were made using a CPI-U-X1 fiscal year average price index. Source: U.S. Department of Health and Human Services, Administration for Children and Families, Office of Child Support Enforcement, Preliminary Child Support Enforcement FY 1997 Data Report, 1998 (and earlier years), Washington, DC. |
|||||||
| 1978 | $1,047 | $2,527 | $472 | $13 | $459 | $575 | $312 |
| 1979 | 1,333 | 2,954 | 597 | 12 | 584 | 736 | 383 |
| 1980 | 1,478 | 2,937 | 603 | 10 | 593 | 874 | 466 |
| 1981 | 1,629 | 2,948 | 671 | 12 | 659 | 958 | 526 |
| 1982 | 1,771 | 2,992 | 786 | 15 | 771 | 985 | 612 |
| 1983 | 2,024 | 3,284 | 880 | 15 | 865 | 1,144 | 691 |
| 1984 | 2,378 | 3,696 | 1,000 | 17 | 983 | 1,378 | 723 |
| 1985 | 2,694 | 4,038 | 1,090 | 189 | 901 | 1,604 | 814 |
| 1986 | 3,249 | 4,750 | 1,225 | 275 | 955 | 2,019 | 941 |
| 1987 | 3,917 | 5,569 | 1,349 | 278 | 1,070 | 2,569 | 1,066 |
| 1988 | 4,605 | 6,290 | 1,486 | 289 | 1,188 | 3,128 | 1,171 |
| 1989 | 5,241 | 6,831 | 1,593 | 307 | 1,286 | 3,648 | 1,363 |
| 1990 | 6,010 | 7,462 | 1,750 | 334 | 1,416 | 4,260 | 1,606 |
| 1991 | 6,886 | 8,138 | 1,984 | 381 | 1,603 | 4,902 | 1,804 |
| 1992 | 7,964 | 9,136 | 2,259 | 435 | 1,824 | 5,705 | 1,995 |
| 1993 | 8,907 | 9,919 | 2,416 | 446 | 1,971 | 6,491 | 2,241 |
| 1994 | 9,850 | 10,686 | 2,550 | 457 | 2,093 | 7,300 | 2,556 |
| 1995 | 10,827 | 11,428 | 2,689 | 474 | 2,215 | 8,138 | 3,012 |
| 1996 | 12,020 | 12,344 | 2,855 | 480 | 2,375 | 9,165 | 3,055 |
| 1997 | 13,380 | 13,380 | 2,856 | 157 | 2,698 | 10,524 | 3,424 |
- From FY 1984 through FY 1996, the first $50 dollars of each month’s child support collection was passed-through to families that were receiving AFDC benefits. The “Collections Paid to Families” shown in Table ECON 8a reflects this $50 pass-through and other benefit adjustments. In FY 1997, states were no longer required to continue the $50 pass-through, and so collections paid to families dropped from $480 million in FY 1996 to $157 million in FY 1997.
Figure ECON 8b. Average Annual Child Support Enforcement Payments for Current Support by Noncustodial Parents with an Obligation and Payment in Nominal and Constant 1997 Dollars, 1986 to 1997
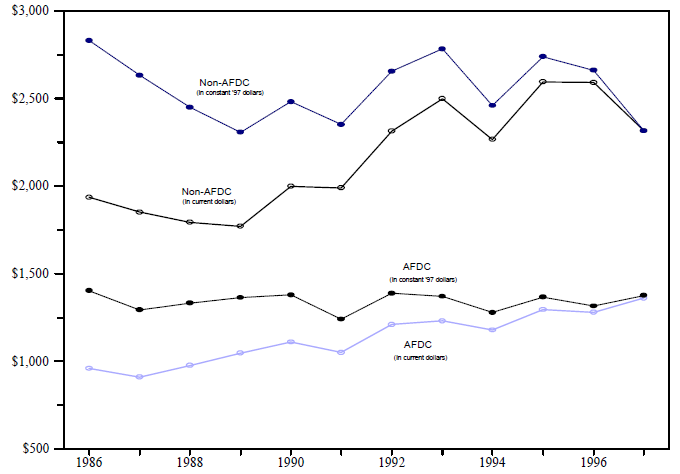
Source: U.S. Department of Health and Human Services, Administration for Children and Families, Office of Child Support Enforcement, Preliminary Child Support Enforcement FY 1997 Data Report, 1998, and Twentieth Annual Report to Congress, for the period ending September 30, 1995 (and earlier years), Washington, DC.
- Figure ECON 8b represents the average annual payment of current support by noncustodial parents for families receiving services through the child support enforcement system. Payments on behalf of families not receiving AFDC were about twice as large as those payments for families receiving AFDC. (Note that many families not on AFDC may have received AFDC sometime in the past.)
- As shown in Table ECON 8b, annual payments in current dollars on behalf of AFDC and non-AFDC families have increased by more than 40 percent between FY 1986 and FY 1997. However, when converted to constant dollars, per capita payments have not quite kept pace with inflation.
- In FY 1996, collections were received from about 60 percent of the cases with orders and those collections represented about 52 percent of the current child support due (Table ECON 8b2). About 32 percent of the current support due on behalf of AFDC families is collected, compared to 60 percent collected on behalf of families not receiving AFDC.
Table ECON 8b1. Average Annual Child Support Enforcement Payments for Current Support by Noncustodial Parents with an Obligation and Payment in Nominal and Constant Dollars, 1986 – 1997
| AFDC/TANF | Non-AFDC/TANF | Totals | |||||
|---|---|---|---|---|---|---|---|
| Current Dollars | Constant ’97 Dollars | Current Dollars | Constant ’97 Dollars | Current Dollars | Constant ’97 Dollars | FY CPI-U | |
| 1986-97 | |||||||
| – change | $402 | -$27 | $379 | -$515 | $685 | $23 | 50.5 |
| – percent | 41.9% | -1.9% | 19.6% | -18.2% | 47.8% | 1.1% | 46.2% |
| Note: Data for 1997 are preliminary and does not include information from Florida, Hawaii, Tennessee, and Wisconsin. Source: U.S. Department of Health and Human Services, Administration for Children and Families, Office of Child Support Enforcement, Preliminary Child Support Enforcement FY 1997 Data Report, 1998, and Twenty-first Annual Report to Congress, for the period ending September 30, 1996 (and earlier years), Washington, DC. | |||||||
| 1986 | $959 | $1,402 | $1,936 | $2,830 | $1,433 | $2,095 | 109.3 |
| 1987 | 910 | 1,294 | 1,851 | 2,632 | 1,416 | 2,013 | 112.4 |
| 1988 | 975 | 1,332 | 1,793 | 2,449 | 1,468 | 2,005 | 117.0 |
| 1989 | 1,046 | 1,363 | 1,770 | 2,307 | 1,457 | 1,899 | 122.6 |
| 1990 | 1,110 | 1,378 | 1,998 | 2,481 | 1,672 | 2,076 | 128.7 |
| 1991 | 1,049 | 1,240 | 1,989 | 2,351 | 1,711 | 2,022 | 135.2 |
| 1992 | 1,210 | 1,388 | 2,314 | 2,655 | 1,919 | 2,201 | 139.3 |
| 1993 | 1,230 | 1,370 | 2,498 | 2,782 | 1,990 | 2,216 | 143.5 |
| 1994 | 1,178 | 1,278 | 2,266 | 2,458 | 1,889 | 2,049 | 147.3 |
| 1995 | 1,294 | 1,366 | 2,595 | 2,739 | 2,167 | 2,287 | 151.4 |
| 1996 | 1,280 | 1,315 | 2,591 | 2,661 | 2,152 | 2,210 | 155.6 |
| 1997 | 1,361 | 1,361 | 2,315 | 2,315 | 2,118 | 2,118 | 159.8 |
Table ECON 8b2. Proportion of IV-D Cases with Orders and Collections and Proportion of Amount Paid to Amount Due, FY 1996 (In millions)
| AFDC Cases | Non-AFDC Cases | Total Cases | |
|---|---|---|---|
|
Note: FY 1997 data are not available. Source: U.S. Department of Health and Human Services, Administration for Children and Families, Office of Child Support Enforcement, Preliminary Child Support Enforcement FY 1996 Data Report, Washington, DC, 1997 and unpublished data. |
|||
| Number of Cases with Orders (Current Support) | 2.44 | 4.13 | 6.57 |
| Number of Cases with Collections (Current Support) | 1.20 | 2.76 | 3.96 |
| Percent of Cases with Collection (Current Support) | 49% | 67% | 60% |
| Amount of Current Support Due | $4,795 | $11,971 | $16,766 |
| Amount of Current Support Paid | $1,535 | $ 7,150 | $ 8,684 |
| Percent Paid | 32% | 60% | 52% |
Figure ECON 8c. Percentage of Single Mothers Receiving Child Support by Marital Status and Receipt of Income Assistance, 1977 – 1996
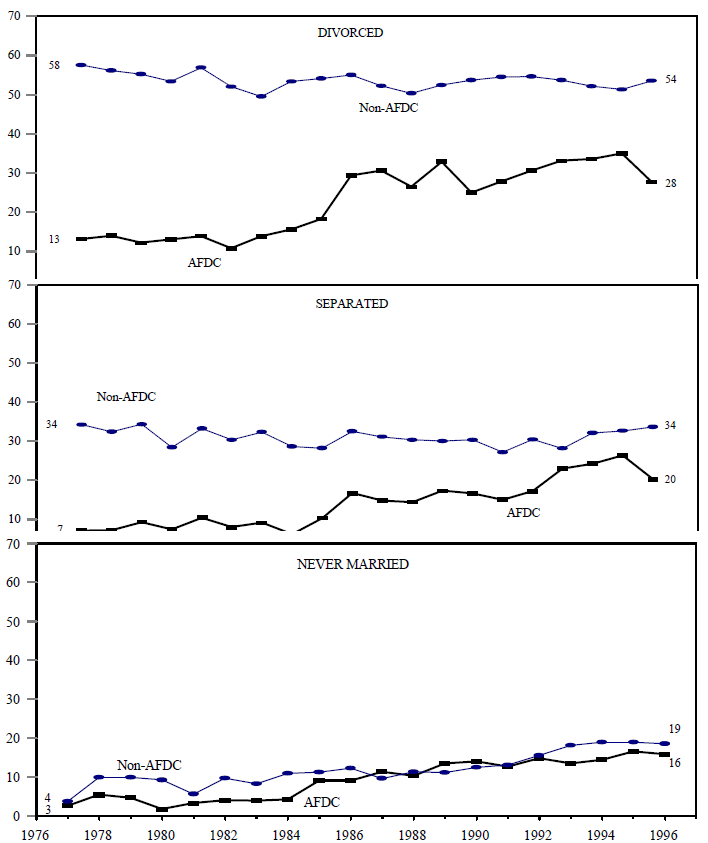
Source: Elaine Sorensen, the Urban Institute, unpublished data from the March Current Population Survey Public Use Files, 1978 – 1997.
- Single mothers enrolled in the AFDC program are less likely than other single mothers to receive child support, even after controlling for marital status. Since the authorization of the Child Support Enforcement program in the mid-1970s, the proportion of single AFDC mothers receiving child support has generally increased, resulting in a narrowing of the gap between AFDC and non-AFDC mothers. Between 1995 and 1996, however, the proportion of AFDC recipients receiving child support declined, following drops in the AFDC caseload and shifts in its composition.
Table ECON 8c. Percentage of Single Mothers Receiving Child Support and Alimony by Marital Status and Receipt of Income Assistance, 1977 – 1996
| Divorced | Separated | Never Married | ||||
|---|---|---|---|---|---|---|
| AFDC | Non-AFDC | AFDC | Non-AFDC | AFDC | Non-AFDC | |
| 1977-96 Change | 14.5 | -4.0 | 13.2 | -0.6 | 13.2 | 14.8 |
|
Note: Married women also receive child support, but the proportion of eligible married women cannot be identified on the March CPS file. Child support and alimony were not collected as separate items prior to 1988. They are left combined for all years to ensure comparability across years. Source: Elaine Sorensen, the Urban Institute, unpublished data from the March Current Population Survey Public Use Files, |
||||||
| 1977 | 13.2 | 57.5 | 7.1 | 34.2 | 2.6 | 3.7 |
| 1978 | 14.0 | 56.1 | 7.2 | 32.4 | 5.4 | 9.9 |
| 1979 | 12.2 | 55.2 | 9.3 | 34.3 | 4.6 | 9.9 |
| 1980 | 13.0 | 53.3 | 7.4 | 28.4 | 1.8 | 9.2 |
| 1981 | 13.9 | 56.9 | 10.4 | 33.2 | 3.3 | 5.6 |
| 1982 | 10.8 | 52.0 | 8.0 | 30.3 | 4.0 | 9.7 |
| 1983 | 13.8 | 49.5 | 9.1 | 32.3 | 3.9 | 8.2 |
| 1984 | 15.6 | 53.3 | 6.2 | 28.6 | 4.2 | 10.9 |
| 1985 | 18.3 | 54.1 | 10.3 | 28.2 | 9.0 | 11.2 |
| 1986 | 29.4 | 55.0 | 16.7 | 32.5 | 9.0 | 12.2 |
| 1987 | 30.6 | 52.2 | 14.8 | 31.1 | 11.3 | 9.6 |
| 1988 | 26.5 | 50.3 | 14.4 | 30.3 | 10.3 | 11.3 |
| 1989 | 32.9 | 52.4 | 17.3 | 30.0 | 13.5 | 11.1 |
| 1990 | 25.0 | 53.7 | 16.6 | 30.3 | 14.0 | 12.4 |
| 1991 | 27.9 | 54.5 | 15.0 | 27.1 | 12.7 | 13.1 |
| 1992 | 30.6 | 54.6 | 17.2 | 30.4 | 14.8 | 15.5 |
| 1993 | 33.1 | 53.7 | 23.0 | 28.1 | 13.4 | 18.1 |
| 1994 | 33.6 | 52.1 | 24.2 | 32.1 | 14.4 | 18.9 |
| 1995 | 35.0 | 51.3 | 26.3 | 32.6 | 16.6 | 18.9 |
| 1996 | 27.7 | 53.5 | 20.3 | 33.6 | 15.8 | 18.5 |
- Figure ECON 8c also shows that divorced and separated women are more likely to receive child support than are never-married women.
- The proportion of never-married women receiving child support is similar for the AFDC and non-AFDC populations. The upward trend lines for both groups reflect the paternity establishment activities of the Child Support Enforcement Program, as very few paternities are established outside of the CSE system.
- The proportion of divorced and separated women receiving child support but not AFDC payments has remained relatively constant.
Figure ECON 8d. Estimated Children Under 18 Born Outside of Marriage With Paternity Established, 1978 – 1997
Source: National Center for Health Statistics, Vital Statistics of the United States, annual and Monthly Vital Statistics Report, Vol. 46, No. 1, Supplement 2, September 11, 1997 and U.S. Department of Health and Human Services, Administration for Children and Families, Office of Child Support Enforcement, Preliminary Child Support Enforcement FY 1997 Data Report, 1998 (and earlier years), Washington, DC.
- The cumulative number of children needing paternity to be established has risen steadily over the last two decades due to growing numbers of children being born outside of marriage. The cumulative total of children born outside of marriage as of 1997 was about 17.5 million as shown in Figure ECON 8d. While the number and percentage of paternity establishments has increased, 45 percent of these children still did not have a legally identified father.
Table ECON 8d. Estimated Children under 18 Born Outside of Marriage with Paternity Established
(In thousands)
| 1978 | 1980 | 1982 | 1984 | 1986 | 1988 | 1990 | 1992 | 1994 | 1996 | 1997 | |
|---|---|---|---|---|---|---|---|---|---|---|---|
|
1 Non-marital births in 1997 are estimated based on the 12 months ending June 1997 as compared to the preceding 12 months. Note: Total children under 18 years of age who were born outside of marriage is the cumulative total of nonmarital births less deaths; paternities established is the cumulative total of voluntary and C.S.E. paternity establishment as well as estimated births legitimated by marriage and adoption. An unknown number of children born outside of marriage are living with step-fathers who may have assumed paternal responsibility without legal adoption. Source: National Center for Health Statistics, Vital Statistics of the United States, annual and Monthly Vital Statistics Report, Vol. 46, No. 1, Supplement 2, September 11, 1997 and U.S. Department of Health and Human Services, Administration for Children and Families, Office of Child Support Enforcement, Preliminary Child Support Enforcement FY 1997 Data Report, 1998 (and earlier years), Washington, DC. |
|||||||||||
| Children Under 18 Born Outside of Marriage (est.) | 6,212 | 6,932 | 7,781 | 8,674 | 9,680 | 10,816 | 12,175 | 13,743 | 15,326 | 16,816 | 17,501 |
| Paternity Not Established | 3,460 | 3,869 | 4,371 | 4,877 | 5,487 | 6,093 | 6,786 | 7,638 | 8,306 | 8,268 | 7,910 |
| Paternity Established | 2,752 | 3,063 | 3,410 | 3,797 | 4,193 | 4,722 | 5,389 | 6,105 | 7,020 | 8,548 | 9,591 |
| Percent of Children | 44.3 | 44.2 | 43.8 | 43.8 | 43.3 | 43.7 | 44.3 | 44.4 | 45.8 | 50.8 | 54.8 |
| Paternities Established for Nonmarital Births in a Year: | |||||||||||
| Nonmarital Births1 | 544 | 666 | 715 | 770 | 878 | 1,005 | 1,165 | 1,225 | 1,290 | 1,260 | 1,267 |
| Paternities Established | 111 | 144 | 173 | 219 | 245 | 307 | 393 | 512 | 676 | 1,043 | 1,282 |
| Percent of Births | 20.4 | 21.6 | 24.2 | 28.4 | 27.9 | 30.5 | 33.7 | 41.8 | 52.5 | 82.7 | 101.2 |
- As shown in Table ECON 8d, the number of paternities established each year as a percent of the number of children born outside of marriage each year has increased from 20 percent in 1978 to over 100 percent in 1997. This increasing rate of paternity establishment in the 1990s has increased the proportion of children with paternity established from about 44 percent in the period prior to 1994 to nearly 55 percent in 1997.
- The proportion of all children under age 18 with paternities established has increased significantly in the past few years. This increase reflects the additional paternities now being established in the hospitals at the time of the birth of the child.
- Reporting of in-hospital paternity establishments is voluntary and reflects reports from only 39 states, therefore the rate of increase in paternity establishments over the past few years may be underestimated.
Economic Security Risk Factor 9. Food Insecurity
Household food insecurity, including (at a severe level) direct hunger among children in the household, is related to general income poverty and is expected to affect children’s health, cognitive and social development, and general school success.
Figure ECON 9. Percentage of Households Classified as Food Insecure, 1995
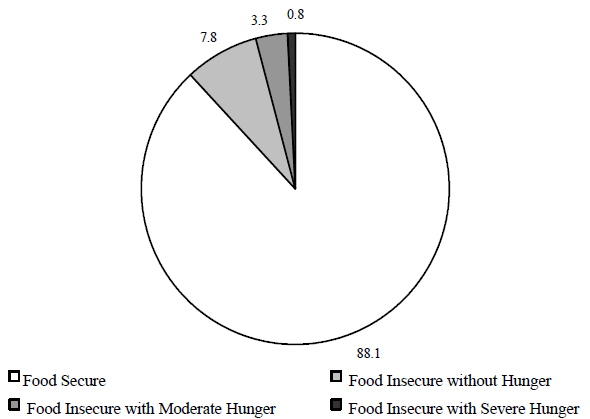
Source: Table ECON 9. See table for definition of food secure households.
- A large majority (88 percent) of American households was food secure in the year ending April 1995. Food secure households show little or no evidence of concern about food supply or reduction in food intake.
- About 11.9 million (of approximately 100 million) households experienced food insecurity - not being able to afford enough food - at some level during 1995. Most of the food insecure households were food insecure without hunger, meaning that although food insecurity was evident in their concerns and in adjustments to household food management, including reduced quality of diets, little or no reduction in food intake was reported.
- About 4 percent of the 100 million households were classified as food insecure with hunger. Thus, one or more adult members of some 4.2 million households were estimated to have experienced reduced food intake and hunger as a result of financial constraints in the year ending April 1995.
- About 800,000 households were classified as food insecure with severe hunger, meaning that children, as well as adults, experienced reduced food intake and hunger.
Table ECON 9. Percentage of Households Classified as Food Insecure, 1995
| Food Secure | Food Insecure No Hunger | Food Insecure Moderate Hunger | Food Insecure Severe Hunger | |
|---|---|---|---|---|
|
Note: Persons of Hispanic ethnicity can be any race. Food secure households show little or no evidence of concern about food supply or reduction in food intake. Households classified as food insecure without hunger report food-related concerns and adjustments to household food management but report little or no reduction in food intake. Households classified as food insecure with moderate hunger report reduced food intake and hunger among adults, while households are defined as food insecure with severe hunger if they report reduced food intake and hunger among children as well as adults. Source: U.S. Department of Agriculture, Food and Nutrition Service, Office of Analysis and Evaluation, Household Food Security in the United States in 1995. |
||||
| All Households | 88.1 | 7.8 | 3.3 | 0.8 |
| Households with Children Under 6, by Race | ||||
| White | 82.6 | 13.1 | 3.6 | 0.6 |
| Black | 70.1 | 19.7 | 8.8 | 1.4 |
| Hispanic | 66.8 | 23.6 | 7.9 | 1.7 |
| Other | 79.4 | 14.1 | 4.0 | 2.6 |
| Households with Children Under 18, by Race | ||||
| White | 84.6 | 11.1 | 3.6 | 0.7 |
| Black | 71.8 | 18.1 | 8.5 | 1.6 |
| Hispanic | 69.6 | 21.6 | 7.5 | 1.3 |
| Other | 81.1 | 12.6 | 4.7 | 1.6 |
| Households with Elderly but no Children, by Race | ||||
| White | 95.3 | 3.2 | 1.3 | 0.2 |
| Black | 81.7 | 12.6 | 4.3 | 1.4 |
| Hispanic | 79.1 | 15.2 | 4.0 | 1.7 |
| Other | 87.7 | 7.8 | 3.6 | 0.9 |
| Household Income-to-Poverty Ratio (all races and household types) | ||||
| Under 0.50 | 58.4 | 24.6 | 12.1 | 4.9 |
| Under 1.00 | 64.7 | 22.1 | 10.0 | 3.1 |
| Under 1.30 | 68.1 | 20.0 | 9.3 | 2.6 |
| Under 1.85 | 73.8 | 17.0 | 7.3 | 1.9 |
| 1.85 and over | 95.8 | 2.8 | 1.2 | 0.2 |
| Households with Children under 18 (all races) | ||||
| Married-Couple Families | 88.5 | 8.8 | 2.3 | 0.5 |
| Female Head, No Spouse | 64.7 | 22.9 | 10.3 | 2.0 |
| Male Head, No Spouse | 81.4 | 12.0 | 5.6 | 1.0 |
- The prevalence of food insecurity is higher among non-white households than among white households. As shown in Table ECON 9, 10 percent of black and Hispanic households with children under six experience food insecurity with either moderate or severe hunger, compared with 4 percent of white households with children under six.
- Households with an income-to-poverty ratio under 1.00 have a higher rate of food insecurity with moderate or severe hunger – 13 percent – than the 4 percent rate for the total population.
- Female-headed households with children under 18 had a higher prevalence of food insecurity with moderate or severe hunger (12 percent) than male-headed families (7 percent) or married-couple families (3 percent).
Economic Security Risk Factor 10. Health Insurance
A lack of health insurance may be the precursor to future health problems and as such a risk factor of dependence.
Figure ECON 10. Percentage of Persons without Health Insurance by Age, 1996
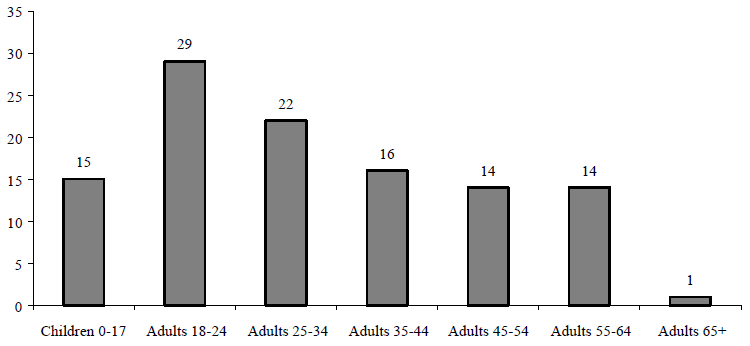
Source: Table ECON 10.
- Among all age categories, young adults age 18 to 24 were the most likely to be without health insurance in 1996 (29 percent).
- Sixteen percent of the population was without health insurance in 1996 as shown in Table ECON 10.
- Table ECON 10 also shows that among racial groups, a much larger percentage of Hispanics were without health insurance (34 percent) than non-Hispanic whites (12 percent) or non-Hispanic blacks (22 percent).
| Table ECON 10. Percentage of Persons without Health Insurance by Age, 1996 | |
|---|---|
| Source: U.S. Bureau of the Census, March Current Population Survey, 1997. | |
| All Persons | 16 |
| Non-HispanicWhite | 12 |
| Non-HispanicBlack | 22 |
| Hispanic | 34 |
| Other | 21 |
| Children 0 - 5 | 14 |
| Children 6 - 8 | 14 |
| Children 9 - 11 | 15 |
| Children 12 - 14 | 16 |
| Children 15 - 17 | 17 |
| Total 0 - 17 | 15 |
| Adults 18 - 24 | 29 |
| Adults 25 - 34 | 22 |
| Adults 35 - 44 | 16 |
| Adults 45 - 54 | 14 |
| Adults 55 - 64 | 14 |
| Women Age 18 - 64 | 14 |
| Men Age 18 - 64 | 18 |
| Adults Age 65 and over | 1 |
Economic Security Risk Factor 11. Percentage Residing in High-poverty Neighborhoods
High-poverty neighborhoods are often associated with relatively lower quality services (e.g., education, medical) that can have a negative effect on development and increase the risk of dependence.
Figure ECON 11. Percentage of Total Population Residing in High-Poverty Neighborhoods, 1990
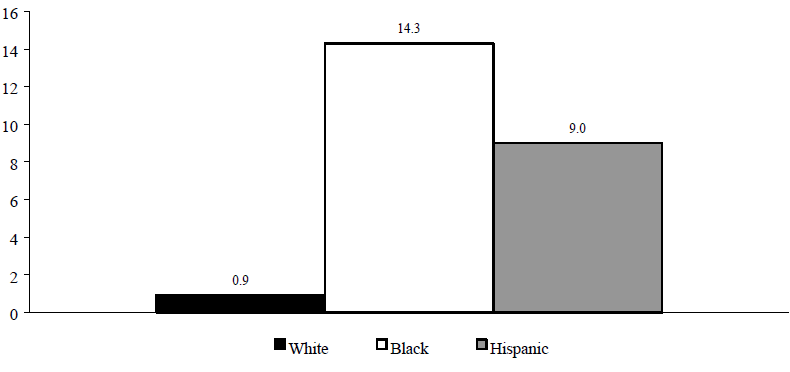
Source: Table ECON 11.
- Black and Hispanic individuals were disproportionately represented in high-poverty neighborhoods in 1990, as shown in Figure ECON 11. Whereas 14 percent of black individuals and 9 percent of Hispanic individuals resided in neighborhoods where over 40 percent of residents were poor, only 1 percent of white individuals lived in such neighborhoods.
- The percentage of black individuals living in high-poverty neighborhoods has increased over time, from 11 percent in 1970 to 14 percent in 1990, as shown in Table ECON 11. This has contributed to an overall increase in the percentage of the population residing in high-poverty neighborhoods, from 2 percent in 1970 to 3 percent in 1990.
Table ECON 11. Percentage of Total Population Residing in High-Poverty Neighborhoods, Selected Years
| 1970 | 1980 | 1990 | |
|---|---|---|---|
|
Note: Neighborhoods are defined as census tracts and block-numbering areas. A highpoverty area is defined as having 40% or more of the residents' incomes below the official poverty line. Source: Jargowsky, Paul. Poverty and Place: Ghetto, Barrios, and the American City. New York: Russell Sage Foundation, 1997. |
|||
| All persons | 2.1 | 2.3 | 3.2 |
| White | 0.6 | 0.6 | 0.9 |
| Black | 11.2 | 12.1 | 14.3 |
| Hispanic | 8.2 | 7.3 | 9.0 |
Economic Security Risk Factor 12. Residential Mobility
Frequent changes of residence are disruptive events for children and may increase the risk of dependence.
Figure ECON 12. Percentage of Persons and Families with Children Who Moved in a Given One-Year Period
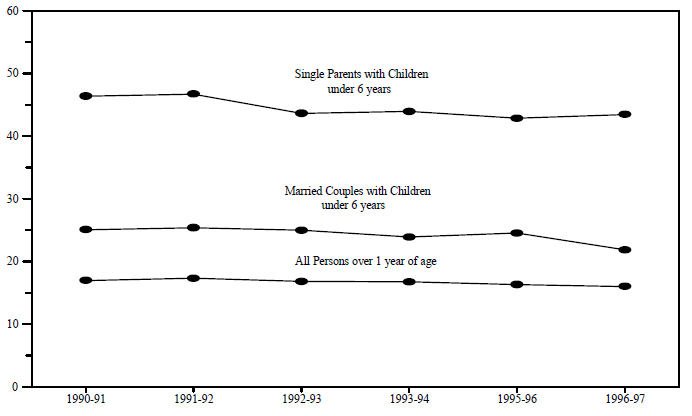
Source: U.S. Bureau of the Census, “Geographical Mobility,” Current Populations Reports, Series P20, Nos. 463,
473, 481, 485, 497 and 510.
- Single-parent families with children under age 18 were much more likely to move in a year than married-couple families in each of the periods shown above.
- Residential mobility for all persons age 1 year and older remained essentially unchanged, dropping only one percentage point from 17 percent to 16 percent over the period as the economy recovered from the recession in the early 1990s.
- Female-headed families with children were much more likely to move in a year than marriedcouple families with children, in each of the one-year periods shown.
- Residential mobility decreased one percentage point every two years for children age 1 to 14 from 1987 - 1988 to 1993 - 1994.
- Residential mobility for adults age 25 and above remained essentially unchanged, dropping only one percentage point over this period.
Table ECON 12. Number and Percentage of Individuals and Families Who Moved in a Given One-Year Period, Selected Years
| 1990-91 | 1991-92 | 1992-93 | 1993-94 | 1995-96 | 1996-97 | |
|---|---|---|---|---|---|---|
|
Note: Residential mobility measures the percent of individual over age 1 who changed houses between March of the first year and March of the next year. The mobility of married-couple and female single-parent families is the percent of householders age 15 to 54 with own children under 18 who changed houses. Source: U.S. Bureau of the Census, “Geographical Mobility,” Current Populations Reports, Series P20, Nos. 463, 473, 481, 485, 497 and 510. |
||||||
| Number Moving (in millions) | ||||||
| Total Population 1 year and older | 41.5 | 42.8 | 42.0 | 42.8 | 42.5 | 42.1 |
| Persons 25 years and over | 32.3 | 33.2 | 33.0 | 33.6 | 32.2 | NA |
| All Families with Children | ||||||
| Age 1-4 years | 3.5 | 3.5 | 3.5 | 3.5 | 3.9 | 3.7 |
| Age 5-9 years | 3.3 | 3.3 | 3.1 | 3.3 | 3.6 | 3.8 |
| Age 10-14 years | 2.5 | 2.8 | 2.5 | 2.5 | 2.8 | 2.9 |
| Married Couples with Children | ||||||
| Under 18 years | 3.7 | 3.9 | 3.8 | 3.7 | 3.6 | 3.5 |
| Under 6 years | 1.6 | 1.6 | 1.6 | 1.5 | 1.5 | 1.3 |
| Single Parents with Children | ||||||
| Under 18 years | 2.3 | 2.5 | 2.3 | 2.5 | 2.4 | 2.6 |
| Under 6 years | 0.8 | 0.9 | 0.9 | 1.0 | 0.9 | 0.9 |
| Percent Moving | ||||||
| Total Population 1 year and older | 17.0 | 17.3 | 16.8 | 16.7 | 16.3 | 16.0 |
| Persons 25 years and over | 16.7 | 17.0 | 16.7 | 16.7 | 15.8 | NA |
| All Families with Children | ||||||
| Age 1-4 years | 22.7 | 23.0 | 22.2 | 21.5 | 24.3 | 23.0 |
| Age 5-9 years | 17.6 | 18.0 | 16.5 | 16.9 | 17.9 | 18.7 |
| Age 10-14 years | 14.1 | 15.4 | 13.4 | 12.9 | 14.2 | 15.0 |
| Married Couples with Children | ||||||
| Under 18 years | 15.8 | 16.3 | 16.0 | 15.4 | 15.0 | 14.2 |
| Under 6 years | 25.1 | 25.4 | 25.0 | 23.9 | 24.5 | 21.8 |
| Single Parents with Children | ||||||
| Under 18 years | 29.0 | 30.3 | 27.3 | 28.1 | 26.8 | 27.7 |
| Under 6 years | 46.4 | 46.7 | 43.6 | 43.9 | 42.8 | 43.4 |
Economic Security Risk Factor 13. Adult Incarceration
This risk factor tracks trends in the extent to which adults are living apart from their children because they are incarcerated. An incarcerated parent leaves his orher family at increased risk of dependence.
Figure ECON 13. Estimated Number of Sentenced Male Prisoners Under State or Federal Jurisdiction per 100,000 Resident Population, 1981 to 1996
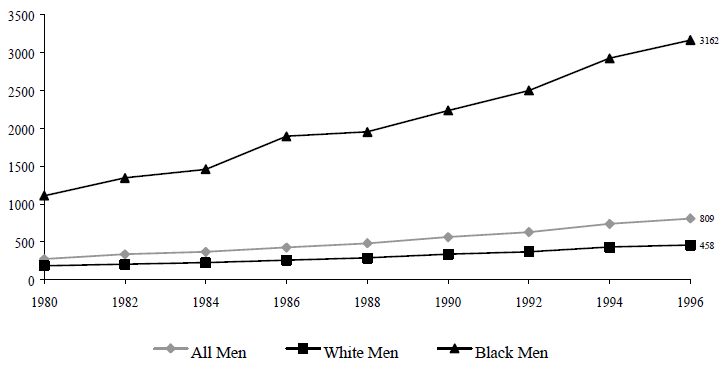
Source: Table ECON 13.
- From 1980 to 1996, the number of black men incarcerated per 100,000 population increased 185 percent, while the rate for white men increased 144 percent in the same period.
- Table ECON 13 shows that the rate of incarceration for women, while still very small relative to men, rose 364 percent from 1980 to 1996, with white female incarceration increasing 400 percent and black female incarceration increasing 307 percent.
- Table ECON 13 also shows that the rates for black men and black women were much higher than the rates for white men and white women in 1996.
Table ECON 13. Estimated Number of Sentenced Prisoners Under State or Federal Jurisdiction per 100,000 Resident Population
| Total Men and Womena | All Mena | White Men | Black Men | All Womena | White Women | Black Women | |
|---|---|---|---|---|---|---|---|
| 1980 | 139 | 275 | 188 | 1111 | 11 | 6 | 45 |
| 1981 | 154 | 304 | 186 | 1217 | 12 | 7 | 50 |
| 1982 | 171 | 337 | 206 | 1345 | 14 | 8 | 57 |
| 1983 | 179 | 354 | 217 | 1412 | 15 | 9 | 58 |
| 1984 | 188 | 370 | 228 | 1459 | 16 | 9 | 63 |
| 1985 | 202 | 397 | 246 | 1559 | 17 | 10 | 68 |
| 1986 | 217 | 426 | 261 | 1895 | 20 | 12 | 77 |
| 1987 | 231 | 453 | 277 | 1800 | 22 | 13 | 82 |
| 1988 | 247 | 482 | 290 | 1951 | 24 | 15 | 91 |
| 1989 | 276 | 535 | 317 | 2200 | 29 | 17 | 115 |
| 1990 | 297 | 564 | 338 | 2234 | 31 | 19 | 117 |
| 1991 | 313 | 595 | 352 | 2368 | 33 | 19 | 129 |
| 1992 | 332 | 631 | 373 | 2499 | 35 | 20 | 136 |
| 1993 | 359 | 685 | 402 | 2718 | 40 | 23 | 155 |
| 1994 | 389 | 739 | 432 | 2923 | 45 | 26 | 169 |
| 1995 | 411 | 781 | 449 | 3095 | 47 | 27 | 176 |
| 1996 | 427 | 809 | 458 | 3162 | 51 | 30 | 183 |
|
Notes: Sentenced prisoners are those with a sentence of more than 1 year. Rates are based on U.S. resident population on July 1 of each year. Rates for 1990--1996 may differ from those previously published because the number of prisoners under jurisdiction have been revised and the resident population by sex and race have been adjusted for the Census undercount. a Includes Asians, Pacific Islanders, American Indians, Alaskan Natives, and other racial groups. Sources: Correctional Populations in the United States, 1994, 1995, 1996; U.S. Department of Justice, Bureau of Justice Statistics, NCJ-160091, June 1996; NCJ-163916, May 1997; NCJ-170013, November 1998. |
|||||||
Employment and Work-related Risk Factor 1. Labor Force Attachment
This risk factor focuses exclusively on the participation of an adult in the labor market, without regard to whether means-tested assistance was received concurrently. Measuring labor force attachment reflects a critical aspect of the risk of dependence.
Figure WORK 1. Percentage of All Individuals in Families with Labor Force Participants, 1994
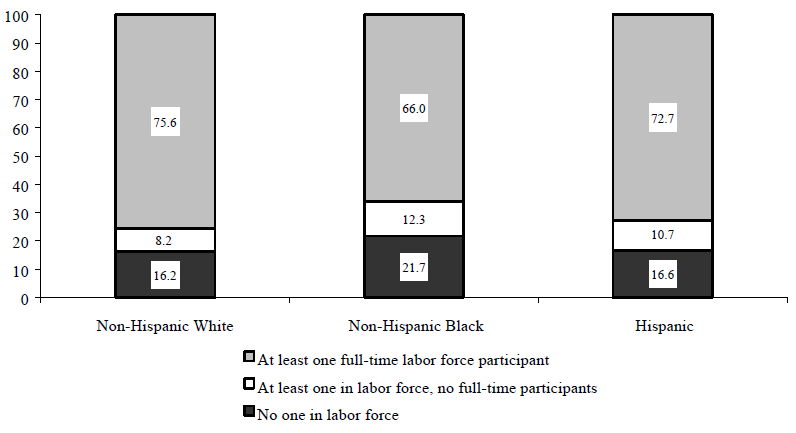
Source: Table WORK 1a.
- In 1994, most individuals, regardless of race, lived in families with at least one person participating in the labor force on a full-time basis.
- Non-Hispanic blacks were more likely than Hispanics or non-Hispanic whites to live in families with no one in the labor force.
- As shown in Table WORK 1a, younger children were slightly more likely than older children to live in families with no one in the labor force.
- Table WORK 1a shows that working-age women were more likely than working-age men to live in families with no one in the labor force, and less likely to live in families with at least one full-time labor force participant.
- The percentage of individuals in families with no one in the labor force increased slightly, from 16 percent in 1987 to 17 percent in 1994, as shown in Table WORK 1b.
Table WORK 1a. Percentage of All Individuals in Families with Labor Force Participants, 1994
| No One in Labor Force | At Least One Person in Labor Force, No Full-Time Participants | At Least One Full-Time Labor Force Participant | |
|---|---|---|---|
|
Note: Full-time labor force participants are defined as those who usually work 35 or more hours per week. Source: Unpublished data from the SIPP, 1993 panel. |
|||
| All Persons | 16.7 | 9.1 | 74.3 |
| Racial Categories | |||
| Non-Hispanic White | 16.2 | 8.2 | 75.6 |
| Non-Hispanic Black | 21.7 | 12.3 | 66.0 |
| Hispanic | 16.6 | 10.7 | 72.7 |
| Age Categories | |||
| Children Age 0 - 5 | 12.3 | 8.9 | 78.9 |
| Children Age 6 - 10 | 11.6 | 9.3 | 79.1 |
| Children Age 11 - 15 | 9.6 | 9.4 | 81.0 |
| Women Age 16 - 64 | 19.2 | 9.4 | 71.4 |
| Men Age 16 - 64 | 14.1 | 8.6 | 77.3 |
Table WORK 1b. Percentage of All Individuals in Families with Labor Force Participants, 1987 to 1994
| 1987 | 1988 | 1990 | 1991 | 1993 | 1994 | |
|---|---|---|---|---|---|---|
|
Note: Full-time labor force participants are defined as those who usually work 35 or more hours per week. Source: Unpublished data from the SIPP, 1987, 1990, and 1993 panels. |
||||||
| No One in the Labor Force | 15.7 | 15.5 | 15.8 | 16.2 | 16.3 | 16.7 |
| At Least One Person in Labor Force, no Full-Time Participants | 8.3 | 7.7 | 7.8 | 8.6 | 9.5 | 9.1 |
| At Least One Full-Time Labor Force Participant | 76.0 | 76.8 | 76.4 | 75.2 | 74.2 | 74.3 |
Employment and Work-related Risk Factor 2. Employment Among the Low-skilled
This risk factor tracks trends in the percentage of men and women with 12 years of schooling or less who are engaged in paid employment. These trends illustrate a key risk of dependence.
Figure WORK 2. Percent of All Persons Ages 18 to 65 with no more than a High School Education who were Employed, 1969 to 1998
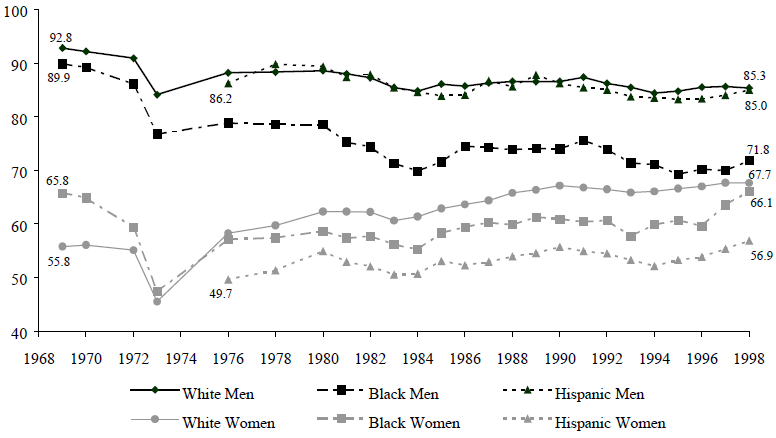
Source: Table WORK 2.
- The percentage of low-skilled men who were employed dropped significantly between 1969 and 1984, with the largest decline among black men. During this time period, the percentage of high school-educated black men who were employed dropped 20 percentage points, from 90 percent to 70 percent; for low-skilled white men, employment rates dropped 8 percentage points over this time period, from 93 percent to 85 percent.
- Since 1984, employment levels for high school-educated white men and Hispanic men have leveled off, hovering close to 85 percent. Employment levels for low-skilled black men have fluctuated over the past fifteen years, rising as high as 76 percent in 1991, and falling as low as 69 percent in 1995.
- In 1998, only 72 percent of black men with no more than a high school education were working compared to 85 percent of similarly educated white and Hispanic men.
- The employment rates for low-skilled women have steadily increased since the early 1970s. Since 1973, employment levels for white and black women have improved by about 20 percentage points. The improvement for Hispanic women, however, has been much less pronounced.
Table WORK 2. Percentage of All Persons Ages 18 to 65 with No More Than a High School Education Who Were Employed, 1969 to 1998
| Men | Women | |||||
|---|---|---|---|---|---|---|
| Year | White | Black | Hispanic | White | Black | Hispanic |
|
Note: White and Black includes Hispanic for all years. Hispanic was not available until 1975. Source: ASPE tabulations of March Current Population Surveys. |
||||||
| 1969 | 92.8 | 89.9 | NA | 55.8 | 65.8 | NA |
| 1970 | 92.1 | 89.2 | NA | 56.1 | 64.9 | NA |
| 1972 | 90.9 | 86.1 | NA | 55.2 | 59.4 | NA |
| 1973 | 84.1 | 76.8 | NA | 45.6 | 47.4 | NA |
| 1976 | 88.2 | 78.8 | 86.2 | 58.3 | 57.2 | 49.7 |
| 1978 | 88.3 | 78.6 | 89.8 | 59.8 | 57.4 | 51.4 |
| 1980 | 88.6 | 78.5 | 89.4 | 62.3 | 58.7 | 55.0 |
| 1981 | 88.0 | 75.3 | 87.4 | 62.3 | 57.4 | 53.0 |
| 1982 | 87.3 | 74.4 | 87.9 | 62.3 | 57.7 | 52.1 |
| 1983 | 85.4 | 71.3 | 85.4 | 60.7 | 56.2 | 50.6 |
| 1984 | 84.8 | 69.9 | 84.6 | 61.4 | 55.3 | 50.8 |
| 1985 | 86.1 | 71.6 | 83.9 | 62.9 | 58.4 | 53.1 |
| 1986 | 85.7 | 74.5 | 84.1 | 63.7 | 59.4 | 52.4 |
| 1987 | 86.3 | 74.2 | 86.7 | 64.4 | 60.3 | 53.0 |
| 1988 | 86.6 | 73.9 | 85.6 | 65.8 | 59.9 | 54.0 |
| 1989 | 86.5 | 74.1 | 87.8 | 66.4 | 61.3 | 54.6 |
| 1990 | 86.6 | 74.0 | 86.2 | 67.2 | 60.9 | 55.8 |
| 1991 | 87.4 | 75.6 | 85.4 | 66.8 | 60.4 | 55.0 |
| 1992 | 86.2 | 73.9 | 85.0 | 66.5 | 60.7 | 54.6 |
| 1993 | 85.5 | 71.4 | 83.7 | 65.9 | 57.8 | 53.3 |
| 1994 | 84.4 | 71.1 | 83.5 | 66.1 | 59.9 | 52.2 |
| 1995 | 84.7 | 69.3 | 83.2 | 66.6 | 60.7 | 53.3 |
| 1996 | 85.5 | 70.2 | 83.3 | 67.0 | 59.7 | 53.9 |
| 1997 | 85.6 | 70.0 | 84.0 | 67.7 | 63.6 | 55.4 |
| 1998 | 85.3 | 71.8 | 85.0 | 67.7 | 66.1 | 56.9 |
Employment and Work-related Risk Factor 3. Earnings of Low-skilled Workers
The economic condition of the low-skill labor market is key to the ability of young adult men and women to support families without receiving means-tested assistance. This measure tracks trends in the earnings of low-skilled workers.
Figure WORK 3. Mean Weekly Wages of Men Working Full-Time, Full-Year with No More Than a High School Education (1995 Dollars), 1970 to 1994
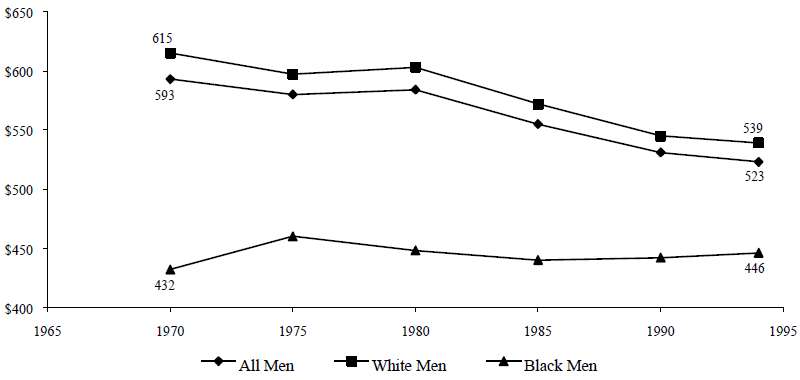
Source: Table WORK 3.
- Mean weekly wages for full-time work by high school-educated men have decreased in real terms over the past quarter of a century. In 1970 the mean weekly wage for low-skilled men working full-time was $593 (in 1995 dollars); the comparable wage in 1994 was $523, representing a decrease of 12 percent.
- A large gap exists between mean weekly wages for high school-educated white and black men, although it has been narrowing over time. In 1970, the mean weekly wage for low-skilled black men working full-time was $432 (in 1995 dollars), or 70 percent of the $615 average for white men. In 1994, full-time working black men with no more than a high school education received 82 percent of the weekly wages of white men, or a mean wage of $446, compared to a mean wage for white men of $539. The narrowing of this gap is predominantly a result of the declining value of white men’s mean wages.
Table WORK 3. Mean Weekly Wages of Men Working Full-Time, Full-Year with No More Than a High School Education (1995 Dollars), 1970 to 1994
| 1970 | 1975 | 1980 | 1985 | 1990 | 1994 | |
|---|---|---|---|---|---|---|
|
Note: Full-time, full-year workers work at least 48 weeks per year and 35 hours per week. These data have been weighted to create an average for all men with no more than a high school diploma using population numbers from U.S. Bureau of the Census, Current Population Reports, Series P-20. The population weights were calculated for 1970, 1980, and 1990 and the Other year weights were calculated using linear extrapolation. Source: Blank, R., It Takes a Nation, 1997. |
||||||
| All Men | $593 | $580 | $584 | $555 | $531 | $523 |
| White Men | 615 | 597 | 603 | 572 | 545 | 539 |
| Black Men | 432 | 460 | 448 | 440 | 442 | 446 |
Employment and Work-related Risk Factor 4. ADULT/CHILD Disability
Health conditions that limit parents’ ability to work are important predictors of family economic problems and future dependence.
Figure WORK 4. Percentage of the Total Population Reporting a Disability, 1994
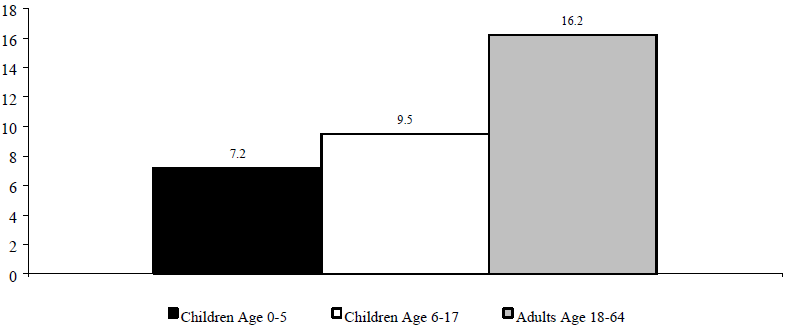
Source: Table WORK 4.
- In 1994, adults were more likely than school-age children to have a functional disability, and school-age children were in turn more likely to have a functional disability than younger children.
- As shown in Table WORK 4, the percentage of non-Hispanic blacks who reported a functional disability was larger than the percentages for non-Hispanic whites and Hispanics.
- Table WORK 4 also shows that while adults were more likely in 1994 to report a functional disability than children, a higher percentage of children than adults were actually recipients of disability program benefits.
| Table WORK 4. Percentage of the Total Population Reporting a Disability, 1994 | |
|---|---|
|
Note: Functional disability only includes those disabilities expected to last at least 12 months. Functional disabilities were defined as either: (1) limitations in or inability to perform a variety of physical activities (i.e. walking, lifting, reaching); (2) serious sensory impairments (i.e. inability to read newsprint even with glasses or contact lenses); (3) serious symptoms of mental illness (i.e. frequent depression or anxiety; frequent confusion, disorientation, or difficulty remembering) which has seriously interfered with life for the last year; (4) use of selected assistive devices (i.e. wheelchairs, scooter, walkers); (5) developmental delays for children identified by a physician (i.e. physical, learning); (6) for children under 5, inability to perform age-appropriate functions (i.e. sitting up, walking); and, (7) long-term care needs. Work disability is defined as limitations in or the inability to work as a result of a physical, mental or emotional health condition. Perceived disability is a new disability measure based on the Americans with Disabilities Act (ADA) and includes individuals who were perceived by themselves or others as having a disability. Disability program recipients include persons covered by Supplemental Security Income (SSI), Social Security Disability Insurance (SSDI), Special Education Services, Early Intervention Services, and/or disability pensions. Source: Unpublished data from the 1994 National Health Interview Survey on Disability, Phase I; 1994 NHIS, and 1994 Family Resources Supplement. |
|
| Functional Disability | |
| All Persons | 18.3 |
| Racial Categories | |
| Non-Hispanic White | 8.7 |
| Non-Hispanic Black | 11.0 |
| Hispanic | 7.7 |
| Age Categories | |
| Children Age 0 - 5 | 7.2 |
| Children Age 6 - 17 | 9.5 |
| Adults Age 18 - 64 | 16.2 |
| Functional, Work, Perceived or Program Disability | |
| Age 0 - 17 | |
| Functional Disability | 8.7 |
| Work Disability | NA |
| Perceived Disability | 2.8 |
| Disability Program Recipient | 6.7 |
| Age 18 - 64 | |
| Functional Disability | 16.2 |
| Work Disability | 10.7 |
| Perceived Disability | 7.0 |
| Disability Program Recipient | 5.7 |
Employment and Work-related Risk Factor 5. Adult Alcohol and Substance Abuse
Adult alcohol and substance abuse is a risk factor for dependence.
Figure WORK 5. Percentage of Adults who used Cocaine, Marijana, or Alcohol, 1997
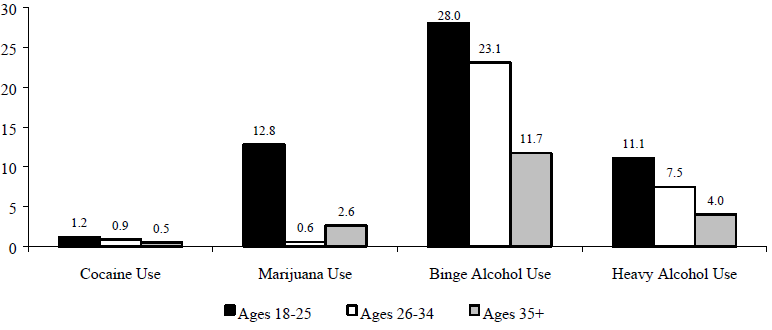
Source: Table WORK 5.
- In 1997, young adults (age 18 to 25) were more likely than other adults to report cocaine use, marijuana use, or alcohol abuse in the past month. One-eighth (13 percent) of adults 18 to 25 reported using marijuana in the past month, compared with 6 percent of adults 26 to 34 and 3 percent of adults 35 and older. The age differences were less pronounced for cocaine use and alcohol abuse.
- The percentages of persons reporting binge alcohol use were significantly larger than the percentages for all other reported behaviors, across all age groups and for all years with reports on alcohol use, as shown in Table WORK 5. In 1997, for example, about one-fourth of adults under 35 (28 percent for adults 18 to 25, and 23 percent for adults 26 to 34) reported drinking five or more drinks on the same occasion at least once within the past month.
- As shown in Table WORK 5, marijuana use was more prevalent than heavy alcohol use among adults ages 18 to 25 in the most recent years (1996 and 1997), as had been the case in earlier years (1985 and 1988). In the intervening years, however, heavy alcohol use was more prevalent than marijuana use among this age group. The recent trend is a result of both increasing marijuana use and decreasing heavy alcohol use in the 1990s, a reversal of the prior trend.
Table WORK 5. Percentage of Adults Who Used Cocaine, Marijuana, or Alcohol, 1979 to 1997
| 1979 | 1985 | 1988 | 1991 | 1994 | 1996 | 1997 | |
|---|---|---|---|---|---|---|---|
|
Note: Cocaine and marijuana use is defined as use during the past month. “Binge" Alcohol Use is defined as drinking five or more drinks on the same occasion on at least one day in the past 30 days. "Occasion" means at the same time or within a couple hours of each other. Heavy Alcohol Use is defined as drinking five or more drinks on the same occasion on each of five or more days in the past 30 days; all Heavy Alcohol Users are also "Binge" Alcohol Users. Data for 1997 are preliminary. Source: U.S. Department of Health and Human Services, Substance Abuse and Mental Health Services |
|||||||
| Cocaine | |||||||
| Age 18 - 25 | 9.9 | 8.1 | 4.8 | 2.2 | 1.2 | 2.0 | 1.2 |
| Age 26 - 34 | 3.0 | 6.3 | 2.8 | 1.9 | 1.3 | 1.5 | 0.9 |
| Age 35 and Above | 0.2 | 0.5 | 0.4 | 0.5 | 0.4 | 0.4 | 0.5 |
| Marijuana | |||||||
| Age 18 - 25 | 35.6 | 21.7 | 15.3 | 12.9 | 12.1 | 13.2 | 12.8 |
| Age 26 - 34 | 19.7 | 19.0 | 12.3 | 7.7 | 6.9 | 6.3 | 6.0 |
| Age 35 and Above | 2.9 | 2.6 | 1.8 | 2.6 | 2.3 | 2.0 | 2.6 |
| Binge Alcohol Use | |||||||
| Age 18 - 25 | NA | 34.4 | 28.2 | 31.2 | 33.6 | 32.0 | 28.0 |
| Age 26 - 34 | NA | 27.5 | 19.7 | 21.5 | 24.0 | 22.8 | 23.1 |
| Age 35 and Above | NA | 12.9 | 9.7 | 10.1 | 11.8 | 11.3 | 11.7 |
| Heavy Alcohol Use | |||||||
| Age 18 - 25 | NA | 13.8 | 12.0 | 15.2 | 13.2 | 12.9 | 11.1 |
| Age 26 - 34 | NA | 11.5 | 7.1 | 7.9 | 8.0 | 7.1 | 7.5 |
| Age 35 and Above | NA | 5.2 | 4.0 | 4.4 | 4.8 | 3.8 | 4.0 |
Employment and Work-related Risk Factor 6. Children's Health Conditions
Health limitations may limit the labor force participation of parents and therefore illustrate a risk of dependence.
Table WORK 6. Selected Chronic Health Conditions per 1,000 Children Ages 0 to 17, 1984 to 1994
| 1984 | 1987 | 1990 | 1992 | 1993 | 1994 | |
|---|---|---|---|---|---|---|
| Source: U.S. Department of Health and Human Services, Office of the Assistant Secretary for Planning and Evaluation, Trends in the Well-Being of America’s Children and Youth: 1997. Table HC 2.4. | ||||||
| Respiratory Conditions | ||||||
| Chronic Bronchitis | 50 | 62 | 53 | 54 | 59 | 55 |
| Chronic Sinusitis | 47 | 58 | 57 | 69 | 80 | 65 |
| Asthma | 43 | 53 | 58 | 63 | 72 | 69 |
| Chronic Diseases of Tonsils or Adenoids | 34 | 30 | 23 | 28 | 26 | 23 |
| Impairments | ||||||
| Deformity or Orthopedic Impairment | 35 | 36 | 29 | 33 | 29 | 28 |
| Speech Impairment | 16 | 19 | 14 | 21 | 20 | 21 |
| Hearing Impairment | 24 | 16 | 21 | 15 | 17 | 18 |
| Visual Impairment | 9 | 10 | 9 | 10 | 7 | 9 |
| Other Conditions | ||||||
| Heart Disease | 23 | 22 | 19 | 19 | 20 | 18 |
| Anemia | 11 | 8 | 10 | 11 | 9 | 12 |
| Epilepsy | 7 | 4 | 4 | 3 | 5 | 5 |
- Respiratory conditions were the most prevalent chronic health conditions experienced by children ages 0 to 17 throughout the time period, especially asthma. In 1994, 69 children per thousand had asthma, up from 43 children per thousand in 1984. The prevalence of chronic sinusitis also increased, from 47 children per thousand in 1984, to 65 children per thousand by 1994.
- In 1994, 28 children per thousand had a deformity or orthopedic impairment, down from 35 children per thousand in 1984.
Employment and Work-related Risk Factor 7. Child CARE Expenditures
Proportion of total family income spent on child care in families with employed mothers is an important dimension of the risk of dependency.
Figure WORK 7. Percentage of Monthly Income Spent on Child Care for Preschoolers by Families with Employed Mothers, 1993
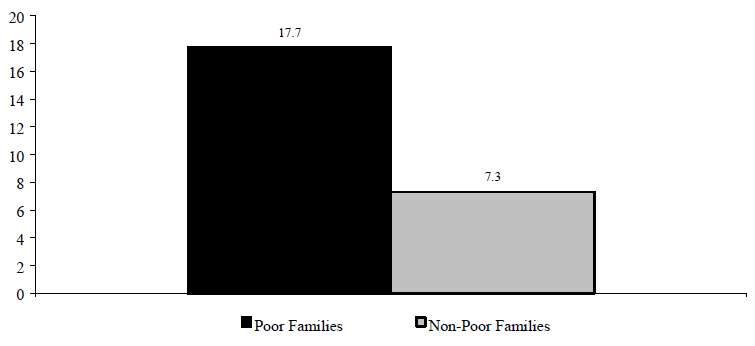
Source: Table WORK 7.
- Poor families with employed mothers of preschoolers spent a much larger percentage of their monthly family income on child care in 1993 relative to non-poor families with employed mothers (18 percent compared to 7 percent).
- As shown in Table WORK 7, employed single mothers (no husband present) spent a larger percentage of their monthly family income on child care expenses than did employed married mothers.
- Table WORK 7 shows that employed mothers who received assistance from AFDC, WIC or Food Stamps spent a larger percentage of their total monthly family income on child care relative to non-recipients (13 percent compared to 7 percent). Among recipients of these programs, AFDC recipients spent the largest percentage of their monthly family income on child care.
Table WORK 7. Percentage of Monthly Income Spent on Child Care for Preschoolers by Families with Employed Mothers, 1993
| Table WORK 7. Percentage of Monthly Income Spent on Child Care for Preschoolers by Families with Employed Mothers, 1993 |
|
|---|---|
| All Families | 7.6 |
| Racial Categories | |
| Non-Hispanic White | 7.4 |
| Non-Hispanic Black | 8.5 |
| Hispanic | 9.0 |
| Marital Status | |
| Married, Husband Present | 7.0 |
| Widowed, Separated, Divorced | 12.3 |
| Never Married | 12.5 |
| Poverty Status | |
| Poor | 17.7 |
| Non-Poor | 7.3 |
| Program Participation | |
| Recipient | 12.8 |
| AFDC | 17.1 |
| WIC | 12.3 |
| Food Stamps | 14.6 |
| Non-Recipient | 7.3 |
|
Note: Non-recipients are those in families not receiving AFDC, general assistance, Food Stamps or WIC. Source: U.S. Bureau of the Census, "What Does It Cost to Mind Our Preschoolers," Current Population Reports, Series P70-52, 1995. |
|
Employment and Work-related Risk Factor 8. Educational Attainment
Completed schooling is one measure of job-skill level. Individuals with no more than a high school education have the lowest amount of human capital and are at the greatest risk of becoming poor despite their work effort. This risk factor tracks the trend in educational attainment.
Figure WORK 8. Percentage of Adults Ages 25 and Over by Level of Educational Attainment, 1970 to 1997
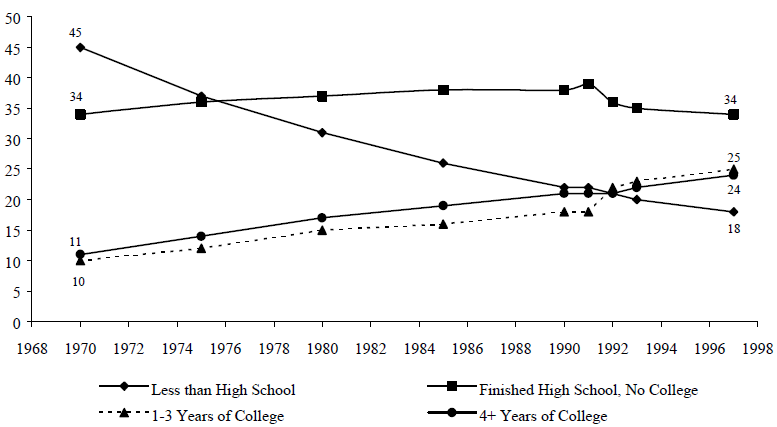
Source: Table WORK 8.
- Since 1970 there has been a marked decline in the percentage of the population with less than a high school education, dropping from 45 percent in 1970 to 18 percent in 1997.
- The percentage of the population receiving a high school education but with no subsequent college was 34 percent in 1970, rose somewhat in the 1970s and 1980s, and then fell back to 34 percent by 1997.
- Since 1970 there has been a consistent increase in the percentage of the population with some college (one to three years), rising from 11 to 25 percent.
- The percentage of the population completing four or more years of college more than doubled from 1970 to 1997, rising steadily from 11 to 24 percent.
Table WORK 8. Percentage of Adults Ages 25 and Over by Level of Educational Attainment, 1970 to 1997
| 1970 | 1975 | 1980 | 1985 | 1990 | 1991 | 1992 | 1993 | 1997 | |
|---|---|---|---|---|---|---|---|---|---|
|
Note: Completing the GED is not considered completing high school within this table. Beginning with data for 1992, a new question results in different categories than for earlier years. Data shown as 'High School, 4 years' is now collected by the category 'High School Graduate.' Data shown as 'College 1 to 3 years,' is now collected by 'Some College;' and two 'Associate Degree' categories. Data shown as 'College 4 years or more,' is now collected by the categories, 'Bachelor's Degree; Master's Degree;' 'Doctorate Degree;' 'Professional Degree.' Source: U.S. Bureau of the Census, "Educational Attainment in the United States" Current Population Reports, Series P20, Nos. 476 (1994) and 505 (1998). |
|||||||||
| Less than High School | 45 | 37 | 31 | 26 | 22 | 22 | 21 | 20 | 18 |
| Finished High School, No College | 34 | 36 | 37 | 38 | 38 | 39 | 36 | 35 | 34 |
| One to Three Years of College | 10 | 12 | 15 | 16 | 18 | 18 | 22 | 23 | 25 |
| Four or More Years of College | 11 | 14 | 17 | 19 | 21 | 21 | 21 | 22 | 24 |
Employment and Work-related Risk Factor 9. High-school Dropout Rates
Although some teens who drop out of high school eventually graduate or obtain GEDS, dropout rates are reliable risk factors associated with teen problem behavior and future economic problems.
Figure WORK 9. Percentage of Students Enrolled in Grades 10 to 12 in the Previous Year Who Were Not Enrolled and Had Not Graduated in the Survey Year, 1975 to 1996
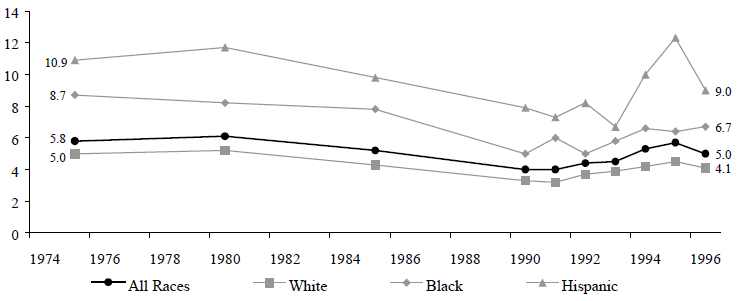
Source: Table WORK 9.
- After declining steadily during the 1980s and the 1990s, dropout rates for teens in grades 10 to 12 began rising, from a total dropout rate of 4 percent in 1990 to a rate of 6 percent in 1995. The overall rate dropped back to 5 percent in 1996.
- Dropout rates are highest for Hispanic teens. In 1996, the dropout rate was 9 percent for Hispanic teens, compared to 7 percent for black teens and 4 percent for white teens.
Table WORK 9. Percentage of Students Enrolled in Grades 10 to 12 in the Previous Year Who Were Not Enrolled and Had Not Graduated in the Survey Year, 1975 to 1996
| 1975 | 1980 | 1985 | 1990 | 1991 | 1992 | 1993 | 1994 | 1995 | 1996 | |
|---|---|---|---|---|---|---|---|---|---|---|
| Source: U.S. Department of Health and Human Services, Office of the Assistant Secretary for Planning and Evaluation, Trends in the Well-Being of America’s Children and Youth: 1998. Table EA 1.4. | ||||||||||
| Total | 5.8 | 6.1 | 5.2 | 4.0 | 4.0 | 4.4 | 4.5 | 5.3 | 5.7 | 5.0 |
| White | 5.0 | 5.2 | 4.3 | 3.3 | 3.2 | 3.7 | 3.9 | 4.2 | 4.5 | 4.1 |
| Black | 8.7 | 8.2 | 7.8 | 5.0 | 6.0 | 5.0 | 5.8 | 6.6 | 6.4 | 6.7 |
| Hispanic | 10.9 | 11.7 | 9.8 | 7.9 | 7.3 | 8.2 | 6.7 | 10.0 | 12.3 | 9.0 |
Teen Behavior Risk Factor 1. Percentage of Births That are to Unmarried Women Within Age Groups
This risk factor shows the percentage of all births, within each age group, that are to unmarried women.
Figure TEEN 1. Percentage of Births That Are to Unmarried Women, by Age Group, 1940 to 1997
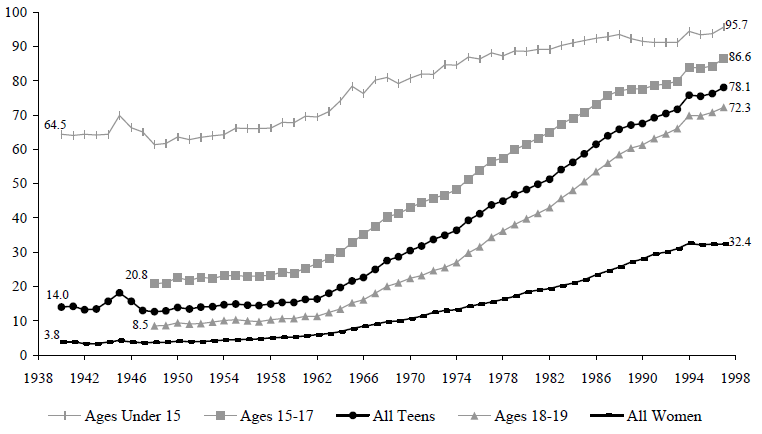
Source: Table TEEN 1.
- The percentage of children born outside of marriage to women of all ages has increased over the past half-century, from 4 percent in 1940 to 32 percent in 1997. This increase reflects changes in several factors: the rate at which unmarried women have children, the rate at which married women have children, and the rate at which women marry.
- The percentage of children born outside of marriage is especially high for teen women, as shown in Figure TEEN 1. Among teens, over three-quarters (78 percent) of births were outside of marriage in 1997. The comparable percentage for all women is 32 percent.
- Figure TEEN 1 shows that the percentage of unmarried births to all women has leveled off since 1994. Growth in the percentage of unmarried births to teen mothers has also slowed since 1994, but it is still rising (from 76 percent in 1994 to 78 percent in 1997).
- The trend toward leveling off has occurred for both black and white women (see Table C-1 in Appendix C for non-marital birth data by age and race).
Table TEEN 1. Percentage of Births That Are to Unmarried Women by Age Group, 1940 to 1997
| Year | Under 15 | 15-17 Years | 18-19 Years | All Teens | All Women |
|---|---|---|---|---|---|
|
Notes: Births to unmarried women in the United States for 1940 - 1979 are estimated from data for registration areas in which marital status of the mother was reported; see sources below. Beginning in 1980, births to unmarried women in the United States are based on data from states reporting marital status directly and data from non-reporting states for which marital status was inferred from other information on the birth certificate; see sources below. Data for 1997 are preliminary. Sources: U. S. Department of Health and Human Services, National Center for Health Statistics, "Births to Unmarried Mothers: United States, 1980 - 1992"; Vital and Health Statistics, Series 21, No. 53, 1995; U.S. Department of Health and Human Services, National Center for Health Statistics, "Report of Final Natality Statistics, 1995," Monthly Vital Statistics Report, Vol. 45, No. 11, Supplement, 1997; Ventura, S.J., Anderson, R.N., Martin, J.A, and Smith, B.L., "Births and Deaths: Preliminary Data for 1997," National Vital Statistics Reports, Vol. 47, No. 4, National Center for Health Statistics, Hyattsville, MD, 1998. |
|||||
| 1940 | 64.5 | NA | NA | 14 | 3.8 |
| 1941 | 64.1 | NA | NA | 14.2 | 3.8 |
| 1942 | 64.5 | NA | NA | 13.2 | 3.4 |
| 1943 | 64.2 | NA | NA | 13.4 | 3.3 |
| 1944 | 64.5 | NA | NA | 15.7 | 3.8 |
| 1945 | 70 | NA | NA | 18.2 | 4.3 |
| 1946 | 66.4 | NA | NA | 15.7 | 3.8 |
| 1947 | 65.1 | NA | NA | 13 | 3.6 |
| 1948 | 61.4 | 20.8 | 8.5 | 12.7 | 3.7 |
| 1949 | 61.8 | 21.1 | 8.6 | 12.9 | 3.7 |
| 1950 | 63.7 | 22.6 | 9.4 | 13.9 | 4 |
| 1951 | 62.9 | 21.8 | 9.1 | 13.5 | 3.9 |
| 1952 | 63.6 | 22.8 | 9.2 | 14 | 3.9 |
| 1953 | 64 | 22.3 | 9.6 | 14.1 | 4.1 |
| 1954 | 64.4 | 23.2 | 10.1 | 14.7 | 4.4 |
| 1955 | 66.3 | 23.2 | 10.3 | 14.9 | 4.5 |
| 1956 | 66.1 | 23 | 10 | 14.6 | 4.6 |
| 1957 | 66.1 | 23.1 | 9.8 | 14.5 | 4.7 |
| 1958 | 66.2 | 23.3 | 10.3 | 14.9 | 5 |
| 1959 | 67.9 | 24.2 | 10.6 | 15.4 | 5.2 |
| 1960 | 67.8 | 24 | 10.7 | 15.4 | 5.3 |
| 1961 | 69.7 | 25.3 | 11.3 | 16.2 | 5.6 |
| 1962 | 69.5 | 26.7 | 11.3 | 16.4 | 5.9 |
| 1963 | 71.1 | 28.2 | 12.5 | 18 | 6.3 |
| 1964 | 74.2 | 29.9 | 13.5 | 19.7 | 6.8 |
| 1965 | 78.5 | 32.8 | 15.3 | 21.6 | 7.7 |
| 1966 | 76.3 | 35.3 | 16.1 | 22.6 | 8.4 |
| 1967 | 80.3 | 37.7 | 18 | 25 | 9 |
| 1968 | 81 | 40.4 | 20.1 | 27.6 | 9.7 |
| 1969 | 79.3 | 41.3 | 21.1 | 28.7 | 10 |
| 1970 | 80.8 | 43 | 22.4 | 30.5 | 10.7 |
| 1971 | 82.1 | 44.5 | 23.2 | 31.8 | 11.3 |
| 1972 | 81.9 | 45.9 | 24.7 | 33.8 | 12.4 |
| 1973 | 84.8 | 46.7 | 25.6 | 35 | 13 |
| 1974 | 84.6 | 48.3 | 27 | 36.4 | 13.2 |
| 1975 | 87 | 51.4 | 29.8 | 39.3 | 14.2 |
| 1976 | 86.4 | 54 | 31.6 | 41.2 | 14.8 |
| 1977 | 88.2 | 56.6 | 34.4 | 43.8 | 15.5 |
| 1978 | 87.3 | 57.5 | 36.2 | 44.9 | 16.3 |
| 1979 | 88.8 | 60 | 38.1 | 46.9 | 17.1 |
| 1980 | 88.7 | 61.5 | 39.8 | 48.3 | 18.4 |
| 1981 | 89.2 | 63.3 | 41.4 | 49.9 | 18.9 |
| 1982 | 89.2 | 65 | 43 | 51.4 | 19.4 |
| 1983 | 90.4 | 67.5 | 45.7 | 54.1 | 20.3 |
| 1984 | 91.1 | 69.2 | 48.1 | 56.3 | 21 |
| 1985 | 91.8 | 70.9 | 50.7 | 58.7 | 22 |
| 1986 | 92.5 | 73.3 | 53.6 | 61.5 | 23.4 |
| 1987 | 92.9 | 75.8 | 56 | 64 | 24.5 |
| 1988 | 93.6 | 77.1 | 58.5 | 65.9 | 25.7 |
| 1989 | 92.4 | 77.7 | 60.4 | 67.2 | 27.1 |
| 1990 | 91.6 | 77.7 | 61.3 | 67.6 | 28 |
| 1991 | 91.3 | 78.7 | 63.2 | 69.3 | 29.5 |
| 1992 | 91.3 | 79.2 | 64.6 | 70.5 | 30.1 |
| 1993 | 91.3 | 79.9 | 66.1 | 71.8 | 31 |
| 1994 | 94.5 | 84.1 | 70 | 75.9 | 32.6 |
| 1995 | 93.5 | 83.7 | 69.8 | 75.6 | 32.2 |
| 1996 | 93.8 | 84.4 | 70.8 | 76.3 | 32.4 |
| 1997 | 95.7 | 86.6 | 72.3 | 78.1 | 32.4 |
Teen Behavior Risk Factor 2. Percentage of All Births That are to Unmarried Teens
This risk factor shows the percentage of total births that are to unmarried teen mothers each year.
Figure TEEN 2. Percentage of all Births That Are to Unmarried Teens Ages 15-19, 1940 to 1997
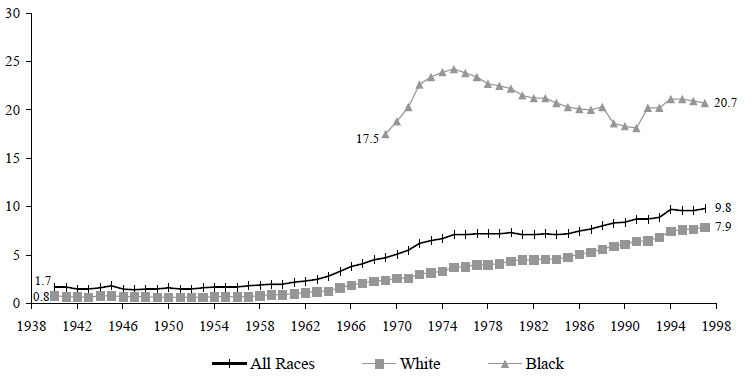
Source: Table TEEN 2.
- In contrast to Figure TEEN 1, which showed births to unmarried teens as a percentage of all teen births, Figure TEEN 2 shows births to unmarried teens as a percentage of births to all women, teens or adults, married or unmarried. Births to unmarried teens as a percentage of all births have risen, from 2 percent in 1940 to 10 percent in 1997. This percentage is affected by several factors: the age distribution of the population, the marriage rate among teens, the birth rate among unmarried teens, and the birth rate among all other women.
- The percentage of all births that were to unmarried teens leveled off over the last four years for births to both white and black women.
- Between 1970 and 1994, the percentage of all births that were to unmarried teens had been increasing steadily among white women.
- Among births to black women, the percentage of all births that were to unmarried teens varied greatly during the same period, peaking in 1975, then falling until the early 1990s. The sharp increase in the percentage for black women in the early 1970s reflects a rise in non-marital teen births concurrent with a decline in total black births.
Table TEEN 2. Percentage of All Births That Are to Unmarried Teens Ages 15 to 19, 1940 to 1997
| Year | All Races | White | Black |
|---|---|---|---|
|
Notes: Births to unmarried women in the United States for 1940 - 1979 are estimated from data for registration areas in which marital status of the the mother was reported; see sources below. Beginning in 1980, births to unmarried women in the United States are based on data from states reporting marital status directly and data from non-reporting states for which marital status was inferred from other information on the birth certificate; see sources below. Beginning in 1980, data are tabulated by the race of the mother. Prior to 1980, data are tabulated by the race of the child; see sources below. Data for 1997 are preliminary. Sources: U. S. Department of Health and Human Services, National Center for Health Statistics, "Births to Unmarried Mothers: United States, 1980 - 1992," Vital and Health Statistics, Series 21, No. 53, 1995; U.S. Department of Health and Human Services, National Center for Health Statistics, "Report of Final Natality Statistics, 1995," Monthly Vital Statistics Report, Vol. 45, No. 11, Supplement, 1997; Ventura, S.J., Anderson, R.N., Martin, J.A., Smith, B.L., "Births and Deaths: Preliminary Data for 1997," National Vital Statistics Reports, Vol. 47, No. 4, National Center for Health Statistics, Hyattsville, MD, 1998. |
|||
| 1940 | 1.7 | 0.8 | NA |
| 1941 | 1.7 | 0.7 | NA |
| 1942 | 1.5 | 0.7 | NA |
| 1943 | 1.5 | 0.6 | NA |
| 1944 | 1.6 | 0.8 | NA |
| 1945 | 1.8 | 0.8 | NA |
| 1946 | 1.5 | 0.7 | NA |
| 1947 | 1.4 | 0.7 | NA |
| 1948 | 1.5 | 0.7 | NA |
| 1949 | 1.5 | 0.6 | NA |
| 1950 | 1.6 | 0.6 | NA |
| 1951 | 1.5 | 0.6 | NA |
| 1952 | 1.5 | 0.6 | NA |
| 1953 | 1.6 | 0.6 | NA |
| 1954 | 1.7 | 0.7 | NA |
| 1955 | 1.7 | 0.7 | NA |
| 1956 | 1.7 | 0.7 | NA |
| 1957 | 1.8 | 0.7 | NA |
| 1958 | 1.9 | 0.8 | NA |
| 1959 | 2 | 0.9 | NA |
| 1960 | 2 | 0.9 | NA |
| 1961 | 2.2 | 1 | NA |
| 1962 | 2.3 | 1.1 | NA |
| 1963 | 2.5 | 1.2 | NA |
| 1964 | 2.8 | 1.3 | NA |
| 1965 | 3.3 | 1.6 | NA |
| 1966 | 3.8 | 1.9 | NA |
| 1967 | 4.1 | 2.1 | NA |
| 1968 | 4.5 | 2.3 | NA |
| 1969 | 4.7 | 2.4 | 17.5 |
| 1970 | 5.1 | 2.6 | 18.8 |
| 1971 | 5.5 | 2.6 | 20.3 |
| 1972 | 6.2 | 3 | 22.6 |
| 1973 | 6.5 | 3.2 | 23.4 |
| 1974 | 6.7 | 3.3 | 23.9 |
| 1975 | 7.1 | 3.7 | 24.2 |
| 1976 | 7.1 | 3.8 | 23.8 |
| 1977 | 7.2 | 4 | 23.4 |
| 1978 | 7.2 | 4 | 22.7 |
| 1979 | 7.2 | 4.1 | 22.5 |
| 1980 | 7.3 | 4.4 | 22.2 |
| 1981 | 7.1 | 4.5 | 21.5 |
| 1982 | 7.1 | 4.5 | 21.2 |
| 1983 | 7.2 | 4.6 | 21.2 |
| 1984 | 7.1 | 4.6 | 20.7 |
| 1985 | 7.2 | 4.8 | 20.3 |
| 1986 | 7.5 | 5.1 | 20.1 |
| 1987 | 7.7 | 5.3 | 20 |
| 1988 | 8 | 5.6 | 20.3 |
| 1989 | 8.3 | 5.9 | 18.6 |
| 1990 | 8.4 | 6.1 | 18.3 |
| 1991 | 8.7 | 6.4 | 18.1 |
| 1992 | 8.7 | 6.5 | 20.2 |
| 1993 | 8.9 | 6.8 | 20.2 |
| 1994 | 9.7 | 7.5 | 21.1 |
| 1995 | 9.6 | 7.6 | 21.1 |
| 1996 | 9.6 | 7.7 | 20.9 |
| 1997 | 9.8 | 7.9 | 20.7 |
Teen Behavior Risk Factor 3. Unmarried Teen Birth Rates Within Age Groups
This indicator tracks trends in the number of births per 1,000 unmarried teen women within specific age groups.
Figure TEEN 3a. Births per 1,000 Unmarried Teens Ages 15 to 17, 1966 to 1996
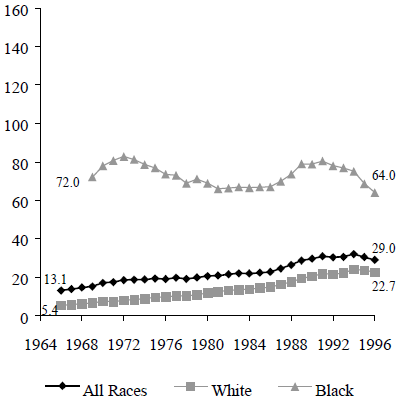
Figure TEEN 3b. Births per 1,000 Unmarried Teens Ages 18 to 19, 1966 to 1996
Source: Table TEEN 3.
- The birth rate per 1,000 single teens fell between 1994 and 1996 for both black and white teens in the 15 to 17 and 18 to 19 age groups, with the largest relative decline among black teens age 15 to 17.
- Prior to 1994, birth rates among single white teens in both age groups rose steadily for nearly three decades.
- Among single black teens in both age groups, birth rates varied greatly over the period, peaking in 1991, and falling thereafter. Rates for both age groups were lower in 1996 than in 1970.
Table TEEN 3. Births per 1,000 Unmarried Teen Women Within Age Groups, 1966 to 1996
| Ages 15-17 | Ages 18-19 | |||||
|---|---|---|---|---|---|---|
| Year | Total | White | Black | Total | White | Black |
|
Note: Rates are per 1,000 unmarried women in specified group; rates prior to 1980 are estimated. Births to unmarried women in the United States for 1940 - 1979 are estimated from data for registration areas in which marital status of the mother was reported; see sources below. Beginning in 1980, births to unmarried women in the United States are based on data from states reporting marital status directly and data from non-reporting states for which marital status was inferred from other information on the birth certificate; see sources below. Beginning in 1980, data are tabulated by the race of the mother. Prior to 1980, data are tabulated by the race of the child; see sources below. Rates for 1981-1989 have been revised and differ, therefore, from rates published in Vital Statistics in the United States, Vol. 1, Natality, for 1991 and earlier years. Sources: U. S. Department of Health and Human Services, National Center for Health Statistics, "Births to Unmarried Mothers: United States, 1980 - 1992," Vital and Health Statistics, Series 21, No. 53, 1995 and U.S. Department of Health and Human Services, National Center for Health Statistics, "Report of Final Natality Statistics, 1996," Monthly Vital Statistics Report, Vol. 46, No. 11, Supplement, 1998. |
||||||
| 1966 | 13.1 | 5.4 | NA | 25.6 | 14.1 | NA |
| 1967 | 13.8 | 5.6 | NA | 27.6 | 15.3 | NA |
| 1968 | 14.7 | 6.2 | NA | 29.6 | 16.6 | NA |
| 1969 | 15.2 | 6.6 | 72.0 | 30.8 | 16.6 | 128.4 |
| 1970 | 17.1 | 7.5 | 77.9 | 32.9 | 17.6 | 136.4 |
| 1971 | 17.5 | 7.4 | 80.7 | 31.7 | 15.8 | 135.2 |
| 1972 | 18.5 | 8.0 | 82.8 | 30.9 | 15.1 | 128.2 |
| 1973 | 18.7 | 8.4 | 81.2 | 30.4 | 14.9 | 120.5 |
| 1974 | 18.8 | 8.8 | 78.6 | 31.2 | 15.3 | 122.2 |
| 1975 | 19.3 | 9.6 | 76.8 | 32.5 | 16.5 | 123.8 |
| 1976 | 19.0 | 9.7 | 73.5 | 32.1 | 16.9 | 117.9 |
| 1977 | 19.8 | 10.5 | 73.0 | 34.6 | 18.7 | 121.7 |
| 1978 | 19.1 | 10.3 | 68.8 | 35.1 | 19.3 | 119.6 |
| 1979 | 19.9 | 10.8 | 71.0 | 37.2 | 21.0 | 123.3 |
| 1980 | 20.6 | 12.0 | 68.8 | 39.0 | 24.1 | 118.2 |
| 1981 | 20.9 | 12.6 | 65.9 | 39.0 | 24.6 | 114.2 |
| 1982 | 21.5 | 13.1 | 66.3 | 39.6 | 25.3 | 112.7 |
| 1983 | 22.0 | 13.6 | 66.8 | 40.7 | 26.4 | 111.9 |
| 1984 | 21.9 | 13.7 | 66.5 | 42.5 | 27.9 | 113.6 |
| 1985 | 22.4 | 14.5 | 66.8 | 45.9 | 31.2 | 117.9 |
| 1986 | 22.8 | 14.9 | 67.0 | 48.0 | 33.5 | 121.1 |
| 1987 | 24.5 | 16.2 | 69.9 | 48.9 | 34.5 | 123.0 |
| 1988 | 26.4 | 17.6 | 73.5 | 51.5 | 36.8 | 130.5 |
| 1989 | 28.7 | 19.3 | 78.9 | 56.0 | 40.2 | 140.9 |
| 1990 | 29.6 | 20.4 | 78.8 | 60.7 | 44.9 | 143.7 |
| 1991 | 30.9 | 21.8 | 80.4 | 65.7 | 49.6 | 148.7 |
| 1992 | 30.4 | 21.6 | 78.0 | 67.3 | 51.5 | 147.8 |
| 1993 | 30.6 | 22.1 | 76.8 | 66.9 | 52.4 | 141.6 |
| 1994 | 32.0 | 24.1 | 75.1 | 70.1 | 56.4 | 141.6 |
| 1995 | 30.5 | 23.6 | 68.6 | 67.6 | 55.4 | 131.2 |
| 1996 | 29.0 | 22.7 | 64.0 | 65.9 | 54.1 | 129.2 |
Teen Behavior Risk Factor 4. Early Sexual Intercourse
Early sexual intercourse is a strong predictor of subsequent childbearing at an early age, which increases the risk of dependence.
Figure TEEN 4. Percentage of High School Students Grades 9 to 12 Who Reported Ever Having Sexual Intercourse, 1997
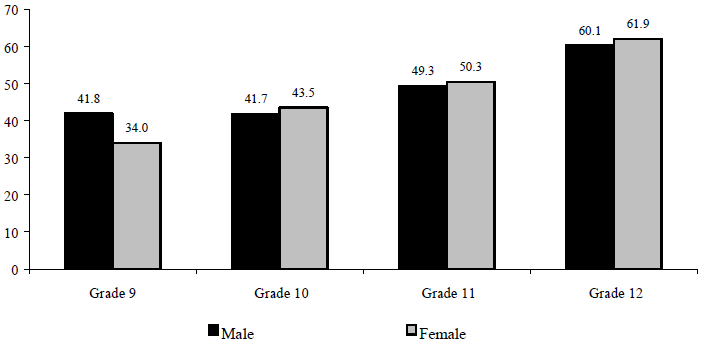
Source: Table TEEN 4.
- Between 1995 and 1997, the percentage of high school students reporting ever had sexual intercourse dropped by 5 percentage points, from 53 percent to 48 percent, as shown in Table TEEN 4.
- The percentage of high school students who report ever having had sexual intercourse increases with each grade, particularly among female students. In 1997, the rates rose from 34 percent for female 9th grade students to 62 percent for female 12th grade students, as depicted in Figure TEEN 4.
- Female students in grade 9 were less likely than their male counterparts to report ever having had sexual intercourse (34 percent compared to 42 percent). By grades 10 through 12, however, rates reported by female students had risen slightly above rates reported by male students.
- As shown in Table TEEN 4, in 1997, four-fifths (80 percent) of non-Hispanic black male students reported ever having had sexual intercourse, a percentage that is 14 percentage points above the 66 percent reported by non-Hispanic black female students. Among Hispanic students, the rate for males (58 percent) is 12 percentage points higher than the rate for females (46 percent). Among non-Hispanic white students, however, nearly equal percentages of males and females report ever having had sexual intercourse – 43 percent for males and 44 percent for females.
Table TEEN 4. Percentage of High School Students Grades 9 to 12 Who Reported Ever Having Sexual Intercourse, 1995 and 1997
| 1995 | 1997 | |||||
|---|---|---|---|---|---|---|
| Total | Male | Female | Total | Male | Female | |
| Source: U.S. Department of Health and Human Services, Centers for Disease Control and Prevention, Morbidity and Mortality Weekly Report, Surveillance Summaries, Vol. 45 No. SS-4 and Vol. 47, No. SS-3, Table 26. | ||||||
| Total | 53.1 | 54.0 | 52.1 | 48.4 | 48.9 | 47.7 |
| Grade | ||||||
| 9 | 36.9 | 40.6 | 32.1 | 38.0 | 41.8 | 34.0 |
| 10 | 48.0 | 50.0 | 46.0 | 42.5 | 41.7 | 43.5 |
| 11 | 58.6 | 57.1 | 60.2 | 49.7 | 49.3 | 50.3 |
| 12 | 66.4 | 67.1 | 66.0 | 60.9 | 60.1 | 61.9 |
| Racial Categories | ||||||
| Non-Hispanic White | 48.9 | 48.9 | 49.0 | 43.6 | 43.3 | 44.0 |
| Non-Hispanic Black | 73.4 | 81.0 | 67.0 | 72.7 | 80.3 | 65.6 |
| Hispanic | 57.6 | 62.0 | 53.3 | 52.2 | 57.7 | 45.7 |
Teen Behavior Risk Factor 5. Never-married Family Status
This measure complements the measures of nonmarital births by showing the “stock” of children living with never-married women. Children living with never-married women are at increased risk of dependence.
Figure TEEN 5. Percentage of all Children Living in Families Headed by Never- Married Women, 1983 to 1997
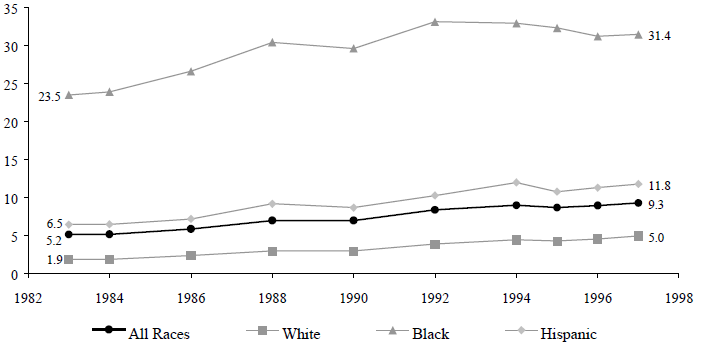
Source: Table TEEN 5.
- The percentage of children living with never-married women increased from 5 percent in 1983 to 9 percent in 1997. This increase reflects growth across all racial categories, as shown in Figure TEEN 5.
- A very small percentage (2 percent) of white children were living in families headed by never-married women in 1983. Although this percentage increased by 150 percent over the time period, the percentage of white children in families headed by never-married women was still relatively small (5 percent) in 1997.
- The percentage of black children living in families headed by never-married women was much higher than the percentages for other groups throughout the time period. In 1997, for example, 31 percent of black children, compared to 12 percent of Hispanic children and 5 percent of white children, lived in families headed by never-married women.
Table TEEN 5. Percentage of all Children Living in Families Headed by Never-Married Women, 1983 to 1997
| Year | All | White | Black | Hispanic |
|---|---|---|---|---|
|
Note: Data are for all children under 18 who are not family heads. Source: U.S. Bureau of the Census, "Marital Status and Living Arrangements," Current Population Reports, Series P20-399, 418, 433, 450, 468, 484, 491, 496, and 505, various years. |
||||
| 1983 | 5.2 | 1.9 | 23.5 | 6.5 |
| 1984 | 5.2 | 1.9 | 23.9 | 6.5 |
| 1986 | 5.9 | 2.4 | 26.6 | 7.2 |
| 1988 | 7.0 | 3.0 | 30.4 | 9.2 |
| 1990 | 7.0 | 3.0 | 29.6 | 8.7 |
| 1992 | 8.4 | 3.9 | 33.1 | 10.3 |
| 1994 | 9.0 | 4.5 | 32.9 | 12.0 |
| 1995 | 8.7 | 4.3 | 32.3 | 10.8 |
| 1996 | 9.0 | 4.6 | 31.2 | 11.3 |
| 1997 | 9.3 | 5.0 | 31.4 | 11.8 |
Teen Behavior Risk Factor 6. Detached Youth
Teens who are neither in school nor working are likely to be at significant risk of dependence.
Figure TEEN 6. Percentage of Youths Ages 16 to 19 Who Were Neither in School Nor Working by Race, 1985 to 1996
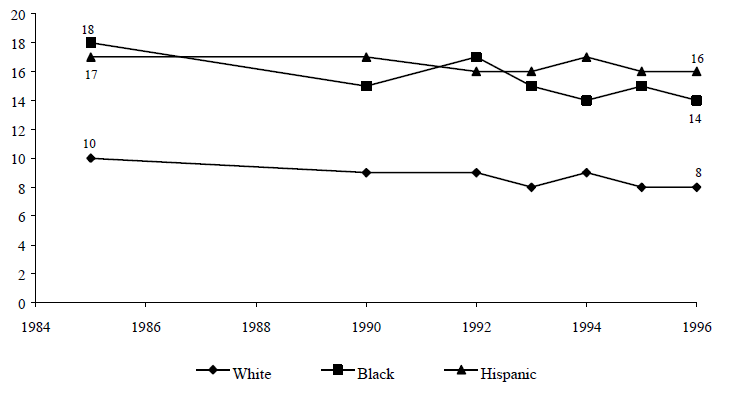
Source: Table TEEN 6.
- Black and Hispanic youths ages 16 to 19 are more likely than white youths to be neither in school nor working. In 1996, for example, Hispanic youths were twice as likely as white youths to be out of school and work, 16 percent compared to 8 percent.
- In 1975, 12 percent of all youths ages 16 to 19 were neither in school nor working, as shown in Table TEEN 6. This percentage has gradually declined since then, reaching 9percent in 1996.
- The percentage of female youths who are neither in school nor working in 1996 was higher (11 percent) than the comparable percentage (8 percent) of male youths.
Table TEEN 6. Percentage of Youths Ages 16 to 19 Who Were Neither in School Nor Working, 1975 to 1996
| 1975 | 1985 | 1990 | 1992 | 1993 | 1994 | 1995 | 1996 | |
|---|---|---|---|---|---|---|---|---|
| Source: U.S. Department of Health and Human Services, Office of the Assistant Secretary for Planning and Evaluation, Trends in the Well-Being of America’s Children and Youth: 1998. Table ES 3.6. | ||||||||
| All Youths | 12 | 11 | 10 | 10 | 9 | 10 | 9 | 9 |
| Male | 9 | 8 | 8 | 8 | 8 | 8 | 8 | |
| Female | 13 | 12 | 12 | 11 | 11 | 11 | 11 | |
| Racial Categories | ||||||||
| White | 10 | 9 | 9 | 8 | 9 | 8 | 8 | |
| Black | 18 | 15 | 17 | 15 | 14 | 15 | 14 | |
| Hispanic | 17 | 17 | 16 | 16 | 17 | 16 | 16 | |
Teen Behavior Risk Factor 7. Teen Alcohol and Substance Abuse
Teen alcohol and substance abuse are important examples of teen problem behavior and may increase the risk of dependence.
Figure TEEN 7. Percentage of Teens Ages 12 to 17 Who Used Cocaine, Marijuana, or Alcohol, 1979 to 1997
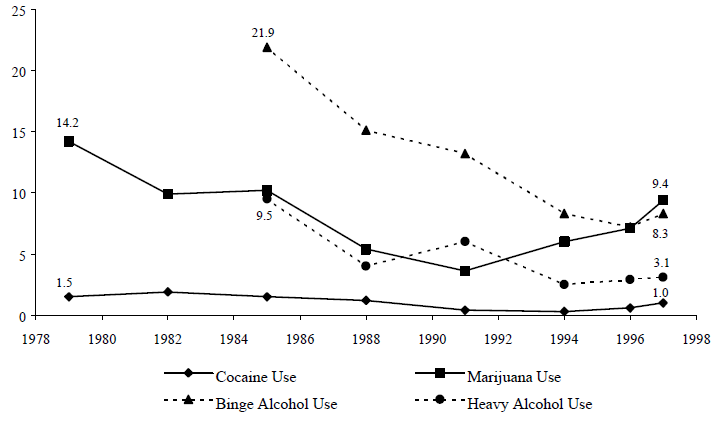
- Source: Table TEEN 7.
- Although both binge and heavy alcohol use declined among teens ages 12 to 17 throughout most of the period, the percentage of teens abusing alcohol rose slightly in 1997.
- Marijuana use among teens declined fairly continuously through the 1980s but has risen fairly sharply since, from a minimum of 4 percent in 1991 to 9 percent in 1997. It is still below the 14 percent level occurring in 1979.
- As shown in Table TEEN 7, cocaine use more than tripled between 1994 and 1997, and in 1997 was at its highest level (1 percent) since 1988.
Table TEEN 7. Percentage of Teens Ages 12 to 17 Who Used Cocaine, Marijuana, or Alcohol, 1979 to 1997
| 1979 | 1982 | 1985 | 1988 | 1991 | 1994 | 1996 | 1997 | |
|---|---|---|---|---|---|---|---|---|
|
Note: Cocaine and marijuana use is defined as use during the past month. “Binge" Alcohol Use is defined as drinking five or more drinks on the same occasion on at least one day in the past 30 days. "Occasion" means at the same time or within a couple hours of each other. Heavy Alcohol Use is defined as drinking five or more drinks on the same occasion on each of five or more days in the past 30 days; all Heavy Alcohol Users are also "Binge" Alcohol Users. Source: U.S. Department of Health and Human Services, Substance Abuse and Mental Health Services Administration National Household Survey on Drug Abuse: Preliminary Estimates, 1998. |
||||||||
| Cocaine | 1.5 | 1.9 | 1.5 | 1.2 | 0.4 | 0.3 | 0.6 | 1.0 |
| Marijuana | 14.2 | 9.9 | 10.2 | 5.4 | 3.6 | 6.0 | 7.1 | 9.4 |
| Binge Alcohol Use | NA | NA | 21.9 | 15.1 | 13.2 | 8.3 | 7.2 | 8.3 |
| Heavy Alcohol Use | NA | NA | 9.5 | 4.0 | 6.0 | 2.5 | 2.9 | 3.1 |
Teen Behavior Risk Factor 8. Teen Violent Crime Arrests
Teen crime data indicate serious adolescent problem behavior and may predict future dependence.
Figure TEEN 8. Arrest Rates for Violent Crime for Youths Ages 10 to 17, per 100,000 Youths, 1980 to 1996
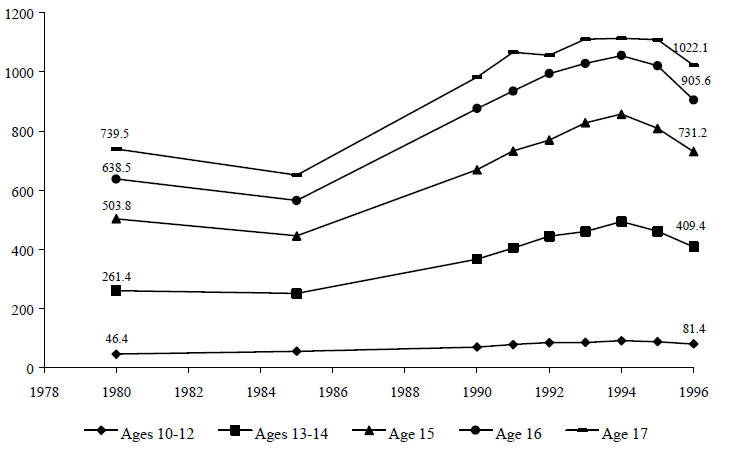
Source: Table TEEN 8.
- Arrest rates for violent crimes for all youths peaked in 1994 but have gradually been decreasing since that time.
- Historically, youths become more likely to be arrested for violent crimes as they grow older; 17 year-olds, for example, were more than twelve times as likely to be arrested than ten to twelve year-olds in 1996.
- Table TEEN 8 also shows that, as expected, violent crime arrest rates were consistently much higher among males than among females for all ages over the time period.
TEEN 8. Arrest Rates for Violent Crime for Youths Ages 10 to 17, per 100,000 Youths, 1980 to 1996
| 1980 | 1985 | 1990 | 1991 | 1992 | 1993 | 1994 | 1995 | 1996 | |
|---|---|---|---|---|---|---|---|---|---|
|
Note: Violent crime is the sum of murder, forcible rape, robbery and aggravated assault. Rates refer to the number of arrests made per 100,000 inhabitants belonging to the prescribed age group. Source: U.S. Department of Health and Human Services, Office of the Assistant Secretary for Planning and Evaluation, Trends in the Well-Being of America’s Children and Youth: 1998. Table SD 1.6. |
|||||||||
| Total | |||||||||
| Ages 10-17 | 334.1 | 303.0 | 428.6 | 461.5 | 482.9 | 505.4 | 527.8 | 511.6 | 464.7 |
| Ages 10-12 | 46.4 | 56.4 | 70.6 | 79.0 | 85.5 | 86.1 | 91.8 | 89.1 | 81.4 |
| Ages 13-14 | 261.4 | 251.9 | 368.0 | 405.4 | 444.9 | 461.4 | 494.2 | 461.7 | 409.4 |
| Age 15 | 503.8 | 446.1 | 669.7 | 732.7 | 770.0 | 828.2 | 857.5 | 809.6 | 731.2 |
| Age 16 | 638.5 | 565.9 | 876.2 | 935.2 | 994.4 | 1,028.6 | 1,055.6 | 1,021.0 | 905.6 |
| Age 17 | 739.5 | 651.1 | 982.7 | 1,066.5 | 1,056.9 | 1,110.2 | 1,113.6 | 1,109.4 | 1,022.1 |
| Male | |||||||||
| Ages 10-17 | 587.6 | 529.8 | 740.5 | 797.9 | 825.7 | 857.7 | 888.6 | 855.7 | 772.3 |
| Ages 10-12 | 81.6 | 99.5 | 119.8 | 135.1 | 145.2 | 114.8 | 153.7 | 147.4 | 133.8 |
| Ages 13-14 | 445.6 | 426.1 | 603.9 | 668.5 | 725.4 | 744.8 | 793.1 | 737.2 | 649.1 |
| Age 15 | 875.4 | 771.7 | 1,144.1 | 1,250.6 | 1,291.9 | 1,386.5 | 1,421.7 | 1,329.9 | 1,195.2 |
| Age 16 | 1,132.6 | 997.3 | 1,534.9 | 1,637.3 | 1,730.7 | 1,776.5 | 1,809.1 | 1,733.5 | 1,530.8 |
| Age 17 | 1,325.8 | 1,166.1 | 1,758.1 | 1,909.7 | 1,877.6 | 1,956.8 | 1,950.2 | 1,933.6 | 1,760.4 |
| Female | |||||||||
| Ages 10-17 | 70.2 | 66.9 | 104.0 | 111.4 | 126.0 | 138.8 | 152.2 | 153.4 | 144.6 |
| Ages 10-12 | 3.4 | 4.0 | 7.5 | 8.1 | 9.2 | 9.7 | 10.5 | 10.7 | 10.0 |
| Ages 13-14 | 47.4 | 52.7 | 77.0 | 82.8 | 95.9 | 107.9 | 121.5 | 117.0 | 107.5 |
| Age 15 | 63.4 | 55.3 | 88.5 | 93.5 | 112.4 | 118.7 | 130.6 | 134.7 | 123.3 |
| Age 16 | 129.6 | 114.6 | 187.4 | 208.9 | 219.8 | 249.9 | 265.4 | 268.0 | 257.1 |
| Age 17 | 131.0 | 114.1 | 183.9 | 189.0 | 210.6 | 224.5 | 246.8 | 250.3 | 247.5 |
Appendices
Appendix A. Program Data
The Welfare Indicators Act specifies that the annual welfare indicators reports shall include analyses of families and individuals receiving assistance under three means-tested benefit programs: the program of Aid to Families with Dependent Children (AFDC) under part A of title IV of the Social Security Act (replaced with the Temporary Assistance for Needy Families (TANF) program by the Personal Responsibility and Work Opportunity Reconciliation Act of 1996), the Food Stamp Program under the Food Stamp Act of 1997, and the Supplemental Security Income program under title XVI of the Social Security Act. This chapter includes information on the three programs, derived primarily from administrative data reported by state and federal agencies, instead of the national survey data presented in previous chapters. Discussion of each of the three individual programs is preceded, however, by an overview of several recent studies of caseload changes in the AFDC, Food Stamp, and SSI programs.
Recent Studies of Caseload Change
Historically, caseload size has served as the preeminent indicator of welfare dependence. Given the anticipated growth in state-level program variations since enactment of the PRWORA, several recent studies have looked at caseload changes among states.
A May 1997 report by the Council of Economic Advisers (CEA) attempted to determine the cause of the 20 percent decline in number of individuals receiving Aid to Families with Dependent Children from January 1993 and January 1997 by examining the impacts of three potential factors. The factors considered were economic growth, federal waivers which allowed states to experiment with innovative ways to reduce welfare dependence, and other policies affecting work-related incentives including expansions of the Earned Income Tax Credit (EITC) and increased state and federal spending on child care. The CEA attributed over 40 percent of the caseload decline to falling unemployment rates associated with economic growth. Their analysis also found that almost one-third of the decline resulted from statewide welfare reform waivers in six broad categories: termination time limits, work-requirement time limits, reduced work program exemptions, increased work program sanctions, caps on benefits to families that have additional children while on welfare, and increased earnings disregards. Other factors, which might include policies such as the EITC expansions, accounted for the remainder of the caseload decline.
Another study, done by The Lewin Group, sought to improve understanding of state-level factors behind historical growth in AFDC caseloads by analyzing the relationship between state AFDC caseload growth and the strength and structure of the state economy, demographic trends, and changes in the structure of AFDC and other public assistance programs. Separately, Rebecca Blank investigated the determinants of aggregate public assistance (principally the AFDC program) caseload changes over time, by investigating the role of macroeconomic forces, public policies and demographic change.
Methodological differences notwithstanding, all three efforts concluded that the effects of the economy on welfare caseload changes were substantial. Unemployment rates, wage levels and job growth were all determined to be important factors. These are critical findings for states as they prepare for the implications of economic recessions and recoveries under the TANF block grant. Welfare caseload reductions caused by economic factors are also the most likely to be reflected in commensurate movement along the continuum from dependence to self-sufficiency at the family level.
Several other factors were also found to influence the size of welfare caseloads, including program parameters and operating rules. Benefit levels and eligibility criteria are significant determinants of caseload levels. In recent years, many states received waivers of federal requirements in order to experiment with policies that varied widely in scope. Many policies were designed to promote work, both through incentives for recipients (such as increased earnings disregards and expanded child care) and measures designed to strengthen enforcement of work requirements. Policies that reduced the number of exemptions from work requirements, increased sanctions or required work after a limited time period in exchange for benefits were adopted in a number of states. Interestingly, some of the estimated waiver effects on caseloads occurred even before the waiver was approved or implemented.
The increased options available to state agencies in implementing the TANF program under the new welfare law highlight the role that policy forces play in effecting caseload changes. State responses to their increased flexibility to define eligibility are still evolving. It is clear, however, that these policy decisions will determine even how “cases” are defined for data reporting purposes.
Concern about an increase of one million persons participating in the Food Stamp Program between the second quarters of fiscal years 1989 and 1990, a time with no major changes in the program or the economy, prompted Congress to ask the U.S. Department of Agriculture to conduct a study detailing the specific factors and trends responsible. While the program growth was widespread, the size and timing of the participation increases varied considerably by state, with three states accounting for nearly half the increase.
The study concluded that no one factor could explain the increase, and that the importance of the three factors most responsible varied significantly from state to state. In some states, the expansions in Medicaid eligibility for pregnant women and children appeared to be a major contributor, although no clear regional pattern was evident. Increased unemployment was a key contributor in the northeast and north central states, while the changes in immigration laws, particularly the legalization of undocumented aliens (by the Immigration Reform and Control Act (IRCA) of 1986) were important in California and other southern and western states.
Aside from specific factors attributed to discrete periods of dramatic caseload changes, a number of factors are associated with changes in Food Stamp Program participation. Economic factors such as increases in unemployment, increases in the number of “working poor,” increases in food prices, and changes in the distribution of income are important, as are demographic changes such as an increase in the number of female-headed households. Other factors include changes in the number of eligible households caused by immigration legislation, changes in the Food Stamp Program itself, and changes in other public assistance programs that bring more people into the public assistance system.
Similarly, several factors have contributed to the growth of the Supplemental Security Income program. According to the General Accounting Office (GAO), three groups accounted for nearly 90 percent of the SSI program’s growth since 1991: adults with mental impairments, children and noncitizens. The GAO attributes caseload growth to several factors including: expansion in disability eligibility (particularly for mentally impaired adults and for children), increased outreach, immigration growth, and transfers from state programs.
The remainder of this chapter presents brief descriptions of the AFDC/TANF, Food Stamp and SSI programs and highlights some of the recent legislative changes that will affect program participation and expenditures over time. (Effects from some of the Food Stamp Program changes, in particular, under PRWORA are already reflected in the data.) National caseload and expenditure trend information on each of the three programs is included, as well as state-by-state trend tables on each program and information on the characteristics of participants in each program.
Aid to Families with Dependent Children (AFDC) and Temporary Assistance for Needy Families (TANF)
Aid to Families with Dependent Children (AFDC) was established by the Social Security Act of 1935 as a grant program to enable states to provide cash welfare payments for needy children who have been deprived of parental support or care because their father or mother is absent from the home, incapacitated, deceased, or unemployed. All 50 states, the District of Columbia, Guam, Puerto Rico, and the Virgin Islands operated an AFDC program. States defined “need,” set their own benefit levels, established (within federal limitations) income and resource limits, and administered the program or supervised its administration. States were entitled to unlimited federal funds for reimbursement of benefit payments, at “matching” rates which were inversely related to state per capita income. States were required to provide aid to all persons who were in classes eligible under federal law and whose income and resources were within state-set limits.
AFDC enrollments and benefit outlays have generally increased in times of economic recession and declined in times of economic growth. Both caseloads and outlays rose to all-time high levels in fiscal year 1994. That year a monthly average of 14.2 million persons (9.6 million children) in 5 million families received benefits totaling $22.8 billion. AFDC participation then fell to 12.6 million persons in fiscal year 1996.
Recent Legislative Changes. The Personal Responsibility and Work Opportunity Act of 1996 (PRWORA) eliminated the AFDC cash welfare and other related programs (AFDC administration, the Job Opportunities and Basic Skills Training (JOBS) program and the Emergency Assistance program) and created in their place a cash welfare block grant called Temporary Assistance for Needy Families (TANF). Its purpose is to increase state flexibility in providing assistance to needy families so that children can be cared for at home; end the dependence of needy parents on government benefits by promoting job preparation, work and marriage; prevent and reduce the incidence of out-of-wedlock pregnancies; and encourage the formation and maintenance of two-parent families. The implementation date for the TANF block grant was July 1, 1997, although states could, and most did, begin their block grant programs sooner.
Spending through the TANF block grant is capped and funded at $16.4 billion per year, slightly above fiscal year 1995 federal expenditures for the four component programs. Each year between 1996 and 2002, the basic block grant provides each state with the highest of recent annual funding levels it received for the four constituent programs to operate welfare programs that stress work instead of government dependence. To receive each year’s full TANF block grant, a state must spend in the previous year on behalf of TANF-eligible families a sum equal to 75 percent of state funds used in fiscal year 1994 on the replaced programs (its “historic” level of welfare expenditures). If a state fails to meet work participation rates, its required “maintenance of effort” spending rises to 80 percent. To assist in recessions or other emergencies, states that maintain 100 percent of fiscal year 1994 AFDC-related spending are eligible to receive matching grants from a $2 billion contingency fund.
The new law gives states wide latitude in developing innovative programs that will get families off welfare and into jobs. States set TANF eligibility standards and benefit levels. TANF block grant funds are guaranteed payments to states, but can be reduced if states fail to meet specified requirements such as meeting work participation requirements and ensuring that funds are spent on children and families. In addition, states are prohibited from using federal cash welfare block grant funds to: (1) provide cash or noncash TANF benefits to families in which an adult has already received assistance through the block grant for 5 years with an exemption of 20 percent of the caseload, (2) pay TANF benefits to noncitizens (including legal immigrants) arriving after the date of enactment (August 22, 1996) during their first 5 years in the United States1, and (3) pay benefits to parents who fail to participate in work or a state-designed welfare-to-work program after 24 months (or shorter at state option) of receiving cash welfare. The new law also gives states wide flexibility to combat out-of-wedlock births, which are related to increased welfare use and long-term dependence. They may deny or offer aid to two-parent families or to any group; however, if states offer TANF to unmarried teen parents they must require them to live at home or in another adult-supervised setting and attend school in order to be eligible for payments.
AFDC/TANF Program Data. The following tables and figures present a variety of data about the AFDC program:
- Tables A-1 through A-5 and Figures A-1 through A-3 present national caseload and expenditure trend data on the AFDC program. As noted above, the transition from AFDC to TANF began in some states as early as October 1996 and was completed by July 1, 1997. As a result, fiscal year 1997 data reflect some TANF program experience, although it is much too early to draw any conclusions about TANF trends;
- Figure A-4 and Table A-6 present some demographic characteristics of the AFDC caseload; and
- Tables A-7 through A-13 present some state-by-state trend data on the AFDC program, plus provisional 1997 data that reflect the phasing out of AFDC and the phasing in of TANF.
Table A-1 presents information on the average monthly number of AFDC families and recipients for each fiscal year since 1970 through Fiscal Year 1997. The U.S. caseload peaked at record highs in 1994, with an average 14.2 million recipients in over 5 million families receiving AFDC benefits each month. Since then the caseload has declined about 22 percent -- by a little over 1 million families and 3.2 million recipients. Preliminary data for the first several months of 1998 suggest that the caseload has continued to decline during the first year of TANF implementation falling as low as 8.4 million recipients in 3.0 million families in June 1998, as shown in Table A-10. (Because data on the demographic characteristics of the TANF caseload are not available, most of the other tables in this Appendix present data through June 1997). As shown on Table A-2, the average monthly benefit per recipient has continued the steady decline (in 1997 dollars) which began in 1988; recipients received an average 23 percent less in AFDC/TANF benefits (in 1997 dollars) in 1997 than in 1988.
Table A-1. Trends in AFDC/ TANF Enrollments, 1962 – 1997 1
| Average Monthly Number (In thousands) | Children as Average | ||||||
|---|---|---|---|---|---|---|---|
| Total Families 2 | Unemployed | Total | Total | of Children | |||
| Total | Families | Parent | |||||
|
1 The Personal Responsibility and Work Opportunity Reconciliation Act of 1996 repealed the AFDC program as of July 1, 1997 2 3 Based on data for the first 9 months of the fiscal year. Source: U.S. Department of Health and Human Services, Administration for Children and Families, Office of Planning, Research and Evaluation, (Available online at http://www.acf.dhhs.gov/). |
|||||||
| 1962 | 3,593 | 49 | 2,778 | 77.3 | |||
| 1963 | 3,834 | 54 | 2,896 | 75.5 | |||
| 1964 | 4,059 | 60 | 3,043 | 75.0 | |||
| 1965 | 4,323 | 69 | 3,242 | 75.0 | |||
| 1966 | 4,472 | 62 | 3,369 | 75.3 | |||
| 1967 | 4,718 | 58 | 3,561 | 75.5 | |||
| 1968 | 5,348 | 67 | 4,011 | 75.0 | |||
| 1969 | 6,147 | 66 | 4,591 | 74.7 | |||
| 1970 | 7,429 | 78 | 5,494 | 74.0 | |||
| 1971 | 9,556 | 143 | 6,963 | 72.9 | |||
| 1972 | 10,632 | 134 | 7,698 | 72.4 | |||
| 1973 | 11,038 | 120 | 7,965 | 72.2 | |||
| 1974 | 10,845 | 95 | 7,824 | 72.1 | |||
| 1975 | 11,067 | 101 | 7,928 | 71.6 | |||
| 1976 | 11,339 | 135 | 8,156 | 71.9 | |||
| 1977 | 11,108 | 149 | 7,818 | 70.4 | |||
| 1978 | 10,663 | 128 | 7,475 | 70.1 | |||
| 1979 | 10,311 | 114 | 7,193 | 69.8 | |||
| 1980 | 10,597 | 141 | 7,320 | 69.1 | |||
| 1981 | 11,160 | 209 | 7,615 | 68.2 | |||
| 1982 | 10,431 | 232 | 6,975 | 66.9 | |||
| 1983 | 10,659 | 272 | 7,051 | 66.1 | |||
| 1984 | 10,866 | 287 | 7,153 | 65.8 | |||
| 1985 | 10,813 | 261 | 7,165 | 66.3 | |||
| 1986 | 10,995 | 254 | 7,300 | 66.4 | |||
| 1987 | 11,065 | 236 | 7,381 | 66.7 | |||
| 1988 | 10,920 | 210 | 7,325 | 67.1 | |||
| 1989 | 10,935 | 193 | 7,370 | 67.4 | |||
| 1990 | 11,460 | 204 | 7,755 | 67.7 | |||
| 1991 | 12,595 | 268 | 8,515 | 67.6 | |||
| 1992 | 13,625 | 322 | 9,225 | 67.7 | |||
| 1993 | 14,143 | 359 | 9,539 | 67.6 | |||
| 1994 | 14,226 | 363 | 9,590 | 67.6 | |||
| 1995 | 13,659 | 335 | 9,275 | 67.9 | |||
| 1996 | 12,644 | 301 | 8,673 | 68.6 | |||
| 1997 | 11,015 | 275 | 1,158 3 | 3 | 70.6 | 2.0 3 | |
Figure A-1. AFDC/TANF Families Receiving Income Assistance 1
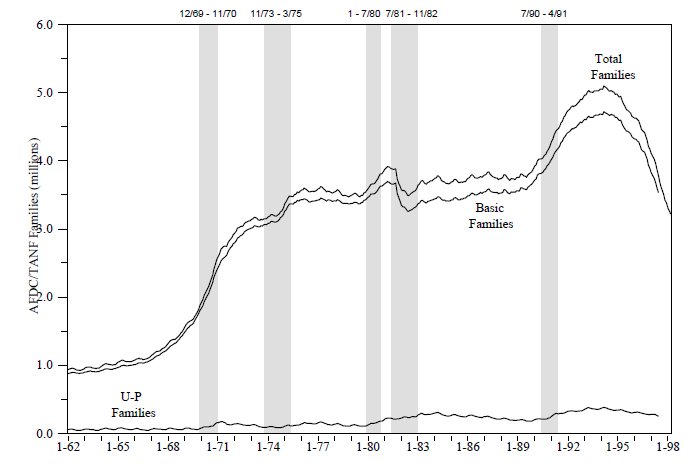
1 The Personal Responsibility and Work Opportunity Reconciliation Act of 1996 repealed the AFDC program as of July 1, 1997 and replaced it with the Temporary Assistance to Needy Families (TANF) program.
Note: Shaded areas are periods of recession. Effective July 1, 1981 families with incomes greater than 150 percent of a State's standard of need were no longer eligible for income assistance; this income cut-off was raised to 185 percent in 1984. Last data point plotted is June 1997 for U-P and Basic Families and March 1998 for Total Families.
Source: U.S. Department of Health and Human Services, Administration for Children and Families, Office of Planning, Research, and Evaluation.
Figure A-2. Average Number of Children per Family For Families with Related Children Under 18 by Living Arrangement, 1960 – 1996
(In millions)
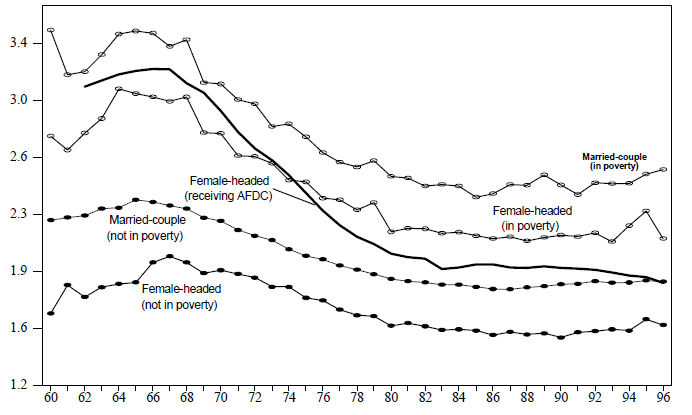
Note: For 1960-74 the average number of children per married-couple family is estimated based on all male-headed families of which during this period they comprised 98-99 percent.
Source: U.S. Department of Health and Human Services, Administration for Children and Families, Office of Family Assistance, Quarterly Public Assistance Statistics, 1992-1993 and earlier years; U.S. Bureau of the Census, “Poverty in the United States: 1996," Current Population Reports, Series P60-198 and earlier years.
Table A-2. Trends in AFDC/TANF Average Monthly Payments, 1962 – 1997 1
| Fiscal Year | Monthly Benefit per Recipient | Average Number of Persons per Family | Monthly Benefit per Family (not reduced by Child Support) |
Weighted Average2 Monthly Benefit (per 3-person Family) |
|||
|---|---|---|---|---|---|---|---|
| Current Dollars | 1997 Dollars | Current Dollars | 1997 Dollars | Current Dollars | 1997 Dollars | ||
|
1 The Personal Responsibility and Work Opportunity Reconciliation Act of 1996 repealed the AFDC program as of July 1, 1997 and replaced it with the Temporary Assistance to Needy Families (TANF) program. 2 The maximum benefit for a 3-person family in each state is weighted by that state’s share of total AFDC families. 3 Estimated based on the weighted average benefit for a 4-person family. Note: AFDC benefit amounts have not been reduced by child support collections. Constant dollar adjustments to 1997 level were made using a CPI-U-X1 fiscal year price index. Source: U.S. Department of Health and Human Services, Administration for Children and Families, Office of Family Assistance, Quarterly Public Assistance Statistics, 1992 & 1993 and earlier years along with unpublished data. |
|||||||
| 1962 | $31 | $152 | 3.9 | $121 | $593 | NA | NA |
| 1963 | 31 | 151 | 4.0 | 126 | 608 | NA | NA |
| 1964 | 32 | 152 | 4.1 | 131 | 626 | NA | NA |
| 1965 | 34 | 158 | 4.2 | 140 | 659 | NA | NA |
| 1966 | 35 | 161 | 4.2 | 146 | 670 | NA | NA |
| 1967 | 36 | 162 | 4.1 | 150 | 670 | NA | NA |
| 1968 | 40 | 171 | 4.1 | 162 | 698 | NA | NA |
| 1969 | 43 | 179 | 4.0 | 173 | 717 | 1863 | 774 |
| 1970 | 46 | 181 | 3.9 | 178 | 705 | 1943 | 769 |
| 1971 | 48 | 181 | 3.8 | 180 | 683 | 2013 | 761 |
| 1972 | 51 | 188 | 3.6 | 187 | 684 | 2053 | 751 |
| 1973 | 53 | 186 | 3.5 | 187 | 656 | 2133 | 747 |
| 1974 | 57 | 183 | 3.4 | 194 | 627 | 2293 | 740 |
| 1975 | 63 | 186 | 3.3 | 209 | 616 | 243 | 717 |
| 1976 | 71 | 195 | 3.2 | 226 | 622 | 257 | 708 |
| 1977 | 78 | 200 | 3.1 | 241 | 619 | 271 | 696 |
| 1978 | 83 | 200 | 3.0 | 249 | 603 | 284 | 685 |
| 1979 | 87 | 193 | 2.9 | 257 | 570 | 301 | 667 |
| 1980 | 94 | 187 | 2.9 | 274 | 545 | 320 | 638 |
| 1981 | 96 | 174 | 2.9 | 277 | 501 | 326 | 590 |
| 1982 | 103 | 174 | 2.9 | 300 | 508 | 331 | 560 |
| 1983 | 106 | 172 | 2.9 | 311 | 503 | 336 | 544 |
| 1984 | 110 | 171 | 2.9 | 321 | 499 | 352 | 546 |
| 1985 | 112 | 168 | 2.9 | 329 | 493 | 369 | 553 |
| 1986 | 116 | 169 | 2.9 | 339 | 495 | 383 | 560 |
| 1987 | 123 | 175 | 2.9 | 359 | 511 | 393 | 559 |
| 1988 | 127 | 174 | 2.9 | 370 | 506 | 404 | 552 |
| 1989 | 131 | 171 | 2.9 | 381 | 497 | 412 | 538 |
| 1990 | 135 | 167 | 2.9 | 389 | 483 | 421 | 523 |
| 1991 | 135 | 159 | 2.9 | 388 | 458 | 425 | 502 |
| 1992 | 136 | 156 | 2.9 | 389 | 446 | 419 | 480 |
| 1993 | 131 | 146 | 2.8 | 373 | 415 | 414 | 461 |
| 1994 | 134 | 145 | 2.8 | 376 | 408 | 420 | 451 |
| 1995 | 134 | 142 | 2.8 | 377 | 397 | 418 | 441 |
| 1996 | 135 | 138 | 2.8 | 374 | 384 | 422 | 433 |
| 1997 | 134 | 134 | 2.8 | 373 | 373 | 420 | 420 |
Figure A-3. Average Monthly AFDC Benefit By Family and Recipient in Current and Constant Dollars
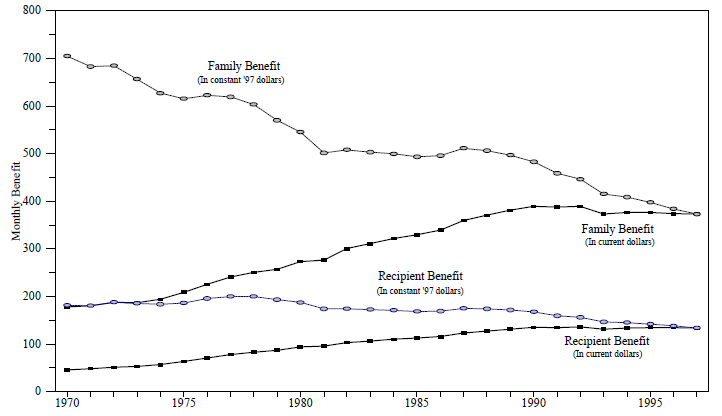
Source: U.S. Department of Health and Human Services, Administration for Children and Families, Office of Family Assistance, Quarterly Public Assistance Statistics, 1992 & 1993, and unpublished data.
Table A-3. Total, Federal, and State AFDC/TANF Expenditures, 1970 – 1997 1
[In millions of current and 1997 dollars]
| Fiscal Year | Federal Share (Current Dollars) |
State Share (Current Dollars) |
Total (Current Dollars) |
Total (Constant 97 Dollars 4) |
||||
|---|---|---|---|---|---|---|---|---|
| Benefits | Administrative | Benefits | Administrative | Benefits | Administra- tive | Benefits | Administrative | |
|
1 The Personal Responsibility and Work Opportunity Reconciliation Act of 1996 repealed the AFDC program as of July 1, 1997 and replaced it with the Temporary Assistance to Needy Families (TANF) program. Spending categories not entirely equivalent. 2 Includes expenditures for services. 3 Administrative expenditures only. 4 Constant dollar adjustments to 1997 level were made using a CPI-U-X1 fiscal year price index. 5 Provisional data, subject to change. Note: Benefits do not include emergency assistance payments and have not been reduced by child support collections. Foster care payments are included from 1971 to 1980. Beginning in fiscal year 1984, the cost of certifying AFDC households for food stamps is shown in the food stamp program’s appropriation under the U.S. Department of Agriculture. Administrative costs include: Child Care administration, Work Program, ADP, FAMIS, Fraud Control, SAVE and other State and local administrative expenditures. Source: U.S. Department of Health and Human Services, Administration for Children and Families, Office of Program Systems. |
||||||||
| 1970 | $2,187 | $572 2 | $1,895 | $309 | $4,082 | $881 2 | $16,146 | $3,485 |
| 1971 | 3,008 | 271 | 2,469 | 254 | 5,477 | 525 | 20,740 | 1,988 |
| 1972 | 3,612 | 240 3 | 2,942 | 241 | 6,554 | 481 3 | 23,966 | NA |
| 1973 | 3,865 | 313 | 3,138 | 296 | 7,003 | 610 | 24,595 | 2,142 |
| 1974 | 4,071 | 379 | 3,300 | 362 | 7,371 | 740 | 23,844 | 2,394 |
| 1975 | 4,625 | 552 | 3,787 | 529 | 8,412 | 1,082 | 24,801 | 3,190 |
| 1976 | 5,258 | 541 | 4,418 | 527 | 9,676 | 1,069 | 26,705 | 2,950 |
| 1977 | 5,626 | 595 | 4,762 | 583 | 10,388 | 1,177 | 26,688 | 3,024 |
| 1978 | 5,724 | 631 | 4,898 | 617 | 10,621 | 1,248 | 25,599 | 3,008 |
| 1979 | 5,825 | 683 | 4,954 | 668 | 10,779 | 1,350 | 23,890 | 2,992 |
| 1980 | 6,448 | 750 | 5,508 | 729 | 11,956 | 1,479 | 23,823 | 2,947 |
| 1981 | 6,928 | 835 | 5,917 | 814 | 12,845 | 1,648 | 23,273 | 2,986 |
| 1982 | 6,922 | 878 | 5,934 | 878 | 12,857 | 1,756 | 21,764 | 2,973 |
| 1983 | 7,332 | 915 | 6,275 | 915 | 13,607 | 1,830 | 22,030 | 2,963 |
| 1984 | 7,707 | 876 | 6,664 | 822 | 14,371 | 1,698 | 22,318 | 2,637 |
| 1985 | 7,817 | 890 | 6,763 | 889 | 14,580 | 1,779 | 21,856 | 2,667 |
| 1986 | 8,239 | 993 | 6,996 | 967 | 15,235 | 1,960 | 22,274 | 2,866 |
| 1987 | 8,914 | 1,081 | 7,409 | 1,052 | 16,323 | 2,133 | 23,207 | 3,033 |
| 1988 | 9,125 | 1,194 | 7,538 | 1,159 | 16,663 | 2,353 | 22,759 | 3,214 |
| 1989 | 9,433 | 1,211 | 7,807 | 1,206 | 17,240 | 2,417 | 22,471 | 3,150 |
| 1990 | 10,149 | 1,358 | 8,390 | 1,303 | 18,539 | 2,661 | 23,019 | 3,304 |
| 1991 | 11,165 | 1,373 | 9,191 | 1,300 | 20,356 | 2,673 | 24,060 | 3,159 |
| 1992 | 12,258 | 1,459 | 9,993 | 1,378 | 22,250 | 2,837 | 25,524 | 3,255 |
| 1993 | 12,270 | 1,518 | 10,016 | 1,438 | 22,286 | 2,956 | 24,817 | 3,292 |
| 1994 | 12,512 | 1,680 | 10,285 | 1,621 | 22,797 | 3,301 | 24,731 | 3,581 |
| 1995 | 12,019 | 1,770 | 10,014 | 1,751 | 22,032 | 3,521 | 23,254 | 3,717 |
| 1996 | 11,065 | 1,633 | 9,346 | 1,633 | 20,411 | 3,266 | 20,962 | 3,354 |
| 1997 5 | 9,746 | 1,286 | 7,902 | 1,128 | 17,648 | 3,234 | 17,648 | 3,234 |
Table A-4. Federal and State AFDC Benefit Payments Under the Single Parent and Unemployed Parent Programs, Fiscal Years 1970 to 1996
[In millions of current and 1996 dollars]
| Fiscal Year | (1) | (2) | (3) | (4) | (5) |
|---|---|---|---|---|---|
| Single Parent1 | Unemployed Parent | Child Support Collections2 | Net Benefits3 (1) + (2) minus (3) | Net Benefits (1996 dollars)4 |
|
|
1 Includes payments to two-parent families where one adult is incapacitated. 2 Total AFDC collections (including collections on behalf of foster care children) less payments to AFDC families. 3 Net AFDC benefits--Gross benefits less those reimbursed by child support collections. 4 Constant dollar adjustments to 1996 level were made using a CPI-U-XI fiscal year price index. Source: U.S. Department of Health and Human Services, Administration for Children and Families, Office of Financial Management. |
|||||
| 1970 | 3,851 | 231 | 0 | 4,082 | 15,722 |
| 1971 | 4,993 | 412 | 0 | 5,405 | 19,882 |
| 1972 | 5,972 | 422 | 0 | 6,394 | 22,715 |
| 1973 | 6,459 | 414 | 0 | 6,873 | 22,504 |
| 1974 | 6,881 | 324 | 0 | 7,205 | 22,740 |
| 1975 | 7,791 | 362 | 0 | 8,153 | 23,363 |
| 1976 | 8,825 | 525 | 245 | 9,105 | 24,469 |
| 1977 | 9,420 | 617 | 395 | 9,642 | 24,121 |
| 1978 | 9,624 | 565 | 459 | 9,730 | 22,870 |
| 1979 | 9,865 | 522 | 584 | 9,803 | 21,156 |
| 1980 | 10,847 | 693 | 593 | 10,947 | 21,186 |
| 1981 | 11,769 | 1,075 | 659 | 12,185 | 21,472 |
| 1982 | 11,601 | 1,256 | 771 | 12,086 | 19,879 |
| 1983 | 12,136 | 1,471 | 865 | 12,742 | 20,128 |
| 1984 | 12,759 | 1,612 | 983 | 13,388 | 20,264 |
| 1985 | 13,024 | 1,556 | 901 | 13,679 | 19,967 |
| 1986 | 13,672 | 1,563 | 951 | 14,284 | 20,335 |
| 1987 | 14,807 | 1,516 | 1,070 | 15,252 | 21,115 |
| 1988 | 15,243 | 1,420 | 1,196 | 15,466 | 20,569 |
| 1989 | 15,889 | 1,350 | 1,286 | 15,952 | 20,246 |
| 1990 | 17,059 | 1,480 | 1,416 | 17,123 | 20,702 |
| 1991 | 18,529 | 1,827 | 1,603 | 18,753 | 21,583 |
| 1992 | 20,130 | 2,121 | 1,824 | 20,426 | 22,816 |
| 1993 | 19,988 | 2,298 | 1,971 | 20,315 | 22,028 |
| 1994 | 20,393 | 2,404 | 2,093 | 20,704 | 21,871 |
| 1995 | 19,820 | 2,212 | 2,215 | 19,817 | 20,367 |
| 1996 | 18,438 | 1,973 | 2,374 | 18,037 | 18,037 |
Table A-5. Number of AFDC/TANF Recipients, and Recipients as a Percentage of Various Population Groups, 1970 – 1997
| Calender Year | Total AFDC Recipients in the States & DC (in thousands) |
AFDC Child Recipients in the States & DC (in thousands) |
AFDC Recipients as a Percent of Total Population1 | AFDC Recipients as a Percent of Poverty Population2 | AFDC Recipients as a Percent of Pretransfer Poverty Population3 | AFDC Child Recipients as a Percent of Total Child Population1 | AFDC Child Recipients as a Percent of Children in Poverty2 |
|---|---|---|---|---|---|---|---|
|
1 Population numbers used as denominators are resident population. See Current Population Reports, Series P25-1106. 2 For poverty population data see Current Population Reports, Series P60-201. 3 The pretransfer poverty population used as denominator is the number of all persons in families with related children under 18 years of age whose income (cash income plus social insurance plus Social Security but before taxes and means-tested transfers) falls below the appropriate poverty threshold. See Appendix J, Table 20, 1992 Green Book; data for subsequent years are unpublished Congressional Budget Office tabulations. 4 Average for January through June of 1997. Source: U.S. Department of Health and Human Services, Administration for Children and Families, Office of Family Assistance and U.S. Bureau of the Census, “Poverty in the United States: 1996," Current Population Reports, Series P60-201 and earlier years, (Available online at http://www.census.gov/hhes/www/poverty.html). |
|||||||
| 1970 | 8,303 | 6,104 | 4.1 | 32.7 | NA | 8.8 | 58.5 |
| 1971 | 10,043 | 7,303 | 4.9 | 39.3 | NA | 10.5 | 69.2 |
| 1972 | 10,736 | 7,766 | 5.1 | 43.9 | NA | 11.2 | 75.5 |
| 1973 | 10,738 | 7,763 | 5.1 | 46.7 | NA | 11.3 | 80.5 |
| 1974 | 10,621 | 7,637 | 5.0 | 45.4 | NA | 11.3 | 75.2 |
| 1975 | 11,131 | 7,928 | 5.2 | 43.0 | NA | 11.8 | 71.4 |
| 1976 | 11,098 | 7,850 | 5.1 | 44.4 | NA | 11.8 | 76.4 |
| 1977 | 10,856 | 7,632 | 4.9 | 43.9 | NA | 11.7 | 74.2 |
| 1978 | 10,387 | 7,270 | 4.7 | 42.4 | NA | 11.2 | 73.2 |
| 1979 | 10,140 | 7,057 | 4.5 | 38.9 | 53.1 | 11.0 | 68.0 |
| 1980 | 10,599 | 7,295 | 4.7 | 36.2 | 49.2 | 11.4 | 63.2 |
| 1981 | 10,893 | 7,397 | 4.7 | 34.2 | 47.1 | 11.7 | 59.2 |
| 1982 | 10,161 | 6,767 | 4.4 | 29.5 | 40.6 | 10.8 | 49.6 |
| 1983 | 10,569 | 6,967 | 4.5 | 29.9 | 41.9 | 11.1 | 50.1 |
| 1984 | 10,644 | 7,017 | 4.5 | 31.6 | 43.6 | 11.2 | 52.3 |
| 1985 | 10,672 | 7,073 | 4.5 | 32.3 | 45.0 | 11.3 | 54.4 |
| 1986 | 10,851 | 7,206 | 4.5 | 33.5 | 46.6 | 11.5 | 56.0 |
| 1987 | 10,842 | 7,240 | 4.5 | 33.6 | 46.7 | 11.5 | 55.9 |
| 1988 | 10,728 | 7,201 | 4.4 | 33.8 | 47.7 | 11.4 | 57.8 |
| 1989 | 10,799 | 7,286 | 4.4 | 34.3 | 47.6 | 11.5 | 57.9 |
| 1990 | 11,497 | 7,781 | 4.6 | 34.2 | 47.1 | 12.1 | 57.9 |
| 1991 | 12,728 | 8,601 | 5.0 | 35.6 | 49.1 | 13.2 | 60.0 |
| 1992 | 13,571 | 9,183 | 5.3 | 35.7 | 50.8 | 13.9 | 60.1 |
| 1993 | 14,007 | 9,439 | 5.4 | 35.7 | 48.5 | 14.1 | 60.2 |
| 1994 | 13,976 | 9,440 | 5.4 | 36.7 | 50.0 | 13.9 | 61.8 |
| 1995 | 13,240 | 9,009 | 5.0 | 36.3 | 50.1 | 13.1 | 61.5 |
| 1996 | 12,150 | 8,355 | 4.6 | 33.3 | 46.4 | 12.1 | 57.8 |
| 1997 | 10,236 | 7,340 4 | 3.8 | 28.8 | NA | 10.6 | 52.0 |
Figure A-4. Characteristics of AFDC Families
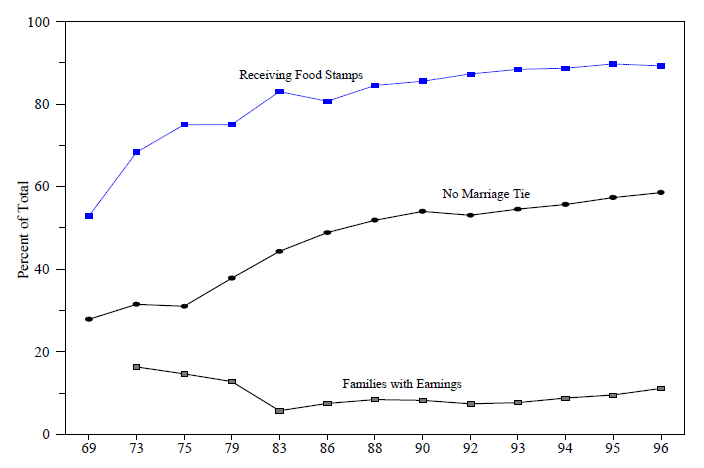
Source: U.S. Department of Health and Human Services, Administration for Children and Families, Characteristics and Financial Circumstances of AFDC Recipients: Fiscal Year 1996 and earlier years, (Current data available online at http://www.acf.dhhs.gov/programs/ofa/content.htm).
Table A-6. AFDC Characteristics, 1969 – 1996
| May 1969 | May 1975 | March 1979 | Fiscal year1 | |||||||
|---|---|---|---|---|---|---|---|---|---|---|
| 1983 | 1988 | 1990 | 1992 | 1994 | 1995 | 19965 | ||||
|
1 Percentages are based on the average monthly caseload during the year. Hawaii and the territories are not included in 1983. Data after 1986 include the territories and Hawaii. 2 Calculated on the basis of total number of families. 3 For years after 1983, data are for adult female recipients. 4 States began collecting child support directly in 1975, removing one source of non-AFDC income. 5 Preliminary data. Source: U.S. Department of Health and Human Services, Administration for Children and Families, Office of Family Assistance, Characteristics and Financial Circumstances of AFDC Recipients: Fiscal Year 1996 and earlier years, (Current data available online at http://www.acf.dhhs.gov/programs/ofa/content.htm). |
||||||||||
| Average Family Size (persons) | 4.0 | 3.2 | 3.0 | 3.0 | 3.0 | 2.9 | 2.9 | 2.8 | 2.8 | 2.8 |
| Number of Child Recipients (percent of AFDC Cases): | ||||||||||
| One | 26.6 | 37.9 | 42.3 | 43.4 | 42.5 | 42.2 | 42.5 | 42.6 | 43.2 | 43.9 |
| Two | 23.0 | 26.0 | 28.1 | 29.8 | 30.2 | 30.3 | 30.2 | 30.0 | 30.4 | 29.9 |
| Three | 17.7 | 16.1 | 15.6 | 15.2 | 15.8 | 15.8 | 15.5 | 15.6 | 15.5 | 15.0 |
| Four or More | 32.5 | 20.0 | 13.9 | 10.1 | 9.9 | 9.9 | 10.1 | 9.6 | 9.6 | 9.2 |
| Unknown | NA | NA | NA | 1.5 | 1.7 | 1.4 | 0.7 | 1.5 | 1.3 | 1.3 |
| Basis for Eligibility (percent children): | ||||||||||
| Parents Present: | ||||||||||
| Incapacitated | 11.72 | 7.7 | 5.3 | 3.4 | 3.7 | 3.6 | 4.1 | 3.9 | 4.3 | 4.3 |
| Unemployed | 4.62 | 3.7 | 4.1 | 8.7 | 6.5 | 6.4 | 8.2 | 8.7 | 7.8 | 8.3 |
| Parents Absent: | ||||||||||
| Death | 5.52 | 3.7 | 2.2 | 1.8 | 1.8 | 1.6 | 1.6 | 1.7 | 1.8 | 1.6 |
| Divorce or Separation | 43.32 | 48.3 | 44.7 | 38.5 | 34.6 | 32.9 | 30.0 | 26.5 | 25.4 | 24.3 |
| No Marriage Tie | 27.92 | 31.0 | 37.8 | 44.3 | 51.9 | 54.0 | 53.1 | 55.7 | 57.4 | 58.6 |
| Other Reason | 3.52 | 4.0 | 5.9 | 1.4 | 1.6 | 1.9 | 2.0 | 2.6 | 2.5 | 2.4 |
| Unknown | NA | NA | NA | 1.7 | NA | NA | 0.9 | 1.0 | 0.8 | 0.6 |
| Mother's Employment Status (percent mothers):3 | ||||||||||
| Full-Time Job | 8.2 | 10.4 | 8.7 | 1.5 | 2.2 | 2.5 | 2.2 | 3.2 | 3.7 | 4.7 |
| Part-Time Job | 6.3 | 5.7 | 5.4 | 3.4 | 4.2 | 4.2 | 4.2 | 4.5 | 5.1 | 5.4 |
| Presence of Income (percent families): | ||||||||||
| With Earnings | NA | 14.6 | 12.8 | 5.7 | 8.4 | 8.2 | 7.4 | 8.7 | 9.5 | 11.1 |
| No Non-AFDC Income | 56.0 | 71.1 | 80.64 | 86.84 | 79.64 | 80.14 | 78.94 | 78.0 | 77.3 | 76.0 |
| Median Months on AFDC | ||||||||||
| Since Most Recent Opening | 23.0 | 31.0 | 29.0 | 26.0 | 26.3 | 23.0 | 22.5 | 21.5 | 23.2 | 23.6 |
| Proportion of Households (percent families): | ||||||||||
| Living in Public Housing | 12.8 | 14.6 | NA | 10.0 | 9.6 | 9.6 | 9.2 | 8.3 | 8.0 | 8.8 |
| Participating in Food Stamp Or Donated Food Program | 52.9 | 75.1 | 75.1 | 83.0 | 84.6 | 85.6 | 87.3 | 88.7 | 89.8 | 89.3 |
| Incld. Non-Recipient Members | 33.1 | 34.8 | NA | 36.9 | 36.8 | 37.7 | 38.9 | 46.4 | 48.3 | 49.9 |
Table A-7. AFDC/TANF Assistance by State, Selected Fiscal Years 1978 – 1997
[Millions of dollars]
| 1978 | 1982 | 1986 | 1988 | 1992 | 1994 | 1996 | 19971 | |
|---|---|---|---|---|---|---|---|---|
| United States | $10,621 | $12,857 | $15,235 | $16,663 | $22,251 | $22,797 | $20,411 | $17,648 |
|
1 Provisional. Source: U.S. Department of Health and Human Services, Administration for Children and Families, Office of Program Support, Office of Management Services, unpublished data from the ACF-196 TANF Report and ACF-231 AFDC Line by Line Report. |
||||||||
| Alabama | $78 | $72 | $68 | $62 | $85 | $92 | $75 | $64 |
| Alaska | 17 | 32 | 46 | 54 | 96 | 113 | 107 | 99 |
| Arizona | 30 | 49 | 79 | 103 | 243 | 266 | 228 | 187 |
| Arkansas | 51 | 34 | 48 | 53 | 61 | 57 | 52 | 48 |
| California | 1,813 | 2,734 | 3,574 | 4,091 | 5,828 | 6,088 | 5,908 | 5,036 |
| Colorado | 74 | 87 | 107 | 125 | 163 | 158 | 129 | 108 |
| Connecticut | 169 | 210 | 223 | 218 | 377 | 397 | 323 | 321 |
| Delaware | 28 | 28 | 25 | 24 | 37 | 40 | 35 | 31 |
| Dist. of Columbia | 91 | 86 | 77 | 76 | 102 | 126 | 121 | 105 |
| Florida | 145 | 207 | 261 | 318 | 733 | 806 | 680 | 544 |
| Georgia | 103 | 172 | 223 | 266 | 420 | 428 | 385 | 316 |
| Guam | 3 | 4 | 4 | 3 | 8 | 12 | 14 | 11 |
| Hawaii | 83 | 88 | 73 | 77 | 125 | 163 | 173 | 163 |
| Idaho | 21 | 20 | 19 | 19 | 24 | 30 | 30 | 20 |
| Illinois | 700 | 802 | 886 | 815 | 883 | 914 | 833 | 707 |
| Indiana | 118 | 139 | 148 | 167 | 218 | 228 | 154 | 126 |
| Iowa | 107 | 127 | 170 | 155 | 164 | 169 | 131 | 120 |
| Kansas | 73 | 81 | 91 | 97 | 119 | 123 | 98 | 112 |
| Kentucky | 122 | 123 | 104 | 143 | 213 | 198 | 191 | 181 |
| Louisiana | 97 | 127 | 162 | 182 | 182 | 168 | 130 | 117 |
| Maine | 51 | 59 | 84 | 80 | 118 | 108 | 99 | 90 |
| Maryland | 166 | 213 | 250 | 250 | 333 | 314 | 285 | 232 |
| Massachusetts | 476 | 468 | 471 | 558 | 751 | 730 | 560 | 472 |
| Michigan | 780 | 1,064 | 1,248 | 1,231 | 1,162 | 1,132 | 779 | 754 |
| Minnesota | 165 | 235 | 322 | 338 | 387 | 379 | 333 | 228 |
| Mississippi | 33 | 55 | 74 | 85 | 89 | 82 | 68 | 60 |
| Missouri | 152 | 176 | 209 | 215 | 274 | 287 | 254 | 219 |
| Montana | 15 | 19 | 37 | 41 | 46 | 49 | 46 | 43 |
| Nebraska | 38 | 49 | 62 | 56 | 65 | 62 | 54 | 49 |
| Nevada | 8 | 12 | 16 | 20 | 41 | 48 | 48 | 40 |
| New Hampshire | 21 | 25 | 20 | 21 | 54 | 62 | 50 | 44 |
| New Jersey | 489 | 513 | 509 | 459 | 527 | 531 | 463 | 426 |
| New Mexico | 32 | 45 | 51 | 56 | 106 | 144 | 153 | 131 |
| New York | 1,689 | 1,641 | 2,099 | 2,140 | 2,944 | 2,913 | 2,929 | 2,657 |
| North Carolina | 138 | 143 | 138 | 206 | 335 | 353 | 300 | 270 |
| North Dakota | 14 | 14 | 20 | 22 | 28 | 26 | 21 | 19 |
| Ohio | 441 | 606 | 804 | 805 | 984 | 1,016 | 763 | 697 |
| Oklahoma | 74 | 74 | 100 | 119 | 169 | 165 | 122 | 94 |
| Oregon | 148 | 100 | 120 | 128 | 200 | 197 | 155 | 175 |
| Pennsylvania | 726 | 740 | 389 | 747 | 906 | 935 | 822 | 702 |
| Puerto Rico | 25 | 65 | 33 | 67 | 75 | 74 | 63 | 45 |
| Rhode Island | 59 | 70 | 79 | 82 | 128 | 136 | 125 | 118 |
| South Carolina | 52 | 76 | 103 | 91 | 119 | 115 | 101 | 72 |
| South Dakota | 18 | 17 | 15 | 21 | 25 | 25 | 22 | 18 |
| Tennessee | 77 | 74 | 100 | 125 | 206 | 215 | 190 | 130 |
| Texas | 122 | 118 | 281 | 344 | 517 | 544 | 496 | 365 |
| Utah | 41 | 47 | 55 | 61 | 76 | 77 | 64 | 58 |
| Vermont | 21 | 38 | 40 | 40 | 67 | 65 | 56 | 53 |
| Virgin Islands | 2 | 3 | 2 | 2 | 4 | 4 | 4 | 3 |
| Virginia | 136 | 166 | 179 | 169 | 225 | 253 | 199 | 161 |
| Washington | 175 | 240 | 375 | 401 | 606 | 610 | 585 | 499 |
| West Virginia | 53 | 56 | 109 | 107 | 120 | 126 | 102 | 89 |
| Wisconsin | 260 | 407 | 444 | 506 | 453 | 425 | 291 | 206 |
| Wyoming | 6 | 9 | 16 | 19 | 27 | 21 | 17 | 12 |
Table A-8. Comparison of Federal Funding for AFDC and Related Programs and Family Assistance Grants Under PRWORA
[In millions]
| State | FY 1996 Grants for AFDC, EA & JOBS1 | FY 1997 State Family Assistance Grant2 | Increase from FY 1996 Level | Percent Increase from FY 1996 Level |
|---|---|---|---|---|
| United States | $14,931 | $16,489 | $1,558 | 10.4 |
|
1 Excludes IV-A child care. AFDC benefits include the Federal share of child support collections to be comparable to the Family LAssistance Grant; 1996 expenditures as reported through February 25, 1997. 2 Does not include additional funds authorized under P.L. 104-327. Source: U.S. Department of Health and Human Services, Administration for Children and Families, Office of Legislative Affairs and Budget. |
||||
| Alabama | $75.9 | $93.3 | $17.4 | 22.9 |
| Alaska | 58.7 | 63.6 | 4.9 | 8.4 |
| Arizona | 197.8 | 222.4 | 24.7 | 12.5 |
| Arkansas | 51.9 | 56.7 | 4.9 | 9.4 |
| California | 3,622.8 | 3,733.8 | 111.1 | 3.1 |
| Colorado | 158.3 | 136.1 | -22.3 | -14.1 |
| Connecticut | 215.3 | 266.8 | 51.5 | 23.9 |
| Delaware | 35.2 | 32.3 | -2.9 | -8.2 |
| Dist of Columbia | 70.8 | 92.6 | 21.8 | 30.8 |
| Florida | 497.5 | 562.3 | 64.8 | 13.0 |
| Georgia | 288.4 | 330.7 | 42.3 | 14.7 |
| Hawaii | 97.9 | 98.9 | 1.0 | 1.0 |
| Idaho | 31.3 | 31.9 | 0.6 | 2.0 |
| Illinois | 601.1 | 585.1 | -16.0 | -2.7 |
| Indiana | 133.1 | 206.8 | 73.7 | 55.3 |
| Iowa | 128.9 | 131.5 | 2.7 | 2.1 |
| Kansas | 89.8 | 101.9 | 12.2 | 13.6 |
| Kentucky | 157.2 | 181.3 | 24.0 | 15.3 |
| Louisiana | 114.3 | 164.0 | 49.7 | 43.5 |
| Maine | 74.8 | 78.1 | 3.3 | 4.5 |
| Maryland | 214.3 | 229.1 | 14.8 | 6.9 |
| Massachusetts | 353.1 | 459.4 | 106.3 | 30.1 |
| Michigan | 632.2 | 775.4 | 143.1 | 22.6 |
| Minnesota | 220.8 | 268.0 | 47.1 | 21.3 |
| Mississippi | 70.3 | 86.8 | 16.4 | 23.4 |
| Missouri | 195.4 | 217.1 | 21.7 | 11.1 |
| Montana | 40.4 | 45.5 | 5.1 | 12.7 |
| Nebraska | 56.0 | 58.0 | 2.0 | 3.6 |
| Nevada | 41.4 | 44.0 | 2.6 | 6.3 |
| New Hampshire | 34.7 | 38.5 | 3.8 | 11.1 |
| New Jersey | 383.2 | 404.0 | 20.9 | 5.4 |
| New Mexico | 132.1 | 126.1 | -6.0 | -4.6 |
| New York | 2,160.7 | 2,442.9 | 282.3 | 13.1 |
| North Carolina | 312.6 | 302.2 | -10.4 | -3.3 |
| North Dakota | 25.7 | 26.4 | 0.7 | 2.9 |
| Ohio | 543.7 | 728.0 | 184.3 | 33.9 |
| Oklahoma | 118.2 | 148.0 | 29.8 | 25.2 |
| Oregon | 142.0 | 167.9 | 25.9 | 18.2 |
| Pennsylvania | 770.1 | 719.5 | -50.6 | -6.6 |
| Rhode Island | 89.5 | 95.0 | 5.5 | 6.2 |
| South Carolina | 94.4 | 100.0 | 5.6 | 5.9 |
| South Dakota | 20.2 | 21.9 | 1.7 | 8.2 |
| Tennessee | 137.4 | 191.5 | 54.1 | 39.3 |
| Texas | 419.0 | 486.3 | 67.2 | 16.0 |
| Utah | 64.7 | 76.8 | 12.1 | 18.8 |
| Vermont | 42.4 | 47.4 | 5.0 | 11.7 |
| Virginia | 121.4 | 158.3 | 36.9 | 30.4 |
| Washington | 415.4 | 404.3 | -11.1 | -2.7 |
| West Virginia | 87.7 | 110.2 | 22.5 | 25.7 |
| Wisconsin | 276.4 | 318.2 | 41.8 | 15.1 |
| Wyoming | 15.0 | 21.8 | 6.8 | 45.5 |
Table A-9. Average Monthly AFDC Recipients by State, Selected Fiscal Years 1977 – 1997
[In thousands]
| 1977 | 1981 | 1985 | 1989 | 1992 | 1994 | 1996 | 1997 | Percent Change | ||
|---|---|---|---|---|---|---|---|---|---|---|
| 1989-93 | 1993-97 | |||||||||
| United States | 11,130 | 11,160 | 10,813 | 10,934 | 13,625 | 14,226 | 12,644 | 10,941 | 29.3 | -22.6 |
| Source: U.S. Department of Health and Human Services, Administration for Children and Families, Office of Planning, Research and Evaluation, Time Trends, FY 1984-1995, and unpublished data. | ||||||||||
| Alabama | 169 | 171 | 151 | 129 | 142 | 132 | 105 | 86 | 8.3 | -38.6 |
| Alaska | 11 | 16 | 16 | 19 | 32 | 38 | 36 | 35 | 87.3 | -2.8 |
| Arizona | 58 | 62 | 72 | 105 | 181 | 201 | 172 | 147 | 86.5 | -25.0 |
| Arkansas | 95 | 84 | 64 | 70 | 75 | 69 | 58 | 53 | 4.4 | -26.9 |
| California | 1,434 | 1,523 | 1,619 | 1,763 | 2,307 | 2,639 | 2,626 | 2,404 | 39.7 | -2.4 |
| Colorado | 92 | 82 | 79 | 97 | 122 | 119 | 99 | 80 | 26.6 | -35.4 |
| Connecticut | 135 | 142 | 122 | 106 | 157 | 166 | 162 | 154 | 52.1 | -4.4 |
| Delaware | 31 | 33 | 24 | 19 | 26 | 27 | 23 | 22 | 44.2 | -20.2 |
| Dist. of Columbia | 96 | 81 | 58 | 48 | 60 | 74 | 70 | 66 | 39.4 | -0.7 |
| Florida | 242 | 277 | 271 | 327 | 601 | 669 | 561 | 451 | 112.5 | -35.0 |
| Georgia | 248 | 236 | 239 | 266 | 388 | 393 | 353 | 282 | 49.8 | -29.2 |
| Guam | 4 | 6 | 6 | 4 | 5 | 7 | 8 | 8 | 33.6 | 42.5 |
| Hawaii | 56 | 62 | 51 | 43 | 50 | 62 | 67 | 71 | 30.6 | 27.2 |
| Idaho | 20 | 20 | 17 | 17 | 20 | 23 | 23 | 16 | 26.6 | -24.4 |
| Illinois | 771 | 709 | 735 | 632 | 688 | 712 | 655 | 580 | 9.0 | -15.8 |
| Indiana | 165 | 172 | 165 | 147 | 199 | 216 | 148 | 122 | 43.0 | -42.0 |
| Iowa | 95 | 110 | 123 | 98 | 103 | 110 | 89 | 78 | 3.6 | -22.6 |
| Kansas | 76 | 74 | 67 | 74 | 85 | 87 | 68 | 54 | 19.2 | -39.0 |
| Kentucky | 202 | 175 | 160 | 156 | 229 | 208 | 175 | 158 | 44.4 | -29.8 |
| Louisiana | 218 | 216 | 230 | 277 | 274 | 248 | 236 | 187 | -5.0 | -28.6 |
| Maine | 60 | 57 | 57 | 51 | 68 | 64 | 56 | 49 | 32.8 | -26.8 |
| Maryland | 213 | 221 | 195 | 176 | 221 | 222 | 204 | 163 | 25.6 | -26.3 |
| Massachusetts | 373 | 344 | 235 | 242 | 310 | 307 | 237 | 207 | 34.6 | -36.3 |
| Michigan | 651 | 759 | 691 | 640 | 674 | 666 | 527 | 449 | 7.5 | -34.8 |
| Minnesota | 131 | 149 | 152 | 164 | 192 | 187 | 171 | 157 | 17.1 | -18.1 |
| Mississippi | 174 | 176 | 155 | 179 | 177 | 159 | 129 | 102 | -4.0 | -40.3 |
| Missouri | 265 | 215 | 197 | 203 | 251 | 263 | 232 | 197 | 28.7 | -24.7 |
| Montana | 18 | 20 | 22 | 28 | 32 | 35 | 31 | 27 | 24.9 | -22.4 |
| Nebraska | 34 | 39 | 44 | 41 | 48 | 45 | 39 | 37 | 17.6 | -23.6 |
| Nevada | 12 | 14 | 14 | 20 | 32 | 38 | 38 | 29 | 74.9 | -16.3 |
| New Hampshire | 25 | 24 | 14 | 13 | 28 | 30 | 24 | 20 | 131.9 | -33.1 |
| New Jersey | 449 | 469 | 367 | 298 | 353 | 335 | 288 | 251 | 17.3 | -28.2 |
| New Mexico | 55 | 56 | 51 | 59 | 88 | 102 | 101 | 81 | 62.6 | -14.6 |
| New York | 1,247 | 1,108 | 1,112 | 979 | 1,117 | 1,255 | 1,184 | 1,048 | 22.2 | -12.4 |
| North Carolina | 200 | 201 | 166 | 200 | 313 | 333 | 278 | 243 | 67.1 | -27.3 |
| North Dakota | 14 | 13 | 12 | 15 | 18 | 16 | 13 | 11 | 21.1 | -38.4 |
| Ohio | 563 | 590 | 673 | 629 | 749 | 685 | 546 | 494 | 14.2 | -31.3 |
| Oklahoma | 89 | 91 | 82 | 103 | 135 | 131 | 105 | 82 | 34.0 | -40.7 |
| Oregon | 122 | 92 | 74 | 87 | 116 | 114 | 87 | 62 | 34.8 | -46.9 |
| Pennsylvania | 655 | 643 | 561 | 523 | 594 | 620 | 544 | 461 | 16.3 | -24.2 |
| Puerto Rico | 188 | 172 | 173 | 185 | 194 | 183 | 155 | 144 | 2.6 | -24.4 |
| Rhode Island | 53 | 55 | 44 | 42 | 59 | 63 | 58 | 55 | 47.3 | -11.7 |
| South Carolina | 140 | 157 | 120 | 107 | 140 | 140 | 119 | 90 | 36.4 | -38.8 |
| South Dakota | 24 | 19 | 16 | 19 | 20 | 19 | 16 | 13 | 6.2 | -33.2 |
| Tennessee | 188 | 174 | 155 | 195 | 266 | 300 | 260 | 184 | 59.0 | -40.7 |
| Texas | 315 | 325 | 363 | 540 | 758 | 788 | 684 | 574 | 44.8 | -26.6 |
| Utah | 37 | 42 | 38 | 44 | 52 | 50 | 40 | 34 | 20.6 | -35.6 |
| Vermont | 22 | 25 | 22 | 20 | 29 | 28 | 25 | 23 | 44.7 | -19.3 |
| Virgin Islands | 4 | 4 | 4 | 3 | 4 | 4 | 5 | 5 | 11.1 | 20.3 |
| Virginia | 173 | 175 | 154 | 146 | 188 | 195 | 162 | 130 | 33.4 | -33.1 |
| Washington | 143 | 155 | 178 | 219 | 273 | 292 | 274 | 254 | 31.4 | -11.8 |
| West Virginia | 64 | 81 | 106 | 109 | 119 | 114 | 95 | 82 | 8.9 | -31.2 |
| Wisconsin | 201 | 241 | 288 | 245 | 244 | 226 | 170 | 120 | -3.3 | -49.4 |
| Wyoming | 7 | 7 | 10 | 14 | 19 | 16 | 13 | 7 | 32.8 | -59.9 |
Table A-10. AFDC Caseload by State, October 1989 to June 1998 Peak
[In thousands]
| State | Peak Caseload Oct ‘89 to June ‘98 | Date Peak Occurred Oct ’89 to June ‘98 | June ‘97 Caseload | June ‘98 Caseload | Percent Decline1 From June ‘97 | Percent Decline From Peak |
|---|---|---|---|---|---|---|
| Alabama | 52.3 | Mar-93 | 32.0 | 22.7 | 29.3 | 56.7 |
| Alaska | 13.4 | Apr-94 | 12.0 | 10.1 | 16.2 | 24.5 |
| Arizona | 72.8 | Dec-93 | 52.5 | 37.0 | 29.5 | 49.1 |
| Arkansas | 27.1 | Mar-92 | 20.7 | 12.9 | 37.6 | 52.5 |
| California | 933.1 | Mar-95 | 789.9 | 689.4 | 12.7 | 26.1 |
| Colorado | 43.7 | Dec-93 | 28.7 | 19.8 | 30.8 | 54.7 |
| Connecticut | 61.9 | Mar-95 | 55.5 | 41.0 | 26.1 | 33.8 |
| Delaware | 11.8 | Apr-94 | 9.5 | 6.7 | 28.7 | 42.9 |
| Dist. of Columbia | 27.5 | Apr-94 | 23.7 | 20.5 | 13.6 | 25.5 |
| Florida | 259.9 | Nov-92 | 160.6 | 98.7 | 38.5 | 62.0 |
| Georgia | 142.8 | Nov-93 | 98.2 | 69.8 | 28.9 | 51.1 |
| Guam | 2.6 | Sep-97 | 2.2 | 1.9 | 12.5 | 25.2 |
| Hawaii | 23.6 | Jan-98 | 23.4 | 23.6 | -0.9 | 0.0 |
| Idaho | 9.5 | Mar-95 | 6.7 | 1.8 | 72.7 | 80.7 |
| Illinois | 243.1 | Aug-94 | 191.6 | 164.2 | 14.3 | 32.5 |
| Indiana | 76.1 | Sep-93 | 42.4 | 38.5 | 9.1 | 49.3 |
| Iowa | 40.7 | Apr-94 | 28.4 | 24.2 | 14.8 | 40.6 |
| Kansas | 30.8 | Aug-93 | 18.2 | 12.9 | 28.9 | 58.0 |
| Kentucky | 84.0 | Mar-93 | 62.5 | 49.6 | 20.6 | 40.9 |
| Louisiana | 94.7 | May-90 | 51.7 | 48.4 | 6.3 | 48.9 |
| Maine | 24.4 | Aug-93 | 18.2 | 15.2 | 16.2 | 37.5 |
| Maryland | 81.8 | May-95 | 55.0 | 46.0 | 16.4 | 43.8 |
| Massachusetts | 115.7 | Aug-93 | 76.0 | 63.5 | 16.5 | 45.1 |
| Michigan | 233.6 | Apr-91 | 145.8 | 115.4 | 20.8 | 50.6 |
| Minnesota | 66.2 | Jun-92 | 52.3 | 48.7 | 7.0 | 26.5 |
| Mississippi | 61.8 | Nov-91 | 36.4 | 20.8 | 42.9 | 66.4 |
| Missouri | 93.7 | Mar-94 | 67.6 | 57.0 | 15.6 | 39.2 |
| Montana | 12.3 | Mar-94 | 8.8 | 7.4 | 16.3 | 40.0 |
| Nebraska | 17.2 | Mar-93 | 13.3 | 13.3 | 0.1 | 22.7 |
| Nevada | 16.3 | Mar-95 | 11.7 | 9.9 | 15.6 | 39.5 |
| New Hampshire | 11.8 | Apr-94 | 7.9 | 6.1 | 22.4 | 48.2 |
| New Jersey | 132.6 | Nov-92 | 97.6 | 76.8 | 21.3 | 42.1 |
| New Mexico | 34.9 | Nov-94 | 25.9 | 22.7 | 12.4 | 34.9 |
| New York | 463.7 | Dec-94 | 371.0 | 324.8 | 12.5 | 29.9 |
| North Carolina | 134.1 | Mar-94 | 95.6 | 68.0 | 28.9 | 49.3 |
| North Dakota | 6.6 | Apr-93 | 4.0 | 3.2 | 20.6 | 51.9 |
| Ohio | 269.8 | Mar-92 | 180.5 | 131.4 | 27.2 | 51.3 |
| Oklahoma | 51.3 | Mar-93 | 28.3 | 22.3 | 21.2 | 56.6 |
| Oregon | 43.8 | Apr-93 | 22.7 | 18.4 | 19.2 | 58.0 |
| Pennsylvania | 212.5 | Sep-94 | 157.0 | 129.4 | 17.6 | 39.1 |
| Puerto Rico | 61.7 | Jan-92 | 47.3 | 40.9 | 13.5 | 33.8 |
| Rhode Island | 22.9 | Apr-94 | 19.5 | 19.0 | 2.8 | 17.1 |
| South Carolina | 54.6 | Jan-93 | 30.3 | 23.3 | 23.4 | 57.4 |
| South Dakota | 7.4 | Apr-93 | 5.0 | 3.7 | 25.7 | 49.3 |
| Tennessee | 112.6 | Nov-93 | 64.4 | 57.1 | 11.4 | 49.3 |
| Texas | 287.5 | Dec-93 | 204.0 | 132.5 | 35.0 | 53.9 |
| Utah | 18.7 | Mar-93 | 11.6 | 10.5 | 9.7 | 43.9 |
| Vermont | 10.3 | Apr-92 | 8.2 | 7.2 | 12.5 | 30.3 |
| Virgin Islands | 1.4 | Dec-95 | 1.2 | 1.2 | 4.2 | 18.3 |
| Virginia | 76.0 | Apr-94 | 50.9 | 40.8 | 19.9 | 46.3 |
| Washington | 104.8 | Feb-95 | 91.4 | 75.0 | 17.9 | 28.5 |
| West Virginia | 41.9 | Apr-93 | 28.7 | 13.4 | 53.4 | 68.1 |
| Wisconsin | 82.9 | Jan-92 | 38.1 | 11.3 | 70.4 | 86.4 |
| Wyoming | 7.1 | Aug-92 | 2.0 | 1.3 | 37.0 | 81.9 |
| United States | 5,098 | Mar-94 | 3,789 | 3,031 | 20.0 | 40.5 |
|
1 Negative values denote percent increase. Source: U.S. Department of Health and Human Services, Administration for Children and Families, Office of Planning, Research and Evaluation, Division of Data Collection and Analysis. |
||||||
Table A-11. Average Number of AFDC Child Recipients By State, Selected Fiscal Years 1977 – 1997 1
[In thousands]
| 1977 | 1981 | 1985 | 1989 | 1992 | 1994 | 1996 | 19971 | Percent Change | ||
|---|---|---|---|---|---|---|---|---|---|---|
| 1989-93 | 1993-97 | |||||||||
| United States | 7,818 | 7,614 | 7,165 | 7,370 | 9,226 | 9,611 | 8,671 | 7,781 | 29.7 | -18.6 |
|
1 Data shown for 1997 are averages for the first nine months of the fiscal year because information on child recipients is currently Source: U.S. Department of Health and Human Services, Administration for Children and Families, Office of Planning, Research and Evaluation, unpublished data. |
||||||||||
| Alabama | 130 | 122 | 105 | 92 | 101 | 96 | 79 | 69 | 9.2 | -31.1 |
| Alaska | 8 | 11 | 10 | 13 | 20 | 24 | 23 | 23 | 82.3 | -0.2 |
| Arizona | 44 | 45 | 50 | 74 | 126 | 136 | 118 | 105 | 82.1 | -21.8 |
| Arkansas | 72 | 61 | 45 | 50 | 53 | 49 | 42 | 39 | 4.4 | -24.4 |
| California | 977 | 1,009 | 1,070 | 1,186 | 1,602 | 1,804 | 1,805 | 1,701 | 43.7 | -0.2 |
| Colorado | 63 | 56 | 53 | 66 | 82 | 80 | 68 | 60 | 26.1 | -27.4 |
| Connecticut | 98 | 98 | 82 | 71 | 105 | 111 | 108 | 104 | 51.5 | -4.1 |
| Delaware | 22 | 23 | 16 | 13 | 18 | 19 | 16 | 15 | 42.0 | -19.3 |
| Dist. of Columbia | 66 | 56 | 43 | 38 | 42 | 51 | 48 | 47 | 20.4 | 2.6 |
| Florida | 179 | 197 | 191 | 235 | 417 | 463 | 395 | 339 | 103.3 | -29.0 |
| Georgia | 189 | 171 | 166 | 187 | 268 | 274 | 251 | 216 | 47.9 | -21.8 |
| Guam | 3 | 4 | 4 | 3 | 3 | 5 | 6 | 6 | 31.1 | 48.3 |
| Hawaii | 40 | 41 | 33 | 28 | 34 | 41 | 44 | 46 | 31.5 | 24.7 |
| Idaho | 13 | 14 | 11 | 11 | 13 | 16 | 16 | 14 | 24.3 | -4.8 |
| Illinois | 543 | 491 | 493 | 432 | 472 | 486 | 456 | 414 | 9.3 | -12.4 |
| Indiana | 116 | 120 | 111 | 100 | 133 | 145 | 104 | 86 | 39.8 | -38.3 |
| Iowa | 65 | 72 | 77 | 63 | 67 | 72 | 59 | 53 | 4.9 | -19.9 |
| Kansas | 54 | 52 | 45 | 50 | 57 | 59 | 48 | 40 | 17.9 | -32.4 |
| Kentucky | 147 | 122 | 107 | 105 | 147 | 137 | 120 | 111 | 38.4 | -22.9 |
| Louisiana | 155 | 158 | 163 | 195 | 195 | 180 | 162 | 138 | -3.2 | -26.8 |
| Maine | 41 | 39 | 36 | 32 | 42 | 40 | 35 | 32 | 31.3 | -22.8 |
| Maryland | 154 | 149 | 126 | 117 | 149 | 151 | 140 | 117 | 27.4 | -22.0 |
| Massachusetts | 249 | 222 | 152 | 154 | 208 | 197 | 153 | 136 | 35.3 | -34.8 |
| Michigan | 417 | 493 | 441 | 414 | 441 | 439 | 354 | 312 | 8.6 | -30.6 |
| Minnesota | 89 | 98 | 95 | 105 | 125 | 124 | 116 | 108 | 19.4 | -13.8 |
| Mississippi | 127 | 129 | 112 | 129 | 128 | 116 | 96 | 81 | -3.5 | -34.5 |
| Missouri | 194 | 144 | 129 | 134 | 164 | 176 | 162 | 145 | 27.7 | -15.5 |
| Montana | 13 | 14 | 15 | 18 | 21 | 23 | 21 | 18 | 26.2 | -18.5 |
| Nebraska | 23 | 27 | 29 | 28 | 33 | 31 | 27 | 25 | 16.3 | -22.3 |
| Nevada | 8 | 10 | 9 | 14 | 22 | 27 | 27 | 23 | 74.0 | -7.5 |
| New Hampshire | 17 | 16 | 9 | 8 | 18 | 19 | 16 | 14 | 122.6 | -27.1 |
| New Jersey | 316 | 322 | 247 | 205 | 241 | 228 | 195 | 174 | 16.3 | -27.0 |
| New Mexico | 41 | 38 | 34 | 41 | 57 | 66 | 65 | 57 | 52.4 | -7.9 |
| New York | 878 | 759 | 729 | 648 | 743 | 813 | 771 | 704 | 20.8 | -10.0 |
| North Carolina | 150 | 141 | 113 | 136 | 210 | 223 | 191 | 171 | 64.1 | -23.3 |
| North Dakota | 9 | 9 | 8 | 10 | 12 | 11 | 9 | 8 | 17.6 | -32.6 |
| Ohio | 398 | 389 | 424 | 411 | 489 | 455 | 382 | 358 | 15.1 | -24.3 |
| Oklahoma | 66 | 66 | 57 | 71 | 92 | 90 | 74 | 61 | 33.4 | -35.7 |
| Oregon | 81 | 60 | 49 | 58 | 76 | 76 | 60 | 45 | 33.3 | -41.8 |
| Pennsylvania | 470 | 438 | 369 | 348 | 397 | 417 | 368 | 325 | 17.1 | -20.4 |
| Puerto Rico | 115 | 120 | 116 | 126 | 132 | 124 | 105 | 99 | 2.4 | -23.6 |
| Rhode Island | 37 | 37 | 28 | 28 | 39 | 41 | 39 | 37 | 46.9 | -9.3 |
| South Carolina | 99 | 111 | 84 | 77 | 100 | 102 | 89 | 69 | 37.5 | -34.4 |
| South Dakota | 18 | 13 | 11 | 13 | 14 | 14 | 12 | 10 | 7.2 | -26.3 |
| Tennessee | 131 | 122 | 105 | 133 | 180 | 203 | 181 | 137 | 63.1 | -36.9 |
| Texas | 235 | 236 | 256 | 378 | 528 | 549 | 484 | 427 | 44.2 | -21.8 |
| Utah | 22 | 27 | 24 | 28 | 34 | 33 | 27 | 24 | 22.7 | -32.3 |
| Vermont | 17 | 16 | 14 | 12 | 18 | 17 | 16 | 15 | 41.3 | -16.8 |
| Virgin Islands | 3 | 3 | 3 | 3 | 3 | 3 | 4 | 3 | 8.8 | 22.9 |
| Virginia | 122 | 120 | 103 | 100 | 129 | 134 | 114 | 96 | 33.6 | -28.1 |
| Washington | 101 | 99 | 113 | 141 | 176 | 187 | 177 | 169 | 31.1 | -8.5 |
| West Virginia | 50 | 62 | 64 | 67 | 73 | 72 | 62 | 55 | 10.1 | -26.2 |
| Wisconsin | 141 | 159 | 181 | 161 | 165 | 153 | 123 | 94 | -1.4 | -41.0 |
| Wyoming | 5 | 5 | 7 | 9 | 13 | 11 | 9 | 6 | 34.4 | -51.8 |
Table A-12. AFDC Recipiency Rates for Children by State, Selected Fiscal Years 1977 - 1997
[In percent]
| 1977 | 1981 | 1985 | 1989 | 1992 | 1994 | 1996 | 1997 | Percent Change | ||
|---|---|---|---|---|---|---|---|---|---|---|
| 1989-93 | 1993-97 | |||||||||
|
Note: Recipiency rate refers to the average monthly number of AFDC child recipients in each State during the given fiscal year as a percent of the resident population under 18 years of age as of July 1 of that year. The numerators are from Table A-11. Sources: U. S. Department of Health and Human Services and U.S. Bureau of the Census, (Resident population by state available online at http://www.census.gov/population/estimates/state/). |
||||||||||
| Alabama | 11.0 | 10.7 | 9.7 | 8.6 | 9.5 | 8.9 | 7.4 | 6.4 | 9 | -31 |
| Alaska | 5.4 | 8.3 | 5.9 | 7.3 | 10.9 | 12.8 | 12.5 | 12.2 | 69 | -0 |
| Arizona | 5.8 | 5.7 | 5.9 | 7.6 | 11.9 | 12.1 | 9.6 | 8.2 | 62 | -33 |
| Arkansas | 10.7 | 9.3 | 7.1 | 7.9 | 8.5 | 7.7 | 6.4 | 5.9 | 3 | -28 |
| California | 15.3 | 15.7 | 15.6 | 15.6 | 19.1 | 20.8 | 20.3 | 19.0 | 28 | -5 |
| Colorado | 7.8 | 6.8 | 6.1 | 7.6 | 8.8 | 8.4 | 6.8 | 5.9 | 16 | -33 |
| Connecticut | 11.1 | 12.2 | 10.8 | 9.5 | 13.7 | 14.2 | 13.7 | 13.1 | 46 | -6 |
| Delaware | 12.4 | 14.0 | 10.2 | 8.1 | 10.4 | 10.5 | 8.9 | 8.5 | 33 | -21 |
| Dist. of Columbia | 40.7 | 40.0 | 33.9 | 30.7 | 36.8 | 44.6 | 44.0 | 43.9 | 30 | 10 |
| Florida | 7.7 | 8.2 | 7.6 | 8.4 | 13.4 | 14.1 | 11.6 | 9.8 | 78 | -35 |
| Georgia | 11.4 | 10.4 | 10.1 | 10.8 | 14.9 | 14.6 | 12.8 | 10.9 | 38 | -27 |
| Hawaii | 14.3 | 14.8 | 11.6 | 10.1 | 11.5 | 13.6 | 14.5 | 15.3 | 24 | 23 |
| Idaho | 4.4 | 4.3 | 3.6 | 3.7 | 4.1 | 4.6 | 4.6 | 3.9 | 15 | -10 |
| Illinois | 16.0 | 15.4 | 16.1 | 14.5 | 15.6 | 15.8 | 14.4 | 13.0 | 7 | -16 |
| Indiana | 6.9 | 7.6 | 7.5 | 6.9 | 9.2 | 9.8 | 7.0 | 5.8 | 40 | -40 |
| Iowa | 7.5 | 8.9 | 10.2 | 8.8 | 9.3 | 9.9 | 8.2 | 7.3 | 4 | -20 |
| Kansas | 8.1 | 8.1 | 6.9 | 7.6 | 8.4 | 8.6 | 7.0 | 5.8 | 14 | -33 |
| Kentucky | 13.3 | 11.5 | 10.5 | 10.9 | 15.4 | 14.1 | 12.4 | 11.6 | 38 | -23 |
| Louisiana | 11.6 | 11.8 | 12.2 | 15.5 | 15.9 | 14.6 | 13.4 | 11.6 | -1 | -25 |
| Maine | 12.2 | 12.3 | 11.7 | 10.4 | 13.8 | 13.1 | 11.8 | 10.9 | 32 | -21 |
| Maryland | 12.3 | 13.0 | 11.4 | 10.2 | 12.2 | 12.0 | 11.1 | 9.2 | 18 | -24 |
| Massachusetts | 15.5 | 15.3 | 11.2 | 11.4 | 15.1 | 13.9 | 10.6 | 9.4 | 31 | -37 |
| Michigan | 14.4 | 18.3 | 17.7 | 16.9 | 17.7 | 17.5 | 14.1 | 12.5 | 6 | -31 |
| Minnesota | 7.2 | 8.5 | 8.5 | 9.2 | 10.3 | 10.1 | 9.4 | 8.7 | 13 | -16 |
| Mississippi | 15.4 | 16.1 | 14.0 | 17.1 | 17.1 | 15.4 | 12.7 | 10.8 | -3 | -35 |
| Missouri | 13.6 | 10.7 | 9.8 | 10.2 | 12.2 | 12.9 | 11.7 | 10.3 | 24 | -18 |
| Montana | 5.4 | 6.0 | 6.1 | 7.9 | 9.0 | 9.7 | 8.9 | 8.0 | 22 | -17 |
| Nebraska | 4.9 | 6.0 | 6.8 | 6.5 | 7.5 | 7.1 | 6.1 | 5.7 | 15 | -24 |
| Nevada | 4.2 | 4.3 | 3.9 | 5.0 | 6.6 | 7.1 | 6.5 | 5.1 | 37 | -26 |
| New Hampshire | 6.5 | 6.1 | 3.7 | 3.1 | 6.3 | 6.7 | 5.4 | 4.6 | 114 | -29 |
| New Jersey | 14.8 | 16.6 | 13.5 | 11.3 | 12.8 | 11.7 | 9.9 | 8.7 | 10 | -30 |
| New Mexico | 9.9 | 9.1 | 7.8 | 9.0 | 12.1 | 13.5 | 13.1 | 11.4 | 42 | -11 |
| New York | 17.5 | 16.6 | 16.7 | 15.1 | 16.8 | 18.1 | 16.9 | 15.4 | 16 | -12 |
| North Carolina | 8.8 | 8.7 | 7.1 | 8.5 | 12.5 | 12.7 | 10.4 | 9.2 | 54 | -30 |
| North Dakota | 4.7 | 4.8 | 4.3 | 5.7 | 6.9 | 6.4 | 5.4 | 4.9 | 23 | -30 |
| Ohio | 12.2 | 12.9 | 14.7 | 14.6 | 17.3 | 16.0 | 13.4 | 12.6 | 14 | -24 |
| Oklahoma | 7.9 | 7.6 | 6.3 | 8.3 | 10.7 | 10.4 | 8.5 | 6.9 | 31 | -37 |
| Oregon | 11.3 | 8.2 | 6.9 | 8.2 | 10.0 | 9.7 | 7.5 | 5.6 | 22 | -45 |
| Pennsylvania | 14.1 | 14.4 | 12.9 | 12.4 | 13.9 | 14.4 | 12.8 | 11.3 | 15 | -20 |
| Rhode Island | 14.3 | 15.6 | 12.6 | 12.1 | 16.9 | 17.7 | 16.7 | 15.7 | 43 | -9 |
| South Carolina | 10.4 | 11.9 | 9.1 | 8.3 | 10.7 | 10.8 | 9.4 | 7.3 | 36 | -36 |
| South Dakota | 8.3 | 6.5 | 5.7 | 6.7 | 7.0 | 6.6 | 5.9 | 5.3 | 3 | -23 |
| Tennessee | 9.9 | 9.5 | 8.6 | 10.9 | 14.4 | 15.7 | 13.7 | 10.3 | 57 | -39 |
| Texas | 5.6 | 5.4 | 5.4 | 7.9 | 10.4 | 10.4 | 8.8 | 7.6 | 34 | -27 |
| Utah | 4.6 | 4.7 | 4.0 | 4.5 | 5.3 | 4.9 | 4.0 | 3.4 | 16 | -35 |
| Vermont | 11.3 | 10.9 | 9.9 | 8.8 | 12.2 | 11.7 | 10.8 | 10.0 | 37 | -17 |
| Virginia | 8.0 | 8.3 | 7.1 | 6.7 | 8.2 | 8.4 | 7.0 | 5.8 | 27 | -31 |
| Washington | 9.1 | 8.6 | 9.7 | 11.5 | 12.9 | 13.3 | 12.4 | 11.6 | 17 | -13 |
| West Virginia | 8.8 | 11.2 | 12.6 | 14.8 | 17.0 | 16.8 | 14.7 | 13.3 | 16 | -23 |
| Wisconsin | 9.8 | 11.9 | 14.2 | 12.6 | 12.4 | 11.4 | 9.2 | 7.0 | -5 | -42 |
| Wyoming | 3.6 | 3.3 | 4.1 | 6.6 | 9.2 | 8.1 | 6.9 | 4.5 | 37 | -50 |
| United States | 11.8 | 11.8 | 11.2 | 11.4 | 13.8 | 14.0 | 12.4 | 11.0 | 23 | -22 |
Table A-13. AFDC Recipiency Rates for Total Population by State, Selected Fiscal Years 1977 – 1997
[In percent]
| 1977 | 1981 | 1985 | 1989 | 1992 | 1994 | 1997 | 1997 | Percent Change | ||
|---|---|---|---|---|---|---|---|---|---|---|
| 1989-93 | 1993-97 | |||||||||
| United States | 5.0 | 4.8 | 4.5 | 4.4 | 5.3 | 5.4 | 4.7 | 4.0 | 24 | -25 |
|
Note: Recipiency rate refers to the average monthly number of AFDC recipients in each State during the given fiscal year expressed as a percent of the total resident population as of July 1 of that year. The numerators are from Table A-9. Sources: U. S. Department of Health and Human Services and U.S. Bureau of the Census, (Resident population by state available online at http://www.census.gov/population/estimates/state/). |
||||||||||
| Alabama | 4.5 | 4.4 | 3.8 | 3.2 | 3.4 | 3.1 | 2.5 | 2.0 | 4 | -40 |
| Alaska | 2.8 | 3.9 | 3.0 | 3.5 | 5.4 | 6.3 | 6.0 | 5.8 | 72 | -5 |
| Arizona | 2.4 | 2.2 | 2.3 | 2.9 | 4.7 | 4.8 | 3.9 | 3.2 | 69 | -34 |
| Arkansas | 4.3 | 3.7 | 2.8 | 3.0 | 3.1 | 2.8 | 2.3 | 2.1 | 1 | -30 |
| California | 6.4 | 6.3 | 6.1 | 6.0 | 7.5 | 8.4 | 8.2 | 7.4 | 31 | -6 |
| Colorado | 3.4 | 2.7 | 2.5 | 3.0 | 3.5 | 3.3 | 2.6 | 2.0 | 16 | -41 |
| Connecticut | 4.4 | 4.5 | 3.8 | 3.2 | 4.8 | 5.1 | 5.0 | 4.7 | 53 | -4 |
| Delaware | 5.3 | 5.5 | 3.9 | 2.9 | 3.8 | 3.9 | 3.2 | 3.0 | 36 | -24 |
| Dist. of Columbia | 14.2 | 12.7 | 9.2 | 7.7 | 10.3 | 13.1 | 13.0 | 12.5 | 51 | 8 |
| Florida | 2.7 | 2.7 | 2.4 | 2.6 | 4.5 | 4.8 | 3.9 | 3.1 | 96 | -39 |
| Georgia | 4.8 | 4.2 | 4.0 | 4.1 | 5.7 | 5.6 | 4.8 | 3.8 | 39 | -35 |
| Hawaii | 6.1 | 6.3 | 4.9 | 3.9 | 4.4 | 5.3 | 5.6 | 6.0 | 23 | 24 |
| Idaho | 2.3 | 2.1 | 1.7 | 1.7 | 1.8 | 2.0 | 1.9 | 1.3 | 14 | -31 |
| Illinois | 6.8 | 6.2 | 6.4 | 5.5 | 5.9 | 6.1 | 5.5 | 4.9 | 6 | -17 |
| Indiana | 3.0 | 3.1 | 3.0 | 2.7 | 3.5 | 3.8 | 2.5 | 2.1 | 39 | -44 |
| Iowa | 3.3 | 3.8 | 4.3 | 3.5 | 3.7 | 3.9 | 3.1 | 2.7 | 2 | -23 |
| Kansas | 3.3 | 3.1 | 2.8 | 3.0 | 3.4 | 3.4 | 2.7 | 2.1 | 16 | -40 |
| Kentucky | 5.7 | 4.8 | 4.3 | 4.2 | 6.1 | 5.4 | 4.5 | 4.0 | 40 | -32 |
| Louisiana | 5.4 | 5.0 | 5.2 | 6.5 | 6.4 | 5.8 | 5.4 | 4.3 | -6 | -30 |
| Maine | 5.4 | 5.0 | 4.9 | 4.2 | 5.5 | 5.2 | 4.5 | 4.0 | 31 | -27 |
| Maryland | 5.1 | 5.2 | 4.4 | 3.7 | 4.5 | 4.4 | 4.0 | 3.2 | 20 | -28 |
| Massachusetts | 6.5 | 6.0 | 4.0 | 4.0 | 5.2 | 5.1 | 3.9 | 3.4 | 35 | -37 |
| Michigan | 7.1 | 8.2 | 7.6 | 6.9 | 7.1 | 6.9 | 5.4 | 4.6 | 4 | -36 |
| Minnesota | 3.3 | 3.6 | 3.6 | 3.8 | 4.3 | 4.1 | 3.7 | 3.3 | 12 | -21 |
| Mississippi | 7.1 | 6.9 | 6.0 | 6.9 | 6.8 | 6.0 | 4.8 | 3.8 | -6 | -42 |
| Missouri | 5.5 | 4.3 | 3.9 | 4.0 | 4.8 | 5.0 | 4.3 | 3.6 | 25 | -27 |
| Montana | 2.3 | 2.6 | 2.7 | 3.5 | 3.9 | 4.1 | 3.6 | 3.1 | 19 | -26 |
| Nebraska | 2.2 | 2.5 | 2.8 | 2.6 | 3.0 | 2.8 | 2.3 | 2.2 | 15 | -26 |
| Nevada | 1.8 | 1.7 | 1.4 | 1.8 | 2.4 | 2.6 | 2.3 | 1.8 | 44 | -31 |
| New Hampshire | 2.9 | 2.5 | 1.4 | 1.2 | 2.5 | 2.7 | 2.1 | 1.7 | 128 | -36 |
| New Jersey | 6.1 | 6.3 | 4.9 | 3.9 | 4.5 | 4.2 | 3.6 | 3.1 | 15 | -30 |
| New Mexico | 4.5 | 4.2 | 3.5 | 3.9 | 5.6 | 6.2 | 5.9 | 4.7 | 51 | -20 |
| New York | 7.0 | 6.3 | 6.2 | 5.4 | 6.2 | 6.9 | 6.5 | 5.8 | 21 | -12 |
| North Carolina | 3.5 | 3.4 | 2.6 | 3.1 | 4.6 | 4.7 | 3.8 | 3.3 | 58 | -32 |
| North Dakota | 2.1 | 2.0 | 1.8 | 2.4 | 2.9 | 2.6 | 2.1 | 1.8 | 23 | -39 |
| Ohio | 5.2 | 5.5 | 6.3 | 5.8 | 6.8 | 6.2 | 4.9 | 4.4 | 12 | -32 |
| Oklahoma | 3.1 | 2.9 | 2.5 | 3.3 | 4.2 | 4.0 | 3.2 | 2.5 | 31 | -42 |
| Oregon | 5.0 | 3.5 | 2.8 | 3.1 | 3.9 | 3.7 | 2.7 | 1.9 | 24 | -50 |
| Pennsylvania | 5.5 | 5.4 | 4.8 | 4.4 | 5.0 | 5.1 | 4.5 | 3.8 | 15 | -24 |
| Rhode Island | 5.6 | 5.7 | 4.5 | 4.2 | 5.9 | 6.3 | 5.9 | 5.5 | 48 | -11 |
| South Carolina | 4.7 | 4.9 | 3.6 | 3.1 | 3.9 | 3.8 | 3.2 | 2.4 | 30 | -41 |
| South Dakota | 3.5 | 2.7 | 2.3 | 2.7 | 2.8 | 2.6 | 2.2 | 1.8 | 2 | -35 |
| Tennessee | 4.3 | 3.8 | 3.3 | 4.0 | 5.3 | 5.8 | 4.9 | 3.4 | 52 | -44 |
| Texas | 2.4 | 2.2 | 2.2 | 3.2 | 4.3 | 4.3 | 3.6 | 3.0 | 35 | -32 |
| Utah | 2.8 | 2.8 | 2.3 | 2.6 | 2.8 | 2.6 | 2.0 | 1.6 | 10 | -41 |
| Vermont | 4.5 | 4.8 | 4.2 | 3.5 | 5.1 | 4.8 | 4.3 | 3.9 | 41 | -21 |
| Virginia | 3.3 | 3.2 | 2.7 | 2.4 | 3.0 | 3.0 | 2.4 | 1.9 | 26 | -36 |
| Washington | 3.8 | 3.7 | 4.0 | 4.6 | 5.3 | 5.5 | 5.0 | 4.5 | 19 | -17 |
| West Virginia | 3.3 | 4.1 | 5.5 | 6.0 | 6.6 | 6.3 | 5.2 | 4.5 | 8 | -31 |
| Wisconsin | 4.3 | 5.1 | 6.1 | 5.0 | 4.9 | 4.5 | 3.3 | 2.3 | -7 | -51 |
| Wyoming | 1.6 | 1.4 | 2.0 | 3.0 | 4.1 | 3.4 | 2.7 | 1.5 | 30 | -61 |
Food Stamp Program
The Food Stamp Program, administered by the U.S. Department of Agriculture’s (USDA) Food and Nutrition Service, is the largest food assistance program in the country, reaching more poor individuals over the course of a year than any other public assistance program. In fiscal year 1997, 22.9 million persons were served and $19.6 billion in benefits were distributed. Unlike many other public assistance programs, the Food Stamp Program has few categorical requirements for eligibility, such as the presence of children, elderly or disabled individuals in a household. As a result, the program offers assistance to a large and diverse population of needy persons, many of whom are not eligible for other forms of assistance.
The Food Stamp Program was designed primarily to increase the food purchasing power of eligible low-income households to the point where they can buy a nutritionally adequate low-cost diet. Participating households are expected to be able to devote 30 percent of their counted monthly cash income to food purchases. Food stamp benefits then make up the difference between the household’s expected contribution to its food costs and an amount judged to be sufficient to buy an adequate low-cost diet. This amount, the maximum food stamp benefit level, is derived from USDA’s lowest-cost food plan (the Thrifty Food Plan (TFP)).
The Federal government is responsible for virtually all of the rules that govern the program and, with limited variations these rules are nationally uniform, as are the benefit levels. Nonetheless, States, the District of Columbia, Guam, and the Virgin Islands, through their local welfare offices, have primary responsibility for the day-to-day administration of the program2. They determine eligibility, calculate benefits, and issue food stamp allotments. The Food Stamp Act provides 100 percent Federal funding of food stamp benefits. States and other jurisdictions have responsibility for about half the cost of state welfare agency administration.
The Food Stamp Program has financial, employment/training-related and “categorical” tests for eligibility. The basic food stamp beneficiary unit is the “household.” Generally, individuals living together constitute a single food stamp household if they customarily purchase food and prepare meals in common. Members of the same household must apply together, and their income, expenses, and assets normally are aggregated in determining food stamp eligibility and benefits. Except for households composed entirely of AFDC, SSI, or general assistance recipients (who generally are automatically eligible for food stamps), monthly cash income is the primary food stamp eligibility determinant. Unless exempt, adult applicants for food stamps must register for work, typically with the welfare agency or a state employment service office. To maintain eligibility, they must accept a suitable job if offered one and fulfill any work, job search, or training requirements established by the administering welfare agencies.
Food stamp benefits are a function of a household’s size, its net monthly income, and maximum monthly benefit levels. Allotments are not taxable and food stamp purchases may not be charged sales taxes. Receipt of food stamps does not affect eligibility for or benefits provided by other welfare programs, although some programs use food stamp participation use food stamps as a “trigger” for eligibility and others take into account the general availability of food stamps in deciding what level of benefits to provide. In fiscal year 1997, monthly benefits averaged $71 a person and about $178 a household.
The size of the population eligible for food stamps is influenced by many factors, including changes in program rules (including immigration laws), changes in the economy, and demographics. Similarly, changes in the economy and changes in attitudes toward “welfare” affect the rate at which eligible individuals participate in the program and may also influence the average length of time spent in the program.
Recent Legislative Changes. Subtitle A of title VIII of the PRWORA contains major and extensive revisions to the Food Stamp Program, including provisions designed to strengthen work and other nonfinancial eligibility requirements and control future spending increases. The impact on program participation and expenditures resulting from some of those provisions are reflected in preliminary 1997 data, while the effects of others will be observable over time.
A new work requirement was added for able-bodied adult food stamp recipients without children. Unless exempt, no individual may be eligible for food stamps if, during the preceding 36-month period, the individual received food stamp benefits for any 3 months while not: (1) working at least 20 hours a week; (2) participating in and complying with a work program for at least 20 hours a week; or (3) participating in and complying with a workfare program. USDA was authorized to waive application of the work requirement to any group of individuals at the request of the state agency, if a determination is made that the area where they reside has an unemployment rate over 10 percent or does not have a sufficient number of jobs to provide them employment. The impacts were further moderated by provisions of the Balanced Budget Act of 1997 (Public Law 105-33).
Separately, title IV of the act made significant changes in the eligibility of noncitizens for Food Stamp benefits. Most qualified aliens (including legal immigrants -- illegal aliens are already ineligible) were barred from Food Stamps until citizenship. Subsequently, the Agriculture Research, Extension and Education Reform Act of 1998 [PL 105-185] restored food stamp eligibility to certain groups of qualified aliens who were legally residing in the United States before passage of PRWORA (August 22, 1996). The ban was lifted for children, disabled and people who were 65 on August 22, 1996.
Growth in future program expenditures was restrained by changes in the benefit structure for eligible participants, including a reduction in the maximum food stamp allotment. Other provisions of the act disqualify from eligibility those convicted of drug-related felonies and give states the option to disqualify individuals, both custodial and noncustodial parents, from food stamps when they do not cooperate with child support agencies or are in arrears in their child support.
Food Stamp Program Data. The following six tables and figures provide information about the Food Stamp Program:
- Tables A-14 and A-15 present national caseload and expenditure trend data on the Food Stamp program. As noted above, some PRWORA effects are reflected in the fiscal year 1997 data;
- Figure A-5 and Table A-16 present some demographic characteristics of the food stamp caseload; and
- Tables A-17 through A-19 present some state-by-state trend data on the Food Stamp program through fiscal year 1996.
Table A-14 presents information on the average monthly number of food stamp recipients for each fiscal year since 1970 through Fiscal Year 1997. The health of the economy has historically been a good predictor of the number of participants in the Food Stamp Program. Food stamp participation (excluding Puerto Rico) has continued to fall from its peak in of 28 million in March 1994 to an average of 22.9 million persons in 1997, reaching their lowest point since 1990.3 As shown in Table A-15, total program costs have also declined, reaching their lowest levels since 1990, after adjusting for inflation. Total program costs (including Puerto Rico) were $25.6 billion in Fiscal Year 1996 and declined by 11 percent in 1997 to $22.8 billion. The average monthly benefit per person has also declined and, after adjusting for inflation, is at the same level paid in 1981.
Table A-14. Trends in Food Stamp Participation, 1970 – 1997
| Fiscal Year | Total Food Stamp Participants1 (in thousands) | Child Food Stamp Participants1 (in thousands) | Participants as a Percent of Total Population2 | Participants as a Percent of All Poor Persons2 | Participants as a Percent of Pre-transfer Poverty Population3 | Child Participants as a Percent of Total Child Population2 | Child Participants as a Percent of Children in Poverty2 |
|---|---|---|---|---|---|---|---|
|
1 Total participants includes all participating States, the District of Columbia, and the territories. The number of child participants includes only the participating States and D.C. (the territories are not included). From 1970 to 1974 the number of participants includes the family food assistance program (FFAP) which was largely replaced by the Food Stamp program in 1975. The FFAP participants for these five years were: 3,977; 3,642; 3,002; 2,441; and 1,406 (all in thousands). The monthly average number of participants for all fiscal years (including 1970-76) is computed as an average from October of the prior calender year to September of the current year. 2 Includes all participating States and the District of Columbia only--the territories are excluded from both numerator and denominator. Population numbers used as denominators are the resident population—see Current Population Reports, Series P25-1106. For the persons living in poverty used as denominators, see Current Population Reports, Series P60-201. 3 The pretransfer poverty population used as denominator is the number of all persons in families or living alone whose income (cash income plus social insurance plus Social Security but before taxes and means-tested transfers) falls below the appropriate poverty threshold. See Appendix J, Table 20, 1992 Green Book; data for subsequent years are unpublished Congressional Budget Office tabulations. 4 The first fiscal year in which food stamps were available nationwide. 5 The fiscal year in which the food stamp purchase requirement was eliminated, on a phased in basis. 6 Participation figures in column 1 from 1982 on include enrollment in Puerto Rico’s Nutrition Assistance Program (averaging 1.4 to 1.5 million persons a month under the nutrition assistance grant and higher figures in earlier years under Food Stamps). e Estimated value. Sources: U.S. Department of Agriculture, Food and Nutrition Service, National Data Bank, the 1996 Green Book, and U.S. Bureau of the Census,“Poverty in the United States: 1997," Current Population Reports, Series P60-201 and earlier years. |
|||||||
| 1970 | 8,277 | NA | 4.1 | 32.6 | NA | NA | NA |
| 1971 | 13,042 | NA | 6.3 | 51.0 | NA | NA | NA |
| 1972 | 14,102 | NA | 6.7 | 57.7 | NA | NA | NA |
| 1973 | 14,641 | NA | 6.9 | 63.7 | NA | NA | NA |
| 1974 | 14,784 | NA | 6.9 | 63.2 | NA | NA | NA |
| 19754 | 18,308 | NA | 7.9 | 66.2 | NA | NA | NA |
| 1976 | 18,240 | 9,126 | 7.7 | 66.7 | NA | 13.8 | 88.8 |
| 1977 | 17,014 | NA | 7.1 | 62.7 | NA | NA | NA |
| 1978 | 15,988 | NA | 6.5 | 58.9 | NA | NA | NA |
| 19795 | 17,682 | NA | 7.1 | 60.9 | 57.1 | NA | NA |
| 1980 | 21,082 | 9,493 | 8.4 | 65.5 | 60.7 | 15.5 | 85.6 |
| 1981 | 22,430 | 9,674 | 9.0 | 64.6 | 60.8 | 15.5 | 78.4 |
| 19826 | 22,055 | 9,545 | 8.8 | 59.0 | 56.3 | 15.3 | 70.3 |
| 19836 | 23,195 | 10,783 | 9.2 | 61.1 | 58.5 | 17.4 | 78.4 |
| 19846 | 22,384 | 10,372 | 8.8 | 61.7 | 58.5 | 16.8 | 78.2 |
| 19856 | 21,379 | 9,824 | 8.3 | 60.0 | 56.6 | 15.8 | 76.1 |
| 19866 | 20,909 | 9,846 | 8.1 | 59.9 | 56.2 | 15.7 | 76.5 |
| 19876 | 20,583 | 9,765 | 7.9 | 59.2 | 55.6 | 15.5 | 75.4 |
| 19886 | 20,095 | 9,363 | 7.6 | 58.6 | 55.2 | 14.8 | 75.1 |
| 19896 | 20,266 | 9,429 | 7.6 | 59.6 | 55.6 | 14.9 | 74.9 |
| 19906 | 21,547 | 10,127 | 8.0 | 59.7 | 55.7 | 15.8 | 75.4 |
| 19916 | 24,115 | 11,952 | 9.0 | 63.3 | 59.3 | 18.4 | 83.3 |
| 19926 | 26,886 | 13,349 | 9.9 | 66.7 | 64.0 | 20.2 | 87.3 |
| 19936 | 28,422 | 14,196 | 10.5 | 68.6 | 63.8 | 21.2 | 90.3 |
| 19946 | 28,844 | 14,391 | 10.5 | 72.1 | 66.8 | 21.2 | 94.1 |
| 19956 | 27,945 | 13,860 | 10.1 | 73.0 | 67.6 | 20.2 | 94.5 |
| 19966 | 26,870 | 13,189 | 9.6 | 69.9 | 64.7 | 19.1 | 91.2 |
| 19976 | 24,160 | 11,800e | 8.5 | 64.2 | NA | 17.0e | 83.6e |
Table A-15 Trends in Food Stamp Expenditures, 1970 – 1997
| Fiscal Year | Total Federal Cost | Benefits2 (Federal) [In millions] |
Administration1 | Average Monthly Benefit per Person | ||||
|---|---|---|---|---|---|---|---|---|
| Current Dollars [In millions] |
1997 Dollars3 [In millions] |
Federal [In millions] |
State & Local [In millions] |
Total Cost [In millions] |
Current Dollars | 1997 Dollars3 | ||
|
1 All Federal administrative costs of the Food Stamp Program and Puerto Rico's block grant are included: Federal matching for the various administrative and employment and training expenses of States and other jurisdictions, and direct Federal administrative costs. Beginning in 1984 the administrative cost of certifying AFDC households for food stamps are shown in the food stamp appropriation. Figures for Federal administrative costs beginning with fiscal year 1989 include only those paid out of the Food Stamp appropriation and the Food Stamp portion of the general appropriation for food program administration. Figures for earlier years include estimates of food stamp related Federal administrative expenses paid out of other Agriculture Department accounts. State and local costs are estimated based on the known Federal shares and represent an estimate of all administrative expenses of participating States (including Puerto Rico). 2 All benefit costs associated with the Food Stamp Program and Puerto Rico's block grant are included. The benefit amounts shown in the table reflect small downward adjustments for overpayments collected from recipients and, beginning in 1989, issued but unredeemed benefits. Over time, the figures reflect both changes in benefit levels and numbers of recipients. 3 Constant dollar adjustments to 1997 level were made using the CPI-U-X1 price index. 4 From 1970 to 1974 total Federal cost includes the cost of the family food assistance program (FFAP) which was largely replaced by the Food Stamp program in 1975. The FFAP amounts for these years were: $289, $321, $312, $255, and $205 (in millions). 5 The first fiscal year in which benefit and eligibility rules were, by law, nationally uniform and indexed for inflation. 6 The first fiscal year in which food stamps were available nationwide. 7 The fiscal year in which the food stamp purchase requirement was eliminated, on a phased in basis. 8 Beginning 1984 USDA took over from DHHS the administrative cost of certifying public assistance households for food stamps. 9 Includes funding for Puerto Rico's nutrition assistance grant; earlier years include funding for Puerto Rico under the regular food stamp program. Average benefit figures do not reflect the lower benefits in Puerto Rico under its nutrition assistance program. Sources: Budget documents of the U.S. Department Agriculture, Food and Nutrition Service and the 1996 Green Book . |
||||||||
| 1970 | 8664 | 3,427 | 550 | 27 | 20 | 886 | 9.00 | 35.60 |
| 1971 | 1,8974 | 7,184 | 1,523 | 53 | 40 | 1,937 | 12.60 | 47.70 |
| 19725 | 2,1824 | 7,980 | 1,797 | 73 | 55 | 2,237 | 13.50 | 49.40 |
| 1973 | 2,4664 | 8,661 | 2,131 | 80 | 60 | 2,526 | 14.60 | 51.30 |
| 1974 | 3,0474 | 9,857 | 2,718 | 124 | 95 | 3,142 | 17.60 | 56.90 |
| 19756 | 4,624 | 13,632 | 4,386 | 238 | 180 | 4,804 | 21.40 | 63.10 |
| 1976 | 5,692 | 15,708 | 5,327 | 365 | 275 | 5,967 | 23.90 | 66.00 |
| 1977 | 5,469 | 14,051 | 5,067 | 402 | 300 | 5,769 | 24.70 | 63.50 |
| 1978 | 5,573 | 13,433 | 5,139 | 434 | 325 | 5,898 | 26.80 | 64.60 |
| 19797 | 6,995 | 15,504 | 6,480 | 515 | 388 | 7,383 | 30.60 | 67.80 |
| 1980 | 9,224 | 18,379 | 8,721 | 503 | 375 | 9,599 | 34.40 | 68.50 |
| 1981. | 11,308 | 20,488 | 10,630 | 678 | 504 | 11,812 | 39.50 | 71.60 |
| 19829 | 11,318 | 19,159 | 10,609 | 709 | 557 | 11,875 | 39.20 | 66.40 |
| 19839 | 12,733 | 20,616 | 11,955 | 778 | 612 | 13,345 | 43.00 | 69.60 |
| 19849 | 12,470 | 19,365 | 11,499 | 9718 | 805 | 13,275 | 42.70 | 66.30 |
| 19859 | 12,599 | 18,886 | 11,556 | 1,043 | 871 | 13,470 | 45.00 | 67.50 |
| 19869 | 12,528 | 18,316 | 11,415 | 1,113 | 935 | 13,463 | 45.60 | 66.70 |
| 19879 | 12,539 | 17,827 | 11,344 | 1,195 | 996 | 13,535 | 45.80 | 65.10 |
| 19889 | 13,289 | 18,150 | 11,999 | 1,290 | 1,080 | 14,369 | 49.80 | 68.00 |
| 19899 | 13,904 | 18,122 | 12,572 | 1,332 | 1,101 | 15,005 | 51.90 | 67.60 |
| 19909 | 16,512 | 20,502 | 15,090 | 1,422 | 1,174 | 17,686 | 59.00 | 73.30 |
| 19919 | 19,765 | 23,361 | 18,249 | 1,516 | 1,247 | 21,012 | 63.90 | 75.50 |
| 19929 | 23,539 | 27,003 | 21,883 | 1,656 | 1,375 | 24,914 | 68.50 | 78.60 |
| 19939 | 24,749 | 27,560 | 23,033 | 1,716 | 1,572 | 26,321 | 67.96 | 75.70 |
| 19949 | 25,600 | 27,772 | 23,811 | 1,789 | 1,643 | 27,243 | 69.01 | 74.90 |
| 19959 | 25,818 | 27,251 | 23,901 | 1,917 | 1,748 | 27,566 | 71.27 | 75.20 |
| 19969 | 25,591 | 26,282 | 23,607 | 1,984 | 1,842 | 27,433 | 73.22 | 75.20 |
| 19979 | 22,778 | 22,778 | 20,751 | 2,026 | 1,882 | 24,660 | 71.27 | 71.30 |
Figure A-5. Characteristics of Food Stamp Recipients
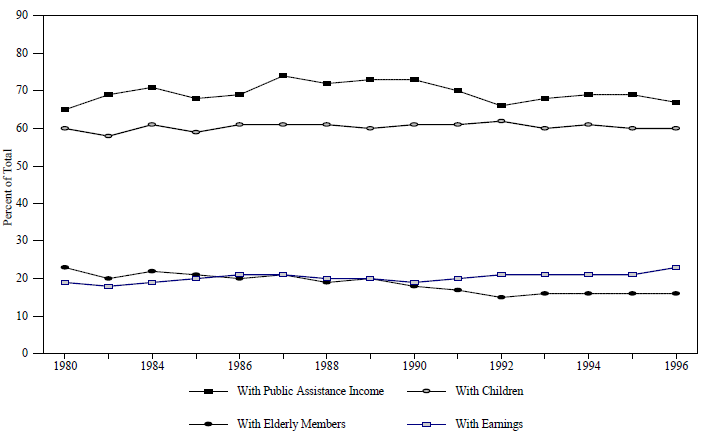
Source: U.S. Department of Agriculture, Food and Nutrition Service, Office of Analysis and Evaluation, Characteristics of Food Stamp Households: Fiscal Year 1996 and earlier years.
- The percentage of food stamp households with earnings has stayed in a range of 18 to 23 percent, with an average over the years of 20 percent. Correspondingly, the percentage with gross monthly income below the poverty level has ranged from a low of 87 percent in 1980 to a high of 95 percent in the recession year 1982. During the 1990s, it has stayed almost constant at around 92 percent.
- The percentage of households receiving food stamps with children has also been fairly constant at a little over 60 percent.
- The percentage of food stamp households with public assistance income has ranged from a low of 65 percent in 1980 to a high of 73 percent in the recession year 1990.
Table A-16. Characteristics of Food Stamp Households, 1980 - 1996
[In percent]
| Year | |||||||||
|---|---|---|---|---|---|---|---|---|---|
| 19801 | 19821 | 19841 | 19861 | 19881 | 19901 | 19921 | 19941 | 19961 | |
|
1 Survey was conducted in August in the years 1980-84 and during the summer in the years from 1986 to the present. 2 Public assistance income includes AFDC, SSI, and general assistance. 3 In 1996 female heads of household with children whose spouse is present comprised about 7 percent of all female heads of household with children. 4 Elderly members and heads of household include those age 60 or older. * Less than 0.5 percent. Source: U.S. Department of Agriculture, Food and Nutrition Service, Office of Analysis and Evaluation, Characteristics of Food Stamp Households, Fiscal Year 1996 and earlier years. |
|||||||||
| With Gross Monthly Income: | |||||||||
| Below the Federal Poverty Levels | 87 | 95 | 93 | 93 | 92 | 92 | 92 | 90 | 91 |
| Between the Poverty Levels and 130 Percent of the Poverty Levels | 10 | 5 | 6 | 6 | 8 | 8 | 8 | 9 | 8 |
| Above 130 Percent of Poverty | 2 | * | 1 | * | * | * | * | 1 | 1 |
| With Earnings | 19 | 18 | 19 | 21 | 20 | 19 | 21 | 21 | 23 |
| With Public Assistance Income2 | 65 | 69 | 71 | 69 | 72 | 73 | 66 | 69 | 67 |
| With AFDC/TANF Income | NA | 42 | 42 | 38 | 42 | 43 | 40 | 38 | 37 |
| With SSI Income | 18 | 18 | 18 | 18 | 20 | 19 | 19 | 23 | 24 |
| With Children | 60 | 58 | 61 | 61 | 61 | 61 | 62 | 61 | 60 |
| And Female Heads of Household | NA | 45 | 47 | 48 | 50 | 51 | 51 | 51 | 50 |
| With No Spouse Present3 | NA | NA | NA | NA | 39 | 37 | 44 | 43 | 43 |
| With Elderly Members4 | 23 | 20 | 22 | 20 | 19 | 18 | 15 | 16 | 16 |
| With Elderly Female Heads of Household4 | NA | 14 | 16 | 15 | 14 | 11 | 9 | 11 | NA |
| Average Household Size | 2.8 | 2.8 | 2.8 | 2.7 | 2.6 | 2.6 | 2.5 | 2.5 | 2.5 |
Table A-17. Value of Food Stamps Issued by State, Selected Fiscal Years 1977 – 1997
[Millions of dollars]
| 1977 | 1981 | 1985 | 1989 | 1992 | 1994 | 1996 | 1997 | |
|---|---|---|---|---|---|---|---|---|
| United States1 | $5,067 | $10,630 | $11,556 | $12,572 | $21,883 | $23,796 | $23,607 | $20,700 |
|
1 Totals include small amounts not allocated to individual states: $6 million in 1977, $26 million in 1985, and $4 million in 1992. Source: U.S. Department of Agriculture, Food and Nutrition Service, unpublished data from the National Data Bank. |
||||||||
| Alabama | $99 | $293 | $318 | $276 | $451 | $456 | $443 | $393 |
| Alaska | 5 | 31 | 25 | 24 | 41 | 53 | 54 | 52 |
| Arizona | 45 | 125 | 121 | 176 | 377 | 418 | 377 | 316 |
| Arkansas | 66 | 138 | 126 | 130 | 207 | 212 | 225 | 214 |
| California | 333 | 604 | 639 | 747 | 1,760 | 2,395 | 2,559 | 2,378 |
| Colorado | 48 | 88 | 94 | 133 | 219 | 224 | 211 | 182 |
| Connecticut | 45 | 71 | 62 | 53 | 131 | 152 | 175 | 170 |
| Delaware | 26 | 27 | 22 | 19 | 42 | 48 | 95 | 91 |
| Dist. of Columbia | 8 | 47 | 40 | 36 | 70 | 86 | 47 | 41 |
| Florida | 261 | 502 | 368 | 455 | 1,306 | 1,324 | 1,296 | 1,061 |
| Georgia | 9 | 306 | 290 | 302 | 627 | 695 | 27 | 27 |
| Guam | 143 | 18 | 18 | 14 | 28 | 22 | 706 | 597 |
| Hawaii | 35 | 69 | 93 | 74 | 121 | 153 | 195 | 189 |
| Idaho | 285 | 35 | 36 | 37 | 53 | 57 | 1,034 | 933 |
| Illinois | 59 | 506 | 713 | 729 | 1,070 | 1,069 | 330 | 293 |
| Indiana | 29 | 204 | 242 | 185 | 373 | 415 | 141 | 125 |
| Iowa | 10 | 75 | 107 | 97 | 143 | 145 | 61 | 53 |
| Kansas | 15 | 52 | 64 | 80 | 133 | 146 | 135 | 112 |
| Kentucky | 126 | 268 | 332 | 300 | 430 | 416 | 418 | 372 |
| Louisiana | 134 | 270 | 365 | 484 | 677 | 642 | 597 | 512 |
| Maine | 29 | 69 | 62 | 48 | 109 | 111 | 115 | 103 |
| Maryland | 84 | 171 | 171 | 176 | 316 | 350 | 365 | 320 |
| Massachusetts | 147 | 191 | 173 | 154 | 315 | 330 | 294 | 262 |
| Michigan | 132 | 395 | 541 | 537 | 846 | 834 | 774 | 678 |
| Minnesota | 42 | 84 | 105 | 131 | 234 | 229 | 224 | 192 |
| Mississippi | 106 | 235 | 264 | 319 | 421 | 397 | 376 | 313 |
| Missouri | 69 | 183 | 212 | 255 | 447 | 482 | 482 | 401 |
| Montana | 9 | 23 | 31 | 36 | 52 | 56 | 59 | 55 |
| Nebraska | 11 | 31 | 44 | 50 | 78 | 79 | 78 | 72 |
| Nevada | 6 | 21 | 22 | 31 | 74 | 88 | 92 | 74 |
| New Hampshire | 13 | 27 | 15 | 12 | 45 | 46 | 42 | 35 |
| New Jersey | 157 | 280 | 260 | 232 | 433 | 486 | 513 | 449 |
| New Mexico | 40 | 90 | 88 | 100 | 182 | 194 | 200 | 168 |
| New York | 404 | 875 | 938 | 930 | 1,586 | 1,945 | 2,044 | 1,780 |
| North Carolina | 133 | 272 | 237 | 228 | 461 | 490 | 552 | 478 |
| North Dakota | 4 | 12 | 16 | 21 | 35 | 34 | 32 | 29 |
| Ohio | 262 | 508 | 697 | 751 | 1,102 | 1,076 | 944 | 750 |
| Oklahoma | 37 | 82 | 134 | 159 | 275 | 305 | 307 | 256 |
| Oregon | 42 | 133 | 142 | 150 | 226 | 241 | 260 | 216 |
| Pennsylvania | 204 | 490 | 547 | 554 | 916 | 1,001 | 983 | 865 |
| Puerto Rico | 581 | 879 | 786 | 871 | 973 | 1,050 | 1,102 | 1,134 |
| Rhode Island | 18 | 41 | 35 | 33 | 69 | 76 | 78 | 70 |
| South Carolina | 89 | 212 | 194 | 167 | 297 | 303 | 299 | 281 |
| South Dakota | 7 | 21 | 26 | 31 | 42 | 41 | 41 | 39 |
| Tennessee | 134 | 339 | 280 | 312 | 562 | 600 | 545 | 475 |
| Texas | 255 | 600 | 701 | 1,098 | 2,103 | 2,320 | 2,147 | 1,765 |
| Utah | 9 | 30 | 40 | 61 | 96 | 94 | 87 | 78 |
| Vermont | 11 | 22 | 20 | 17 | 37 | 44 | 43 | 40 |
| Virgin Islands | 12 | 21 | 23 | 14 | 19 | 23 | 451 | 25 |
| Virginia | 70 | 201 | 189 | 206 | 406 | 448 | 42 | 379 |
| Washington | 63 | 135 | 140 | 191 | 344 | 386 | 429 | 387 |
| West Virginia | 60 | 122 | 159 | 169 | 255 | 261 | 253 | 239 |
| Wisconsin | 38 | 99 | 148 | 157 | 236 | 220 | 200 | 158 |
| Wyoming | 3 | 7 | 15 | 18 | 26 | 27 | 28 | 23 |
Table A-18. Average Number of Food Stamp Recipients by State, Selected Fiscal Years 1977 – 1997
[In thousands]
| 1977 | 1981 | 1985 | 1989 | 1992 | 1994 | 1996 | 1997 | Percent Change | ||
|---|---|---|---|---|---|---|---|---|---|---|
| 1989-93 | 1993-97 | |||||||||
| United States | 17,014 | 22,430 | 21,379 | 20,266 | 26,886 | 28,879 | 26,870 | 24,156 | 40 | -15 |
| Source: U.S. Department of Agriculture, Food and Nutrition Service, unpublished data from the National Data Bank. | ||||||||||
| Alabama | 316 | 605 | 588 | 436 | 550 | 545 | 509 | 469 | 29 | -16 |
| Alaska | 11 | 32 | 22 | 26 | 38 | 46 | 46 | 45 | 65 | 5 |
| Arizona | 140 | 210 | 206 | 264 | 457 | 512 | 427 | 364 | 85 | -26 |
| Arkansas | 213 | 305 | 253 | 227 | 277 | 283 | 274 | 266 | 25 | -7 |
| California | 1,345 | 1,605 | 1,615 | 1,776 | 2,558 | 3,155 | 3,143 | 2,815 | 61 | -2 |
| Colorado | 147 | 175 | 170 | 211 | 260 | 268 | 244 | 217 | 29 | -20 |
| Connecticut | 178 | 175 | 145 | 114 | 202 | 223 | 223 | 210 | 90 | -3 |
| Delaware | 26 | 56 | 40 | 30 | 51 | 59 | 58 | 54 | 95 | -7 |
| Dist. of Columbia | 98 | 101 | 72 | 58 | 82 | 91 | 93 | 90 | 48 | 4 |
| Florida | 728 | 957 | 630 | 668 | 1,404 | 1,474 | 1,371 | 1,192 | 125 | -21 |
| Georgia | 459 | 654 | 567 | 485 | 754 | 830 | 793 | 698 | 67 | -14 |
| Guam | 22 | 25 | 20 | 13 | 20 | 15 | 18 | 18 | 0 | 41 |
| Hawaii | 108 | 104 | 99 | 78 | 94 | 115 | 130 | 127 | 32 | 23 |
| Idaho | 33 | 64 | 59 | 61 | 72 | 82 | 80 | 70 | 30 | -11 |
| Illinois | 922 | 984 | 1,110 | 990 | 1,156 | 1,189 | 1,105 | 1,020 | 19 | -14 |
| Indiana | 196 | 405 | 406 | 285 | 448 | 518 | 390 | 348 | 74 | -30 |
| Iowa | 108 | 163 | 203 | 168 | 192 | 196 | 177 | 161 | 17 | -18 |
| Kansas | 62 | 108 | 119 | 128 | 175 | 192 | 172 | 149 | 47 | -21 |
| Kentucky | 394 | 519 | 560 | 447 | 529 | 522 | 486 | 444 | 19 | -16 |
| Louisiana | 425 | 574 | 644 | 725 | 779 | 756 | 670 | 575 | 7 | -26 |
| Maine | 101 | 140 | 114 | 84 | 133 | 136 | 131 | 124 | 64 | -11 |
| Maryland | 255 | 346 | 287 | 249 | 342 | 390 | 375 | 354 | 51 | -5 |
| Massachusetts | 579 | 437 | 337 | 314 | 429 | 442 | 374 | 340 | 41 | -23 |
| Michigan | 635 | 942 | 985 | 874 | 994 | 1,031 | 935 | 839 | 17 | -18 |
| Minnesota | 158 | 202 | 228 | 245 | 309 | 318 | 295 | 260 | 29 | -18 |
| Mississippi | 333 | 514 | 495 | 493 | 536 | 511 | 457 | 399 | 9 | -26 |
| Missouri | 221 | 378 | 362 | 404 | 549 | 593 | 554 | 478 | 46 | -19 |
| Montana | 27 | 47 | 58 | 56 | 66 | 71 | 71 | 67 | 26 | -5 |
| Nebraska | 40 | 75 | 94 | 92 | 107 | 111 | 102 | 97 | 23 | -14 |
| Nevada | 18 | 37 | 32 | 41 | 80 | 97 | 97 | 82 | 126 | -12 |
| New Hampshire | 44 | 54 | 28 | 22 | 58 | 62 | 53 | 46 | 176 | -24 |
| New Jersey | 493 | 608 | 464 | 353 | 494 | 545 | 540 | 490 | 50 | -8 |
| New Mexico | 118 | 183 | 157 | 151 | 221 | 244 | 235 | 205 | 62 | -16 |
| New York | 1,646 | 1,851 | 1,834 | 1,463 | 1,885 | 2,154 | 2,099 | 1,914 | 40 | -6 |
| North Carolina | 428 | 605 | 474 | 390 | 597 | 630 | 631 | 586 | 61 | -6 |
| North Dakota | 15 | 29 | 33 | 39 | 46 | 45 | 40 | 38 | 25 | -22 |
| Ohio | 803 | 976 | 1,133 | 1,068 | 1,251 | 1,245 | 1,045 | 874 | 19 | -31 |
| Oklahoma | 158 | 206 | 263 | 261 | 346 | 376 | 354 | 322 | 42 | -13 |
| Oregon | 153 | 232 | 228 | 213 | 265 | 286 | 288 | 259 | 33 | -9 |
| Pennsylvania | 843 | 1,071 | 1,032 | 916 | 1,137 | 1,208 | 1,124 | 1,009 | 29 | -15 |
| Puerto Rico | 1,472 | 1,805 | 1,480 | 1,460 | 1,480 | 1,410 | 1,330 | e 1,306 | -1 | -9 |
| Rhode Island | 79 | 88 | 69 | 57 | 87 | 94 | 91 | 85 | 62 | -8 |
| South Carolina | 280 | 443 | 373 | 272 | 369 | 385 | 358 | 349 | 45 | -11 |
| South Dakota | 26 | 46 | 48 | 50 | 55 | 53 | 49 | 47 | 11 | -16 |
| Tennessee | 392 | 677 | 518 | 500 | 702 | 735 | 638 | 586 | 55 | -24 |
| Texas | 823 | 1,226 | 1,263 | 1,634 | 2,454 | 2,726 | 2,372 | 2,034 | 63 | -23 |
| Utah | 36 | 65 | 75 | 95 | 123 | 128 | 110 | 98 | 40 | -26 |
| Vermont | 46 | 48 | 44 | 34 | 54 | 65 | 56 | 53 | 70 | -9 |
| Virgin Islands | 25 | 34 | 32 | 16 | 16 | 20 | 31 | 20 | 8 | 15 |
| Virginia | 240 | 432 | 360 | 333 | 495 | 547 | 538 | 476 | 61 | -11 |
| Washington | 212 | 271 | 281 | 321 | 431 | 468 | 476 | 442 | 44 | -5 |
| West Virginia | 199 | 252 | 278 | 259 | 310 | 321 | 300 | 287 | 24 | -11 |
| Wisconsin | 175 | 269 | 363 | 291 | 334 | 330 | 283 | 232 | 16 | -31 |
| Wyoming | 9 | 15 | 27 | 27 | 33 | 34 | 33 | 29 | 25 | -16 |
Table A-19. Food Stamp Recipiency Rates by State, Selected Fiscal Years 1977 – 1997
[In percent]
| 1977 | 1981 | 1985 | 1989 | 1992 | 1994 | 1996 | 1997 | Percent Change | ||
|---|---|---|---|---|---|---|---|---|---|---|
| 1989-93 | 1993-97 | |||||||||
|
Note: Recipiency rate refers to the average monthly number of food stamp recipients in each State during the particular fiscal year expressed as a percent of the total resident population as of July 1 of that year. The numerator is from Table A-18. Source: U.S. Department of Agriculture, Food and Nutrition Service, unpublished data from the National Data Bank and U.S. Bureau of the Census, (Resident population by state available online at http://www.census.gov/population/estimates/state/). |
||||||||||
| Alabama | 8.4 | 15.4 | 14.8 | 10.8 | 13.3 | 12.9 | 11.9 | 10.9 | 24 | -19 |
| Alaska | 2.7 | 7.7 | 4.1 | 4.8 | 6.4 | 7.6 | 7.6 | 7.4 | 51 | 3 |
| Arizona | 5.8 | 7.5 | 6.5 | 7.3 | 11.8 | 12.3 | 9.6 | 8.0 | 68 | -35 |
| Arkansas | 9.7 | 13.3 | 10.9 | 9.7 | 11.6 | 11.5 | 10.9 | 10.5 | 21 | -10 |
| California | 6.0 | 6.6 | 6.1 | 6.1 | 8.3 | 10.1 | 9.9 | 8.7 | 51 | -5 |
| Colorado | 5.5 | 5.9 | 5.3 | 6.5 | 7.5 | 7.3 | 6.4 | 5.6 | 19 | -27 |
| Connecticut | 5.8 | 5.6 | 4.5 | 3.5 | 6.2 | 6.8 | 6.8 | 6.4 | 90 | -3 |
| Delaware | 4.5 | 9.3 | 6.5 | 4.5 | 7.3 | 8.4 | 8.0 | 7.3 | 84 | -12 |
| Dist. of Columbia | 14.5 | 15.9 | 11.4 | 9.4 | 14.1 | 16.0 | 17.2 | 17.1 | 60 | 14 |
| Florida | 8.2 | 9.4 | 5.5 | 5.3 | 10.4 | 10.6 | 9.5 | 8.1 | 107 | -26 |
| Georgia | 8.8 | 11.7 | 9.5 | 7.6 | 11.2 | 11.8 | 10.8 | 9.3 | 55 | -20 |
| Hawaii | 11.8 | 10.6 | 9.5 | 7.1 | 8.2 | 9.8 | 11.0 | 10.7 | 24 | 21 |
| Idaho | 3.8 | 6.7 | 5.9 | 6.1 | 6.7 | 7.2 | 6.7 | 5.8 | 17 | -19 |
| Illinois | 8.1 | 8.6 | 9.7 | 8.7 | 10.0 | 10.1 | 9.3 | 8.6 | 16 | -15 |
| Indiana | 3.6 | 7.4 | 7.4 | 5.2 | 7.9 | 9.0 | 6.7 | 5.9 | 69 | -32 |
| Iowa | 3.7 | 5.6 | 7.2 | 6.1 | 6.9 | 6.9 | 6.2 | 5.7 | 15 | -19 |
| Kansas | 2.7 | 4.5 | 4.9 | 5.2 | 6.9 | 7.5 | 6.7 | 5.7 | 44 | -23 |
| Kentucky | 11.0 | 14.2 | 15.2 | 12.1 | 14.1 | 13.7 | 12.5 | 11.4 | 15 | -19 |
| Louisiana | 10.6 | 13.4 | 14.6 | 17.0 | 18.2 | 17.6 | 15.4 | 13.2 | 7 | -27 |
| Maine | 9.2 | 12.4 | 9.8 | 6.9 | 10.7 | 11.0 | 10.6 | 10.0 | 62 | -11 |
| Maryland | 6.1 | 8.1 | 6.5 | 5.3 | 7.0 | 7.8 | 7.4 | 7.0 | 44 | -8 |
| Massachusetts | 10.1 | 7.6 | 5.7 | 5.2 | 7.2 | 7.3 | 6.1 | 5.5 | 41 | -25 |
| Michigan | 6.9 | 10.2 | 10.8 | 9.4 | 10.5 | 10.8 | 9.6 | 8.6 | 14 | -20 |
| Minnesota | 4.0 | 4.9 | 5.5 | 5.7 | 6.9 | 7.0 | 6.3 | 5.6 | 24 | -21 |
| Mississippi | 13.5 | 20.3 | 19.1 | 19.1 | 20.5 | 19.2 | 16.9 | 14.6 | 6 | -28 |
| Missouri | 4.5 | 7.7 | 7.2 | 7.9 | 10.6 | 11.2 | 10.3 | 8.8 | 42 | -22 |
| Montana | 3.6 | 5.9 | 7.1 | 7.0 | 8.1 | 8.3 | 8.1 | 7.6 | 20 | -9 |
| Nebraska | 2.6 | 4.7 | 5.9 | 5.9 | 6.7 | 6.8 | 6.2 | 5.9 | 20 | -17 |
| Nevada | 2.7 | 4.4 | 3.4 | 3.6 | 6.0 | 6.6 | 6.0 | 4.9 | 86 | -27 |
| New Hampshire | 5.1 | 5.8 | 2.8 | 2.0 | 5.2 | 5.4 | 4.6 | 3.9 | 172 | -27 |
| New Jersey | 6.7 | 8.2 | 6.1 | 4.6 | 6.3 | 6.9 | 6.8 | 6.1 | 48 | -10 |
| New Mexico | 9.7 | 13.7 | 10.9 | 10.0 | 14.0 | 14.7 | 13.7 | 11.8 | 51 | -22 |
| New York | 9.2 | 10.5 | 10.3 | 8.1 | 10.4 | 11.9 | 11.6 | 10.6 | 39 | -6 |
| North Carolina | 7.5 | 10.2 | 7.6 | 5.9 | 8.7 | 8.9 | 8.6 | 7.9 | 52 | -12 |
| North Dakota | 2.4 | 4.4 | 4.9 | 6.0 | 7.2 | 7.1 | 6.2 | 5.9 | 27 | -22 |
| Ohio | 7.5 | 9.1 | 10.6 | 9.9 | 11.4 | 11.2 | 9.4 | 7.8 | 16 | -32 |
| Oklahoma | 5.5 | 6.7 | 8.0 | 8.3 | 10.8 | 11.6 | 10.7 | 9.7 | 39 | -15 |
| Oregon | 6.3 | 8.7 | 8.5 | 7.6 | 8.9 | 9.3 | 9.0 | 8.0 | 22 | -14 |
| Pennsylvania | 7.1 | 9.0 | 8.8 | 7.7 | 9.5 | 10.0 | 9.3 | 8.4 | 28 | -15 |
| Rhode Island | 8.3 | 9.3 | 7.2 | 5.7 | 8.7 | 9.4 | 9.2 | 8.6 | 63 | -7 |
| South Carolina | 9.4 | 13.9 | 11.3 | 7.9 | 10.3 | 10.5 | 9.6 | 9.3 | 38 | -15 |
| South Dakota | 3.8 | 6.6 | 6.9 | 7.2 | 7.6 | 7.3 | 6.6 | 6.4 | 7 | -18 |
| Tennessee | 8.9 | 14.6 | 11.0 | 10.3 | 14.0 | 14.2 | 12.0 | 10.9 | 48 | -28 |
| Texas | 6.2 | 8.3 | 7.8 | 9.7 | 13.9 | 14.8 | 12.4 | 10.5 | 51 | -29 |
| Utah | 2.7 | 4.3 | 4.6 | 5.6 | 6.8 | 6.6 | 5.5 | 4.8 | 27 | -32 |
| Vermont | 9.4 | 9.4 | 8.2 | 6.1 | 9.4 | 11.1 | 9.6 | 9.0 | 65 | -11 |
| Virginia | 4.6 | 7.9 | 6.3 | 5.4 | 7.8 | 8.4 | 8.1 | 7.1 | 52 | -15 |
| Washington | 5.6 | 6.4 | 6.4 | 6.8 | 8.4 | 8.8 | 8.6 | 7.9 | 30 | -11 |
| West Virginia | 10.4 | 12.9 | 14.6 | 14.3 | 17.1 | 17.7 | 16.5 | 15.8 | 24 | -11 |
| Wisconsin | 3.8 | 5.7 | 7.6 | 6.0 | 6.7 | 6.5 | 5.5 | 4.5 | 12 | -33 |
| Wyoming | 2.1 | 3.0 | 5.4 | 6.0 | 7.2 | 7.2 | 6.9 | 6.0 | 23 | -18 |
| United States | 7.1 | 9.0 | 8.3 | 7.6 | 9.9 | 10.5 | 9.6 | 8.5 | 37 | -18 |
Supplemental Security Income
The Supplemental Security Income (SSI) Program is a means tested, federally administered income assistance program authorized by title XVI of the Social Security Act. Established in 1972 (Public Law 92-603) and begun in 1974, SSI provides monthly cash payments in accordance with uniform, nationwide eligibility requirements to needy aged, blind and disabled persons. To qualify for SSI payments, a person must satisfy the program criteria for age, blindness or disability. Children may qualify for SSI if they are under age 18, unmarried, and meet the applicable SSI disability or blindness, income and resource requirements. Individuals and couples are eligible for SSI if their countable incomes fall below the Federal maximum monthly SSI benefit levels, which were $484 for an individual and $726 for a couple in fiscal year 1997. SSI eligibility is restricted to qualified persons who have countable resources/assets of not more than $2,000, or $3,000 for a couple.
SSI law requires that SSI applicants file for all other money benefits for which they may be entitled. Since its inception, SSI has been viewed as the “program of last resort”-- after evaluating all other income, SSI pays what is necessary to bring an individual to the statutorily prescribed income “floor.” (The Social Security Administration, which administers the SSI program, works with recipients and helps them get any other benefits for which they are eligible.) As of December 1996, 37 percent of all SSI recipients also received Social Security benefits; Social Security benefits are the single highest source of income for SSI recipients.
No individual could receive both SSI payments and AFDC benefits; if eligible for both, the individual was required to choose which benefit to receive. Generally, the AFDC agency encouraged individuals to file for SSI and, once the SSI payments had started, the individual was removed from the AFDC filing unit. The PRWORA does not specifically prohibit an individual’s receipt of both TANF benefits and SSI; states have complete authority to set TANF eligibility standards and benefit levels.
Except in California, which converted food stamp benefits to cash that is included in the State supplementary payment, SSI recipients may be eligible to receive food stamps. If all household members receive SSI, they do not need to meet the Food Stamp Program financial eligibility standards to participate in the program because they are categorically eligible. If SSI beneficiaries live in households where other household members do not receive SSI benefits, the household must meet the net income eligibility standard of the Food Stamp Program to be eligible for food stamp benefits.
Recent Legislative Changes. Several legislative changes made in the 104th Congress are likely to affect Supplemental Security Income (SSI) participation and expenditures. Public Law 104-121, the Contract with America Advancement Act of 1996, prohibits SSI eligibility to individuals whose drug addiction and/or alcoholism (DAA) is a contributing factor material to the finding of disability. This provision applied to individuals who filed for benefits on or after the date of enactment (March 29, 1996) and to individuals whose claims were finally adjudicated on or after the date of enactment. It applied to current beneficiaries on January 1, 1997.
The PRWORA made several changes designed to maintain the SSI program’s goal of providing benefits for severely disabled children while preventing children without serious impairments from receiving benefits. First, the act replaced the former law “comparable severity” test with a new definition of childhood disability based on a medically determinable physical or mental impairment. Second, it discontinued use of the Individualized Functional Assessment (IFA) which authorized subjective judgment to determine children’s eligibility for SSI. Third, it eliminated references to “maladaptive behavior” in the Listings of Impairments (among medical criteria for evaluation of mental and emotional disorders in the domain of personal/behavioral function). The latter two provisions were effective for all new and pending applications upon enactment (August 22, 1996). Current beneficiaries receiving benefits due to an IFA or maladaptive behavior listing received notice no later than January 1, 1997, that their benefits might end when their case is redetermined. All currently receiving benefits are subject to redetermination using the new eligibility criteria by February 28, 1998 (per P.L. 105-33, enacted August 5, 1997).
Title IV of PRWORA also made significant changes in the eligibility of noncitizens for SSI benefits. Essentially, qualified aliens (including legal immigrants) are barred from SSI. Some of the restrictions were subsequently moderated, most notably by the Balanced Budget Act of 1997 (Public Law 105-33), which grandfathered immigrants who were receiving SSI at the time of enactment of the PRWORA.
SSI Program Data. The following six tables and two figures provide SSI program data:
- Tables A-20 through A-23 present national caseload and expenditure trend data on the SSI program;
- Figures A-6 and A-7 present some demographic characteristics of the SSI caseload; and
- Tables A-24 through A-26 present some state-by-state trend data on the SSI program through fiscal year 1996.
Table A-20 presents information on the number of persons receiving SSI payments in December of each year from 1974 through 1997. Data on the total number of SSI recipients are shown, as well as recipients by eligibility category (aged, blind and disabled) and by type of recipient (child, adult age 18-64, and adult age 65 or older). From 1990 to 1994, growth in the total number of beneficiaries averaged 370 thousand per year, almost 6.5 percent per year. The increase slowed in 1995 and 1996, with the number of recipients peaking at 6.6 million beneficiaries in December 1996. In 1997 growth stopped and the number of recipients declined slightly, to 6.5 million in December 1997.
Recent trends in the changing composition of the SSI caseload continued through 1997, as shown in Table A-22. The number of aged beneficiaries continued to decline, both as an absolute number (from a high of 2.3 million persons in December 1975 to less than 1.4 million in December 1997) and as a proportion of the SSI caseload. The number of aged, as a percentage of all SSI participants, has dropped steadily, from 60.6 percent in December 1974 to 31.6 percent in December 1997. This relative decline is a result of very little change in the number of aged participants between December 1990 and December 1997 while the number of persons 18 to 64 receiving benefits grew by 45 percent during the same time period. Moreover, the number of children increased by 177 percent, from 340 thousand to 943 thousand, bringing them from 7 percent of the SSI caseload in 1990 to 15 percent in 1997. Many analysts attribute this growth to outreach activities, the Supreme Court decision in the Zebley case4, expansion of the medical impairment category, and reduction in reviews of continuing eligibility.
Table A-20. Number of Persons Receiving Federally Administered SSI Payments 1974 – 1997
[In thousands]
| Date | Total | Eligibility Category | Type of Recipient | |||||
|---|---|---|---|---|---|---|---|---|
| Aged | Blind and Disabled | Children1 | Adults | |||||
| Total | Blind | Disabled | Age 18-64 | 65 or Older | ||||
|
1 Includes students 18-21; there were 50,661 students 18-21 in December 1997. Source: Social Security Administration, Office of Research, Evaluation, and Statistics, (Data available online at http://www.ssa.gov/statistics/ores_home.html). |
||||||||
| Dec 1974 | 3,996 | 2,286 | 1,710 | 75 | 1,636 | 71 | 1,503 | 2,422 |
| Dec 1975 | 4,314 | 2,307 | 2,007 | 74 | 1,933 | 128 | 1,678 | 2,508 |
| Dec 1976 | 4,236 | 2,148 | 2,088 | 76 | 2,012 | 153 | 1,686 | 2,397 |
| Dec 1977 | 4,238 | 2,051 | 2,187 | 77 | 2,109 | 175 | 1,709 | 2,353 |
| Dec 1978 | 4,217 | 1,968 | 2,249 | 77 | 2,172 | 197 | 1,716 | 2,304 |
| Dec 1979 | 4,150 | 1,872 | 2,278 | 77 | 2,201 | 212 | 1,692 | 2,246 |
| Dec 1980 | 4,142 | 1,808 | 2,334 | 78 | 2,256 | 229 | 1,693 | 2,221 |
| Dec 1981 | 4,019 | 1,678 | 2,341 | 79 | 2,262 | 230 | 1,668 | 2,121 |
| Dec 1982 | 3,858 | 1,549 | 2,309 | 77 | 2,231 | 229 | 1,618 | 2,011 |
| Dec 1983 | 3,901 | 1,515 | 2,386 | 79 | 2,307 | 236 | 1,662 | 2,003 |
| Dec 1984 | 4,029 | 1,530 | 2,499 | 81 | 2,419 | 249 | 1,743 | 2,037 |
| Dec 1985 | 4,138 | 1,504 | 2,634 | 82 | 2,551 | 265 | 1,841 | 2,031 |
| Dec 1986 | 4,269 | 1,473 | 2,796 | 83 | 2,713 | 280 | 1,972 | 2,018 |
| Dec 1987 | 4,385 | 1,455 | 2,930 | 83 | 2,846 | 289 | 2,081 | 2,015 |
| Dec 1988 | 4,464 | 1,433 | 3,030 | 83 | 2,948 | 290 | 2,168 | 2,006 |
| Dec 1989 | 4,593 | 1,439 | 3,154 | 83 | 3,071 | 296 | 2,271 | 2,026 |
| Dec 1990 | 4,817 | 1,454 | 3,363 | 84 | 3,279 | 340 | 2,418 | 2,059 |
| Dec 1991 | 5,118 | 1,465 | 3,654 | 85 | 3,569 | 439 | 2,600 | 2,080 |
| Dec 1992 | 5,566 | 1,471 | 4,095 | 85 | 4,010 | 624 | 2,843 | 2,100 |
| Dec 1993 | 5,984 | 1,475 | 4,509 | 85 | 4,424 | 771 | 3,101 | 2,113 |
| Dec 1994 | 6,296 | 1,466 | 4,830 | 85 | 4,745 | 893 | 3,284 | 2,119 |
| Dec 1995 | 6,514 | 1,446 | 5,068 | 84 | 4,984 | 974 | 3,425 | 2,115 |
| Dec 1996 | 6,614 | 1,413 | 5,201 | 82 | 5,119 | 1,018 | 3,506 | 2,090 |
| Dec 1997 | 6,495 | 1,362 | 5,133 | 81 | 5,052 | 943 | 3,499 | 2,054 |
Table A-21. Federal and State SSI Benefit Payments, 1974 – 1997 1
[In millions of current and 1997 dollars]
| Calender Year | Total Benefits | Federal Payments | State Supplementation | Administrative Costs (fiscal year) |
|||
|---|---|---|---|---|---|---|---|
| 19972 Dollars | Current Dollars | Total | Federally Administered | State Administered | |||
|
1 Payments and adjustments during the respective year but not necessarily accrued for that year. 2 Data adjusted for inflation by ASPE using the CPI-U-X1. Source: Social Security Administration, Office of SSI, and Office of Budget, Social Security Bulletin, Annual Statistical Supplement, 1998 (available online at http://www.ssa.gov/statistics/ores_home.html). |
|||||||
| 1974 | $16,222 | $5,246 | $3,833 | $1,413 | $1,264 | $149 | $285 |
| 1975 | 16,787 | 5,878 | 4,314 | 1,565 | 1,403 | 162 | 399 |
| 1976 | 16,390 | 6,066 | 4,512 | 1,554 | 1,388 | 166 | 500 |
| 1977 | 16,014 | 6,306 | 4,703 | 1,603 | 1,431 | 172 | NA |
| 1978 | 15,579 | 6,552 | 4,881 | 1,671 | 1,491 | 180 | 539 |
| 1979 | 15,345 | 7,075 | 5,279 | 1,797 | 1,590 | 207 | 610 |
| 1980 | 15,486 | 7,941 | 5,866 | 2,074 | 1,848 | 226 | 668 |
| 1981 | 15,307 | 8,593 | 6,518 | 2,076 | 1,839 | 237 | 718 |
| 1982 | 15,078 | 8,981 | 6,907 | 2,074 | 1,798 | 276 | 779 |
| 1983 | 15,154 | 9,404 | 7,423 | 1,982 | 1,711 | 270 | 830 |
| 1984 | 16,022 | 10,372 | 8,281 | 2,091 | 1,792 | 299 | 864 |
| 1985 | 16,498 | 11,060 | 8,777 | 2,283 | 1,973 | 311 | 953 |
| 1986 | 17,692 | 12,081 | 9,498 | 2,583 | 2,243 | 340 | 1,022 |
| 1987 | 18,298 | 12,951 | 10,029 | 2,922 | 2,563 | 359 | 976 |
| 1988 | 18,704 | 13,786 | 10,734 | 3,052 | 2,671 | 381 | 975 |
| 1989 | 19,389 | 14,980 | 11,606 | 3,374 | 2,955 | 419 | 1,051 |
| 1990 | 20,383 | 16,599 | 12,894 | 3,705 | 3,239 | 466 | 1,075 |
| 1991 | 21,829 | 18,524 | 14,765 | 3,759 | 3,231 | 529 | 1,257 |
| 1992 | 25,433 | 22,233 | 18,247 | 3,986 | 3,435 | 550 | 1,538 |
| 1993 | 27,276 | 24,557 | 20,722 | 3,835 | 3,270 | 566 | 1,467 |
| 1994 | 28,024 | 25,877 | 22,175 | 3,701 | 3,116 | 585 | 1,775 |
| 1995 | 29,096 | 27,628 | 23,919 | 3,708 | 3,118 | 590 | 1,973 |
| 1996 | 29,453 | 28,792 | 25,265 | 3,527 | 2,988 | 539 | 1,949 |
| 1997 | 29,052 | 29,052 | 25,457 | 3,595 | 2,913 | 682 | 2,055 |
Table A-22. Average Monthly SSI Benefit Payments, 1974 – 1997
| Calender Year | Total1 | Federal Payments | State Supplementation | |||
|---|---|---|---|---|---|---|
| 1997 Dollars | Current Dollars | Total | Federally Administered | State Administered | ||
| 1974 | $440 | $135 | $108 | $64 | $71 | $35 |
| 1975 | 313 | 112 | 92 | 66 | 69 | 45 |
| 1980 | 297 | 158 | 133 | 89 | 91 | 76 |
| 1984 | 323 | 211 | 187 | 93 | 93 | 93 |
| 1985 | 324 | 219 | 193 | 99 | 99 | 102 |
| 1986 | 338 | 232 | 202 | 107 | 108 | 101 |
| 1987 | 338 | 242 | 208 | 117 | 118 | 110 |
| 1988 | 339 | 253 | 219 | 118 | 118 | 118 |
| 1989 | 342 | 267 | 230 | 126 | 126 | 127 |
| 1990 | 341 | 283 | 244 | 132 | 131 | 136 |
| 1991 | 347 | 297 | 260 | 125 | 122 | 143 |
| 1992 | 373 | 328 | 292 | 124 | 121 | 147 |
| 1993 | 373 | 337 | 306 | 112 | 107 | 150 |
| 1994 | 364 | 338 | 310 | 105 | 99 | 152 |
| 1995 | 368 | 350 | 322 | 110 | 103 | 164 |
| 1996 | 366 | 359 | 332 | 108 | 103 | 145 |
| 1997 | 369 | 369 | 342 | 99 | 102 | 86 |
| Calender Year | Number of PersonsReceiving Payments (in thousands) | ||||
|---|---|---|---|---|---|
| Total | Federal | State Supplementation | |||
| Total | Federally Administered | State Administered | |||
|
1 Total is a weighted average of the Federal plus State average benefit, the Federal-only average benefit, and Stateonly Note: The numerators for these averages are given in Table A-21. Averages were computed by DHHS. Data adjusted for inflation using the monthly values of the CPI-U-X1 index. Source: Number of persons receiving payments obtained from Social Security Administration, Office of SSI, and Office of Budget. |
|||||
| Jan1974 | 3,249 | 2,956 | 1,839 | 1,480 | 358 |
| Dec1975 | 4,360 | 3,893 | 1,987 | 1,684 | 303 |
| Dec1980 | 4,194 | 3,682 | 1,934 | 1,685 | 249 |
| Dec1984 | 4,094 | 3,699 | 1,875 | 1,607 | 268 |
| Dec1985 | 4,200 | 3,799 | 1,916 | 1,661 | 255 |
| Dec1986 | 4,347 | 3,922 | 2,003 | 1,723 | 279 |
| Dec1987 | 4,458 | 4,019 | 2,079 | 1,807 | 272 |
| Dec1988 | 4,541 | 4,089 | 2,155 | 1,885 | 270 |
| Dec1989 | 4,673 | 4,206 | 2,224 | 1,950 | 275 |
| Dec1990 | 4,888 | 4,412 | 2,344 | 2,058 | 286 |
| Dec1991 | 5,200 | 4,730 | 2,512 | 2,204 | 308 |
| Dec1992 | 5,647 | 5,202 | 2,684 | 2,372 | 313 |
| Dec1993 | 6,065 | 5,636 | 2,850 | 2,536 | 314 |
| Dec1994 | 6,377 | 5,965 | 2,950 | 2,628 | 322 |
| Dec1995 | 6,576 | 6,194 | 2,817 | 2,518 | 300 |
| Dec1996 | 6,677 | 6,326 | 2,732 | 2,421 | 310 |
| Dec1997 | 6,565 | 6,212 | 3,029 | 2,372 | 657 |
Table A-23. SSI Participation Rates, 1974 - 1997
[In percent]
| All Recipients as a Percent Of Total Population1 | Child Recipients as a Percent of All Children1 |
Elderly Recipients (Persons 65 & Older) as a Percent of | |||
|---|---|---|---|---|---|
| All Persons 65 & Older1 | All Elderly Poor2 | Pretransfer Elderly Poor3 | |||
|
1 Population numbers used for the denominators are Census resident population estimates adjusted to the December date by averaging the July 1 population of the current year with the July 1 population of the following year; see Current Population Reports, Series P25-1106. 2 For the number of persons (65 years of age and older living in poverty) used as the denominator, see Current Population Reports, Series P60-198. 3 The pretransfer poverty population used as the denominator is the number of all elderly persons living in elderly-only units whose income (cash income plus social insurance plus Social Security but before taxes and means-tested transfers) falls below the appropriate poverty threshold. See Appendix J, Table 20, 1992 Green Book; data for subsequent years are unpublished Congressional Budget Office tabulations. Notes: Numerators for these ratios are from Table A-20. Rates computed by DHHS. Source: 1994 Green Book and U.S. Bureau of the Census, “Poverty in the United States: 1996," Current Population Reports, Series P60-198, and earlier years, (Available online at http://www.census.gov/hhes/www/poverty.html). |
|||||
| Dec 1974 | 1.9 | 0.1 | 10.8 | 78.5 | NA |
| Dec 1975 | 2.0 | 0.2 | 10.9 | 75.6 | NA |
| Dec 1976 | 1.9 | 0.2 | 10.2 | 72.4 | NA |
| Dec 1977 | 1.9 | 0.3 | 9.7 | 74.1 | NA |
| Dec 1978 | 1.9 | 0.3 | 9.3 | 71.5 | NA |
| Dec 1979 | 1.8 | 0.3 | 8.8 | 61.3 | 66.8 |
| Dec 1980 | 1.8 | 0.4 | 8.6 | 57.5 | 64.7 |
| Dec 1981 | 1.7 | 0.4 | 8.0 | 55.0 | 63.3 |
| Dec 1982 | 1.7 | 0.4 | 7.4 | 53.6 | 62.3 |
| Dec 1983 | 1.7 | 0.4 | 7.3 | 55.2 | 61.9 |
| Dec 1984 | 1.7 | 0.4 | 7.2 | 61.2 | 66.3 |
| Dec 1985 | 1.7 | 0.4 | 7.1 | 58.7 | 64.5 |
| Dec 1986 | 1.8 | 0.4 | 6.9 | 57.9 | 63.4 |
| Dec 1987 | 1.8 | 0.5 | 6.7 | 56.5 | 64.7 |
| Dec 1988 | 1.8 | 0.5 | 6.6 | 57.6 | 64.3 |
| Dec 1989 | 1.9 | 0.5 | 6.5 | 60.3 | 64.6 |
| Dec 1990 | 1.9 | 0.5 | 6.5 | 56.3 | 63.3 |
| Dec 1991 | 2.0 | 0.7 | 6.5 | 55.0 | 61.1 |
| Dec 1992 | 2.2 | 0.9 | 6.5 | 53.5 | 59.8 |
| Dec 1993 | 2.3 | 1.1 | 6.4 | 56.3 | 63.3 |
| Dec 1994 | 2.4 | 1.3 | 6.4 | 57.9 | 65.6 |
| Dec 1995 | 2.5 | 1.4 | 6.4 | 63.7 | 71.4 |
| Dec 1996 | 2.5 | 1.5 | 6.2 | 61.0 | 69.3 |
| Dec 1997 | 2.4 | 1.3 | 6.0 | 60.8 | NA |
Figure A-6. SSI Recipients by Age, 1974 – 1997
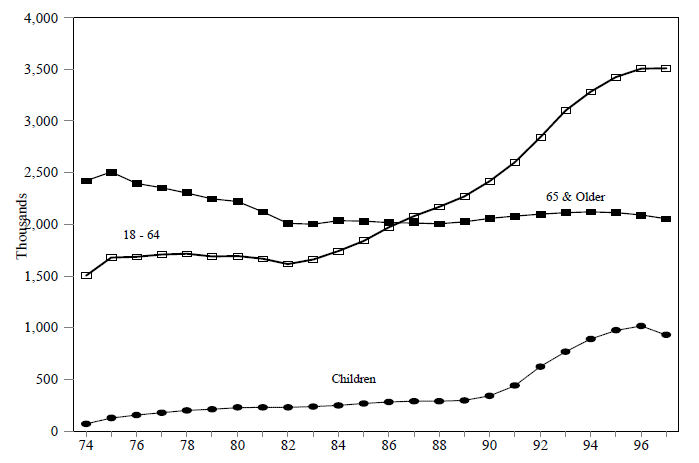
Source: Social Security Administration, Office of Research, Evaluation, and Statistics, (Data available online at http://www.ssa.gov/statistics/ores_home.html).
- The proportion of persons receiving SSI who are 65 years of age or older (as a percent of all SSI recipients) has decreased steadily from a high of 61 percent in 1974 to a low of 32 percent in 1997 essentially cutting the proportion of elderly recipients in half. The actual number who are 65 or older has declined from 2.5 million in 1975 to a little less than 2.1 million today.
- The percentage of child recipients increased two and one half times during the 1970s, going from 2 percent in 1974 to 5 percent by the end of the decade. During the 1980s, it remained fairly constant at about 6 percent. In the 1990s, the share of child recipients increased rapidly, more than doubling to 15 percent.
- The percentage of persons receiving SSI between the ages of 18 and 64 has increased steadily over time, rising from 38 percent in 1974 to 54 percent in 1997.
Figure A-7. Number and Percentage Distribution of Persons Age 15 or Older with Supplemental Security Income, by Race and Hispanic Origin, 1985 & 1995
(In thousands)

Source: U.S. Bureau of the Census, “Money Income in the United States: 1995," Current Population Reports, Series P60-193 and earlier years.
Table A-24. Total SSI Payments, Federal SSI Payments And State Supplementary Payments, Fiscal 1997
(In Thousands)
| State | Total1 | Total Federal2 | Federal SSI2 | State Supplementation | |
|---|---|---|---|---|---|
| Federally Administered2 | State Administrated | ||||
| Other: N. Mariana Islands | 2,518 | 2,518 | 2,518 | – | – |
| Total | $29,052,091 | $28,370,538 | $25,457,355 | $2,913,281 | $681,521 |
|
1 Includes $463,000 for unknown States. Federal SSI includes $643,000 for unknown States. 2 The sum of federally administered State supplementation payments exceeds the total by $214,000. This represents refunds of State payments that had not yet been credited to States. 3 Data estimated. 4 Represents recovered State payments. Administration changed from Federal to State: Maine in April 1996, Wisconsin in January 1996. Source: Social Security Administration, Office of Research, Evaluation, and Statistics, Social Security Bulletin, Annual Statistical Supplement, 1998. |
|||||
| Alabama | 634,096 | 633,109 | 633,109 | – | 987 |
| Alaska | 43,052 | 30,080 | 30,080 | – | 12,972 3 |
| Arizona | 316,054 | 315,742 | 315,742 | – | 312 |
| Arkansas | 335,331 | 335,331 | 335,331 | – | – |
| California | 5,512,788 | 5,512,788 | 3,593,495 | 1,919,293 | – |
| Colorado | 296,154 | 229,554 | 229,554 | – | 66,600 |
| Connecticut | 288,158 | 195,349 | 195,349 | – | 92,809 |
| Delaware | 45,500 | 45,500 | 44,626 | 874 | – |
| District of Columbia | 84,906 | 84,906 | 82,163 | 2,743 | – |
| Florida | 1,467,042 | 1,448,658 | 1,448,650 | 8 | 18,384 |
| Georgia | 744,478 | 744,475 | 744,478 | – | – |
| Hawaii | 88,669 | 88,669 | 77,363 | 11,306 | – |
| Idaho | 78,965 | 68,549 | 68,549 | – | 10,416 |
| Illinois | 1,174,134 | 1,144,974 | 1,144,974 | – | 29,160 |
| Indiana | 373,244 | 369,668 | 369,668 | – | 3,576 |
| Iowa | 164,641 | 153,316 | 150,311 | 3,005 | 11,325 |
| Kansas | 146,264 | 146,264 | 146,264 | – | – |
| Kentucky | 692,039 | 676,463 | 676,463 | – | 15,576 |
| Louisiana | 728,659 | 728,116 | 728,116 | – | 543 |
| Maine | 100,768 | 100,064 | 100,122 | -58 4 | 704 |
| Maryland | 370,584 | 363,907 | 363,896 | 11 | 6,677 |
| Massachusetts | 740,252 | 740,252 | 579,728 | 160,524 | – |
| Michigan | 949,061 | 945,255 | 917,569 | 27,686 | 3,806 |
| Minnesota | 306,218 | 252,921 | 252,921 | – | 53,297 3 |
| Mississippi | 517,694 | 517,694 | 517,694 | – | – |
| Missouri | 477,882 | 452,689 | 452,689 | – | 25,193 |
| Montana | 54,344 | 54,344 | 53,512 | 832 | – |
| Nebraska | 87,418 | 81,219 | 81,219 | – | 6,199 |
| Nevada | 88,176 | 88,176 | 83,915 | 4,261 | – |
| New Hampshire | 54,651 | 43,563 | 43,563 | – | 11,088 |
| New Jersey | 627,617 | 627,617 | 550,794 | 76,823 | – |
| New Mexico | 177,662 | 177,394 | 177,394 | – | 268 |
| New York | 2,931,527 | 2,931,527 | 2,408,404 | 523,123 | – |
| North Carolina | 791,473 | 698,905 | 698,905 | – | 92,568 |
| North Dakota | 31,722 | 29,806 | 29,806 | – | 1,916 3 |
| Ohio | 1,111,237 | 1,111,237 | 1,111,235 | 2 | – |
| Oklahoma | 320,881 | 283,469 | 283,469 | – | 37,412 |
| Oregon | 218,164 | 197,990 | 197,990 | – | 20,174 3 |
| Pennsylvania | 1,235,472 | 1,235,472 | 1,109,806 | 125,666 | – |
| Rhode Island | 109,271 | 109,271 | 89,628 | 19,643 | – |
| South Carolina | 423,542 | 410,499 | 410,499 | – | 13,043 |
| South Dakota | 50,840 | 48,936 | 48,929 | 7 | 1,904 |
| Tennessee | 657,844 | 657,844 | 657,844 | – | – |
| Texas | 1,491,309 | 1,491,309 | 1,491,309 | – | – |
| Utah | 85,860 | 85,860 | 85,801 | 59 | – |
| Vermont | 50,122 | 50,122 | 40,553 | 9,569 | – |
| Virginia | 526,385 | 507,128 | 507,128 | – | 19,257 |
| Washington | 432,129 | 431,886 | 403,459 | 28,427 | 243 |
| West Virginia | 296,853 | 296,853 | 296,853 | – | – |
| Wisconsin | 494,557 | 370,147 | 370,555 | -408 4 | 124,410 |
| Wyoming | 23,421 | 22,724 | 22,724 | – | 697 |
Table A-25. SSI Recipiency Rates by State And Program Type for 1979 and 1997
[In percent]
| Total Recipiency Rate | Rate for Adults 18-84 | Rate for Adults 65 & Over | |||||||
|---|---|---|---|---|---|---|---|---|---|
| 1979 | 1997 | Percent Change 1979-97 | 1979 | 1997 | Percent Change 1979-97 | 1979 | 1997 | Percent Change 1979-97 | |
| Total | 1.85 | 2.43 | 31.2 | 1.26 | 2.17 | 72.3 | 8.98 | 6.03 | -32.9 |
|
Note: Recipiency rates are the ratios of the number of SSI recipients (in the respective age groups) as of the month of December to the population in the respective age group as of the the month of July; calculations by DHHS. Source: Social Security Administration and U.S. Bureau of the Census, (Resident population by state available online at http://www.census.gov/population/estimates/state/). |
|||||||||
| Alabama | 3.55 | 3.78 | 6.5 | 1.83 | 3.20 | 74.9 | 21.01 | 9.28 | -55.8 |
| Alaska | 0.77 | 1.22 | 58.7 | 0.54 | 1.22 | 126.4 | 14.04 | 5.45 | -61.2 |
| Arizona | 1.11 | 1.68 | 51.0 | 0.89 | 1.62 | 82.4 | 4.98 | 3.47 | -30.3 |
| Arkansas | 3.50 | 3.59 | 2.5 | 1.87 | 3.07 | 64.4 | 17.05 | 8.12 | -52.4 |
| California | 3.02 | 3.17 | 5.0 | 2.05 | 2.49 | 21.7 | 16.43 | 12.67 | -22.9 |
| Colorado | 1.10 | 1.45 | 31.9 | 0.77 | 1.37 | 77.5 | 6.68 | 3.55 | -46.9 |
| Connecticut | 0.75 | 1.41 | 88.3 | 0.63 | 1.45 | 130.5 | 2.70 | 2.53 | -6.4 |
| Delaware | 1.19 | 1.56 | 31.3 | 0.94 | 1.41 | 50.5 | 5.43 | 2.69 | -50.5 |
| District of Columbia | 2.28 | 3.75 | 64.5 | 1.92 | 3.32 | 72.9 | 8.56 | 7.48 | -12.6 |
| Florida | 1.78 | 2.41 | 35.4 | 1.14 | 1.91 | 67.9 | 6.21 | 4.92 | -20.8 |
| Georgia | 2.87 | 2.66 | -7.2 | 1.89 | 2.24 | 18.7 | 17.73 | 8.84 | -50.2 |
| Hawaii | 1.05 | 1.64 | 56.0 | 0.69 | 1.27 | 84.7 | 7.57 | 5.84 | -22.9 |
| Idaho | 0.79 | 1.41 | 78.0 | 0.64 | 1.50 | 134.8 | 3.78 | 2.21 | -41.5 |
| Illinois | 1.08 | 2.12 | 96.7 | 0.95 | 2.13 | 124.1 | 4.25 | 3.89 | -8.5 |
| Indiana | 0.75 | 1.51 | 101.3 | 0.61 | 1.56 | 155.6 | 3.32 | 1.99 | -40.2 |
| Iowa | 0.89 | 1.43 | 60.5 | 0.62 | 1.55 | 150.0 | 3.50 | 2.00 | -42.9 |
| Kansas | 0.89 | 1.40 | 57.2 | 0.63 | 1.45 | 129.7 | 3.47 | 2.04 | -41.2 |
| Kentucky | 2.54 | 4.29 | 69.0 | 1.79 | 4.33 | 141.7 | 12.54 | 8.16 | -34.9 |
| Louisiana | 3.35 | 4.03 | 20.3 | 2.03 | 3.56 | 75.3 | 20.14 | 9.87 | -51.0 |
| Maine | 1.95 | 2.27 | 16.4 | 1.39 | 2.44 | 75.4 | 8.58 | 3.91 | -54.4 |
| Maryland | 1.15 | 1.67 | 45.3 | 0.94 | 1.46 | 55.1 | 5.40 | 4.29 | -20.5 |
| Massachusetts | 2.24 | 2.75 | 22.9 | 1.28 | 2.68 | 109.1 | 10.80 | 5.88 | -45.5 |
| Michigan | 1.26 | 2.14 | 69.8 | 1.07 | 2.20 | 106.0 | 5.85 | 3.18 | -45.6 |
| Minnesota | 0.81 | 1.34 | 65.0 | 0.55 | 1.33 | 141.1 | 3.71 | 2.59 | -30.1 |
| Mississippi | 4.49 | 4.98 | 10.9 | 2.42 | 4.24 | 75.4 | 26.01 | 13.65 | -47.5 |
| Missouri | 1.76 | 2.08 | 18.3 | 1.10 | 2.11 | 91.7 | 7.89 | 3.55 | -55.0 |
| Montana | 0.89 | 1.56 | 75.8 | 0.72 | 1.69 | 135.3 | 3.79 | 2.32 | -38.9 |
| Nebraska | 0.88 | 1.27 | 44.5 | 0.64 | 1.31 | 104.3 | 3.38 | 1.97 | -41.7 |
| Nevada | 0.84 | 1.33 | 58.0 | 0.53 | 1.16 | 118.9 | 5.87 | 3.48 | -40.8 |
| New Hampshire | 0.58 | 0.95 | 63.2 | 0.44 | 1.00 | 127.5 | 2.53 | 1.44 | -42.9 |
| New Jersey | 1.14 | 1.79 | 57.0 | 0.86 | 1.50 | 74.1 | 4.69 | 4.48 | -4.4 |
| New Mexico | 1.97 | 2.62 | 33.1 | 1.37 | 2.35 | 71.2 | 12.36 | 7.88 | -36.2 |
| New York | 2.12 | 3.30 | 55.5 | 1.59 | 2.78 | 75.1 | 8.26 | 8.88 | 7.4 |
| North Carolina | 2.40 | 2.60 | 8.4 | 1.58 | 2.14 | 35.4 | 13.60 | 7.04 | -48.3 |
| North Dakota | 0.99 | 1.34 | 35.8 | 0.57 | 1.30 | 128.8 | 5.05 | 2.74 | -45.7 |
| Ohio | 1.11 | 2.21 | 98.9 | 0.99 | 2.35 | 137.6 | 4.17 | 2.60 | -37.6 |
| Oklahoma | 2.32 | 2.22 | -4.1 | 1.33 | 2.05 | 54.4 | 11.62 | 4.93 | -57.6 |
| Oregon | 0.86 | 1.48 | 71.9 | 0.70 | 1.52 | 117.8 | 3.28 | 2.57 | -21.6 |
| Pennsylvania | 1.40 | 2.24 | 60.1 | 1.12 | 2.24 | 100.2 | 4.96 | 3.52 | -29.1 |
| Rhode Island | 1.59 | 2.56 | 61.2 | 1.08 | 2.53 | 133.8 | 6.43 | 4.79 | -25.5 |
| South Carolina | 2.69 | 2.92 | 8.5 | 1.78 | 2.47 | 38.9 | 16.96 | 7.75 | -54.3 |
| South Dakota | 1.14 | 1.79 | 56.6 | 0.72 | 1.69 | 135.0 | 4.99 | 3.35 | -32.8 |
| Tennessee | 2.86 | 3.20 | 11.9 | 1.87 | 2.98 | 59.4 | 14.77 | 7.45 | -49.6 |
| Texas | 1.89 | 2.09 | 10.8 | 0.95 | 1.61 | 69.1 | 12.69 | 8.46 | -33.4 |
| Utah | 0.55 | 0.99 | 79.3 | 0.51 | 1.08 | 111.5 | 3.03 | 1.98 | -34.7 |
| Vermont | 1.77 | 2.16 | 22.0 | 1.31 | 2.19 | 67.0 | 8.08 | 4.64 | -42.6 |
| Virginia | 1.50 | 1.94 | 29.6 | 1.02 | 1.61 | 57.7 | 8.52 | 5.37 | -37.0 |
| Washington | 1.16 | 1.68 | 45.2 | 0.98 | 1.74 | 77.9 | 4.83 | 3.38 | -30.1 |
| West Virginia | 2.13 | 3.82 | 79.3 | 1.86 | 4.19 | 125.1 | 7.95 | 5.21 | -34.5 |
| Wisconsin | 1.44 | 1.75 | 21.7 | 0.96 | 1.73 | 80.6 | 6.54 | 2.65 | -59.4 |
| Wyoming | 0.42 | 1.20 | 185.9 | 0.29 | 1.29 | 346.1 | 2.74 | 1.79 | -34.5 |
Table A-26. SSI Recipiency Rates by State, Selected Fiscal Years 1975 – 1997
[In percent]
| 1975 | 1985 | 1990 | 1992 | 19942 | 19962 | 19972 | |
|---|---|---|---|---|---|---|---|
| Total1 | 2.00 | 1.74 | 1.94 | 2.11 | 2.42 | 2.49 | 2.43 |
|
1 The number of SSI recipients used to calculate the total recipiency rate includes a certain number of recipients whose State is unknown. For 1975, 1985, 1990, and 1992,, the numbers of unknown (in thousands) were 256, 14, 0, and 71 respectively. 2 For 1975-92 the percentages are calculated as the average number of monthly SSI recipients over the total population of each State in July of that year. For 1994-1997 the number of recipients is from the month of December; calculations by DHHS. Source: Social Security Administration and Bureau of the Census, (Resident population by state available online at http://www.census.gov/population/estimates/state/). |
|||||||
| Alabama | 3.98 | 3.29 | 3.29 | 3.43 | 3.83 | 3.91 | 3.78 |
| Alaska | 0.81 | 0.65 | 0.84 | 0.90 | 1.05 | 1.21 | 1.22 |
| Arizona | 1.24 | 1.04 | 1.22 | 1.42 | 1.68 | 1.71 | 1.68 |
| Arkansas | 4.09 | 3.14 | 3.23 | 3.47 | 3.83 | 3.76 | 3.59 |
| California | 3.09 | 2.59 | 2.93 | 3.10 | 3.23 | 3.28 | 3.17 |
| Colorado | 1.37 | 0.93 | 1.14 | 1.29 | 1.49 | 1.50 | 1.45 |
| Connecticut | 0.76 | 0.83 | 0.98 | 1.10 | 1.30 | 1.41 | 1.41 |
| Delaware | 1.19 | 1.21 | 1.21 | 1.27 | 1.45 | 1.58 | 1.56 |
| District of Columbia | 2.23 | 2.51 | 2.67 | 3.00 | 3.48 | 3.73 | 3.75 |
| Florida | 1.86 | 1.62 | 1.71 | 1.90 | 2.27 | 2.45 | 2.41 |
| Georgia | 3.27 | 2.56 | 2.46 | 2.55 | 2.75 | 2.73 | 2.66 |
| Hawaii | 1.08 | 1.08 | 1.25 | 1.30 | 1.53 | 1.65 | 1.64 |
| Idaho | 1.06 | 0.84 | 1.03 | 1.21 | 1.39 | 1.46 | 1.41 |
| Illinois | 1.22 | 1.18 | 1.55 | 1.78 | 2.21 | 2.27 | 2.12 |
| Indiana | 0.83 | 0.87 | 1.09 | 1.26 | 1.49 | 1.55 | 1.51 |
| Iowa | 1.00 | 0.96 | 1.18 | 1.29 | 1.44 | 1.47 | 1.43 |
| Kansas | 1.05 | 0.87 | 0.99 | 1.14 | 1.39 | 1.49 | 1.40 |
| Kentucky | 2.83 | 2.65 | 3.11 | 3.42 | 4.07 | 4.38 | 4.29 |
| Louisiana | 3.90 | 2.87 | 3.15 | 3.49 | 4.14 | 4.19 | 4.03 |
| Maine | 2.31 | 1.89 | 1.93 | 2.03 | 2.38 | 2.24 | 2.27 |
| Maryland | 1.17 | 1.16 | 1.25 | 1.35 | 1.57 | 1.67 | 1.67 |
| Massachusetts | 2.30 | 1.91 | 1.98 | 2.23 | 2.60 | 2.72 | 2.75 |
| Michigan | 1.31 | 1.35 | 1.54 | 1.71 | 2.18 | 2.23 | 2.14 |
| Minnesota | 1.00 | 0.78 | 0.92 | 1.05 | 1.30 | 1.37 | 1.34 |
| Mississippi | 5.21 | 4.28 | 4.42 | 4.68 | 5.23 | 5.20 | 4.98 |
| Missouri | 2.10 | 1.58 | 1.66 | 1.83 | 2.08 | 2.17 | 2.08 |
| Montana | 1.12 | 0.92 | 1.25 | 1.38 | 1.55 | 1.62 | 1.56 |
| Nebraska | 1.06 | 0.88 | 0.99 | 1.09 | 1.26 | 1.32 | 1.27 |
| Nevada | 1.00 | 0.85 | 0.95 | 1.04 | 1.30 | 1.37 | 1.33 |
| New Hampshire | 0.67 | 0.62 | 0.62 | 0.71 | 0.85 | 0.95 | 0.95 |
| New Jersey | 1.11 | 1.23 | 1.36 | 1.52 | 1.78 | 1.82 | 1.79 |
| New Mexico | 2.29 | 1.83 | 2.08 | 2.25 | 2.58 | 2.67 | 2.62 |
| New York | 2.24 | 2.00 | 2.31 | 2.60 | 3.10 | 3.33 | 3.30 |
| North Carolina | 2.71 | 2.21 | 2.24 | 2.36 | 2.58 | 2.66 | 2.60 |
| North Dakota | 1.25 | 0.96 | 1.17 | 1.30 | 1.39 | 1.38 | 1.34 |
| Ohio | 1.22 | 1.19 | 1.44 | 1.63 | 2.12 | 2.27 | 2.21 |
| Oklahoma | 3.03 | 1.81 | 1.92 | 2.02 | 2.22 | 2.28 | 2.22 |
| Oregon | 1.12 | 0.95 | 1.11 | 1.24 | 1.47 | 1.51 | 1.48 |
| Pennsylvania | 1.24 | 1.39 | 1.60 | 1.77 | 2.09 | 2.24 | 2.24 |
| Rhode Island | 1.72 | 1.62 | 1.74 | 1.91 | 2.29 | 2.55 | 2.56 |
| South Carolina | 2.84 | 2.60 | 2.59 | 2.67 | 2.96 | 3.03 | 2.92 |
| South Dakota | 1.32 | 1.19 | 1.45 | 1.62 | 1.83 | 1.88 | 1.79 |
| Tennessee | 3.24 | 2.71 | 2.87 | 3.06 | 3.37 | 3.36 | 3.20 |
| Texas | 2.23 | 1.57 | 1.73 | 1.87 | 2.12 | 2.15 | 2.09 |
| Utah | 0.76 | 0.53 | 0.73 | 0.84 | 1.04 | 1.05 | 0.99 |
| Vermont | 1.93 | 1.76 | 1.79 | 1.99 | 2.19 | 2.19 | 2.16 |
| Virginia | 1.53 | 1.49 | 1.54 | 1.67 | 1.91 | 2.00 | 1.94 |
| Washington | 1.46 | 1.09 | 1.27 | 1.39 | 1.64 | 1.71 | 1.68 |
| West Virginia | 2.37 | 2.24 | 2.63 | 2.91 | 3.53 | 3.82 | 3.82 |
| Wisconsin | 1.44 | 1.50 | 1.75 | 1.88 | 2.16 | 1.84 | 1.75 |
| Wyoming | 0.67 | 0.45 | 0.76 | 0.92 | 1.16 | 1.22 | 1.20 |
1 States also have the option of continuing TANF benefits for immigrants who arrived before the bill’s enactment. Only Alabama, Mississippi and South Carolina have indicated that they will not be continuing benefits for these aliens.
2 Alternative programs are offered in Puerto Rico, the Northern Mariana Islands, and American Samoa.
3 Some of the decline in food stamp participation can be attributed to eligibility changes made in the 1996 welfare law, most notably the elimination of eligibility for most legal immigrants and for many childless adults aged 18-50. By April 1, 1997, many states began removing legal immigrants who were receiving food stamps on August 22, 1996. Most states removed at least a portion of the childless 18-50 year olds on or around March 1, 1997.
4 On February 20, 1990, the Supreme Court ruled that the individual functional assessment (or a residual functional capacity assessment) applied to adults whose condition did not meet or equal a listing of medical impairments to determine eligibility should also be applied to children whose condition did not meet or equal the medical listing of impairments. A GAO study estimated that 87,000 children were added to the SSI caseload after the individual functional assessments for children were initiated.
Appendix B. Poverty Data
Figure B-1. The Poverty Gap 1 and Reductions in the Gap from Cash and Non-Cash Transfers for All Persons, 1979 - 1996
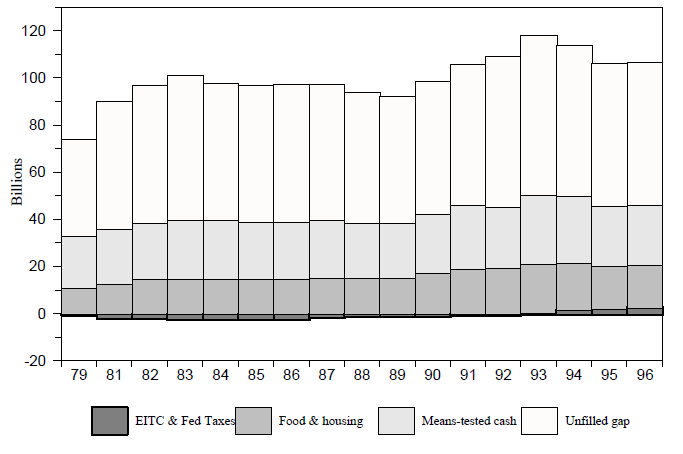
1 The poverty gap denotes the amount of funds needed to bring all those below poverty up to the poverty threshold; as measured here the gap is the difference between the poverty threshold and cash income plus all social insurance (including social security benefits). Food and housing benefits may be received either as cash or (more generally) as in-kind benefits in which case the market value of food and housing benefits is imputed. EITC refers to the refundable Earned Income Tax Credit which is always positive whereas Federal payroll and income taxes are a negative adjustment.
Source: Congressional Budget Office tabulations. Additional calculations by DHHS.
Table B-1. The Poverty Gap 1 and Reductions in the Gap from Cash and Non-Cash Transfers for All Persons, 1979 - 1996
(In billions of constant 1996 dollars)
| 1979 | 1982 | 1985 | 1988 | 1992 | 1993 | 1994 | 1995 | 1996 | |
|---|---|---|---|---|---|---|---|---|---|
|
1 The poverty gap denotes the amount of funds needed to bring all those below poverty up to the poverty threshold; as measured here the gap is the difference between the poverty threshold and cash income plus all social insurance (including social security benefits). Food and housing benefits may be received either as cash or (more generally) as in-kind benefits in which case the market value of food and housing benefits is imputed. EITC refers to the refundable Earned Income Tax Credit which is always positive whereas Federal payroll and income taxes are a negative adjustment. Source: Congressional Budget Office tabulations. Additional calculations by DHHS. |
|||||||||
| Poverty Gap After: | |||||||||
| Cash Income plus All Social Insurance | 73.3 | 94.6 | 94.3 | 92.5 | 108.6 | 118.1 | 113.6 | 106.0 | 106.6 |
| Plus Means-Tested Cash Assistance | 51.0 | 70.8 | 69.7 | 69.3 | 82.6 | 89.1 | 85.4 | 80.5 | 81.5 |
| Plus Food and Housing Benefits | 39.9 | 56.2 | 55.1 | 53.8 | 63.1 | 68.1 | 65.4 | 62.4 | 63.3 |
| Plus EITC and Federal Taxes | 40.5 | 58.2 | 57.5 | 54.9 | 63.6 | 67.5 | 63.7 | 60.1 | 60.4 |
| Reduction in Poverty Gap Due To: | |||||||||
| Means-Tested Cash | 22.3 | 23.7 | 24.6 | 23.2 | 26.1 | 29.0 | 28.1 | 25.5 | 25.0 |
| Food and Housing Benefits | 11.1 | 14.6 | 14.6 | 15.5 | 19.4 | 21.0 | 20.0 | 18.2 | 18.3 |
| EITC and Federal Taxes | -0.6 | -2.0 | -2.3 | -1.1 | -0.5 | 0.6 | 1.7 | 2.3 | 2.9 |
| Total Reductions | 32.8 | 36.4 | 36.8 | 37.6 | 45.0 | 50.6 | 49.9 | 45.9 | 46.2 |
| Percent Reduction in Gap Due To: | |||||||||
| Means-Tested Cash | 30.5 | 25.1 | 26.1 | 25.1 | 24.0 | 24.6 | 24.8 | 24.0 | 23.5 |
| Food and Housing Benefits | 15.1 | 15.5 | 15.5 | 16.7 | 17.9 | 17.8 | 17.6 | 17.1 | 17.1 |
| EITC and Federal Taxes | -0.9 | -2.1 | -2.4 | -1.2 | -0.5 | 0.5 | 1.5 | 2.2 | 2.7 |
| Total Reductions | 44.7 | 38.5 | 39.1 | 40.6 | 41.4 | 42.9 | 44.0 | 43.3 | 43.3 |
Figure B-2. The Poverty Gap 1 and Reductions in the Gap from Cash & Non-Cash Transfers for Persons in Families with Children Under 18 Years, 1979 - 1996
(In billions of constant 1996 dollars)
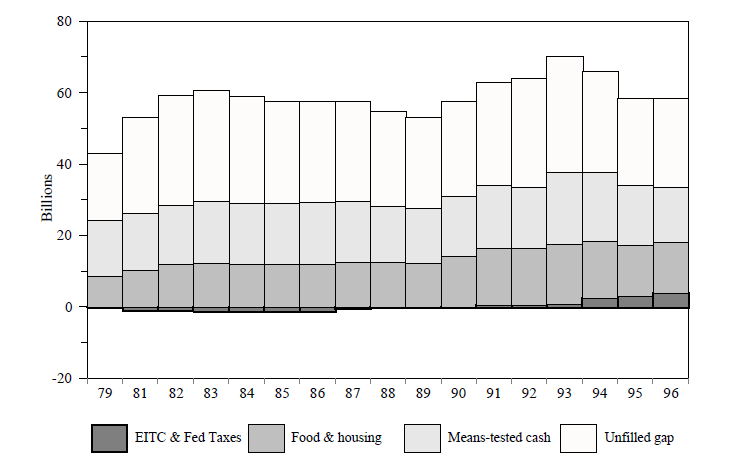
1 The poverty gap denotes the amount of funds needed to bring all those below poverty up to the poverty threshold; as measured here it is the difference between the poverty threshold and cash income plus all social insurance (including social security benefits). Food and housing benefits may be received either as cash or (more generally) as in-kind benefits in which case the market value of food and housing benefits is imputed. EITC refers to the refundable Earned Income Tax Credit which is always positive whereas Federal payroll and income taxes are a negative adjustment.
Source: Congressional Budget Office tabulations. Additional calculations by DHHS.
Table B-2. The Poverty Gap 1 and Reductions in the Gap from Cash & Non-Cash Transfers for Persons in Families with Children Under 18 Years, 1979 - 1996
(In billions of constant 1996 dollars)
| 1979 | 1982 | 1985 | 1988 | 1992 | 1993 | 1994 | 1995 | 1996 | |
|---|---|---|---|---|---|---|---|---|---|
|
1 The poverty gap denotes the amount of funds needed to bring all those below poverty up to the poverty threshold; as measured here it is the difference between the poverty threshold and cash income plus all social insurance (including social security benefits). Food and housing benefits may be received either as cash or (more generally) as in-kind benefits in which case the market value of food and housing benefits is imputed. EITC refers to the refundable Earned Income Tax Credit which is always positive whereas Federal payroll and income taxes are a negative adjustment. Source: Congressional Budget Office tabulations. Additional calculations by DHHS. |
|||||||||
| Poverty Gap After: | |||||||||
| Cash Income plus All Social Insurance | 43.0 | 58.3 | 56.4 | 54.8 | 64.1 | 70.0 | 65.8 | 58.5 | 58.4 |
| Plus Means-Tested Cash Assistance | 27.7 | 41.6 | 39.5 | 39.1 | 46.7 | 50.0 | 46.7 | 41.7 | 42.9 |
| Plus Food and Housing Benefits | 18.7 | 29.4 | 27.4 | 26.5 | 31.0 | 33.0 | 30.7 | 27.3 | 28.5 |
| Plus EITC and Federal Taxes | 18.7 | 30.3 | 28.5 | 26.4 | 30.1 | 32.1 | 28.0 | 24.1 | 24.6 |
| Reduction in Poverty Gap Due To: | |||||||||
| Means-Tested Cash | 15.3 | 16.7 | 16.9 | 15.6 | 17.4 | 20.1 | 19.1 | 16.8 | 15.5 |
| Food and Housing Benefits | 9.1 | 12.2 | 12.1 | 12.7 | 15.7 | 16.9 | 16.1 | 14.3 | 14.5 |
| EITC and Federal Taxes | 0.0 | -0.9 | -1.0 | 0.1 | 0.9 | 0.9 | 2.7 | 3.2 | 3.9 |
| Total Reductions | 24.4 | 28.0 | 28.0 | 28.4 | 33.9 | 38.0 | 37.9 | 34.4 | 33.9 |
| Percent Reduction in Gap Due To: | |||||||||
| Means-Tested Cash | 35.5 | 28.6 | 29.9 | 28.6 | 27.1 | 28.7 | 29.0 | 28.8 | 26.5 |
| Food and Housing Benefits | 21.1 | 20.9 | 21.4 | 23.1 | 24.5 | 24.2 | 24.4 | 24.5 | 24.7 |
| EITC and Federal Taxes | 0.0 | -1.6 | -1.8 | 0.2 | 1.3 | 1.4 | 4.1 | 5.5 | 6.7 |
| Total Reductions | 56.6 | 48.0 | 49.6 | 51.8 | 52.9 | 54.2 | 57.5 | 58.8 | 58.0 |
Table B-3. Poverty Rate of Related Children Under 18 1 by State, Selected Years 1969 – 1997
[In percent]
| 1969 | 1979 | 1983 | 1986 | 1989 | 1992 | 1994 | 1996 | 1997 | |
|---|---|---|---|---|---|---|---|---|---|
|
1 Related children under 18 include own children, including stepchildren and adopted children, plus all other children in the household who are related to the householder by blood, marriage, or adoption. Note: Due to limited sample size, rates for small states exhibit large sampling errors. Source: U.S. Bureau of the Census, for 1969 data see 1970 Census of Population, PC(S1)-105 "Supplementary Report", table 3; for 1979 data, see 1980 Census of Population, PC80-1-C1 "General Social and Economic Characteristics", table 245; subsequent years are unpublished March Current Population Survey data. |
|||||||||
| Alabama | 29.3 | 23.6 | 31.0 | 38.0 | 23.5 | 23.9 | 21.9 | 21.2 | 25.3 |
| Alaska | 14.7 | 12.1 | 14.4 | 13.6 | 13.7 | 11.9 | 12.3 | 9.9 | 10.4 |
| Arizona | 17.9 | 16.5 | 27.7 | 20.1 | 23.9 | 23.9 | 24.6 | 30.5 | 25.1 |
| Arkansas | 31.3 | 23.4 | 23.9 | 27.6 | 24.6 | 23.9 | 19.3 | 22.0 | 26.7 |
| California | 12.7 | 15.2 | 23.0 | 19.5 | 20.1 | 24.6 | 27.0 | 25.0 | 25.0 |
| Colorado | 12.7 | 11.5 | 17.5 | 19.2 | 16.7 | 15.1 | 11.7 | 11.7 | 9.5 |
| Connecticut | 7.8 | 11.4 | 13.8 | 10.6 | 1.8 | 20.1 | 20.6 | 21.9 | 9.9 |
| Delaware | 12.3 | 15.6 | 12.0 | 21.2 | 14.2 | 12.2 | 11.3 | 14.0 | 16.2 |
| Dist of Columbia | 23.1 | 27.0 | 32.2 | 23.0 | 26.2 | 35.8 | 37.3 | 38.0 | 38.6 |
| Florida | 19.2 | 18.5 | 22.5 | 16.4 | 19.3 | 24.4 | 23.1 | 21.7 | 20.4 |
| Georgia | 24.1 | 21.1 | 23.8 | 23.8 | 24.2 | 27.4 | 19.4 | 19.9 | 24.8 |
| Hawaii | 10.3 | 13.0 | 20.7 | 14.7 | 17.7 | 19.0 | 11.9 | 15.9 | 20.7 |
| Idaho | 12.7 | 14.3 | 24.0 | 23.0 | 15.3 | 20.6 | 16.3 | 16.6 | 20.2 |
| Illinois | 11.0 | 14.9 | 21.4 | 20.7 | 20.5 | 23.6 | 18.9 | 17.8 | 15.8 |
| Indiana | 9.3 | 11.9 | 24.5 | 16.4 | 22.8 | 16.6 | 16.9 | 7.8 | 10.9 |
| Iowa | 10.1 | 11.5 | 22.8 | 16.6 | 13.7 | 16.5 | 14.1 | 11.0 | 11.3 |
| Kansas | 12.0 | 11.4 | 19.5 | 13.7 | 16.2 | 15.0 | 19.4 | 13.5 | 10.9 |
| Kentucky | 24.9 | 21.6 | 24.7 | 23.2 | 19.3 | 28.0 | 28.5 | 24.5 | 23.1 |
| Louisiana | 30.0 | 23.5 | 27.5 | 31.3 | 33.8 | 35.3 | 37.5 | 31.5 | 23.1 |
| Maine | 14.5 | 15.8 | 16.2 | 11.0 | 14.4 | 20.3 | 11.6 | 14.3 | 13.2 |
| Maryland | 11.5 | 12.5 | 13.3 | 11.8 | 13.1 | 18.7 | 16.8 | 16.3 | 13.4 |
| Massachusetts | 8.8 | 13.1 | 12.6 | 14.4 | 14.3 | 18.1 | 13.4 | 14.2 | 19.7 |
| Michigan | 9.4 | 13.3 | 25.3 | 21.5 | 19.9 | 20.7 | 21.2 | 16.7 | 14.2 |
| Minnesota | 9.5 | 10.2 | 14.8 | 19.0 | 17.0 | 18.6 | 13.8 | 11.6 | 15.9 |
| Mississippi | 41.3 | 30.4 | 37.8 | 33.5 | 31.1 | 32.9 | 29.5 | 29.5 | 21.5 |
| Missouri | 14.9 | 14.6 | 22.4 | 20.2 | 17.5 | 22.9 | 22.7 | 11.6 | 18.2 |
| Montana | 13.3 | 13.8 | 17.7 | 24.2 | 22.5 | 19.5 | 13.6 | 25.6 | 18.7 |
| Nebraska | 12.2 | 12.1 | 17.3 | 19.1 | 18.8 | 16.0 | 11.2 | 12.7 | 12.1 |
| Nevada | 9.1 | 10.0 | 10.3 | 14.4 | 14.6 | 19.2 | 16.5 | 9.4 | 16.8 |
| New Hampshire | 7.9 | 9.4 | 10.2 | 1.7 | 9.5 | 10.1 | 11.5 | 9.0 | 12.3 |
| New Jersey | 9.2 | 14.1 | 17.9 | 13.9 | 12.7 | 15.5 | 13.9 | 13.5 | 13.9 |
| New Mexico | 26.7 | 22.1 | 29.5 | 27.8 | 27.0 | 29.8 | 29.1 | 34.2 | 29.9 |
| New York | 12.7 | 19.0 | 23.3 | 20.6 | 19.4 | 25.8 | 25.8 | 25.0 | 25.2 |
| North Carolina | 23.6 | 18.3 | 19.8 | 19.1 | 15.6 | 24.3 | 20.4 | 17.9 | 16.3 |
| North Dakota | 15.9 | 14.3 | 16.9 | 14.1 | 15.0 | 14.3 | 12.0 | 11.0 | 18.5 |
| Ohio | 10.0 | 13.2 | 19.2 | 18.7 | 15.1 | 19.4 | 21.0 | 18.5 | 15.3 |
| Oklahoma | 19.7 | 15.7 | 22.6 | 17.7 | 18.7 | 24.2 | 22.9 | 25.4 | 17.7 |
| Oregon | 10.8 | 12.0 | 23.3 | 15.5 | 16.0 | 15.2 | 14.7 | 19.8 | 15.8 |
| Pennsylvania | 10.9 | 13.9 | 22.3 | 14.2 | 16.6 | 16.2 | 18.9 | 15.3 | 16.6 |
| Rhode Island | 11.7 | 13.8 | 23.1 | 13.9 | 8.4 | 21.7 | 14.1 | 14.3 | 21.0 |
| South Carolina | 28.7 | 21.0 | 29.3 | 23.2 | 24.7 | 29.0 | 20.6 | 19.1 | 19.5 |
| South Dakota | 18.9 | 20.0 | 23.2 | 21.8 | 13.9 | 19.0 | 19.2 | 13.4 | 16.8 |
| Tennessee | 24.6 | 20.6 | 28.4 | 23.5 | 26.5 | 21.3 | 19.0 | 22.8 | 19.1 |
| Texas | 21.7 | 18.7 | 22.7 | 24.7 | 24.0 | 26.6 | 27.7 | 24.1 | 23.0 |
| Utah | 10.6 | 10.7 | 16.2 | 14.2 | 10.0 | 11.8 | 9.0 | 8.8 | 11.5 |
| Vermont | 11.5 | 13.9 | 21.2 | 15.8 | 9.1 | 11.8 | 7.9 | 16.7 | 12.1 |
| Virginia | 18.0 | 14.9 | 16.1 | 14.6 | 14.8 | 14.6 | 12.0 | 17.2 | 17.6 |
| Washington | 9.8 | 11.5 | 13.6 | 18.5 | 11.2 | 15.3 | 15.7 | 16.0 | 14.0 |
| West Virginia | 24.3 | 18.5 | 30.9 | 30.8 | 21.5 | 35.1 | 26.3 | 24.0 | 20.6 |
| Wisconsin | 8.9 | 10.4 | 14.6 | 14.3 | 11.7 | 15.0 | 13.1 | 11.5 | 10.7 |
| Wyoming | 11.6 | 7.7 | 14.5 | 19.7 | 14.7 | 13.5 | 11.1 | 13.3 | 15.3 |
| United States | 13.8 | 16.0 | 21.8 | 19.8 | 19.0 | 21.6 | 21.2 | 19.8 | 19.2 |
Table B-4. Poverty Rate of All Persons By State, Selected Years 1969 – 1997
[In percent]
| 1969 | 1979 | 1983 | 1986 | 1989 | 1992 | 1994 | 1996 | 1997 | |
| Alabama | 25.4 | 18.9 | 22.9 | 23.8 | 18.9 | 17.3 | 16.4 | 14.0 | 15.7 |
| Alaska | 12.6 | 10.7 | 12.4 | 11.4 | 10.5 | 10.2 | 10.2 | 8.2 | 8.8 |
| Arizona | 15.3 | 13.2 | 16.5 | 14.3 | 14.1 | 15.8 | 15.9 | 20.5 | 17.2 |
| Arkansas | 27.8 | 19.0 | 21.6 | 21.3 | 18.3 | 17.5 | 15.3 | 17.2 | 19.7 |
| California | 11.1 | 11.4 | 14.9 | 12.7 | 12.9 | 16.4 | 17.9 | 16.9 | 16.6 |
| Colorado | 12.3 | 10.1 | 12.5 | 13.5 | 12.1 | 10.8 | 9.0 | 10.6 | 8.2 |
| Connecticut | 7.2 | 8.0 | 8.7 | 6.0 | 2.9 | 9.8 | 10.8 | 11.7 | 8.6 |
| Delaware | 10.9 | 11.9 | 8.5 | 12.4 | 10.0 | 7.8 | 8.3 | 8.6 | 9.6 |
| Dist of Columbia | 17.0 | 18.6 | 21.3 | 12.8 | 18.0 | 20.3 | 21.2 | 24.1 | 21.8 |
| Florida | 16.4 | 13.5 | 14.8 | 11.4 | 12.5 | 15.6 | 14.9 | 14.2 | 14.3 |
| Georgia | 20.7 | 16.6 | 18.8 | 14.6 | 15.0 | 17.7 | 14.0 | 14.8 | 14.5 |
| Hawaii | 9.3 | 9.9 | 13.4 | 10.7 | 11.3 | 11.2 | 8.7 | 12.1 | 13.9 |
| Idaho | 13.2 | 12.6 | 17.3 | 18.5 | 12.4 | 15.2 | 12.0 | 11.9 | 14.7 |
| Illinois | 10.2 | 11.0 | 14.4 | 13.3 | 12.7 | 15.6 | 12.4 | 12.1 | 11.2 |
| Indiana | 9.7 | 9.7 | 16.1 | 12.7 | 13.7 | 11.8 | 13.7 | 7.5 | 8.8 |
| Iowa | 11.6 | 10.1 | 16.7 | 12.9 | 10.3 | 11.5 | 10.7 | 9.6 | 9.6 |
| Kansas | 12.7 | 10.1 | 13.5 | 11.1 | 10.8 | 11.1 | 14.9 | 11.2 | 9.7 |
| Kentucky | 22.9 | 17.6 | 18.0 | 17.7 | 16.1 | 19.7 | 18.5 | 17.0 | 15.9 |
| Louisiana | 26.3 | 18.6 | 21.6 | 22.0 | 23.3 | 24.5 | 25.7 | 20.5 | 16.3 |
| Maine | 13.6 | 13.0 | 12.4 | 10.2 | 10.4 | 13.5 | 9.4 | 11.2 | 10.1 |
| Maryland | 10.1 | 9.8 | 8.6 | 9.2 | 9.0 | 11.8 | 10.7 | 10.3 | 8.4 |
| Massachusetts | 8.6 | 9.6 | 7.7 | 9.2 | 8.8 | 10.3 | 9.7 | 10.1 | 12.2 |
| Michigan | 9.4 | 10.4 | 16.8 | 13.9 | 13.2 | 13.6 | 14.1 | 11.2 | 10.3 |
| Minnesota | 10.7 | 9.5 | 12.3 | 12.5 | 11.2 | 13.0 | 11.7 | 9.8 | 9.6 |
| Mississippi | 35.4 | 23.9 | 26.9 | 26.6 | 22.0 | 24.6 | 19.9 | 20.6 | 16.7 |
| Missouri | 14.7 | 12.2 | 16.7 | 14.4 | 12.6 | 15.7 | 15.6 | 9.5 | 11.8 |
| Montana | 13.6 | 12.3 | 15.1 | 16.5 | 15.6 | 13.8 | 11.5 | 17.0 | 15.6 |
| Nebraska | 13.1 | 10.7 | 15.3 | 13.6 | 12.8 | 10.6 | 8.8 | 10.2 | 9.8 |
| Nevada | 9.1 | 8.7 | 9.8 | 8.1 | 10.8 | 14.7 | 11.1 | 8.1 | 11 |
| New Hampshire | 9.1 | 8.5 | 8.1 | 3.7 | 7.7 | 8.7 | 7.7 | 6.4 | 9.1 |
| New Jersey | 8.1 | 9.5 | 10.9 | 8.9 | 8.2 | 10.3 | 9.2 | 9.2 | 9.3 |
| New Mexico | 22.8 | 17.6 | 24.2 | 21.3 | 19.5 | 21.6 | 21.1 | 25.5 | 21.2 |
| New York | 11.1 | 13.4 | 15.8 | 13.2 | 12.6 | 15.7 | 17.0 | 16.7 | 16.5 |
| North Carolina | 20.3 | 14.8 | 15.9 | 14.3 | 12.2 | 15.8 | 14.2 | 12.2 | 11.4 |
| North Dakota | 15.7 | 12.6 | 15.1 | 13.5 | 12.2 | 12.1 | 10.4 | 11.0 | 13.6 |
| Ohio | 10.0 | 10.3 | 13.6 | 12.8 | 10.6 | 12.5 | 14.1 | 12.7 | 11 |
| Oklahoma | 18.8 | 13.4 | 16.9 | 14.7 | 14.7 | 18.6 | 16.7 | 16.6 | 13.7 |
| Oregon | 11.5 | 10.7 | 16.4 | 12.3 | 11.2 | 11.4 | 11.8 | 11.8 | 11.6 |
| Pennsylvania | 10.6 | 10.5 | 15.5 | 10.1 | 10.4 | 11.9 | 12.5 | 11.6 | 11.2 |
| Rhode Island | 11.0 | 10.3 | 14.8 | 9.1 | 6.7 | 12.4 | 10.3 | 11.0 | 12.7 |
| South Carolina | 23.9 | 16.6 | 20.9 | 17.3 | 17.0 | 19.0 | 13.8 | 13.0 | 13.1 |
| South Dakota | 18.7 | 16.9 | 18.1 | 17.0 | 13.2 | 15.1 | 14.5 | 11.8 | 16.5 |
| Tennessee | 21.8 | 16.5 | 20.1 | 18.3 | 18.4 | 17.0 | 14.6 | 15.9 | 14.3 |
| Texas | 18.8 | 14.7 | 15.7 | 17.3 | 17.1 | 18.3 | 19.1 | 16.6 | 16.7 |
| Utah | 11.4 | 10.3 | 13.9 | 12.6 | 8.2 | 9.4 | 8.0 | 7.7 | 8.9 |
| Vermont | 12.1 | 12.1 | 15.6 | 11.0 | 8.0 | 10.5 | 7.6 | 12.6 | 9.3 |
| Virginia | 15.5 | 11.8 | 11.4 | 9.7 | 10.9 | 9.5 | 10.7 | 12.3 | 12.7 |
| Washington | 10.2 | 9.8 | 10.8 | 12.9 | 9.6 | 11.2 | 11.7 | 11.9 | 9.2 |
| West Virginia | 22.2 | 15.0 | 22.3 | 22.4 | 15.7 | 22.3 | 18.6 | 18.5 | 16.4 |
| Wisconsin | 9.8 | 8.7 | 10.6 | 10.7 | 8.4 | 10.9 | 9.0 | 8.8 | 8.2 |
| Wyoming | 11.7 | 7.9 | 12.7 | 14.6 | 10.9 | 10.3 | 9.3 | 11.9 | 13.5 |
| United States | 13.7 | 12.4 | 15.2 | 13.6 | 12.8 | 14.8 | 14.5 | 13.7 | 13.3 |
|
Note: Due to limited sample size, rates for small states exhibit large sampling errors. Source: U.S. Bureau of the Census, for 1969 data, see 1970 Census of Population, PC(1)-C1 "General Social and Economic Characteristics", table 182; for 1979 data, see 1980 Census of Population, PC80-1-C1 "General Social and Economic Characteristics", table 245; 1983 and later years, “Poverty in the United States: 1997," Current Population Reports, Series P60-201 and earlier years, (Available online at http://www.census.gov/hhes/www/poverty.html). |
|||||||||
Table B-5. Number and Percent of Persons in Poverty by Family Relationship for All Races, 1959 - 1997
| All Races | Persons in Families | Related Children1 Under 18 in Families | Related Children under 18 In Married-couple Families | Related Children under 18 in Families with Female Householder no husband present |
||||
|---|---|---|---|---|---|---|---|---|
| Thousands | Percent | Thousands | Percent | Thousands | Percent | Thousands | Percent | |
|
1 Related children under 18 include own children, including stepchildren and adopted children, plus all other children in the household who are related to the householder by blood, marriage, or adoption. 2 Estimated by subtracting an estimate of the number of children living in families headed by male householders with no wife present from the total number of children living in all male-headed households. 3 Prior to 1979 unrelated subfamiles were included in all families. Beginning in 1979 unrelated subfamilies are excluded from Source: U.S. Bureau of the Census, “Poverty in the United States: 1997," Current Population Reports, Series P60-201 and earlier years, (Available online at http://www.census.gov/hhes/www/poverty.html). |
||||||||
| 1959 | 34,562 | 20.8 | 17,208 | 26.9 | 12,8522 | 22.32 | 4,145 | 72.2 |
| 1960 | 34,925 | 20.7 | 17,288 | 26.5 | 13,0042 | 22.12 | 4,095 | 68.4 |
| 1961 | 34,509 | 20.3 | 16,577 | 25.2 | 12,2902 | 20.92 | 4,044 | 65.1 |
| 1962 | 33,623 | 19.4 | 16,630 | 24.7 | 11,8492 | 19.72 | 4,506 | 70.2 |
| 1963 | 31,498 | 17.9 | 15,691 | 22.8 | 10,9302 | 17.72 | 4,554 | 66.6 |
| 1964 | 30,912 | 17.4 | 15,736 | 22.7 | 11,1272 | 18.02 | 4,422 | 62.3 |
| 1965 | 28,358 | 15.8 | 14,388 | 20.7 | 9,6442 | 15.62 | 4,562 | 64.2 |
| 1966 | 23,809 | 13.1 | 12,146 | 17.4 | 7,7172 | 12.42 | 4,262 | 58.2 |
| 1967 | 22,771 | 12.5 | 11,427 | 16.3 | 7,0502 | 11.32 | 4,246 | 54.3 |
| 1968 | 20,695 | 11.3 | 10,739 | 15.3 | 6,2102 | 10.02 | 4,409 | 55.2 |
| 1969 | 19,175 | 10.4 | 9,501 | 13.8 | 5,1462 | 8.52 | 4,247 | 54.4 |
| 1970 | 20,330 | 10.9 | 10,235 | 14.9 | 5,4072 | 9.02 | 4,689 | 53.0 |
| 1971 | 20,405 | 10.8 | 10,344 | 15.1 | 5,3532 | 9.12 | 4,850 | 53.1 |
| 1972 | 19,577 | 10.3 | 10,082 | 14.9 | 4,8692 | 8.52 | 5,094 | 53.1 |
| 1973 | 18,299 | 9.7 | 9,453 | 14.2 | 4,1722 | 7.42 | 5,171 | 52.1 |
| 1974 | 18,817 | 9.9 | 9,967 | 15.1 | 4,4182 | 8.12 | 5,361 | 51.5 |
| 1975 | 20,789 | 10.9 | 10,882 | 16.8 | 5,141 | 9.7 | 5,597 | 52.7 |
| 1976 | 19,632 | 10.3 | 10,081 | 15.8 | 4,333 | 8.3 | 5,583 | 52.0 |
| 1977 | 19,505 | 10.2 | 10,028 | 16.0 | 4,173 | 8.3 | 5,658 | 50.3 |
| 1978 | 19,062 | 10.0 | 9,722 | 15.7 | 3,865 | 7.8 | 5,687 | 50.6 |
| 19793 | 19,964 | 10.2 | 9,993 | 16.0 | 4,176 | 8.3 | 5,635 | 48.6 |
| 1980 | 22,601 | 11.5 | 11,114 | 17.9 | 4,982 | 10.1 | 5,866 | 50.8 |
| 1981 | 24,850 | 12.5 | 12,068 | 19.5 | 5,522 | 11.4 | 6,305 | 52.3 |
| 1982 | 27,349 | 13.6 | 13,139 | 21.3 | 6,139 | 12.6 | 6,696 | 56.1 |
| 1983 | 27,933 | 13.9 | 13,427 | 21.8 | 6,345 | 13.2 | 6,747 | 55.4 |
| 1984 | 26,458 | 13.1 | 12,929 | 21.0 | 5,757 | 12.2 | 6,772 | 54.0 |
| 1985 .......... | 25,729 | 12.6 | 12,483 | 20.1 | 5,393 | 11.3 | 6,716 | 53.6 |
| 1986 | 24,754 | 12.0 | 12,257 | 19.8 | 4,942 | 10.4 | 6,943 | 54.4 |
| 1987 | 24,725 | 12.0 | 12,275 | 19.7 | 4,835 | 10.2 | 7,019 | 53.7 |
| 1988 | 24,048 | 11.6 | 11,935 | 19.0 | 4,552 | 9.5 | 6,955 | 52.9 |
| 1989 | 24,066 | 11.5 | 12,001 | 19.0 | 4,738 | 9.9 | 6,808 | 51.1 |
| 1990 | 25,232 | 12.0 | 12,715 | 19.9 | 4,907 | 10.2 | 7,363 | 53.4 |
| 1991 | 27,143 | 12.8 | 13,658 | 21.1 | 5,066 | 10.6 | 8,065 | 55.4 |
| 1992 | 28,961 | 13.3 | 14,521 | 21.6 | 5,547 | 11.2 | 8,368 | 54.6 |
| 1993 | 29,927 | 13.6 | 14,961 | 22.0 | 5,845 | 11.7 | 8,503 | 53.7 |
| 1994 | 28,985 | 13.1 | 14,610 | 21.2 | 5,439 | 10.8 | 8,427 | 52.9 |
| 1995 | 27,501 | 12.3 | 13,999 | 20.2 | 4,971 | 10.0 | 8,364 | 50.3 |
| 1996 | 27,376 | 12.2 | 13,764 | 19.8 | 5,035 | 10.1 | 7,990 | 49.3 |
| 1997 | 26,217 | 11.6 | 13,422 | 19.2 | 4,759 | 9.5 | 7,928 | 49.0 |
Table B-6. Composition of Poverty Population for Selected Demographic Groups, Selected Years
| Demographic group | Year 1 | ||||||||
|---|---|---|---|---|---|---|---|---|---|
| 1959 | 1966 | 1975 | 1985 | 1990 | 1992 | 1994 | 1996 | 1997 | |
|
1 Demographic data are for March of the following year. 2 Includes unrelated or single individuals. 3 Hispanic origin may be of any race; therefore numbers add to more than 100 percent. 4 Family includes related children under 18. Source: 1998 Green Book, Table H-5. Based on data from March Current Population Survey. |
|||||||||
| Aged | 13.9 | 17.9 | 12.8 | 10.5 | 10.9 | 10.3 | 9.6 | 9.4 | 9.5 |
| Children | 43.6 | 42.6 | 42.1 | 38.8 | 39.5 | 39.7 | 39.6 | 38.8 | 39.7 |
| Nonaged adults | 42.5 | 39.5 | 45.1 | 50.7 | 49.7 | 49.9 | 50.8 | 51.8 | 50.8 |
| Individuals in Female-headed families2 | 26.3 | 36.0 | 47.4 | 49.5 | 53.4 | 52.6 | 52.8 | 53.5 | 52.7 |
| Individuals in All other families2 | 73.7 | 64.0 | 52.6 | 50.5 | 46.6 | 47.4 | 47.2 | 46.5 | 47.3 |
| Blacks | 25.1 | 31.1 | 29.2 | 27.0 | 29.3 | 28.5 | 26.8 | 26.5 | 25.6 |
| Whites | 72.1 | 67.7 | 68.7 | 69.1 | 66.5 | 66.4 | 66.7 | 67.5 | 68.6 |
| Other races | 2.8 | 1.2 | 2.1 | 3.9 | 4.2 | 5.1 | 6.5 | 6.0 | 5.8 |
| Hispanic origin3 | NA | NA | 11.6 | 15.8 | 17.9 | 20.0 | 22.1 | 23.8 | 23.4 |
| Individuals in Families with children4 | NA | NA | NA | NA | 68.0 | 68.4 | 68.0 | 66.7 | NA |
| Male present | NA | NA | NA | NA | 30.7 | 31.4 | 31.2 | 30.1 | NA |
| Female head | NA | NA | NA | NA | 37.2 | 37.0 | 36.9 | 36.5 | NA |
| Individuals in all Other families | NA | NA | NA | NA | 32.0 | 31.6 | 32.0 | 33.3 | NA |
Figure B-3. Number of Persons Living in Poverty, Unemployed and Receiving Food Stamps 1 and AFDC, 1959 - 1997
(In millions)
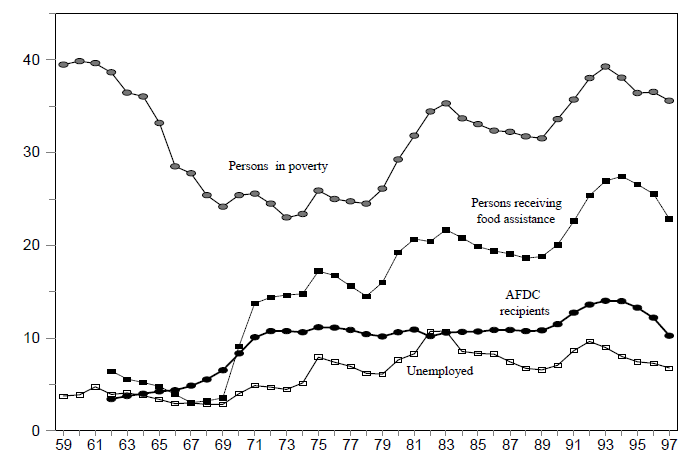
1 Included in the total of persons receiving foods stamps are those persons served by the Family Food Assistance Program (FFAP) which was the predecessor nutrition assistance program to the Food Stamps Program. In 1962 FFAP had 6.4 million participants but by 1967 the number had dropped to 3 million and by 1974, its last year of significant operation it had 1.4 million participants. The Food Stamp program began in the early 1960s on an experimental basis and served less than 1 million participants until 1967 when it reached 1.4 million participants. By 1974 it served 12.9 million participants.
Notes: To be comparable to the poverty and unemployment data, persons receiving food stamps and AFDC benefits in the territories (Guam, Puerto Rico, and the Virgin Islands) are excluded. Data for food stamp participants are for fiscal years; all of the other data series are for calendar years. The reason that the number of AFDC recipients declined slightly during the 1982 recession, rather than increasing as would be expected, was because of new restrictive eligibility provisions enacted as part of OBRA 1981— effective July 1, 1981 families with incomes greater than 150 percent of a State's standard of need were no longer eligible for AFDC income assistance; this was raised to 185 percent in 1984.
Source: U. S. Department of Health and Human Services, Administration for Children and Families, Office of Planning, Research and Evaluation, National Data Bank of the USDA Food and Nutrition Service, U.S. Department of Labor, Bureau of Labor Statistics, Employment and Earnings, monthly, and U.S. Bureau of the Census, “Poverty in the United States: 1997," Current Population Reports, Series P60-201 and earlier years.
Table B-7. Annual AFDC Benefit Levels by State For a Mother and Two Children with No Earnings, Selected Years 1972 – 1996
| State | AFDC Benefit Levels (in 1996 dollars) | Percent Change in Benefits | ||||||||
|---|---|---|---|---|---|---|---|---|---|---|
| 1972 | 1980 | 1985 | 1989 | 1993 | 1994 | 1996 | 1972-89 | 1989-93 | 1993-96 | |
| Average | $8,542 | $6,535 | $5,792 | $5,602 | $4,930 | $4,834 | $4,569 | -34.4 | -12.0 | -7.3 |
| Weighted Average | 8,723 | 6,813 | 6,134 | 5,980 | 5,138 | 5,005 | 4,718 | -31.4 | -14.1 | -8.2 |
|
Note: Dollars adjusted for inflation using fiscal year average values of the CPI-U-X1 price index. Each state's weight in every year is the state's population of persons under 18 years of age in 1990 (for continuity over time Alaska, Hawaii, and the territories are not included). Source: DHHS and Ways and Means Committee staff based upon state AFDC benefit data collected by the Congressional Research Service. |
||||||||||
| Alabama | $3,847 | $2,701 | $2,065 | $1,797 | $2,134 | $2,079 | $1,968 | -53.3 | 18.7 | -7.8 |
| Arizona | 5,842 | 4,624 | 4,078 | 4,462 | 4,515 | 4,399 | 4,164 | -23.6 | 1.2 | -7.8 |
| Arkansas | 4,453 | 3,685 | 3,361 | 3,107 | 2,654 | 2,586 | 2,448 | -30.2 | -14.6 | -7.8 |
| California | 11,363 | 10,825 | 10,274 | 10,570 | 8,119 | 7,694 | 7,152 | -7.0 | -23.2 | -11.9 |
| Colorado | 8,086 | 6,637 | 6,056 | 5,434 | 4,632 | 4,513 | 4,272 | -32.8 | -14.8 | -7.8 |
| Connecticut | 12,396 | 9,292 | 9,959 | 9,884 | 8,848 | 8,620 | 7,632 | -20.3 | -10.5 | -13.7 |
| Delaware | 8,727 | 6,088 | 5,023 | 5,072 | 4,398 | 4,285 | 4,056 | -41.9 | -13.3 | -7.8 |
| District of Columbia | 9,155 | 6,545 | 5,724 | 6,229 | 5,322 | 5,324 | 4,980 | -32.0 | -14.6 | -6.4 |
| Florida | 5,130 | 4,462 | 4,201 | 4,371 | 3,943 | 3,841 | 3,636 | -14.8 | -9.8 | -7.8 |
| Georgia | 4,097 | 3,753 | 3,903 | 4,158 | 3,643 | 3,549 | 3,360 | 1.5 | -12.4 | -7.8 |
| Idaho | 10,686 | 7,393 | 5,321 | 4,828 | 4,125 | 4,018 | 3,804 | -54.8 | -14.6 | -7.8 |
| Illinois | 9,297 | 6,591 | 5,969 | 5,209 | 4,775 | 4,779 | 4,524 | -44.0 | -8.3 | -5.3 |
| Indiana | 7,124 | 5,836 | 4,481 | 4,386 | 3,747 | 3,651 | 3,456 | -38.4 | -14.6 | -7.8 |
| Iowa | 10,472 | 8,239 | 6,301 | 6,244 | 5,543 | 5,400 | 5,112 | -40.4 | -11.2 | -7.8 |
| Kansas | 11,791 | 7,896 | 6,844 | 6,640 | 5,582 | 5,438 | 5,148 | -43.7 | -15.9 | -7.8 |
| Kentucky | 6,590 | 4,303 | 3,448 | 3,472 | 2,967 | 2,877 | 3,144 | -47.3 | -14.6 | 6.0 |
| Louisiana | 4,560 | 3,959 | 3,325 | 2,894 | 2,472 | 2,408 | 2,280 | -36.5 | -14.6 | -7.8 |
| Maine | 7,872 | 6,408 | 6,472 | 6,671 | 5,894 | 5,299 | 5,016 | -15.3 | -11.6 | -14.9 |
| Maryland | 7,124 | 6,179 | 5,758 | 6,031 | 4,762 | 4,728 | 4,476 | -15.3 | -21.0 | -6.0 |
| Massachusetts | 11,683 | 8,193 | 7,561 | 8,209 | 7,013 | 7,340 | 6,780 | -29.7 | -14.6 | -3.3 |
| Michigan (Wayne) | 12,004 | 9,727 | 6,896 | 7,082 | 5,972 | 5,818 | 5,508 | -41.0 | -15.7 | -7.8 |
| Minnesota | 11,755 | 9,543 | 9,242 | 8,102 | 6,922 | 6,744 | 6,384 | -31.1 | -14.6 | -7.8 |
| Mississippi | 1,710 | 2,197 | 1,680 | 1,828 | 1,561 | 1,521 | 1,440 | 6.9 | -14.6 | -7.8 |
| Missouri | 4,809 | 5,676 | 4,796 | 4,341 | 3,799 | 3,701 | 3,504 | -9.7 | -12.5 | -7.8 |
| Montana | 7,872 | 5,928 | 6,196 | 5,468 | 5,218 | 5,273 | 5,256 | -30.5 | -4.6 | 0.7 |
| Nebraska | 8,977 | 7,095 | 6,127 | 5,544 | 4,736 | 4,614 | 4,368 | -38.2 | -14.6 | -7.8 |
| Nevada | 7,409 | 5,996 | 4,989 | 5,026 | 4,528 | 4,411 | 4,176 | -32.2 | -9.9 | -7.8 |
| New Hampshire | 10,971 | 7,918 | 6,809 | 7,706 | 6,714 | 6,972 | 6,600 | -29.8 | -12.9 | -1.7 |
| New Jersey | 11,043 | 8,239 | 7,072 | 6,458 | 5,517 | 5,375 | 5,088 | -41.5 | -14.6 | -7.8 |
| New Mexico | 6,020 | 5,035 | 4,516 | 4,021 | 4,645 | 4,830 | 4,668 | -33.2 | 15.5 | 0.5 |
| New York | 14,035 | 9,017 | 8,297 | 8,209 | 7,508 | 7,314 | 6,924 | -41.5 | -8.5 | -7.8 |
| North Carolina | 6,519 | 4,394 | 4,306 | 4,051 | 3,539 | 3,448 | 3,264 | -37.9 | -12.6 | -7.8 |
| North Dakota | 10,758 | 7,644 | 6,494 | 5,879 | 5,322 | 5,463 | 5,172 | -45.4 | -9.5 | -2.8 |
| Ohio | 7,266 | 6,019 | 5,076 | 4,889 | 4,437 | 4,323 | 4,092 | -32.7 | -9.2 | -7.8 |
| Oklahoma | 8,264 | 6,454 | 4,936 | 4,950 | 4,216 | 4,107 | 3,684 | -40.1 | -14.8 | -12.6 |
| Oregon | 12,610 | 8,880 | 6,757 | 6,579 | 5,985 | 5,831 | 5,520 | -47.8 | -9.0 | -7.8 |
| Pennsylvania | 11,291 | 7,278 | 6,371 | 6,122 | 5,478 | 5,337 | 5,052 | -45.8 | -10.5 | -7.8 |
| Rhode Island | 11,185 | 7,781 | 7,159 | 8,270 | 7,209 | 7,023 | 6,648 | -26.1 | -12.8 | -7.8 |
| South Carolina | 3,419 | 2,953 | 3,273 | 3,137 | 2,602 | 2,535 | 2,400 | -8.2 | -17.1 | -7.8 |
| South Dakota | 10,437 | 7,347 | 5,758 | 5,742 | 5,426 | 5,451 | 5,160 | -45.0 | -5.5 | -4.9 |
| Tennessee | 4,097 | 2,792 | 2,679 | 2,802 | 2,407 | 2,345 | 2,220 | -31.6 | -14.1 | -7.8 |
| Texas | 4,132 | 2,655 | 2,923 | 2,797 | 2,394 | 2,383 | 2,256 | -32.3 | -14.4 | -5.8 |
| Utah | 9,796 | 8,239 | 6,581 | 5,894 | 5,387 | 5,248 | 5,112 | -39.8 | -8.6 | -5.1 |
| Vermont | 11,862 | 11,260 | 10,205 | 9,915 | 8,575 | 8,240 | 7,596 | -16.4 | -13.5 | -11.4 |
| Virginia | 9,546 | 5,904 | 6,196 | 5,391 | 4,606 | 4,487 | 4,248 | -43.5 | -14.6 | -7.8 |
| Washington | 11,683 | 10,482 | 8,332 | 7,493 | 7,104 | 6,921 | 6,552 | -35.9 | -5.2 | -7.8 |
| West Viginia | 7,338 | 4,714 | 4,359 | 3,792 | 3,240 | 3,207 | 3,036 | -48.3 | -14.6 | -6.3 |
| Wisconsin | 12,716 | 10,162 | 9,329 | 7,874 | 6,727 | 6,554 | 6,204 | -38.1 | -14.6 | -7.8 |
| Wyoming | 8,727 | 5,264 | 6,301 | 5,483 | 4,684 | 4,563 | 4,320 | -37.2 | -14.6 | -7.8 |
Table B-8. Annual AFDC and Food Stamp Benefit Levels by State For a Mother and Two Children with No Earnings, Selected Years 1972 – 1996
| State | AFDC & Food Stamp Benefit Levels (in 1996 dollars) | Percent Change in Benefits | ||||||||
|---|---|---|---|---|---|---|---|---|---|---|
| 1972 | 1980 | 1985 | 1989 | 1993 | 1994 | 1996 | 1972-89 | 1989-93 | 1993-96 | |
| Average | $10,769 | $9,136 | $8,563 | $8,411 | $8,139 | $8,020 | $7,876 | -21.9 | -3.2 | -3.2 |
| Weighted Average | 10,921 | 9,331 | 8,811 | 8,682 | 8,286 | 8,136 | 7,977 | -20.5 | -4.6 | -3.7 |
|
Note: Dollars adjusted for inflation using fiscal year average values of the CPI-U-X1 price index. Each state's weight in every year is the state's population of persons under 18 years of age in 1990 (for continuity over time Alaska, Hawaii, and the territories are not included). Source: DHHS and Ways and Means Committee staff based upon state AFDC benefit data collected by the Congressional Research Service. |
||||||||||
| Alabama | $7,481 | $6,452 | $5,706 | $5,391 | $5,933 | $5,818 | $5,724 | -27.9 | 10.1 | -3.5 |
| Arizona | 8,877 | 7,807 | 7,347 | 7,591 | 7,846 | 7,707 | 7,596 | -14.5 | 3.4 | -3.2 |
| Arkansas | 7,905 | 7,152 | 6,844 | 6,642 | 6,454 | 6,325 | 6,204 | -16.0 | -2.8 | -3.9 |
| California | 12,742 | 12,132 | 11,684 | 11,866 | 10,357 | 10,014 | 9,684 | -6.9 | -12.7 | -6.5 |
| Colorado | 10,448 | 9,211 | 8,731 | 8,274 | 7,924 | 7,783 | 7,668 | -20.8 | -4.2 | -3.2 |
| Connecticut | 13,465 | 11,063 | 11,463 | 11,386 | 10,878 | 10,661 | 10,020 | -15.4 | -4.5 | -7.9 |
| Delaware | 10,897 | 8,828 | 8,008 | 8,017 | 7,755 | 7,618 | 7,512 | -26.4 | -3.3 | -3.1 |
| District of Columbia | 11,196 | 9,148 | 8,498 | 8,827 | 8,406 | 8,354 | 8,160 | -21.2 | -4.8 | -2.9 |
| Florida | 8,379 | 7,695 | 7,433 | 7,527 | 7,443 | 7,314 | 7,224 | -10.2 | -1.1 | -2.9 |
| Georgia | 7,655 | 7,200 | 7,224 | 7,377 | 7,235 | 7,111 | 7,032 | -3.6 | -1.9 | -2.8 |
| Idaho | 12,269 | 9,738 | 8,217 | 7,847 | 7,573 | 7,441 | 7,344 | -36.0 | -3.5 | -3.0 |
| Illinois | 11,296 | 9,179 | 8,669 | 8,195 | 8,093 | 8,037 | 7,908 | -27.4 | -1.2 | -2.3 |
| Indiana | 9,775 | 8,653 | 7,628 | 7,537 | 7,300 | 7,175 | 7,092 | -22.9 | -3.2 | -2.8 |
| Iowa | 12,118 | 10,329 | 8,903 | 8,838 | 8,562 | 8,404 | 8,256 | -27.1 | -3.1 | -3.6 |
| Kansas | 13,042 | 10,089 | 9,282 | 9,403 | 8,796 | 8,645 | 8,472 | -27.9 | -6.5 | -3.7 |
| Kentucky | 9,401 | 7,583 | 6,905 | 6,898 | 6,753 | 6,617 | 6,876 | -26.6 | -2.1 | 1.8 |
| Louisiana | 7,979 | 7,344 | 6,819 | 6,488 | 6,272 | 6,148 | 6,036 | -18.7 | -3.3 | -3.8 |
| Maine | 10,298 | 9,052 | 9,022 | 9,136 | 8,809 | 8,328 | 8,184 | -11.3 | -3.6 | -7.1 |
| Maryland | 9,775 | 8,893 | 8,832 | 8,958 | 8,184 | 8,100 | 7,968 | -8.4 | -8.6 | -2.6 |
| Massachusetts | 12,966 | 10,297 | 9,785 | 10,213 | 9,590 | 9,761 | 9,420 | -21.2 | -6.1 | -1.8 |
| Michigan (Wayne) | 13,191 | 11,366 | 9,319 | 9,424 | 8,861 | 8,696 | 8,664 | -28.6 | -6.0 | -2.2 |
| Minnesota | 13,016 | 11,238 | 10,961 | 10,139 | 9,525 | 9,342 | 9,144 | -22.1 | -6.1 | -4.0 |
| Mississippi | 5,608 | 5,951 | 5,321 | 5,422 | 5,361 | 5,261 | 5,196 | -3.3 | -1.1 | -3.1 |
| Missouri | 8,154 | 8,541 | 7,848 | 7,505 | 7,339 | 7,213 | 7,128 | -8.0 | -2.2 | -2.9 |
| Montana | 10,298 | 8,717 | 8,829 | 8,294 | 8,328 | 8,316 | 8,352 | -19.5 | 0.4 | 0.3 |
| Nebraska | 11,071 | 9,531 | 8,780 | 8,348 | 7,989 | 7,859 | 7,740 | -24.6 | -4.3 | -3.1 |
| Nevada | 9,974 | 8,765 | 7,983 | 7,985 | 7,846 | 7,707 | 7,596 | -19.9 | -1.7 | -3.2 |
| New Hampshire | 12,468 | 10,105 | 9,258 | 9,861 | 9,382 | 9,507 | 9,300 | -20.9 | -4.9 | -0.9 |
| New Jersey | 12,517 | 10,329 | 9,441 | 9,101 | 8,640 | 8,480 | 8,328 | -27.3 | -5.1 | -3.6 |
| New Mexico | 9,002 | 8,094 | 7,653 | 7,281 | 7,937 | 8,011 | 7,944 | -19.1 | 9.0 | 0.1 |
| New York | 15,051 | 10,872 | 10,577 | 10,455 | 10,136 | 9,951 | 9,720 | -30.5 | -3.1 | -4.1 |
| North Carolina | 9,351 | 7,647 | 7,505 | 7,303 | 7,157 | 7,035 | 6,960 | -21.9 | -2.0 | -2.7 |
| North Dakota | 12,318 | 9,913 | 9,037 | 8,582 | 8,406 | 8,455 | 8,292 | -30.3 | -2.1 | -1.4 |
| Ohio | 9,875 | 8,780 | 8,045 | 7,889 | 7,846 | 7,656 | 7,536 | -20.1 | -0.5 | -4.0 |
| Oklahoma | 10,572 | 9,083 | 7,946 | 7,932 | 7,625 | 7,504 | 7,260 | -25.0 | -3.9 | -4.8 |
| Oregon | 13,626 | 10,776 | 9,841 | 9,612 | 9,329 | 9,152 | 8,964 | -29.5 | -2.9 | -3.9 |
| Pennsylvania | 12,692 | 9,658 | 8,952 | 8,753 | 8,510 | 8,366 | 8,208 | -31.0 | -2.8 | -3.5 |
| Rhode Island | 12,617 | 10,009 | 9,592 | 10,334 | 9,798 | 10,027 | 9,792 | -18.1 | -5.2 | -0.1 |
| South Carolina | 7,181 | 6,642 | 6,783 | 6,663 | 6,402 | 6,275 | 6,156 | -7.2 | -3.9 | -3.8 |
| South Dakota | 12,094 | 9,706 | 8,523 | 8,486 | 8,484 | 8,442 | 8,292 | -29.8 | -0.0 | -2.3 |
| Tennessee | 7,655 | 6,530 | 6,319 | 6,397 | 6,207 | 6,085 | 5,976 | -16.4 | -3.0 | -3.7 |
| Texas | 7,680 | 6,407 | 6,538 | 6,392 | 6,194 | 6,123 | 6,012 | -16.8 | -3.1 | -2.9 |
| Utah | 11,645 | 10,329 | 9,098 | 8,593 | 8,445 | 8,303 | 8,256 | -26.2 | -1.7 | -2.2 |
| Vermont | 13,091 | 12,436 | 11,635 | 11,407 | 10,683 | 10,394 | 9,996 | -12.9 | -6.4 | -6.4 |
| Virginia | 11,470 | 8,701 | 8,829 | 8,241 | 7,898 | 7,770 | 7,656 | -28.2 | -4.2 | -3.1 |
| Washington | 12,966 | 11,893 | 10,492 | 9,922 | 9,993 | 9,799 | 9,576 | -23.5 | 0.7 | -4.2 |
| West Viginia | 9,925 | 7,871 | 7,542 | 7,122 | 6,948 | 6,870 | 6,792 | -28.2 | -2.4 | -2.2 |
| Wisconsin | 13,734 | 11,669 | 11,022 | 9,979 | 9,395 | 9,216 | 9,024 | -27.3 | -5.9 | -3.9 |
| Wyoming | 10,897 | 8,254 | 8,903 | 8,305 | 7,963 | 7,821 | 7,704 | -23.8 | -4.1 | -3.3 |
Table B-9. Civilian Unemployment Rate, Selected Years 1979 – 1997
(Percent of Civilian Labor Force)
| 1979 | 1982 | 1985 | 1989 | 1992 | 1993 | 1994 | 1995 | 1996 | 1997 | |
|---|---|---|---|---|---|---|---|---|---|---|
| United States | 5.8 | 9.7 | 7.2 | 5.3 | 7.5 | 6.9 | 6.1 | 5.6 | 5.4 | 4.9 |
| Source: U.S. Department of Labor, Bureau of Labor Statistics, Local Area Unemployment Statistics, Geographic Profile of Employment and Unemployment, annual, (data for 1997 available online at http://stats.bls.gov:80/lauhome.htm). | ||||||||||
| Alabama | 7.1 | 14.4 | 8.9 | 7.0 | 7.4 | 7.6 | 6.0 | 6.3 | 5.1 | 5.1 |
| Alaska | 9.2 | 9.9 | 9.7 | 6.7 | 9.2 | 7.7 | 7.8 | 7.3 | 7.8 | 7.9 |
| Arizona | 5.1 | 9.9 | 6.5 | 5.2 | 7.6 | 6.3 | 6.4 | 5.1 | 5.5 | 4.6 |
| Arkansas | 6.2 | 9.8 | 8.7 | 7.2 | 7.3 | 6.2 | 5.3 | 4.9 | 5.4 | 5.3 |
| California | 6.2 | 9.9 | 7.2 | 5.1 | 9.3 | 9.4 | 8.6 | 7.8 | 7.2 | 6.3 |
| Colorado | 4.8 | 7.7 | 5.9 | 5.8 | 6.0 | 5.3 | 4.2 | 4.2 | 4.2 | 3.3 |
| Connecticut | 5.1 | 6.9 | 4.9 | 3.7 | 7.6 | 6.3 | 5.6 | 5.5 | 5.7 | 5.1 |
| Delaware | 8.0 | 8.5 | 5.3 | 3.5 | 5.3 | 5.3 | 4.9 | 4.3 | 5.2 | 4.0 |
| Dist. of Columbia | 7.5 | 10.6 | 8.4 | 5.0 | 8.6 | 8.6 | 8.2 | 8.9 | 8.5 | 7.9 |
| Florida | 6.0 | 8.2 | 6.0 | 5.6 | 8.3 | 7.0 | 6.6 | 5.5 | 5.1 | 4.8 |
| Georgia | 5.1 | 7.8 | 6.5 | 5.5 | 7.0 | 5.8 | 5.2 | 4.9 | 4.6 | 4.5 |
| Hawaii | 6.3 | 6.7 | 5.6 | 2.6 | 4.6 | 4.3 | 6.1 | 5.9 | 6.4 | 6.4 |
| Idaho | 5.7 | 9.8 | 7.9 | 5.1 | 6.5 | 6.2 | 5.6 | 5.4 | 5.2 | 5.3 |
| Illinois | 5.5 | 11.3 | 9.0 | 6.0 | 7.6 | 7.5 | 5.7 | 5.2 | 5.3 | 4.7 |
| Indiana | 6.4 | 11.9 | 7.9 | 4.7 | 6.6 | 5.4 | 4.9 | 4.7 | 4.1 | 3.5 |
| Iowa | 4.1 | 8.5 | 8.0 | 4.3 | 4.7 | 4.0 | 3.7 | 3.5 | 3.8 | 3.3 |
| Kansas | 3.4 | 6.3 | 5.0 | 4.0 | 4.3 | 5.0 | 5.3 | 4.4 | 4.5 | 3.8 |
| Kentucky | 5.6 | 10.6 | 9.5 | 6.2 | 6.9 | 6.2 | 5.4 | 5.4 | 5.6 | 5.4 |
| Louisiana | 6.7 | 10.3 | 11.5 | 7.9 | 8.2 | 7.5 | 8.0 | 6.9 | 6.7 | 6.1 |
| Maine | 7.2 | 8.6 | 5.4 | 4.1 | 7.2 | 7.9 | 7.4 | 5.7 | 5.1 | 5.4 |
| Maryland | 5.9 | 8.4 | 4.6 | 3.7 | 6.7 | 6.2 | 5.1 | 5.1 | 4.9 | 5.1 |
| Massachusetts | 5.5 | 7.9 | 3.9 | 4.0 | 8.6 | 6.9 | 6.0 | 5.4 | 4.3 | 4.0 |
| Michigan | 7.8 | 15.5 | 9.9 | 7.1 | 8.9 | 7.1 | 5.9 | 5.3 | 4.9 | 4.2 |
| Minnesota | 4.2 | 7.8 | 6.0 | 4.3 | 5.2 | 5.1 | 4.0 | 3.7 | 4.0 | 3.3 |
| Mississippi | 5.8 | 11.0 | 10.3 | 7.8 | 8.2 | 6.4 | 6.6 | 6.1 | 6.1 | 5.7 |
| Missouri | 4.5 | 9.2 | 6.4 | 5.5 | 5.7 | 6.5 | 4.9 | 4.8 | 4.6 | 4.2 |
| Montana | 5.1 | 8.6 | 7.7 | 5.9 | 6.9 | 6.1 | 5.1 | 5.9 | 5.3 | 5.4 |
| Nebraska | 3.2 | 6.1 | 5.5 | 3.1 | 3.0 | 2.7 | 2.9 | 2.6 | 2.9 | 2.6 |
| Nevada | 5.1 | 10.1 | 8.0 | 5.0 | 6.7 | 7.3 | 6.2 | 5.4 | 5.4 | 4.1 |
| New Hampshire | 3.1 | 7.4 | 3.9 | 3.5 | 7.5 | 6.6 | 4.6 | 4.0 | 4.2 | 3.1 |
| New Jersey | 6.9 | 9.0 | 5.7 | 4.1 | 8.5 | 7.5 | 6.8 | 6.4 | 6.2 | 5.1 |
| New Mexico | 6.6 | 9.2 | 8.8 | 6.7 | 7.0 | 7.7 | 6.3 | 6.3 | 8.1 | 6.2 |
| New York | 7.1 | 8.6 | 6.5 | 5.1 | 8.6 | 7.8 | 6.9 | 6.3 | 6.2 | 6.4 |
| North Carolina | 4.8 | 9.0 | 5.4 | 3.5 | 6.0 | 4.9 | 4.4 | 4.3 | 4.3 | 3.6 |
| North Dakota | 3.7 | 5.9 | 5.9 | 4.3 | 5.1 | 4.4 | 3.9 | 3.3 | 3.1 | 2.5 |
| Ohio | 5.9 | 12.5 | 8.9 | 5.5 | 7.3 | 6.5 | 5.5 | 4.8 | 4.9 | 4.6 |
| Oklahoma | 3.4 | 5.7 | 7.1 | 5.6 | 5.7 | 6.1 | 5.8 | 4.7 | 4.1 | 4.1 |
| Oregon | 6.8 | 11.5 | 8.8 | 5.7 | 7.6 | 7.3 | 5.4 | 4.8 | 5.9 | 5.8 |
| Pennsylvania | 6.9 | 10.9 | 8.0 | 4.5 | 7.6 | 7.1 | 6.2 | 5.9 | 5.3 | 5.2 |
| Rhode Island | 6.6 | 10.2 | 4.9 | 4.1 | 9.0 | 7.8 | 7.1 | 7.0 | 5.1 | 5.3 |
| South Carolina | 5.0 | 10.8 | 6.8 | 4.7 | 6.3 | 7.6 | 6.3 | 5.1 | 6.0 | 4.5 |
| South Dakota | 3.5 | 5.5 | 5.1 | 4.2 | 3.2 | 3.6 | 3.3 | 2.9 | 3.2 | 3.1 |
| Tennessee | 5.8 | 11.8 | 8.0 | 5.1 | 6.4 | 5.7 | 4.8 | 5.2 | 5.2 | 5.4 |
| Texas | 4.2 | 6.9 | 7.0 | 6.7 | 7.7 | 7.2 | 6.4 | 6.0 | 5.6 | 5.4 |
| Utah | 4.3 | 7.8 | 5.9 | 4.6 | 5.0 | 3.9 | 3.7 | 3.6 | 3.5 | 3.1 |
| Vermont | 5.1 | 6.9 | 4.8 | 3.7 | 6.7 | 5.5 | 4.7 | 4.2 | 4.6 | 4.0 |
| Virginia | 4.7 | 7.7 | 5.6 | 3.9 | 6.4 | 5.1 | 4.9 | 4.5 | 4.4 | 4.0 |
| Washington | 6.8 | 12.1 | 8.1 | 6.2 | 7.6 | 7.6 | 6.4 | 6.4 | 6.5 | 4.8 |
| West Virginia | 6.7 | 13.9 | 13.0 | 8.6 | 11.4 | 10.9 | 8.9 | 7.9 | 7.5 | 6.9 |
| Wisconsin | 4.5 | 10.7 | 7.2 | 4.4 | 5.2 | 4.7 | 4.7 | 3.7 | 3.5 | 3.7 |
| Wyoming | 2.8 | 5.8 | 7.1 | 6.3 | 5.7 | 5.5 | 5.3 | 4.8 | 5.0 | 5.1 |
Appendix C. Additional Nonmarital Birth Data
Table C-1. Percentage of Births that are to Unmarried Women Within Age Groups by Race
| White | Black | |||||||||
|---|---|---|---|---|---|---|---|---|---|---|
| Under Age 15 | Age 15 - 17 | Age 18 - 19 | All Teens | All Women | Under Age 15 | Age 15 - 17 | Age 18 – 19 | All Teens | All Women | |
|
Notes: Births to unmarried women in the United States for 1940 - 1979 are estimated from data for registration areas in which marital status of the mother was reported; see sources below. Beginning in 1980, births to unmarried women in the United States are based on data from states reporting marital status directly and data from nonreporting states for which marital status was inferred from other information on the birth certificate; see sources below. Data for 1996 are preliminary. Sources: U. S. Department of Health and Human Services, National Center for Health Statistics, "Births to Unmarried Mothers: United States, 1980 - 1992," Vital and Health Statistics, Series 21, No. 53, 1995 and U.S. Department of Health and Human Services, National Center for Health Statistics, "Report of Final Natality Statistics, 1996," Monthly Vital Statistics Report, Vol. 46, No. 11, June 30, 1998. |
||||||||||
| 1940 | 44.4 | NA | NA | 7.2 | 1.9 | NA | NA | NA | NA | NA |
| 1941 | 44.9 | NA | NA | 7 | 1.9 | NA | NA | NA | NA | NA |
| 1942 | 40.5 | NA | NA | 6.4 | 1.7 | NA | NA | NA | NA | NA |
| 1943 | 45.2 | NA | NA | 6.5 | 1.6 | NA | NA | NA | NA | NA |
| 1944 | 41.3 | NA | NA | 8.4 | 2 | NA | NA | NA | NA | NA |
| 1945 | 50.7 | NA | NA | 10 | 2.4 | NA | NA | NA | NA | NA |
| 1946 | 52.4 | NA | NA | 8.4 | 2.1 | NA | NA | NA | NA | NA |
| 1947 | 45.1 | NA | NA | 6.6 | 1.8 | NA | NA | NA | NA | NA |
| 1948 | 39.9 | 10.3 | 4.6 | 6.3 | 1.8 | NA | NA | NA | NA | NA |
| 1949 | 40.4 | 10 | 4.5 | 6.1 | 1.7 | NA | NA | NA | NA | NA |
| 1950 | 41.9 | 10.2 | 4.8 | 6.4 | 1.7 | NA | NA | NA | NA | NA |
| 1951 | 34.9 | 9.7 | 4.4 | 5.9 | 1.6 | NA | NA | NA | NA | NA |
| 1952 | 40.4 | 9.6 | 4.4 | 6 | 1.6 | NA | NA | NA | NA | NA |
| 1953 | 43.1 | 9.6 | 4.5 | 6.1 | 1.7 | NA | NA | NA | NA | NA |
| 1954 | 36.8 | 10.2 | 4.9 | 6.5 | 1.8 | NA | NA | NA | NA | NA |
| 1955 | 42.1 | 10.2 | 4.9 | 6.6 | 1.9 | NA | NA | NA | NA | NA |
| 1956 | 42.6 | 10.2 | 4.8 | 6.5 | 1.9 | NA | NA | NA | NA | NA |
| 1957 | 41.5 | 10.4 | 4.7 | 6.5 | 2 | NA | NA | NA | NA | NA |
| 1958 | 45.3 | 10.8 | 4.9 | 6.8 | 2.1 | NA | NA | NA | NA | NA |
| 1959 | 46.7 | 11.4 | 5.2 | 7.2 | 2.2 | NA | NA | NA | NA | NA |
| 1960 | 47.5 | 11.7 | 5.4 | 7.4 | 2.3 | NA | NA | NA | NA | NA |
| 1961 | 49.9 | 12.4 | 6 | 7.9 | 2.5 | NA | NA | NA | NA | NA |
| 1962 | 48.3 | 13.4 | 6.1 | 8.2 | 2.8 | NA | NA | NA | NA | NA |
| 1963 | 50.3 | 15.1 | 7 | 9.4 | 3.1 | NA | NA | NA | NA | NA |
| 1964 | 52.3 | 16 | 7.6 | 10.4 | 3.4 | NA | NA | NA | NA | NA |
| 1965 | 57.3 | 17.3 | 9.1 | 11.7 | 4 | NA | NA | NA | NA | NA |
| 1966 | 52.5 | 19.5 | 9.9 | 12.6 | 4.4 | NA | NA | NA | NA | NA |
| 1967 | 61.6 | 21 | 11.2 | 14.2 | 4.9 | NA | NA | NA | NA | NA |
| 1968 | 61 | 23.4 | 12.7 | 16.1 | 5.3 | NA | NA | NA | NA | NA |
| 1969 | 57 | 24 | 12.9 | 16.6 | 5.5 | 91.7 | 72.1 | 48.3 | 60 | 34.9 |
| 1970 | 57.9 | 25.2 | 13.5 | 17.5 | 5.7 | 93.5 | 76 | 52.1 | 64 | 37.6 |
| 1971 | 60.5 | 25.2 | 13.2 | 17.4 | 5.6 | 95 | 79.6 | 56 | 68.1 | 40.5 |
| 1972 | 59 | 26.4 | 13.7 | 18.5 | 6 | 96.4 | 81 | 59 | 70.7 | 43.9 |
| 1973 | 65.2 | 27.6 | 14.3 | 19.6 | 6.4 | 96.4 | 82.6 | 60.4 | 72.1 | 45.7 |
| 1974 | 65.3 | 29.4 | 15 | 20.8 | 6.5 | 97.4 | 84.8 | 63.8 | 74.7 | 47.1 |
| 1975 | 71 | 33 | 17.2 | 23.5 | 7.3 | 98.4 | 87.4 | 67.6 | 77.8 | 48.8 |
| 1976 | 69.3 | 35.7 | 18.8 | 25.4 | 7.7 | 99.1 | 89.7 | 70.9 | 80.5 | 50.3 |
| 1977 | 72.8 | 38.9 | 21 | 27.8 | 8.2 | 98.8 | 90.6 | 74.6 | 82.6 | 51.7 |
| 1978 | 73.1 | 40.1 | 22.5 | 29.1 | 8.7 | 97.2 | 90.9 | 76.5 | 83.5 | 53.2 |
| 1979 | 75 | 42.4 | 24.3 | 30.8 | 9.4 | 99.4 | 92.9 | 78.9 | 85.7 | 54.7 |
| 1980 | 75.4 | 45.4 | 27.1 | 33.6 | 11.2 | 98.6 | 93.1 | 79.9 | 86.2 | 56.1 |
| 1981 | 76.5 | 48 | 28.7 | 35.5 | 11.8 | 98.9 | 93.9 | 81.3 | 87.2 | 56.9 |
| 1982 | 77.7 | 50.1 | 30.3 | 37.2 | 12.3 | 98.4 | 94.2 | 82.4 | 87.9 | 57.7 |
| 1983 | 79.9 | 53.1 | 32.7 | 39.8 | 12.9 | 98.5 | 95.1 | 84.4 | 89.4 | 59.2 |
| 1984 | 80.8 | 55.4 | 35.1 | 42.2 | 13.6 | 98.6 | 95.3 | 85.4 | 90 | 60.3 |
| 1985 | 82.4 | 58 | 38.2 | 45.3 | 14.7 | 98.8 | 95.6 | 86.2 | 90.6 | 61.2 |
| 1986 | 83.6 | 61.3 | 41.7 | 48.8 | 15.9 | 99 | 95.7 | 86.9 | 91.1 | 62.4 |
| 1987 | 84.6 | 64.6 | 44.4 | 51.8 | 16.9 | 99.1 | 96.1 | 87.6 | 91.7 | 63.4 |
| 1988 | 86.5 | 66.2 | 47.3 | 54.1 | 18 | 98.9 | 96.4 | 88.5 | 92.3 | 64.7 |
| 1989 | 84.7 | 67.2 | 49.5 | 55.7 | 19.2 | 98.4 | 96.1 | 89 | 92.3 | 59.2 |
| 1990 | 83.6 | 67.9 | 50.8 | 56.8 | 20.4 | 98.5 | 95.6 | 89.4 | 92.2 | 59.8 |
| 1991 | 75.5 | 69.7 | 53.2 | 59 | 21.8 | 98.1 | 95.7 | 89.8 | 92.5 | 60.3 |
| 1992 | 76.2 | 70.6 | 54.9 | 60.6 | 22.6 | 97.6 | 95.6 | 90.4 | 92.8 | 68.1 |
| 1993 | 83.2 | 71.7 | 57.2 | 62.7 | 23.6 | 98.1 | 95.7 | 90.8 | 93.1 | 68.7 |
| 1994 | 90.4 | 77.5 | 61.9 | 68 | 25.4 | 99.1 | 97.8 | 93.4 | 95.5 | 70.4 |
| 1995 | 88.8 | 77.4 | 62.1 | 68 | 25.3 | 99.1 | 97.7 | 93.2 | 95.3 | 69.9 |
| 1996 | 90.1 | 78.8 | 63.3 | 69.2 | 25.7 | 99.1 | 97.9 | 93.6 | 95.6 | 69.8 |