
Acknowledgements
Any large scale research effort is made possible through the efforts of many hands, and the National Survey of Adoptive Parents (NSAP) and the compilation of this Chartbook is no exception. Important to this effort is the interagency collaboration that occurred throughout the development of the questionnaire, the implementation of the survey, and, finally, the publication of the Chartbook.
The NSAP was sponsored by the Office of the Assistant Secretary for Planning and Evaluation (ASPE) and the Children’s Bureau within the Administration for Children and Families (ACF). In 2005-06 the Urban Institute developed the questionnaire used in the survey under contract to the Office of the Assistant Secretary for Planning and Evaluation (233-02-0092, task 10). The survey was conducted in 2007-08 by the Centers for Disease Control and Prevention’s (CDC) National Center for Health Statistics (NCHS) as a module of the State and Local Area Integrated Telephone Survey (SLAITS). The CDC’s National Center for Immunization and Respiratory Diseases graciously permitted the use of the National Immunization Survey sampling frame for this survey. Data collection was conducted by the National Opinion Research Center (NORC) at the University of Chicago under contract to the NCHS.
In 2008-09 this Chartbook was developed by Child Trends under contract to the Office of the Assistant Secretary for Planning and Evaluation (HHSP233200800506G). The Child Trends authors would like to acknowledge the assistance of many individuals in the data analysis and development of the Chartbook. First, we wish to express our thanks to our Federal Project Officers, Laura Radel with the Office of the Assistant Secretary for Planning and Evaluation and Matthew Bramlett with the National Center for Health Statistics, for their invaluable oversight and input throughout the development of this Chartbook. In addition, Dr. Bramlett was the NSAP survey director and provided valuable insights with his extensive statistical expertise. We also wish to thank the expert consultants who reviewed drafts of this Chartbook and helped to identify key themes and suggested ways to clarify the presentation: Richard Barth, Professor and Dean of the University of Maryland School of Social Work; Penelope Maza, former Senior Policy Research Analyst in the U.S. Children’s Bureau; and Debbie Riley, Executive Director, The Center for Adoption Support and Education. In addition, Child Trends senior staff member David Murphey reviewed early drafts of the Chartbook and provided valuable insight. Erin Bishop, former research assistant at Child Trends, was an integral part of the team, diligently conducting analytical tasks. The Chartbook was designed by Chris Mazzatenta.
Most importantly, we extenad our appreciation to the thousands of parents who were willing to share their stories. Their efforts made this Chartbook a reality.
Introduction
This Chartbook presents findings from the 2007 National Survey of Adoptive Parents (NSAP). The NSAP is the first-ever survey to provide representative information about the characteristics, adoption experiences, and wellbeing of adopted children and their families in the United States. All information was reported by the children’s adoptive parents. The findings represent children under age 18 who were adopted and living with neither biological parent. This includes children adopted from foster care, from other domestic sources, and from other countries. Furthermore, the Chartbook includes comparable information on children in the general population for many indicators of well-being, based on data from the 2007 National Survey of Children’s Health (NSCH). While adopted children comprise only a small portion of the overall U.S. child population—about 2 percent—their absolute numbers are sizable, numbering nearly 1.8 million.i This group of children is of particular concern to policy makers and the public both due to the government’s role in establishing adoptive parent-child relationships as well as the potential vulnerabilities of some segments of this population.
ABOUT THE DATA SOURCES
The National Survey of Children’s Health (NSCH) is a nationally representative survey of U.S. children under age 18. In each sampled household, one child under age 18 was randomly selected. A parent or guardian knowledgeable about the child’s health answered questions by telephone regarding the child’s and the family’s health and well-being and provided information about demographic characteristics. The 2007 NSCH includes information on 91,642 focal children, representing 73.8 million children throughout the United States.
The National Survey of Adoptive Parents (NSAP) was an add-on module to the 2007 NSCH. If the focal child in the 2007 NSCH was adopted, an adoptive parent of the child was asked to participate in the NSAP, a 30-minute telephone survey. A total of 2,737 focal children were identified as having been adopted in the 2007 NSCH. NSAP interviews were carried out between April 2007 and June 2008 regarding 2,089 children, representing nearly 1.8 million children throughout the nation. Adopted children who were also living with a biological parent, whose adoptions were assumed to be primarily step-parent adoptions, were excluded from the NSAP.
Additional details about both surveys can be found in the Appendix to this Chartbook.
The Adoption Process
THREE PRIMARY WAYS TO ADOPT IN THE UNITED STATES
Foster care adoption: Children adopted from foster care are those who, prior to their adoption, were involved with the child protective services system and removed from their families due to their families’ inability or unwillingness to provide appropriate care. Public child welfare agencies oversee such adoptions, although they may contract with private adoption agencies to perform some adoption functions.
Private domestic adoption: This group is defined here as children who were adopted privately from within the United States, and who were not part of the foster care system at any time prior to their adoption. Such adoptions may be arranged independently or through private adoption agencies.
International adoption: This group includes children who originated from countries other than the United States. Typically, adoptive parents work with private U.S. adoption agencies, which coordinate with adoption agencies and other entities in children’s countries of origin.
Note: Additional details about how the three types of adoption were identified can be found in the Appendix to this Chartbook. Definitions of additional terms specific to adoption can be found in the glossary at the end of this introduction.
Adoption establishes a legal parent-child relationship between a child and one or two adults who are not the child’s biological parents. Once finalized, adoption affords adoptive parents rights and responsibilities identical to those of biological parents. Except for children in step-family adoptions, who are not examined in this Chartbook, children who have been adopted all share the experience of being raised by parents who are not their biological parents. Adoptive parents also share common experiences such as having a judge legally establish the adoptive placement. Adoption is a complex process—in terms of the paths through which children come to be adopted, the various processes by which parents can adopt, and the laws that govern those processes.
Prior to adopting, prospective adoptive parents undergo an assessment, often called a home study. The purpose of this assessment is to identify families’ appropriateness and readiness for adoption. Specific requirements vary across jurisdictions and depend upon the type of adoption, but often involve training, individual and family interviews, home safety inspections, and reviews of records (such as health evaluations, child abuse and criminal clearances, and driving records).1
(Note to reader: Footnotes are denoted using roman numerals, renumbered in each section of the chartbook. Endnotes are denoted using cardinal numbers running consecutively throughout the chartbook.)
Several distinct situations underlie adoption. Children in foster care in the United States— that is, children under the legal guardianship of a public child welfare agency following maltreatment or abandonment by their birth parents—can be adopted if reunification with their birth parents is not in the child’s best interests. Public child welfare agencies oversee adoptions of foster children, either directly or through contracts with private licensed agencies.
Other U.S. children are adopted after their parents voluntarily make an adoption plan for their child.2 Prospective adoptive parents seeking to adopt domestically from sources other than foster care can either use a licensed agency or adopt independently. In a licensed agency adoption, agencies work with both prospective adoptive and birth families, and often facilitate matches between them. Prior to adoption finalization, birth parents relinquish their parental rights to the adoption agency. Licensed agencies must adhere to licensing and procedural standards; unlicensed agencies are sometimes used as well. With independent adoption, prospective adoptive parents and birth parents identify each other independently of an agency, for example, through relatives or mutual acquaintances, word of mouth, or through advertisements. Attorneys may facilitate such adoptions.3
Americans can also adopt children from other countries. The eligibility of these children for adoption is governed by the laws of children’s home countries. Following the adoption, children must legally immigrate to the United States (unless the parents choose to live elsewhere). Internationally adopted children subsequently need to be naturalized in order to become American citizens.
As of April 1, 2008, the Hague Convention on Protection of Children and Co-operation in Respect of Intercountry Adoption governs adoptions from approximately 75 countries that, like the United States, are parties to it. The Hague Convention determines which children are eligible for adoption and immigration. Its purpose is to protect children and to ensure that placements made are in the best interests of children. For adoptions from countries not party to the Hague Convention, U.S. law dictates that children must have been orphans in order to immigrate into the United States. U.S. law defines an orphan as a child who has no living parents or a child whose single parent cannot care for the child and has provided written relinquishment of the child for emigration and adoption.4
In some instances, adoptive parents and children choose to end the relationship with the child and do not proceed with finalization, i.e., legalization of an adoption, following the child’s placement in their home. This scenario is referred to as “disruption.” Legally ending an adoption following finalization is referred to as “dissolution.” Dissolution is particularly difficult to study, but existing research suggests that it is rare.5
Children in these situations enter (or return to) foster care or are placed with new adoptive parents. The NSAP does not include information on the incidence of disruption or dissolution. The sample only includes children with finalized adoptions living with their parents at the time of the survey. The survey did ask parents if they had ever considered dissolving the adoption and positive responses were so rare that a reliable percentage estimate could not be generated.
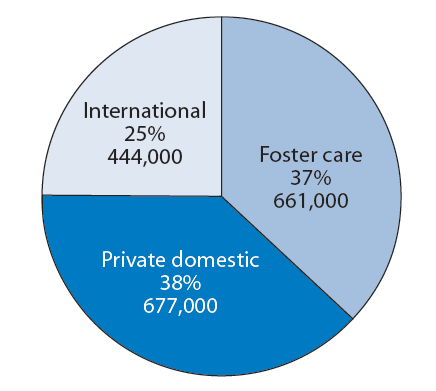
Among all adopted children in 2007—with the exclusion of those living with at least one biological parent (i.e., in step families)—one out of four was adopted from other nations; of the remaining children adopted domestically, half were adopted from foster care and half from private sources; see Figure 1. For more information see Appendix Table 1 on page 53.
Figure 1. Number and percentage distribution of adopted children by adoption type
Interpreting Differences Among Percentages
When comparing adopted children with all U.S. children, readers should be aware of some key differences between the two populations.
- Adopted children tend to be older than children in the general population. Among adopted children, 6 percent are under age 3, compared with 16 percent of children in the general population, according to data from the NSAP and NSCH. Among other reasons, this age difference is partly due to the fact that children are often adopted later than infancy. Additionally, the estimates presented here represent children with finalized adoptions, and finalizations typically take a minimum of six months.
- Many child and family well-being indicators differ according to children’s ages. Therefore, when comparing wellbeing between adopted children and the general population of children, some differences may be attributable to the older ages, on average, of adopted children. For example, older children will have had more time in which a health problem may have been diagnosed than will younger children. As a way of accounting for the fact that on average adopted children are older, the Chartbook presents some indicators by age group.ii
Adopted children and children in the general population also differ in ways other than age, some of which are explored in Part 1 of this Chartbook. Part 1 also explores some of the ways in which the characteristics of adopted children differ by adoption type.
This Chartbook provides a snapshot at a single point in time of the characteristics, experiences, and well-being of adopted children and their families. All comparisons between groups that are highlighted in the text are statistically significant at the .05 level of significance; notable differences or associations that are statistically significant at the .10 level were also in some cases mentioned and footnoted as “marginally significant” at the .10 level. A difference that is statistically significant is one that exists not just among the survey respondents, but that can be inferred to exist in the population they represent; the values of .05 and .10 are commonly used as thresholds for making such assumptions. Although group differences are present by adoptive status or by adoption type, assumptions about the reasons for any such differences should not be made based on the data presented in the Chartbook. Further analyses of the data will help shed light on how different factors are independently associated with indicators of interest. However, inferences concerning cause and effect are not appropriate, even where analyses account for multiple, interrelated variables.
In addition to testing the statistical significance of differences between groups of children according to adoption type, we also examined the relative standard error of each estimate. The relative standard error (calculated as the ratio of the standard error to the percentage estimate itself) is one method for determining the reliability of estimates. We generally avoided reporting estimates for which the relative standard error exceeded 0.3, and— at a minimum flagged such estimates in the appendix tables to denote their imprecision. Additionally, value labels for percentages with standard errors exceeding 0.3 are omitted from the figures in this Chartbook.
Changes in the Adoption Landscape
The adoption landscape is constantly shifting, as a result of changes in U.S. and international laws, as well as changes in societal attitudes and other circumstances. These changes mean that readers should be particularly cautious in inferring how the snapshot presented in this Chartbook may apply to future adopted children and their families.
The Hague Convention, in particular, may result in substantial changes to international adoption. For example, according to the NSAP, 11 percent of all internationally adopted children under age 18 had been adopted from Guatemala as of 2007, but in March 2008, the U.S. Department of State announced that it would not process Guatemalan adoptions until further notice, due to concerns about the country’s ability to adhere to the guidelines of the Hague Convention. Additionally, in September of 2008, Guatemala stopped accepting any new adoption cases. Adoptions from Guatemala came to a halt immediately following a year during which it was the source of the single largest number of internationally adopted children.6
Even prior to the adoption of the Hague Convention, some other countries had changed their adoption requirements. For example, as of May 2007, China enacted a stricter policy requiring that adoptive parents be married couples between the ages of 30 and 50 with assets of at least $80,000 who are good health (including not being overweight).7 In addition to China, other countries, such as Russia8 and Korea,9 are attempting to promote domestic adoption rather than relying on international adoption. Such efforts are likely to reduce the number of international adoptions to the United States.
Overall, international adoptions to the United States have been declining since 2004,10 which may result in more parents adopting children domestically. Beginning in the 1990s, state, federal, and private initiatives to achieve permanency for foster children have influenced adoptions within the United States, as well.11 In particular, recent efforts have focused on adoptions for older foster youth who cannot be reunified with their birth family.
Recent and continuing developments in reproductive medicine may also affect the adoption landscape. For many people seeking to build families, treatments such as intrauterine insemination and in vitro fertilization, either with the parents’ own genetic material or with donor sperm and/or eggs, increasingly provide alternatives to adoption. At the same time, the relinquishment of infants born to never-married women has become rarer, declining from 8.7 percent prior to 1973 to 1 percent throughout the 1990s.12
All Adopted Children
Throughout this Chartbook, we present indicators pertaining to the characteristics, experiences, and well-being of adopted children and their families. We highlight a few key findings pertaining to adopted children as a group below:
- Most adopted children (85 percent) are in excellent or very good health. At the same time, the parents of 26 percent of adopted children report that their child experiences moderate or severe consequences of any of 16 possible medical or psychological conditions. Adopted children are more likely than children in the general population to have health insurance (95 compared with 91 percent) and to have had insurance continuously over the previous 12 months (91 compared with 85 percent). The incidence of special health care needs13 is about twice as high in the population of adopted children as it is among the general population of U.S. children (39 compared with 19 percent). However, because adopted children comprise such a small share of the general population, the absolute number of adopted children with special health care needs is far smaller (702,000, compared with 14,136,000 of all U.S. children).
- The majority of adopted children also fare well according to measures of social and emotional well-being. For example, only a small minority of adopted children have ever been diagnosed with disorders such as attachment disorder, depression, attention deficit disorder or attention deficit/hyperactivity disorder(ADD/ADHD), or behavior or conduct disorder. (See page 27 for definitions and the prevalence of these disorders.) Furthermore, 88 percent of adopted children ages 6 and older exhibit positive social behaviors. However, compared to the general population of children, adopted children are more likely to have ever been diagnosed with—and to have moderate or severe symptoms of—depression, ADD/ADHD, or behavior/conduct disorder.iii
- The majority of adopted children have enriching experiences in their families, and they are more likely to have some of these positive experiences than children in the general population. For example, they are more likely to be read to every day as young children (68 compared with 48 percent in the general population), sung to or told stories every day as young children (73 compared with 59 percent), or to participate in extracurricular activities as school-age children (85 compared with 81 percent). However, a minority of adopted children have parents who report parental aggravation (for example, feeling the child was difficult to care for, or feeling angry with the child). Parental aggravation is more common among parents of adopted children than among parents in the general U.S. population (11 compared with 6 percent).
- Overall, 87 percent of adopted children have parents who said they would “definitely” make the same decision to adopt their child, knowing everything then that they now know about their child. In addition, more than nine out of ten adopted children ages 5 and older have parents who perceived their child’s feelings towards the adoption as “positive” or “mostly positive.”
- Overall, four out of ten adopted children are in transracial adoptions—that is, their parents reported that both adoptive parents are (or the single adoptive parent is) of a different race, culture, or ethnicity than their child. The majority of adopted children have non-Hispanic white parents but are not themselves non-Hispanic white. Transracial adoptions are most common for children whose families adopted internationally.
Children Adopted From Foster CARE
Children adopted from foster care are those who, prior to their adoption, were involved with the child protective services system and removed from their families due to their families’ inability or unwillingness to provide appropriate care. Children adopted from foster care may be a vulnerable group for several reasons. Most children who enter foster care do so because of abuse or neglect by their caregivers. Once in foster care, lack of continued connections to birth parents and/or siblings, adjustments to cultural changes, and multiple placement moves prior to adoption may exacerbate these children’s existing problems or become the causes of new ones.14 Children adopted from foster care have had varied experiences prior to their adoption, and some children who had very negative experiences still manage to thrive. Yet, as a group, the pre-adoptive experiences of children adopted from foster care—many of whom are adopted at older ages than children adopted from other domestic sources or internationally—are likely to make them more vulnerable than other adopted children.
According to the Administration for Children and Families’ analysis of data from the Adoption and Foster Care Reporting and Analysis System, the number of adoptions from foster care has ranged from 51,000 to 53,000 annually between 2002 and 2007.15 Data from the NSAP indicate that as of 2007: (See Appendix Table 1 page 56.)
- About 661,000 children were adopted from foster care, representing 37 percent of all adopted children. Of these,
- 153,000, or 23 percent, were adopted by relatives.
- 262,000, or 40 percent, were adopted by someone who knew them prior to the adoption (including relatives).
- 454,000, or 69 percent, were adopted by someone who was previously their foster parent.
- 355,000, or 54 percent, have special health care needs.
For as many as four out of ten children adopted from foster care, their adoptive family was their only foster placement.iv Children adopted from foster care are more likely than other adopted children to live in families with lower household incomes, but their adoption-related expenses are considerably lower, and most are supported through adoption subsidies.
Children Adopted Domestically From Sources Other Than Foster CARE
This group includes children who were adopted from within the United States but who were not part of the foster care system at any time prior to the adoption. Some of these children may have deceased birth parents, or their birth parents voluntarily relinquished their rights and chose to make an adoption plan for them. These adoptions may be facilitated by a private adoption agency, or they may be arranged independently without an agency’s involvement. Though this type of adoption is often referred to as private domestic adoption, for the purposes of the survey, this group largely excludes adoptions from foster care that are facilitated by private agencies.16 Reliable data on trends in private domestic adoption are not available. According to the NSAP, as of 2007: (See Appendix Table 1 page 56.)
- About 677,000, or 38 percent of adopted children, were adopted privately from sources other than foster care. Of these,
- 276,000, or 41 percent, were adopted by relatives.
- 301,000, or 44 percent, were adopted by someone who knew them prior to the adoption (including relatives).
- 218,000, or 32 percent, have special health care needs.
The majority of children adopted privately in the United States were placed with their adoptive family as newborns or when they were younger than one month old (62 percent).
Children Adopted From International Sources
This group includes children adopted from countries other than the United States. Typically, the adoption is facilitated by a private adoption agency. International adoptions had increased from about 15,000 to over 22,000 children in 2004. Since 2004, international adoptions have been steadily decreasing, to below 18,000 in 2008.17 According to the 2007 NSAP, this group is somewhat smaller than either of the domestic adoption groups: (See Appendix Table 1 on page 56.)
- Numbering at about 444,000, children adopted internationally comprise 25 percent of all adopted children. Of these,
- 128,000, or 29 percent, have special health care needs.
As of 2007, six out of ten internationally adopted children had been adopted from Asia, with over half of them (33 percent of all international children) coming from China. In 1979, China introduced a population control policy that generally restricted married, urban couples to having one child. This policy, in combination with a Chinese preference for male children, has contributed to the large number of girls adopted from China by American parents.18 Largely because of the high proportion of girls adopted from China, only one out of three internationally adopted children are male.
Many children adopted internationally have lived in congregate care facilities (70 percent) prior to living with their adoptive families. International adoption expenses are significantly higher than those for other types of adoption, with expenses of $20,000 or more for nearly half of this group of children. Correspondingly, internationally adopted children are more likely than other types of adopted children to live in households with incomes over four times the poverty threshold.
The Chartbook
As we have described, adopted children and their families represent a diverse population that has followed complex pathways to adoption. Part 1, “The Population,” presents information regarding the demographic and socio-economic characteristics of adopted children and families, as well as measures of child and family wellbeing. Part 2, “The Adoption Process,” presents information regarding parents’ motivation for adoption, satisfaction with their agency or attorney, openness of adoption (i.e., contact between adopted children and birth-family members), and post-adoption supports and services. The Chartbook presents findings for the population of adopted children as a whole and, where possible, comparable data for the entire population of U.S. children.v To illuminate some of the differences as well as some of the similarities among adopted children, we also present information separately by adoption type—children adopted from foster care, children adopted privately in the United States, and children adopted internationally. Respondents to the NSCH were adults in the household knowledgeable about the child’s health, and for the NSAP were adoptive parents. While these interviewees have intimate knowledge regarding their families, their responses were not independently verified and could be subject to recall errors or to other biases. Interested readers will find detailed tables in the Appendix to support the information described throughout the Chartbook.
Glossary
Agency adoption: Adoptions in which agencies work with both prospective adoptive and birth families, and often facilitate matches between them. Adoption agencies may be licensed (adhering to licensing and approval standards established by the state), or unlicensed.
Adoption: A process that establishes a legal parent-child relationship between a child and one or two adults who are not the child’s biological parents.
Birth parents: A child’s biological, rather than adoptive, parents. The term “birth family” is also used to refer to members of a child’s biological family.
Congregate care settings: Congregate care settings are a type of placement in which children may live when they are no longer living with their birth families, but before placement with adoptive families. They can include residential group foster homes, residential group treatment facilities, or other settings such as juvenile detention centers or hospitals. In some other countries, many infants and young children available for adoption live in orphanages, whereas these children in the United States tend to live with foster families.
Disruption: An adoption that is terminated after the child has been placed with a family, but before the adoption has been legally finalized.
Dissolution: An adoption that has been reversed; that is, an adoption that is terminated after the child has been placed with the family and after the adoption has been legally finalized.
Finalization: The legal act of establishing an adoption.
Foster care: Children under the legal guardianship of a public child welfare agency following maltreatment or abandonment by their birth parents are in foster care. Typically, they are cared for either by foster families who may or may not be related to them, or in congregate care settings.
Home study: An assessment of prospective adoptive parents intended to identify families’ appropriateness and readiness for adoption. The specific legal requirements for home studies vary across jurisdictions and depend upon the type of adoption.
Independent adoption: Prospective adoptive parents and birth parents identify each other independently of an agency, for example, through relatives or mutual acquaintances, word of mouth, or through advertisements. Attorneys may facilitate such adoptions.
Match: A match occurs when an agency identifies and approves a plan for specific adults to adopt a specific child or children. In international adoption, this is sometimes called a “referral,” from the adoptive parents’ point of view.
Permanency: Permanency refers to a living arrangement that is intended to be permanent, rather than temporary, for example, adoption and reunification. Because foster care is intended to be temporary, caseworkers establish and work toward “permanency goals” for children in foster care.
Placement: The setting in which a foster child or adopted child lives. When the Chartbook refers to the placement of adopted children with their parents, it refers to the time at which children began living with their adoptive parents, which often occurs before the legal finalization of the adoption.
Pre-adoptive placement: A child who has moved in with adults who plan to adopt that child is said to be in a “pre-adoptive placement” until the adoption is finalized.
Reunification: The return of a foster child to live with the parent(s) from whom he or she was removed.
Transracial adoption: In this Chartbook, we define transracial adoptions as those in which parents reported that they (including both parents, for children living with two parents) are of a different race, culture, or ethnicity than their child.
Notes
i Estimate based on weighted data from the NSAP. This estimate excludes children in informal adoptions (i.e., without legally finalized adoptions) as well as those living with at least one biological parent, most of whom are living in step families. Further information about the population of adopted children represented by the NSAP is available in the technical appendix.
ii The age distributions of adopted children also vary by adoption type, but in many cases, sample sizes became too small to yield reliable estimates for age subgroups separately by adoption type.
iii The difference between the percentages of all children and of adopted children who have moderate or severe depression is marginally significant (p<.10).
iv Twenty-two percent of children adopted from foster care were living with their birth family immediately prior to living with their adoptive parents, and an additional 22 percent were placed with their adoptive families in their first month of life. These figures suggest that, for up to 45 percent of children adopted from foster care, their adoptive parents were their only foster placement. However, it is possible that some adopted children may have lived in another foster placement, returned to their birth parents, and then moved in with their adoptive parents.
v This is possible for those variables based on data from the National Survey of Children’s Health.
Part 1: The Population
Part 1 presents some key population characteristics of adopted children and their families. Information presented includes children’s prior relationship to their parents, socio-economic and demographic characteristics, and child and family well-being. Child well-being measures include physical health, social and emotional well-being, and cognitive development and educational achievement. Parenting and family well-being includes findings on family and community activities, parent well-being, adoption satisfaction, and parent involvement and advocacy. Because many of the indicators in Part 1 draw heavily on data from the NSCH, we are able to present many comparisons between adopted children and children in the general population.
KEY FINDINGS
- More than four out of ten adopted children (43 percent) lived with their birth families at some time prior to their adoption. Thirty-two percent were adopted at birth or were not yet one month old when placed with their adoptive parents; 24 percent were adopted by relatives
- Overall, about half of adopted children (49 percent) are male. However, 33 percent of internationally adopted children are male, whereas 57 percent of children adopted from foster care are male.
- The distribution of race and Hispanic origin differs between adopted children and adoptive parents. A minority of adopted children are non-Hispanic white (37 percent), compared with a majority of children’s parents (73 percent). Overall, 40 percent of adopted children are of a different race, culture, or ethnicity than both of their adoptive parents (or their sole parent if there is only one parent in the household).
- Adopted children tend to be somewhat older than children in the general population. For example, 14 percent of adopted children are under 5 years old, compared with 27 percent of children in the general population.
- Adopted children are less likely than are children in the general population to live in households with incomes below the poverty threshold (12 compared with 18 percent). However, nearly half (46 percent) of children adopted from foster care live in households with incomes no higher than two times the poverty threshold.
- Over two-thirds of adopted children—69 percent—live with two married parents, and they are just as likely to do so as children in the general population.
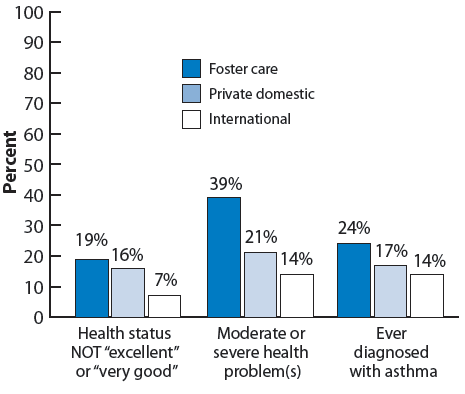
- Like children in the general population, most adopted children are in excellent or very good health (85 percent). However, while a minority of adopted children have special health care needs (39 percent) or moderate or severe health difficulties (26 percent), or have ever been diagnosed with asthma (19 percent), they are more likely to have experienced these health issues than are children in the general population (19 percent, 10 percent and 13 percent, respectively). However, the majority of adopted children have adequate health insurance (78 percent) and have been consistently insured over the prior 12 months (91 percent).
- The majority of adopted children fare well on six measures of socio-emotional well-being. For example, only a small minority of adopted children have ever been diagnosed with disorders such as attachment disorder, depression, attention deficit disorder or attention deficit/hyperactivity disorder, or behavior or conduct disorder. Furthermore, 88 percent of adopted children ages 6 and older exhibit positive social behaviors. However, adopted children tend to have somewhat lower levels of socio-emotional well-being across a variety of measures, compared with children in the general population. See Appendix Table 8 on page 66 for specific figures.
- More than half of school-age adopted children have excellent or very good performance in reading and language arts and the same is true for math, according to their parents. Furthermore, 69 percent are engaged in school (i.e., they care about doing well in school and regularly do homework), but they are somewhat less likely to be engaged in school than are children in the general population (81 percent).
- The majority of adopted children have enriching experiences in their families, and they are more likely to have certain of these positive experiences than are children in the general population. For example, they are more likely to be read to every day as young children (68 compared with 48 percent), to be sung to or told stories every day as young children (73 compared with 59 percent), or to participate in extracurricular activities as school-age children (85 compared with 81 percent).
- Overall, 81 percent of adopted children have parents who reported their relationship with their child as very warm and close. In addition, 42 percent had parents report the relationship as “better than ever expected,” with only 15 percent reporting the relationship as “more difficult” than they ever expected.
Children’s history, prior relationship with parents
In this section, the Chartbook reports on whether or not adopted children had ever lived with their birth family and where they lived immediately prior to living with their adoptive parents. It also includes information on children’s relationships to their parents prior to the adoption. (Prior relationships could include that they were already related to the child, that they had known the child previously, and—for adoptions from foster care—that they were foster parents to the child.) See Appendix Table 2 on page 58 for detailed data on each indicator.
Figure 2. Percentage of adopted children who have ever lived with birth family members, by adoption type
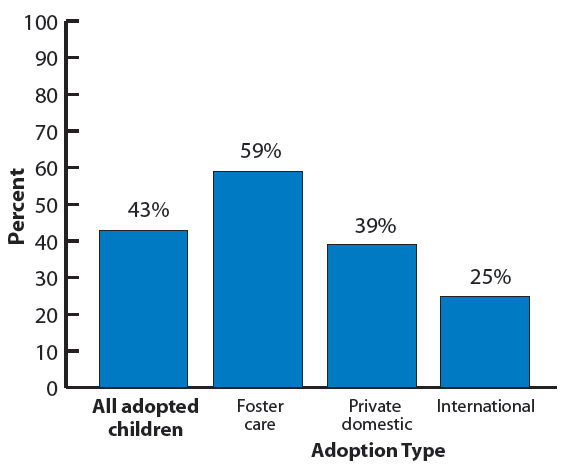
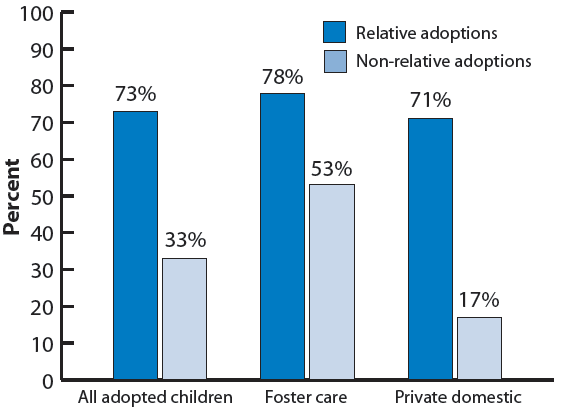
Forty-three percent of adopted children lived with their birth families at some time prior to their adoption; see Figure 2. Of these, about half lived with their birth families immediately before the adoptive placement (22 percent of all adopted children). The proportion of children who have ever lived with their birth families varies across adoption types; it is highest for those adopted from foster care (59 percent) and lowest for children adopted internationally (25 percent). For children adopted by relatives, these figures are considerably higher. Seventy-three percent of children adopted by relatives had ever lived with their birth family. In contrast, among children adopted by non-relatives, 53 percent of those adopted from foster care ever lived with their birth family, as did 17 percent of those adopted privately from the United States; see Figure 3.
Figure 3. Percentage of children adopted from foster care and from other domestic sources who have ever lived with birth family members, by pre-adoptive relationship to parents
Children’s pre-adoptive placement differs depending on adoption type. The majority of children adopted privately in the United States were placed with their adoptive family as newborns or when they were younger than one month old (62 percent). In contrast, children adopted internationally overwhelming lived in congregate care facilities prior to the adoptive placement (70 percent) or with a foster family (24 percent). Seventy-eight percent of children adopted from foster care lived with a foster family or in some other foster care setting away from their birth family prior to their adoptive placement. Among children adopted from foster care, 44 percent lived with a foster family other than their adoptive family immediately prior to their adoptive placement, and 11 percent lived in congregate care.
For many children adopted from foster care, their adoptive family was likely their only foster placement. Although more than half of children adopted from foster care were living with another foster family or in congregate care prior to living with their adoptive families, a substantial proportion were not previously in foster care settings. Specifically, 22 percent lived with their birth family, and an additional 22 percent were placed with their adoptive families in their first month of life. These figures suggest that for more than four out of ten children adopted from foster care, their adoptive parents may have been their only foster placement setting.
Among children adopted from foster care and from other domestic sources, adoption by relatives or by adults who knew the child prior to the adoptive match is common. More than two out of ten children adopted from foster care (23 percent) were adopted by relatives, and an additional 22 percent were adopted by nonrelatives who knew the child prior to the adoptive match. For other domestic adoptions, relative adoption is even more common. Of privatelyadopted U.S. children, 41 percent were adopted by relatives and an additional 7 percent were adopted by non-relatives who previously knew the child. Reports of internationally adopted children adopted by relatives were too rare to yield a reliable percentage estimate.
ADOPTION TERMINOLOGY
Placement: The setting in which a foster child or adopted child lives. When the Chartbook refers to the placement of adopted children with their parents, it refers to the time at which children began living with their adoptive parents, which often occurs before the legal finalization of the adoption.
Congregate care: Congregate care settings include residential group foster homes, orphanages, residential group treatment facilities, or other settings such as juvenile detention centers or hospitals. Children no longer living with their birth families may reside in congregate care prior to adoption. In some other countries, many infants and young children available for adoption live in orphanages, whereas children waiting for adoption in the United States tend to live with foster families.
Foster family: A family (who may or may not be related to the child) who provides care during the time in which the child is under the legal guardianship of a public child welfare agency.
Birth parents: A child’s biological parents. The term “birth family” is also used to refer to members of a child’s biological family, or individuals related by marriage to the child’s biological family (for example, step-siblings and aunts and uncles).
Adoptive match: A match occurs when an agency identifies and approves a plan for specific adults to adopt a specific child or children. In international adoption, this is sometimes called a “referral.”
MEASURES RELATED TO CHILDREN’S HISTORY AND PRIOR RELATIONSHIP TO THEIR PARENTS
Ever lived with birth family: Parents reported whether their child “has…ever lived with his/her birth family.”
Where child lived before living with parent: Parents were asked, “Just before being placed with you, where did [your child] live?” We identified several types of placements, including 1) birth parent(s) or birth family members other than parents, 2) a foster family, and 3) congregate care. Congregate care includes group homes in the U.S. foster care system (that is, a group home with four foster children or more), residential treatment facilities in the U.S. (that is, a facility where large numbers of children and youth live), institutions or orphanages, or hospitals or health clinics. Additionally, we reported a fourth category that includes children who had been adopted at birth or placed with the adoptive parents prior to one month of age. In some of these cases, parents said children lived at a hospital prior to their adoptive placement; due to their young age, we assumed such hospital stays were related to the births. Finally, we grouped all other children, including those whose parents reported that their prior placement had been another adoptive family, or someplace else not mentioned, into a separate “other” category.
Parent and child were relatives prior to adoption: For this item, parents reported whether they or their spouse or partner were previously related to their child, for example, as a grandparent, aunt, or uncle.
Parent and child knew each other prior to adoption: Parents also reported whether they or their spouse or partnerknew their child before they considered adopting him or her, or before being matched with the child for adoption.
Parent was a foster parent to the child: We defined parents as having previously been foster parents to their child if they reported either that they or their spouse or partner had been the child’s foster parent at any time before the adoption was finalized, or at the time they began the adoption process.
Race, ethnicity, and gender
This section reports on demographic indicators related to race, ethnicity, and gender for adopted children and their parents. These include the race and Hispanic origin of adopted children and of their parents, transracial adoption (that is, adoptions in which the race, ethnicity, or culture of origin differs for adopted children and their parents), and the child’s gender. Additionally, for internationally adopted children, we report on children’s region and country of origin. See Appendix Table 3 on page 59 for detailed data on each indicator.
Figure 4. Percentage distribution of all children and adopted children by race and Hispanic origin
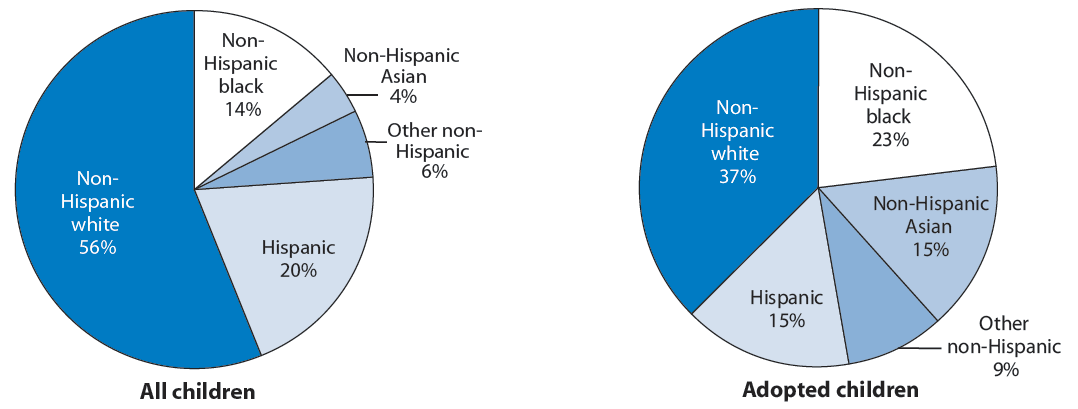
The race and ethnic distribution of adopted children is different from that of children in the general population. Adopted children are less likely to be white or of Hispanic origin than children in the general U.S. population, and they are more likely to be black;i see Figure 4. The racial distribution of children also varies by type of adoption, with children adopted from foster care most likely to be black (35 percent) and those adopted internationally least likely to be black (3 percent). Children adopted privately from the United States are most likely to be white (50 percent); those adopted internationally are least likely to be white (19 percent). The majority of children adopted internationally are Asian (59 percent). In comparison, very few children adopted from foster care or through private domestic adoptions are Asian; in fact, the proportion is so small that reliable estimates could not be generated. The percentage of adopted children who are Hispanic does not vary by type of adoption; see Figure 5.
Figure 5. Percentage distribution of adopted children by race and Hispanic origin, by adoption type
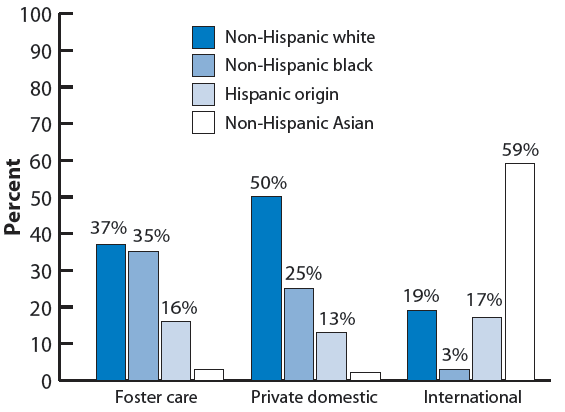
Note: Values corresponding to unreliable percentage estimates have been suppressed in this figure.
The race and ethnic distribution of adopted children is different from that of adoptive parents. Whereas a majority of adopted children are nonwhite, the majority of these children’s parents are white (73 percent). Sixty-three percent of children adopted from foster care have white parents, as do 71 percent of children adopted within the United States, and 92 percent of children adopted internationally.ii A substantial portion of adopted children have black parents, including 27 percent of children adopted from foster care and 19 percent of those adopted privately within the United States; see Figure 6.
Figure 6. Percentage distribution of adopted children by race and Hispanic origin of their parents, by adoption type
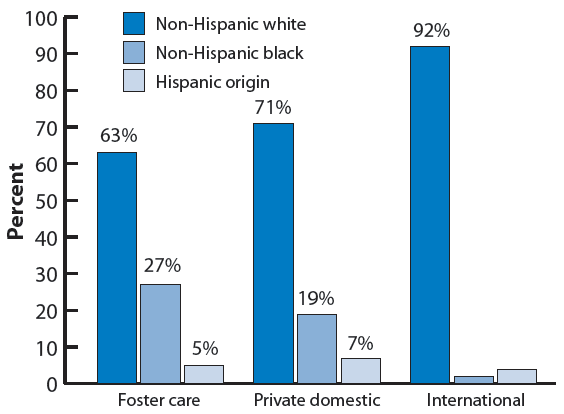
Note: Values corresponding to unreliable percentage estimates have been suppressed in this figure.
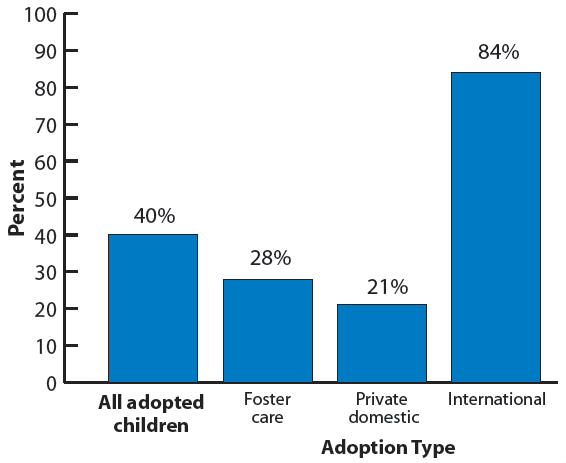
Given that the racial and ethnic distribution of adopted children differs from that of their parents, it is not surprising that four out of ten children have parents who report that they and their spouse or partner (if they have one) are of a different race, ethnicity, or culture than their child. Children adopted internationally are most likely to be in transracial placements (84 percent), compared with 28 percent of children adopted from foster care and 21 percent of those adopted privately from within the United States; see Figure 7.
Figure 7. Percentage of adopted children who were adopted transracially, by adoption type
Children’s gender distribution varies substantially by adoption type. Overall, about half of adopted children are male (49 percent), but gender distribution varies by adoption type. Only onethird of children adopted internationally are male (33 percent) compared with a slight majority of children adopted from foster care and through private domestic adoptions (57 and 51 percent, respectively). Among internationally adopted children, only 19 percent of Asian children are male, reflecting the large number of girls adopted from China.
Among internationally adopted children, more than twice as many were born in China as in any other individual country. Specifically, 33 percent of internationally adopted children lived in China prior to their adoption; the second-most common country of origin is Russia, with 13 percent. Eleven percent of the internationally adopted children originate from Guatemala, and another 11 percent originate from South Korea. Other countries from which internationally adopted children originate include India, Kazakhstan, Colombia, Ukraine, Philippines, and Ethiopia. All had too few children to generate reliable estimates of their frequency.
MEASURES PERTAINING TO CHILDREN’S RACE, ETHNICITY, AND GENDER
Children’s race and Hispanic origin
Parents’ race and Hispanic origin
Child gender
Transracial adoption: We categorized children as having been transracially adopted if their parents reported that their child was “of a different race or ethnicity or from a different culture” compared to themselves and their spouse or partner (if they had one).
Region of origin: Regions from which internationally adopted children came include Asia, Europe, South America, North America, and Africa. Other regions had too few adoptions to be reported separately.
Country of origin: Countries from which internationally adopted children most commonly originated include China, Russia, Guatemala, and South Korea. We grouped together the fifth through tenth most common countries of origin, including India, Kazakhstan, Colombia, Ukraine, Philippines, and Ethiopia. Other counties had fewer adoptions to the United States, so reliable estimates could not be calculated.
Notes
i The difference between the percentages of internationally adopted children and privately adopted U.S. children that are under age 3 (6 compared with 10 percent, respectively) is marginally significant (p < .10).
Other demographic and socio-economic characteristics
In this section we examine additional demographic and socio-economic characteristics. The indicators here include children’s current ages, whether children’s parents have a spouse or partner, parents’ current ages, the age gap between parent (or spouse/partner of parent, whichever is smaller) and child, the education of the parent with the highest level of educational attainment, household income-to-poverty ratio, and parental employment. See Appendix Table 4 on page 60 for detailed data on each indicator.
Adopted children tend to be older than children in the general population. Among adopted children, 6 percent are under age 3 compared with 16 percent of children in the general population; see Figure 8. Among other reasons, this age difference is due to the fact that some children are adopted at older ages, rather than as infants. Additionally, the estimates presented here are representative of children with finalized adoptions, and adoptions typically take a minimum of six months to finalize. Larger percentages of internationally adopted children are under age 5 (24 percent) than are other adopted children (9 percent for children adopted from foster care; 13 percent for those adopted privately from the United States).i
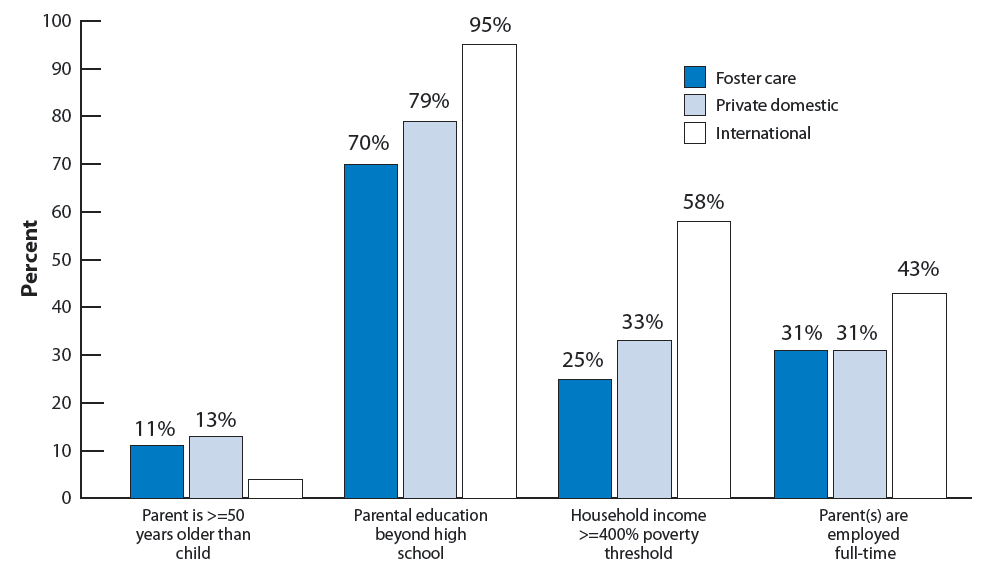
Adopted children are less likely than children in the general population to live in families with incomes below the poverty threshold, and they are more likely to have a parent who has completed education beyond high school. However, these characteristics vary substantially by adoption type. Specifically, internationally adopted children are more likely than children adopted from foster care or from other domestic sources to have a parent with education beyond high school (95 percent compared with 70 and 79 percent, respectively), and to have incomes exceeding four times the federal poverty threshold (58 percent compared with 25 and 33 percent, respectively).19 Internationally adopted children are also more likely than other adopted children to live in households in which both or the single parent works full time (43 percent compared with 31 percent of children adopted from foster care or from other domestic sources); see Figure 9. Children adopted privately from the United States are the most likely to have retired parents (15 percent), followed by children adopted from foster care (6 percent).
Figure 8. Percentage distribution of all children and adopted children by child age
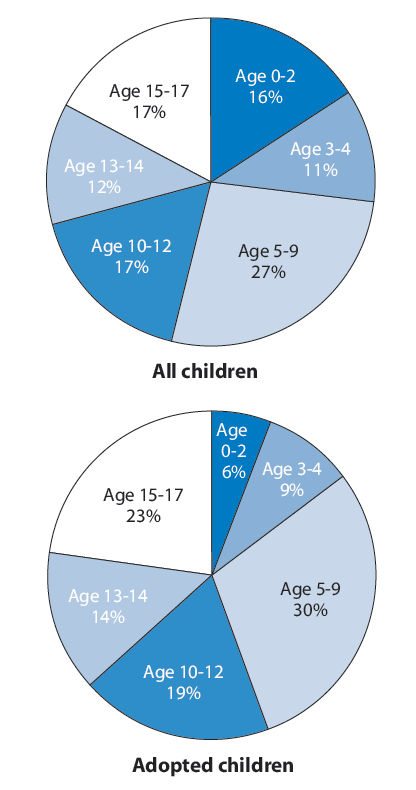
Figure 9. Percentage of adopted children by socio-economic and demographic characteristics, by adoption type
Note: Values corresponding to unreliable percentage estimates have been suppressed in this figure.
MEASURES OF OTHER DEMOGRAPHIC AND SOCIO-ECONOMIC CHARACTERISTICS
Child’s current age: Parents reported children’s ages, and had the option to do so in months as well as years (primarily for infants under one year old).
Parent’s current age: Parents reported the year in which they were born. To generate an estimate of their age we subtracted the year of birth from 2007, the year during which most of the NSAP interviews took place.
Age gap between parent (or spouse/partner of parent) and child: We calculated the difference in ages between the adopted child and each parent (for children who had two parents) and identified whichever difference was smaller.
Education of parent with highest level of educational attainment: We compared the educational attainment of the child’s parent and the parent’s spouse/partner (if there was one) and reported whichever was higher. Categories include less than high school diploma, 12 years (or high school diploma or general equivalency degree), or more than 12 years.
Household income-to-poverty ratio: Parents reported their total combined family income during the prior calendar year for all members of the family, before taxes. The amount was then compared with the federal poverty threshold, as established by the U.S. Department of Health and Human Services (http://aspe.hhs.gov/poverty).
Parental employment: Parents answered the question, “Last week were you working full time, working part time, temporarily not working, unemployed, retired, going to school, keeping house, or something else?” They also answered this question regarding their spouse or partner, if they had one. The category “parents work fulltime” includes single parents who work full-time and households with two parents, both of whom work fulltime. The category “retired parents” includes single parents who are retired and households with two parents, both of whom are retired.
Note: Appendix Table 4 also includes the age of the spouse/partner of parent for parents who are not single.
Notes
i The difference between the percentages of internationally adopted children and privately adopted U.S. children that are under age 3 (6 compared with 10 percent, respectively) is marginally significant (p < .10).
Family structure
This section describes the structural characteristics of families in which adopted children live. Specifically, we report whether or not adopted children have birth siblings and whether any of those children had also been adopted by the child’s parents. In addition, parents’ marital status and whether the parents were married at the time of the adoption, the total number of children under 18 in the household, and the presence of birth and adopted children are reported. See Appendix Table 5 on page 62 for detailed data on each indicator.
Seventy-one percent of adopted children have known birth siblings. Of these, 29 percent have birth siblings also adopted by the adoptive parent; see Figure 10. The percentage of all adopted children who have birth siblings also adopted by their parents varies across adoption types. The percentage is higher for children adopted from foster care (36 percent) than for those adopted privately from other domestic sources (15 percent) or internationally (7 percent); see Figure 11. Knowledge of children’s birth siblings also varies by adoption type. Parents of internationally adopted children are less likely than parents of children adopted from the United States to have reported knowing of birth siblings. Thirty-one percent of internationally adopted children had parents who knew of birth siblings, compared with 89 and 80 percent for foster care and private domestic adoptions, respectively.i
Most adopted children live with two married parents. Like children in the general U.S. population, about seven out of ten adopted children live in families with two married parents, one or both of whom may be adoptive parents. Children adopted internationally are most likely to have two married parents (82 percent), while children adopted through private domestic sources are least likely (59 percent);20 see Figure 12. Thirty-nine percent of adopted children live with one adoptive parent in the family.21
Many adopted children are the only child in the household. Thirty-eight percent of adopted children are the only child in the household under 18.ii This varies by adoption type, with privately adopted U.S. children most likely to be the only child in the household (48 percent, compared with 27 and 37 percent of foster care and international adoptions, respectively). Conversely, children adopted from foster care are the most likely to live in households with three or more children (40 percent, compared with 16 percent each of children adopted privately from the United States and internationally).
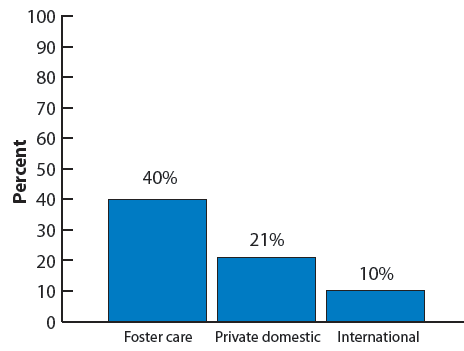
Children adopted from foster care tend to have more complex family structures than children adopted from other sources. Forty percent of children adopted from foster care live in families with adopted and birth children, while 21 percent of privately adopted U.S. children and 10 percent of internationally adopted children have this family structure; see Figure 13. Children adopted privately from the United States and children adopted internationally are more likely than children adopted from foster care to be the only child in the family (24 and 23 percent, respectively, compared to 11 percent).
Figure 10. Percentage distribution of adopted children by existence of birth siblings; percentage distribution of adopted children with birth siblings by whether of not parent also adopted child’s birth sibling(s)
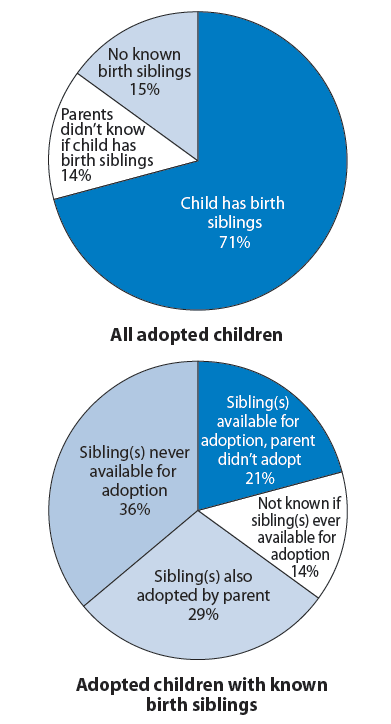
Figure 11. Percentage of adopted children with birth siblings also adopted by parent, by adoption type
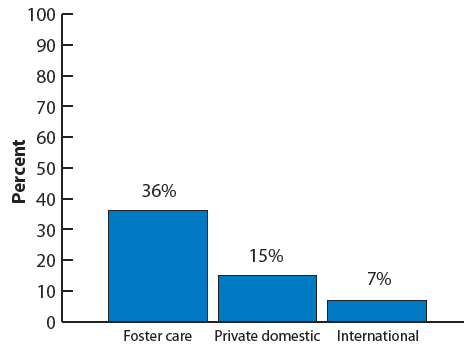
Figure 12. Percentage of children with married parents, by adoptive status and by adoption type
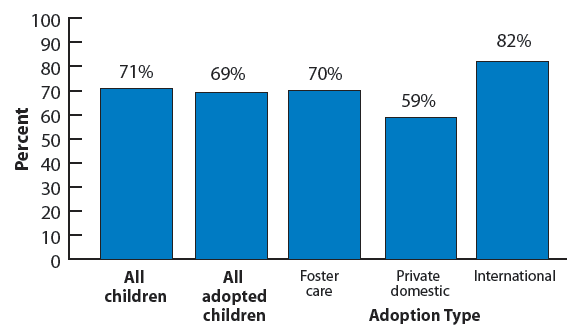
Figure 13. Percentage of adopted children whose parents have other adopted children and biological children
MEASURES PERTAINING TO FAMILY CHARACTERISTICS AND FAMILY STRUCTURE
Child’s birth siblings: We reported on whether or not children have biological siblings, in combination with whether or not the children’s parents have also adopted the child’s siblings. Categories are based on parental responses to several questions about whether the adopted child has birth siblings including half siblings, whether those siblings were available for adoption, and whether the parent adopted the siblings. A substantial portion—15 percent—of children have parents who said “I don’t know” in response to the question about the existence of birth siblings. Additionally, some children whose parents responded “no” to the question likely have birth siblings of whom their parents are not aware. Therefore, in contrast to other measures included in this Chartbook, we included the “I don’t know” response as an explicit category for this measure.
Parents’ marital status: We reported on the marital status of children’s parents, regardless of whether both parents (if the child had two parents) had each adopted the child.
Family structure: We reported whether children are living with one or two adoptive parents, as well as the marital status of those parents.
Number of children under 18 in household: We reported the number of children currently living in the household, excluding any of the parents’ children who might have been living elsewhere.
Presence of birth and adoptive children in family: We examined whether the child was the only child in the family, or whether the child had siblings also adopted by his or her parent and/or siblings who were biological children to his or her parent.
Notes
i These figures are likely underestimates of the percentages of children who actually have birth siblings, as many parents did not know whether their children have birth siblings.
ii Many of these children have siblings living elsewhere or with another parent or older siblings no longer living in the same household. The percentage of adopted children who are “only children”—that is, who have no other biological or adoptive siblings living anywhere—is smaller.
Neighborhood characteristics
To provide information about the neighbor hoods in which adopted children live, this section reports on whether or not adopted children live in or near urban areas, as well as on whether the children’s neighborhoods are safe, have characteristics indicating poor physical condition, and have amenities. See Appendix Table 6 on page 63 for detailed data on each indicator.14%
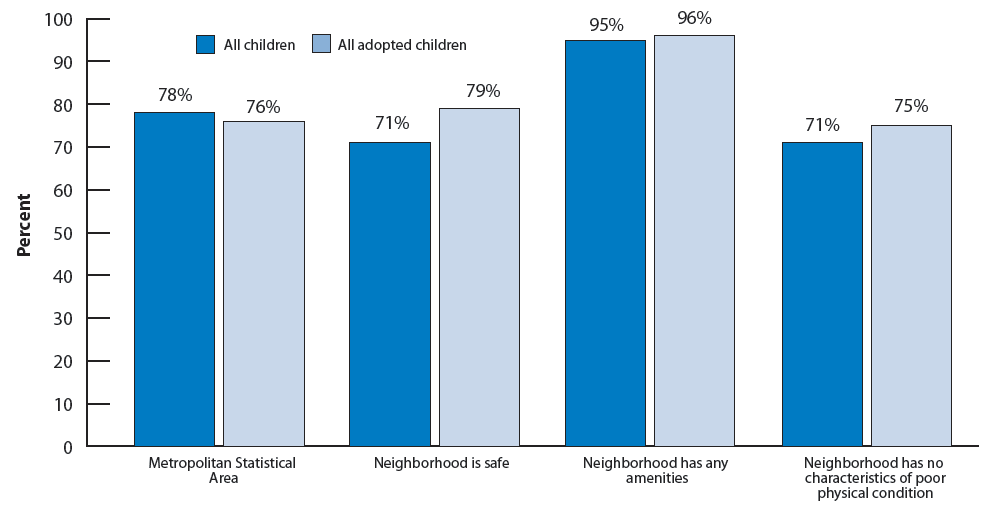
Overall, 76 percent of adopted children live in or near urban areas, 79 percent live in safe neighbor hoods, and 75 percent live in neighborhoods with no characteristics of poor physical condition. Poor physical neighborhood conditions include litter or garbage, poorly kept or dilapidated housing, and vandalism. Very few (4 percent) live in neighborhoods with no amenities. Neighborhood amenities include sidewalks or walking paths; parks or playground areas; recreation centers, community centers, or boys’ or girls’ clubs; and libraries or bookmobiles. Adopted children are slightly more likely than children in the general population to live in safe neighborhoods and in neighborhoods that show no poor physical conditions.i Adopted children and children in the general population are equally likely to live in or near urban areas; see Figure 14.
Internationally adopted children are slightly less likely than other adopted children to live in neighborhoods with no amenities, although living in such neighborhoods is very rare among all adopted children (4 percent). The likelihood of living in a safe neighborhood or a neighbor hood with no characteristics of poor physical condition does not vary by adoption type, nor does the percentage living in or near urban areas.
Figure 14. Percentage of children living in neighborhoods with various characteristics, by adoptive status
MEASURES PERTAINING TO NEIGHBORHOOD CHARACTERISTICS
Urban areas: To determine whether children live in or near an urban area, we identified whether the child’s county was part of a Metropolitan Statistical Area (MSA). MSAs include counties containing an urban area with a population of at least 50,000, as well as adjacent counties that are socially and economically integrated with the urban core. 22 MSA status in the NSCH was suppressed for children living in states with either fewer than 500,000 persons living in MSAs or fewer than 500,000 persons not living in MSAs. Among these children, we assumed that children living in primarily urban states were living in MSAs and that children living in other states were not living in MSAs.
Safe neighborhoods: To assess whether children live in safe neighborhoods, the survey asked parents five questions about their perceptions of their neighborhood. Specifically, parents reported their level of agreement with four statements: 1) “People in this neighborhood help each other out.” 2) “We watch out for each other’s children in this neighborhood.” 3) “There are people I can count on in this neighborhood.” 4) “If my child were outside playing and got hurt or scared, there are adults nearby who I trust to help my child.” Additionally, they reported how frequently they feel their child is “safe in [their] community or neighborhood.” Negative responses to any of the questions (i.e., response of “somewhat” or “definitely disagree” to any of the first four questions, or responses of “never” or “sometimes” to the fifth question) were categorized as not living in safe neighborhoods.
Neighborhoods in poor physical condition: Children were categorized as living in neighborhoods with poor physical conditions if their parents reported that their neighborhood had “litter or garbage on the street or sidewalk”, was “poorly kept or had rundown housing,” or had “vandalism such as broken windows or graffiti.”
Neighborhoods with no amenities: To identify whether children’s neighborhoods had any amenities, parents were asked if “the following places and things are available to children in your neighborhood, even if [their child] does not actually use them:” 1) “sidewalks or walking paths,” 2) “a park or playground area,” 3) “A recreation center, community center, or boys’ or girls’ club,” or 4) “a library or bookmobile.”
Notes
i The difference between the percentages of adopted children living in neighborhoods in good condition (75 compared with 71 percent, respectively) is marginally significant (p < .10).
Physical health
This section reports on six health indicators for adopted children, including their health status, having special health care needs, missing school due to illness or injury, having moderate or severe health difficulties, having asthma, or having been injured. It also presents four measures pertaining to health insurance and health care, factors that are not direct indicators of children’s health, but that are important for supporting their health. These include health insurance coverage, consistency of coverage, adequacy of insurance, and receipt of care in a medical home. For definitions of these measures, see the text boxes labeled “health measures” and “health insurance and health care measures.” Because the measures in this section are based on parents’ responses in the National Survey of Children’s Health, comparable data for children in the general population are also included. See Appendix Table 7 on page 64 for detailed data on each indicator.
Health and Well-being
The majority of adopted children fare well on six measures of health. Specifically, 85 percent of adopted children have parents who rated their health as “excellent” or “very good.” Yet 39 percent of adopted children have special health care needs—a broadly defined measure. Children with special health care needs include those who currently experience at least one out of five consequences attributable to a medical, behavioral, or other health condition that has lasted or is expected to last for at least 12 months. Problems that were much less commonly reported than special health care needs included more than 10 school absences due to illness or injury, having moderate or severe asthma, and having been injured during the prior year.
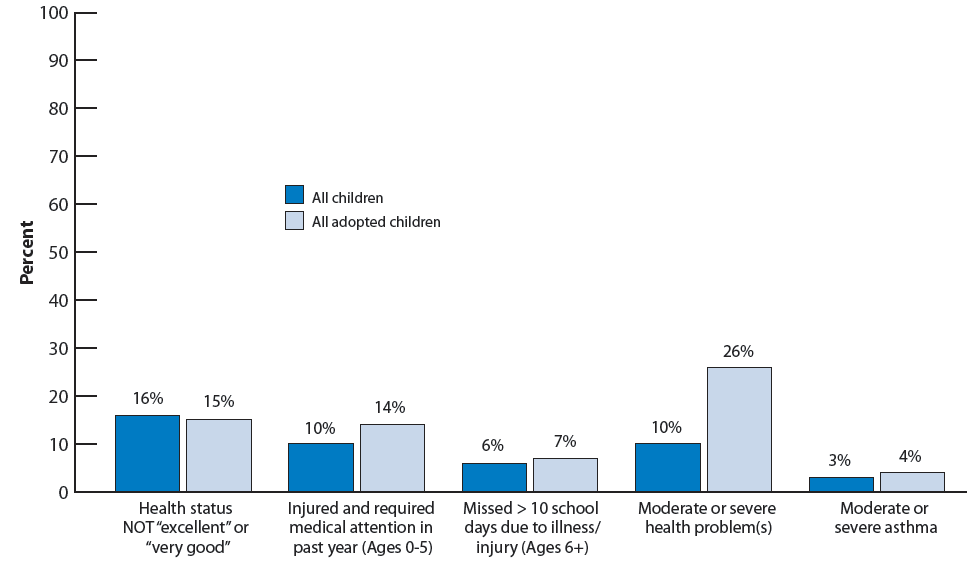
However, some adopted children do experience health problems. Twenty-six percent of adopted children have a moderate or severe health problem; see Figure 15. Such problems include any one of 16 possible conditions, such as asthma, a learning disability, or attention deficit disorder/attention deficit hyperactivity disorder. Many parents who reported such problems also rated their child’s health status as “very good” or “excellent.” (This occurs frequently in the general population as well.) While this may appear contradictory, many children identified as having “moderate” or “severe” health problems may have conditions that are largely controlled with medication or other treatment. Children with controlled conditions or who do not have severe symptoms may be considered by their parents as having excellent or very good health.
Figure 15. Percentage of children according to their health status, by adoptive status
Some, but not all, of the six health indicators also differ by adoption type. Children adopted internationally are more likely (93 percent) to have parents who rated their health as “excellent” or “very good” than those adopted from foster care or privately from within the United States (81 and 84 percent, respectively). In addition, children adopted from foster care are more likely than children adopted privately from the United States or internationally to have a moderate or severe health problem (39 percent, compared with 21 and 14 percent, respectively). Special health care needs are also more common among children adopted from foster care (54 percent) than among other adopted children (32 percent of children adopted from other domestic sources and 29 percent of children adopted internationally). And, although children adopted from foster care are somewhat more likely than other adopted children ever to have been diagnosed with asthma (24 percent, compared with 17 percent of U.S. children adopted privately and 14 percent of children adopted internationally), the percentage of adopted children with current asthma symptoms that are moderate or severe was small across all three types (6 percent or less); see Figure 16.
Figure 16. Percentage of adopted children according to their health status, by adoption type
Health Insurance and Health CARE
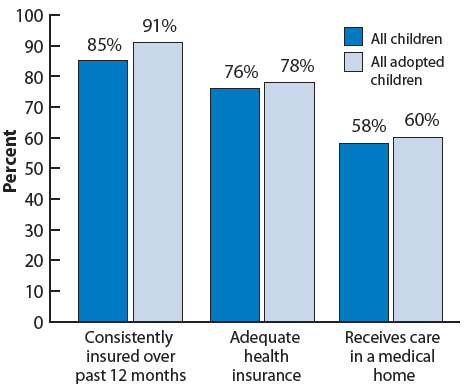
The vast majority of adopted children not only have insurance (95 percent), but have been consistently covered over the prior 12 months (91 percent) and have adequate insurance (78 percent). Additionally, 60 percent of adopted children receive coordinated, ongoing, comprehensive care within a medical home;i see Figure 17.
Adopted children fare better than or as well children in the general population on health insurance and health care measures. Adopted children are more likely than children in the general population to have health insurance (95 compared with 91 percent) and to have had insurance continuously over the previous 12 months (91 compared with 85 percent). Similar percentages of adopted children and children in the general population have adequate health insurance and have a medical home;ii see Figure 17.
Figure 17. Percentage of children according to measures of health context and insurance, by adoptive status
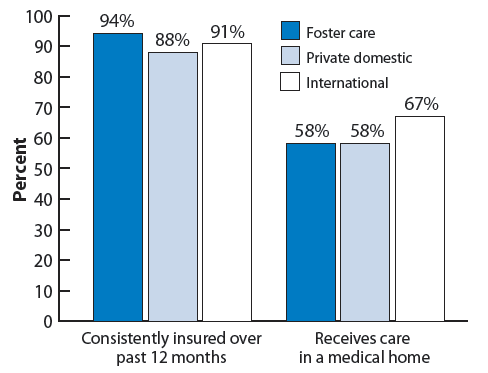
Adequacy and consistency of health insurance coverage is similar across adoption types. Children adopted from foster care are as likely as the other two groups of adopted children to have any health insurance coverage and to have adequate coverage. In addition, children adopted from foster care are slightly more likely than privately adopted U.S. children to have been consistently insured for the prior 12 months (94 compared with 88 percent).iii However, children adopted from foster care are less likely than children adopted internationally to receive coordinated, ongoing, comprehensive care within a medical home (58 compared with 67 percent);iv see Figure 18.
Figure 18. Percentage of adopted children according to measures of health context and insurance, by adoption type
The type of health insurance coverage varies by adoption type. Over half of children adopted from foster care (59 percent) and one-third of children adopted privately from the United States are covered by public health insurance. In contrast, internationally adopted children are far more likely than children adopted from foster care and privately adopted U.S. children to be covered by private insurance (92 percent, compared with 37 and 61 percent, respectively).
HEALTH MEASURES
Special health care needs: Children with special health care needs are those who currently experience at least one of five consequences attributable to a medical, behavioral, or other health condition that has lasted or is expected to last for at least 12 months. The consequences include: 1) ongoing limitations in ability to perform activities that other children of the same age can perform, 2) ongoing need for prescription medications, 3) ongoing need for specialized therapies, 4) ongoing need for more medical, mental health, or educational services than are usual for most children of the same age, and 5) the presence of ongoing behavioral, emotional, or developmental conditions requiring treatment or counseling.
Moderate or severe health difficulties: Parents reported whether a doctor had ever told them that their child had any one of 16 health conditions.23 Children whose parents reported at least one condition for their child that was currently moderate or severe were categorized as having a moderate or severe health problem.
Impacted by asthma: Parents first reported whether a “doctor or health care provider has ever told” them that their child had asthma. Parents who responded positively also reported whether the child currently still had asthma, and, if so, whether the symptoms were “mild, moderate, or severe.” We grouped children into three categories: those who had never been diagnosed with asthma, those with currently moderate or severe asthma symptoms, and those with mild or non-current asthma.
Missed more than 10 school days due to illness or injury: This indicator was based on parental reports regarding children ages 6 and older who were enrolled in school.
Injured during the prior 12 months: This measure was assessed for children ages 0 to 5 depending on parents’ reports that their child had “been injured and required medical attention.”
HEALTH INSURANCE AND HEALTH CARE MEASURES
Health insurance coverage: The NSCH first asked parents, “Does [your child] have any kind of health care coverage, including health insurance, prepaid plans such as HMOs, or government plans such as Medicaid?” If a respondent answered “yes,” the NSCH asked whether the child was covered by “Medicaid or the State Children’s Health Insurance Program, S-CHIP?” We categorized children whose parents reported that their child was covered by Medicaid or S-CHIP as being covered by public insurance. We categorized all other children whose parents reported that they had health insurance as being covered by private insurance. However, some share of children may be covered both by public and private insurance.
Consistency of coverage: We assessed whether children were consistently insured over the 12 months prior to the survey, never insured over the year, currently insured but lacked coverage at some time during the year, or currently uninsured but had coverage at some time during the year.
Adequate health insurance: This measure depends on parents’ responses to three questions: 1) “Does [your child’s] health insurance offer benefits or cover services that meet (his/her) needs?” 2) “Does [your child's] health insurance allow him/her to see the health care providers he/she needs?” And 3) “How often are [out-of-pocket] costs reasonable?” Children were categorized as having adequate insurance if their parents responded “usually” or “always” to each of the questions (or had no out-of-pocket costs and said usually or always to the other questions).
Care is received in a medical home: This measure is based on five components, each of which must have been present in order to categorize children as receiving care in a medical home. The five components are: The child 1) has a usual source for sick care, 2) has a personal doctor or nurse, 3) has no problems obtaining referrals when needed, 4) receives effective care coordination (i.e., the family is very satisfied with doctors’ communication with each other and with doctors’ communication with other programs, and the family usually or always gets sufficient help coordinating care if needed), and 5) receives family-centered care, including at least one visit in the past year. Family-centered care is care in which doctors usually or always spend enough time with the patient, listen carefully to complaints or concerns, are sensitive to families’ values and customs, provide needed information, and make the family feel like a partner, and in which families have interpretation services available when needed.
Notes
i Specifically, analyses of the NSCH indicate that, of children in the general population who have moderate or severe problems, 61 percent are rated as having “excellent” or “very good” health.
ii See the box labeled “Health insurance and health care measures” for the full definition of a medical home.
iii The difference between 94 and 88 percent is marginally significant (p<.10).
iv The difference between 58 and 67 percent is marginally significant (p<.10).
Social and emotionalwell-being
To assess the social and emotional well-being of adopted children, this section reports on whether children have ever been diagnosed with any of four psychological disorders, including attachment disorder, depression, attention deficit disorder/attention deficit hyperactivity disorder (ADD/ADHD), or behavior/conduct disorder. Additionally, we report on the percentages of children who exhibit positive and negative social behaviors. See Appendix Table 8 on page 66 for detailed data on each indicator.
Most adopted children fare well, according to six measures of socio-emotional well-being, but a small minority experience serious problems. Parents’ responses indicate that the majority of adopted children have never been diagnosed with each of the four psychological disorders included in the survey. Twelve percent of adopted children have ever been diagnosed with attachment disorder. The survey did not ask about the severity of the disorder. Most adopted children diagnosed with attachment disorder have parents who report a “very warm and close” relationship with their child, although such reports are rarer than among adopted children without attachment disorder (64 compared with 84 percent). Overall, 4 percent of adopted children both have been diagnosed with attachment disorder and have a parent who reported the relationship as not being very warm and close.
The incidence of the other three disorders examined here is lower than for attachment disorder. Fourteen percent of adopted children ages 6 and older have been diagnosed with ADD/ADHD and have parents who rated the condition as moderate or severe. Eight percent of adopted children ages 2 and older have moderate or severe behavior or conduct problems, according to their parents. Parents of 2 percent of adopted children report their child has been diagnosed with depression and currently has symptoms that are moderate or severe. Also based on parent responses, 14 percent of adopted children have problems with social behaviors. However, parents also reported that 88 percent exhibit positive social behaviors.
Compared to the general population of children, adopted children are more likely to have ever been diagnosed with—and to have moderate or severe symptoms of—depression, ADD/ADHD, or behavior/conduct disorder.24 For example, 9 percent of adopted children ages 2 and older have ever been diagnosed with depression, compared with 4 percent of children in the general population. Additionally, 26 percent of adopted children ages 6 and older have ever been diagnosed with ADD/ADHD, compared with 10 percent of children in the general population. A similar pattern of differences emerges for behavior/conduct disorder: 15 percent of adopted children have ever been so diagnosed compared with 4 percent of children in the general population. Adopted children are also somewhat more likely than the general population of children to exhibit problems with social behaviors, and are somewhat less likely to exhibit positive social behaviors; see Figure 19.
Differences in social and emotional well-being by adoption type are apparent for five out of six measures, with children adopted from foster care more likely to have problems. Children adopted from foster care are more likely than those adopted privately from the United States or internationally to have been diagnosed with ADD/ADHD (38 percent compared with 19 and 17 percent, respectively), behavior/conduct problems (25 percent compared with 11 and 7 percent), and attachment disorder (21 percent compared with 6 and 8 percent). Furthermore, children adopted from foster care are more likely to have problems with social behaviors than privately adopted U.S. children (18 percent compared with 10 percent), and they are somewhat less likely to exhibit positive social behaviors (83 percent compared with 91 percent);i see Figure 20. However, depression is rare among all adopted children regardless of the type of adoption.
Figure 19. Percentage of children according to measures of social and emotional well-being, by adoptive status
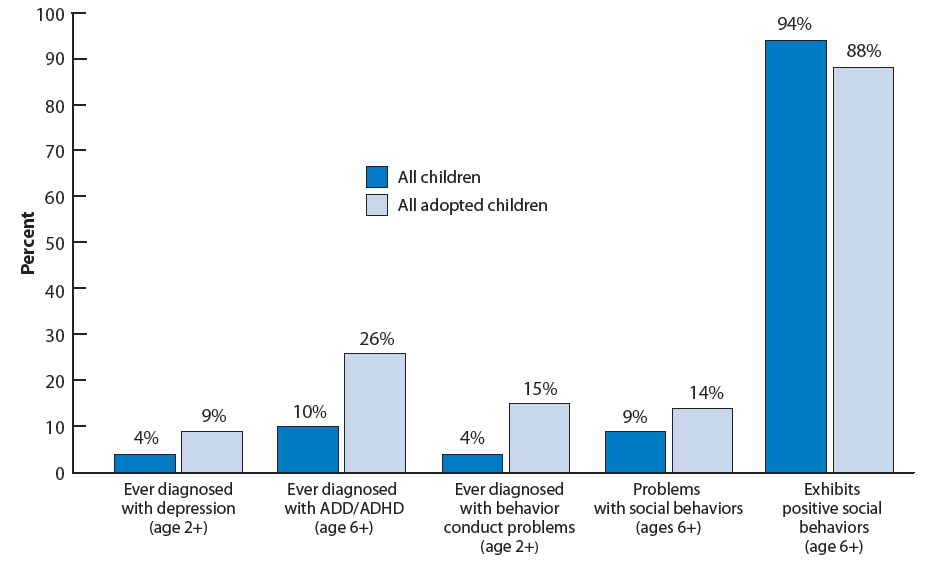
Figure 20. Percentage of adopted children according to measures of social and emotional well being, by adoption type
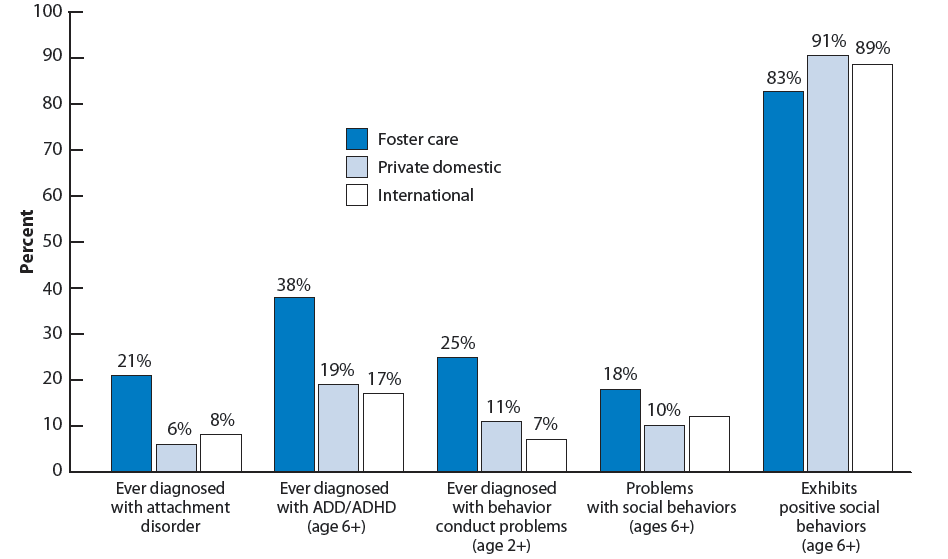
SOCIAL AND EMOTIONAL WELL-BEING MEASURES
For each of the first four disorders listed below, parents reported whether “a doctor or other health care provider ever told them that the child had the condition, even if he/she does not have the condition now.” It is important to note that, while these represent clinical psychological problems, data are based on parents’ recollections of doctors’ diagnoses, rather than actual diagnoses or direct observation of children. With the exception of attachment disorder, parents also reported whether children still had each condition at the time of the survey, and, if so, whether it was mild, moderate, or severe.
Attachment disorder (or reactive attachment disorder, RAD): This is a disorder of infancy/early childhood that can severely harm children’s abilities to develop appropriate social relationships. Children may be excessively inhibited; alternatively, they may be indiscriminately sociable. By definition, it begins before age 5; it is associated with severe neglect of children’s basic emotional needs. If parents had not heard of attachment disorder, we assumed children had not been diagnosed with it. This question was asked in the NSAP, so comparable data are not available for the general child population.
Depression: Depressive disorders can include relatively brief episodes (e.g., 2 weeks) of chronically depressed or irritable mood, changes in appetite or weight, changes in sleep patterns, and difficulty concentrating. It can be associated with separation anxiety, problems with social interactions, academic problems, substance use, and in serious cases, suicide. If parents were unfamiliar with depression, interviewers told them that “Depression is an illness that involves the body, mood, and thoughts. It is marked by persistent sadness or an anxious or empty mood. It affects how a person feels, and the way a person eats, sleeps, and functions.”
Attention deficit disorder or attention deficit hyperactivity disorder (ADD/ADHD): ADD/ADHD involves inattention and/or hyperactivity or impulsivity that occurs more severely and frequently than in other children of similar ages and that impairs children’s social or academic functioning. It is difficult to establish a diagnosis prior to age 4 or 5, although it develops prior to age 7. When asked, interviewers explained that “a child with attention deficit disorder or attention deficit hyperactivity disorder has problems paying attention or sitting still. It may cause the child to be easily distracted.”
Behavior or conduct disorder: Children with conduct disorders repeatedly and persistently violate the basic rights of others or social rules or norms. Children may threaten to or actually harm others, or engage in vandalism or theft. Parents reported whether their child had ever been diagnosed with behavior or conduct disorder, such as oppositional defiant disorder. Interviewers could explain to parents that “oppositional defiant disorder is an ongoing pattern of defiant and hostile behavior that interferes with a child’s life and daily activities.”
Positive social behaviors: Children are classified as exhibiting positive social behaviors if their parent reported that their child “usually” or “always” engaged in all four of the following behaviors: “[shows] respect for teachers and neighbors,” “[gets] along well with other children,” “[tries] to understand other people’s feelings,” and “[tries] to resolve conflicts with classmates, family, or friends.”
Negative social behaviors: Children are described as exhibiting negative social behaviors if their parent reported that their child “usually” or “always” engaged in two out of the four behaviors: “[argues] too much,” “[bullies or is] cruel or mean to others,” “[is] disobedient,” and “[is] stubborn, sullen, or irritable.”
Note: Detailed information on the symptoms of attachment disorder, depression, attention deficit disorder or attention deficit hyperactivity disorder (ADD/ADHD), or behavior or conduct disorder are available in: American Psychiatric Association. 2000. Diagnostic and Statistical Manual of Mental Disorders, Fourth Edition, Text Revision. Washington, DC: American Psychiatric Association.
Notes
i Differences between children adopted from foster care and from other domestic sources in the percentages exhibiting negative and positive social behaviors are marginally significant (p<.10)
Cognitive development and educational achievement
To assess the cognitive development and educational achievement of children who were adopted, the Chartbook summarizes parents’ reports on four measures for school-age children: reading/language arts performance, math performance, engagement in school, and whether children spend time reading for pleasure. See Appendix Table 9 on page 68 for detailed data on each indicator.
More than half of school-age adopted children have excellent or very good performance in reading and language arts; the same is true for math. Nearly seven out of ten are engaged in school. Furthermore, about eight out of ten adopted children typically spend time reading for pleasure on a daily basis. Among elementary-school-age adopted children ages 6 to 11, about nine out of ten (88 percent) spent time reading for pleasure.
For elementary-school-age children, reading for pleasure is equally likely among adopted children and those in the general population. However, older adopted children ages 12 to 17 are somewhat less likely to have had their parents report that the child spent any time reading for pleasure on an average school day, compared with those in the general population (71 compared with 78 percent, respectively); see Figure 21. Additionally, adopted children are less likely than children in the general population to be engaged in school (69 and 81 percent, respectively); see Figure 22. Parents of children in the general population were not asked about their children’s reading and language arts or math performance.
Figure 21. Percentage of children ages 6-17 who spend any time reading on an average school day, by adoptive status and by child age
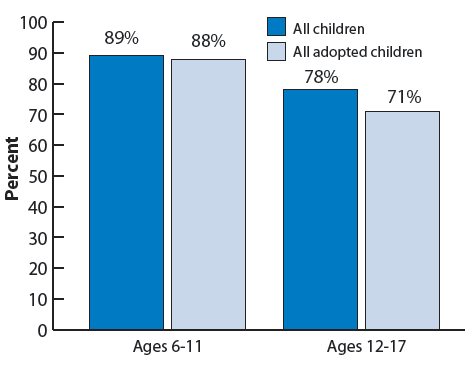
Figure 22. Percentage of children ages 6-17 who are usually or always engaged in school, by adoptive status and by adoption type
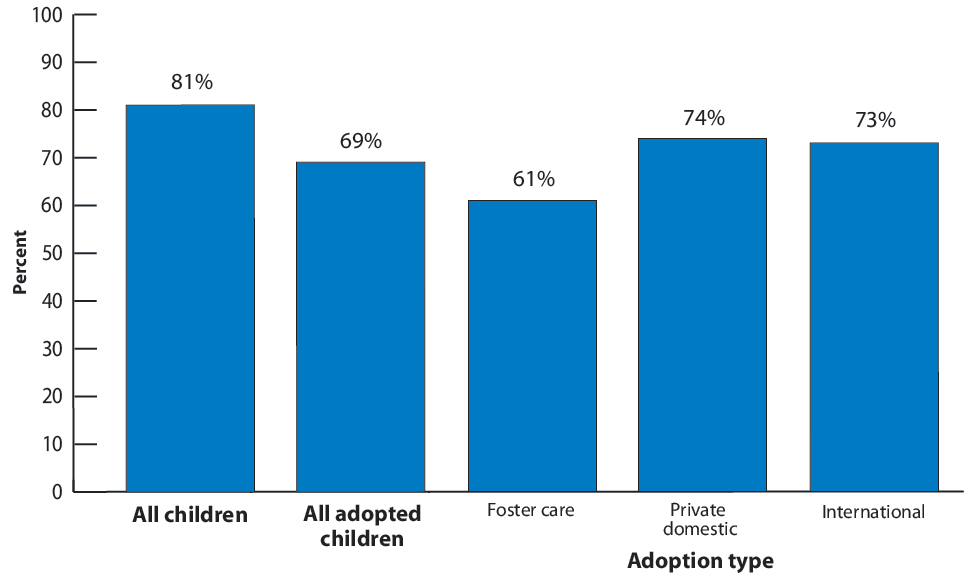
Children adopted from foster care are somewhat less likely than other adopted children to have excellent or very good performance in reading and language arts and in math, and they are less likely to be engaged in school. Fifty percent of school-age children who had been adopted from foster care had parents who rated their reading and language arts performance as “excellent” or “very good.” Similarly, 41 percent had parents who rated their math performance as “excellent” or “very good”; see Figure 23. This pattern generally holds true regardless of children’s ages. Among 6- to 17-year-olds adopted from foster care, 61 percent are engaged in school, compared with 74 percent of those adopted privately from the United States and 73 percent of those adopted internationally. However, reading for pleasure is equally likely for all three types of adoptions among school-age children, both for those of elementary school age (6 to 11 years) and for older children (ages 12 to 17).
Figure 23. Percentage of adopted children ages 5-17 whose parents rated their school performance as “excellent” or “very good” by adoption type
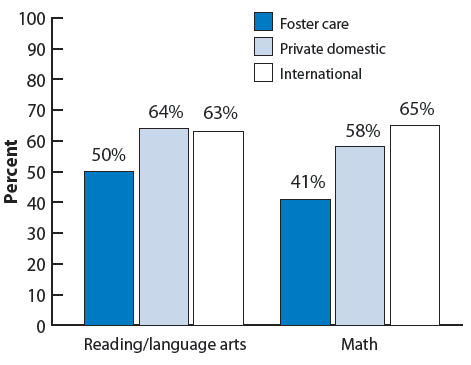
COGNITIVE DEVELOPMENT AND EDUCATIONAL ACHIEVEMENT MEASURES
Reading and language arts performance: For this measure, we compared the percentage of children ages 5 to 17 whose parents rated their “school performance in reading and language arts” as “excellent” or “very good,” rather than “good,” “fair,” or “poor.”
Math performance: For this measure, parents of children ages 5 to 17 rated their child’s “school performance in math.” Response options and groupings were the same as with reading and language arts performance.
Usually/always engaged in school: School engagement was assessed based on parents’ responses about how frequently during the prior month children ages 6 to 17 “care[d] about doing well in school” and “[did] all required homework.” Children whose parents answered “usually” or “always” to both questions were classified as being engaged in school.
Reading for pleasure: For this indicator, we identified whether parents who responded to the question, “On an average weekday, about how much time does [he/she] usually spend reading for pleasure?” reported that their child, age 6 to 17, spent any time reading.
Family and communityactivities
This section examines a set of activities that are often inherently of value to children and families and that are also predictive of child well-being. For example, reading to young children,25 as well as telling stories and singing to young children,26 supports children’s early literacy development. Regularly sharing meals supports parent-child connectedness and family connectedness and may positively influence adolescents’ nutrition habits and behavioral outcomes.27 Finally, although children’s participation in extracurricular activities takes place outside the family, parents typically facilitate children’s participation. Extracurricular activities can positively influence children’s academic performance and social skills, and they provide opportunities to develop supportive relationships with caring adults.28 See Appendix Table 10 on page 69 for detailed data on each indicator.
Overall, most adopted children have families that engage in positive and supportive activities. For example, almost seven out of ten adopted children under age 6 are read to every day, and more than seven out of ten adopted children under age 6 are sung to or told stories every day; see Figure 24. Over half of all adopted children eat meals together with their families six or seven days per week. More than eight out of ten adopted children ages 6 through 17 participate in extracurricular activities; see Figure 25.
Figure 24. Percentage of children whose parents read to them and sing or tell stories to them, by adoptive status
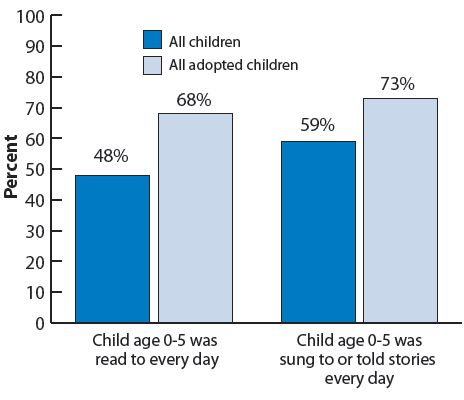
Figure 25. Percentage of children ages 6-17 who participate in one or more organized activities outside of school, by adoptive status and by adoption type
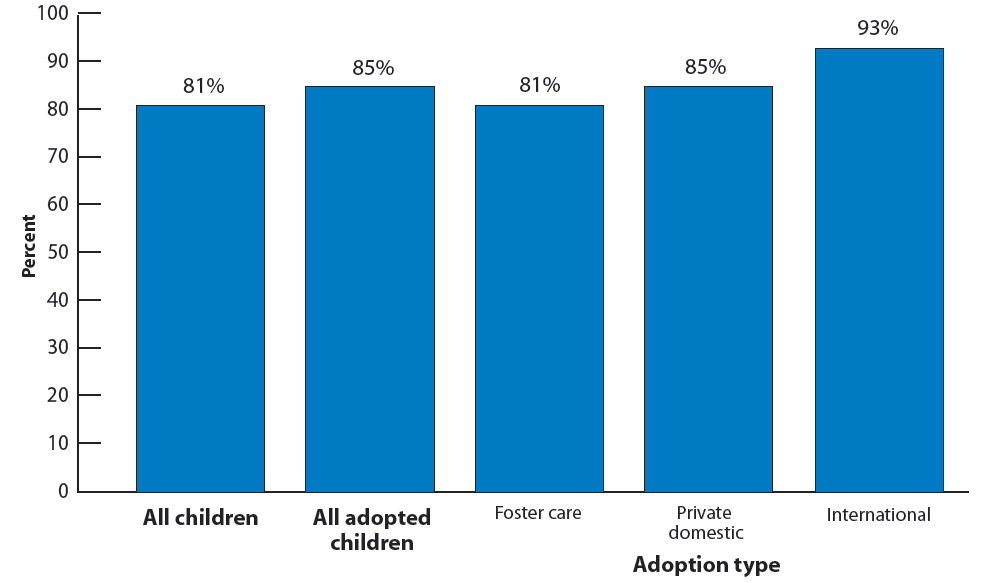
Adopted children are more likely than children in the general population to experience each of the four family activities examined here. Specifically, 68 percent of young adopted children were read to every day during the prior week, compared with 48 percent in the general population. Similarly, 73 percent of young adopted children were sung to or told stories every day during the prior week; this was true of 59 percent of all young children; see Figure 24. Adopted children are also slightly more likely than children in the general population to eat meals with their families six or seven days a week (56 compared with 52 percent).i Eighty-five percent of adopted children ages 6 and older participated in an organized activity, compared with 81 percent of all children ages 6 and older.ii
Results on two of the measures of family activities differ by adoption type, with internationally adopted children most likely to experience positive circumstances. Nearly two-thirds of children adopted internationally (64 percent) eat meals with their families six or seven days a week, compared with just over half of children adopted from foster care and in private domestic adoptions (54 and 52 percent, respectively). Additionally, children adopted internationally are more likely to have participated in an organized activity than children adopted from foster care or privately in the Unites States (93, compared with 81 and 85 percent, respectively). However, there are no differences across adoption types for reading to young children or in telling stories and singing to young children.
MEASURES OF FAMILY AND COMMUNITY ACTIVITIES AND CONTEXT
Child is read to every day: This measure was assessed for children ages 0 to 5 based on parents’ answers to the question, “During the past week, how many days did you or other family members read to [your child]?”
Child is sung to or told stories every day: This measure was assessed for children ages 0 to 5 based on the number of days during the past week that parents reported that “[they] or other family members [told] stories or [sang] songs to” the child.
Family eats meals together 6-7 days per week: Parents responded to the question, “During the past week, on how many days did all the family members who live in the household eat a meal together?”
Extracurricular activity participation: Parents of children ages 6 through 17 answered three questions regarding whether or not their child had been “on a sports team or ... [took] sports lessons after school or on weekends,” “participate[d] in any clubs or organizations after school or on weekends,” or “participate[d] in any other organized events or activities” during the 12 months prior to the survey. Children whose parents answered “yes” to any of the questions were categorized as having participated in extracurricular activities.
Note: Appendix Table 10 includes two additional measures: 1) involvement in community service or volunteer work, and 2) child attendance at religious services.
Notes
i This difference is marginally significant (p<.10).
ii The difference in organized activity participation between adopted and all children was concentrated among 6- to 11-year-olds (89 percent compared with 79 percent).
Parenting and parentwell-being
This section examines five indicators related to parenting: 1) whether the parent-child relationship was rated as very warm and close; 2) the parent-child relationship compared to parental expectations; 3) the experience of having the child in his/her life as compared to parental expectations; 4) ability to cope with the demands of parenting; and 5) parental aggravation. Additionally, this section reports on the quality of the relationship between children’s parents. The parents’ relationship with each other can influence child well-being. For example, relationship factors such as positive affect and enjoyment have been linked with fewer child behavior problems.29 For definitions of each measure, see the text box labeled “Measures of parenting and parent well-being.” See Appendix Table 11 on page 70 for detailed data on each indicator.
The majority of adopted children fare well according to parenting measures, with a substantial portion having parents who rated the parent-child relationship and having the child in their lives as “better than they ever expected.” Overall, 81 percent of adopted children have parents who described their relationship with their child as very warm/close, and 42 percent have parents who reported that the relationship is “better than ever expected.” Fifty-one percent of adopted children have parents who reported that having the child in their lives is better than they ever expected. Just over half (53 percent) also have parents who feel that they cope “very well” with the demands of parenting. Eleven percent have parents who experience parental aggravation; see Figure 26.
Furthermore, for the vast majority of adopted children living with two parents, their parents’ relationship quality is high. Parental reports regarding the happiness of their relationships with their spouses or partners indicate that, among adopted children living with two parents, nearly nine out of ten have parents who reported that their relationship was “very happy” or “completely happy;” see Figure 27.
Adopted children are somewhat less likely than children in the general population to fare well on the parenting measures, but they are more likely to have parents who have satisfying relationships. Adopted children are somewhat less likely than those in the general population to have parents who reported that they cope “very well” with the demands of parenting (53 compared with 60 percent).i And, while parental aggravation is rare among all children, regardless of adoptive status, adopted children are more likely than children in the general U.S. population to have an aggravated parent (11 compared with 6 percent). However, adopted children live with parents who are at least as happy with each other as parents of children in the general population. Indeed, adopted children are somewhat less likely than children in the general population to have parents who said their relationship was either “fairly happy” or “not too happy” (12 and 17 percent, respectively).
Children adopted from foster care fare less well than internationally adopted children on some parenting measures; on other measures there were no differences among adoption types. Specifically, the percentage of children adopted from foster care with parents who reported the parent-child relationship being “better than ever expected” is lowest for children adopted from foster care (36 percent) and highest for internationally adopted children (46 percent). Similarly, 40 percent of children adopted from foster care have parents who reported that having the child in their lives is “better than they ever expected,” compared with 54 percent of privately adopted U.S. children and 62 percent of internationally adopted children. Furthermore, children adopted from foster care are more likely to have aggravated parents than privately adopted U.S. children or internationally adopted children (16 percent, compared with 7 and 9 percent, respectively); see Figure 28. However, parents’ reports regarding how well they cope with the demands of parenting do not differ by adoption type, nor does the quality of parents’ relationships.
Figure 26. Percentage of adopted children according to parenting and parent-child measures
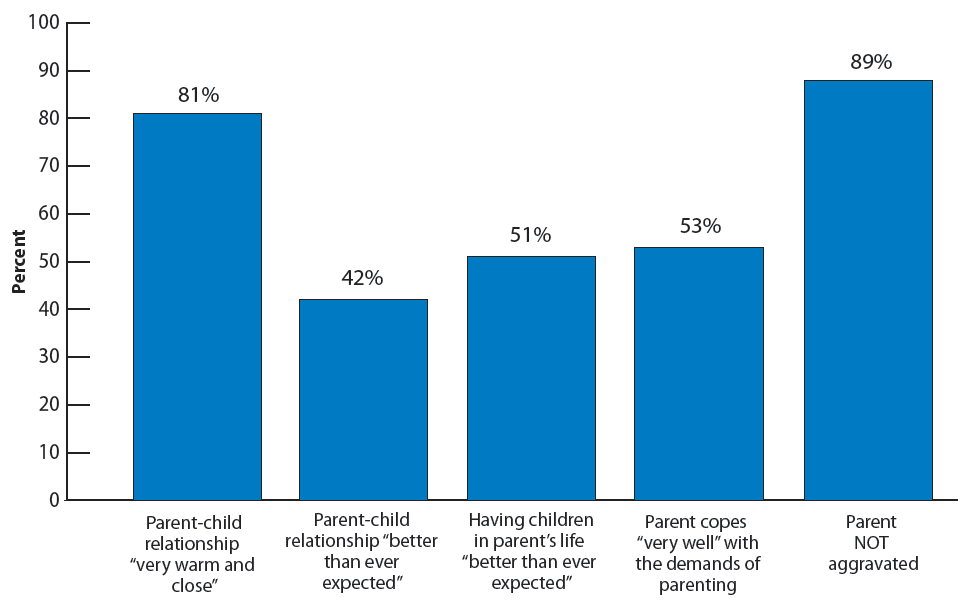
Figure 27. Percentage distribution of all children and all adopted children, by reported satisfaction of parent with spouse/partner relationship quality
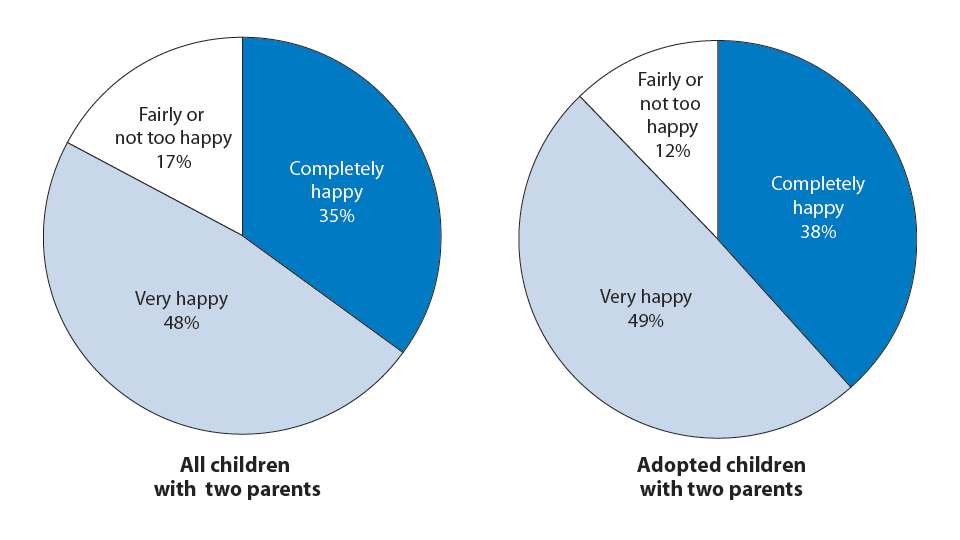
Figure 28. Percentage of adopted children according to parenting and parent-child measures, by adoption type
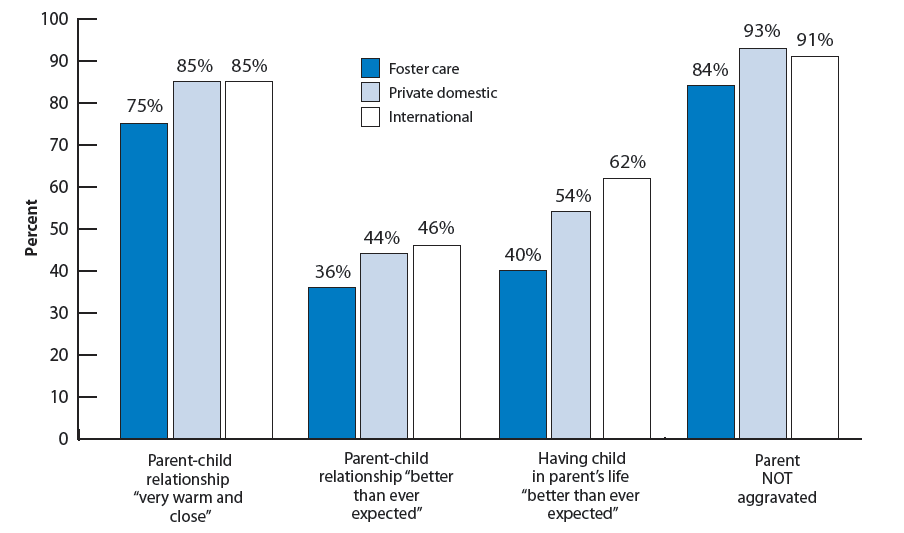
MEASURES OF PARENTING AND PARENT WELL-BEING
Spouse/partner relationship quality: To assess the relationship quality of parents who have a spouse or partner, we identified parents who described their relationship as “completely happy” or “very happy,” as opposed to “fairly happy” or “not too happy.”
Parent-child relationship very warm/close: Based on parents’ responses to the question, “How would you describe your relationship to [your child]?” we examined children whose parents responded “very warm and close,” compared with those who responded “somewhat warm and close,” “somewhat distant,” or “very distant.”
Parent-child relationship, compared to parental expectations: This indicator is based on the question, “Thinking about [your child]’s relationship with you, would you say things are better than you ever expected, about what you expected, or more difficult than you ever expected?”
Having the child in their life, compared to parents’ expectations: Parents answered the question, “So far, how has having [the child] in your life compared with what you thought it would be like?” Responses included “better than you expected,” “about what you expected,” and “more difficult than you expected.”
Ability to cope with the demands of parenting: Parents also answered the question, “How well do you feel you are coping with the day to day demands of parenthood?” We identified parents who responded “very well,” versus those who responded “somewhat well,” “not very well,” and “not very well at all.”
Parent aggravation: Parental aggravation was assessed based on parents’ ratings of how frequently during the prior month they felt the child “[was] much harder to care for than most children his/her age” and “[did] things that really bothered [the parent] a lot,” and how often they “felt angry with him/her.” A scale score was calculated such that typical parental responses of “sometimes,” “usually,” or “always,” rather than “never” or “rarely,” indicated parental aggravation.
Note: Appendix Table 11 includes two additional measures: 1) the relationship of the parent’s spouse/partner to the child is very warm and close, and 2) the relationship of the parent’s spouse/partner to the child, compared to parental expectations.
Notes
i This difference is concentrated among adolescents. For adopted adolescents ages 12 to 17, 47 percent have parents who reported that they coped “very well,” compared with 55 percent of the general population of adolescents.
Adoption satisfaction
To examine adoption satisfaction, this section reports on three measures: whether parentswould make the same decision to adopt their child again, whether parents considereddissolving the adoption, and parental perceptions of their child’s feelings about being adopted. See Appendix Table 12 on page 72 for detailed data on each indicator.
Very few adopted children (3 percent) haveparents who say that they “probably would not” or “definitely would not” make the same decision to adopt their child. In fact, 87 percent of adopted children have parents who said they would “definitely” make the same decision. This percentage varies somewhat by adoption type with 93 percent of privately adopted U.S. children, 87 percent of internationally adopted children, and 81 percent of children adopted from foster care having parents who expressed this opinion;i see Figure 29.
Figure 29. Percentage of adopted children according to whether their parents would make the same decision to adopt again, by adoption type
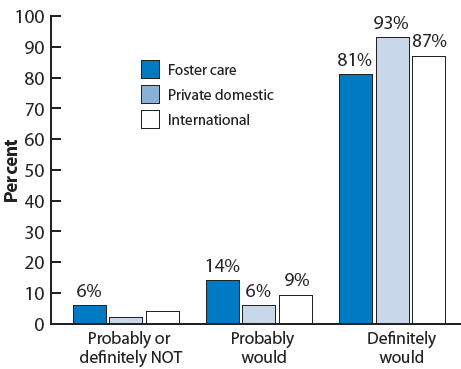
Note: Values corresponding to unreliable percentage estimates have been suppressed in this figure.
Very few adopted children have parents who reported ever having considered dissolving the adoption. The number of children whose parents reported ever considering dissolution was too small to generate reliable estimates of its frequency. It should be noted, however, that families in which the child’s adoption has been legally dissolved do not appear in the survey sample. Furthermore, parents were only asked this question if they had reported the adoption had negatively affected their family or that they would definitely or probably not have accepted the child, knowing everything they now know about the child.
The vast majority of adopted children have parents who reported that their child feels positive about their adoption. More than nine out of ten adopted children ages 5 and older (92 percent) have “positive” or “mostly positive” feelings about their adoption, according to their parents.30 This is true regardless of adoption type and regardless of the child's age; overall, 49 percent of adopted children were reported as having positive feelings and 43 percent were reported as having mostly positive feelings about their adoption.
MEASURES OF ADOPTION SATISFACTION
Parents would make the same decision to adopt their child: Parents were asked, “If you (and your spouse/partner) knew everything about [your child] before the adoption that you now know, how might that have affected your decision to accept him/her for adoption?” Responses included whether the parent would have “definitely,” “probably,” “probably not,” or “definitely not” have accepted the child.
Parent considered dissolving the adoption: Parents were first asked how having their child in their life affected their family and whether they would have made the same decision to adopt the child. If they responded that the child affected their life “somewhat” or “very negatively” or that they would “probably” or “definitely not have accepted the child,” they were asked: “Have you [or your spouse/partner] ever thought about ending this adoption?” We identified parents who answered “yes,” compared with those who answered “no” or who were not asked the question due to their responses to the previous questions.
Parents’ perceptions of the child’s feelings about adoption: Parents of children at least five years old were asked, “Overall, how do you think [your child] feels about being adopted?” Responses included that the child feels “positive,” “mostly positive,” “neither positive nor negative,” “mostly negative,” or “negative” about it. Three percent of children ages 5 and older were excluded from this analysis because their parents reported that the child did not know that he or she had been adopted.
Notes
i The difference between the percentage for children adopted from foster carepercent) is marginally significant (p<.1). The difference between private domesticmarginally significant (p<.1).
Parent involvement and advocacy in the adoption community
This section examines whether adoptive parents have ever helped other adoptive families, for example, whether they have mentored new adoptive parents, and whether they have recruited other families to adopt children. See Appendix Table 13 on page 73 for detailed data on each indicator.
Most adopted children have parents who had never been asked to help or recruit other adoptive families. Specifically, 56 percent of adopted children have parents who reported never having been asked to help, and 92 percent have parents who reported never having been asked to recruit other families. Very few children have parents who declined to help when asked. Only 3 percent of adopted children have parents who reported that they had not helped if asked to assist other adoptive families; see Figure 30. Two percent have parents who declined to recruit other adoptive families; see Figure 31. These figures suggest that adoptive parents are a largely untapped resource of individuals who may be willing to help or to recruit other adoptive families.
Internationally adopted children are the most likely to have parents who helped other adoptive families. And although recruiting by parents was rare among children with all three types of adoptions, children adopted from foster care are the most likely to have parents who recruited other adoptive families. Specifically, 60 percent of internationally adopted children have parents who reported that they helped other families, compared with 38 and 34 percent of children adopted from foster care and privately in the United States, respectively; see Figure 32. Parents of nine percent of children adopted from foster care reported recruiting other adoptive families.
Figure 30. Percentage distribution of adopted children according to whether parents helped other adoptive families
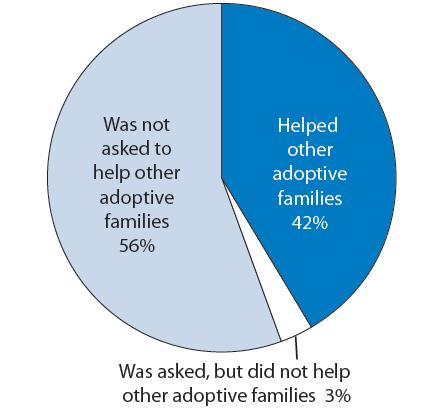
Figure 31. Percentage distribution of adopted children according to whether parents recruited other adoptive families
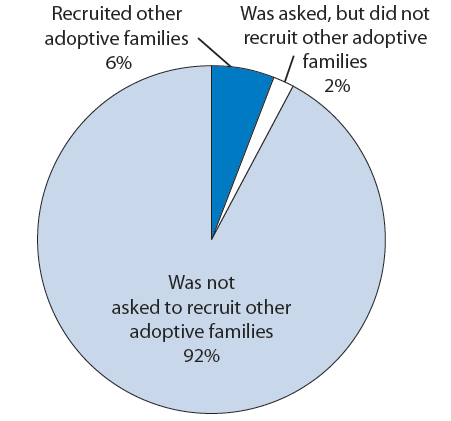
Figure 32. Percentage distribution of adopted children according to whether parents helped other adoptive families, by adoption type
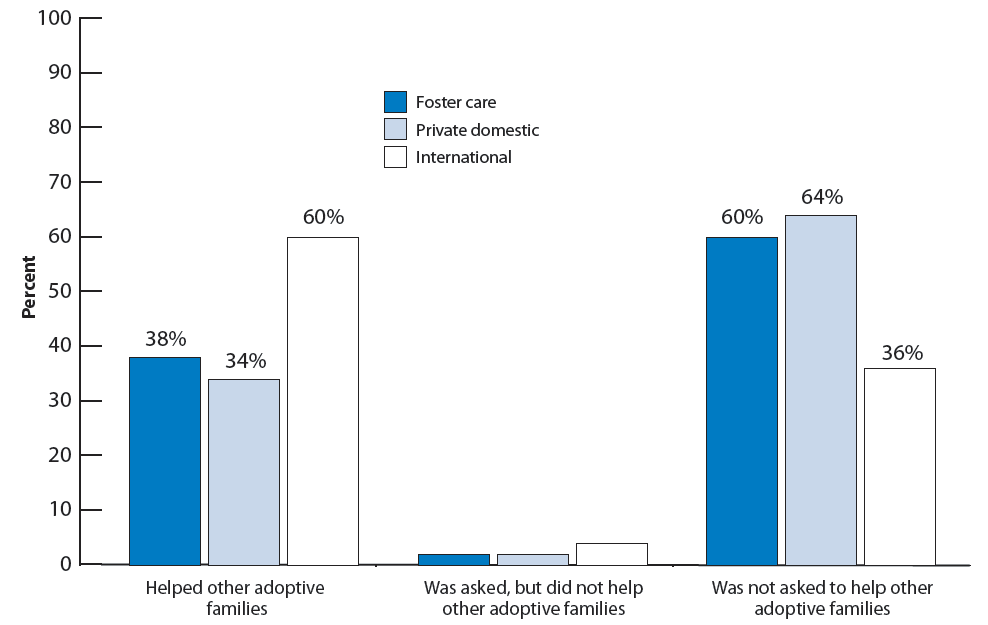
Note: Values corresponding to unreliable percentage estimates have been suppressed in this figure.
MEASURES OF PARENTAL INVOLVEMENT AND ADVOCACY IN THE ADOPTION COMMUNITY
Parent helped other adoptive families: To assess whether parents had helped other families, we examined whether parents said they or their spouse or partner had “ever been asked by anyone to assist in helping other adoptive families” and, for those who answered “yes,” whether they did “assist in helping other adoptive families.”
Parent recruited other adoptive families: This measure depended upon parents’ reports regarding whether they or their spouse or partner had ever been asked “to recruit other adoptive families” and, for those who answered “yes,” whether they had done so.
Parents’ prior connections to adoption
This section examines adoptive parents’ prior experience with adoption. See Appendix Table 14 on page 74 for detailed data.
Three out of four adopted children have parents who have some prior experience with or connection to adoption. Six percent of adopted children have a parent who was himself or herself adopted. Given that the proportion of the general child population that is adopted is 2 percent, it seems likely that adopted children are more likely to have a parent who was adopted than are children in the general population. Four percent have an aunt or uncle who was adopted, but did not have an adopted parent, an additional 31 percent have other relatives who were adopted, and an additional 35 percent have parents with friends who have adopted. Twenty-four percent of adopted children have parents who reported no prior connection to adoption; see Figure 33.
Among adopted children, those adopted internationally were the most likely to have a parent with some prior personal connection to adoption, whereas those adopted privately from the United States were the least likely. Specifically, 10 percent of children adopted internationally have a parent with no prior connection to adoption compared with 33 percent of those adopted privately from within the United States. Compared to other adopted children, those adopted internationally are particularly likely to have a parent who had friends who had adopted; see Figure 34.
Figure 33. Percentage distribution of adopted children by parents’ prior connection to adoption
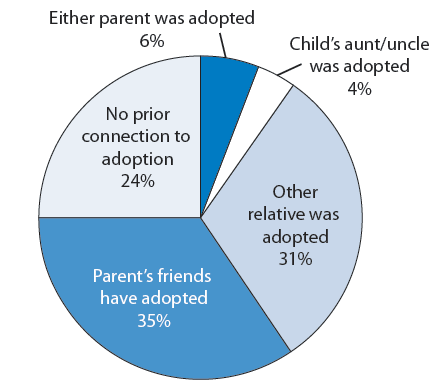
Figure 34. Percentage distribution of adopted children by parents’ prior connection to adoption, by adoption type
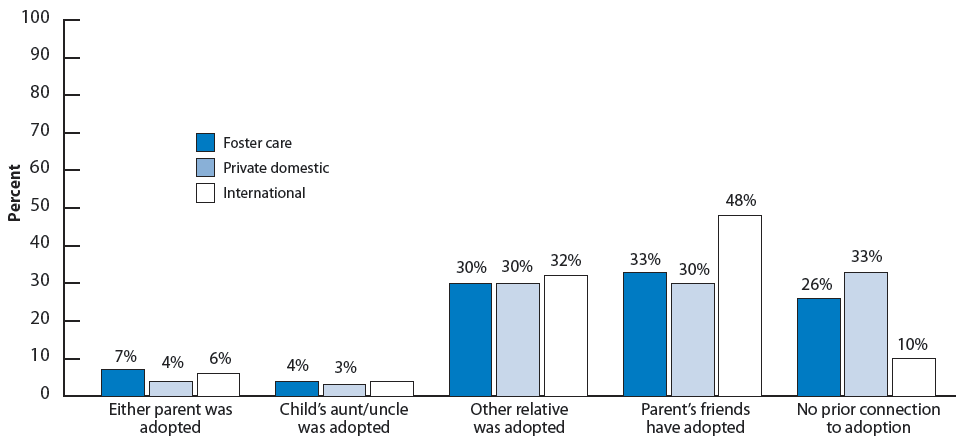
Note: Values corresponding to unreliable percentage estimates have been suppressed in this figure.
MEASURES OF PARENTS’ PRIOR CONNECTIONS TO ADOPTION
We identified parents’ prior connections to adoption by examining their responses to a series of questions. First, we identified adopted children whose parent reported that either they or their spouse or partner (if they had one) had been adopted as a child. Among those adopted children who did not have a parent who had been adopted, we next identified those who had an aunt or uncle who had been adopted, based on their parent’s responses to the question, “Do you [or your spouse/partner] have siblings who were adopted?” To identify whether any of the remaining adopted children had any other relatives who had been adopted, we looked at parental responses to the question, “Do any of your [or your spouse’s/partner’s] relatives have adopted children?” Next, for all adopted children who had no parents or relatives who had been adopted, we identified those whose parent reported having “friends or close acquaintances” with adopted children. We assumed that if parents answered “no” to all the prior questions, children’s parents had no prior connection to adoption.Part 2: The Adoption Process
Part 2 presents findings about the adoption process. Information presented includes parents’ motivation to adopt, parental satisfaction with the agency or attorney that assisted them in the adoption, and adoption expenses. In addition, this section includes information about the openness of adoptions as well as on the post-adoption services and supports families receive. Because this section includes information specific to the adoption process, comparisons with children in the general population are not ncluded.
KEY FINDINGS
- Adopted children typically have parents who said they chose to adopt in order to provide a permanent home for a child, to expand their family, and/or because of infertility. Among the three adoption types, children adopted from foster care are least likely to have parents report infertility as a motivation for adoption, and most likely to report being motivated because they had previously adopted the child’s sibling.
- Nearly nine out of ten adopted children have a parent who was satisfied with their adoption attorney or agency; more than nine out of ten believe that the agency disclosed all important information prior to the adoption. Children adopted from foster care are slightly less likely to have parents who were satisfied with the adoption agency or attorney, but the perception of failure to disclose important information prior to the adoption was rare across all three groups of adopted children.
- Adoption expenses for children adopted privately in the United States or internationally are considerably higher than for children adopted from foster care.
- Almost all adopted children ages 5 and older (97 percent) know they were adopted. Among children adopted by non-relatives, about one-third have a pre-adoption agreement regarding openness, and roughly one-third have had post-adoption contact with birth family members.
- Three out of ten adopted children have a parent who reported that at least one adoption-specific support they needed was not received. Such supports include meeting with agency staff, child and parent adoption support groups, parent training, and web-based resources. Receipt of these services varies by adoption type, with children adopted internationally typically the most likely to have parents who received particular services.
- Just over one out of five adopted children (21 percent) has a parent who reported not receiving at least one needed service not specific to adoption. Such services include child mental health care, family and crisis counseling, child residential treatment or hospitalization, and child drug or alcohol services, tutoring, and mentoring. In a few cases, receipt of services varies by adoption type, with children adopted from foster care typically more likely than other adopted children to have received particular services.
- More than three-fourths of children adopted from foster care receive an adoption subsidy (78 percent); 64 percent have an adoption agreement that allows for both a subsidy and health insurance coverage.
Parents’ motivation to adopt
This section examines adoptive parents’ motivation to adopt. Examining why parents choose to adopt and how those reasons are similar and different across adoption types may inform agencies’ recruitment efforts. See Appendix Table 15 on page 74 for detailed data on each indicator.
Adopted children typically have parents who said they chose to adopt in order to provide a permanent home for a child, to expand their family, and/or because of infertility. Children’s parents reported whether five possible reasons for choosing to adopt applied to them. The most commonly reported reason was to provide a permanent home for a child in need (81 percent), followed by a desire to expand their family (69 percent), inability to have a biological child (52 percent), wanting a sibling for another child (24 percent), and having previously adopted the child’s sibling (7 percent). Some respondents also volunteered additional reasons for adopting, including being related to the child prior to the adoption, having already formed a bond with or loved the child, loving children in general, and helping a child avoid foster care.
The reported motivation to adopt differs by adoption type. Although the ordering of the frequency with which these reasons are reported is generally the same across adoption types, the percentages of children whose parents reported each reason differ. For example, children adopted internationally are more likely than children adopted from foster care or privately adopted adopt U.S. children to have parents report that they were motivated by a desire to expand their family (92 percent compared with 61 and 60 percent, respectively), by infertility (72 percent compared with 39 and 52 percent), or by a desire for a sibling for their child (36 percent compared with 24 and 16 percent). Additionally, children adopted internationally are more likely than privately adopted U.S. children to have parents report being motivated by a desire to provide a permanent home for a child (90 percent compared with 70 percent); see Figure 35. Among the three adoption types, children adopted from foster care are least likely to have parents report infertility as a motivation for adoption, and most likely to report being motivated because they had previously adopted their child’s sibling.i
Figure 35. Percentage of adopted children by parents’ reasons for choosing to adopt, by adoption type
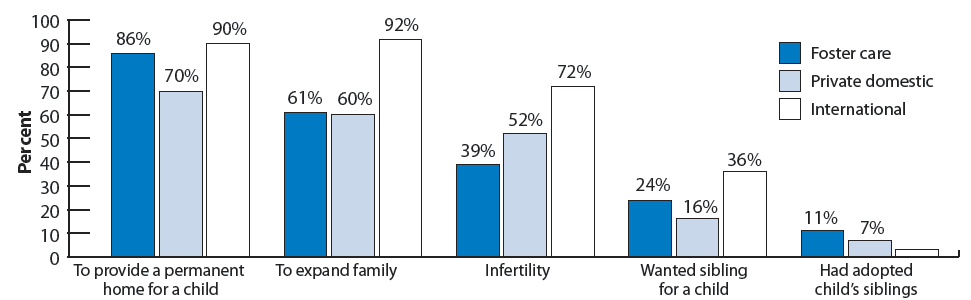
Note: Values corresponding to unreliable percentage estimates have been suppressed in this figure.
MEASURES OF PARENTS’ MOTIVATION TO ADOPT
To assess parents’ motivations for adopting, the NSAP interviewer asked parents to report whether each of a series of possible reasons for deciding to adopt a child applied to them. The motivations included:
- inability to have a biological child,
- wanting to expand their family,
- wanting a sibling for another child,
- already having adopted their child’s sibling, and
- wanting to adopt a child in need of a permanent family.
Additionally, parents were asked whether there was any other reason. Some of the most common additional explanations were that the parent had already formed a bond with or loved the child, or that the parent was related to the child.
Notes
i The difference in percentages of children adopted from foster care and those adopted from other domestic sources is marginally significant for reports that parents were motivated by already having adopted their child’s sibling (p<.10)
Parents’ satisfaction with their agency or attorney
This section examines adoptive parents’ satisfaction with their adoption agency or attorney. See Appendix Table 16 on page 75 for detailed data on each indicator.
Nearly nine out of ten adopted children have a parent who is satisfied with their adoption attorney or agency; more than nine out of ten believe that the agency disclosed all important information prior to the adoption. Specifically, 89 percent of adopted children have parents who reported either a “very positive” or “positive” experience with their attorney or agency. Overall, 8 percent of adopted children have a parent who reported that they believe important information was not disclosed to them prior to the adoption.
Satisfaction with the adoption agency or attorney varies by adoption type. Children adopted from foster care are somewhat less
likely to have parents who had a “very positive” experience than U.S. children adopted privately or those adopted internationally (48 percent, compared with 57 percent for both of the other groups);i see Figure 36.
Figure 36. Percentage distribution of adopted children by parents’ reported experience with adoption agency or attorney, by adoption type
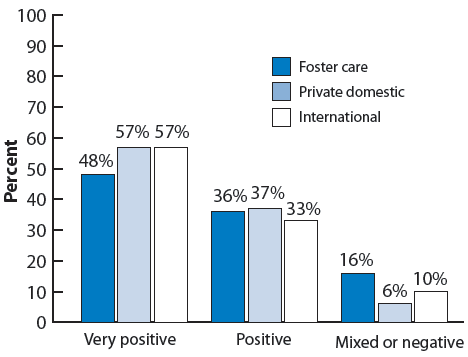
MEASURES PERTAINING TO PARENTS’ SATISFACTION WITH AGENCY OR ATTORNEY
Parents’ satisfaction with their adoption attorney or agency was assessed based on whether parents reported that overall their experience was “very positive, positive, mixed, negative, or very negative.” A small portion of adopted children (1 percent) had parents who reported having used neither an adoption agency nor an attorney for the adoption. These children were excluded from the analysis regarding their parents’ satisfaction with their agency or attorney.
Disclosure of important information prior to the adoption: Parents reported whether they “believe that the agency knew important information” about their child that the agency did not share prior to the finalization of the adoption.
Note: Two additional measures relevant to foster care adoption are reported in Appendix Table 16. These asked foster parents who fostered prior to the adoption: 1) whether options other than adoption were discussed with parent(s), and 2) whether the parent(s) felt pressured by the agency to adopt the child.
Notes
i The difference for internationally adopted children is marginally significant (p<.10).
Adoption expenses
This section examines adoption expenses and sources of reimbursement for expenses, including filing for the federal adoption tax credit, reimbursement for some or all costs by the adoption agency (for children adopted from foster care only), and employer-provided financial assistance. The federal adoption tax credit was established in 1996 to reimburse parents for adoption-related expenses. As of 2008, the maximum reimbursement amount was $11,650; it is phased out for families with adjusted gross incomes between $174,730 and $214,730.31 See Appendix Table 17 on page 76 for detailed data on each indicator.
For about one out of three adopted children, their parents reported paying no adoption-related expenses; for four out of ten, expenses were $10,000 or more. Among children whose adoptions occurred in 1997 or later, eight out of ten have parents who filed for the federal adoption tax credit. Among all adopted children, 13 percent have a parent who reported receiving employer-provided financial assistance.
Adoption-related expenses for the majority of children adopted from foster care are low. Fifty-six percent of children adopted from foster care have parents who reported incurring no adoption expenses; parents of an additional 29 percent reported expenses that were less than $5,000. Fewer than one in ten children adopted from foster care have parents who said the cost was $10,000 or more; see Figure 37.
Figure 37. Percentage distribution of adopted children according to the cost of the adoption, by adoption type
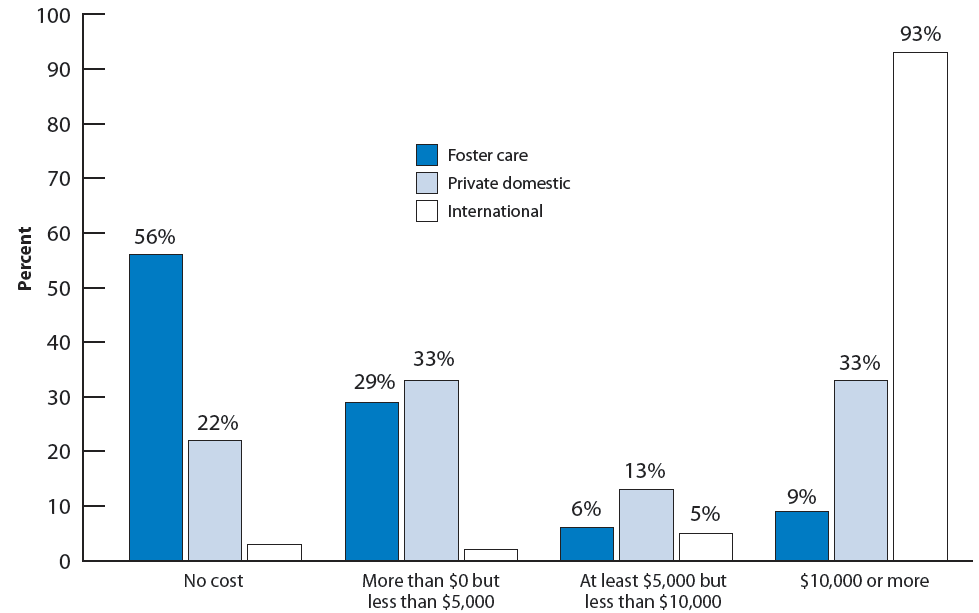
Adoption expenses for children adopted privately in the United States or internationally are typically much higher than for children adopted from foster care. Costs were substantial for a large proportion of privately adopted U.S. children, with 20 percent having adoption costs ranging from $10,000 to $20,000 and 12 percent with expenses of $20,000 or more. However, for 22 percent of children adopted privately in the United States, parents reported paying no adoption-related costs. In general, adoption costs are lower when children are adopted by relatives, and this is particularly so among children adopted privately. Among these children, 94 percent of those adopted by relatives had expenses less than $5,000, compared with 27 percent of those adopted by non-relatives. International adoption expenses tend to be even greater than for privately adopted U.S. children. Adoption expenses were $20,000 or more for 49 percent of children adopted internationally.
Children adopted from foster care are less likely than other adopted children to have a parent use the adoption tax credit or to receive employer-provided financial assistance. Children adopted internationally are more likely than other adopted children to have parents who reported obtaining employer-provided financial assistance to cover adoption-related expenses. Twenty-two percent of children adopted internationally have parents who reported this type of financial assistance, while these figures are 6 and 13 percent, respectively, for children adopted from foster care and privately from the United States. Similarly, the percentage of parents who claimed the tax credit is higher for those who adopted privately from the United States (84 percent) and internationally (86 percent) than for those who adopted from foster care (66 percent). However, these lower rates among parents adopting from foster care may reflect their use of different financial supports. In most states, the public child welfare agency reimburses families for most, if not all, of adoption-related costs for parents who adopt children from foster care. Accordingly, substantial proportions of children adopted from foster care have parents who reported no adoption-related costs (56 percent) or having been reimbursed by their adoption agency (39 percent).
MEASURES PERTAINING TO ADOPTION EXPENSES
Adoption expenses: The survey initially asked parents, “Did you pay anything at the time of the adoption, for example, did you pay for a home study or pay an attorney?” Those who said “no” were not asked any further questions about cost or about whether they were reimbursed for any costs. It is not clear whether families who were fully reimbursed for adoption-related expenses would have responded that they incurred any costs at the time of the adoption, or whether they would have reported no adoption expenses. Among those who responded “yes,” they had paid something at the time of the adoption, information on adoption-related costs was collected differently depending on adoption type. Parents of children adopted privately in the United States or internationally reported costs in increments of $5,000 up to “$40,000 or more.” Parents of children adopted from foster care reported costs in increments of $5,000 up to “$10,000 or more.” See Appendix Table 18 for details on adoption expenses for children adopted privately or internationally.
Sources of reimbursement for adoption expenses: Parents reported whether they were aware of and had filed for the federal adoption tax credit, whether their adoption agency had reimbursed all, some, or none of these expenses, and whether they or their spouse’s employer had provided financial assistance for the adoption.
Adoption openness
In the adoption process, “openness” refers to the extent to which all parties (including the adopted child and birth-family members) are informed about past and present relationships, and are able to initiate and maintain contact with each other. To examine adoption openness, this section first identifies whether or not children are aware that they have been adopted. This section also describes whether children’s families have pre-adoption agreements regarding openness, and whether adopted children have had post-adoption contact with members of their birth family. In “closed” adoptions, birth and adoptive parents had no contact with each other; often knowing very little—if anything—about each other. In some cases, adoptive parents did not tell their children that they had been adopted. The 1960s brought a shift toward more openness in adoption.32 Although the effect of continued contact and communication between adopted individuals and birth parents has been difficult to study, its proponents believe it can facilitate the psychological well-being of both groups.33 In many states, agreements about post-adoption contact—both for privately adopted children and for children adopted from foster care - are legally enforceable, providing some assurance to birth parents of the continued openness of an adoption.34 See Appendix Table 18 on page 77 for detailed data on each indicator.
Almost all adopted children ages 5 and older (97 percent) know they were adopted. There are small differences across adoption type, with children adopted from foster care slightly less likely to know they were adopted (94 percent), compared with other adopted children.
Among children adopted by non-relatives,i about one-third have a pre-adoption agreement regarding openness. Roughly one-third have had post-adoption contact with birth family members. Specifically, the parents of 32 percent of adopted children reported pre-adoption agreements regarding contact, such as visits or phone calls with birth family members, or the exchange of photographs. For 36 percent, either the child or the child’s parents have had post-adoption contact with the child’s birth family, either in person, or through letters or email.
Pre-adoption agreements and post-adoption contact are most common among children adopted privately from within the United States. Specifically, 67 percent of privately adopted U.S. children have pre-adoption agreements compared with 32 percent of children adopted from foster care. Respondents who adopted internationally reported pre-adoption agree-ments so rarely that a reliable estimate cannot be generated. Similarly, over two-thirds of privately adopted U.S. children (68 percent) have had contact with their birth families following the adoption, as have almost two-fifths of children adopted from foster care (39 percent). Six percent of children adopted internationally have had post-adoption contact with their birth families; see Figure 38.
Figure 38. Percentage of children adopted by non-relatives who have pre-adoption agreements regarding openness and who have had post-adoption contact with birth family members, by adoption type
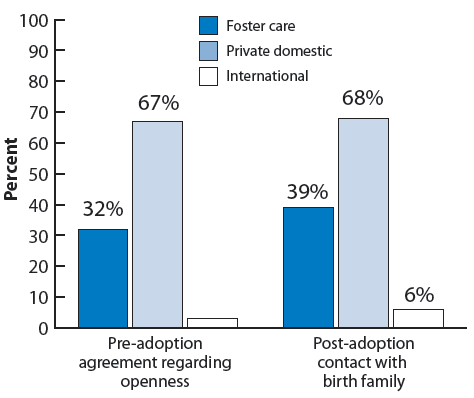
Note: Values corresponding to unreliable percentage estimates have been suppressed in this figure.
MEASURES PERTAINING TO OPENNESS IN ADOPTION
Child knows he/she was adopted: We derived this measure from a question to parents of children ages 5 and older regarding how their children feel about being adopted. In response, some parents volunteered that their children did not know they had been adopted.
Pre-adoption agreement regarding openness: A pre-adoption agreement regarding openness may range from informal discussion to a written, signed contract regarding contact between adopted children and members of their birth family following the adoption. Such agreements are also sometimes called “cooperative adoption” or “open adoption” agreements. In the NSAP, interviewers asked parents whether there was “any kind of pre-adoption agreement in which you agreed to provide information about [your child] to one or both of his/her birth parents or other birth family members.” Children whose parents were related to them prior to the adoption were excluded from this analysis because they were not asked about pre-adoption openness agreements.
Post-adoption contact with birth family members: This measure was based on parental report about whether they, their spouse or partner, or their child have “ever had contact with his/her birth family members” since the time of the adoption. Note that the contact may have been between the birth family and the adoptive parents rather than directly with the child, and that contact may have been via letter, email or in person. Children whose parents were related to them prior to the adoption were excluded from this analysis because they were not asked about post-adoption contact.
Notes
i Parents who were related to their child prior to the adoption were not asked about whether they had pre-adoption agreements regarding openness.
Post-adoption supports
Post-adoption supports include an array of services and other assistance that families may receive after adopting a child. 35 In this section, we discuss several categories of supports. Supports specific to adoption include meeting with agency staff, child and parent adoption support groups, parent training, and web-based resources. Financial supports available specifically for children adopted from foster care include monthly adoption subsidy payments and health insurance coverage (i.e., Medicaid coverage). Rehabilitative services not specific to adoption include child mental health care, family and crisis counseling, child residential treatment or hospitalization, and child drug or alcohol services. In this section we also look at other supports not specific to adoption, including mentoring and tutoring. See Appendix Table 19 on page 78 for detailed data on each indicator.
Adoption-specific Supports
The most commonly reported service received was meeting with someone from the adoption agency to discuss post-adoption services (35 percent). Participating in a parent support group, participating in parent trainings, and using web-based resources are services that the parents of about three out of ten children received regardless of adoption type. A less common service is participation in support groups for children; 11 percent of adopted children ages 5 and older have ever participated in such a group.
A minority of parents said they wanted but did not receive services. For example, few adopted children (7 percent) have a parent who reported not having met with someone at the agency to discuss post-adoption services, but wanting to. For each of the other services, just over one out of ten children had a parent who reported having wanted but not received a service (16 percent for children’s support groups, 12 percent for parent trainings, 11 percent for parent support groups); see Figure 39. Overall, three out of ten adopted children have a parent who reported that at least one needed adoption-specific support was not received.
Receipt of post-adoption services varies by adoption type, with children adopted internationally typically the most likely to have parents who received particular services. One-half of children adopted internationally (50 percent) have a parent who met with someone from the adoption agency to discuss post-adoption services, compared with just over one-third of children adopted from foster care and one-quarter of those adopted domestically through other sources (36 and 25 percent, respectively). Similarly, children adopted internationally are more likely to have participated in a support group for children ages 5 and up, to have had a parent participate in a support group,i and to have a parent who used web-based resources about adoption. However, the percentage of adopted children with a parent who participated in parent training after the adoption was finalized is higher for foster care adoptions than for private domestic or international adoptions (38 percent, compared with 25 and 29 percent, respectively); ii see Figure 40.
The majority of children adopted from foster care receive an adoption subsidy and health insurance coverage through an adoption agreement. Over three-quarters of children adopted from foster care (78 percent) receive a monthly adoption subsidy payment. Nearly two-thirds (64 percent) have an adoption agreement guaranteeing both an adoption subsidy and health insurance coverage.
Figure 39. Percentage of adopted children whose parents wanted to receive various post-adoption services (adoption specific) but did not
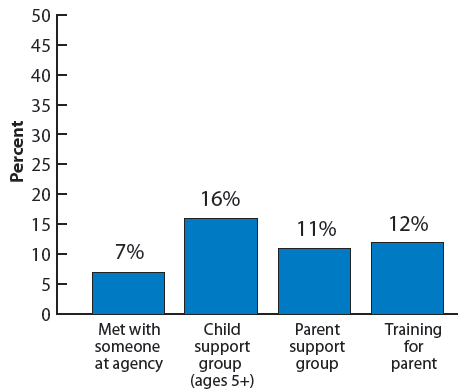
Figure 40. Percentage of adopted children whose parents received various post adoption services (adoption specific), by adoption type
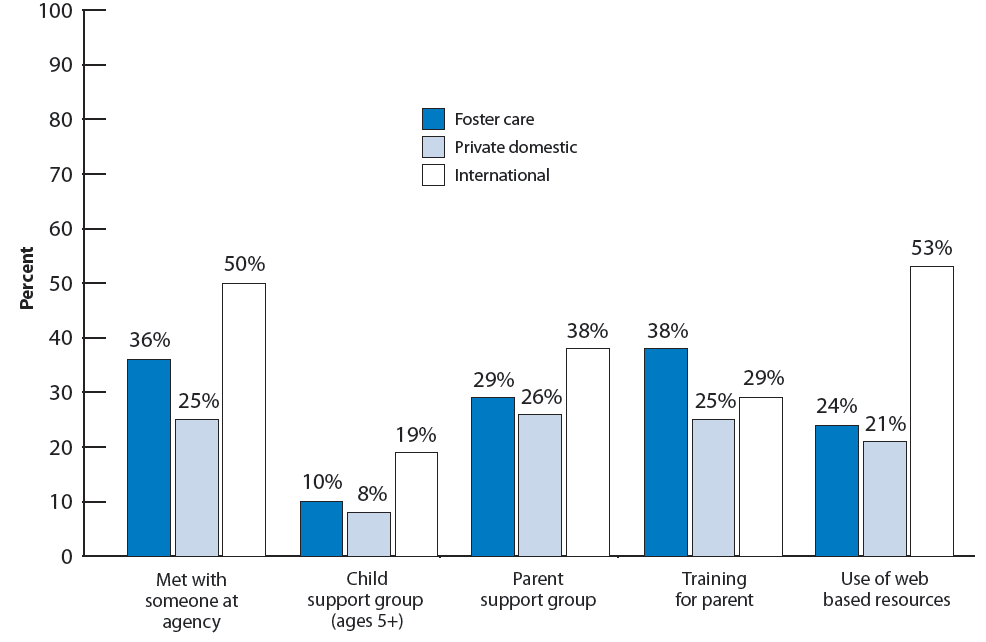
MEASURES RELATED TO POST-ADOPTION SUPPORTS
Adoption agreement, health insurance coverage, and monthly subsidies: Parents reported whether they had an adoption agreement at the time of their child’s adoption. Such agreements may include monthly maintenance payments from the agency, health insurance coverage, and other services such as therapy. For parents who volunteered that they receive a monthly financial subsidy or whose child was covered by public health insurance, we examined whether these supports were part of the adoption agreement.
Other supports: Parents reported whether they or their child had received a variety of services and whether they had wanted to receive each service. The services included:
- Parents meeting with someone at an adoption agency after the adoption was finalized to discuss post-adoption services and supports
- Adoption support groups for children ages 5 and older
- Adoption support groups for parents
- Classes, conferences, lectures, or seminars for parents about adoption
- Internet-based resources with information on adoption-related issues
- Family counseling
- Crisis counseling
- Mental health care or counseling for children ages 5 and older
- Psychiatric hospital, group home, or residential treatment center for children ages 8 and older
- Alcohol or drug evaluation and/or treatment for children ages 13 and older
- A mentor for children ages 5 and older
- An academic tutor for children ages 5 and older
Rehabilitative services: The rehabilitative services considered here include family counseling; crisis counseling; mental health care or counseling for children; treatment in a psychiatric hospital, group home, or residential treatment center; and alcohol or drug evaluation and/or treatment for children.
Rehabilitative Services and Other Supports Not Specific to Adoption
Mental health care and tutoring were the most common services received by adopted children that were not specifically designed for or targeted to adoptive families. Among adopted children ages 5 and over, 39 percent received mental health care and 36 percent received tutoring. Families of one out of five adopted children received family counseling (20 percent). Thirteen percent of adopted children ages 5 or older had ever had a mentor. Less common services include psychiatric residential treatment or hospitalization, and drug and alcohol services for adopted adolescents, as well as crisis counseling. Over one-third of adopted children received at least one rehabilitative service, such as family or crisis counseling, in-patient or out-patient mental health care, or drug or alcohol treatment services.
For most services not specifically designed for or targeted to adoptive families, fewer than one out of ten adopted children have parents who said they wanted but did not receive each particular service. The most frequently mentioned services that had been desired but not received were mentoring and tutoring (11 percent for each service). For other services, reports that services were needed but not received were rarer; see Figure 41. Looking across all of the supports not specific to adoption, just over one out of five dparents (21 percent) reported that at least one
needed support was not received.
Receipt of a few services varies by adoption type; typically, children adopted from foster care are more likely than other adopted children to have received each service. In particular, nearly half of children adopted from foster care have received some type of rehabilitative service (46 percent), compared with 34 percent of children adopted from other domestic sources and 29 percent of children adopted internationally. Nearly one-half of children ages 5 and older adopted from foster care (46 percent) received mental health care compared with about one-third of children adopted domestically through other sources or internationally (33 and 35 percent, respectively).iii
Children adopted from foster care are also more likely than U.S. children adopted privately or internationally adopted children to have received crisis counseling, and, among those ages 5 and older, they are more likely than internationally adopted children to have had a mentor; see Figure 42. The percentage of adopted children who failed to receive at least one needed service also varies by adoption type. Twenty-six percent of children adopted from foster care have parents who reported an unfilled need compared with 16 percent of children adopted internationally.
Figure 41. Percentage of adopted children whose parents wanted to receive various post-adoption services (general) but did not
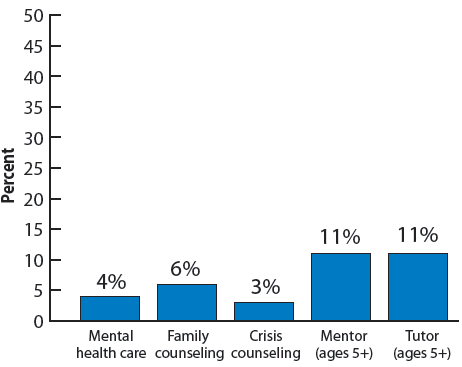
Figure 42. Percentage of adopted children whose parents received various post-adoption services (general), by adoption type
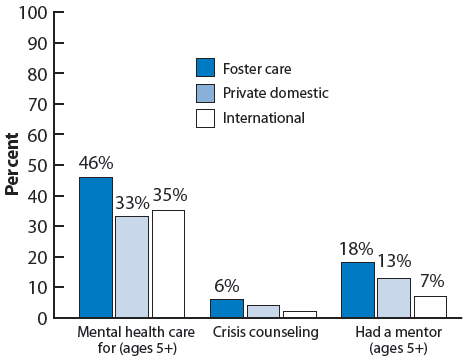
Note: Values corresponding to unreliable percentage estimates have been suppressed in this figure.
Notes
i This difference is marginally significant (p<.10).
ii The difference in percentages for children adopted from foster care and children adopted internationally (38 compared with 29 percent) is marginally significant (p<.10).
Technical Appendix
Data Sources
Data for this Chartbook come from the 2007 National Survey of Adoptive Parents (NSAP) and from the 2007 National Survey of Children’s Health (NSCH). Estimates pertaining to the entire population of U.S. children are based on the NSCH sample, and estimates pertaining to adopted children are based on the NSAP sample.
The NSCH is a nationally representative survey of U.S. children under age 18. The NSCH uses the sampling frame of the National Immunization Survey (NIS), which contacts over a million households annually. After the NIS screener and/or survey are completed, the State and Local Area Integrated Telephone Survey (SLAITS) module is administered if households include any children under age 18. SLAITS has fielded the NSCH in 2003 and in 2007. In each household, one child under age 18 was randomly selected, and a parent or guardian knowledgeable about the child’s health answered questions about the child’s and the family’s health and well-being and provided information about demographic characteristics. The 2007 NSCH included information on 91,642 focal children. The overall response rate for the NSCH was 46.7 percent. This percentage accounts not only for the rate at which individuals who were contacted for the survey completed it, but also for the assumption that some portion of the sampled phone numbers whose eligibility could not be determined were, in fact, eligible for the NSCH interview. Among households in which someone completed the screener to determine their eligibility for the NSCH, the interview completion rate was 66 percent.36
The NSAP is nationally representative of adopted children ages 0 to 17 in English-speaking households in the United States in 2007, excluding those also living with a biological parent. Collaborative efforts between the Office of the Assistant Secretary for Planning and Evaluation (ASPE), the Administration for Children and Families (ACF), and the National Center for Health Statistics (NCHS) culminated in the development of the NSAP survey instrument and administration of the survey.37 The NSAP was an add-on module to the 2007 National Survey of Children’s Health (NSCH).38 If the focal child in the 2007 NSCH was adopted, an adoptive parent of the child was asked to participate in the NSAP, a 30-minute telephone survey. A total of 2,737 focal children were identified as having been adopted in the 2007 NSCH. NSAP interviews were carried out between April 2007 and June 2008 regarding 2,089 children. (Adopted children who were also living with a biological parent, whose adoptions were assumed to be primarily step-parent adoptions, were excluded from the NSAP.)39 The cooperation rate (that is, the rate at which NSAP interviews were completed for children who were identified as eligible based on the NSCH screener) was high, at 74.4 percent. However, when other factors are taken into account, such as the NSCH interview completion rate,40 the overall response rate for the NSAP was 34.6 percent. Weighting adjustments for NSAP nonresponse greatly reduce the likelihood of nonresponse bias.
Identifying Adopted Children and the Type of Adoption
Identifying adopted children in the NSCH who were eligible for the NSAP, and identifying the type of adoption, required several steps. All NSCH respondents reported their own relationship to the child. Those who identified themselves as a mother or father to the child were asked whether they were the child’s “biological, adoptive, step, or foster” parent. Respondents were asked also whether any other parents or people who act as the child’s parents lived with them, and if so, what their relation-ships to the child were. If there was no biological parent in the household, interviewers asked follow-up questions to identify the type of adoption. Specifically, parents were asked: “Was [the child] adopted from another country?” Positive responses indicated children who had been adopted internationally. If the answer was no, parents were asked: “Prior to being adopted,was [the child] in the legal custody of a state or county child welfare agency in the United States? That is, was [the child] in the U.S. foster care system?” Positive responses indicated children who were adopted from foster care. All other adopted children were categorized as those adopted privately from domestic sources other than foster care (i.e., U.S. children adopted privately).
There are several important exclusions to the sample of children identified as adopted in the NSCH. First, children adopted informally and those in pre-adoptive placements are not included. Parents who answered “no” to the question, “Has [the child]’s adoption been finalized?” were not eligible for the NSAP interview. Finalizing adoptions can take six months or more from the time a child is placed with a family with the goal of adoption, even after the child has been legally freed for adoption.41 Most of these children were likely later adopted by their parents, but it is possible that for some others, the adoption disrupted (i.e., the adoption was aborted prior to legal finalization.) Excluding children whose adoptions had not been legally finalized also means that the sample does not include dependent children being reared by caregivers in informal adoption arrangements, many of whom may be related to children but not as biological parents.42 Informal adoptions are more common among some cultures, including black and Hispanic families, than others.43
Another important exception is that the NSAP excluded children who were living with one biological and one adoptive parent. Most of these children are in step-families. According to estimates from the Census, at least 4 percent of all children—approximately two-thirds of all adoptions—in the United States are in step-parent adoptions.44
Thirdly, the NSAP does not include children whose adoptions had already been dissolved (i.e., whose adoptions were reversed following legal finalization.) Therefore, while the NSAP addressed topics such as adoption satisfaction and whether parents ever considered dissolving an adoption, it cannot address topics such as why families with dissolved adoptions chose to end the adoption.
Data Analysis
Administering the NSAP as an add-on to the NSCH not only allows for a representative sample of adopted children, but it also allows for comparisons of adopted children with children in the general population on the health and well-being measures collected by the NSCH. For our analyses, we merged variables from the NSCH onto NSAP records (i.e., we created a linked NSAP-NSCH file). This enabled us to calculate estimates pertaining to NSCH variables for adopted children. Estimates pertaining to adopted children in this Chartbook are always based on the NSAP sample.45 Estimates per-taining to all children are based on the NSCH sample and do not exclude adopted children, in order to represent the general population of U.S. children.
To yield representative samples of children in each state, the NSCH used complex sampling methods involving the clustering of children within households and stratification of households within states. The complex sampling methodology means that, in order to generate estimates of variance that are not biased downward, analyses must take advantage of stratum and primary sampling unit (PSU) identifiers, as well as weights that have been adjusted for unequal sampling probability.46 The weights, which have also been adjusted for non-response and which were further adjusted to match pre-existing population control totals, are also necessary in order to generate parameter estimates (e.g., percentages) that can be extrapolated to the overall populations of children that the NSCH—and the NSAP—are intended to represent.
We used the statistical software package Stata in order to account for the complex sampling methodology in both the NSCH and NSAP. Additionally, all analyses were weighted. We generally avoided reporting estimates for which the relative standard error exceeded 0.3, and - at a minimum—flagged such estimates in the appendix tables to denote their imprecision. We also omitted value labels for percentages with relative standard errors exceeding 0.3 from the figures in the Chartbook. Additionally, we tested whether variables were associated by examining chi-square statistics. When chi-square statistics indicated that variables were associated, we tested differences between pairs of groups of sampled children (such as those adopted from foster care versus those adopted internationally or privately and domestically, as well as those adopted by relatives versus non-relatives) by calculating t-statistics for each difference. To test whether differences between adopted children and all children were statistically significant, we calculated t-statistics that accounted for the fact that the NSAP was a subsample of the NSCH. All comparisons between groups that are highlighted in text are statistically significant at the .05 level of significance; notable differences or associations that are statistically significant at the .10 level were also in some cases mentioned and footnoted as “marginally significant” at the .10 level.
Availability of Data
Researchers can carry out more complex analyses of the NSAP and the NSCH by obtaining public use versions of the datasets, available at: http://www.cdc.gov/nchs/slaits.htm
The linked version of the NSCH and NSAP used for the analyses in this chartbook is not publicly available. Researchers interested in analyzing linked NSCH-NSAP data may apply for access to restricted data through the NCHS Research Data Center at http://www.cdc.gov/nchs/r&d/rdc.htm.
Endnotes
1 See: U.S. Department of Health and Human Services, Administration for Children and Families. 2006. The basics of adoption practice. Available online at: www.Childwelfare.gov/pubs/f_basicsbullentin/.
2 This subgroup may also include children who had birth parents unable or unwilling to provide adequate care but were not reported for abuse or neglect and, subsequently, not involved with public child welfare agencies. In these cases the birth parents must voluntarily relinquish their parental rights in order for a relative or unrelated individual to adopt the child privately.
3 Two additional variations on the way that private domestic adoption may occur include identified adoptions and the use of adoption facilitators. Identified adoptions are those in which adoptive and birth parents meet independently, but then choose to use some agency services, such as counseling. Adoption facilitators are sometimes used as an alternative to an adoption agency. An adoption facilitator is an individual who matches prospective adoptive parents and birth parents for a fee. In many states, adoption facilitators are minimally regulated, and in some, adoptions by paid facilitators are not legal. For details on variations in adoption methods, see: U.S. Department of Health and Human Services, Administration for Children and Families. 2003 Adoption Options. http://www.childwelfare.gov/pubs/f_adoptoption.pdf.
4 For more information, see: http://adoption.state.gov/about/how/childeligibility.html.
5 Individual studies, based on a variety of samples and methodologies, have estimated rates of disruption ranging from 10 to 25 percent, and rates of dissolution ranging from 1 to 10 percent. See: U.S. Department of Health and Human Services, Administration for Children and Families. 2004. Adoption Disruption and Dissolution. Available online at http://www.childwelfare.gov/pubs/s_disrup.pdf.
6 During Federal Fiscal Year 2008 (October 1, 2007 through September 30, 2008), 4,123 children were adopted from Guatemala, more than any other country during that year. This was true even though adoptions from Guatemala had come to a halt by the end of that year. Data on rates of international adoptions to the United States and on trends in these rates are available from the Office of Children’s Issues of the U.S. Department of State, available online at: http://adoption.state.gov/news/total_chart.html. The rates are based on issuances of IR3, IH3, IR4, and IH4 visas. The type of visa varies depending on whether the child originates from a country that is party to the Hague Convention and depending on whether the adoption occurs in the United States or in the child’s home country.
7 Office of Children’s Issues of the U.S. Department of State, http://adoption.state.gov/country/china.html.
8 The Voice of Russia World Service in English (RUVR). 2007. “Russian families’ change of heart on adoption.” Available
online at http://www.ruvr.ru/main.php?lng=eng&q=18909&cid=59&p=16.11.2007.
9 Lee, Bong Joo. 2007. Adoption in Korea: Current status and future prospects. International Journal of Social Welfare. 16: 75-83.
10 Office of Children’s Issues of the U.S. Department of State, http://adoption.state.gov/news/total_chart.html.
11 Despite a spike in the number of foster care adoptions following the passage of the Adoption and Safe Families Act (ASFA) in 1996, evidence suggests that the likelihood that a waiting child will be adopted has not increased, and adoptive family recruitment has not increased the share of non-relative adoptions. During the three-year base period before ASFA, 28,000 children were adopted compared with 51,000 in FY 2000. Since 2002, the numbers of children adopted from foster care (51,000 to 53,000), the numbers waiting (129,000 to 133,000), and the percentages of waiting children who are adopted (38 to 40 percent) have remained fairly stable. [Trends in foster care and adoption: FY2002-FY2006 (based on data submitted by states as of January 16, 2008). Retrieved August 13, 2009 from: http://www.acf.hhs.gov/programs/cb/stats_research/afcars/trends.htm.]
12 Jones, J. 2008. Adoption experiences of women and men and demand for children to adopt by women 18-44 years of age in the United States, 2002. National Center for Health Statistics. Vital and Health Statistics, 23(27). Available online at http://www.cdc.gov/nchs/data/series/sr_23/sr23_027.pdf.
13 The NSCH defines children with special health care needs as those who currently experience at least one out of five consequences attributable to a medical, behavioral, or other health condition that has lasted or is expected to last for at least 12 months. The consequences include: 1) ongoing limitations in ability to perform activities that other children of the same age can perform, 2) ongoing need for prescription medications, 3) ongoing need for specialized therapies, 4) ongoing need for more medical, mental health, or educational services than are usual for most children of the same age, and 5) the presence of ongoing behavioral, emotional, or developmental conditions requiring treatment or counseling.
14 Indeed, the experiences of adopted children and youth including histories of abuse and neglect, later age of adoption, prenatal drug exposure, and placement in multiple foster homes prior to adoption have been identified as risk factors for symptoms of attention-deficit hyperactivity disorder (ADHD) and oppositional defiant disorder (ODD) (Simmel, C., Brooks, D., Barth, R., and Hinshaw, S. 2001. Prevalence of externalizing symptomatology in an adoptive sample: Linkages between pre-adoption risk factors and post-adoption out-comes. Journal of Abnormal Child Psychology, 29:57–69). Attachment disorder, which can result from extremely neglectful care very early in life, is also a particular concern for adopted children who entered care due to severe neglect and/or who experienced multiple foster care placements early in life and for some internationally adopted children who received insufficient care in orphanages (for example, see: Howe, D., and Fearnley, S. 2003. Disorders of attachment in adopted and fostered children: Recognition and treatment. Clinical Child Psychology and Psychiatry, 8(3): 369-387; Hughes, D.A. 1999. Adopting children with attachment problems. Child Welfare, 78(5):541-560. Strijker, J., Knorth, E.J., and Knot-Dickscheit, J. 2008. Placement history of foster children: A study of placement history and outcomes in long-term family foster Care. Child Welfare, 87(5): 107-124; van den Dries, L., Juffer, F., van IJzendoorn, M.H., Bakermans-Kranenburg, M.J. 2009. Fostering security? A meta-analysis of attachment in adopted children. Children and Youth Services Review, 31(3): 410-421.)
15 See “Trends in Foster Care and Adoption—FY 2002-FY 2007,” available at http://www.acf.hhs.gov/programs/cb/stats_research/afcars/trends.htm.
16 Adoptions of foster children facilitated by private agencies were intended to be categorized as foster care adoptions based on the NSCH screener questions. During the data collection, however, a change was made to the adoption type assignment for 73 children, because information regarding the type of adoption provided by the respondent during the NSAP interview conflicted with similar information provided during the NSCH interview. Nevertheless, survey error likely remains, and the population of former foster children in adoptions facilitated by private agencies is likely split between foster adoption and private domestic adoption in the NSAP.
17 Office of Children’s Issues, United States Department of State, available online at: http://adoption.state.gov/news/total_chart.html.
18 Weiguo Zhang. 2006. Child adoption in contemporary rural China, Journal of Family Issues 27(3): 301-340. Zeng Yi, Tu Ping, Gu Baochang, Xu Yi, Li Bohua, and Li Yongping. 1993. Causes and implications of the recent increase in the reported sex ratio at birth in China, Population and Development Review 19 (2): 283-302.
19 For a family of four, an income four times the federal poverty threshold equates to $84,800 in 2008. (See: The 2008 HHS Poverty Guidelines, One Version of the [U.S.] Federal Poverty Measure, available at http://aspe.hhs.gov/poverty/08poverty.shtml).
20 Overall, six out of ten adopted children live with two married adoptive parents, most of whom were also married at the time of adoption (55 percent of adopted children have parents who were married at the time of the adoption; an additional 5 percent live with parents who married since the adoption).
21 According to the NSAP, 74 percent of children live with a parent who has a spouse or partner (i.e., the spouse or partner may or may not be an adoptive parent and may or may not be married to the child’s other parent) compared with 80 percent of the general population of children.
22 See: U.S. Census Bureau, page last modified August 19, 2009. Metropolitan and Micropolitan Statistical Areas, available online at: http://www.census.gov/population/www/metroareas/metroarea.html.
23 The 16 conditions considered for the measure of moderate or severe health difficulties include: learning disability; attention deficit disorder or attention deficit hyperactivity disorder (ADD/ADHD); depression; anxiety problems; behavioral or conduct problems, such as oppositional defiant disorder or conduct disorder; autism, Asperger's disorder, pervasive developmental disorder, or other autism spectrum disorder; any developmental delay that affects his/her ability to learn; stuttering, stammering, or other speech problems; Tourette's syndrome; asthma; diabetes; epilepsy or seizure disorder; hearing problems; vision problems that cannot be corrected with glasses or contact lenses; bone, joint, or muscle problems; and brain injury or concussion.
24 This finding is consistent with prior research that focused on the disproportionately high prevalence of clinical levels of externalizing disorders in adopted youth, such as ADHD/ADD, Oppositional Defiant Disorder, conduct disorders, and antisocial behaviors (Deutsch, C.K., Swanson, J.M., Bruell, J.H., Cantwell, D.P., Weinberg, F., and Baren, M. 1982. Over-representation of adoptees in children with attention deficit disorder. Behavior Genetics, 12, 231-238. Brodzinsky, D.M., Hitt, J.C., and Smith, D. 1993. Zill, N. 1996. Coon, J., Carey, G., Corley, R., and Fulker, D.W. 1992. Identifying children in the Colorado Adoption Project at risk for conduct disorder. Journal of the American Academy of Child and Adolescent Psychiatry, 31, 503-511. Simmel, C., Brooks, D., Barth, R., and Hinshaw, S. 2001. Prevalence of externalizing symptomatology in an adoptive sample: Linkages between pre-adoption risk factors and post-adoption outcomes. Journal of Abnormal Child Psychology, 29:57–69).
25 For a review, see the Child Trends Databank indicator on “Reading to Young Children,” available online at: http://www.childtrendsdatabank.org/indicators/5ReadingtoYoungChildren.c….
26 For a review, see the National Center for Education Statistic’s article “Reading—Young Children’s Achievement and Classroom Experiences” available online at: http://nces.ed.gov/pubs2003/2003070.pdf
27 For a review, see the Child Trends Databank indicator on “Family Meals,” available online at: http://www.childtrendsdatabank.org/indicators/96FamilyMeals.cfm.
28 For a review, see the Child Trends Databank indicator on “After-School Activities,” available online at: http://www.childtrendsdatabank.org/indicators/86AfterSchoolActivities.c….
29 See Frosch, C. A., & Mangelsdorf, S. C. (2001). Marital behavior, parenting behavior, and multiple reports of preschoolers' behavior problems: Mediation or moderation? Developmental Psychology, 37, 502-519.
30 A small minority of children whose parents reported that they didn’t know they were adopted were excluded from this analysis. Overall, 3 percent of adopted children ages 5 and older do not know they are adopted.
31 See “Adoption Benefits Increased” at http://www.irs.gov/formspubs/article/0,,id=177982,00.html.
32 Kahan, M. 2006. “Put up” on platforms: A history of twentieth century adoption policy in the United States. Journal of Sociology and Social Welfare, 33(3): 51-72.
33 Ibid. See also Brodzinsky, D.M. 2005. Reconceptualizing openness in adoption: Implications for theory, research, and practice. Pp. 145-166 in Psychological Issues in Adoption (D.M. Brodzinsky and J. Palacios, eds.) Westport, CT: Greenwood Publishing Group.
34 As of 2008, this was true in 23 states. Child Welfare Information Gateway. 2005. Post adoption contact agreements between birth and adoptive families: Summary of state law. Available online at: http://www.childwelfare.gov/systemwide/laws_policies/statutes/cooperati….
35 For a more thorough description of post-adoption supports, see http://www.nacac.org/postadopt/postadopt.html.
36 Further information on the NSCH can be found in: Blumberg S.J., Foster E.B., Frasier A.M., et al. Design and Operation of the National Survey of Children’s Health, 2007. National Center for Health Statistics. Vital and Health Statistics, Series 1. Forthcoming. Available online at http://www.cdc.gov/nchs/about/major/slaits/nsch07.htm.
37 Federal officials and contractor staff consulted with the State Department’s Office of Children’s Issues during the development of the NSAP instrument to gain insight on the questions pertaining to international adoptions.
38 The NSAP was also administered as a follow-back to the 2005-06 National Survey of Children with Special Health Care Needs (NS-CSHCN). The present chartbook does not include results from the National Survey of Adoptive Parents of Children with Special Health Care Needs (NSAP-SN). Initial results based on the identification of adopted children in the NS-CSHCN are available in: Bramlett, M.D., and Radel, L.F. 2008. Adopted children with special health care needs: Characteristics, health, and health care by adoption type. ASPE Research Brief. Washington, DC: Office of the Assistant Secretary for Planning and Evaluation, Office of Human Services Policy – U.S. Department of Health and Human Services. Available online at http://aspe.hhs.gov/hsp/08/CSHCN/rb.shtml.
39 Further information on the NSAP can be found in: Bramlett MD, Foster EB, Frasier AM, et al. Forthcoming. Design and Operation of the National Survey of Adoptive Parents, 2007. National Center for Health Statistics. Vital and Health Statistics, Series 1.
40 Specifically, the overall NSAP response rate depended upon the resolution rate (i.e., the identification of sampled telephone numbers as being residential or non-residential), the age screener completion rate for determining eligibility for the NSCH, the NSCH interview completion rate, and the NSAP eligibility screener completion rate, in addition to the NSAP completion rate. For more details, see Bramlett et al., forthcoming.
41 The legal relinquishment of biological parents’ rights to their children, and the legal adoption of children by non-biological children, are two separate steps that must take place in sequence for an adoption to occur.
42 For a review, see Gibson, P.A., J. Nelson-Christinedaughter, H.D. Grotevant, and H-K. Kwon. 2005. The well-being of African American adolescents within formal and informal adoption arrangements. Adoption Quarterly, 9(1), 59-78.
43 For a review, see Kreider, 2003.
44 Kreider, 2003. The Census report notes that this estimate is likely to be an undercount of the number of step-children due to the manner in which the data were collected. Additionally, in the Census, families simply reported whether or not their child was a “stepson/stepdaughter” or without identifying whether or not the householder had adopted that stepchild.
45 The two samples of adopted children are not identical because, as noted above, some focal children who were identified as adopted in the NSCH had parents who did not participate in the NSAP interview.
46 In the public use version of the NSAP data, the 51 strata for the 50 states plus Washington, DC have been collapsed into ten categories in order to protect respondent confidentiality. The chartbook analyses of the NSAP sample use the original, un-collapsed state identifier as the PSU identifier. Analyses of the NSCH data presented in this chartbook also use the state as the PSU identifier. Although the state was used as the PSU identifier, reliable state-level estimates cannot be calculated from the NSAP sample due to small sample size by state.
Appendix tables
Table 1. Number and percentage distribution of children ages 0-17 by adoptive status; number and percentage distribution of adopted children1 ages 0-17 by various characteristics: United States, 2007