
Prepared by:
Barbara Dalberth, Deborah Gibbs, and Nancy Berkman
RTI International
RTI Project Number 07578.006
Prepared for:
Laura Radel
Office of the Assistant Secretary for Planning and Evaluation (ASPE)
U.S. Department of Health and Human Services
Introduction
Adoption subsidies are perhaps the single most powerful tool by which the child welfare system can encourage adoption and support adoptive families. Adoption and Foster Care Analysis and Reporting System (AFCARS) data indicate that 88 percent of children adopted from public welfare agencies in 2001 received subsidies (DHHS, 2003). Yet our understanding of the patterns of adoption subsidies is limited. Little is known about factors associated with the receipt and amount of subsidy at the time of adoption. Although some evidence suggests that subsidies are associated with greater adoption stability (Barth, 1993), the extent to which subsidy receipt and amount influence the number and timing of adoption finalization among children free for adoption is unknown.
The Adoption Assistance and Child Welfare Act (AACWA) was enacted in 1980 to ensure that families who want to adopt children with special needs could do so without reducing or exhausting their resources. Building on concepts implemented at the state level, AACWA created a federal adoption subsidy program that would entitle all families caring for children with special needs, who could not meet their needs, to obtain subsidy support. Federal expenditures for adoption subsidy expenditures have grown more than 2000 times in the last two decades, from less than $400,000 in fiscal year 1981 to $1.3 billion in fiscal year 2002, and are expected to approach $2.5 billion by FY 2008 (U.S. House of Representatives, 2004).
Researchers project that the rate of growth in the average monthly number of children under age 18 who have been adopted from foster care will exceed the rate of growth of the foster care population for at least the next two decades (Wulczyn & Hislop, 2002). Similarly, the Congressional Research Service projects that, within the Title IV-E Adoption Assistance Program, the adoption population nationwide will have exceeded the number of children in foster care by 2003 (Spar & Devere, 2001).
AFCARS data offer an opportunity to examine how states use adoption subsidies to help achieve goals of permanency and well-being for children. Of particular interest to this analysis are patterns of subsidy receipt, the role of federal support for adoption subsidies under Title IV-E, and the relationship between adoption subsidies and the number and timeliness of adoptions from foster care.
Background
In order to be eligible for federal matching (Title IV-E) subsidies (federal plus state funds), children must have been removed from families that would have met income criteria for the Aid for Families with Dependent Children (AFDC) program, and have special needs that would preclude their adoption without subsidies (U.S. House of Representatives, 2004). Each state defines their criteria for special needs within broad federal guidelines. Under Title IV-E adoption assistance, a portion of the subsidy payment is federally funded, with the remaining share subsidized with state and/or county dollars. The federal medical assistance percentage (FMAP), or Medicaid matching rate, is used to determine the federal share of maintenance payments. This rate is between 50 percent and 83 percent (Spar and Devere, 2001). States with low per capita income have higher matching rates while high per capita income states have lower matching rates. If the child does not meet Title IV-E criteria, then a state may use state and/or county funds to provide a subsidy.
Adoption subsidies, up to the amount of the maintenance payment the child would have received if in foster care, are eligible for federal matching funds; higher adoption subsidies can be paid using state and or county dollars. Most states offer deferred payment agreements, which allow families the option of negotiating a subsidy at a later date even if they do not need one at the time of adoption.
Studying adoption subsidies is complicated by the fact that jurisdictions vary widely in the assumptions that underlie the design of their subsidy programs. Some consider that subsidies should be set at a rate sufficient to provide general support for needed services. Others set subsidy amounts at a level that can only support the basic care for a child, unless there are time-limited requests for subsidy funds to address specific problems. According to a recent report from the North American Council on Adoptable Children (NACAC), analysis of NACAC's State Subsidy Profiles(1) found that the subsidy rate in four states slightly exceeded the USDA rate needed to raise a family in a low-income family. In three states, however, the typical state subsidy is just half the USDA estimate (Bower and Laws, 2002). These disparities may be offset to some extent by options for one-time payments or by use of augmented subsidies that supplement the typical rate.
Research Questions
The goal of the analyses is to describe patterns of subsidy receipt by adoptive families and to explore how receipt and amount of subsidy may be related to adoption outcomes. Specific questions of interest include:
- What are the characteristics of adoptive children and families that may affect subsidy patterns?
- Does receipt of adoption subsidy vary by children's characteristics or foster care experiences?
- Does the amount of adoption subsidy vary by children's characteristics or foster care experiences?
- To what extent do states vary in their practices regarding adoption subsidies?
- Do adoption subsidies affect the timing or likelihood of adoption?
Figure 1-1 shows possible relationships among individual and state-level factors that may influence subsidy receipt and amount, and how subsidies may in turn affect the likelihood and timing of adoption. In the absence of previous analyses in this area, these hypothesized relationships were identified through discussions with federal and state agency staff.
Figure 1-1. Hypothesized Influences on Subsidy Practices and Adoption Outcomes
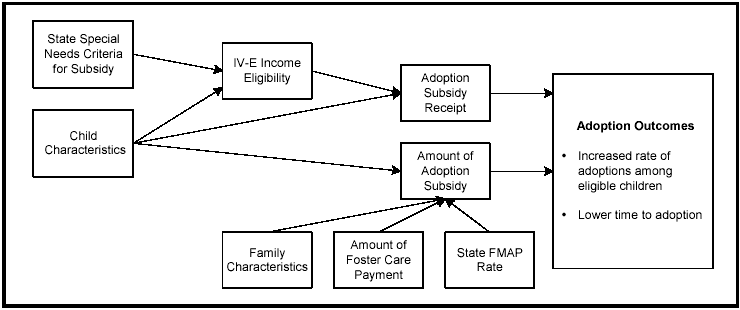
Reading from right to left, the model proposes that adoptions of foster children, and the timeliness of these adoptions, may be influenced by both the likelihood that the family will receive a subsidy and the amount of the subsidy. The most likely determinants of subsidy receipt are the characteristics of adopted children, including age, race/ethnicity, special needs and membership in sibling groups. In addition children who are eligible for federal support under Title IV-E, based on special needs and income, may be more likely to receive subsidies since federal support would decrease the cost of the subsidy to the state.
Subsidy amount is also influenced by the child's characteristics. In addition, states may also adjust subsidy amount (but not whether a subsidy is given) based on the circumstances of the adoptive parents. Since most foster children are adopted by foster parents, the amount of the adoption subsidy may be related to the level of support received by the foster parent prior to adoption. However, Title IV-E adoption subsidies cannot exceed the foster care payment amounts. Finally, states with higher FMAP rates may be able to offer higher subsidies than other states, since the federal share of the subsidy's cost will be greater.
Many of these relationships cannot be thoroughly assessed using AFCARS data, for two reasons. First the data elements included in the data set provide limited information about factors such as children's special needs and adoptive parent characteristics. In addition, the structure of the data set does not allow linking information about children's experiences in foster care (such as time in care) to information about their adoption (such as subsidy receipt and amount). However, the comprehensive nature of the data set, including all children adopted from foster care during the year, offers an important opportunity to describe national trends and variations among states with respect to adoption subsidies.
This project was funded by the U.S. Department of Health and Human Services (DHHS), Office of the Assistant Secretary for Planning and Evaluation. Research was conducted by RTI International.
AFCARS data used in this publication were made available by the National Data Archive on Child Abuse and Neglect, Cornell University, Ithaca, NY, and have been used with permission. AFCARS data were originally collected by the Children's Bureau. AFCARS is supported by the Children's Bureau, Administration on Children, Youth and Families, Administration for Children and Families, U.S. Department of Health and Human Services. The collector of the original data, the funder, the Archive, Cornell University and their agents or employees bear no responsibility for the analyses or interpretations presented here.
Methodology
Data Source
National data from the Adoption and Foster Care Analysis and Reporting System (AFCARS) provide child-level information on children in foster care and children adopted from foster care during a one year reporting period. Foster care and adoption data reside in two separate data files. No identifying information links these two sets of data, nor is there identifying information linking data from one year to another.
All 50 states, as well as Puerto Rico and the District of Columbia, submitted usable adoption and foster care data to AFCARS for each of the years (1999-2001) reported on in this report. States are required to report data on all children in out-of-home care for whom the state child welfare agency has the responsibility for placement, care, or supervision. The adoption data file contains one record for each child who was adopted during a reporting period; the foster care data file contains one record for each child who was in out-of-home care during the reporting period, including children who entered and exited care during this period. The majority of analyses were conducted using the adoption file, although selected analyses use 2001 foster care data in conjunction with the adoption data.
The following variables of interest are included in the adoption file:
- Child's characteristics (e.g., age, sex, race, ethnicity, special needs classification);
- Adoptive family's characteristics (e.g., family structure; preadoptive parent-child relationship; mother's age, race and ethnicity; father's age, race, and ethnicity);
- Subsidy data (e.g., source of subsidy, subsidy amount); and
- Case characteristics (e.g., months from termination of parental rights (TPR) to adoption, reporting state, reporting period).
The following variables of interest are included in the foster care file:
- Child's characteristics (e.g., age);
- Foster care payment and adoption subsidy data (e.g., source of subsidy, subsidy amount); and
- Case characteristics (e.g., date of most recent entry into out-of-home care, discharge reason and date, reporting state, reporting period).
AFCARS data are cross-sectional, meaning that they represent data at a single point in time. Cross-sectional adoption data provide a valuable snapshot of the children who were adopted during the reporting period while the foster care data provide a snapshot of children who were in out-of-home care during at least part of the reporting period.
The analysis population for the adoption file comprised children who were less than 18 years of age at the time of their adoption; the foster care analysis population comprised children who were less than 18 at the end of the reporting period.
While the AFCARS data elements are straightforward, the analysis took into account potential concerns regarding the reliability of specific variables. Appendix tables note items for which more than 10 percent of cases have missing or invalid data for the variable of interest. Additional steps to prepare the analysis files included identifying outliers for continuous variables that appear to be data errors and setting them to missing. For example, there were several cases where the monthly subsidy amount was reported as greater than $10,000. Although this amount may be valid for a small number of cases, the patterns we observed led us to believe that many of these were due to errors in the states' data reporting. Staff from DHHS assisted in identifying and resolving other issues that might obscure the interpretation of these data and suggesting, as much as possible, ways of using the data to narrow the range of interpretations.
These analyses use the most recent available AFCARS data set to describe patterns of adoption subsidy receipt and amount and compare these data with foster care data. Subsidy amounts in relation to child characteristics, adoptive parent characteristics, and adoption timeliness are described. Of particular interest are patterns of variation among states and factors that may explain these. We also describe patterns of subsidy receipt and amount for the three most recent years for which we have data (1999-2001). The analysis files excluded 57 children who resided in another country and were not a United States citizen prior to the adoptive placement. A small number of included cases were reported to be placed by an independent person or birth parent (146 cases in 2001), 90 cases were missing the placing entity information, and 904 were placed by a private agency. The analyses include both District of Columbia and Puerto Rico with the state-level data.
The analyses are conducted at two data levels:
- National data are summarized for most of the analyses.
- State-level data are presented in tabular form (i.e., listing of all states with their data).
Variables Used in Analyses
Variables were selected from the AFCARS files to address the goals and hypotheses described above. This section describes the creation and analysis of key variables.
Variables describing time to adoption should be interpreted with caution. These variables represent time to adoption for those children who have exited to adoption during the reporting year, but do not represent the experience of all children who will eventually be adopted. In particular, if the number of adoptions fluctuates from one year to the next (as seems to be the case in some states), these rates will be unstable. These estimates are used as comparisons among states rather than actual estimates of time to adoption, which would ideally be based on analysis of entry cohorts.
- Child's age.
- Children less than 18 years of age at time of adoption are included in the adoption population. Age at adoption was used for most of these analyses. Children less than 18 years of age as of the end of the reporting period were included in analyses using foster care data. We stratified most of the analysis results by three age groups (0 to 5, 6 to 12, and 13 to 17). These age groups were defined based on developmental stages and their similarities with respect to subsidy needs.
- Race/ethnicity.
- Multiple race designations could apply to each child, beginning with the FY 2000 data. The ethnicity variable was dichotomous: Hispanic and non-Hispanic. After initial analyses shown in Table 3-1, researchers consolidated race and ethnicity categories for simplicity and consistency with other analyses conducted by ACYF. The consolidated categories include white, non-Hispanic; African American, non-Hispanic; Hispanic; and other race/ethnicity. The other category includes non-Hispanic American Indians, Asians, Native Hawaiians, and children with more than one race designation. Researchers used race/ethnicity to describe the children adopted from out-of-home care and to stratify analysis of time from TPR to adoption and subsidy amounts received.
- Special needs criteria.
- Special needs status with respect to adoption subsidies defines characteristics that would make adoption difficult if a subsidy were not available. Categories broadly defined by the federal government, include race, age, sibling group, medical condition, and other. AFCARS allows only one factor to be assigned to an individual child for reporting purposes. Each state has the latitude to set their own criteria for classifying children as special needs children and to specify a priority for classifying children if they meet multiple criteria. Some caseworkers may report the special needs criteria that is the easiest to document. For these reasons and because states may specify more specific criteria for each special needs category using the other category, special needs data are not entirely comparable across states. Further specification of medical conditions include mental retardation, visually or hearing impaired, physically disabled, emotionally disturbed, and other diagnosed condition. The proportion of adopted children meeting special needs criteria is presented overall and by state and the relationship between time from TPR to adoption and special needs status was examined.
- Adoptive family characteristics.
- The family structure of the adoptive family (i.e., married couple, unmarried couple, single female, and single male) and the preadoptive parent-child relationship (i.e., foster parent, stepparent, other relative, and nonrelative) is presented. The adoptive mother and father's age and the proportion of children who are adopted by parents of a different race and ethnicity are displayed. These analyses are presented stratified by age.
- Time from TPR to adoption.
- If available, both the mother's and father's TPR data were reported in the AFCARS adoption file as well as the date the adoption was legalized. For these analyses, we designated the most recent of the two TPR dates to calculate the time from TPR to adoption. These analyses were stratified by child's age at TPR, race/ethnicity, and special needs status.
- Time from most recent entry to adoption.
- Because the adoption file does not include dates of entry into out-of-home care, we used data from the foster care file to calculate the most recent time in continuous care prior to adoption. This measure was used to describe the population, stratified by age and state.
- Proportion of children receiving adoption subsidies.
- The proportion of children adopted from public child welfare agencies who receive a monthly subsidy of any kind (i.e., federal or state) is presented at the national level and by state. Tables show the proportion of children receiving federal plus state subsidies, state-only subsidies, and no subsidies. The proportion of children who receive monthly payments and those with deferred agreements are presented. Although AFCARS does not include a field to explicitly indicate a deferred subsidy agreement is in place, we considered cases that were reported to be receiving a subsidy and the amount of subsidy was either $0 or $1 to have deferred payments for these analyses. Because only a small number of cases met this definition, it is likely that these analyses undercount the number of actual deferred agreements since some states may not distinguish between cases with deferred agreements and those without subsidies in AFCARS. In addition, the proportion of adoption subsidies with federal matching funds were compared across states. To examine trends in the federal plus state subsidy rate, data for the three most recent years were analyzed for each state and the percent change from year to year and from 1999 to 2001 is presented.
- Proportion of children receiving federal foster care payments.
- The proportion of children in nonrelative foster care placement (either current or most recent placement) receiving federal matching funds is calculated from the foster care data and compared to the equivalent adoption variable by state. Children in relative care were excluded from these analyses due to state variability in practices regarding foster care payments to relative caregivers.
- Adoption subsidy amounts.
- The median subsidy amount is presented for the past 3 years and by state. The state-level data were stratified by age, since foster care payments tend to increase with children's age in most states (likely due to their greater material and service needs) and we hypothesize a correlation between foster care payments and adoption subsidies. To examine trends in the average federal matching monthly subsidy amount, data for the three most recent years were analyzed for each state and the percent change from year to year and from 1999 to 2001 was calculated. Subsidy amounts greater than $10,000 per month were considered invalid data due to the likelihood of errors in the states' data for this field and were treated as missing values.
- Foster care payment amounts.
- Because the adoption data file does not include the amount the child received in foster care payments, we used the foster care data file to compare foster care payments to adoption subsidy amounts. For this analysis, we compared the subsidy amounts of all adopted children who were adopted by their foster family or by a nonrelative with the monthly payments for children in nonrelative foster care or pre-adoptive homes. Limiting the analysis to children who had been, or were currently placed, in nonrelative foster care excludes those children who were in a group care facility and might be receiving unusually high stipends and eliminates the likelihood that state variability in practices regarding relative caregivers will bias the results. Thus the analysis is reduced to the two groups of children who are most similar. These analyses are also presented for each state. Foster care payments greater than $10,000 were considered invalid data and were treated as missing values due to the likelihood that they were reported in error.
- Foster care adoption rate.
- Adoption rates are defined as the percentage of eligible children in out-of-home care who were adopted, derived from the foster care data file. Eligible children are defined as those who had a goal of adoption and/or had parental rights terminated, excluding those aged 16 and older with a goal of emancipation.
- Deferred subsidy payments.
- The proportion of adopted children with deferred subsidy payments are presented for each state. Deferred payments were defined as payments of $0 or $1 for cases where a subsidy was indicated.
Analysis Plan
The analyses in this report are descriptive, using tables and graphical representations of data to present results. Initial analyses presented in Section 3.1 describe the adopted child's demographic characteristics (gender, age, race, and ethnicity), time from TPR to adoption, and characteristics of the adoptive family (family structure, preadoptive parent-child relationship, mother's age, father's age, race/ethnicity differentials between child and parent). Section 3.2 presents analyses of special needs and the factors most commonly reported to satisfy the special needs criteria. Section 3.3 describes subsidy receipt rates, separately for federal plus state-funded and state only-funded subsidies and stratified by age group. Section 3.4 presents monthly subsidy amounts over the past 3 years, describes subsidy amounts by age and other factors to discern differences in amount received, and compares adoption subsidy amounts with foster care payment amounts.
Analyses in Section 3.5 use correlations among state-level measures to assess relationships among the practice and outcome measures identified in the model in Section 1-2. Finally, multivariate analyses described in Section 3.6 model the influence of child, adoptive family and state variables on subsidy receipt and subsidy amount.
To show the variation among states, many of the analyses presented in the report are also presented by state. State tabulations are shown in Tables A-1 through A-10 in Appendix A. States with high levels of missing or invalid data for specific variables are identified on each table.
Text discussion describes variation among states and patterns among the 10 states with the largest number of adoptions during FY 2001 (in order, California, Illinois, New York, Michigan, Texas, Ohio, Florida, Pennsylvania, North Carolina and Washington). Although the composition of this group varies slightly from one year to the next, these 10 states also had the largest number of adoptions across the FY 1999-2001 period. These states together account for more than 60 percent of adoptions nationally. According to CWLA, four states have a larger general population of children compared to Washington; two of these have a larger population compared to North Carolina (Child Welfare League of America, 2004). And although six states have a larger number of children in out-of-home care compared to Washington; Washington has a higher percentage of children in out-of-home care who were adopted compared to those six states. The number of children in out-of-home care in North Carolina was not reported on this Web site.
Findings
Characteristics of Adopted Children
Males comprised one-half of the 50,703 children under 18 years of age who were adopted in the 2001 reporting period (Table 3-1). Less than 2 percent were under one year, about 45 percent were between 1 and 5 years, 24 percent were between 6 and 8, 21 percent were between 9 and 12, and about 9 percent were older children, aged 13 to 17. These proportions have remained relatively steady from 1999 to 2001.
There was a marked increase over a 3-year period of the proportion of adopted children who were white (44 percent to 54 percent), an increase of 6,700 children. The number of adopted children who were African-American remained somewhat steady over the past 3 years, the number of American Indian/Alaskan Native children increased from 553 in 1999 to 1,177 in 2001, and the number of Asian/Pacific Islanders increased from 477 to 658. There was a slight increase in the number of adopted children who were Hispanic over the 3-year period (6,552 to 8,253). For the most recent reporting period, white children comprised 54 percent of the adopted children followed by African-Americans at 38 percent. American Indian/Alaskan Natives and Asian/Pacific Islanders, combined, comprised almost 4 percent of adopted children.
| 1999 | 2000 | 2001 | ||||
|---|---|---|---|---|---|---|
| n | % | N | % | n | % | |
| Number of adopted children | 46,391 | 50,472 | 50,703 | |||
| Gender | ||||||
| Female | 23,236 | 50.1 | 25,250 | 50.0 | 25,192 | 49.7 |
| Male | 23,149 | 49.9 | 25,216 | 50.0 | 25,501 | 50.3 |
| Age at adoption | ||||||
| <1 year | 833 | 1.8 | 921 | 1.8 | 1,018 | 2.0 |
| 1-5 years | 20,951 | 45.2 | 22,974 | 45.5 | 23,397 | 46.2 |
| 6-8 years | 10,969 | 23.6 | 11,383 | 22.6 | 10,864 | 21.4 |
| 9-12 years | 9,698 | 20.9 | 10,729 | 21.3 | 10,705 | 21.1 |
| 13-17 years | 3,940 | 8.5 | 4,465 | 8.9 | 4,719 | 9.3 |
| Race | ||||||
| White | 20,620 | 44.5 | 24,941 | 49.4 | 27,320 | 54.3 |
| African-American | 19,576 | 42.2 | 20,588 | 40.8 | 19,226 | 38.3 |
| American Indian/Alaskan Native | 553 | 1.2 | 926 | 1.8 | 1,177 | 2.4 |
| Asian/Pacific Islander | 477 | 1.0 | 602 | 1.2 | 658 | 1.3 |
| Unknown | 5,165 | 11.1 | 4,386 | 8.7 | 4,004 | 8.0 |
| Ethnicity | ||||||
| Hispanic | 6,552 | 14.2 | 7,184 | 14.2 | 8,253 | 16.3 |
| Non-Hispanic | 39,755 | 85.9 | 43,287 | 85.8 | 42,450 | 83.7 |
Notes:
Source: AFCARS 1999-2001, adoption data. |
||||||
Table 3-2 shows that while African-American children comprise only 15 percent of the population under 18 years of age, they represent a disproportionate number of children in foster care (39 percent). And while approximately the same number of white and African-American children were in foster care as of the end of the AFCARS 2001 reporting period, more African-American children were waiting for an adoptive home and fewer were adopted compared to white children. Hispanic children are the 2nd largest group, comprising nearly 16 percent of the population of children less than 18 years of age. Hispanic children represented 17 percent of the foster care population, 13 percent of those waiting for adoption and 16 percent who were adopted.
| Race/Ethnicity | General Population of Children |
Children in Foster Care |
Waiting Children |
Adopted Children |
|---|---|---|---|---|
| 2001 | 2001 | 2001 | 2001 | |
| White, non-Hispanic | 60.7 | 38.7 | 35.6 | 38.4 |
| African-American, non-Hispanic | 14.9 | 39.1 | 46.8 | 34.8 |
| Hispanic | 17.6 | 17.1 | 12.7 | 16.3 |
| Other | 6.9 | 5.1 | 4.9 | 5.3 |
Notes:
Sources: General Population of Children data: Table NA-EST2002-ASRO-03National Population EstimatesCharacteristics. Population Division, U.S. Census Bureau. Released June 18, 2003. Foster Care and Waiting Children data: http://www.acf.hhs.gov/programs/cb/publications/afcars/report8.htm; accessed September 10, 2004. Adopted Children data: AFCARS 2001, adoption data. |
||||
Table 3-3 shows the race and ethnicity variables combined to present the proportion of white non-Hispanics, African-American non-Hispanics, and Hispanics who were adopted, stratified by their age at the time of adoption. Children classified as American Indian, Asian, Native Hawaiians and those with more than one race designation are included in the other category. The proportion who were white was steady or increased with each successive age group (whites comprised 40 percent of adopted children less than 5 years old, 40 percent of children between 6 and 12 years of age, and 45 percent of those aged 13 to 17). In contrast, African-Americans comprised 35 percent of adopted children less than 5 years old, 39 percent of those aged 6 to 12, and 37 percent of those aged 13 to 17. An almost equal number of adopted children aged 6 to 12 years of age were white and African-American. The proportion of adopted children who were Hispanic was 18 percent for children less than 5 years of age and decreased by 2 percent for each of the successively higher age groups.
| Age at Adoption | Total | |||||||
|---|---|---|---|---|---|---|---|---|
| 0 to 5 Years | 6 to 12 Years | 13 to 17 Years | ||||||
| n | % | n | % | n | % | n | % | |
| Number of adopted children | 24,415 | 48.2 | 21,569 | 42.5 | 4,719 | 9.3 | 50,703 | 100.0 |
| Race/ethnicity | ||||||||
| White, Non-Hispanic | 9,330 | 40.4 | 8,136 | 39.7 | 2,002 | 44.8 | 19,468 | 38.4 |
| African-American, Non-Hispanic | 8,055 | 34.9 | 7,950 | 38.8 | 1,660 | 37.2 | 17,665 | 34.8 |
| Hispanic | 4,232 | 18.3 | 3,385 | 16.5 | 636 | 14.2 | 8,253 | 16.3 |
| Other | 1,468 | 6.4 | 1,038 | 5.1 | 168 | 3.8 | 2674 | 5.3 |
Notes:
Source: AFCARS 2001, adoption data. |
||||||||
Table 3-4 shows the number of months from TPR to legalized adoption stratified by the child's age at TPR, race/ethnicity, and special needs status. Children 6 to 12 years old comprise the second largest group of adopted children and generally wait longer from TPR to adoption compared to younger and older children. Generally, the youngest children have better prospects for quicker placements with an adoptive family; therefore, they experience shorter wait times until they are adopted. Because finding families for children over the age of 12 is often particularly challenging, some agencies delay TPR for these children until an adoptive family is identified (Gibbs et al., 2004). This practice would shorten the time from TPR to adoption for older children. TPR for children in out-of-home care for only a short time could indicate also that these children had been placed in care by abandoning parents (most likely for younger children), that this was not their first or second spell in care, or that the courts had acted expeditiously based on one of the aggravated circumstances, under which ASFA and states' laws allow child welfare agencies to forego reunification efforts and proceed to TPR, although there is little evidence that states routinely invoke this last option.
| Adopted Children | 25th Percentile | Median | 75th Percentile | 95th Percentile | |
|---|---|---|---|---|---|
| Total | 49,673 | 6.9 | 12.5 | 20.9 | 42.8 |
| Age at TPR | |||||
| 0-5 years | 29,705 | 6.5 | 11.6 | 19.7 | 40.3 |
| 6-12 years | 17,754 | 7.9 | 14.4 | 23.3 | 47.2 |
| 13-17 years | 2,214 | 5.3 | 10.4 | 17.7 | 32.2 |
| Race/ethnicity | |||||
| White, non-Hispanic | 19,186 | 6.3 | 11.2 | 18.7 | 37.8 |
| African-American, non-Hispanic | 17,194 | 7.3 | 13.9 | 23.7 | 47.9 |
| Hispanic | 8,105 | 7.2 | 12.6 | 20.5 | 37.5 |
| Other | 2,627 | 7.4 | 12.3 | 19.7 | 38.8 |
| Special needs | |||||
| No | 5,952 | 5.9 | 10.6 | 18.2 | 37.4 |
| Yes | 42,410 | 7.1 | 12.8 | 21.3 | 43.8 |
Notes:
Source: AFCARS 2001, adoption data. |
|||||
The median number of months from TPR to adoption is lowest for whites (11.2), slightly higher for Hispanics (12.6) and even higher for African-Americans (13.9). Most children in this population are classified as having special needs with respect to adoption, such as age, race or membership in a sibling group. These children wait slightly longer for adoption after their parental rights have been terminated compared to children without special needs (12.8 vs. 10.6 months, respectively). This delay is perhaps indicative of the challenge of finding families for these hard to place children, as well as negotiating financial agreements that cover needed services for these special needs children.
Examining the time from TPR to adoption only tells part of the story since the time from entry to TPR varies greatly among states. States with a short time from TPR to adoption may reflect a practice pattern in which parental rights are not terminated until an adoptive home is identified, after which TPR is executed and the child is adopted in a relatively short time period. However, these same children may have spent a prolonged amount of time in out-of-home care prior to TPR. AFCARS adoption data does not include the date of entry into out-of-home care. Therefore, to present the larger picture to show the time children spent in out-of-home care until adoption, we analyzed data from the foster care data file. This file includes information on entry and exit dates and the population is theoretically identical to the population in the adoption file.(2)
Table A-1 in the appendix presents the median months that children wait from their most recent entry into out-of-home care to the date their adoption was finalized, by age at adoption(3) for each state. The national median number of months from the most recent entry into out-of-home care was 38.1. The youngest children are adopted the most quickly (29.7 months for children less than 6), children aged 6 to 12 wait a median of about 20 months longer (49.3 months), and the oldest children wait about 10 months longer than those 6 to 12 (59.0 months).
Most states followed a similar pattern of older children waiting longer for adoption compared to their younger counterparts; however there was much variation in their ability to move children quickly to adoption. Among the largest states the median months in out-of-home care ranged from 23.9 (Texas) up to 59.2 (New York).
Characteristics of the child's adoptive family are presented in Table 3-5, stratified by the child's age at adoption. Two-thirds of these children were adopted by married couples. Among children less than 5 years of age, almost 72 percent were adopted by married couples. This proportion dropped with each successive age group to 62 percent for children aged 6 to 12 and 60 percent for children 13 to 17. Single females comprised the next largest proportion of adoptive parents (30 percent). Only one-quarter of younger children (aged 0 to 5) were adopted by single females, which increased to more than one-third of the older children adoptions (aged 13 to 17). Single males adopted just over 1,000 children (2 percent of all adoptions) while unmarried couples adopted 636 children (1 percent).
| Age at Adoption | Total | |||||||
|---|---|---|---|---|---|---|---|---|
| 0 to 5 | 6 to 12 | 13 to 17 | ||||||
| n | % | n | % | n | % | n | % | |
| Number of adopted children | 24,415 | 48.2 | 21,569 | 42.5 | 4,719 | 9.3 | 50,703 | 100.0 |
| Adoptive family structure | ||||||||
| Married couple | 16,289 | 71.7 | 12,041 | 62.4 | 2,446 | 59.8 | 30,776 | 66.8 |
| Unmarried couple | 354 | 1.6 | 245 | 1.3 | 37 | 0.9 | 636 | 1.4 |
| Single female | 5,794 | 25.5 | 6,460 | 33.5 | 1,405 | 34.3 | 13,659 | 29.6 |
| Single male | 275 | 1.2 | 546 | 2.8 | 205 | 5.0 | 1,026 | 2.2 |
| Total | 22,712 | 100.0 | 19,292 | 100.0 | 4,093 | 100.0 | 46,097 | 100.0 |
| Preadoptive parent-child relationship | ||||||||
| Foster parent | 13,730 | 56.3 | 10,534 | 48.9 | 2,237 | 47.4 | 26,501 | 52.3 |
| Stepparent | 57 | 0.2 | 47 | 0.2 | 13 | 0.3 | 117 | 0.2 |
| Other relative | 4,579 | 18.8 | 5,034 | 23.4 | 1,100 | 23.3 | 10,713 | 21.1 |
| Nonrelative | 3,847 | 15.8 | 3,248 | 15.1 | 655 | 13.9 | 7,750 | 15.3 |
| Adoptive mother's age | ||||||||
| 18-29 | 10,626 | 51.6 | 4,592 | 26.5 | 82 | 2.3 | 15,300 | 36.8 |
| 30-39 | 8,024 | 38.9 | 9,678 | 55.8 | 2,231 | 61.5 | 19,933 | 47.9 |
| 40 and over | 1,954 | 9.5 | 3,078 | 17.7 | 1,314 | 36.2 | 6,346 | 15.3 |
| Total | 20,604 | 100.0 | 17,348 | 100.0 | 3,627 | 100.0 | 41,579 | 100.0 |
| Adoptive father's age | ||||||||
| 18-29 | 5,309 | 34.1 | 1,750 | 13.1 | 32 | 1.2 | 7,091 | 22.3 |
| 30-39 | 6,058 | 38.9 | 6,850 | 51.2 | 1,083 | 39.2 | 13,991 | 44.1 |
| 40 and over | 4,225 | 27.1 | 4,784 | 35.7 | 1,646 | 59.6 | 10,655 | 33.6 |
| Total | 15,592 | 100.0 | 13,384 | 100.0 | 2,761 | 100.0 | 31,737 | 100.0 |
| Child same race/ethnicity as adoptive parents | ||||||||
| Yes | 14,483 | 91.3 | 11,710 | 93.9 | 2,595 | 96.0 | 28,788 | 92.8 |
| No | 1,378 | 8.7 | 758 | 6.1 | 107 | 4.0 | 2,243 | 7.2 |
| Total | 15,861 | 100.0 | 12,468 | 100.0 | 2,702 | 100.0 | 31,031 | 100.0 |
Notes:
Source: AFCARS 2001, adoption data. |
||||||||
Table 3-5 also shows the relationship between the child and the adoptive parent prior to the adoption. Slightly more than one-half (52 percent) of the children were adopted by a foster parent, 21 percent were adopted by a nonstepparent relative, 15 percent were adopted by a nonrelative, and the remaining were stepparent adoptions (less than 1 percent). The proportion of children less than 6 years old adopted by a foster parent was higher (56 percent) compared to the proportion adopted by foster parents among the oldest age group (47 percent). A higher proportion of older children aged 13 to 17 were adopted by relatives other than stepparents compared to the proportion of younger children (less than 6 years) adopted by these other relatives (23 percent and 19 percent, respectively).
Slightly fewer than one-half of the children were adopted by women aged 30 to 39, followed by 37 percent adopted by women aged 18 to 29 and 15 percent aged 40 and over. Generally, younger women tended to adopt younger children. Among children less than 6 years old, 56 percent of their adoptive mothers were less than 30 years old, while these younger women comprised only 2 percent of the women who adopted a child older than 12.
About 44 percent of children were adopted by men aged 30 to 39, 33 percent were adopted by men 40 and older, and 22 percent were adopted by men less than 30 years of age. While younger women (less than 30) comprised the highest proportion of women adopting children younger than 6; men between 30 and 39 comprised the highest proportion of men adopting the youngest children. Similar to the trend for mothers, the older men tended to adopt older children. Similar percentages of children aged 13 to 17 were adopted by women 30 to 30 and men 40 and over, likely reflecting the marriages of slightly older men to younger women.
We examined whether the child was the same race/ethnicity as at least one of his adoptive parents and found that overall, 93 percent of children were of the same race/ethnicity as at least one of his or her adoptive parents. Slightly fewer same race adoptions occurred among younger children (91 percent) compared to each of the successively older age groups (94 percent and 96 percent). The percentage of transracial adoptions reported here may be lower than that reported elsewhere due to differences in how this variable is calculated.
Special Needs Classification
Nearly 88 percent of adopted children were classified as having special needs with respect to adoption. The lowest proportion of children with special needs was found in the youngest age group; 84.5 percent among those less than 6 years of age. The 6 to 12 and 13 to 17 age groups had similar proportions (90.5 percent and 90.6 percent, respectively).
Table A-2 shows the proportion of children meeting the state's special needs criteria for each age group and for each state. Among the larger states the proportions of children with special needs ranged from a low of 55.1 percent (Pennsylvania) up to 99.9 percent in Ohio. These differences may be due to state policy and practice in how they define their criteria for special needs within federal guidelines.
To assess whether variation in the proportion of children classified as special needs is associated with state policy, we compared the proportion of children classified as special needs with a recent analysis of state special needs definitions (Bower and Laws, 2002). We hypothesized that states with stringent definitions would classify a smaller proportion of their children as special needs while states who defined special needs in broader terms would have higher proportions of children classified as special needs. The analysis classified states as having narrow, moderate or broad special needs definitions based on how categories are defined within federal guidelines and on the inclusion of additional categories such as children who have experienced prior adoptive disruptions.
This analysis found that the relationship between special needs definitions and the proportion of children classified as having special needs was not clear. The median percentage of children classified as special needs among states with narrow, moderate, and broad special needs definitions was 90, 90, and 94 percent, respectively. Both Pennsylvania and Ohio(4) were among the states with the broadest special needs definitions; however, these two states were at the lower and upper range, respectively, among large states with respect to the proportion of children with special needs.
Although AFCARS includes a field for the primary factor or condition that meets the special needs definition, states vary in how they apply criteria for determining which factor they report in AFCARS. For example, if a child meets multiple special needs criteria, some states prioritize the criteria and report the first one that applies while other states may not be as stringent.(5) Therefore, analysis of these data are not presented in this report.
Subsidy Receipt
Source of Subsidies
Table 3-6 shows that nearly all children adopted in FY 2001 received subsidy assistance (88.1 percent). The proportion of children less than 6 years old who received subsidies was slightly lower compared to the two older age groups (85.7 percent vs. 90.5 percent and 90 percent, respectively). The largest group of children were those receiving subsidies with federal matching funds (74.3 percent); 13.8 percent of children received state only-funded and 11.9 percent received no subsidy. Thus, 84 percent of children who received subsidies used Federal matching funds. As expected, the proportion of children in each age group receiving subsidies is similar to the proportion classified with special needs (shown in Table 3-4).
| Age at Adoption | Total | |||||||
|---|---|---|---|---|---|---|---|---|
| 0 to 5 | 6 to 12 | 13 to 17 | ||||||
| N | % | N | % | N | % | N | % | |
| Source of subsidy | ||||||||
| Federal + State | 17,518 | 71.9 | 16,537 | 76.9 | 3,508 | 74.6 | 37,563 | 74.3 |
| State | 3,343 | 13.7 | 2,923 | 13.6 | 724 | 15.4 | 6,990 | 13.8 |
| None | 3,489 | 14.3 | 2,054 | 9.5 | 469 | 10.0 | 6,012 | 11.9 |
| Total | 24,350 | 99.9 | 21,514 | 100.0 | 4,701 | 100.0 | 50,565 | 100.0 |
| Subsidy payments | ||||||||
| Receiving payments | 20,596 | 84.6 | 19,345 | 89.9 | 4,214 | 89.6 | 44,155 | 87.3 |
| Deferred payments | 265 | 1.1 | 115 | 0.5 | 18 | 0.4 | 398 | 0.8 |
| No subsidy | 3,489 | 14.3 | 2,054 | 9.5 | 469 | 10.0 | 6,012 | 11.9 |
| Total | 24,350 | 100.0 | 21,514 | 99.9 | 4,701 | 100.0 | 50,565 | 100.0 |
Note:
Source: AFCARS 2001, adoption data. |
||||||||
Families with deferred subsidy agreements have the option of negotiating payments in the future, should the child's needs or family's circumstances warrant a monetary subsidy. AFCARS data indicate that nationally, only 398 children have a deferred payment agreement according to our definition for these analyses (children identified as receiving a subsidy, with the subsidy amount equal to $0 or $1). Because AFCARS does not include a field to explicitly indicate deferred status, it is likely that this number represents an undercount of the actual number of cases with no subsidies may include children with deferred agreements. Table A-3 in the appendix shows that only four states reported that at least 5 percent of their children had deferred agreements, perhaps another indication that states differ in how or whether they report deferred agreements in ACFARS. Only one of these was a large state (Washington with 5.7 percent).
Table A-4 presents the proportion of adopted children receiving federal matching funds, state subsidies only, or no subsidies for each state. The percentage of subsidies with federal matching funds are presented in the last column. A wide range of proportions of children with subsidies was observed among states. At one end of the spectrum, Puerto Rico and Connecticut reported only 13.2 percent and 16.4 percent, respectively, of their children received any subsidies. At the other end, South Carolina reported that all of their adopted children receive subsidies; and 16 states reported that at least 95 percent of adopted children received subsidies.
The percent of subsidies that were matched with federal funds varied widely among states as well. Nine states reported less than 70 percent of subsidies provided were federally funded; these were all small states with fewer than 1,000 children receiving subsidies. Six states reported 100 percent of their subsidies were federally funded; five of these were smaller states.
Eight of the 10 largest states reported at least 90 percent of their children had subsidies; however, two large states reported rates of 64.2 percent and 72.6 percent (Florida and Texas, respectively). Among the 10 largest states, two (New York and Ohio) reported that at least 90 percent of their caseload receive subsidies with federal matching funds; Florida and Texas reported the lowest proportion of children receiving federal subsidies (56.6 percent and 55.6 percent, respectively).
Trends
Table A-5 presents the federal plus state subsidy receipt trends from 1999 to 2001 for each state. The total row at the bottom of the table shows that there is little change on a national level in federal subsidy receipt in the last 3 years for which data are available (1999 to 2001). At the state level, the table shows considerable instability, with substantial increases and decreases between years. Examining the data for just the 10 largest states, we observe that four of them showed at least a 20 percent change in the proportion of children receiving federal subsidies from 1999 to 2001. Three of these states reported an increase in the percent of children receiving subsidies (California, Florida, and Washington); one reported a decrease (Texas).
Comparison of Adoption Subsidy and Foster Care Payment Receipt
The relationship between foster care payments with federal matching funds and adoption subsidies with federal matching funds was examined to determine whether variations in the use of federal matching adoption subsidies were related to state variations in establishing children's IV-E eligibility at the time of entry to foster care. Table A-6 shows that 74.3 percent of adopted children receive subsidies while only 48.3 percent of children in nonrelative foster care placements receive payments with federal matching funds. Examination of state data shows us that only 11 states reported the proportion of adopted children with federally-supported subsidies was within 10 percent of the proportion of foster children with federal matching payments.
The remaining states varied widely in these two measures, as illustrated by the last column in the table, the ratio of foster care payments to adoption subsidies. At one extreme, Connecticut reported that their proportion of children receiving federal support for foster care payments was nine times higher that of the proportion of adopted children receiving federal plus state subsidies. Other states reported that the federal adoption subsidy rate was significantly higher compared to the federal foster care payment rate, e.g., Washington DC and Michigan. Data reported for Nevada and Texas also indicate that the proportion of adopted children receiving federal adoption subsidies is significantly higher compared to the proportion of foster care children in nonrelative care who receive foster care payments. However, these data should be interpreted with caution due to possible reporting errors. All of the ten largest states reported higher federal adoption subsidy rates compared to foster care payments. The following section compares the amount of subsidies and payments provided to adopted and foster care children.
Adoption Subsidy Amounts
Child Characteristics
The median subsidy amount for children adopted in 2001 was $444 a month (Table 3-7); a 10 percent increase from the median of $404 provided in 1999. At the same time, 33,655 children were adopted in 1999 and 39,135 children were adopted in 2001, a 16 percent increase.
| Monthly Subsidy Amount | |||
|---|---|---|---|
| 1999 ($) |
2000 ($) |
2001 ($) |
|
| Subsidy Amount | |||
| 25th Percentile | 359 | 364 | 384 |
| Median | 404 | 425 | 444 |
| 75th Percentile | 529 | 550 | 600 |
| 95th Percentile | 945 | 991 | 1,066 |
| N | 33,655 | 38,366 | 39,135 |
Note:
Source: AFCARS 1999-2001, adoption data. |
|||
Table 3-8 shows the relationship between child-related factors and subsidy amount received. As would be expected, adoption subsidies increase as children get older, presumably reflecting their greater need for services (also seen on Table A-7). Children less than 6 years old receive a median of $406 compared to $522 for children aged 13 to 17. Whites, African-Americans, and Hispanics had an identical median subsidy amount ($444), while children of other races received slightly higher subsidies ($469).
| Adopted Children | 25th Percentile ($) |
Median ($) |
75th Percentile ($) |
95th Percentile ($) |
|
|---|---|---|---|---|---|
| Child's age at adoption | |||||
| 0 to 5 years | 18,734 | 369 | 406 | 550 | 1,000 |
| 6 to 12 years | 16,857 | 387 | 471 | 650 | 1,090 |
| 13 to 17 years | 3,544 | 436 | 522 | 690 | 1,132 |
| Race/ethnicity | |||||
| White, non-Hispanic | 15,569 | 365 | 444 | 610 | 1,090 |
| African-American, non-Hispanic | 13,688 | 380 | 444 | 626 | 1,064 |
| Hispanic | 6,214 | 405 | 444 | 521 | 1,008 |
| Other | 2,260 | 365 | 469 | 600 | 1,099 |
| Preadoptive parent-child relationship | |||||
| Foster parent | 22,651 | 384 | 450 | 650 | 1,103 |
| Stepparent | 46 | 364 | 535 | 665 | 890 |
| Other relative | 9,371 | 393 | 441 | 535 | 877 |
| Nonrelative | 5,671 | 360 | 471 | 613 | 1,125 |
| Wait time (from TPR to adoption) | |||||
| < 6 months | 7,906 | 364 | 420 | 562 | 1,029 |
| 6 to 12 months | 10,519 | 384 | 441 | 591 | 1,024 |
| 12 to 18 months | 8,002 | 393 | 444 | 600 | 1,078 |
| > 18 months | 12,168 | 400 | 475 | 650 | 1,090 |
| Total | 39,135 | 384 | 444 | 600 | 1,066 |
Notes:
Source: AFCARS 2001, adoption data. |
|||||
Children in nonrelative foster homes received higher median subsidies compared to other preadoptive placements (excluding stepparent adoptions) a monthly median of $471 vs. $450 for foster parents and $441 for other relatives.
Children who waited longer from TPR to adoption (more than 18 months) received a higher median subsidy compared to children who were adopted more quickly after TPR.
Table A-7 in the appendix shows that median monthly adoption subsidy amounts vary substantially among states. Overall, median subsidies ranged from a low of $174 and $241 (Puerto Rico and Alabama, respectively) to a high of $856 (Iowa) and $741 (Washington, DC). Among the nine largest states,(6) median subsidy amounts ranged from $300 in Florida up to $591 in Michigan.
The national data shows subsidy amounts tend to increase for older children (see bottom row on A-7). We examined the nine largest states6 to determine whether this pattern was consistent on a state-level basis. All of these large states, with the exception of one, showed a similar pattern. Texas was the exception, which reported the same median subsidy amount for each of the three age groups. These findings are consistent with state policies that tend to have higher basic subsidy rates for older children (U.S. House of Representatives, 2004). Nevertheless, results should be interpreted with caution due to the differences in how states structure their subsidy payments (i.e., what is included in basic rates vs. special supplemental payments).
Trends Over Time
Table A-8 examines state-level trends in the median subsidy amount between 1999 and 2001 to assess whether the national increase seen in Table 3-7 occurred consistently across states.(7) Eight states reported the same median subsidy amounts for the past 3 years. Between 1999 and 2001, 26 states increased their mean subsidy amounts, with the amount of increases ranging from 3 percent up to 66.5 percent. Eight states showed decrease in their subsidy amounts, ranging from 1.1 percent to 27.2 percent and two reported no change from 2000 to 2001. Eight of the nine largest states(8) showed an increase in subsidy amounts from 1999 to 2001, ranging from 5.8 (North Carolina) to 27.7 percent increase in Florida. Washington reported such an insignificant change from 1999 to 2001 as to be considered no change in subsidy amount.
Comparison of Adoption Subsidy and Foster Care Payment Amounts
For adoption subsidies funded by Title IV-E, the subsidy amount is capped at the level of the foster care payment that a family would receive on behalf of a child. However, adoption subsidy rates that are set lower than foster care payments could represent a disincentive for foster families to adopt a child if foster parents are concerned about whether they could meet a child's needs after adoption. To assess whether this potential barrier exists, we compared the median adoption subsidy amounts with the median amount received by children in foster care on a national and state level.
This analysis uses data from the AFCARS foster care file (for foster care payments) and adoption file (for adoption subsidy amounts). Because individual children who exit foster care to adoption cannot be traced from one file to another, the population examined in each file was restricted in order to increase their comparability to the extent possible. Analysis of foster care data was limited to those in a pre-adoptive home or non-relative foster home. The analysis of adopted children includes only those who were adopted by a non-relative.
Table A-9 shows that nationally, the ratio of median adoption subsidies to median foster care payments was 0.8 (bottom row of table). However, when we examine these data for each state, the ratio of adoption amounts to foster care amounts varies widely among one-half the states. Twenty-one states show a difference greater than 10 percent between adoption and foster care median amounts. Fifteen of these states have a lower median adoption amount compared to foster care median; the lowest ration was 0.2 in Kansas. However, the foster care data in Kansas should be interpreted with caution due to possible errors in data reporting. Six states(9) showed higher median adoption amounts compared to foster care payments, with the highest ratio (1.3) seen in Arizona (median adoption subsidy was $479; foster care median was $358). This may reflect state supplementation of adoption subsidies beyond the level eligible for federal support, population differences between children in foster care and adopted children, or data quality issues. Patterns were consistent across age groups with few exceptions.
None of the eight largest states,(10) reported higher median adoption subsidies compared to median foster care payments; four reported the same or less than a 10 percent change in amounts, and four states reported lower median adoption subsidies compared to foster care payments.
A previous comparison of states' basic monthly adoption assistance rates and basic foster care rates found that 33 states allow adoption subsidy rates to be equal to or greater than their foster care rates (Bower and Laws, 2002). They reported that in twelve states monthly adoption subsidies were higher than monthly foster care payments, possibly due to the addition of county or state funds or the use of more recent adoption subsidy data in conjunction with older foster care data. These data do not reflect supplemental payments that may be made for children with higher levels of needs in either foster care or adoption.
Same-Year Adoption Rates and Time to Adoption
The model in Figure 1-1 hypothesizes that states with high subsidy rates and/or high median subsidy amounts will have a higher proportion of children in foster care exit to adoption. To examine this theory, we obtained a same year foster care adoption rate for each state, defined as the proportion of eligible children(11) who were adopted. We presented this adoption rate, the adoption subsidy rate, and the median monthly adoption subsidy in Table A-10, in the appendix.
The national adoption rate was 22 percent in 2001. Six of the nine largest states(12) reported a rate matching or exceeding the national average. Each reported that at least 90 percent of their cases received a subsidy and all but one reported a median subsidy close to or exceeding the national median. Of the three large states with adoption rates lower than the national average, one (Michigan) reported more than 90 percent of their cases receive subsidies (with a median exceeding the national median); one state reported a subsidy rate of 64.2 percent (Florida) with a median subsidy below the national median and the third state reported an adoption rate just below the national average, a subsidy rate of 72.6 percent, and a higher median subsidy amount compared to the national median (Texas).
State Subsidy Practices and Adoption Outcomes
Pearson correlation coefficients were used to further examine the relationships among state-level variables representing subsidy practices and adoption outcomes, as shown in Table 3-9. The table shows significant correlations between the percent of children who received an adoption subsidy and the rate of adoptions among eligible children. The percent of children receiving any subsidy was, in turn, significantly correlated with the percent of children for whom a federal IV-E subsidy was used. This suggests that adoption assistance under Title IV-E expands states' ability to offer adoption subsidies, rather than substituting for subsidies that would otherwise be supported by state funds. Since special needs status is a prerequisite for federal adoption assistance, it is not surprising that both receipt of federal subsidy and receipt of any subsidy (federal or state only funded) were significantly correlated with the percentage of children who are classified as special needs.
| NACAC Special Needs Category | % Classified as Special Needs | % Federal Foster Care Payment | FMAP | % Federal Adoption Subsidy | % Any Adoption Subsidy | Median Adoption Subsidy | Foster Care Adoption Rate | Median Months MRE to Adoption | |
|---|---|---|---|---|---|---|---|---|---|
| NACAC special needs category | 1 | -.052 | .323* | -.117 | .277* | .130 | .233 | .189 | .123 |
| % classified as special needs | -.052 | 1 | -.209 | .123 | .563** | .468** | -.039 | .071 | -.031 |
| % federal foster care payment | .323* | -.209 | 1 | .033 | .212 | .025 | .071 | .390** | .094 |
| FMAP | -.117 | .123 | .033 | 1 | -.051 | -.142 | -.152 | .243 | -.219 |
| % federal adoption subsidy | .277* | .563** | .212 | -.051 | 1 | .750** | .221 | .223 | -.011 |
| % any adoption subsidy | .130 | .468** | .025 | -.142 | .750** | 1 | .199 | .282* | -.127 |
| Median adoption subsidy | .233 | -.039 | .071 | -.152 | .221 | .199 | 1 | .004 | .111 |
| Foster care adoption rate | .189 | .071 | .390** | .243 | .223 | .282* | .004 | 1 | -.435** |
| Median months MRE to adoption | .123 | -.031 | .094 | -.219 | -.011 | -.127 | .111 | -.435** | 1 |
| * Significant at the 0.05 level. ** Significant at the 0.01 level. NACAC = North American Council on Adoptable Children Source: AFCARS 2001, adoption data. | |||||||||
Other than the correlation between adoption subsidies and adoptions of eligible children, few of the hypothesized relationships shown in Figure 1-1 could be supported by analysis of state-level variables. No significant correlation was found between the percentage of children receiving adoption subsidy and the median time from most recent entry to foster care and adoption. The median amount of adoption subsidy was not correlated to either the rate of adoption or median time to adoption. Several other hypothesized relationships described in Section 1.2 were not found to be significant, including the relationship between either the percentage of foster children eligible for IV-E foster care support or state FMAP rates and the percentage of children receiving federal plus state adoption subsidies.
Figure 3-1 shows the model from Section 1, with significant correlations indicated by a heavier line. Since the relationships between special needs status, IV-E eligibility and subsidy receipt are as expected, the most interesting correlation is that between the percentage of children receiving an adoption subsidy and the foster care adoption rate (proportion of eligible children adopted).
Figure 3-1.
Correlations Between Subsidy Practices and Adoption Outcomes(a)
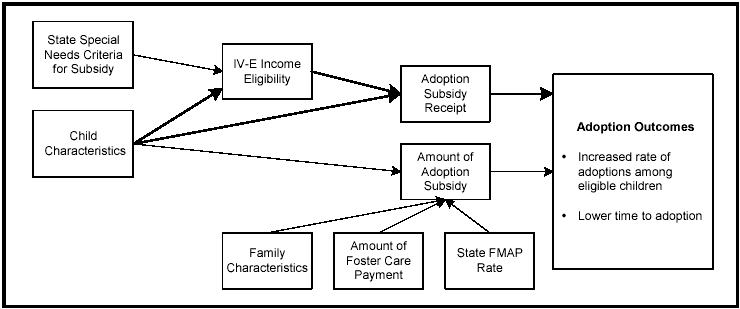
(a) Heavy lines indicate correlations significant at the 0.05 or 0.01 levels.
Multivariate Analyses of Subsidy Receipt and Amount
Multivariate analyses used AFCARS data to answer the following two research questions:
- What individual- and state-level characteristics are associated with whether a child receives an adoption subsidy?
- Among those children who received a subsidy, what individual- and state-level characteristics are associated with the amount of their subsidy?
The first question was addressed with a logistic regression analysis, since the outcome is a 0/1 binary variable indicating whether children adopted in FY 2001 received a subsidy. To answer the second question, analysts used multiple regression analysis, because the amount of the subsidy is a continuous variable ranging from $1 to $8,000 (the highest subsidy value) monthly. If the factors that determine subsidy receipt are different from those that determine subsidy amount, then the estimation requires a two-stage structural equation model. However, a two-stage model requires an explanatory variable in the first-stage equation that is not a predictor in the second stage. Since no such variable was identified, two separate equations were used. Because this approach may cause our estimation to be less efficient, explanatory variables that would have been statistically significant may not appear to be so.
Nearly all children in the 2001 adoption file (88 percent) received a subsidy. The sample size used to answer the first research question was 25,744. The sample size used to answer the second research question, including only those children who received a subsidy, was 22,150. Explanatory variables are considered statistically significantly at the p < 0.05 level of significance or better. Due to limitations in the data in four states (Mississippi, Nevada, New York, and West Virginia), the analyses were limited to children in the remaining 46 states, the District of Columbia, and Puerto Rico.
The equations used to answer both research questions contain the same explanatory variables and were modeled in two ways. All equations include individual level descriptive variables. In the first estimation (Models 1A and 2A, Table 3-10), two state-level descriptive variables are also included in the model. In the second estimation (Models 1B and 2B, Table 3-11), the state-level variables are replaced by dummy variables representing each of the states included in the study. Using two sets of estimations allows comparison of how variations in outcomes are explained by identified factors on the state level, as well as unexplained variations between states.
| Model Parameter | Model 1A Estimate | Model 1B Estimate |
|---|---|---|
| Intercept | -1.0295* | -1.982 |
| Age | ||
| Age at adoption | 0.0701* | 0.0753* |
| Child's race/ethnicity | ||
| Non-Hispanic black | 0.0832 | 0.3927 |
| Hispanic | -0.3897* | -0.00958 |
| Non-Hispanic other | -0.3306 | -0.3756 |
| Adoptive mother's race/ethnicity | ||
| Non-Hispanic black | -0.1914 | -0.38 |
| Hispanic | -0.3623* | 0.0381 |
| Non-Hispanic other | 0.3561 | 0.3092 |
| Pre-adoptive relationship | ||
| Other relative | -0.1752* | -0.1161 |
| Nonrelative | -0.8284* | -0.6668* |
| IV-E adoption subsidy | ||
| IV-E eligible | 6.5674* | 7.2434* |
| Special needs | ||
| Special needs eligible | 1.2482* | 1.915* |
| Sex | ||
| Male | 0.0103 | -0.0156 |
| Adoptive family's structure | ||
| Unmarried couple | 0.0711 | -0.079 |
| Single family | 0.1943* | 0.0508 |
| Single male | 0.1797 | -1.3859 |
| Not applicable | -1.4062* | -1.5295* |
| Time to adoption | ||
| Median time for all children | 0.00682* | |
| Federal support | ||
| Percentage of adoption subsidy from feds | 0.00104 | |
| State | ||
| Alabama | 0.1509 | |
| Alaska | 1.4291* | |
| Arizona | 0.4428 | |
| Arkansas | 0.7793* | |
| Colorado | 1.4611* | |
| Connecticut | -0.7861* | |
| Delaware | 2.5846* | |
| DC | -1.4457* | |
| Florida | -1.3263* | |
| Georgia | -0.6851* | |
| Hawaii | 0.3058 | |
| Idaho | -0.3363 | |
| Illinois | 1.292* | |
| Indiana | -2.5103* | |
| Iowa | 0.5924* | |
| Kansas | -0.8961* | |
| Kentucky | 0.1423 | |
| Louisiana | 1.4243* | |
| Maine | 2.1589* | |
| Maryland | 1.9432* | |
| Massachusetts | 1.0468* | |
| Michigan | 2.9676* | |
| Minnesota | 3.5642* | |
| Missouri | 2.7189* | |
| Montana | 1.5048* | |
| Nebraska | -0.8909 | |
| New Hampshire | -2.8706* | |
| New Jersey | -0.541* | |
| New Mexico | -2.8915* | |
| North Carolina | 1.2882* | |
| North Dakota | 0.0171 | |
| Ohio | -2.018* | |
| Oklahoma | 2.1246* | |
| Oregon | 1.8321* | |
| Pennsylvania | 0.1575 | |
| Rhode Island | 16.319 | |
| South Carolina | 15.7532 | |
| South Dakota | -2.3432* | |
| Tennessee | 0.5924* | |
| Texas | -0.4756* | |
| Utah | 0.3707* | |
| Vermont | -2.9594* | |
| Virginia | 1.8423* | |
| Washington | 0.6067* | |
| Wisconsin | 1.0289* | |
| Wyoming | -0.5633 | |
| Puerto Rico | -2.6785* | |
| Notes: Omitted categories include: child's race non-Hispanic white, mother's race non-Hispanic white foster care, not IV-E eligible, child not designated as special needs, female, adopted by married couple, state California. Excluded are children in Mississippi, Nevada, New York, and West Virginia. * P < 0.05. | ||
| Model Parameter | Model 2A Estimate | Model 2B Estimate |
|---|---|---|
| Intercept | 762.46547* | 520.29808* |
| Age | ||
| Age at adoption | 11.8756* | 12.51003* |
| Child's race/ethnicity | ||
| Non-Hispanic black | 48.06609 | 43.94241 |
| Hispanic | 13.88608 | 2.74035 |
| Non-Hispanic other | 16.19326 | -12.54596 |
| Adoptive mother's race/ethnicity | ||
| Non-Hispanic black | -2.05671 | 7.64712 |
| Hispanic | -50.45312* | -45.00671* |
| Non-Hispanic other | 15.68435 | -2.98261 |
| Pre-adoptive relationship | ||
| Other relative | -77.95191* | -93.32551* |
| Nonrelative | 13.20397 | -8.16719 |
| IV-E adoption subsidy | ||
| IV-E eligible | 41.51744* | 9.60062 |
| Special needs | ||
| Special needs eligible | -45.84947* | 5.48014 |
| Sex | ||
| Male | 10.15852* | 11.52742* |
| Adoptive family's structure | ||
| Unmarried couple | 50.64906* | 35.06718* |
| Single family | 41.10579* | 36.24887* |
| Single male | -73.1697 | -58.86626 |
| Not applicable | 44.61036 | -10.18483 |
| Time to adoption | ||
| Median time for all children | 2.00327* | |
| Federal support | ||
| Percentage of adoption subsidy from feds | -5.70384* | |
| State | ||
| Alabama | -386.34067* | |
| Alaska | 203.86941* | |
| Arizona | -73.23307* | |
| Arkansas | -188.1449* | |
| Colorado | 97.38257* | |
| Connecticut | 96.81203 | |
| Delaware | -142.28779* | |
| DC | 174.94671 | |
| Florida | -247.15927* | |
| Georgia | -147.25584* | |
| Hawaii | 39.976 | |
| Idaho | -223.80525* | |
| Illinois | -72.79573* | |
| Indiana | -358.86858* | |
| Iowa | 211.99399* | |
| Kansas | -303.17903* | |
| Kentucky | 38.32826 | |
| Louisiana | -283.45032* | |
| Maine | 204.5706* | |
| Maryland | -35.95179 | |
| Massachusetts | -153.63138* | |
| Michigan | 72.3233* | |
| Minnesota | -103.27779* | |
| Missouri | -278.2044* | |
| Montana | -203.80688* | |
| Nebraska | 189.72853 | |
| New Hampshire | -104.92855* | |
| New Jersey | -104.32314* | |
| New Mexico | -90.2626* | |
| North Carolina | -233.72761* | |
| North Dakota | -123.99448* | |
| Ohio | -58.95866* | |
| Oklahoma | -208.0152* | |
| Oregon | -95.73414* | |
| Pennsylvania | -156.93086* | |
| Rhode Island | -56.29293* | |
| South Carolina | -182.92044* | |
| South Dakota | -200.65931* | |
| Tennessee | -175.51452* | |
| Texas | -80.06179* | |
| Utah | -308.08123* | |
| Vermont | 66.61544* | |
| Virginia | -244.81333* | |
| Washington | 68.5187* | |
| Wisconsin | 271.1299* | |
| Wyoming | -228.97941* | |
| Puerto Rico | -386.30636* | |
| Notes: Omitted categories include child's race non-Hispanic white, mother's race non-Hispanic white, foster care, not IV-E eligible, child not designated as special needs, female, adopted by married couple, state California. Excluded are children in Mississippi, Nevada, New York, and West Virginia. * P < 0.05. | ||
The explanatory variables included in all models describing the child are
- age at adoption (0 to 17.99 years of age);
- race/ethnicity categorized as non-Hispanic white, non-Hispanic African American, Hispanic, and other;
- sex;
- preadoptive relationship between the child and adopting parents, categorized as foster care, other (nonparental) relative or nonrelative (other than foster parents);
- special needs status with respect to eligibility for IV-E adoption assistance (yes/no);
- IV-E adoption assistance claimed for adoption subsidy (yes/no);
- adopting mother's race/ethnicity, categorized as non-Hispanic white, non-Hispanic African American, Hispanic, and other; and
- adopting family's structure categorized as married couple, unmarried couple, single female, single male, and not applicable.
The state-level explanatory variables included in Models 1A and 2A are as follows:
- Median time from the most recent foster care entry to adoption, including all children in the AFCARS foster care file who exited foster care to adoption in FY 2001. While these should be the same children who were adopted during FY 2001, it is not possible to link individual entries in the foster care and adoption files. Because this information is not available for individual children in the adoption file, the state-level aggregate is used in the model.
- Federal share of subsidies for children receiving adoption assistance under Title IV-E, the Federal Medicaid Assistance Percentage (FMAP) for FY2001 (DHHS, 2000).
Subsidy Receipt
In predicting whether a child received a subsidy in our model containing state-level explanatory variables (Model 1A), several factors were associated with increased likelihood of receiving a subsidy. Age was a significant factor: the older the child, the more likely he or she was to receive an adoption subsidy. The probability of receiving a subsidy was also greater for a child who was IV-E eligible, designated as special needs, or adopted by a single woman rather than a married couple. Children in states with longer mean times in foster care prior to adoption were more likely to receive subsidies.
In contrast, Hispanic children, and children who were adopted by Hispanic mothers (rather than white non-Hispanic mothers) were less likely to have received a subsidy. A child adopted by a relative or a non-relative who was not a foster parent was less likely to receive a subsidy than a child adopted by foster parents. The percentage of the subsidy provided by the federal government was not a significant determinant of subsidy receipt.
The second specification estimated whether a child received a subsidy, controlling for state variation by including a dummy variable representing each state (Model 1B). As in Model 1A, the child's age, IV-E eligibility, and special needs status were all positively and significantly related to subsidy receipt, while adoption by a non-relative (other than a foster parent) was negatively associated. However, in this specification, a child's and a mother's ethnicity, and the adoptive family's structure (other than it being unknown) were no longer significant determinants of whether a child received a subsidy. There were significant differences associated with state, compared to being from California (our comparison state). Significant positive or negative differences were found for 36 of 48 jurisdictions (46 states, District of Columbia, and Puerto Rico). State practice is clearly a major determinant of subsidy receipt.
The difference between Models 1A and 1B suggests that some of the distinctions seen in Model 1A (an apparent disadvantage for Hispanic children and Hispanic adoptive mothers, and a greater likelihood of subsidy receipt for single female adoptive mothers) may be an artifact of demographics and adoptive family characteristics in some states. Even after controlling for variations among states, age, IV-E eligibility, and special needs status are significantly associated with subsidy receipt. The latter two associations are unremarkable, since both IV-E eligibility and special needs status are required for federal adoption assistance. Although states are not bound by these requirements when determining state-funded subsidies, 74 percent of all subsidies for FY 2001 included federal funds, as seen in Table 3-6.
Subsidy Amount
In the first model of subsidy amount, which includes state-level variables (Model 2A), subsidy amount was positively related to the age of the child; the older the child, the larger the subsidy. Increased subsidies were also associated with being IV-E eligible, being male, and being adopted by non-relatives rather than by foster parents. The structure of the adopting family was also a significant factor; being adopted by an unmarried couple or a single female compared to a married couple was significantly related to the child's receiving a larger subsidy.
While the child's race/ethnicity was not a significant factor, being adopted by a Hispanic mother compared to a non-Hispanic white mother was significantly related to receiving a smaller subsidy. Children adopted by single females (but not by single males) received higher subsidies than those adopted by married couples, as did children adopted by unmarried couples. The latter category represents just over 1 percent of adoptions. Children adopted by relatives received smaller subsidies than those placed with foster parents, as did children with special needs.
The two state-level variables included in the model were significant predictors of subsidy amount. Children in states where the mean time in foster care prior to adoption was higher received higher subsidies. Children in states with higher FMAP rates, where the proportion of the subsidy paid with federal funds for IV-E eligible children is higher, had lower predicted subsidies. Since FMAP is inversely related to per capita income in the state, this finding indicates that less wealthy states offer lower subsidies, even with augmented federal support.
For Model 2B, which predicts the amount of the subsidy while controlling for state variation with the use of state dummy variables, most results were similar. However, subsidy amount was no longer significantly related to IV-E eligibility or special needs status. Significant positive or negative differences were found for 42 of the 48 dummy variables representing jurisdiction, indicating that unmeasured state-level factors also played an important role in the amount of the subsidy.
The differences between Models 2A and 2B suggest that the apparent disadvantage for children with special needs, seen in Model 2A, may reflect variations in the extent to which states classify children as having special needs. Table A-2 shows that the proportion of children classified as having special needs ranges from less than 50 percent to 100 percent.
Discussion
The multivariate models confirm the importance of state-level practice variations in determining both subsidy receipt and amount. These differences persist even after controlling for variations in the characteristics of adopted children and adoptive families. Children in states where the time to adoption was longer were more likely to receive subsidies, and to receive higher subsidies. Children in states with higher federal matching rates received lower subsidies.
Even after controlling for state-practice variations, several child characteristics were associated with subsidy decisions. Based on odds ratios calculated from logit results, each additional year of age increases the odds of a child receiving a subsidy by 7.8 percent. Among children who received a subsidy, each additional year of age was related to an increase of $12.53 per month. Adopted boys are no more likely to receive a subsidy than adopted girls, but among children receiving a subsidy, boys receive slightly higher subsidies. Child race and ethnicity were not significant determinants of subsidy receipt or amount.
Characteristics of adoptive families also influenced subsidies. After controlling for state-level variation, neither race nor ethnicity was associated with subsidy receipt; however, among children receiving subsidies, those adopted by Hispanic mothers received, on average $45 less than did children adopted by white, non-Hispanic mothers. Children adopted by non-relatives (other than foster parents) were less likely to receive subsidies. Children adopted from foster care by relatives received subsidies that were, on average, $93 per month less than those adopted by foster parents. Children adopted by single females received higher subsidies than those adopted by married couples. While the latter finding could be based on greater material needs within single-parent families, other associations between family characteristics and subsidies suggest the impact of variations among adoptive parents in their ability to advocate for subsidies. In particular, the lower subsidy amount for children adopted by relatives would seem to be at odds with the current goal of encouraging such adoptions.
Summary and Conclusions
Subsidies have become an essential tool in moving children to permanent homes and supporting adoptive families. At the national level, subsidy practice shows some clear patterns in relation to characteristics of adopted children and adoptive families. However, the variations among states are equally striking. Although some extreme values may result from incomplete data provided to the AFCARS system, the state-level tables in the Appendix suggest divergent practice among states in most aspects of adoption subsidy practice. The following key findings represent both national patterns and variations among states:
- Nearly all children adopted from foster care in recent years received an adoption subsidy. Nationally, 88 percent of children adopted in FY 2001 received an adoption subsidy. However, practice varied widely among states, with subsidy receipt ranging from 13 percent to 100 percent. Nearly all adopted children (88 percent) were identified as having special needs that would prevent adoption without financial assistance.
- Nationally, the median monthly adoption subsidy was $444 per month. This figure represents a 10-percent increase between FY 1999 and FY 2001. Across states, median subsidy varied widely_from $171 to $876 monthly. Although states have the option of offering deferred payment agreements, which allow families the option of negotiating a subsidy at a later date even if they do not need one at the time of adoption, this arrangement is not explicitly identified by AFCARS data. Fewer than 1 percent of adopted children were shown as having an adoption assistance agreement and receiving a subsidy of $0 or $1.
- Federal adoption assistance through Title IV-E is widely used, representing 84 percent of all adoption subsidies nationally. Analysis of aggregate data found that states that identified larger percentages of children as IV-E eligible provided subsidies to more children. Multivariate analyses found associations between IV-E eligibility and both subsidy receipt and amount. States with higher levels of federal matching (FMAP) for IV-E adoption assistance offered lower subsidy amounts, suggesting that even augmented federal support does not offset limited financial resources within these states.
- Children's age and special needs status influenced subsidy receipt and amount. Older children were more likely to receive subsidies, and to receive larger subsidies. Race and ethnicity did not influence subsidies, after controlling for state-level variation. Although sex was not associated with subsidy receipt, among children who received a subsidy, boys received slightly higher subsidies than did girls.
- Pre-adoptive relationship and other characteristics of adoptive families influenced children's subsidies. Children adopted by foster parents who represent more than half of all adoptions were more likely to receive subsidies than others. They also received higher subsidies than children adopted by relatives. Children adopted by Hispanic mothers received lower subsidies than those whose adoptive mothers were non-Hispanic whites. Children adopted by single females received higher subsidies than those adopted by married couples. These findings suggest the influence of both family needs and adoptive parents' ability to advocate on subsidy decisions.
- Analyses found some support for associations between subsidies and adoption outcomes. Analysis of state-level aggregate data show a significant positive correlation between the percentage of adopted children who receive a subsidy and the percent of eligible children who are adopted. Multivariate analysis found that children living in states where the median time to adoption was longer were more likely to receive subsidies, and received higher subsidies. Possibly states are using subsidies strategically to address the backlog of waiting children in foster care and meet their adoption goals.
The limitations of the AFCARS data set suggest that more compelling analyses may be found within state administrative databases, with greater opportunities to compare children's foster care and adoption experiences. However, the comprehensive scope of AFCARS supports analyses that provide an overview of how subsidies are used to support permanency for children who might otherwise remain in foster care, as well as the diversity of practice among states.
References
Barth, R.P. (1993). Fiscal Issues in Special Needs Adoption. Public Welfare 41(4):7-11.
Bower, J.W., and R. Laws (2002). Forever Families: Support for Families of Children with Special Needs: A Policy Analysis of Adoption Subsidy Programs in the United States. North American Council on Adoptable Children.
Child Welfare League of America (2004). Data from the National Data Analysis System. <http://ndas.cwla.org>. As obtained on August 20, 2004.
Gibbs, D., B. Dalberth, S. Hawkins, S. Harris, R. Barth, and J. Wildfire (2004). Termination of Parental Rights for Older Foster Children: Exploring Practice and Policy Issues. Report prepared for the Office of Planning, Research and Evaluation, Children's Bureau, Administration for Children, Youth and Families, U.S. Department of Health and Human Services. Research Triangle Park, NC: RTI International.
Spar, K., and C. Devere (2001). Child Welfare Financing: Issues and Options. Congressional Research Service.
U.S. Census Bureau, Population Division. June 18, 2003. Table NA-EST2002-ASRO-03National Population EstimatesCharacteristics. <http://www.census.gov/popest/archives/2000s/vintage_2002/files/NA-EST2002-ASRO-03.csv>.
U.S. Department of Health and Human Services (2000). Federal Financial Participation in State Assistance Expenditures for October 1, 2000 through September 30, 2001. <http://aspe.hhs.gov/health/fmap01.htm>. As obtained on January 15, 2004.
U.S. Department of Health and Human Services (2003). AFCARS Report. <http://www.acf.hhs.gov/programs/cb/publications/afcars/report8.htm>. As obtained on June 2, 2004.
Wulczyn, F.H., and K.B. Hislop (2002). Issue Papers on Foster Care and Adoption: Growth in the Adoption Population. Chicago: Chapin Hall Center for Children at the University of Chicago.
Endnotes
1. State subsidy profiles include the maximum basic adoption assistance payments for each state as provided by state administrators to NACAC.
2. Discrepancies in data between the adoption file and the foster file that was restricted to children discharged to adoption are likely due to some states' practice of underreporting foster care discharges and more accurately reporting adoption data, which is used to calculate adoption incentive awards.
3. Analysis based on age at entry into care may produce different results.
4. Ohio is noted as a model program based on its inclusion of four categories beyond the Federal required ones.
5. For example, Florida reports the first of the following criteria that applies: disability, race, age, other.
6. Excluding New York which was missing subsidy amounts for all their cases.
7. Eight states had more than 30 percent of their data missing; therefore these states are omitted from this discussion.
8. Excluding New York, which was missing subsidy amounts for all their cases.
9. Including Nebraska with adoption data based on only five children who were reported to have been adopted by their foster family.
10. Excluding New York which was missing subsidy amounts for all their cases and Washington, which reported $0 or $1 payment amounts for foster care children eligible for this analysis.
11. Eligible children were defined as those who had a goal of adoption and/or had parental rights terminated, excluding those aged 16 and older with a goal of emancipation.
12. Excluding New York which was missing subsidy amounts for all their cases.
To obtain a printed copy of this report, send the title and your mailing information to:
Human Services Policy, Room 404EAssistant Secretary for Planning and Evaluation
U.S. Department of Health and Human Services
200 Independence Av, SW
Washington, DC 20201
Fax: (202) 690-6562
Appendix A
Median Months from Most Recent Entry into Out-of-Home Care to Adoption, by Child's Age at Adoption, by State, FY 2001
| State | Age at Adoption | Total | ||||||
|---|---|---|---|---|---|---|---|---|
| 0 to 5 | 6 to 12 | 13 to 17 | ||||||
| Adopted Children | Median Months | Adopted Children | Median Months | Adopted Children | Median Months | Total Adopted Children | Median Months |
|
| Alabama | 80 | 34.8 | 73 | 52.4 | 5 | 117.5 | 158 | 46.0 |
| Alaska | 113 | 29.2 | 76 | 42.2 | 9 | 68.3 | 198 | 35.6 |
| Arizona | 414 | 28.4 | 330 | 38.1 | 64 | 50.4 | 808 | 32.7 |
| Arkansas | 146 | 26.0 | 150 | 33.7 | 46 | 38.4 | 342 | 28.9 |
| California | 3,915 | 31.5 | 2,661 | 49.1 | 483 | 61.9 | 7,059 | 38.8 |
| Colorado | 216 | 18.2 | 160 | 24.0 | 44 | 20.0 | 420 | 20.6 |
| Connecticut | 215 | 36.0 | 155 | 56.0 | 22 | 62.9 | 392 | 46.2 |
| Delaware | 62 | 33.0 | 49 | 41.6 | 3 | 50.6 | 114 | 39.7 |
| District of Columbia | 15 | 42.0 | 31 | 54.2 | 7 | 49.4 | 53 | 53.5 |
| Florida | 743 | 28.6 | 522 | 46.3 | 117 | 48.2 | 1,382 | 34.1 |
| Georgia | 420 | 30.0 | 414 | 51.5 | 78 | 66.3 | 912 | 40.1 |
| Hawaii | 166 | 20.2 | 93 | 32.6 | 12 | 34.4 | 271 | 23.7 |
| Idaho | 56 | 25.6 | 35 | 41.9 | 12 | 31.3 | 103 | 28.8 |
| Illinois | 1,538 | 37.1 | 1,840 | 69.1 | 346 | 74.5 | 3,724 | 51.0 |
| Indiana | 477 | 27.4 | 444 | 39.2 | 127 | 53.8 | 1,048 | 32.4 |
| Iowa | 252 | 22.3 | 217 | 33.6 | 68 | 38.7 | 537 | 27.0 |
| Kansas | 14 | 24.5 | 6 | 50.5 | 0 | 0.0 | 20 | 27.1 |
| Kentucky | 202 | 31.1 | 228 | 45.7 | 69 | 44.8 | 499 | 40.1 |
| Louisiana | 179 | 30.9 | 228 | 48.9 | 56 | 57.3 | 463 | 41.8 |
| Maine | 141 | 32.2 | 114 | 49.1 | 23 | 80.3 | 278 | 42.2 |
| Maryland | 250 | 35.2 | 277 | 68.8 | 56 | 75.1 | 583 | 49.9 |
| Massachusetts | 386 | 31.2 | 345 | 54.9 | 65 | 62.6 | 796 | 40.3 |
| Michigan | 802 | 26.2 | 766 | 32.5 | 138 | 35.5 | 1,706 | 29.6 |
| Minnesota | 234 | 24.1 | 183 | 37.9 | 19 | 69.4 | 436 | 30.1 |
| Mississippi | 94 | 32.2 | 92 | 52.6 | 24 | 61.1 | 210 | 40.2 |
| Missouri | 531 | 26.5 | 401 | 44.8 | 103 | 46.2 | 1,035 | 32.8 |
| Montana | 125 | 23.6 | 92 | 38.4 | 24 | 55.8 | 241 | 30.0 |
| Nebraska | 7 | 39.8 | 11 | 68.0 | 0 | 0.0 | 18 | 56.9 |
| Nevada | 22 | 29.9 | 14 | 72.9 | 4 | 124.8 | 40 | 49.5 |
| New Hampshire | 36 | 37.6 | 28 | 56.2 | 5 | 33.9 | 69 | 41.5 |
| New Jersey | 501 | 35.0 | 309 | 57.7 | 42 | 77.1 | 852 | 43.3 |
| New Mexico | 97 | 26.4 | 134 | 37.4 | 22 | 33.1 | 253 | 32.5 |
| New York | 1,357 | 40.5 | 1,901 | 76.9 | 512 | 100.5 | 3770 | 59.2 |
| North Carolina | 561 | 28.1 | 493 | 40.3 | 121 | 41.0 | 1,175 | 33.3 |
| North Dakota | 41 | 21.3 | 20 | 39.8 | 15 | 47.9 | 76 | 30.3 |
| Ohio | 910 | 27.2 | 608 | 41.7 | 153 | 52.5 | 1,671 | 33.3 |
| Oklahoma | 388 | 27.4 | 420 | 43.2 | 110 | 43.4 | 918 | 33.9 |
| Oregon | 516 | 30.9 | 448 | 47.0 | 67 | 61.4 | 1,031 | 40.4 |
| Pennsylvania | 723 | 29.0 | 761 | 54.4 | 194 | 62.4 | 1,678 | 41.0 |
| Rhode Island | 86 | 22.3 | 54 | 39.5 | 8 | 35.9 | 148 | 25.6 |
| South Carolina | 188 | 31.9 | 162 | 56.7 | 45 | 62.0 | 395 | 40.3 |
| South Dakota | 67 | 19.2 | 25 | 35.5 | 4 | 40.4 | 96 | 23.9 |
| Tennessee | 239 | 31.9 | 319 | 64.8 | 81 | 79.3 | 639 | 53.0 |
| Texas | 1,110 | 20.2 | 700 | 32.7 | 112 | 39.2 | 1,922 | 23.9 |
| Utah | 199 | 14.2 | 104 | 26.4 | 15 | 42.3 | 318 | 17.3 |
| Vermont | 36 | 27.7 | 33 | 44.3 | 10 | 61.5 | 79 | 35.2 |
| Virginia | 174 | 30.4 | 195 | 48.0 | 38 | 56.3 | 407 | 37.3 |
| Washington | 628 | 28.1 | 371 | 45.0 | 46 | 50.9 | 1,045 | 33.1 |
| West Virginia | 135 | 27.1 | 145 | 38.4 | 40 | 50.5 | 320 | 34.2 |
| Wisconsin | 269 | 30.4 | 270 | 46.9 | 46 | 49.2 | 585 | 38.8 |
| Wyoming | 7 | 22.5 | 8 | 54.8 | 1 | 64.8 | 16 | 42.9 |
| Puerto Rico | 44 | 31.1 | 23 | 78.0 | 1 | 93.6 | 68 | 44.5 |
| Total | 20,127 | 29.7 | 17,538 | 49.3 | 3,712 | 59.0 | 41,377 | 38.1 |
|
Notes:
Source: AFCARS 2001, foster care data. |
||||||||
Proportion of Adopted Children Meeting Special Needs Criteria, by State, FY 2001
| State | Age at Adoption | |||||||||||
|---|---|---|---|---|---|---|---|---|---|---|---|---|
| Total | 0 to 5 | 6 to 12 | 13 to 17 | |||||||||
| Adopted Children | Special Needs Children | % | Adopted Children | Special Needs Children | % | Adopted Children | Special Needs Children | % | Adopted Children | Special Needs Children | % | |
| Alabama | 237 | 111 | 46.8 | 117 | 50 | 42.7 | 107 | 55 | 51.4 | 13 | 6 | 46.2 |
| Alaska | 278 | 278 | 100.0 | 143 | 143 | 100.0 | 119 | 119 | 100.0 | 16 | 16 | 100.0 |
| Arizona | 938 | 780 | 83.2 | 469 | 353 | 75.3 | 388 | 351 | 90.5 | 81 | 76 | 93.8 |
| Arkansas | 361 | 347 | 96.1 | 154 | 147 | 95.5 | 160 | 157 | 98.1 | 47 | 43 | 91.5 |
| California | 9,822 | 9,591 | 97.6 | 5,353 | 5,173 | 96.6 | 3,740 | 3,695 | 98.8 | 729 | 723 | 99.2 |
| Colorado* | 342 | 211 | 61.7 | 223 | 113 | 50.7 | 105 | 85 | 81.0 | 14 | 13 | 92.9 |
| Connecticut | 444 | 0 | 0.0 | 246 | 0 | 0.0 | 171 | 0 | 0.0 | 27 | 0 | 0.0 |
| Delaware | 115 | 112 | 97.4 | 62 | 60 | 96.8 | 48 | 47 | 97.9 | 5 | 5 | 100.0 |
| District of Columbia | 226 | 221 | 97.8 | 61 | 56 | 91.8 | 144 | 144 | 100.0 | 21 | 21 | 100.0 |
| Florida | 1,712 | 1,643 | 96.0 | 904 | 856 | 94.7 | 656 | 638 | 97.3 | 152 | 149 | 98.0 |
| Georgia | 895 | 431 | 48.2 | 404 | 176 | 43.6 | 404 | 203 | 50.2 | 87 | 52 | 59.8 |
| Hawaii | 260 | 246 | 94.6 | 155 | 147 | 94.8 | 89 | 86 | 96.6 | 16 | 13 | 81.3 |
| Idaho | 123 | 113 | 91.9 | 67 | 60 | 89.6 | 41 | 40 | 97.6 | 15 | 13 | 86.7 |
| Illinois | 4,095 | 4,014 | 98.0 | 1,661 | 1,580 | 95.1 | 2,031 | 2,031 | 100.0 | 403 | 403 | 100.0 |
| Indiana* | 155 | 117 | 75.5 | 64 | 40 | 62.5 | 69 | 57 | 82.6 | 22 | 20 | 90.9 |
| Iowa | 659 | 374 | 56.8 | 302 | 120 | 39.7 | 265 | 190 | 71.7 | 92 | 64 | 69.6 |
| Kansas | 423 | 314 | 74.2 | 179 | 124 | 69.3 | 183 | 136 | 74.3 | 61 | 54 | 88.5 |
| Kentucky | 571 | 295 | 51.7 | 226 | 106 | 46.9 | 266 | 142 | 53.4 | 79 | 47 | 59.5 |
| Louisiana | 470 | 376 | 80.0 | 178 | 124 | 69.7 | 234 | 194 | 82.9 | 58 | 58 | 100.0 |
| Maine | 363 | 159 | 43.8 | 176 | 80 | 45.5 | 148 | 69 | 46.6 | 39 | 10 | 25.6 |
| Maryland | 812 | 796 | 98.0 | 353 | 337 | 95.5 | 379 | 379 | 100.0 | 80 | 80 | 100.0 |
| Massachusetts | 776 | 768 | 99.0 | 388 | 386 | 99.5 | 328 | 325 | 99.1 | 60 | 57 | 95.0 |
| Michigan | 2,975 | 2,489 | 83.7 | 1,336 | 1,084 | 81.1 | 1,370 | 1,183 | 86.4 | 269 | 222 | 82.5 |
| Minnesota* | 363 | 299 | 82.4 | 132 | 88 | 66.7 | 209 | 191 | 91.4 | 22 | 20 | 90.9 |
| Mississippi | 264 | 217 | 82.2 | 111 | 66 | 59.5 | 121 | 119 | 98.3 | 32 | 32 | 100.0 |
| Missouri | 1,051 | 844 | 80.3 | 518 | 395 | 76.3 | 409 | 343 | 83.9 | 124 | 106 | 85.5 |
| Montana | 275 | 231 | 84.0 | 123 | 79 | 64.2 | 117 | 117 | 100.0 | 35 | 35 | 100.0 |
| Nebraska | 292 | 270 | 92.5 | 129 | 115 | 89.1 | 130 | 122 | 93.8 | 33 | 33 | 100.0 |
| Nevada | 242 | 233 | 96.3 | 149 | 143 | 96.0 | 81 | 78 | 96.3 | 12 | 12 | 100.0 |
| New Hampshire | 95 | 95 | 100.0 | 45 | 45 | 100.0 | 44 | 44 | 100.0 | 6 | 6 | 100.0 |
| New Jersey | 1,025 | 920 | 89.8 | 591 | 523 | 88.5 | 384 | 353 | 91.9 | 50 | 44 | 88.0 |
| New Mexico | 369 | 352 | 95.4 | 140 | 130 | 92.9 | 194 | 189 | 97.4 | 35 | 33 | 94.3 |
| New York | 3,888 | 3,726 | 95.8 | 1,361 | 1,246 | 91.6 | 1,971 | 1,932 | 98.0 | 556 | 548 | 98.6 |
| North Carolina | 1,298 | 1,210 | 93.2 | 643 | 590 | 91.8 | 520 | 491 | 94.4 | 135 | 129 | 95.6 |
| North Dakota | 145 | 101 | 69.7 | 87 | 43 | 49.4 | 41 | 41 | 100.0 | 17 | 17 | 100.0 |
| Ohio | 2,149 | 2,146 | 99.9 | 1,113 | 1,111 | 99.8 | 838 | 838 | 100.0 | 198 | 197 | 99.5 |
| Oklahoma | 955 | 912 | 95.5 | 391 | 355 | 90.8 | 448 | 441 | 98.4 | 116 | 116 | 100.0 |
| Oregon | 1,071 | 1,059 | 98.9 | 520 | 515 | 99.0 | 474 | 468 | 98.7 | 77 | 76 | 98.7 |
| Pennsylvania | 1,560 | 860 | 55.1 | 686 | 398 | 58.0 | 681 | 362 | 53.2 | 193 | 100 | 51.8 |
| Rhode Island | 267 | 123 | 46.1 | 149 | 57 | 38.3 | 99 | 55 | 55.6 | 19 | 11 | 57.9 |
| South Carolina | 373 | 345 | 92.5 | 173 | 157 | 90.8 | 155 | 144 | 92.9 | 45 | 44 | 97.8 |
| South Dakota | 97 | 97 | 100.0 | 52 | 52 | 100.0 | 39 | 39 | 100.0 | 6 | 6 | 100.0 |
| Tennessee | 638 | 516 | 80.9 | 235 | 133 | 56.6 | 323 | 303 | 93.8 | 80 | 80 | 100.0 |
| Texas | 2,312 | 2,087 | 90.3 | 1,351 | 1,129 | 83.6 | 828 | 825 | 99.6 | 133 | 133 | 100.0 |
| Utah | 348 | 328 | 94.3 | 217 | 203 | 93.5 | 114 | 109 | 95.6 | 17 | 16 | 94.1 |
| Vermont | 115 | 115 | 100.0 | 50 | 50 | 100.0 | 49 | 49 | 100.0 | 16 | 16 | 100.0 |
| Virginia | 493 | 322 | 65.3 | 199 | 101 | 50.8 | 238 | 177 | 74.4 | 56 | 44 | 78.6 |
| Washington | 1,203 | 852 | 70.8 | 703 | 505 | 71.8 | 445 | 310 | 69.7 | 55 | 37 | 67.3 |
| West Virginia | 326 | 326 | 100.0 | 136 | 136 | 100.0 | 149 | 149 | 100.0 | 41 | 41 | 100.0 |
| Wisconsin | 753 | 714 | 94.8 | 382 | 348 | 91.1 | 323 | 318 | 98.5 | 48 | 48 | 100.0 |
| Wyoming | 46 | 42 | 91.3 | 14 | 12 | 85.7 | 27 | 26 | 96.3 | 5 | 4 | 80.0 |
| Puerto Rico | 248 | 67 | 27.0 | 124 | 16 | 12.9 | 99 | 36 | 36.4 | 25 | 15 | 60.0 |
| Total | 49,313 | 43,195 | 87.6 | 23,745 | 20,056 | 84.5 | 20,995 | 18,995 | 90.5 | 4,573 | 4,144 | 90.6 |
Notes:
* These states had missing or invalid special needs data for more than 30 percent of their cases. Source: AFCARS 2001, adoption data. |
||||||||||||
Proportion of Adopted Children with Deferred Subsidy Payments, by State, FY 2001
| State | N | Subsidy Provided? | |||||
|---|---|---|---|---|---|---|---|
| Yes, with Payment | Yes, Deferred | No | |||||
| n | (%) | n | (%) | n | (%) | ||
| Alabama | 237 | 111 | 46.8 | 0 | 0.0 | 126 | 53.2 |
| Alaska | 278 | 271 | 97.5 | 0 | 0.0 | 7 | 2.5 |
| Arizona | 938 | 837 | 89.2 | 48 | 5.1 | 53 | 5.7 |
| Arkansas | 361 | 320 | 88.6 | 2 | 0.6 | 39 | 10.8 |
| California | 9,822 | 8,982 | 91.5 | 1 | 0.0 | 839 | 8.5 |
| Colorado | 596 | 522 | 87.6 | 27 | 4.5 | 47 | 7.9 |
| Connecticut | 444 | 73 | 16.4 | 0 | 0.0 | 371 | 83.6 |
| Delaware | 115 | 112 | 97.4 | 0 | 0.0 | 3 | 2.6 |
| District of Columbia | 227 | 130 | 57.3 | 0 | 0.0 | 97 | 42.7 |
| Florida | 1,748 | 1,123 | 64.2 | 0 | 0.0 | 625 | 35.8 |
| Georgia | 896 | 413 | 46.1 | 20 | 2.2 | 463 | 51.7 |
| Hawaii | 260 | 216 | 83.1 | 0 | 0.0 | 44 | 16.9 |
| Idaho | 123 | 104 | 84.6 | 0 | 0.0 | 19 | 15.5 |
| Illinois | 4,079 | 3,921 | 96.1 | 5 | 0.1 | 153 | 3.8 |
| Indiana | 867 | 449 | 51.8 | 0 | 0.0 | 418 | 48.2 |
| Iowa | 659 | 504 | 76.5 | 0 | 0.0 | 155 | 23.5 |
| Kansas | 423 | 304 | 71.9 | 4 | 1.0 | 115 | 27.2 |
| Kentucky | 571 | 401 | 70.2 | 3 | 0.5 | 167 | 29.3 |
| Louisiana | 470 | 428 | 91.1 | 0 | 0.0 | 42 | 8.9 |
| Maine | 363 | 350 | 96.4 | 10 | 2.8 | 3 | 0.8 |
| Maryland | 812 | 797 | 98.2 | 2 | 0.3 | 13 | 1.6 |
| Massachusetts | 721 | 644 | 89.3 | 0 | 0.0 | 77 | 10.7 |
| Michigan | 2,975 | 2,868 | 96.4 | 0 | 0.0 | 107 | 3.6 |
| Minnesota | 565 | 561 | 99.3 | 0 | 0.0 | 4 | 0.7 |
| Mississippi | 264 | 215 | 81.4 | 0 | 0.0 | 49 | 18.6 |
| Missouri | 1,091 | 1,052 | 96.4 | 0 | 0.0 | 39 | 3.6 |
| Montana | 275 | 248 | 90.2 | 0 | 0.0 | 27 | 9.8 |
| Nebraska | 292 | 201 | 68.8 | 0 | 0.0 | 91 | 31.2 |
| Nevada | 243 | 229 | 94.2 | 1 | 0.4 | 13 | 5.4 |
| New Hampshire | 95 | 84 | 88.4 | 0 | 0.0 | 11 | 11.6 |
| New Jersey | 1,025 | 908 | 88.6 | 16 | 1.6 | 101 | 9.9 |
| New Mexico | 369 | 330 | 89.4 | 0 | 0.0 | 39 | 10.6 |
| New York | 3,888 | 3,808 | 97.9 | 0 | 0.0 | 80 | 2.1 |
| North Carolina | 1298 | 1,194 | 92.0 | 29 | 2.2 | 75 | 5.8 |
| North Dakota | 145 | 91 | 62.8 | 0 | 0.0 | 54 | 37.2 |
| Ohio | 2,225 | 2,132 | 95.8 | 5 | 0.2 | 88 | 4.0 |
| Oklahoma | 955 | 905 | 94.8 | 45 | 4.7 | 5 | 0.5 |
| Oregon | 1071 | 1,042 | 97.3 | 18 | 1.7 | 11 | 1.0 |
| Pennsylvania | 1,525 | 1,373 | 90.0 | 3 | 0.2 | 149 | 9.8 |
| Rhode Island | 267 | 265 | 99.3 | 1 | 0.4 | 1 | 0.4 |
| South Carolina | 364 | 364 | 100.0 | 0 | 0.0 | 0 | 0.0 |
| South Dakota | 97 | 63 | 65.0 | 0 | 0.0 | 34 | 35.1 |
| Tennessee | 638 | 518 | 81.2 | 0 | 0.0 | 120 | 18.8 |
| Texas | 2,317 | 1,681 | 72.6 | 0 | 0.0 | 636 | 27.5 |
| Utah | 348 | 266 | 76.4 | 3 | 0.9 | 79 | 22.7 |
| Vermont | 116 | 99 | 85.3 | 0 | 0.0 | 17 | 14.7 |
| Virginia | 493 | 440 | 89.3 | 31 | 6.3 | 22 | 4.5 |
| Washington | 1,203 | 1,107 | 92.0 | 68 | 5.7 | 28 | 2.3 |
| West Virginia | 362 | 311 | 85.9 | 21 | 5.8 | 30 | 8.3 |
| Wisconsin | 753 | 716 | 95.1 | 31 | 4.1 | 6 | 0.8 |
| Wyoming | 46 | 41 | 89.1 | 2 | 4.4 | 3 | 6.5 |
| Puerto Rico | 250 | 31 | 12.4 | 2 | 0.8 | 217 | 86.8 |
| Total | 50,565 | 44,155 | 87.3 | 398 | 0.8 | 6,012 | 11.9 |
Notes:
Source: AFCARS 2001, adoption data. |
|||||||
Proportion of Adopted Children Who Received Subsidy Assistance, by State, FY 2001
| State | В Adopted Children | Percent of Adopted Children Receiving: | ||||
|---|---|---|---|---|---|---|
| FederalВ + State Subsidy | State Subsidy | Any Subsidy | No Subsidy | Percent Subsidies that are FederalВ + State |
||
| N | (%) | (%) | (%) | (%) | (%) | |
| Alabama | 237 | 33.8 | 13.1 | 46.8 | 53.2 | 72 |
| Alaska | 278 | 82.4 | 15.1 | 97.5 | 2.5 | 85 |
| Arizona | 938 | 69.2 | 25.2 | 94.3 | 5.7 | 73 |
| Arkansas | 361 | 78.9 | 10.2 | 89.2 | 10.8 | 89 |
| California | 9,822 | 83.0 | 8.5 | 91.5 | 8.5 | 91 |
| Colorado | 596 | 60.7 | 31.4 | 92.1 | 7.9 | 66 |
| Connecticut | 444 | 10.4 | 6.1 | 16.4 | 83.6 | 63 |
| Delaware | 115 | 75.7 | 21.7 | 97.4 | 2.6 | 78 |
| District of Columbia | 227 | 44.1 | 13.2 | 57.3 | 42.7 | 77 |
| Florida | 1,748 | 56.6 | 7.7 | 64.2 | 35.8 | 88 |
| Georgia | 896 | 34.9 | 13.4 | 48.3 | 51.7 | 72 |
| Hawaii | 260 | 60.8 | 22.3 | 83.1 | 16.9 | 73 |
| Idaho | 123 | 76.4 | 8.1 | 84.6 | 15.4 | 90 |
| Illinois | 4,079 | 75.5 | 20.8 | 96.2 | 3.8 | 78 |
| Indiana | 867 | 51.8 | 0.0 | 51.8 | 48.2 | 100 |
| Iowa | 659 | 58.0 | 18.5 | 76.5 | 23.5 | 76 |
| Kansas | 423 | 61.7 | 11.1 | 72.8 | 27.2 | 85 |
| Kentucky | 571 | 55.9 | 14.9 | 70.8 | 29.2 | 79 |
| Louisiana | 470 | 74.7 | 16.4 | 91.1 | 8.9 | 82 |
| Maine | 363 | 91.7 | 7.4 | 99.2 | 0.8 | 93 |
| Maryland | 812 | 78.3 | 20.1 | 98.4 | 1.6 | 80 |
| Massachusetts | 721 | 48.1 | 41.2 | 89.3 | 10.7 | 54 |
| Michigan | 2,975 | 83.7 | 12.7 | 96.4 | 3.6 | 87 |
| Minnesota | 565 | 84.8 | 14.5 | 99.3 | 0.7 | 85 |
| Mississippi | 264 | 81.4 | 0.0 | 81.4 | 18.6 | 100 |
| Missouri | 1,091 | 67.9 | 28.5 | 96.4 | 3.6 | 70 |
| Montana | 275 | 60.4 | 29.8 | 90.2 | 9.8 | 67 |
| Nebraska | 292 | 51.4 | 17.5 | 68.8 | 31.2 | 75 |
| Nevada | 243 | 70.8 | 23.9 | 94.7 | 5.3 | 75 |
| New Hampshire | 95 | 88.4 | 0.0 | 88.4 | 11.6 | 100 |
| New Jersey | 1,025 | 77.6 | 12.6 | 90.1 | 9.9 | 86 |
| New Mexico | 369 | 89.4 | 0.0 | 89.4 | 10.6 | 100 |
| New York | 3,888 | 93.1 | 4.9 | 97.9 | 2.1 | 95 |
| North Carolina | 1,298 | 75.0 | 19.3 | 94.2 | 5.8 | 80 |
| North Dakota | 145 | 49.7 | 13.1 | 62.8 | 37.2 | 79 |
| Ohio | 2,225 | 95.9 | 0.2 | 96.0 | 4.0 | 100 |
| Oklahoma | 955 | 59.6 | 39.9 | 99.5 | 0.5 | 60 |
| Oregon | 1,071 | 79.4 | 19.6 | 99.0 | 1.0 | 80 |
| Pennsylvania | 1,525 | 84.7 | 5.5 | 90.2 | 9.8 | 94 |
| Rhode Island | 267 | 63.7 | 36.0 | 99.6 | 0.4 | 64 |
| South Carolina | 364 | 64.3 | 35.7 | 100.0 | 0.0 | 64 |
| South Dakota | 97 | 60.8 | 4.1 | 64.9 | 35.1 | 94 |
| Tennessee | 638 | 69.3 | 11.9 | 81.2 | 18.8 | 85 |
| Texas | 2,317 | 55.6 | 16.9 | 72.6 | 27.4 | 77 |
| Utah | 348 | 48.3 | 29.0 | 77.3 | 22.7 | 62 |
| Vermont | 116 | 85.3 | 0.0 | 85.3 | 14.7 | 100 |
| Virginia | 493 | 68.2 | 27.4 | 95.5 | 4.5 | 71 |
| Washington | 1,203 | 83.8 | 13.9 | 97.7 | 2.3 | 86 |
| West Virginia | 362 | 63.3 | 28.5 | 91.7 | 8.3 | 69 |
| Wisconsin | 753 | 84.7 | 14.5 | 99.2 | 0.8 | 85 |
| Wyoming | 46 | 78.3 | 15.2 | 93.5 | 6.5 | 84 |
| Puerto Rico | 250 | 10.4 | 2.8 | 13.2 | 86.8 | 79 |
| Total | 50,565 | 74.3 | 13.8 | 88.1 | 11.9 | 84 |
Notes:
Source: AFCARS 2001, adoption data. |
||||||
Federal + State Adoption Subsidy Rate, by State, FY 1999-2001
| State | Percent of Adopted Children Receiving a Federal + State Subsidy |
Percent Change in Subsidy Rate | |||||||
|---|---|---|---|---|---|---|---|---|---|
| 1999 | 2000 | 2001 | 1999-2000 | 2000-2001 | 1999-2001 | ||||
| Adopted Children | % | Adopted Children | % | Adopted Children | % | % | % | % | |
| Alabama | 153 | 39.2 | 199 | 28.6 | 237 | 33.8 | -27 | 17.8 | -13.9 |
| Alaska | 137 | 87.6 | 202 | 89.6 | 278 | 82.4 | 2.3 | -8.1 | -6 |
| Arizona | 760 | 60.7 | 853 | 71.8 | 938 | 69.2 | 18.3 | -3.6 | 14.1 |
| Arkansas | 314 | 85.0 | 320 | 81.3 | 361 | 79.0 | -4.4 | -2.8 | -7.2 |
| California | 6,365 | 68.4 | 8,736 | 78.2 | 9,822 | 83.0 | 14.3 | 6.2 | 21.3 |
| Colorado | 713 | 81.4 | 687 | 74.1 | 596 | 60.7 | -8.9 | -18 | -25.3 |
| Connecticut | 402 | 32.1 | 499 | 37.3 | 444 | 10.4 | 16.2 | -72.2 | -67.7 |
| Delaware | 33 | 72.7 | 103 | 59.2 | 115 | 75.7 | -18.6 | 27.7 | 4 |
| District of Columbia | 165 | 33.3 | 318 | 49.4 | 227 | 44.1 | 48.1 | -10.8 | 32.2 |
| Florida | 1,355 | 40.7 | 1622 | 44.9 | 1,748 | 56.6 | 10.4 | 26.1 | 39.1 |
| Georgia | 1,148 | 53.6 | 1,076 | 51.9 | 896 | 34.9 | -3.2 | -32.6 | -34.8 |
| Hawaii | 281 | 65.1 | 280 | 70.0 | 260 | 60.8 | 7.5 | -13.2 | -6.7 |
| Idaho | 107 | 72.0 | 123 | 69.9 | 123 | 76.4 | -2.8 | 9.3 | 6.2 |
| Illinois | 7,084 | 89.1 | 5,646 | 89.4 | 4,079 | 75.5 | 0.4 | -15.6 | -15.2 |
| Indiana | 753 | 63.1 | 1129 | 62.3 | 867 | 51.8 | -1.3 | -16.8 | -17.9 |
| Iowa | 763 | 68.4 | 727 | 59.0 | 659 | 58.0 | -13.7 | -1.8 | -15.3 |
| Kansas | 565 | 80.7 | 465 | 68.6 | 423 | 61.7 | -15 | -10.1 | -23.5 |
| Kentucky | 359 | 65.2 | 396 | 44.7 | 571 | 55.9 | -31.4 | 25 | -14.3 |
| Louisiana | 356 | 69.7 | 476 | 72.5 | 470 | 74.7 | 4 | 3 | 7.2 |
| Maine | 202 | 90.6 | 379 | 85.5 | 363 | 91.7 | -5.6 | 7.3 | 1.3 |
| Maryland | 592 | 79.6 | 547 | 77.5 | 812 | 78.3 | -2.6 | 1 | -1.6 |
| Massachusetts | 921 | 44.5 | 823 | 40.3 | 721 | 48.1 | -9.4 | 19.3 | 8.1 |
| Michigan | 2,443 | 86.2 | 2,794 | 84.4 | 2,975 | 83.7 | -2.1 | -0.9 | -2.9 |
| Minnesota | 632 | 85.0 | 613 | 86.3 | 565 | 84.8 | 1.6 | -1.8 | -0.2 |
| Mississippi | 237 | 82.7 | 287 | 88.5 | 264 | 81.4 | 7 | -8 | -1.5 |
| Missouri | 837 | 71.3 | 1,261 | 68.9 | 1,091 | 67.9 | -3.4 | -1.4 | -4.8 |
| Montana | 188 | 59.0 | 237 | 58.2 | 275 | 60.4 | -1.4 | 3.7 | 2.2 |
| Nebraska | 276 | 40.6 | 292 | 45.2 | 292 | 51.4 | 11.4 | 13.6 | 26.6 |
| Nevada | 123 | 74.8 | 231 | 67.5 | 243 | 70.8 | -9.7 | 4.8 | -5.4 |
| New Hampshire | 62 | 85.5 | 97 | 78.4 | 95 | 88.4 | -8.3 | 12.9 | 3.4 |
| New Jersey | 732 | 72.5 | 829 | 78.9 | 1,025 | 77.6 | 8.8 | -1.7 | 6.9 |
| New Mexico | 65 | 100.0 | 347 | 83.3 | 369 | 89.4 | -16.7 | 7.4 | -10.6 |
| New York | 4,792 | 93.5 | 4,182 | 93.2 | 3,888 | 93.1 | -0.3 | -0.2 | -0.5 |
| North Carolina | 944 | 72.1 | 1315 | 74.6 | 1298 | 75.0 | 3.4 | 0.5 | 3.9 |
| North Dakota | 138 | 29.0 | 105 | 27.6 | 145 | 49.7 | -4.7 | 79.8 | 71.3 |
| Ohio | 1,863 | 88.0 | 2,035 | 91.9 | 2,225 | 95.9 | 4.4 | 4.3 | 8.9 |
| Oklahoma | 814 | 71.1 | 1064 | 56.5 | 955 | 59.6 | -20.6 | 5.5 | -16.2 |
| Oregon | 765 | 72.4 | 830 | 78.1 | 1071 | 79.4 | 7.8 | 1.7 | 9.6 |
| Pennsylvania | 1,448 | 84.9 | 1,684 | 88.1 | 1,525 | 84.7 | 3.7 | -3.9 | -0.3 |
| Rhode Island | 281 | 66.9 | 257 | 54.1 | 267 | 63.7 | -19.2 | 17.7 | -4.8 |
| South Carolina | 456 | 68.2 | 371 | 66.0 | 364 | 64.3 | -3.2 | -2.7 | -5.7 |
| South Dakota | 84 | 60.7 | 94 | 44.7 | 97 | 60.8 | -26.4 | 36.1 | 0.2 |
| Tennessee | 381 | 68.5 | 430 | 70.0 | 638 | 69.3 | 2.2 | -1 | 1.1 |
| Texas | 2,060 | 73.7 | 2,039 | 70.6 | 2,317 | 55.6 | -4.2 | -21.2 | -24.5 |
| Utah | 368 | 72.8 | 303 | 57.8 | 348 | 48.3 | -20.7 | -16.4 | -33.7 |
| Vermont | 139 | 87.1 | 116 | 87.9 | 116 | 85.3 | 1 | -2.9 | -2 |
| Virginia | 322 | 52.5 | 445 | 69.7 | 493 | 68.2 | 32.7 | -2.2 | 29.9 |
| Washington | 1,046 | 64.8 | 1,139 | 63.9 | 1,203 | 83.8 | -1.4 | 31.1 | 29.3 |
| West Virginia | 312 | 43.6 | 352 | 49.7 | 362 | 63.3 | 14.1 | 27.2 | 45.1 |
| Wisconsin | 637 | 85.1 | 734 | 89.1 | 753 | 84.7 | 4.7 | -4.9 | -0.4 |
| Wyoming | 45 | 55.6 | 61 | 54.1 | 46 | 78.3 | -2.6 | 44.7 | 40.9 |
| Puerto Rico | 349 | 11.2 | 246 | 16.7 | 250 | 10.4 | 49.1 | -37.6 | -6.9 |
| Total | 46,367 | 74.8 | 50,396 | 75.2 | 50,565 | 74.3 | 0.4 | -1.2 | -0.7 |
Notes:
Source: AFCARS 1999-2001, adoption data. |
|||||||||
Comparison of Adoption Subsidies and Foster Care Payment Rates, by State, FY 2001
| State | Percent of Adopted Children Receiving FederalВ + State Subsidy | Percent of Non-Relative Foster Care Children Receiving FederalВ + State Payments | Ratio of Foster Care Payments to Adoption FederalВ + State Subsidies | ||
|---|---|---|---|---|---|
| N | (%) | N | (%) | ||
| Alabama | 237 | 33.8 | 4,059 | 32.4 | 1.0 |
| Alaska* | 278 | 82.4 | 1,163 | ||
| Arizona | 938 | 69.2 | 3,957 | 49.7 | 0.7 |
| Arkansas | 361 | 78.9 | 4,339 | 38.2 | 0.5 |
| California | 9,822 | 83 | 56,921 | 55.9 | 0.7 |
| Colorado | 596 | 60.7 | 6,139 | 38.9 | 0.6 |
| Connecticut | 444 | 10.4 | 6,014 | 94.4 | 9.1 |
| Delaware | 115 | 75.7 | 954 | 50.3 | 0.7 |
| DistrictВ ofВ Columbia | 227 | 44.1 | 1,816 | 3.7 | 0.1 |
| Florida | 1,748 | 56.6 | 16,562 | 40.2 | 0.7 |
| Georgia | 896 | 34.9 | 11,852 | 40.5 | 1.2 |
| Hawaii | 260 | 60.8 | 2,487 | 41.5 | 0.7 |
| Idaho | 123 | 76.4 | 1,481 | 40.4 | 0.5 |
| Illinois | 4,079 | 75.5 | 17,923 | 39.6 | 0.5 |
| Indiana | 867 | 51.8 | 6,158 | 55 | 1.1 |
| Iowa | 659 | 58 | 5,232 | 47.9 | 0.8 |
| Kansas | 423 | 61.7 | 3,714 | 31.4 | 0.5 |
| Kentucky | 571 | 55.9 | 5,096 | 54.6 | 1.0 |
| Louisiana | 470 | 74.7 | 3,994 | 65.8 | 0.9 |
| Maine | 363 | 91.7 | 2,474 | 67.4 | 0.7 |
| Maryland | 812 | 78.3 | 5,968 | 64.4 | 0.8 |
| Massachusetts | 721 | 48.1 | 8,737 | 9.9 | 0.2 |
| Michigan | 2,975 | 83.7 | 14,245 | 4.7 | 0.1 |
| Minnesota | 565 | 84.8 | 7,444 | 46.3 | 0.5 |
| Mississippi | 264 | 81.4 | 1,554 | 71.4 | 0.9 |
| Missouri | 1,091 | 67.9 | 8,693 | 47.5 | 0.7 |
| Montana | 275 | 60.4 | 1,761 | 36.1 | 0.6 |
| Nebraska | 292 | 51.4 | 2,755 | 45.5 | 0.9 |
| Nevada | 243 | 70.8 | 675 | 0 | 0.0 |
| New Hampshire | 95 | 88.4 | 1,066 | 43.7 | 0.5 |
| New Jersey | 1,025 | 77.6 | 8,851 | 51 | 0.7 |
| New Mexico | 369 | 89.4 | 2,391 | 43 | 0.5 |
| New York | 3,888 | 93.1 | 31,582 | 65.8 | 0.7 |
| North Carolina | 1,298 | 75 | 6,794 | 56.5 | 0.8 |
| North Dakota | 145 | 49.7 | 970 | 52.8 | 1.1 |
| Ohio | 2,225 | 95.9 | 19,364 | 70.4 | 0.7 |
| Oklahoma | 955 | 59.6 | 8,054 | 47.2 | 0.8 |
| Oregon | 1,071 | 79.4 | 6,264 | 57.8 | 0.7 |
| Pennsylvania | 1,525 | 84.7 | 15,597 | 63.6 | 0.8 |
| Rhode Island | 267 | 63.7 | 1,078 | 48.1 | 0.8 |
| South Carolina | 364 | 64.3 | 4,631 | 49.3 | 0.8 |
| South Dakota | 97 | 60.8 | 1,274 | 45.7 | 0.8 |
| Tennessee | 638 | 69.3 | 6,233 | 60.2 | 0.9 |
| Texas | 2,317 | 55.6 | 12,915 | 8 | 0.1 |
| Utah | 348 | 48.3 | 2,382 | 48 | 1.0 |
| Vermont | 116 | 85.3 | 1,015 | 80.9 | 0.9 |
| Virginia | 493 | 68.2 | 5,653 | 58.3 | 0.9 |
| Washington | 1,203 | 83.8 | 8,748 | 37.6 | 0.4 |
| West Virginia | 362 | 63.3 | 2,917 | 38.3 | 0.6 |
| Wisconsin | 753 | 84.7 | 8,723 | 52 | 0.6 |
| Wyoming | 46 | 78.3 | 617 | 17.8 | 0.2 |
| Puerto Rico | 250 | 10.4 | 4,734 | 18.5 | 1.8 |
| Total | 50,565 | 74.3 | 376,020 | 48.3 | 0.7 |
Notes:
* This state was missing federal foster care payment data for all their cases for this analysis. Source: AFCARS 2001, adoption and foster care data. |
|||||
Median Monthly Adoption Subsidy Amount by Age, by State, FY 2001
| State | Age at Adoption | State Ranking | |||||||
|---|---|---|---|---|---|---|---|---|---|
| 0 to 5 | 6 to 12 | 13 to 17 | Total | ||||||
| Children with Subsidy | ($) | Children with Subsidy | ($) | Children with Subsidy | ($) | Children with Subsidy | ($) | ||
| Alabama | 50 | 241 | 55 | 241 | 6 | 241 | 111 | 241 | 39 |
| Alaska | 138 | 653 | 118 | 603 | 15 | 689 | 271 | 650 | 4 |
| Arizona | 330 | 479 | 291 | 479 | 66 | 479 | 687 | 479 | 18 |
| Arkansas | 114 | 400 | 109 | 425 | 39 | 475 | 262 | 425 | 23 |
| California | 4,795 | 405 | 3,507 | 471 | 680 | 569 | 8,982 | 441 | 20 |
| Colorado | 263 | 401 | 208 | 601 | 44 | 786 | 515 | 510 | 15 |
| Connecticut | 29 | 638 | 42 | 659 | 2 | 727 | 73 | 659 | 3 |
| Delaware | 60 | 479 | 47 | 518 | 5 | 543 | 112 | 479 | 18 |
| District of Columbia | 37 | 741 | 80 | 741 | 13 | 817 | 130 | 741 | 2 |
| Florida | 603 | 295 | 430 | 304 | 90 | 364 | 1,123 | 300 | 37 |
| Georgia | 168 | 388 | 193 | 411 | 51 | 433 | 412 | 411 | 24 |
| Hawaii | 118 | 529 | 84 | 529 | 14 | 529 | 216 | 529 | 12 |
| Idaho | 56 | 251 | 36 | 365 | 12 | 410 | 104 | 275 | 38 |
| Illinois | 1,564 | 369 | 1,970 | 410 | 383 | 444 | 3,917 | 410 | 25 |
| Indiana* | 102 | 169 | 150 | 162 | 42 | 194 | 294 | 171 | 41 |
| Iowa | 225 | 587 | 214 | 904 | 65 | 971 | 504 | 856 | 1 |
| Kansas | 106 | 304 | 136 | 400 | 53 | 400 | 295 | 400 | 29 |
| Kentucky | 130 | 600 | 178 | 600 | 56 | 722 | 364 | 600 | 6 |
| Louisiana | 156 | 273 | 220 | 392 | 52 | 395 | 428 | 353 | 35 |
| Maine | 163 | 581 | 141 | 772 | 37 | 733 | 341 | 650 | 4 |
| Maryland | 338 | 600 | 378 | 535 | 80 | 550 | 796 | 543 | 11 |
| Massachusetts | 309 | 454 | 285 | 471 | 50 | 522 | 644 | 471 | 19 |
| Michigan | 1,253 | 439 | 1,350 | 731 | 265 | 846 | 2,868 | 591 | 7 |
| Minnesota | 277 | 397 | 257 | 552 | 27 | 612 | 561 | 427 | 22 |
| Mississippi* | |||||||||
| Missouri | 532 | 225 | 409 | 275 | 111 | 304 | 1,052 | 275 | 38 |
| Montana | 103 | 388 | 111 | 399 | 34 | 508 | 248 | 408 | 26 |
| Nebraska | 90 | 421 | 85 | 641 | 26 | 627 | 201 | 527 | 13 |
| Nevada* | |||||||||
| New Hampshire | 35 | 535 | 38 | 600 | 6 | 708 | 79 | 552 | 9 |
| New Jersey | 495 | 412 | 361 | 457 | 43 | 516 | 899 | 437 | 21 |
| New Mexico* | 48 | 487 | 72 | 520 | 15 | 545 | 135 | 503 | 16 |
| New York* | |||||||||
| North Carolina | 566 | 315 | 479 | 365 | 125 | 415 | 1,170 | 365 | 32 |
| North Dakota | 39 | 396 | 36 | 388 | 16 | 558 | 91 | 402 | 28 |
| Ohio | 1,111 | 471 | 815 | 517 | 190 | 575 | 2,116 | 500 | 17 |
| Oklahoma | 346 | 300 | 438 | 360 | 115 | 420 | 899 | 360 | 33 |
| Oregon | 498 | 369 | 463 | 500 | 77 | 540 | 1,038 | 400 | 29 |
| Pennsylvania | 581 | 450 | 610 | 522 | 177 | 600 | 1,368 | 510 | 15 |
| Rhode Island | 148 | 387 | 98 | 418 | 19 | 422 | 265 | 407 | 27 |
| South Carolina | 165 | 332 | 155 | 359 | 44 | 425 | 364 | 359 | 34 |
| South Dakota | 35 | 390 | 25 | 390 | 3 | 469 | 63 | 390 | 31 |
| Tennessee | 131 | 362 | 306 | 313 | 80 | 422 | 517 | 402 | 28 |
| Texas | 974 | 516 | 610 | 516 | 97 | 516 | 1,681 | 516 | 14 |
| Utah | 144 | 270 | 105 | 348 | 17 | 411 | 266 | 300 | 37 |
| Vermont | 41 | 478 | 44 | 567 | 14 | 789 | 99 | 549 | 10 |
| Virginia | 160 | 294 | 215 | 344 | 49 | 436 | 424 | 344 | 36 |
| Washington | 645 | 531 | 414 | 612 | 48 | 728 | 1,107 | 572 | 8 |
| West Virginia | 119 | 400 | 124 | 400 | 34 | 456 | 277 | 400 | 29 |
| Wisconsin | 326 | 518 | 322 | 796 | 48 | 1,002 | 696 | 639 | 5 |
| Wyoming | 9 | 399 | 26 | 399 | 4 | 399 | 39 | 399 | 30 |
| Puerto Rico | 9 | 207 | 17 | 174 | 5 | 174 | 31 | 174 | 40 |
| Total | 18,734 | 406 | 16,857 | 471 | 3,544 | 522 | 39,135 | 444 | |
Notes:
* These states had missing or invalid subsidy amount data for more than 30 percent of their cases. Source: AFCARS 2001, adoption data. |
|||||||||
Median Monthly Adoption Subsidy Amount, by State, FY 1999-2001
| State | Median Monthly Adoption Subsidy | Percent Change of Subsidy Amount | |||||||
|---|---|---|---|---|---|---|---|---|---|
| 1999 | 2000 | 2001 | 1999-2000 | 2000-2001 | 1999-2001 | ||||
| Children with Subsidy | ($) | Children with Subsidy | ($) | Children with Subsidy | ($) | (%) | (%) | (%) | |
| Alabama | 78 | 241 | 91 | 241 | 111 | 241 | 0.0 | 0.0 | 0.0 |
| Alaska | 127 | 580 | 187 | 600 | 271 | 650 | 3.4 | 8.3 | 12.1 |
| Arizona | 553 | 479 | 663 | 479 | 687 | 479 | 0.0 | 0.0 | 0.0 |
| Arkansas | 250 | 425 | 239 | 425 | 262 | 425 | 0.0 | 0.0 | 0.0 |
| California | 5,058 | 384 | 7,810 | 418 | 8,982 | 441 | 8.9 | 5.5 | 14.8 |
| Colorado | 646 | 349 | 621 | 349 | 515 | 510 | 0.0 | 46.1 | 46.1 |
| Connecticut | 230 | 640 | 201 | 659 | 73 | 659 | 3.0 | 0.0 | 3.0 |
| Delaware | 28 | 439 | 73 | 451 | 112 | 479 | 2.7 | 6.2 | 9.1 |
| District of Columbia | 45 | 445 | 233 | 581 | 130 | 741 | 30.6 | 27.5 | 66.5 |
| Florida | 659 | 235 | 809 | 284 | 1123 | 300 | 20.9 | 5.6 | 27.7 |
| Georgia | 881 | 342 | 717 | 342 | 412 | 411 | 0.0 | 20.2 | 20.2 |
| Hawaii | 231 | 529 | 224 | 529 | 216 | 529 | 0.0 | 0.0 | 0.0 |
| Idaho | 88 | 378 | 102 | 318 | 104 | 275 | -15.9 | -13.5 | -27.2 |
| Illinois | 6,766 | 375 | 5338 | 384 | 3,917 | 410 | 2.4 | 6.8 | 9.3 |
| Indiana* | 142 | 214 | 445 | 156 | 294 | 171 | -27.1 | 9.6 | -20.1 |
| Iowa | 575 | 1123 | 534 | 1,009 | 504 | 856 | -10.2 | -15.2 | -23.8 |
| Kansas | 514 | 434 | 386 | 400 | 295 | 400 | -7.8 | 0.0 | -7.8 |
| Kentucky* | 167 | 446 | 128 | 446 | 364 | 600 | 0.0 | 34.5 | 34.5 |
| Louisiana | 302 | 357 | 422 | 409 | 428 | 353 | 14.6 | -13.7 | -1.1 |
| Maine | 186 | 611 | 356 | 383 | 341 | 650 | -37.3 | 69.7 | 6.5 |
| Maryland | 567 | 542 | 534 | 542 | 796 | 543 | 0.0 | 0.1 | 0.1 |
| Massachusetts | 888 | 471 | 692 | 471 | 644 | 471 | 0.0 | 0.0 | 0.0 |
| Michigan | 2,357 | 556 | 2,687 | 579 | 2,868 | 591 | 4.1 | 2.1 | 6.3 |
| Minnesota | 627 | 427 | 605 | 522 | 561 | 427 | 22.2 | -18.2 | 0.0 |
| Mississippi* | |||||||||
| Missouri | 768 | 264 | 1,179 | 264 | 1,052 | 275 | 0.0 | 4.2 | 4.2 |
| Montana | 161 | 341 | 194 | 351 | 248 | 408 | 2.9 | 16.2 | 19.6 |
| Nebraska | 185 | 543 | 216 | 526 | 201 | 527 | -3.2 | 0.3 | -2.9 |
| Nevada* | 2 | 7,600 | 2 | 7,450 | 0 | 0 | -2.0 | 0.0 | 0.0 |
| New Hampshire | 42 | 495 | 54 | 535 | 79 | 552 | 8.1 | 3.2 | 11.5 |
| New Jersey | 594 | 400 | 724 | 430 | 899 | 437 | 7.5 | 1.6 | 9.3 |
| New Mexico* | 1 | 10,000 | 0 | 0 | 135 | 503 | 0.0 | 0.0 | -95.0 |
| New York* | |||||||||
| North Carolina | 882 | 345 | 1,204 | 365 | 1,170 | 365 | 5.8 | 0.0 | 5.8 |
| North Dakota | 48 | 433 | 34 | 391 | 91 | 402 | -9.8 | 2.9 | -7.2 |
| Ohio | 1,393 | 397 | 1,851 | 470 | 2,116 | 500 | 18.4 | 6.4 | 25.9 |
| Oklahoma | 790 | 360 | 1,031 | 360 | 899 | 360 | 0.0 | 0.0 | 0.0 |
| Oregon | 547 | 360 | 767 | 377 | 1,038 | 400 | 4.7 | 6.1 | 11.1 |
| Pennsylvania | 1,264 | 465 | 1,549 | 464 | 1,368 | 510 | -0.2 | 9.9 | 9.7 |
| Rhode Island | 162 | 12 | 256 | 303 | 265 | 407 | 2,425.0 | 34.3 | 3,291.7 |
| South Carolina | 435 | 332 | 354 | 359 | 364 | 359 | 8.1 | 0.0 | 8.1 |
| South Dakota | 80 | 371 | 48 | 382 | 63 | 390 | 2.8 | 2.2 | 5.1 |
| Tennessee | 302 | 335 | 350 | 345 | 517 | 402 | 3.0 | 16.5 | 20.0 |
| Texas | 1,926 | 475 | 1,896 | 475 | 1,681 | 516 | 0.0 | 8.6 | 8.6 |
| Utah* | 104 | 300 | 230 | 341 | 266 | 300 | 13.7 | -12.0 | 0.0 |
| Vermont | 129 | 601 | 105 | 553 | 99 | 549 | -8.0 | -0.7 | -8.7 |
| Virginia | 227 | 323 | 393 | 344 | 424 | 344 | 6.5 | 0.0 | 6.5 |
| Washington | 872 | 574 | 936 | 569 | 1,107 | 572 | -1.0 | 0.6 | -0.3 |
| West Virginia* | 89 | 400 | 99 | 400 | 277 | 400 | 0.0 | 0.0 | 0.0 |
| Wisconsin | 612 | 577 | 710 | 623 | 696 | 639 | 8.0 | 2.5 | 10.7 |
| Wyoming | 31 | 399 | 39 | 399 | 39 | 399 | 0.0 | 0.0 | 0.0 |
| Puerto Rico | 44 | 207 | 48 | 207 | 31 | 174 | 0.0 | -15.9 | -15.9 |
| Total | 33,655 | 404 | 38,366 | 425 | 39,135 | 444 | 5.2 | 4.5 | 9.9 |
Notes:
* These states had missing or invalid subsidy amount data for more than 30 percent of their cases for at least one reporting year. Source: AFCARS 1999-2001, adoption data. |
|||||||||
Comparison of Adoption Subsidy Median Amounts with Foster Care Subsidy Median Amounts by Age, by State, FY 2001
| State | Median Monthly Subsidy AD/FC (%) | |||||||||||||
|---|---|---|---|---|---|---|---|---|---|---|---|---|---|---|
| Total | Ages 0 to 5 | Ages 6 to 12 | Ages 13 to 17 | |||||||||||
| Adoption N | Median Adoption Subsidy | Foster Care N |
Median Foster Care Payment | Ratio | Median Adoption Subsidy | Median Foster Care Payment | Ratio | Median Adoption Subsidy | Median Foster Care Payment | Ratio | Median Adoption Subsidy | Median Foster Care Payment | Ratio | |
| Alabama | 108 | 241 | 1,311 | 241 | 1.0 | 241 | 241 | 1.0 | 241 | 241 | 1.0 | 241 | 241 | 1.0 |
| Alaska | 142 | 695 | 0 | 0 | 670 | 0 | 732 | 0 | 689 | 0 | ||||
| Arizona | 426 | 479 | 1,636 | 358 | 1.3 | 479 | 358 | 1.3 | 479 | 358 | 1.3 | 479 | 418 | 1.1 |
| Arkansas | 203 | 425 | 1,162 | 425 | 1.0 | 400 | 400 | 1.0 | 425 | 425 | 1.0 | 475 | 450 | 1.1 |
| California | 4,718 | 441 | 18,456 | 981 | 0.4 | 405 | 631 | 0.6 | 539 | 1,264 | 0.4 | 581 | 1,537 | 0.4 |
| Colorado | 374 | 510 | 2,229 | 1,604 | 0.3 | 461 | 1,237 | 0.4 | 601 | 1,604 | 0.4 | 641 | 2,046 | 0.3 |
| Connecticut | 64 | 659 | 5,434 | 1,624 | 0.4 | 638 | 998 | 0.6 | 659 | 2,008 | 0.3 | 727 | 3,087 | 0.2 |
| Delaware | 105 | 479 | 460 | 518 | 0.9 | 479 | 457 | 1.0 | 518 | 518 | 1.0 | 543 | 573 | 0.9 |
| District of Columbia | 107 | 741 | 68 | 717 | 1.0 | 741 | 717 | 1.0 | 741 | 717 | 1.0 | 805 | 2,958 | 0.3 |
| Florida | 612 | 296 | 5,375 | 380 | 0.8 | 295 | 369 | 0.8 | 304 | 380 | 0.8 | 364 | 455 | 0.8 |
| Georgia | 370 | 411 | 4,388 | 1,300 | 0.3 | 388 | 1,275 | 0.3 | 411 | 1,350 | 0.3 | 433 | 1,425 | 0.3 |
| Hawaii | 100 | 529 | 1,014 | 529 | 1.0 | 529 | 529 | 1.0 | 529 | 529 | 1.0 | 529 | 529 | 1.0 |
| Idaho | 79 | 275 | 599 | 301 | 0.9 | 251 | 251 | 1.0 | 425 | 303 | 1.4 | 410 | 404 | 1.0 |
| Illinois | 3,916 | 410 | 7,083 | 444 | 0.9 | 369 | 369 | 1.0 | 410 | 444 | 0.9 | 444 | 771 | 0.6 |
| Indiana* | 254 | 177 | 3,096 | 540 | 0.3 | 166 | 510 | 0.3 | 171 | 540 | 0.3 | 226 | 600 | 0.4 |
| Iowa | 504 | 856 | 2,505 | 698 | 1.2 | 587 | 646 | 0.9 | 904 | 706 | 1.3 | 971 | 850 | 1.1 |
| Kansas | 251 | 400 | 1,062 | 1,997 | 0.2 | 300 | 1,958 | 0.2 | 400 | 1,997 | 0.2 | 400 | 1,958 | 0.2 |
| Kentucky | 364 | 600 | 2,573 | 591 | 1.0 | 600 | 591 | 1.0 | 600 | 591 | 1.0 | 722 | 717 | 1.0 |
| Louisiana | 398 | 361 | 2,606 | 557 | 0.6 | 283 | 420 | 0.7 | 395 | 603 | 0.7 | 443 | 755 | 0.6 |
| Maine | 323 | 650 | 1,551 | 1,020 | 0.6 | 581 | 548 | 1.1 | 798 | 1,083 | 0.7 | 788 | 1,779 | 0.4 |
| Maryland | 477 | 650 | 3,733 | 535 | 1.2 | 650 | 535 | 1.2 | 650 | 535 | 1.2 | 550 | 550 | 1.0 |
| Massachusetts | 638 | 471 | 859 | 471 | 1.0 | 454 | 454 | 1.0 | 471 | 471 | 1.0 | 522 | 522 | 1.0 |
| Michigan | 1,897 | 731 | 546 | 733 | 1.0 | 591 | 583 | 1.0 | 743 | 733 | 1.0 | 876 | 999 | 0.9 |
| Minnesota | 412 | 427 | 3,381 | 983 | 0.4 | 397 | 754 | 0.5 | 552 | 983 | 0.6 | 612 | 1,172 | 0.5 |
| Mississippi* | 0 | 0 | 9 | 4,912 | 0 | 4,870 | 0 | 5,950 | 0 | 8,881 | ||||
| Missouri | 790 | 275 | 4,004 | 277 | 1.0 | 225 | 227 | 1.0 | 275 | 277 | 1.0 | 304 | 307 | 1.0 |
| Montana | 195 | 408 | 635 | 451 | 0.9 | 367 | 451 | 0.8 | 400 | 451 | 0.9 | 510 | 543 | 0.9 |
| Nebraska | 5 | 544 | 1,206 | 452 | 1.2 | 525 | 222 | 2.4 | 827 | 652 | 1.3 | 390 | 727 | 0.5 |
| Nevada* | ||||||||||||||
| New Hampshire | 77 | 552 | 452 | 552 | 1.0 | 535 | 380 | 1.4 | 600 | 597 | 1.0 | 708 | 709 | 1.0 |
| New Jersey | 899 | 437 | 4,271 | 462 | 0.9 | 412 | 412 | 1.0 | 457 | 464 | 1.0 | 516 | 516 | 1.0 |
| New Mexico* | 82 | 503 | 809 | 467 | 1.1 | 487 | 408 | 1.2 | 520 | 487 | 1.1 | 545 | 546 | 1.0 |
| New York* | ||||||||||||||
| North Carolina | 883 | 350 | 3,822 | 365 | 1.0 | 315 | 315 | 1.0 | 365 | 365 | 1.0 | 415 | 415 | 1.0 |
| North Dakota | 91 | 402 | 511 | 391 | 1.0 | 396 | 346 | 1.1 | 388 | 391 | 1.0 | 558 | 510 | 1.1 |
| Ohio | 1,008 | 544 | 9,097 | 590 | 0.9 | 544 | 565 | 1.0 | 560 | 595 | 0.9 | 685 | 821 | 0.8 |
| Oklahoma | 503 | 360 | 2,956 | 360 | 1.0 | 300 | 300 | 1.0 | 360 | 360 | 1.0 | 420 | 420 | 1.0 |
| Oregon | 659 | 475 | 2,390 | 590 | 0.8 | 369 | 369 | 1.0 | 526 | 770 | 0.7 | 555 | 858 | 0.6 |
| Pennsylvania | 1,303 | 510 | 9,454 | 1,200 | 0.4 | 450 | 1,038 | 0.4 | 540 | 1,344 | 0.4 | 600 | 1,392 | 0.4 |
| Rhode Island | 185 | 413 | 504 | 321 | 1.3 | 395 | 321 | 1.2 | 428 | 299 | 1.4 | 422 | 474 | 0.9 |
| South Carolina | 360 | 359 | 2,144 | 359 | 1.0 | 332 | 332 | 1.0 | 359 | 359 | 1.0 | 425 | 425 | 1.0 |
| South Dakota | 50 | 390 | 518 | 397 | 1.0 | 390 | 397 | 1.0 | 390 | 397 | 1.0 | 402 | 477 | 0.8 |
| Tennessee | 482 | 402 | 3,312 | 397 | 1.0 | 362 | 358 | 1.0 | 313 | 313 | 1.0 | 422 | 460 | 0.9 |
| Texas | 1,207 | 516 | 769 | 2,013 | 0.3 | 516 | 835 | 0.6 | 516 | 2,013 | 0.3 | 516 | 2,013 | 0.3 |
| Utah | 244 | 300 | 1,131 | 390 | 0.8 | 270 | 390 | 0.7 | 348 | 403 | 0.9 | 411 | 643 | 0.6 |
| Vermont | 75 | 628 | 729 | 764 | 0.8 | 511 | 501 | 1.0 | 722 | 771 | 0.9 | 855 | 990 | 0.9 |
| Virginia | 403 | 344 | 3,255 | 344 | 1.0 | 294 | 294 | 1.0 | 344 | 344 | 1.0 | 436 | 436 | 1.0 |
| Washington | 1,081 | 570 | 0 | 0 | 530 | 0 | 611 | 0 | 717 | 0 | ||||
| West Virginia | 236 | 400 | 666 | 690 | 0.6 | 400 | 570 | 0.7 | 400 | 690 | 0.6 | 593 | 1,186 | 0.5 |
| Wisconsin | 605 | 689 | 990 | 555 | 1.2 | 518 | 410 | 1.3 | 864 | 615 | 1.4 | 1,084 | 941 | 1.2 |
| Wyoming | 32 | 399 | 110 | 400 | 1.0 | 399 | 400 | 1.0 | 399 | 400 | 1.0 | 399 | 420 | 1.0 |
| Puerto Rico | 23 | 174 | 0 | 0 | 207 | 0 | 174 | 0 | 207 | 0 | ||||
| Total | 28,320 | 453 | 124,871 | 570 | 0.8 | 412 | 487 | 0.8 | 480 | 594 | 0.8 | 522 | 775 | 0.7 |
Notes:
* These states had missing or invalid data for more than 30 percent of their cases in either the adoption or foster care analysis. Source: AFCARS 2001, adoption and foster care data. |
||||||||||||||
Adoption Rates, Adoption Subsidy Rate, and Median Adoption Subsidy Amount, by State, FY 2001
| State | Same-Year Foster Care Adoption Rate |
Adoption Subsidy Rate | Median Monthly Adoption Subsidy |
|||
|---|---|---|---|---|---|---|
| Eligible for Adoption | (%) | Adopted Children | (%) | Children with Subsidy | ($) | |
| Alabama | 1,439 | 12.5 | 237 | 46.8 | 111 | 241 |
| Alaska | 978 | 25.7 | 278 | 97.5 | 271 | 650 |
| Arizona | 2,715 | 30.4 | 938 | 94.3 | 687 | 479 |
| Arkansas | 1,170 | 29.1 | 361 | 89.2 | 262 | 425 |
| California | 10,776 | 26.6 | 9,822 | 91.5 | 8,982 | 441 |
| Colorado | 2,092 | 19.7 | 596 | 92.1 | 515 | 510 |
| Connecticut | 1,353 | 23.4 | 444 | 16.4 | 73 | 659 |
| Delaware | 478 | 24.5 | 115 | 97.4 | 112 | 479 |
| District of Columbia | 1,197 | 4.2 | 227 | 57.3 | 130 | 741 |
| Florida | 9,553 | 15.4 | 1,748 | 64.2 | 1,123 | 300 |
| Georgia | 3,872 | 25 | 896 | 48.3 | 412 | 411 |
| Hawaii | 1,127 | 23 | 260 | 83.1 | 216 | 529 |
| Idaho | 343 | 32.1 | 123 | 84.6 | 104 | 275 |
| Illinois | 15,851 | 25 | 4,079 | 96.2 | 3,917 | 410 |
| Indiana* | 3,593 | 30.3 | 867 | 51.8 | 294 | 171 |
| Iowa | 1,830 | 35.8 | 659 | 76.5 | 504 | 856 |
| Kansas | 2,095 | 0.9 | 423 | 72.8 | 295 | 400 |
| Kentucky | 2,312 | 22 | 571 | 70.8 | 364 | 600 |
| Louisiana | 1,963 | 23.8 | 470 | 91.1 | 428 | 353 |
| Maine | 1,292 | 21.1 | 363 | 99.2 | 341 | 650 |
| Maryland | 3,985 | 14.6 | 812 | 98.4 | 796 | 543 |
| Massachusetts | 3,835 | 22 | 721 | 89.3 | 644 | 471 |
| Michigan | 8,487 | 7.7 | 2,975 | 96.4 | 2,868 | 591 |
| Minnesota | 2,213 | 25.2 | 565 | 99.3 | 561 | 427 |
| Mississippi* | 702 | 34.9 | 264 | 81.4 | ||
| Missouri | 4,128 | 26.1 | 1,091 | 96.4 | 1,052 | 275 |
| Montana | 1,080 | 26.7 | 275 | 90.2 | 248 | 408 |
| Nebraska | 585 | 2.6 | 292 | 68.8 | 201 | 527 |
| Nevada* | 136 | 5.9 | 243 | 94.7 | ||
| New Hampshire | 285 | 26.7 | 95 | 88.4 | 79 | 552 |
| New Jersey | 6,519 | 13.6 | 1,025 | 90.1 | 899 | 437 |
| New Mexico* | 941 | 28.6 | 369 | 89.4 | 135 | 503 |
| New York* | 18,545 | 20.7 | 3,888 | 97.9 | ||
| North Carolina | 4,754 | 27.2 | 1,298 | 94.2 | 1,170 | 365 |
| North Dakota | 399 | 21.6 | 145 | 62.8 | 91 | 402 |
| Ohio | 7,786 | 24.4 | 2,225 | 96 | 2,116 | 500 |
| Oklahoma | 3,377 | 27.1 | 955 | 99.5 | 899 | 360 |
| Oregon | 3,836 | 27.9 | 1,071 | 99 | 1,038 | 400 |
| Pennsylvania | 6,588 | 26.2 | 1,525 | 90.2 | 1,368 | 510 |
| Rhode Island | 582 | 29 | 267 | 99.6 | 265 | 407 |
| South Carolina | 2,743 | 14.7 | 364 | 100 | 364 | 359 |
| South Dakota | 551 | 22.7 | 97 | 64.9 | 63 | 390 |
| Tennessee | 2,910 | 21.9 | 638 | 81.2 | 517 | 402 |
| Texas | 10,676 | 21.3 | 2,317 | 72.6 | 1,681 | 516 |
| Utah | 704 | 49.3 | 348 | 77.3 | 266 | 300 |
| Vermont | 381 | 22.3 | 116 | 85.3 | 99 | 549 |
| Virginia | 2,376 | 17.6 | 493 | 95.5 | 424 | 344 |
| Washington | 3,569 | 31.7 | 1,203 | 97.7 | 1,107 | 572 |
| West Virginia | 1,082 | 28.3 | 362 | 91.7 | 277 | 400 |
| Wisconsin | 1,525 | 41 | 753 | 99.2 | 696 | 639 |
| Wyoming | 139 | 18.7 | 46 | 93.5 | 39 | 399 |
| Puerto Rico | 423 | 9.7 | 250 | 13.2 | 31 | 174 |
| Total | 171,871 | 22.1 | 50,565 | 88.1 | 39,135 | 444 |
|
Notes:
* These states had missing or invalid subsidy amount data for more than 30 percent of their cases. Source: AFCARS 2001, adoption and foster care data. |
||||||