
Prepared under Contract from
the Agency for Healthcare Research and Quality and
the Office of the Assistant Secretary for Planning and Evaluation
Purchase Order HHSP233200800278A
Judy Ng, PhD
Sarah Hudson Scholle, MPH, DrPH
National Committee for Quality Assurance
Washington, DC
ABSTRACT
This report discusses disparities in care of baby boom patients with diabetes who become eligible for Medicare. It also examines disparities related to cardiovascular conditions because of their prevalence among older adults and their association with diabetes. Specifically, this report contains 1.) an overarching conceptual model for disparities in midlife adults (45–64) vs. older adults (>65); 2.) key findings from the literature on disparities in health care quality among midlife and older adults, including disparities based on gender, race/ethnicity and socioeconomic factors; and 3.) an analysis of data from the National Medical Expenditures Panel Survey, to explore whether patterns of disparities differ between midlife and older adults, guided by specific research questions. A discussion of policy implications and recommendations for future directions for research into disparities of care, particularly among older adults, is also included.
Material contained in this publication is in the public domain and may be reproduced, fully or partially, without permission of the Federal Government. The courtesy of attribution is requested. The recommended citation follows:
Office of Health Policy, ASPE(2010) Disparities in Quality of Care for Midlife Adults (Ages 45–64) Versus Older Adults (Ages >65)
Washington, DC: U.S. Department of Health and Human Services, Office of the Assistant Secretary for Planning and Evaluation.
Executive Summary
In 2011, the first of the post-World War II "baby boom"; generation will reach age 65 and become eligible for Medicare. The cost implications of the entry of baby boomers into Medicare have been widely discussed, but less attention has been paid to the implications for health care quality. This report discusses disparities in care of baby boom patients with diabetes who become eligible for Medicare. It also examines disparities related to cardiovascular conditions because of their prevalence among older adults and their association with diabetes. Specifically, this report contains 1.) an overarching conceptual model for disparities in midlife adults (45–64) vs. older adults (>65); 2.) key findings from the literature on disparities in health care quality among midlife and older adults, including disparities based on gender, race/ethnicity and socioeconomic factors; and 3.) an analysis of data from the National Medical Expenditures Panel Survey, to explore whether patterns of disparities differ between midlife and older adults, guided by specific research questions. A discussion of policy implications and recommendations for future directions for research into disparities of care, particularly among older adults, is also included. Key outcomes and findings from this project:
- A conceptual model for examining disparities in quality of care among older adults, reflecting a multilevel approach and documenting individual and system wide factors that may contribute to quality of care along domains delineated by the Institute of Medicine (IOM): safe, equitable, effective, patient-centered, timely/accessible, efficient care. A review of existing measures available from national data sources indicates that effectiveness of care measures are well established, but more measures are needed to address safety, patient-centeredness and efficiency of care domains.
- A review of the literature on disparities in care suggests that while race/ethnicity has been a major focus of most disparity studies, fewer studies have reported on potential care disparities based on factors such as gender or socioeconomic status. Furthermore, few studies have examined whether the pattern of disparity is consistent across the midlife and older age groups. This is important because both age groups have a high prevalence of chronic conditions, yet have different health insurance coverage status, which may affect care. The literature also suggests that the most striking racial/ethnic disparities occur in outcome measures such as cholesterol or blood pressure control, but these studies often did not address disparities related to IOM quality domains and did not account for insurance coverage status.
- A quantitative analysis of quality of care measures from the National Medical Expenditures Panel Survey (MEPS) was conducted to understand disparities based on individual factors beyond race/ethnicity and to assess outcomes related to quality of care domains considered important by the IOM. In particular, a better understanding of the role of health insurance coverage on disparities in quality was sought. Specific research questions that guided the analysis were:
- What are the patterns of gender, racial/ethnic and socioeconomic disparities in effectiveness of care, access to care and patient-centeredness of care among midlife and older diabetes and cardiovascular condition patients?
- What are the multivariate associations of gender and health insurance status for effectiveness of care, access to care and patient-centeredness of care?
In terms of the first research question, analysis indicates that midlife respondents ages 45–64 more often reported delays in care than Medicare-eligible respondents 65 and older, with women reporting access to care problems more often than men. Non-Hispanic Whites were more likely to report problems in access to care compared to African Americans/Blacks ("Blacks";) or Hispanics. The findings also indicate that there were racial/ethnic differences in the effectiveness of care measures that favored Whites, but there were few statistically significant gender differences in effectiveness of care measures. There were statistically significant differences in patient-centeredness measures, but the magnitude of effect was generally small and inconsistent
Findings from the analysis addressing the second research question indicate that the observed patterns related to gender generally persisted, even after controlling for key covariates in multivariate analyses. Findings also suggest that health insurance status—which differs among midlife and older adults—also plays a significant role in the quality of care, even in the presence of other individual factors. Specifically, women were significantly more likely to report access to care problems than men were. However, there were few significant gender differences for effectiveness of care or patient-centeredness measures. The midlife adult population, especially the uninsured, demonstrated more access to care issues than did the Medicare-covered older adult population, but there were few significant health insurance differences for effectiveness of care or patient-centeredness
This report highlights differences in access to care based on gender and health insurance status, and offers insight into whether the extent of disparities varies among midlife and older age groups with differing insurance coverage. Findings suggest that gender disparities persist in access to care, and that uninsured midlife women have more issues with access to care. Findings also suggest that Medicare coverage may play a role in quality of care, as it may mitigate access to care problems among diabetes and cardiovascular condition patients who age from midlife to older adults. Policymakers could consider extending health care coverage to uninsured midlife adults with chronic conditions, in order to mitigate access problems that may become exacerbated as the population becomes Medicare eligible. Future research should consider the causes of disparities in access to care, and take into account the role of health insurance coverage in mitigating disparities.
1.0 Introduction
In 2011, the first of the post-World War II "baby boom"; generation will reach age 65 and become eligible for Medicare. The cost implications of the entry of baby boomers into Medicare have been widely discussed (Keehan et al 2008) but less attention has been paid to the implications for health care quality. The health insurance characteristics of the United States population changes sharply at age 65, when most individuals become eligible for Medicare, yet evidence on the health effects of Medicare is surprisingly limited (Card et al 2007). Studies have found that use of health care services increases once individuals become eligible for Medicare (McWilliams et al 2007), and disparities in the use of these services by race and income have diminished since Medicare's implementation (National Academy of Social Insurance [NASI] 2006). However, the impact of these additional services on quality of health care and outcomes is less clear. Studies of mortality rates before and after the introduction of Medicare show minimal program impact (Card et al 2007; Finkelstein and McKnight 2005). Studies focusing on use of services before and after Medicare eligibility do not clearly identify whether increased service use translates
Improvements in quality of care on the onset of Medicare eligibility may produce substantial health benefits and improved health outcomes, such as long-term reductions in health care expenditures and healthier populations with less intensive health care needs, but differences in quality of care before and after the onset of Medicare eligibility have not been widely examined. Thus, Medicare's effect on quality
Recognizing that Medicare has had a well-documented effect on reducing disparities in access to care by race and income, the purpose of this report is to better understand how disparities in care quality—based on gender, race/ethnicity, education, income or other socioeconomic factors—may affect the health care system as baby boomers enter
- A conceptual framework for monitoring quality of care disparities for midlife adults (ages 45–64) and older adults (ages >65), based on gender, health insurance status, race/ ethnicity, education, income and other key socioeconomic factors. To maximize its applicability, this is a broad-based, non-disease-specific framework that anchors its definition of quality of care in the IOM's domains for quality of care: safe, effective, patient-centered, timely/accessible, equitable and efficient.
- A summary of key findings from the literature on disparities in quality of care among midlife and older adults, with a primary focus on diabetes and a secondary focus on cardiovascular conditions and other diabetes-related conditions. The literature review considered disparities based on gender, race/ethnicity, education, insurance and socioeconomic status, and reflecting the IOM's domains of safe, effective, patient-centered, timely/accessible and efficient care.
- Quantitative analyses to explore patterns of quality of care disparities among midlife and older adults. This report provides new evidence on effectiveness, timeliness and patient-centeredness of care for those with diabetes or cardiovascular disease. Two separate analyses were conducted. The first analysis examined bivariate patterns in quality of care by gender and race/ethnicity. For a better understanding of gender differences and the explicit role of health insurance coverage, a second analysis examined both bivariate and multivariate associations of quality of care to gender and health insurance status.
- A discussion of the findings, policy implications and recommendations for research in quality of care among older adults.
This report focuses on diabetes because it is one of the most prevalent and costly conditions in older adults (Congressional Budget Office 2005; Hogan et al 2001). Measurement of quality care in diabetes is fairly advanced, with numerous well-established diabetes quality of care indicators existing in large, national databases. Furthermore, diabetes is an ideal condition to include in a quality of care disparities study because the negative health outcomes associated with the disease can be minimized through effective management and quality care. A secondary focus on cardiovascular conditions and disparities in depression care are also included because, like
diabetes, cardiovascular conditions are also prevalent and costly among older adults and are associated with diabetes. Measurement of quality of care in cardiovascular conditions is also fairly advanced, with well-established indicators. Depression quality of care indicators are relatively less well developed, but depression is also associated with diabetes and is a costly condition in older adults (refer to Frayne et al 2005).
This report follows a "three-study"; format and is written as three separate manuscripts (presented here as Chapters 2–4) intended as stand-alone chapters. Chapter 2 (Manuscript 1) presents a conceptual framework and reviews the current literature as it relates to disparities in quality of care among midlife and older adults, with a primary focus on diabetes and a secondary focus on cardiovascular and other related conditions. Chapter 3 (Manuscript 2) presents a quantitative analysis characterizing bivariate associations of diabetes and cardiovascular care quality to gender and race/ethnicity. Chapter 4 (Manuscript 3) presents a quantitative analysis characterizing both bivariate and multivariate associations of care quality to gender and health insurance status. While there is, by necessity, some overlap in the research methods used in Chapters 3 and 4, the report attempts to minimize repetition by referring to previous relevant
Chapter 5 discusses gaps in the knowledge base, summarizes key findings presented in the previous chapters and presents key policy recommendations.
2.0 Conceptual Framework and Literature Review: Disparities in Diabetes and Other Priority Conditions
Racial/ethnic disparities in health outcomes exist among midlife and older adults. These include disparities in mortality and quality of care associated with diabetes, cardiovascular disease and other chronic conditions (Gee and Payne-Sturges 2004; U.S. Department of Health and Human Services [HHS] 2000). While it is not always clear why disparities occur, it is widely acknowledged that various factors may play an important role, both at the individual level and at the system wide (ecological) level. This chapter presents a conceptual framework and literature review examining disparities in quality of care.
The conceptual framework emphasizes the individual and system-wide (ecological) level factors that may play a role in quality of care disparities, and illustrates these factors as they relate to six quality domains delineated by the Institute of Medicine (IOM) in its report, "Crossing the Quality Chasm"; (2001). The literature review illustrates these themes with regard to disparity, using diabetes as a prominent condition affecting Americans. The literature review documents well-known disparities in diabetes prevalence, complications and quality of care (Adams et al 2008; Wong et al 2003). The review also documents the small but growing literature on interventions—targeting both individual and system-wide factors in the conceptual framework—that may mitigate disparities. Finally, since diabetes is also linked to other important conditions, such as cardiovascular disease and depression (American Diabetes Association 2008b, 2008c; Egede et al 2005), we conclude our literature review with important examples of disparities from cardiovascular disease and
It should be noted that the literature review focuses on racial and ethnic disparities in diabetes because the research largely focuses on these disparities and pays less attention to other factors. Nevertheless, the review provides examples of what is known about disparities based on other factors illustrated in the conceptual model, such as gender, health
2.1 Conceptual Framework
Figure 1 presents the overarching conceptual model for understanding disparities in quality of care. This model is designed specifically to reflect a multilevel approach, documenting individual and system-wide factors that may contribute to quality of care along domains delineated by the IOM. The IOM has defined six qualities of care domains: safe, equitable, effective, patient-centered, timely/accessible and efficient care. It regards the overarching quality domain to be equity in care, or care that "does not vary in quality because of personal characteristics such as gender, ethnicity, geographic location, and socioeconomic status"; (Beal et al 2004; IOM 2001). Disparities in care may thus be viewed as care that is not equitable because it varies based on personal characteristics, rather than clinical need. While there is evidence of inequity or disparity based on various personal characteristics, most published reports emphasize race/ethnicity-based disparities in care. The remaining quality domains are defined by the IOM as follows: safe (avoiding injuries to patients from care that is intended to help them); effective (providing services based on scientific knowledge to all who could benefit and refraining from providing services to those not likely to benefit); patient centered (providing care that is respectful of and responsive to individual patient preferences, needs and values, and ensuring that patient values guide all clinical decisions); timely/ accessible(reducing wait times and sometimes harmful delays for both those who receive and those who give care); and efficient (avoiding
The conceptual model presented here suggests relationships between system-level (ecological) and individual-level factors. Because this report focuses on midlife and older adults who are entering or who are already on Medicare, the role of health insurance coverage is key, and thus explicitly addressed in the model. To maximize its applicability, the model is broad based and non-disease-specific. It emphasizes both ecological components (top of Figure 1) and individual components (bottom of Figure 1). The ecological components include the presence of insurance and the organization of care processes under a health care organization or health insurance program, while individual components include sociodemographic factors and health.
Figure 1 illustrates the two levels of components in detail and their relation to IOM domains of quality care. The model has been simplified by separating individual components from ecological level components, though many of these components are interrelated. For example, a health organization/insurance's business practices and care processes may directly influence quality of care (e.g., differences in select Health Effectiveness and Data Information Set [HEDIS®1] outcomes based on gender, race/ethnicity or other factors), or may influence an individual's health status or use of services, which in turn may influence outcomes. Conversely, an individual's health status may also partly determine a health care insurer or organization's business practices and care processes (e.g., managed care plans with a high proportion of individuals in poor health may provide care or recruit members differently from plans with mostly healthy individuals). In this framework, both individual and ecological components may account for quality
The model also shows that personal characteristics—such as age, gender, race/ethnicity or socioeconomic status—are linked with quality of care outcomes. However, even among persons with similar personal characteristics, differences in "exposure"; to other risks at either the personal level (e.g., health risks) or the ecological level (e.g., insured vs. not insured, achieving "universal insurance status"; by turning 65 years of age and being on Medicare vs. having no universal insurance) can influence quality of care. For example, racial/ethnic disparities in care quality among midlife adults (45–64) and older adults (>65) enrolled in health care plans may be influenced by adverse plan care processes and practices, but the deleterious effect of any adverse process or practice may be different for a midlife adult who transitions between uninsured and insured health insurance status (e.g., due to job loss and gain), than for an older adult who has consistent, virtually-universal health insurance coverage via Medicare.
_________
1HEDIS® is a registered trademark of the National Committee for Quality Assurance (NCQA).
Table 1 provides an example of the current state of quality of care indicators that address IOM domains. It identifies and categorizes key quality indicators, drawn from national databases, into the IOM domains of safe, effective, patient-centered, timely/accessible and efficient care. Equity is the overarching domain, since inequity in care based on personal characteristics may be found among all the other quality domains (e.g., differences in care based on gender may be found among safety and patient-centered quality of care measures). For effectiveness of care measures, specific examples of quality indicators from diabetes and cardiovascular conditions are used. This general categorization approach has been applied in the area of quality indicators for children's health care (Beal et al 2004), but has not been applied to quality indicators for care among older adults. Identifying and categorizing key examples of quality of care indicators for older adults allows a systematic and easier identification of areas requiring additional development efforts. For example, Table 1 illustrates the clear paucity of existing efficiency indicators, while also showing the well-developed body of effectiveness indicators in quality
2.2 Disparities in Diabetes Prevalence Rates
Diabetes, a priority condition in the U.S., is a group of diseases characterized by high blood glucose levels, resulting from defects in insulin secretion or action (Centers for Disease Control and Prevention [CDC] 2007a). It is the sixth leading cause of death in the U.S., and incurs annual medical costs of over $100 billion (Agency for Healthcare Research and Quality [AHRQ] 2007; Caravalho and Saylor 2000; Peek et al 2007). More than 20.8 million people are estimated to have diabetes, and prevalence rates have increased rapidly in the past decade (Peek et al 2007).
Racial/ethnic disparities in diabetes prevalence rates are well documented. Based on data from the CDC, Blacks are 2.2 times as likely to have diabetes as Whites (Office of Minority Health [OMH] 2008a, 2008b). Hispanics are also 1.5 times as likely to have diabetes as non-Hispanic Whites (OMH 2008c, Peek et al 2007). Recent CDC data indicate that Native Americans are, on average, 2.3 times as likely as Whites are to have diabetes, although regional data indicate that the prevalence can be much higher for certain groups (OMH 2008d). In contrast, Asian Americans generally have the same rate of diabetes as Whites (OMH 2008e).
Published reports of differences in diabetes rates that reflect individual factors beyond race/ethnicity (as illustrated in the conceptual model) are more limited, although there is some evidence of gender differences. For example, a CDC report indicates that adult women experience lower prevalence rates of diabetes overall than men (CDC 2007a; American Diabetes Association 2008a), but the pattern differs according to race and ethnicity: Blacks, younger and older women (≤44, ≥65) experience higher diabetes rates than men in the same age groups (OMH 2008b). Among Hispanics, women have higher age-adjusted rates of diabetes overall than men (OMH 2008c).
Evidence of gender differences in diabetes rates based on age indicates differences between midlife adults (45–64) and older, Medicare-insured adults (>65). For example, among Black adults, the prevalence of diabetes is lowest among midlife adults, but highest among older adults ages 65–74 (OMH 2008a). The overall trend of higher diabetes rates among Black women than Black men is also reversed among midlife adults, where the prevalence of diabetes is slightly higher in men than in women.
2.3 Disparities in Diabetes Complications
Diabetes can lead to serious complications, including blindness, cardiovascular disease, kidney damage and lower-limb amputations, although proper management and quality care can reduce the risk of complications (CDC 2007a). The majority of disparities literature on diabetes complications focuses on race and ethnicity differences and pays less attention to other factors, such as income. In general, non-White racial and ethnic minorities with diabetes experience higher rates of complications and death from diabetes than Whites. For example, Blacks have 2–4 times the rate of end stage renal disease, blindness, amputations and amputation-related mortality than Whites (Lanting et al 2005; OMH 2008a; Peek et al 2007). Hispanics are 1.6 times as likely as non-Hispanic Whites to die from diabetes (OMH 2008c), and Hispanics have higher rates of renal disease, retinopathy and lower-limb amputations than non-Hispanic Whites (AHRQ 2007; Lanting et al 2005; Peek et al 2007). Among Native Americans, diabetes-related mortality is 2.7 times that of Whites (Peek et al 2007), although this rate can vary based on Native American subgroup and region. In contrast, Asian Americans are 20 percent less likely to die from diabetes than Whites (OMH 2008e), on average, and
The few disparities reports based on other individual factors, such as gender and socioeconomic status, did not always exhibit consistent findings. For example, the OMH reported that White, Black and Hispanic women with diabetes have higher rates of obesity than men (OMH 2008a–c). Another study found that women and men have similar rates of hospital admissions for uncontrolled diabetes, and rates for lower extremity amputations were higher for men (Correa-de-Araujo et al 2006). Using 2001–2004 data, AHRQ also found socioeconomic differences: lower-income individuals were likelier to experience lower-limb amputations than higher-income
Data are limited for disparities in diabetes complications based on age. Few studies stratify results by midlife and older adults, who have very different health insurance coverage situations that may affect outcomes. One recent study, the 2007 State of Diabetes Complications in America Report, reported some differences in diabetes complications between midlife adults (45–64) and older adults (>65). The report found that the prevalence of diabetes complications among those with diagnosed diabetes was higher in the older adults than in the midlife adults. These statistics, however, were not stratified by sociodemographic factors, and thus the report did not provide information on whether the extent of disparities in diabetes complications—based on factors of gender, race or socioeconomic status—differed among these two age groups (American Association of Clinical Endocrinologists
2.4 Disparities in Diabetes Quality of Care
Defining a Health Care Quality Measure
Although many measures are available to assess quality of care, this report focuses on clinical performance measures. Previous authors have defined clinical performance measures as
"tools that assess the delivery of clinical services…[They] estimate the extent to which a [health care] provider delivers clinical services that are appropriate for the patients' condition; provides the clinical services safely, competently, and in the appropriate time frame; and achieves the desired outcomes in terms of those aspects of patient health and satisfaction that can be affected by clinical services"; (Beal et al 2004;
Clinical performance measures can address processes, outcomes, access and patient experiences. There is no standardized set of categories for evaluating quality of care, but the categories developed by Avedis Donabedian for evaluating quality of care includes an assessment of structure, process and outcomes, and are widely used today (AHRQ 2008). Structural measures are not as strongly recommended by the IOM because there is less evidence of an association between structure and outcome (Beal et al 2004). Thus, this literature review focuses on process and outcomes of care measures for the priority condition of diabetes and, to a lesser extent, for cardiovascular conditions and depression. Process and outcomes measures can be used to measure any IOM quality domain of equity (the overarching domain), safety, effectiveness, timeliness/accessibility, patient-centeredness and efficiency of care (AHRQ 2008).
AHRQ defines process of care measures as those assessing whether "appropriate physician and other provider activities are carried out to deliver care"; (e.g., percentage of females of specified age receiving mammography; percentage of patients with asthma for whom appropriate medications are ordered [AHRQ 2008]). Outcomes of care measures assess "results of physician and other provider activities"; (e.g., experience or level of satisfaction with care; test results within a range indicating
The remainder of this chapter describes important examples of disparities based on race/ethnicity, gender or other individual factors, in diabetes measures that reflect IOM quality domains. Because the literature is dominated by studies of racial disparities and effectiveness of care measures, this review is focused on these aspects.
- Effectiveness of Care
Numerous studies of disparities in diabetes effectiveness of care are based on race and ethnicity. Evidence shows that racial/ethnic minorities receive suboptimal quality of care across an array of diabetes quality measures, compared to Whites (Harris 1999; IOM 2002). Few studies examine quality of care disparities based on other factors, such as gender or socioeconomic status. Moreover, there are limited disparities studies based on age, particularly studies on age-based differences for midlife vs. older adults.
Effective care of diabetes includes receipt of appropriate process of care services, such as lipid and hemoglobin A1c (HbA1c) testing or control; preventive care (e.g., adult vaccinations); and eye and foot examinations. Reviews of effectiveness of care measures in diabetes have found numerous differences among non-White racial/ethnic minorities compared to Whites (AHRQ 2007; Harris 1999; IOM 2002; Peek et al 2007). There is some evidence that these disparities persist even after accounting for health care access and insurance. For example, Puerto Rican adults with diabetes in New York City are less likely than Whites to receive annual HbA1c testing, cholesterol testing, hypertensive medications and pneumococcal vaccinations, despite having equal access to health care, as measured by insurance, medical home and physician visits (Hosler and Melnik 2005; Peek et al 2007). Similarly, in the 2008 Healthcare Disparities Report, AHRQ found that from 2002–2004, Hispanics consistently lagged behind Whites in receipt of recommended diabetes services, including HbA1c testing, eye examination and foot examination. Findings from a study of Medicare managed care plans also demonstrated that plans with larger numbers of racial minority patients have lower effectiveness of care across several diabetes quality measures relative to plans with fewer minority patients (Schneider et al 2002; Trivedi et al 2005, 2006). Two meta-analyses examining data on HbA1c control in Black, Hispanic and White persons with diabetes found that Blacks and Hispanics exhibited consistently higher levels of HbA1c than Whites (Kirk
Disparities in diabetes effectiveness of care have been largely reported according to race/ethnicity, with relatively fewer reports examining disparities based on gender and socioeconomic status. In addition, disparities based on gender are not consistent in the literature. For example, a 2007 issue of the peer-reviewed journal, Women's Health Issues, dedicated to gender disparities on clinical performance measures in effectiveness of care for diabetes and cardiovascular disease, found that women sometimes received lower quality of diabetes care than men, but sometimes received about the same or better quality of diabetes care than men. One study from that issue found that older women with diabetes in Medicare had higher rates of eye examinations but lower rates of lipid screening and nephropathy monitoring than men (Bird et al 2007). Another study found that women <65 with diabetes had rates of cholesterol screening that were about the same as men, with a reported difference of only 1 percentage point (Chou et al 2007a). A consistent finding across all studies was that fewer women achieved recommended cholesterol control than men, both among women enrolled in commercial plans (primarily age <65) and among Medicare beneficiaries (primarily >65). Women who were of lower socioeconomic status or Black had added risks because of the combined effects of gender disparities due to race and socioeconomic status (NCQA 2007). As Table 2 shows, only 37.7 percent of women with diabetes in commercial managed care plans achieved recommended cholesterol control, compared to 43.3 percent of men (Chou et al, 2007b), with a similar disparity for women with diabetes in Medicare (38.5 percent) and men (45.7 percent).
Disparities in diabetes effectiveness of care based on socioeconomic status have also been demonstrated. Using 2001–2004 data, AHRQ reported that those with lower income and lower education were less likely to receive three recommended diabetes services (HbA1c testing, eye examinations and foot examinations) than individuals with higher income and more education (AHRQ 2007). Another study found that avoidable hospitalizations for diabetes decreased as income increased, although the study cautioned that other factors (e.g., quality of primary care, age, relationship with providers, patient self-management skills) could also influence rates (Correa-de-Araujo et al 2006).
Effective diabetes management includes screening for other conditions for which diabetics are at increased risk (e.g., cardiovascular disease). Evidence from the Framingham Heart Study indicates that the presence of diabetes is significantly associated with an increased risk of developing cardiovascular disease (Franco et al 2007). Research has found a lower likelihood of some screenings for these additional risks, including testing and treatment for hypertension and dyslipidemia among Blacks and Hispanics compared to Whites (Peek et al 2007). Review of self-monitoring of blood glucose studies found that while self-monitoring rates were low, they were generally lower among racial and ethnic minorities. English fluency had some influence on self-monitoring rates in some studies, but data were limited for Native Americans and Asian Americans (Kirk et al 2007).
Some studies have found evidence that racial disparities in diabetes effectiveness of care may be lessening among older adults. One study on Medicare managed care members using 1999–2003 data found that Black–White racial disparities in diabetes care were attenuated over time, including disparities in eye examinations, low-density lipoprotein (LDL) testing and control and HbA1c testing (Trivedi et al 2005). A study of Veterans Administration (VA) beneficiaries found that hospital care for mostly older male VA patients with diagnosed diabetes did not differ for Black, Hispanic or White patients (though differences were found among patients with diagnosed congestive heart failure and chronic obstructive pulmonary disease). Examples of process of hospital care include admission history that documented the patient's typical level of blood glucose control; glycosylated hemoglobin measured during the stay; and patients being ready for discharge when acceptable blood glucose control was established (Gordon et al 2003). Results from these studies should be interpreted with caution because male veterans and Medicare managed care beneficiaries are not representative of all midlife or older
Analogous to diabetes complications, data for disparities in diabetes effectiveness of care were rarely stratified by the midlife and older adults. A Medline review of human subject, English-language diabetes studies published in the last five years, using the broadest search terms possible (i.e., diabetes and disparities) and limited to studies that include the midlife (45–64 years), yielded 195 studies, of which only 6 could be determined conclusively to stratify results by midlife vs. older adults. Thus, even when applying the most productive search criteria, there are still considerable gaps in the literature with respect to studies that examine and clarify disparities in diabetes care by both midlife and older adults.
Among the few studies that did stratify results by these two age groups, there are conflicting results. One study of Hispanics with diabetes found that older adults (>65) were less likely to have an HbA1c test in the past year than midlife adults (40–64) (Mainous et al 2007). The midlife age range in this study started at the slightly younger age of 40 years, instead of 45 years. The studies reported in Table 2 do not show a consistent advantage for either age group, and the finding on gender disparity in cholesterol control is consistent across age groups.
Another study stratifying results by the two age groups found that higher socioeconomic status, as measured by higher education, had a protective effect against smoking (as measured by lower probability of smoking) among midlife adults (45–64), but not among older adults (>65) (Karter et al 2007). Yet another study found that given the presence of diabetes, lower extremity amputations were much lower among ages 50–64 than among ages 65–74 or >75 (Sambamoorthi et al 2006). Also in this study, the midlife age range did not exactly encompass 45–64, but the slightly older range of 50–64. Moreover, the older range was stratified into two age groups (65–74 and >75) rather than just one group of >65. The results of this study are not surprising, given that older people probably have lived with diabetes for longer, probably have other comorbidities and may be of frailer health overall, which puts them at higher risk for adverse outcomes, such as amputations.
Safe, Patient-Centered, Timely/Accessible, Efficient Care
Despite recommendations by the IOM, most diabetes quality of care measures and studies do not address the domains of safe, patient-centered, timely/accessible and efficient care. For example, the National Committee for Quality Assurance/American Diabetes Association (NCQA/ADA) Provider Recognition Program indices do not include patient-centered items related to self-management or psychosocial support (Glasgow et al 2008), and measures of care efficiency in general are lacking. Virtually no efficiency measures reviewed in a recent, comprehensive RAND study included a quality dimension in assessing output, and as such, most efficiency measures could more appropriately be termed as merely measures of cost rather than of efficiency (RAND 2008). NCQA has been among the few organizations that have developed and tested nationally-based efficiency measures assessing the relationship between quality of care outcomes relative to resource input required for that care. Its efficiency measures examine care for persons with diabetes, including annual HbA1c testing, LDL screening and eye examinations; and the receipt of medical care for nephropathy (Roski et al 2008). Resource use for those with diabetes was calculated using medical and pharmacy claims in 31 commercial health plans. Early testing results indicate that pharmacy resource use was significantly and positively associated with higher quality of diabetes care (i.e., plans that spent more on pharmacy services for members with diabetes had more favorable diabetes care results), and hold promise for the future development and use of efficiency measures for diabetes care.
2.5 Disparities in Other Priority Conditions: Examples From Cardiovascular Care and Depression
The paucity of diabetes literature examining quality of care disparities based on individual factors other than race/ethnicity, and which also differentiate between midlife and older adults who have different health insurance coverage situations that could affect care, is similar for other priority conditions. This section briefly highlights the literature for two other conditions commonly related to diabetes: cardiovascular conditions and depression.
Similar to the literature search for age-stratified diabetes disparities, Medline reviews were conducted for cardiovascular care and depression disparities. Reviews were limited to human subjects, English-language cardiovascular care and depression studies published in the last five years, using the broadest search terms possible to maximize the results returned (cardiovascular and disparities, depression and disparities), and to studies that included midlife adults (45–64). The Medline search for cardiovascular disparities yielded 131 studies; the search for depression disparities yielded 71 studies. Of these, only a few could be determined to stratify results by midlife adults vs. older adults (>65) conclusively. This is similar to patterns in the age-stratified diabetes disparities literature, and reconfirms findings that even when the broadest search terms are applied for maximum results, there are gaps in the age-stratified literature for older adult disparities.
Studies of both cardiovascular and depression care disparities focused on race and ethnicity and primarily concluded that non-White minorities receive lower quality of health care compared to Whites. Most studies focused on effectiveness of care, with other IOM quality domains remaining largely unexplored. Fewer studies examined disparities based on other individual factors, such as gender and socioeconomic status. In addition, data were especially lacking on whether disparities differed by age and related health insurance status, with few studies comparing disparities between midlife
In cardiovascular care, for example, one of the largest quality of care studies in recent years found that older non-White minorities had consistently lower process-of-care ratings for cardiovascular care than Whites, such as lower testing and control of LDL levels among patients with known cardiovascular conditions, as well as lower rates of prescription for beta-blocker use after hospitalization for a major cardiovascular event (Trivedi et al 2005). Another comprehensive study of cardiovascular disparities found that non-White racial/ethnic minority Medicare beneficiaries had lower rates of major cardiovascular procedures than Whites, such as coronary-artery bypass grafting (CABG) and carotid endarterectomy (Jha et al 2005).
In the 2008 Health Disparities Report, AHRQ found that obese Hispanics, poor individuals and individuals with lower education were less likely to receive advice about exercise, a recommended process-of-care measure, compared to their White, higher-education and higher-income counterparts (AHRQ 2007). Socioeconomic disparities were also found in a longitudinal study, wherein high income and education individuals experienced much larger declines in smoking, a major risk factor in cardiovascular disease, than low income and education individuals (Kanjilal et al 2006). Studies examining gender disparities had mixed results. One study of Medicare beneficiaries with acute cardiovascular events found that women had higher rates of post-heart attack beta-blocker receipt and cholesterol screening but lower rates of lipid control than men (Bird et al 2007), while another study found that among individuals <65 with cardiovascular conditions, women had higher rates of good blood pressure control, but lower rates of post-heart attack beta-blocker receipt and cholesterol screening (Chou et al 2007; refer to Table 2). The only consistent finding is gender disparities in cholesterol control across age groups; there is positive evidence that disparities in some aspects of cardiovascular care have narrowed over the years (Jha et al 2005; Kanjilal et al 2006; Trivedi et al 2005). Despite their comprehensiveness, these studies did not explicitly address whether disparities based on race/ethnicity continue for both midlife adults and older,
Disparity studies of care for depressive disorders have similar and widely documented evidence of racial/ethnic differences. Across a range of studies, Blacks were found to be at particular risk for undertreatment of depression compared to Whites (AHRQ 2007; Van Voorhees et al 2007; Young et al 2001). In a national overview, both Blacks and Hispanics were found to be less likely to initiate antidepressant medication or psychotherapy for depression than Whites (Harman et al 2004). Furthermore, while existing treatments for depression have been effective across all racial/ethnic groups in community settings, symptomatic recovery is lower among non-White racial/ethnic minorities than Whites (Roy-Byrne et al 2005; Van Voorhees et al 2007). Studies have also documented gender differences in depression, with women reporting rates of depression about twice as high as men across diverse social settings and cultures (WHO 2008). Recent studies have begun to examine quality of care for depression by age, finding older persons to be at risk for lower rates of antidepressant treatment and psychotherapy and less likely to receive a diagnosis of depression (Harman et al 2004). However, as with diabetes and cardiovascular disease, depression care data do not address whether disparities in care persist between midlife and older adults who have different health insurance coverage.
2.6 Interventions to Reduce Disparities in Diabetes and Other Priority Conditions (Cardiovascular Disease and Depression)
Despite the overarching goal of Healthy People 2010—to reduce or eliminate disparities by 2010 (U.S. Department of Health and Human Services 2000a)—most disparity studies do not explicitly address the reasons for disparities in health care. There are suggestions that the provision of lower quality of care could be an important influence in disparities, but literature that explores quality improvement interventions targeting reductions in racial/ethnic or other types of health care disparities is still nascent (Chin et al 2007; Peek et al 2007; Saha et al 2008). Most current studies are "first generation"; (i.e., descriptive studies examining the extent of disparities) or ";second generation"; (i.e., studies examining only the association between race and potential factors that cause disparities without determining whether those factors truly mediate or cause disparities by race/ethnicity) (Saha et al 2008). Without detailed examination, it is challenging to ascertain whether potential mediating factors that influence disparities, identified and targeted through disparity-reducing interventions, truly mediate actual
A recent review of health care interventions to reduce racial/ethnic disparities focused on interventions for diabetes care at the patient, provider and health care organization or multitarget level (Chin et al 2007). The review is particularly relevant in the context of the conceptual model for this study because each intervention category reflects various points highlighted in the model, whether the intervention targeted individual (e.g., patient level) or ecological (e.g., provider, health care organization/system) levels. For each intervention level, the review highlighted areas that seemed most promising in terms of improving the quality of diabetes care for racial/ethnic minorities (e.g., through improved processes of care, such as regular physical activity) and in terms of improving diabetes-related health outcomes overall (e.g., reduced diabetes complications and intermediate outcomes such as mean glucose levels), although whether the interventions led to long-term reductions in diabetes care racial/ethnic disparities remains an open question (Peek et al 2007).
At the patient level, effective interventions that targeted racial/ethnic populations focused mainly on improving patients' diet, physical activity and self-management. Interventions that involved one-on-one interactions or peer support were more effective at improving health among racial/ethnic minorities than those using computer-based patient education. In meta-analyses, culturally-tailored interventions to improve general knowledge and health behaviors also had a more positive effect than general quality improvement efforts (Chin et al 2007; Peek et al 2007). At the provider level, "problem-based education"; targeted at physician providers, such as reminder systems and practice guidelines, continuing medical education, computerized decision-support reminders and in-person feedback, were most effective at generally improving processes of care and outcomes among patients with diabetes (e.g., improved rates of eye examinations) (Peek et al 2007), but these interventions did not necessarily provide information on whether
At the health care organization and multitarget level, there was strong evidence that interventions incorporating both the organization and the community reported large magnitudes of process measure improvements in general (e.g., improvements in HbA1c testing) (Peek et al 2007). Many organization-level interventions used a registered nurse as a case manager or clinical manager and incorporated a community health worker for peer support or community outreach and treatment algorithms targeting glucose, blood pressure and lipid control. Clinically significant patient outcomes included control of diabetes, hypertension and dyslipidemia (Peek et al 2007). The combination of nurse and community health worker was more effective than either used alone. Interventions targeting a combination of patients, providers, multiple heath care organizations and health care systems were also effective in improving process of care and outcomes among diabetics (Chin et al 2007). Multi-target interventions often mobilized multidisciplinary teams and patient registries and included many types of interventions: patient education, treatment algorithms, community outreach with community health workers, continuous quality improvement and nurse case management.
One multitargeted intervention formally measured and demonstrated a reduction in racial/ethnic disparities. The REACH 2010 project (Chin et al 2007; Peek et al 2007) consisted of a broad coalition of health care and academic institutions, community-based and faith-based organizations, civic groups, libraries, professional associations, government, businesses and media. It targeted all levels of intervention possible: patients (e.g., education strategies), providers (e.g., audits/feedback) and health systems (e.g., diabetes registries, community-based case management and continuous quality improvement teams) (Peek et al 2007). The study evaluating REACH 2010 found that previous racial disparities in process measures (e.g., HbA1c testing, eye examinations, lipid profiles, microalbumin testing) were eliminated after two years of implementation (Jenkins et al 2004; Peek et al 2007).
The limited state of interventional studies to reduce disparities in diabetes care also applies to cardiovascular and depression care. Only recently have two large-scale reviews of interventional studies in cardiovascular disease and depression been published in the literature, and both focus on interventions to reduce racial/ethnic disparities. In cardiovascular care, Davis et al (2007) comprehensively reviewed interventions aimed at reducing disparities in cardiovascular risk factor management, and found that hypertension and tobacco use received the most attention. Hypertension interventions targeted patients with sodium restriction promotion and have been somewhat successful, although other interventions targeting exercise or weight loss were not as effective. At the provider or community level, nurse-led interventions were commonly found to be effective in controlling blood pressure (Chin et al 2007; Davis et al 2007). Tobacco cessation interventions were the next most common cardiovascular interventions, with pharmacologic interventions (e.g., bupropion) shown to be effective in Blacks. Culturally tailoring education programs on smoking cessation to Black and Hispanic populations, whether targeted directly at the patient or through provider-targeted education programs, also met with success, although results were mixed. These interventional studies were limited because they did not formally assess whether disparities were reduced (Chin et al 2007; Davis et al 2007).
In depression care, Van Voorhees et al (2007) found that, like diabetes intervention studies, those that targeted multiple patient-level, provider or health care organization factors were most effective in improving depression care among racial minorities, such as improved receipt of cognitive behavioral psychotherapy and antidepressant medication treatment. Examples of successful interventions include those that culturally tailored programs to include bilingual providers, language-appropriate educational materials and case management for low-income persons.
While previous authors have acknowledged the extent of first- or second-generation disparity studies, the literature is still limited (Saha et al 2008). However, recent reviews of interventions that appear to hold promise in reducing racial disparities offer a hint about where targeted interventions seem to have the greatest effect within our conceptual model. Reviews of these interventions, whether for diabetes, cardiovascular care or depression care, point to multitarget interventions as perhaps the most effective, suggesting that causes of disparities are complex and wide-ranging for older adults with priority conditions.
Summary
This targeted review of the literature offers several key conclusions:
- While race/ethnicity has been a major focus of the disparities literature, fewer studies report on potential disparities based on factors such as gender and socioeconomic status. It is not clear whether this is because studies have examined these factors and found no differences (a publication bias) or because disparity studies involving gender and socioeconomic status have not been done.
- Among the numerous studies that have addressed disparities in the quality of care, few examined whether the pattern of disparity is consistent across age groups. While increasing prevalence of chronic conditions is expected among older age groups, it is unclear whether disparities based on race/ethnicity or gender are larger or smaller in the ≥65 age group. Studies that have examined the impact of Medicare on previously uninsured adults did not address how disparities contributed to these findings (McWilliams et al 2007).
- The most successful approaches to reducing disparities in health care appear to be interventions that target multiple causes of disparities.
3.0 Disparities in Diabetes and Cardiovascular Quality of Care: An Evaluation of Adults Ages 45–64 vs. the 65 and Older Population
3.1 Background
Although disparities in the use of health services by race and income have diminished since Medicare's implementation, recent studies suggest that marked health care disparities persist among Medicare beneficiaries. Racial/ethnic minority beneficiaries fare worse than their White counter-parts on numerous measures of health status and care. For example, Blacks have a shorter life expectancy at age 65 than Whites. In addition, Black beneficiaries are more likely than Whites to have chronic conditions and to experience poorer quality of care based on HEDIS measures (Chou et al
Since health insurance characteristics of the population change sharply at age 65, when most people become eligible for Medicare, one important question is whether these changes matter in terms of disparities in health care quality. Improvement in the quality of care upon Medicare eligibility may produce substantial health benefits and improved outcomes, such as long-term reductions in health care expenditures and healthier populations with less intensive health care needs. However, it is less clear whether midlife adults who have not yet reached Medicare eligibility (45–64) experience the same extent of disparities as older adults who have reached Medicare eligibility. Significant differences in health care quality experiences between these two age groups suggest that change in Medicare eligibility matters. This is particularly important as large numbers of baby boomers
This chapter examines the differences in quality of care among older adults using data from the Medical Expenditure Panel Survey (MEPS), a nationally representative database of well-established indicators of health care status, access to care, insurance coverage and, most important, quality of care.2 Because MEPS is intended for government quality initiatives and reports on quality indicators for priority conditions across a wide range of ages and race/ethnicities, it offers a unique opportunity to assess the extent of equitable care for older adults on either side of the Medicare eligibility threshold.
This analysis presents new evidence on whether attainment of Medicare eligibility among older adults is associated with quality of care, particularly for those with diabetes or cardiovascular disease. The analysis assesses relative disparities in quality of care for those on either side of the Medicare threshold: pre-Medicare midlife adults (45–64) compared to older Medicare beneficiaries (≥65). Specifically, select indicators of diabetes and cardiovascular quality of care for midlife adults who have not yet reached Medicare eligibility are compared to older Medicare beneficiaries overall and stratified by race/ethnicity groups and sex. The analysis examines diabetes and cardiovascular disease because these conditions are highly prevalent and costly, requiring continuous maintenance treatment. In addition, there are numerous quality of care measures from the MEPS database related to diabetes and cardiovascular care across multiple dimensions of quality,
___________
2 Detailed information on MEPS is available online at http://www.meps.ahrq.gov/mepsweb.
3.2 Methods
Data
The analysis used data from MEPS 2004–2006. The MEPS is a health survey developed to analyze health care use, expenditures and insurance coverage for the U.S. civilian noninstitutionalized population. The MEPS Household Component (MEPS HC) provides estimates of respondents' demographic and socioeconomic characteristics, access to care, health insurance coverage and effectiveness of care for an array of priority clinical conditions, including cardiovascular disease. The MEPS also collects information on diabetes care effectiveness separately through a self-survey, the MEPS Diabetes Care Supplement. All noninstitutionalized MEPS respondents ≥45 were included in this analysis. The overall 2004 MEPS HC response rate was 63.1 percent; for 2005, it was 61.3 percent; and for 2006, it was 58.3 percent. The MEPS protocol involves computer assisted personal interviewing (CAPI). Data from the 2004–2006 MEPS were pooled to bolster and ensure reliable estimates for comparative analysis across race/ethnicity, gender
Study Sample
The analysis focused on noninstitutionalized MEPS HC respondents ≥45 with self-identified diabetes (N=5,077) or self-identified cardiovascular disease (N=23,235). The sample of all diabetics was identified from those who responded in the affirmative to a MEPS HC question asking if they ever received a diagnosis of diabetes. Respondents were required to complete the MEPS Diabetes Care Supplement containing additional diabetes measures of care effectiveness.
The sample of all those with cardiovascular disease was identified from people who responded in the affirmative to a MEPS HC question asking if they ever received a diagnosis of high blood pressure (hypertension), high cholesterol, coronary heart disease, angina or angina pectoris, a heart attack or myocardial infarction, a stroke or transient ischemic attack (TIA or "ministroke";)
Data Analysis
The basic analytic approach was to compare relative differences in all health care quality measures between each age group, stratified by racial/ethnic and gender groups. Age groups included midlife adults 45–64 and older adults ≥65 (Medicare population). Race/ethnicity groups included non-Hispanic Whites, non-Hispanic Blacks and Hispanics of any race; gender groups included males and females. A fixed reference group was used to assess group differences in use of services. The reference group for age group differences was Medicare-eligible (>65) adults. The reference group for gender differences was males. In terms of race/ethnicity comparison, the reference group was Whites. All relative differences between groups were expressed as relative rates. Statistical significance was assessed using z tests.
The MEPS dataset collected sociodemographic information that allowed age group-based and race/ ethnicity comparison of non-Hispanic Whites, non-Hispanic Blacks and Hispanics of all races, and gender comparison of males and females. Because of data limitations, reliable estimates (with minimum cell size criteria of 100 observations or relative standard error >0.3) were not possible for all race/ethnicity, gender and age strata, and unreliable estimates were not included in the tables (identified by *** in Tables 4–10).
Measures
This analysis used measures from MEPS, reflecting three domains of care quality described by the IOM: effectiveness of care (with different measures for diabetes vs. cardiovascular patients), timeliness/access to care and patient-centeredness in care (Table 3). Diabetes effectiveness of care includes measures of HbA1c, blood pressure and cholesterol testing; eye and foot examinations; and preventive care, including adult vaccinations, dental check-up and receipt of smoking advice (for self-identified smokers). Measures of cardiovascular care effectiveness include blood pressure testing and receipt of lifestyle counseling for diet and exercise. Access to care includes indicators for delays in getting necessary medical or dental care or prescription medications, and an inability to get care when desired. Patient-centeredness in care includes indicators for patient-physician communication, perception of respect and amount of time a physician spends with a patient. Access to care and patient-centered measures are reported separately for the diabetes and cardiovascular disease populations.
3.3 Results
Sociodemographic Characteristics of Midlife and Older Adults With Diabetes and Cardiovascular Conditions
The majority of diabetes and cardiovascular condition respondents were non-Hispanic Whites (51.3 percent diabetes, 62.2 percent cardiovascular conditions), followed by smaller proportions of non-Hispanic Blacks (19.7 percent diabetes, 17.0 percent cardiovascular conditions) and Hispanics (23.4 percent diabetes, 15.3 percent cardiovascular conditions) (Table 4). Respondents reporting "other"; or mixed race (10.7 percent diabetes, 5.4 percent cardiovascular conditions) were excluded from this analysis because many comparisons between men and women in "other"; race/ethnicity categories had too few observations to make reliable estimates, and the patterns did not appear to differ for younger vs. older women. Higher proportions of non-White minorities were Medicaid recipients, had public insurance only and did not attend college. More females than males reported these characteristics within each race/ethnicity category. Among non-White racial/ethnic minorities, more Medicare beneficiaries were also Medicaid recipients, compared to pre-Medicare midlife adults, although this trend was reversed in non-Hispanic White older adults. In general, more Medicare beneficiaries did not attend college, compared to pre-Medicare midlife adults. More Hispanics reported being uninsured than non-Hispanic Whites or non-Hispanic Blacks. These patterns were consistent among both respondents with diabetes and
Tables 5 and 6 summarize the relative rates of reported quality measures based on gender and age group comparisons for diabetes and cardiovascular conditions; Tables 7 and 8 show the relative rates comparing race/ethnicity groups for diabetes and for cardiovascular conditions. Actual measure rates are shown in Tables 9 and 10. A relative rate of 1 means the rates are the same for the two groups being compared; differences in bold indicate a statistically significant difference in reported quality of care measures (p<.05).
Comparisons in Quality of Care Based on Gender
For patients with diabetes, there were no statistically significant differences in performance between men and women for diabetes care, and only one for preventive care (i.e., non-Hispanic White men >65 are more likely to receive dental care compared to women—with a relative rate of 1.26) (Table 5). Non-Hispanic White men were less likely to report delays or unmet needs in care than non-Hispanic White women. The relative rate was 0.61, with 18.8 percent of non-Hispanic White men 45–64 reporting delay in getting necessary medical care compared to 31.0 percent of non-Hispanic White women in the same age group. This difference was smaller and was not significant for non-Hispanic White women of Medicare age (13.1 percent for men vs. 15.9 percent for women). There were few statistically significant differences in patient-centeredness items
Among respondents with cardiovascular conditions, gender comparisons tended to show advantages for women in the 45–64 age groups, with several comparisons achieving statistical significance (Table 6). Among Hispanics 45–64, 91.2 percent of men vs. 95.1 percent of women reported a blood pressure check during the year; among non-Hispanic Blacks 45–64, 64.4 percent of men vs. 71.0 percent of women received advice on exercise. This pattern did not hold for the >65 age group, where the relative rates tended to favor men or were not significant. Results for access to care and patient-centeredness were consistent with patterns in diabetes. Men reported fewer problems with access to care than women among respondents with cardiovascular conditions, and the differences were greater among the 45–64 age group than among the >65 age group. There were few significant gender differences in reports of patient-centered care.
Comparisons in Quality of Care Based on Race/Ethnicity
As shown in Table 7, non-Hispanic Whites were usually more likely than non-Hispanic Blacks or Hispanics to receive diabetes care, a flu vaccination and dental care. For example, non-Hispanic White men <65 were 33 percent more likely to receive an HbA1c test and an eye and foot examination, compared to non-Hispanic Black men in the same age group (44.0 percent of Whites and 33 percent of Blacks received all three services). The pattern was similar and usually significant for Hispanics. The relative rates for receiving a flu shot ranged from 1.18 for Hispanic women ≥65 to 1.48 for non-Hispanic Black women ≥65, compared to White women in the same age group. Among cardiovascular conditions, results were less consistent (Table 8). For men in both age groups, non-Hispanic Whites were more likely to receive advice on nutrition compared to non-Hispanic Blacks. For women ≥65, non-Hispanic Whites were less likely to receive advice on nutrition than non-Hispanic Blacks, and Hispanics ≥65 (both men and women) were also less likely to receive nutrition advice.
Compared to non-Hispanic Blacks and Hispanics, non-Hispanic Whites tended to report more problems in access to care, but for the most part, differences were not significant for either diabetes or cardiovascular condition patients. Similarly, there were few significant differences in patient-centeredness based on race/ethnicity. In general, non-Hispanic Whites tended to report better communication compared to non-Hispanic Blacks or Hispanics, but differences were small.
Comparisons in Quality of Care Based on Age
As shown in Table 5, respondents 45–64 with diabetes and cardiovascular conditions more often reported poor quality of care than their counterparts >65. Receipt of recommended diabetes care was lower among the 45–64 age group for all diabetes services among Hispanic men and women. For example, among Hispanic men, 89.8 percent of the 45–64 age group vs. 98.4 percent of the ≥65 age group received a cholesterol test, resulting in a relative rate of 0.91. Lower rates of some tests were also observed for non-Hispanic Whites and non-Hispanic Blacks. The 45–64 age group was less likely to receive flu shots but more likely to receive dental services. The lower rate of flu shots was expected because recommendations for this service sometimes begin at 50, particularly in times of vaccine shortage (Mardon et al 2006). For cardiovascular care, patients in the 45–64 age group were less likely to receive blood pressure checks but more likely to receive counseling on nutrition and exercise, compared to their older counterparts (Table 6).
Among people with diabetes and cardiovascular conditions, respondents 45–64 were significantly more likely to report delays in care; this was consistent across race/ethnicity and gender groups. For example, among respondents with cardiovascular conditions, the relative rates for the Unmet Needs composite ranged from 1.22 for non-Hispanic Black men to 1.91 for Hispanic men (Table 6). In the latter group, 13.8 percent of Hispanic men 45–64 vs. 7.2 percent of Hispanic men ≥65 answered "yes"; to the four items concerning unmet needs in care (Table 8). Respondents 45–64 also reported more problems on the
Figures 2–4 illustrate the complexity of results by focusing on several key measures of effectiveness, access to care and patient-centeredness, based on age, gender and race/ethnicity.
- Across all quality of care measures, there were few statistically significant gender differences. Differences tended to be small and did not favor women or men consistently. The only exception was in access to care, where women reported delays in care more frequently than men.
- Differences based on race/ethnicity were prominent for effectiveness measures. In general, non-Hispanic Whites had more positive outcomes, particularly for diabetic care, flu shots and dental care. Interestingly, non-Hispanic Whites were more likely to report problems in access to care. These differences are consistent across age groups. Patterns were not as consistent for cardiovascular conditions.
- There were consistent, significant, age-based differences in access to care.
- Although there were statistically significant differences in patient-centeredness measures, their effect was generally small and inconsistent across gender and race/ethnicity groups.
3.4 Discussion
Although analysis results did not exhibit consistent patterns, several findings are worth noting. The most consistent finding was related to access to care. Women more often reported experiencing one or more delays in care compared to men, and delays were significantly more common among the 45–64 age groups than in the ≥65 age group. These findings are consistent with previous research that found improved access to care among older adults since the implementation of Medicare (NASI 2006). Non-Hispanic Whites were more likely than non-Hispanic Blacks or Hispanics to report delays. It is possible that people of different race/ethnicity groups have different perceptions, shaped by historical patterns, of necessary care or getting care as soon as they want it. Non-Hispanic Whites have had greater access to services and higher utilization compared to others. Gender differences in age and race/ethnicity strata may relate to women's lower economic status,
Among effectiveness of care measures, racial/ethnic disparities favoring non-Hispanic Whites over non-Hispanic Blacks and Hispanics were common, particularly among persons with diabetes. These results are consistent with the existing literature on disparities. While racial/ethnic disparities were found in both age groups, they tended to be stronger in magnitude and more often statistically significant for midlife adults 45–64 compared to older adults ≥65. Because most effectiveness of care measures available in this dataset examined processes of care, improved coverage through Medicare may help to diminish disparities for the older age group. Other measures of quality that examine control of blood pressure and cholesterol, where larger disparities have been observed in the Medicare population, were not assessed because the measures were not available in the MEPS data set (Chou et al 2007a; Trivedi et al 2006).
Limitations
There are limitations to this analysis. First is the reliance on self-reported disease status to identify older adults with diabetes and cardiovascular conditions. There is the possibility of misclassification because some individuals who self-identify as having these conditions may not actually have them. In particular, people with diabetes may not meet the clinical definition of the disease. However, there is evidence that older adults can reliably report their chronic conditions, and the positive predictive value of such reports is high (Miller et all 2008; Silliman and Lash 1999).
Second, because of data limitations, comparison across all race, gender and age-group strata were not always reliable, which may explain the failure of some results to reach statistical significance. This study does not adjust for other factors that may influence quality of care, other than Medicare eligibility status among older adults on either side of the Medicare threshold, although results are stratified and reported by race/ethnicity and gender groups. Other factors include patient values and preferences for care; presence of comorbid conditions; functioning and health status; geographic region; education and income; and presence of other insurance (besides Medicare). However, prior research on disparities have found that since its implementation, Medicare has improved access to care for older adults, confirming at least one aspect of the findings and bolstering others. Despite the limitations, analysis provides nationally representative data on the quality of care that allows the comparison of care for pre-Medicare and Medicare age patients, and explores whether disparities based on race/ethnicity and gender are common in the two age groups.
4.0 Association of Delays, Effectiveness and Patient-Centeredness in Health Care With Age, Gender and Insurance Status Among Americans With Diabetes and Cardiovascular Conditions
4.1 Background
Collectively, diabetes and cardiovascular disease account for nearly 30 percent of all deaths in the U.S. and an estimated $623 billion in direct and indirect medical costs (AHRQ 2008; CDC 2009). These diseases are among the most prevalent chronic conditions in midlife and older adult populations 45 and older. Their impact on overall health and disability is profound, but can be minimized through effective management and quality care.
There have been significant efforts to evaluate the quality of diabetes and cardiovascular care among midlife and older adult populations. Current literature suggests that access to care and receiving needed care are key issues among midlife adults (45–64), many of whom have chronic conditions (Collins et al 2006; Hoffman and Schwartz 2008; McWilliams et al 2003). The literature further suggests that Medicare improves access to care and reduces disparities in use of services for virtually all older adults 65 and older who are eligible for coverage (NASI 2006; Williams 2004).
However, while there have been evaluations of quality of care for diabetes and cardiovascular conditions, few large-scale studies have considered health insurance status. Health insurance coverage may affect the ability to pay for care and access to care, particularly timeliness of care, and women may be differentially affected (Glied et al 2008; Patchias and Waxman 2007; Rustgi et al 2009). Existing studies have not often provided comparative results from the Medicare population, which has high rates of chronic conditions but whose insurance status differs from midlife adults. Nor have studies always differentiated between the experiences of women and men, despite previous literature demonstrating gender disparities in select diabetes and cardiovascular outcomes, such as increased risk of diabetes complications and under-receipt of appropriate clinical procedures among women (Chou et al 2007a, 2007b).
This chapter examines the relationship of age, gender and insurance status to quality of care—particularly timeliness of care—among Americans with diabetes and cardiovascular conditions. Using a large-scale, nationally representative survey, this study examined whether gender and insurance are related to self-reported delays in care among midlife adults (45–64) and older adults (>65) with diabetes and cardiovascular conditions.
4.2 Methods
Nationally representative MEPS data were used to examine the relationship of age, gender and insurance status to quality of care among Americans with diabetes and cardiovascular conditions. Persons with missing education or insurance status data were excluded from the analysis (6 percent each for the diabetes and cardiovascular condition populations). Older adults who reported being "uninsured"; were excluded from analysis because they are eligible for Medicare and because there were few respondents who indicated that they were uninsured (0.1 percent each for the diabetes and cardiovascular condition populations). This study focused on respondents ≥45 with self-identified diabetes (N=4,067) or self-identified cardiovascular conditions (N=17,636). Refer to Chapter 3.2 for additional information about the
Analytic Variables
Dependent Variables
The dependent variables were 17 qualities of care indicators for diabetes and 15 qualities of care indicators for cardiovascular conditions. The indicators were from MEPS and addressed effectiveness, timeliness (delays) and patient-centeredness of care (Table 3). Of the 17 diabetes indicators, 7 measured effectiveness of care, 5 measured timeliness of care and 5 measured patient-centeredness of care. Of the 15 cardiovascular indicators, 5 measured effectiveness of care, 5 measured timeliness and 5 measured patient-centeredness items.
Six of the seven diabetes effectiveness of care indicators asked respondents if they had received HbA1c testing, an eye examination, a foot examination, blood pressure testing, blood cholesterol testing and influenza shot. The seventh indicator was a composite measure that examined whether respondents had received HbA1c testing and an eye and foot examination. The five cardiovascular effectiveness of care indicators asked respondents if they had received dietary advice, exercise advice, blood pressure testing, blood cholesterol testing and an influenza shot. All indicators asked about patient experiences during the past year.
The five timeliness indicators were the same for diabetes and cardiovascular condition patients. Three indicators asked all respondents if they had delays in obtaining medical care, dental care or prescription medications. A fourth indicator was a composite measure that asked respondents if they had a delay in any of these three types of care. The fifth indicator was concerned with whether patients who needed care for illness or injury actually received care as soon as they wanted it. All items asked about patient experiences during the past year.
The five patient-centeredness indicators were the same for diabetes and cardiovascular condition patients. Four items asked all respondents if their provider listened carefully, explained things clearly, showed respect and spent enough time with them. The fifth indicator was a composite measure that asked respondents if their provider did any of these four things. All indicators asked about patient experiences during the past year.
Independent Variables
The main independent variables of interest were age, gender and health insurance status in the past year. Age was stratified by midlife adults (45–64 years) vs. older adults (≥65 years). Gender was coded as "male"; or "female."; Five mutually-exclusive insurance status categories were based on self-reported insurance coverage, differentiated by midlife adults vs. older adults. All midlife adults were coded according to whether they reported having private health insurance in the previous year (including health insurance through an employer or union or a private source that was not employment-related); having only public insurance in the previous year (including Medicare, TRICARE, Medicaid and other public hospital/physician coverage); or being uninsured for all of the previous year. Older adults were coded according to whether they reported having Medicare and private health insurance in the previous year, or whether they had Medicare alone or Medicare in combination with only public insurance in the previous year. Older adults who reported being uninsured were excluded because this category had very few
Covariates were race/ethnicity (non-Hispanic White, non-Hispanic Black or Hispanic of any race); education level (<high school or >some college); income level (poor, near poor or low [representing <200 percent federal poverty level (FPL)]) vs. middle or high income (representing >200 FPL); and self-rated health status (excellent, very good or good vs. fair or poor).
Data Analysis
A multivariate analysis was performed using SAS version 9.2 (SAS Institute, Cary, NC) and SUDAAN Release 10.0.0 (RTI International, Research Triangle Park, NC). All estimates were weighted to reflect the complex survey sampling design. Variance was computed using the Taylor linearization method, taking sample design features into account using SUDAAN. The individual was the unit of analysis. The unadjusted associations of all quality indicators were compared across age, gender and insurance status groups. Because of data limitations, reliable unadjusted estimates (with minimum cell size criteria of 100 observations or relative standard error >0.3) were not possible for all age groups, insurance status and gender strata, and unreliable estimates were suppressed in the unadjusted tables (identified by * in Table 13). For further examination of the association of gender and insurance status with quality of care, logistic regressions were used to estimate each indicator separately for each age group, while controlling for potential confounding factors. A fixed reference group was used to assess group differences in quality of care. For example, males were the referent group for gender differences. Private insurance was the referent group for insurance status differences among midlife persons. Medicare and private insurance were the referent groups for insurance status differences among older adults. The multivariate analysis controlled for education, race/ethnicity, income and health status. Multivariate results were reported as adjusted odds ratios (OR) with 95 percent confidence intervals.
Because this analysis examined 17 simultaneous dependent variables, drawn from the same sample of diabetes patients, and 15 simultaneous dependent variables, drawn from the same sample of cardiovascular condition patients, a Bonferroni correction was used to interpret p-values. Thus, at the alpha testing level of 0.05, only p-values <0.002 (0.05/17) were considered significant for diabetes patients, and only p-values <0.003 (0.05/15) were considered significant for cardiovascular patients.
4.3 Results
Table 11 shows the distribution of the key independent variables of interest among the study population. To facilitate the multivariate analyses, only persons with complete data on all analytic variables were included in the study sample (hence, the sample for this analysis differs from the previous analysis reported in Chapter 3.0, which did not include multivariate analyses). In the weighted study sample, the majority of diabetes and cardiovascular condition patients were midlife adults (54.4 percent diabetes, 55.5 percent cardiovascular conditions) and female (51.6 percent diabetes, 53.8 percent cardiovascular conditions). The majority of midlife adults with diabetes or cardiovascular conditions had some type of private health insurance (69.0 percent diabetes, 79.0 percent cardiovascular conditions), while approximately one in seven was uninsured (10.8 percent diabetes, 10.1 percent cardiovascular). Among older adults with Medicare, the majority also had some type of private health insurance (55.2 percent diabetes, 60.9 percent cardiovascular). Men were more likely to have private insurance than women. For example, in the midlife diabetes group, 73.7 percent of men had private insurance coverage (in combination with Medicare), compared to 48.2 percent of women.
Table 12 shows the distribution of individual covariates among the study sample. The majority of the study sample was non-Hispanic White (56.8 percent diabetes, 68.4 percent cardiovascular condition); had high school education or less; medium or high income; and was in excellent, very good or good health. Within each insurance strata, women were slightly more likely than men to report only high school education or less, income below or near the FPL and fair or poor health. For example, in the midlife diabetes group with private insurance coverage, 59.5 percent of women vs. 56.4 percent of men reported high school education or less; 22.3 percent of women vs. 18.2 percent of men reported income below or near the FPL; and 36.2 percent of women vs. 30.6 percent of men reported fair or poor health. These patterns were also seen among cardiovascular condition patients.
Quality of Care for Diabetes Patients
Table 13 gives the reported rates of receiving effectiveness of care services, delays in care (timeliness) and patient-centeredness in care for diabetes patients, stratified by age, insurance status and gender. Among midlife adults, receipt of services was less common among the uninsured compared to the privately or publicly insured, and within each group, similar proportions (within approximately 5 percentage points) of women and men reported receipt of services. There were slightly larger gender differences among uninsured or publicly insured midlife adults, but differences were in opposite directions, depending on the service. For example, a higher proportion of publicly insured midlife men than women (81.3 percent vs. 72.7 percent) reported having a foot examination, but a lower proportion of uninsured midlife men than women (57.1 percent vs. 66.7 percent) reported having a foot examination. Conversely, a lower proportion of publicly insured midlife men than women (47.2 percent vs. 58.2 percent) reported having an eye examination, but a higher proportion of uninsured midlife men than women (47.0 percent vs. 33.1 percent) reported having an eye examination. In the older age group, rates of receiving services were not greatly different between insurance or gender groups, although among both the privately insured (in combination with Medicare) and publicly insured, gender differences were larger (>5 percentage points) for receiving an influenza shot and the composite measure.
Among midlife adults, delays in care were less common among the privately insured compared to publicly insured or uninsured, and within each group, women were more likely to report delays. For example, among midlife adults with diabetes, the reported rate of delays in medical care was 6.2 percent for men vs. 10.9 percent for women with private insurance; the rates were 11.9 percent vs. 21.7 percent in the uninsured group for men and women, respectively. In contrast, the older age group reported fewer delays and the difference between gender and insurance groups was smaller, but women still reported more delays than men. 6.0 percent of men and 8.2 percent of women with Medicare and private insurance coverage reported delays in dental care, while among those with Medicare alone or with other public insurance, the rates were 5.7 percent for men and 10.5 percent for women. These patterns were consistent for each type of delay in the diabetes group, with the exception of delays in medical care for the privately insured (in combination with Medicare), where more men than women (5.3 percent vs. 3.8 percent) reported delays.
Small numbers limited comparison in the diabetes group for access to care for illness or injury. There were few gender and insurance differences for patient-centered indicators. Among midlife adults, 92.5 percent of men and 91.7 percent of women with private insurance reported that their provider explained things. These rates were 89.7 percent and 85.5 percent, respectively, for privately insured men and women. Among older adults, similar proportions (within 5 percentage points) also reported patient-centeredness in care, regardless of gender and insurance group.
Quality of Care for Cardiovascular Condition Patients
Table 13 also provides the reported rates of receiving effectiveness of care services, delays in care (timeliness) and patient-centeredness in care for cardiovascular condition patients, stratified by age, insurance status and gender. Among midlife adults, receipt of services was less common among the uninsured compared to the privately or publicly insured, and within each group there were no consistent gender differences, although uninsured women were more likely than men to report receipt of services. For example, a higher proportion of privately insured midlife men than women (69.4 percent vs. 66.6 percent) reported receiving dietary advice, but a lower proportion of uninsured midlife men than women (56.5 percent vs. 60.3 percent) reported receiving it. Conversely, a lower proportion of privately insured midlife men than women (68.3 percent vs. 71.8 percent) reported receiving exercise advice. Among the older age group, there were few gender or insurance differences in receipt of services.
Among midlife adults, delays in care were less common among the privately insured compared to publicly insured or uninsured. Women were more likely to report delays compared to men. For example, among midlife adults with cardiovascular conditions, the reported rate of delays in medical care was 4.7 percent for men vs. 7.6 percent for women with private insurance. These rates were 12.1 percent vs. 18.7 percent in the public insurance group and 19.5 percent vs. 27.4 percent in the uninsured group for men and women, respectively. In contrast, the older age group reported fewer delays in medical care. Differences between gender and insurance groups were smaller, with women reporting similar or only slightly higher rates of delays. For example, 3.5 percent of men and 3.4 percent of women with Medicare and private insurance coverage reported delays in medical care; rates were 3.9 percent for men and 5.4 percent for women with Medicare alone or other public insurance. These patterns were consistent for each type of delay in the diabetes groups.
Among persons 45–64 with cardiovascular conditions and private insurance who reported needing care for an illness or injury, 9.6 percent of men and 10.8 percent of women reported that they sometimes or never got care for an illness or injury as soon as they wanted. Problems in getting illness or injury care for persons with cardiovascular conditions were most common for the uninsured midlife group (30.7 percent for men and 31.6 percent for women) and least common for Medicare enrollees with private insurance (7.3 percent for men and 4.8 percent for women—the only comparison that favored women) or Medicare enrollees with public insurance only (6.5 percent for men
There were a few gender and insurance differences for patient-centered indicators. For example, rates of midlife adults who reported that their provider listens to them were 93 percent for men and 92.4 percent for women with private insurance vs. 88.5 percent for men and 85.7 percent for women with public insurance. Among older adults, similar proportions (within approximately 5 percentage points) of all adults also reported patient-centeredness in care, regardless of gender and insurance group, although rates were somewhat higher for provider listening and showing respect.
Regression Results for Diabetes Patients
With a few exceptions, adjusting for key patient factors did not greatly alter the patterns exhibited in the unadjusted associations for diabetes patients (Table 14). For effectiveness of care indicators among diabetes patients, and consistent with unadjusted results, uninsured midlife adults were less likely than the privately insured to report receipt of some services, with OR of 0.2 (95 percent CI, 0.1–0.4) for blood cholesterol testing to 0.5 (95 percent CI, 0.3–0.6) for eye examination, all p<0.002. There were no significant gender differences in receipt of services among midlife adults. Among older adults with Medicare coverage, there was no significant gender or insurance group difference in receipt of services.
Among diabetes patients, and consistent with unadjusted results, midlife women were about twice as likely as men to report delays in care. The odds ratios (OR) were 1.9 (95 percent CI, 1.4–2.5) for delays in care. Uninsured midlife adults were two to four times as likely to report delays in care as midlife adults with private insurance; for delays in medical care, the OR was 2.4 (95 percent CI, 1.4–4.0). Midlife adults with public insurance only were also about twice as likely to report a delay in at least one of the three types of care; for the composite measure, the OR was 1.9 (95 percent CI, 1.3–2.7). Among Medicare-insured older adults, gender differences were not significant in diabetes patients.
Patterns exhibited for patient-centeredness indicators among diabetes patients remained after adjusting for sociodemographic factors. Midlife uninsured adults were about half as likely as the privately insured to report high quality on the patient-centered care composite (OR 0.5, 95 percent CI, 0.3–0.7, p<0.002). However, there were no other significant insurance group or gender differences among both midlife and older adults in receipt of patient-centered care.
Regression Results for Cardiovascular Condition Patients
With a few exceptions, adjusting for key patient factors did not greatly alter the patterns exhibited in unadjusted associations for cardiovascular condition patients (Table 15). For effectiveness of care indicators among cardiovascular patients and consistent with unadjusted results, uninsured midlife adults were significantly less likely than the privately insured to receive almost all services, with odds ratios ranging from 0.3 (95 percent CI, 0.2–0.4) for blood cholesterol testing to OR 0.7 (95 percent CI, 0.6–0.8) for dietary advice, all p<0.003. There were no significant differences in receipt of services between publicly and privately insured midlife adults. However, midlife women were more likely than men to receive some services (with odds ranging from 21 percent higher for exercise advice to 67 percent higher for blood pressure testing, all p<0.003). Among older adults with Medicare coverage, there was no significant gender or insurance group difference in receipt of services.
Among diabetes patients and consistent with unadjusted results, midlife women were about twice as likely as men to report delays in care. For example, the odds ratios were 1.7 (95 percent CI, 1.5–1.9) for delay in care among the cardiovascular condition group. Uninsured midlife adults were two to four times as likely to report delays in care as midlife adults with private insurance; for delays in medical care, the OR was 4.0 (95 percent CI, 3.1–5.2) among the cardiovascular condition group. Midlife adults with public insurance only were also about twice as likely to report a delay in at least one of the three types of care; the OR was 1.7 (95 percent CI, 1.4–2.1) among cardiovascular condition groups.
Among Medicare-insured older adults, gender differences were of smaller magnitude and were significant only in the cardiovascular group, with women being more likely to report any one of the three delays in care (OR, 1.3; 95 percent CI, 1.2–1.6). There were no significant differences in delays in care between Medicare-insured older adults with private or public insurance, but uninsured midlife individuals with cardiovascular conditions were more likely to report being unable to get care for illness or injury (OR, 3.0; 95 percent CI, 2.2–4.2).
For patient-centeredness indicators among cardiovascular condition patients, patterns from unadjusted associations remained after adjustment. Uninsured midlife adults were less likely than the privately insured to report most aspects of patient-centered care, with odds ratios ranging from 0.4 (95 percent CI, 0.3–0.5) for the composite measure, to 0.6 (95 percent CI, 0.5–0.8) for their provider spending enough time with them (all p<0.003), but there were no significant differences between publicly and privately insured midlife adults. Among older adults, there were no significant insurance group differences. There were only a few significant gender differences among both midlife and older adults, and those were in opposite directions.
4.4 Discussion
The analysis sought to describe the relationship between health insurance coverage and the quality of care that men and women experience. The most significant, consistent findings were related to access to care. For the most part, women were significantly more likely than men to report delays in care. Differences were exhibited among midlife adults who reported having diabetes or cardiovascular conditions. While gender disparities did not attain statistical significance among Medicare-insured older adults with diabetes, a few significant disparities persisted among older adults with cardiovascular conditions. Findings are consistent with prior research showing that women in midlife have more problems in accessing care, compared to men in the same period of life (Rustgi et al 2009). Attainment of Medicare-eligibility among older adults appears to reduce, but not eliminate, gender disparities in delays in care.
Analysis also demonstrated significant differences in access to care based on insurance coverage. Among midlife adults, uninsured individuals were more likely to report delays in care than other health insurance status groups. There were also some significant differences in access to care between those with private insurance vs. public insurance. However, among older adults, there were no significant differences in delays in care based on type of insurance, and the rates of reported delays were much lower than those reported by midlife adults. These patterns suggest the importance of Medicare in providing access to care for older adults, and speak to the larger issue of significant delays in care for midlife adults in the absence of health coverage provided by Medicare or other publicly supported health insurance programs. Prior research differs on whether obtaining Medicare coverage is associated with general improvement in health status, but indicates that the impact of health insurance may be more profound for persons with cardiovascular conditions or diabetes (McWilliams et al 2007a, 2007b; Polsky et al 2009).
Guidelines for cardiovascular conditions and diabetes recommend ongoing monitoring services and treatment (American Heart Association 2008; National Institute of Diabetes and Digestive and Kidney Diseases 2009). Delays in receipt of medical services and prescription drugs could lead to suboptimal quality and outcomes. Differences in access to care based on type of insurance coverage are well documented. Compared to men, women have lower incomes to meet rising health care costs, have higher rates of chronic conditions, use more health care services and rely more on public programs and insurance obtained through their spouses (Glied et al., 2008; Patchias and Waxman, 2007; Rustgi et al., 2009). It is unclear whether differences in self-reports about delays in care reflect women's greater propensity to self-identify the need for care, or greater difficulty in obtaining needed care. A recent study indicated that a spouse's transition to Medicare contributed to women's inability to gain access to care, despite having consistent insurance coverage (Schumacher et al 2009). Findings from this study suggest that more research is needed to understand better how women's unique health care needs and insurance coverage experiences affect
For the remaining quality of care indicators, there were few statistically significant gender or insurance group differences in effectiveness of care or patient-centeredness of care, and differences did not consistently favor women or men, or any insurance group.
Limitations
There are several limitations to this analysis. First is the reliance on self-reported disease status to identify older adults with diabetes and cardiovascular conditions. There is the possibility of misclassification, as some individuals who self-identify as having these conditions may not actually have them. In particular, those with diabetes may not meet the clinical definition of the disease. However, there is evidence that older adults can reliably report their chronic conditions, and positive predictive value of such reports is high (Miller et al 2008; Silliman and Lash 1999).
Second, while analysis explicitly adjusts for several key individual factors—including patient self-rated health status, race/ethnicity, education and income—it does not adjust for other factors that may influence quality of care, such as patient values and care preferences, presence of comorbid conditions and geographic region. Third, even after combining three years of MEPS data, sample size limitations prevented the exploration of how disparities affect particular subgroups of men and women (e.g., Black men and women, or men and women with less education). Fourth, because of the confounding of age and Medicare coverage, we cannot rule out the possibility of the role of age in the results. Despite these limitations, analysis provides nationally representative data on gender-based and health insurance-based disparities among older adults with diabetes and
5.0 Summary and Recommendations
This report developed a conceptual model for assessing quality of care disparities among midlife and older adults; summarized key literature findings on quality of care for diabetes, cardiovascular conditions and depression; and conducted quantitative analyses to address disparities in care among midlife and older adults with diabetes and cardiovascular conditions. In this chapter, we discuss findings and summarize the challenges and recommendations in assessing quality of care disparities for midlife and older adults with diabetes and cardiovascular conditions.
5.1 Challenges in Assessing Disparities in Quality of Care for Older Adults
A major task of this report—categorization of select measures of diabetes quality of care, along with certain cardiovascular and depression care measures—revealed some important themes in limitations of existing research on disparities, particularly in care for older adults. First, most health care measures for priority conditions in older adults, such as diabetes and cardiovascular conditions, are largely concentrated in the IOM domain of effectiveness of care, with relatively few items found in the safety, patient-centered or timely/accessible domains. No indicators were found in the efficiency of
Second, to enhance disparities research and ultimately improve health outcomes, studies must focus on a wider spectrum of personal factors than race and ethnicity. Some data sets used for quality of care research, including insurance claims data and medical record reviews, do not always have a wide range of sociodemographic variables. However, national survey data often include information on race and ethnicity or gender, as well as other important sociodemographic factors such as income, education level and country of origin. Taking better advantage of these data would enhance understanding of the extent of inequities in health care based on personal factors.
Third, the majority of studies on disparities in quality of care have focused exclusively on effectiveness of care measures, such as processes of care or intermediate outcomes (e.g., receipt of recommended diabetes tests such as eye examinations or HbA1c levels in diabetics; beta-blocker prescription and LDL levels following hospital discharge for a cardiovascular event). Potential disparities in other IOM domains of safety, patient-centered, timely/accessible and efficient care have received less attention. It is unclear whether this is a result of disparities not being observed in those domains, difficulty in collecting data or simply a lack of interest by researchers.
Fourth, the issue of how patterns of disparities in care differ between midlife and older adults has received very little attention in the literature. For example, a Medline search for diabetes studies, limited to those that include people 45–64 and ≥65, yielded many studies that encompassed these two age groups but did not necessarily stratify results by these groups. Thus, very little additional information on this issue could be gleaned, despite applying criteria to maximize the sensitivity and specificity of search results. While studies in cardiovascular and depression care examine results by age, they do not discuss the differences between these two age groups. Differences in the prevalence of these conditions, as well as differences in insurance coverage, may contribute to this finding.
5.2 Key Findings on Disparities in Care for Older Adults
To fill the gap in the literature about consistent disparities in quality of care for midlife vs. older adults, we conducted new analyses, taking advantage of a large, nationally representative sample of Americans evaluated in the MEPS. Analyses showed that racial/ethnic differences were prominent for effectiveness measures, with results favoring non-Hispanic Whites, but there were few statistically significant gender differences in effectiveness of care measures. There were statistically significant differences in patient-centeredness measures, but the magnitude of effect was generally small and inconsistent across gender and race/ethnicity groups. The most consistent findings related to access to care measures were that midlife adults more often reported delays in care than Medicare-eligible older adults and women reported access problems more often than men. Whites were more likely to report problems in access to care, compared to Blacks or Hispanics, which is contrary to most disparities findings favoring Whites over other racial/ethnic groups. Subsequent analyses demonstrated that these patterns persisted even after controlling for health insurance status. The midlife adult population, especially the uninsured, also demonstrated worse access to care than the Medicare-covered older adults. However, there were few significant gender or health insurance differences for effectiveness of care or patient-centeredness measures.
5.3 Implications and Recommendations
Efforts are needed to address persistent disparities in care based on race/ethnicity, socioeconomic status and gender, and for subgroups at particular risk.
As the nation considers options for expanding insurance coverage and improving the quality of care, this report has important implications for policymaking and for research. Special effort is needed to address persistent disparities in care based on race/ethnicity, socioeconomic status and gender, and for subgroups at particular risk. This study shows that even after controlling for health insurance, disparities persist in access to care. Because women report greater delays in care, comprehensive benefits and affordable costs are likely to be critical to the success of health care coverage options. Under current coverage models, women are at a disadvantage where benefits are limited or are associated with higher out-of-pocket costs (Patchias and Waxman, 2007). Furthermore, eliminating gender differences in access and quality of care issues may require efforts to strengthen the health care delivery system, increase gender-sensitive and appropriate delivery options and expand supportive mechanisms for women to gain access to health care. Similarly, efforts are needed to ensure that coverage options and benefits are adapted to improve effectiveness of care for racial/ethnic minority patients at greater risk of poor care.
Efforts to monitor potential differences in the impact of health care reforms for population subgroups at particular risk.
Nationally-representative databases should be supported to enhance statistical power in comparative analyses of disparities stratified by midlife adults (45–64) vs. older adults (>65) for ongoing monitoring of the health care system, as well as for research. Given the demographic changes of baby boomers entering Medicare, it is particularly important to ensure that available data on the quality of care experiences between midlife and older adults can withstand sophisticated analysis of individual factors. Having the datasets and tools that allow characterization and monitoring of quality differences among those nearing Medicare eligibility has important implications for the Medicare program and its ability to care for the aging population.
Further research is needed to consider patterns of disparities among adults 45–64, and how disparities might change in adults 65 and older.
This report partially addresses the gap with new analyses of nationally available survey data. Additional research should consider factors that contribute to delays in care, particularly for midlife women. These data did not find a consistent effect of race/ethnicity on delays in care, although there were consistent and important racial/ethnic disparities in effectiveness of care measures. More information is needed to understand how individuals perceive the need for care, and how this affects their use of services and reports about access to care.
Studies are needed that focus on the causes of disparities or address reductions in disparities as actual outcomes.
Aside from interventional studies that attempt to address this indirectly, the ability to examine potential sources of disparity directly is limited in disparities literature. Multifactorial, multitarget interventions tailored at vulnerable populations, such as racial minorities, hold promise for targeting different causes of disparities, but more research is needed to explore the mediating factors that lead to the success of promising interventions, in addition to whether successful interventions to reduce disparities can be applied outside an experimental setting.
6.0 References
- Adams AS, Trinacty CM, Zhang F, Kleinman K, Grant RW, Meigs JB, Soumerai SB, Ross-Dignan D. Medication adherence and racial differences in A1c control. Diabetes Care. 2008;31:916-921.
- Agency for Healthcare Research and Quality (AHRQ), U.S. Department of Health and Human Services. National Healthcare Quality Report, 2008. (2008). Available online at: http://www.ahrq.gov/QUAL/nhqr08/nhqr08.pdf. (Accessed June 15, 2009).
- Agency for Healthcare Research and Quality (AHRQ), U.S. Department of Health and Human Services. National Healthcare Disparities Report, 2007 (Issued February 2008). Available online at: http://www.ahrq.gov/qual/nhdr07/nhdr07.pdf. (Accessed May 2008).
- AHRQ, U.S. Department of Health and Human Services. Understanding Quality Measurement. Available online at: http://ahrq.hhs.gov/chtoolbx/downloads/understanding.doc. (Accessed December 14 2008)
- American Association of Clinical Endocrinologists. State of Diabetes Complications in America Report, 2007. Available online at: http://www.aace.com/newsroom/press/2007/images/DiabetesComplicationsRep… (Accessed September 8 2008).
- American Diabetes Association. Total Prevalence of Diabetes and Pre-Diabetes (2008a). Available online at: http://www.diabetes.org/diabetes-statistics/prevalence.jsp (Accessed December 12 2008).
- American Diabetes Association. Diabetes: Heart Disease and Stroke (2008b). Available online at: http://www.diabetes.org/diabetes-heart-disease-stroke.jsp. (Accessed December 12 2008).
- American Diabetes Association. Depression and Heart Disease in Diabetes (2008c). http://www.diabetes.org/diabetes-research/summaries/egede-depression.jsp (Accessed December 12 2008).
- American Heart Association. Heart Disease and Stroke Statistics — 2008 Update (2008). Available online at: http://www.americanheart.org/downloadable/heart/1200078608862HS_Stats%202008.final.pdf. (Accessed August 19, 2009).
- Beal AC, Co JPT, Dougherty D, Jorsling T, Kam J, Perrin J, Palmer RH. Quality measures for children's health care. Pediatrics. 2004;113:199-209.
- Bird CE, Fremont AM, Bierman AS, et al. Does quality of care for cardiovascular disease and diabetes differ by gender for enrollees in managed care plans? Women's Health Issues. 2007;17:131-138.
- Brown AF, Gregg EW, Stevens MR, Karter AJ, Weinberger M, Safford MM, et al. Race, ethnicity, socioeconomic position and quality of care for adults with diabetes enrolled in managed care. Diabetes Care. 2005;28:2864-2870.
- Caravalho JY, Saylor CR. Continuum of care: An evaluation of a nurse case-managed program for children with diabetes. Pediatric Nursing. 2000;26:296-300.
- Card D, Dobkin C, Maestas N. Does Medicare Save Lives? NBER Working Paper No. 13668. Cambridge, MA: National Bureau of Economic Research; issued November 2007. Available online at: http://www.nber.org/papers/w13668. (Accessed May 2008).
- Carter JS, Pugh JA, Monterrosa A. Non-insulin-dependent diabetes mellitus in minorities in the United States. Ann Intern Med. 1996; 125:221-232.
- Centers for Disease Control and Prevention (CDC); 2009. Deaths and Mortality. Available online at: http://www.cdc.gov/nchs/FASTATS/deaths.htm. (Accessed June 15, 2009).
- CDC; 2007a. 2007 National Diabetes Fact Sheet. Available online at: http://www.cdc.gov/diabetes/pubs/pdf/ndfs_2007.pdf (Accessed June 14 2008).
- CDC; 2007b. Age-Specific Prevalence of Diagnosed Diabetes, by Race/Ethnicity and Sex, United States, 2005. Atlanta, GA: CDC Division of Diabetes Translation; issued March 2007. Available online at: www.cdc.gov/diabetes/statistics/prev/national/fig2004.htm. (Accessed August 11 2008).
- Chin MH, Walters AE, Cook SC, Huang ES. Interventions to reduce racial and ethnic disparities in health care. Med Care Res Rev. 2007;64:7S-28S.
- Chou AF, Brown AF, Jensen RE, Shih S, Pawlson G, Scholle SH. Gender and racial disparities in the management of diabetes mellitus among Medicare patients. Women's Health Issues. 2007a; 17:150-161.
- Chou AF, Scholle SH, Weisman CS, Bierman A, Correa-de-Araujo R, Mosca L. Gender Disparities in the Quality of Cardiovascular Disease Care in Private Managed Care Plans Women's Health Issues 2007b; May-Jun;17(3):120-30.
- Collins SR, Davis K, Schoen C, Doty MM, and Kriss JL. Health Coverage for Aging Baby Boomers: Findings from the Commonwealth Fund Survey of Older Adults. The Commonwealth Fund, January 2006.
- Congressional Budget Office. High Cost Medicare Beneficiaries. Washington, DC: Congressional Budget Office; May 2005. Available at: http://www.cbo.gov/ftpdocs/63xx/doc6332/05-03-MediSpending.pdf. Accessed November 2, 2008.
- Correa-de-Araujo R, McDermott K, Moy E. Gender differences across racial and ethnic groups in the quality of care for diabetes. Women's Health Issues. 2006;16:56-65.
- Egede LE, Neitert PJ, Zheng D. Depression and All-Cause and Coronary Heart Disease Mortality Among Adults With and Without Diabetes. Diabetes Care. 2005;28: 1339-1345.
- Felix-Aaron K, Moy E, Kang M, Patel M, Chesley FD, Clancy C. Variation in quality of men's health care by race/ethnicity and social class. Med Care. 2005;43: I72-I81.
- Finkelstein A, McKnight R. "What Did Medicare Do (And Was It Worth It)?"; NBER Working Paper No. 11609, September 2005.
- Franco OH, Steyerberg EW, Hu FB, Mackenbach J, Nusselder W. Associations of diabetes mellitus with total life expectancy and life expectancy with and without cardiovascular disease. Arch Intern Med. 2007;167:1145-1151.
- Frayne SM, Halanych JH, Miller DR, et al. Disparities in diabetes care: impact of mental illness. Arch Intern Med. 2005;165:2631-2638.
- Gee GC, Payne-Sturges DC. Environmental health disparities: a framework integrating psychosocial and environmental concepts. Environ Health Perspect. 2004;112:1645-1653.
- Glasgow RE, Peeples M, Skovlund SE. Where is the patient in diabetes performance measures? Diabetes Care. 2008;31:1046-1050.
- Glied S, Jack K, Rachlin J. Women's health insurance coverage 1980–2005. Women's Health Issues. 2008;18:7–16.
- Gordon HS, Johnson ML, Ashton CM. Process of care in Hispanic, Black, and White VA beneficiaries. Med Care. 2003;40:824-833.
- Harman JS, Edlund MJ, Fortney JC. Disparities in the adequacy of depression treatment in the United States. Psychiatric Services. 2004; 55:1379-1385.
- Harris MI. Racial and ethnic differences in health insurance coverage for adults with diabetes Diabetes Care. 1999;22:1679-1682.
- Hoffman C, Schwartz K. Trends in access to care among working-age adults, 1997-2006. Kaiser Commission on Medicaid and the Uninsured Issue Paper #7824. Washington, DC: Kaiser Family Foundation Commission on Medicaid and the Uninsured; 2008.
- Hogan C, Lunney J, Gabel J, et al. Medicare beneficiaries' costs of care in the last year of life. Health Aff (Millwood). 2001; 20:188-195.
- Hosler AS, Melnik TA. Population based assessment of diabetes care and self-management among Puerto Rican adults in New York City. The Diabetes Educator. 2005;31:418-426.
- Institute of Medicine (IOM). Crossing the Quality Chasm. Washington, DC: National Academies Press; 2001.
- IOM. Unequal Treatment: Confronting Racial and Ethnic Disparities in Health Care. Washington, DC: National Academies Press; 2002.
- Jenkins C, McNary S, Carlson BA, et al. Reducing disparities for African Americans with diabetes: progress made by the REACH 2010 Charleston and Georgetown Diabetes Coalition. Public Health Reports. 2004;119:322-330.
- Jha AK, Fisher ES, Li Z, Orav EJ, Epstein AM. Racial trends in the use of major procedures among the older. NEJM. 2005;353:683-691.
- Kaiser Family Foundation Medicare Advantage Fact Sheet. Publication #2052-10. Washington, DC: Kaiser Family Foundation; issued June 2007. Available at: http://www.kff.org/medicare/2052.cfm. (Accessed May 2008).
- Kanjilal S, Gregg EW, Cheng YJ, et al. Socioeconomic status and trends in disparities in 4 major risk factors for cardiovascular disease among US adults, 1971-2002. Arch Int Med. 2006;166:2348-2355.
- Karter AJ, Stevens MR, Brown AF, Duru OK, Gregg EW, Gary TL, Beckles GL, Tseng CW, Marrero DG, Waitzfelder B, Herman WH, Piette JD, Safford MM, Ettner SL. Educational disparities in health behaviors among patients with diabetes: the TRIAD study. BMC Public Health. 2007;7:308. Available online at: http://www.biomedcentral.com/1471-2458/7/308. (Accessed September 3, 2008).
- Keehan S, Sisko A, Truffer C, Smith S, Cowan C, Poisal K, Clemens MK, and the National Health Expenditure Accounts Projections Team. Health Spending Projections Through 2017: The
- Baby-Boom Generation Is Coming To Medicare. Health Affairs (2008; 27: w145–w155 (published online 26 February 2008; 10.1377/hlthaff.27.2.w145)]
- Kirk JK, D'Agostino RB Jr, Bell RA, Passmore LV, Bonds DE, Karter AJ, Narayan KM. Disparities in African-American and non-Hispanic White adults with diabetes: a meta-analysis. Diabetes Care. 2006;29:2130-2136.
- Kirk JK, Graves DE, Bell RA, Hildebrandt CA, Narayan KM. Racial and ethnic disparities in self-monitoring of blood glucose among US adults: a qualitative review. Ethn Dis. 2007;17:135-142.
- Kirk JK, Passmore LV, Bell RA, Narayan KM, D'Agostino RB Jr, Arcury TA, Quandt SA. Disparities in A1C levels between Hispanic and non-Hispanic White adults with diabetes: a meta-analysis. Diabetes Care. 2008;31:240-246.
- Lanting LC, Joung IM, Mackenbach JP, Lamberts SW, Bootsma AH. Ethnic differences in mortality, end-stage complications and quality of care among diabetic patients: a review. Diabetes Care. 2005;28:2280-2288.
- Mainous AG, Diaz VA, Koopman RJ, Everett CJ. Quality of care for Hispanic adults with diabetes. Fam Med. 2007;39:351-356.
- Mardon RE, Pawlson LG, Scholle SH. Influenza Vaccination Coverage Among Persons Aged 50–64 Years Enrolled in Commercial Managed Health-Care Plans—United States, 2003–04 and 2004–05 Influenza Seasons. MMWR 2005; 54(37):921-923.
- McWilliams JM, Zaslavsky AM, Meara E, Ayanian JZ. Impact of Medicare coverage on basic clinical services for previously uninsured adults. JAMA. 2003;290:757-764.
- McWilliams JM, Meara E, Zaslavsky AM, Ayanian JZ. Health of previously uninsured adults after acquiring Medicare coverage. JAMA. 2007a; 298: 2886-2894.
- McWilliams JM, Meara E, Zaslavsky AM, Ayanian JZ. Use of health services by previously uninsured Medicare beneficiaries. NEJM. 2007b;357:143-153.
- Miller DR, Rogers WH, Kazis LE, et al. Patients' self-report of diseases in the Medicare Health Outcomes Survey based on comparisons with linked survey and medical data from the Veterans Health Administration. J Ambul Care Manage. 2008;31:161-177.
- Moy E, Dayton E, Clancy CM. Compiling the evidence: the National Healthcare Disparities Reports. Health Aff (Millwood). 2005;24:376-382.
- National Academy of Social Insurance (NASI). Strengthening Medicare's Role in Reducing Racial and Ethnic Health Disparities. Vladeck, Bruce C., Paul N. Van de Water, and June Eichner (eds.). Washington, DC: National Academy of Social Insurance; 2006.
- National Committee for Quality Assurance. Improving the Quality of Care for Cardiovascular Disease: Using National Managed Care Performance Data to Investigate Gender Differences in HEDISG Measures Related to Heart Disease Contract Number 290-04-00018. Final Report to the Agency for Healthcare Research and Quality, February 2007.
- National Institute of Diabetes and Digestive and Kidney Diseases. National Diabetes Statistics (2007). Available online at: http://www.cdc.gov/diabetes/pubs/pdf/ndfs_2007.pdf. (Accessed August 19, 2009).
- National Quality Measures Clearinghouse (NQMC), Agency for Healthcare Research and Quality. Using Measures: What is a Quality Measure? Available online at: http://www.qualitymeasures.ahrq.gov/resources/measure_use.aspx (Accessed December 14 2008).
- Office of Minority Health (OMH), U.S. Department of Health & Human Services. 2008a. Diabetes Data/Statistics. Last modified June 2008. Available at: http://www.omhrc.gov/templates/browse.aspx?lvl=3&lvlid=62. (Accessed Aug 11 2008).
- OMH, U.S. Department of Health & Human Services. 2008b. Diabetes and African Americans. Last modified June 2008. Available at: http://www.omhrc.gov/templates/content.aspx?lvl=3&lvlID=5&ID=3017. (Accessed Aug 11 2008).
- OMH, U.S. Department of Health & Human Services. 2008c. Diabetes and Hispanic Americans. Last modified June 2008. Available at:
- http://www.omhrc.gov/templates/content.aspx?lvl=3&lvlID=5&ID=3324. (Accessed Aug 11 2008).
- OMH, U.S. Department of Health & Human Services. 2008d. Diabetes and American Indians/Alaska Natives. Last modified June 2008. Available at:
- http://www.omhrc.gov/templates/content.aspx?lvl=3&lvlID=5&ID=3024. (Accessed Aug 11 2008).
- OMH, U.S. Department of Health & Human Services. 2008e. Diabetes and Asians and Pacific Islanders. Last modified June 2008. Available at: http://www.omhrc.gov/templates/content.aspx?lvl=3&lvlID=5&ID=3057. (Accessed Aug 11 2008).
- Patchias EM, Waxman J. Women and health coverage: The affordability gap. New York, NY: The Commonwealth Fund; 2007.
- Peek ME, Cargill A, Huang ES. Diabetes health disparities: a systematic review of health care interventions. Med Care Res Rev. 2007;64 (5 Suppl):101S-156S.
- Polsky D, Doshi JA, Escarce J, Manning W, Paddock SM, Cen L, Rogowski J. The health effects of Medicare for the near-elderly uninsured. Health Services Research. 2009;44:926-45.
- RAND Corporation—Southern California Evidence-based Practice Center. Identifying, Categorizing, and Evaluating Health Care Efficiency Measures. Report prepared under contract no. 282-00-0005-21 for the Agency for Healthcare Research and Quality (AHRQ). AHRQ Publication No. 08-0030. April 2008. Available online at: http://www.ahrq.gov/qual/efficiency/efficiency.pdf. (Accessed September 9, 2008).
- Roski J, Turbyville S, Dunn D, Krushat M, Scholle SH. Resource use and associated care effectiveness results for people with diabetes in managed care organizations. Am J Med Qual. 2008;23:365-374.
- Roy-Byrne PP, Perera P, Pitts CD, Christi JA. Paroxetine response and tolerability among ethnic minority patients with mood or anxiety disorders: a pooled analysis. Journal of Clinical Psychiatry. 2005;66:1228-33.
- Rustgi SD, Doty MM, Collins SR. Women at risk: Why many women are forgoing needed health care. An analysis of the Commonwealth Fund 2007 Biennial Health Insurance Survey. New York, NY: The Commonwealth Fund; 2009.
- Saha S, Freeman M, Toure J, Tippens KM, Weeks C, Ibrahim S. Racial and ethnic disparities in the VA health care system: a systematic review. JGIM. 2008;23:654-671.
- Salganicoff A. Health Care and Long-Term Care Policy: Concerns Facing Older Women. Kaiser Family Foundation, 2008. http://www.kff.org/womenshealth/whp091808oth.cfm. Accessed Jan 4, 2008.
- Sambamoorthi U, Tseng CL, Rajan M, Anjali T, Findley PA, Pogach L. Initial nontraumatic lower-extremity amputations among veterans with diabetes. Med Care. 2006;44:779-787.
- Schumacher JR, Smith MA, Liou JI, Pandhi N. Insurance disruption due to spousal Medicare transitions: Implications for access to care and health care utilization for women approaching age 65. Health Services Research. 2009; 44: 946-964.
- Schneider EC, Zaslavsky AM, Epstein AM. Racial disparities in the quality of care for enrollees in Medicare managed care. JAMA. 2002;287:1288-1294.
- Silliman RA, Lash TL. Comparison of interview-based and medical-record based indices of comorbidity among breast cancer patients. Med Care. 1999;37:339-349.
- Trivedi AN, Zaslavsky AM, Schneider EC, Ayanian JZ. Relationship between quality of care and racial disparities in Medicare health plans. JAMA. 2006;296:1998-2004.
- Trivedi AN, Zaslavsky AM, Schneider EC, Ayanian JZ. Trends in the quality of care and racial disparities in Medicare managed care. NEJM. 2005;353:692-700.
- U.S. Department of Health and Human Services. Healthy People 2010: Understanding and improving health. 2nd ed. U.S. Government Printing Office. Washington, DC: 2000. Available online at: http://www.healthypeople.gov/Publications. (Accessed May 2008).
- Van Voorhees BW, Walters AE, Prochaska M, Quinn MT. Reducing health disparities in depressive disorders outcomes between non-Hispanic Whites and ethnic minorities: a call for pragmatic strategies over the life course. Med Care Res Rev. 2007;64:157S-194S.
- Virnig BA, Scholle SH, Chou AF, Shih S. Efforts to reduce racial disparities in Medicare managed care must consider the disproportionate effects of geography. Am J Manag Care. 2007;13:51-56.
- Virnig BA, Lurie N, Huang Z, Musgrave D, McBean AM, Dowd B. Racial variation in quality of care among Medicare+Choice enrollees. Health Aff (Millwood). 2002;21:224-230.
- Will JC, Strauss KF, Mendlein JM, Ballew C, White LL, Peter DG. Diabetes among Navajo Indians: findings from the Navajo Health and Nutrition Survey. J Nutr. 1997;127:2106S-2113S.
- Williams RD. Medicare and communities of color. National Academy of Social Insurance Medicare Brief No.11. Washington, DC: National Academy of Social Insurance; 2004.
- Wong MD, Shapiro MF, Boscardin J, Ettner SL. Contributions of major disease to disparities in mortality. N Eng J Med. 2002;347:1585-1592.
- World Health Organization (WHO), 2008. See: 1) the WHO programme: Gender and Women's Mental Health. Available online at: http://www.who.int/mental_health/prevention/genderwomen/en/index.html (accessed December 14 2008); 2) the WHO publication: Gender Disparities in Mental Health. Available online at: http://www.who.int/mental_health/media/en/242.pdf (accessed December 14 2008).
- Young AS, Klap R, Sherbourne CD, et al. The quality of care for depressive and anxiety disorders in the United States. Archives of General Psychiatry. 2001;58:55-61.
- Young BA, Maynard C, Reiber G, Boyko EJ. Effects of ethnicity and nephropathy on
7.0 Figures and Tables
Figure 1. How System and Individual Components Affect Quality of Care Disparities in Older Adults
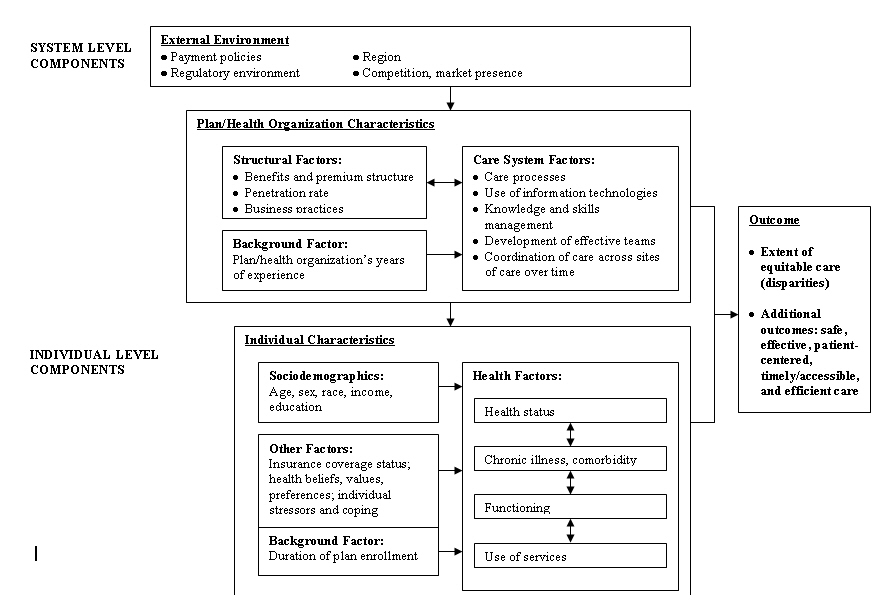
Figure 1 is a flowchart showing how System and Individual Components Affect Quality of Care Disparities in Older Adults. The System level componets used for the external environment are Payment policies, Regulatory environment, Region and Competition, market presents. The Individual Level components are broken down to Plan/Health CCharacteristics and Individual Characteristics. Upon assessing all of these factors, the outcome results through the extent of equitable care.
Figure 2. Delays in Care for Diabetes and Cardiovascular Condition Patients
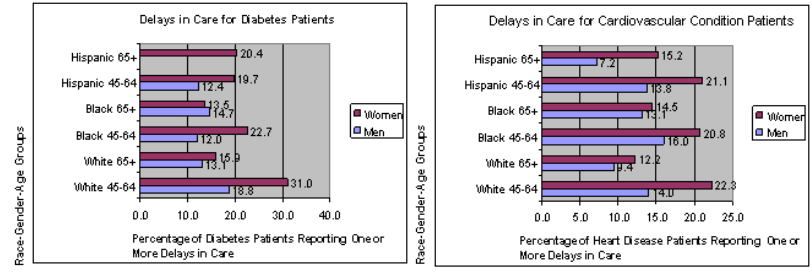
Figure 2 are graphs showing gender differences are significant for Whites <65. Race differences are significant for Hispanic women <65. Age differences are significant for Whites and Black women. Estimate unavailable for Hispanic Men 65+. Gender differences are significant for Whites and Hispanics (both age groups). No race/ethnicity differences were significant. Age differences are significant for Whites, Black women and Hispanics.
Figure 3. Effectiveness of Care for Diabetes and Cardiovascular Conditions
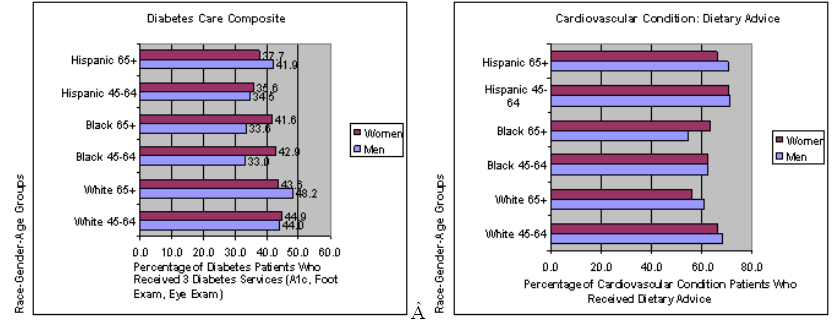
Figure 3 are graphs showing no gender or age differences are significant. Race differences are significant for Black men <65, Hispanic men and Hispanic women <65. Gender differences are significant for White and Blacks 65+. Race differences are significant for Black men (both age groups) and Black women 65+, as well as for Hispanic men 65+ and Hispanic women 65+. Age differences are significant for White men and women.
Figure 4. Patient-Centeredness Among Diabetes and Cardiovascular Condition Patients
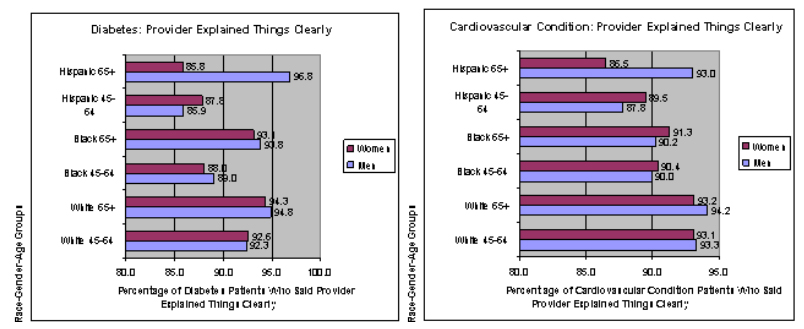
Figure 4 are graphs showing age differences are significant for Hispanic men. Gender differences are significant for Hispanic women 65+. Race differences are significant for Blacks both men and women <65, for Hispanics both men and women <65, for Hispanic women 65+. No age differences are significant. Gender differences are significant for women 65+. Race differences are significant for Hispanic women 65+.
| Quality Indicators | Data Source | Quality Outcomes | ||||||||
|---|---|---|---|---|---|---|---|---|---|---|
| Equity (Overarching Outcome) | ||||||||||
| Safe | Effective | Patient-Centered | Timely/ Accessible | Efficient/Cost/ Utilization | ||||||
| DIABETES EFFECTIVENESS OF CARE | ||||||||||
| Diabetes Care & Management: Process Indicators | ||||||||||
| HbA1c test in last year | MEPS | √—G, R/E, I, IS | ||||||||
| Eye exam in last year | MEPS | √—G, R/E, I, IS | ||||||||
| Foot exam in last year | MEPS | √—G, R/E, I, IS | ||||||||
| Hemoglobin A1C test, eye exam, and foot exam in last year | MEPS | √—G, R/E, I, IS | ||||||||
| Blood pressure check in last year | MEPS | √—G, R/E, I, IS | ||||||||
| Lipid panel within the past 2 years | MEPS | √—G, R/E, I, IS | ||||||||
| Intermediate Outcomes | ||||||||||
| HbA1c <7.0% | NHANES | √—G, E, I, IS, C, EI | ||||||||
| HbA1c >9.0% | NHANES | √—G, E, I, IS, C, EI | ||||||||
| BP <130/80 mm Hg | NHANES | √—G, E, I, IS, C, EI | ||||||||
| Total cholesterol <200 mg/dL | NHANES | √—G, E, I, IS, C, EI | ||||||||
| LDL cholesterol <100 mg/dL | NHANES | √—G, E, I, IS, C, EI | ||||||||
| HDL cholesterol <40 mg/dL (males) or <50mg/dL (females) | NHANES | √—G, E, I, IS, C, EI | ||||||||
| Triglyceride <150 mg/dL | NHANES | √—G, E, I, IS, C, EI | ||||||||
| Additional Indicators | ||||||||||
| Influenza immunization past 12 months | NHANES, MEPS (NHIS) | √—G, E, I, IS, C, EI | ||||||||
| Had pneumococcal immunization | NHANES, MEPS (NHIS) | √—G, E, I, IS, C, EI | ||||||||
| Dental visit in the past year (12 months/) | NHANES, MEPS | √—G, E, I, IS, C, EI | ||||||||
| Recommended or offered intervention for smoking cessation Note: Also smokers who received advice to quit |
BRFSS, MEPS | √—G, R/E, I, IS | ||||||||
| Diabetes Hospitalizations | ||||||||||
| Hospital admissions for uncontrolled diabetes | HCUP | √—G, R/E, I | ||||||||
| Hospital admissions for lower extremity amputations | HCUP | √—G, R/E, I | ||||||||
| Hospital admissions for diabetes with any short-term complications | HCUP, MEPS | √—G, R/E, I, IS | ||||||||
| For hypoglycemia | HCUP | √—G, R/E, I | ||||||||
| For hypotension | HCUP | √—G, R/E, I | ||||||||
| For polypharmacy | HCUP | √—G, R/E, I | ||||||||
| For falls or balance problems (falls or balance problems may also be considered long-term complications) | HCUP, MEPS | √—G, R/E, I, IS | ||||||||
| Hospital admissions for diabetes with any long-term complications | HCUP, MEPS | √—G, R/E, I | ||||||||
| CARDIOVASCULAR EFFECTIVENESS OF CARE | ||||||||||
| Cardiovascular Care: Hypertension Management | ||||||||||
| Blood pressure <140/90 mm/Hg | NHANES | √—G, E, I, IS, C, EI | ||||||||
| Cardiovascular Care: Hospital Care for AMI | ||||||||||
| Number of admissions for AMI | HCUP | √—G, R/E, I | ||||||||
| AMI mortality rate | HCUP | √—G, R/E, I | ||||||||
| PTCA mortality rate | HCUP | √—G, R/E, I | ||||||||
| CABG mortality rate | HCUP | √—G, R/E, I | ||||||||
| Cardiovascular Care: Hospital Care for CHF | ||||||||||
| Number of CHF admissions | HCUP | √—G, R/E, I | ||||||||
| CHF mortality rate | HCUP | √—G, R/E, I | ||||||||
| ACCESS TO CARE | ||||||||||
| Unable or delayed in receiving care | MEPS | √—G, R/E, I, IS | ||||||||
| Difficulty getting to doctor from home | MCBS | √—G, R/E, E, I, IS | ||||||||
| Emergency department visits in which patient left without being seen | NHAMCS | √—G, R/E, IS | ||||||||
| Waiting 30 minutes or more to see doctor at last visit | MCBS | √—G, R/E, E, I, IS | ||||||||
| Without particular place for care | MCBS | √—G, R/E, E, I, IS | ||||||||
| PATIENT-CENTEREDNESS IN CARE | ||||||||||
| Provider sometimes or never listened carefully to them | MEPS | √—G, R/E, I, IS | ||||||||
| Provider sometimes or never explained things clearly | MEPS | √—G, R/E, I, IS | ||||||||
| Provider sometimes or never showed respect for what they had said | MEPS | √—G, R/E, I, IS | ||||||||
| Provider sometimes or never spent enough time with them | MEPS | √—G, R/E, I, IS | ||||||||
| SAFETY IN CARE | ||||||||||
| Percentage with at least 1 prescribed inappropriate Rx | MEPS | √—G, R/E, I, IS | ||||||||
| Provider asks about use of Rx/other treatments from other doctors | MEPS | √—G, R/E, I, IS | ||||||||
|
Equity Items in Data Source: AMI = Acute myocardial infarction, BP = Blood pressure, BRFSS = Behavioral Risk Factors Surveillance System, CABG = Coronary artery bypass graft, We gratefully acknowledge the CDC for its assistance on Table 1. |
||||||||||
| Commercial, 19991 | Medicare, 19991 | Commercial, 20042 | Medicare, 20033 | |||||
|---|---|---|---|---|---|---|---|---|
| Female | Male | Female | Male | Female | Male | Female | Male | |
| Diabetes | ||||||||
| Cholesterol Screening | 58.8 | 63.0 | 53.1 | 56.4 | 91.6 | 92.7 | 92.7 | 92.6 |
| Cholesterol Control <130 | 27.6 | 33.0 | 33.4 | 41.3 | 67.4 | 73.2 | ||
| Cholesterol Control <100 | 37.7 | 43.3 | 38.5 | 45.7 | ||||
| HbA1c Testing | 64.4 | 67.0 | 60.9 | 61.8 | 89.2 | 87.7 | ||
| Poor HbA1c Control | 22.0 | 22.2 | ||||||
| Eye Examination | 39 | 33.7 | 46.5 | 41.7 | 68.8 | 66.4 | ||
| Nephropathy Monitoring | 20.4 | 21.4 | 17.0 | 20.2 | 57.6 | 58.9 | ||
| Cardiovascular Disease | ||||||||
| Beta-Blocker Treatment After a Heart Attack | 63.8 | 73.6 | 67.8 | 67.0 | 94.7 | 97.0 | 92.3 | 92.9 |
| Persistence of Beta Blocker After a Heart Attack | 62.3 | 65.2 | ||||||
| Controlling High Blood Pressure | 30.2 | 26.0 | 30.3 | 35.4 | 70.8 | 68.6 | 59.8 | 63.3 |
| Cholesterol Screening for People With Acute Cardiovascular Events | 66.4 | 67.5 | 61.2 | 60.5 | 76.8 | 79.9 | 80.4 | 82.7 |
| Lipid Control <130 for People With Acute Cardiovascular Events | 33.7 | 34.8 | 35.0 | 45.5 | ||||
| Lipid Control <100 for People With Acute Cardiovascular Events | 45.3 | 55 | ||||||
| ACE Inhibitor With CHF | 56.3 | 62.2 | 53.0 | 55.5 | ||||
| Depression | ||||||||
| Antidepressant Medication Management—Optimal Contacts | 11.9 | 13.7 | ||||||
| Antidepressant Medication Management—Acute Phase | 66.0 | 66.2 | ||||||
| Antidepressant Medication Management—Continuation Phase | 51.3 | 50.5 | ||||||
| Follow-Up After MH Hospitalization (30 Days) | 59.5 | 52.4 | ||||||
| Follow-Up After MH Hospitalization (7 Days) | 37.9 | 33.8 | ||||||
| Influenza Vaccination | 53.9 | 50 | ||||||
|
ACE = Angiotensin-converting enzyme, CHF = Congestive heart failure, HbA1c = Hemoglobin A1c, 1= NCQA, unpublished results. 2=Chou AF, Wong L, Weisman CS, Chan S, Bierman AS, Correa-de-Araujo R, Scholle SH. Gender disparities in cardiovascular disease care among commercial and Medicare managed care plans. Women's Health 3=NCQA, unpublished results. |
||||||||
| Quality of Care Indicator | Description | Quality of Care Domaina | |
|---|---|---|---|
| DIABETES CARE | |||
| Testing of HbA1c | Percentage of diabetics who had testing of HbA1c levels within the past year | Effective | |
| Testing of blood pressure | Percentage of diabetics or those with cardiovascular disease who had testing of blood pressure level within the past year | Effective | |
| Testing of blood cholesterol | Percentage of diabetics or those with cardiovascular disease who had testing of blood cholesterol within the past two years | Effective | |
| Eye examination | Percentage of diabetics who received an eye examination within the past year | Effective | |
| Foot examination | Percentage of diabetics who received a foot examination within the past year | Effective | |
| Composite: HbA1c, eye and foot examination | Percentage of diabetics who received all three services: HbA1c testing, eye examination and foot examination within the past year | Effective | |
| Influenza shot | Percentage of diabetics who received an influenza vaccination within the past year | Effective | |
| Unable to get care | Percentage of diabetics or those with cardiovascular disease who reported that they sometimes or never got care for illness or injury as soon as wanted within the past year | Timely/Access | |
| Delays in medical care | Percentage of diabetics or those with cardiovascular disease who reported that they were unable or delayed in getting necessary medical care within the past year | Timely/Access | |
| Delays in dental care | Percentage of diabetics or those with cardiovascular disease who reported that they were unable or delayed in getting necessary dental care within the past year | Timely/Access | |
| Delays in prescriptions | Percentage of diabetics or those with cardiovascular disease who reported that they were unable or delayed in getting necessary prescription medications within the past year | Timely/Access | |
| Composite: Delays in care | Percentage of diabetics or those with cardiovascular disease who reported that they were unable or delayed in all three types of care: medical care, dental care, getting prescription medications within the past year | Timely/Access | |
| Provider listened | Percentage of diabetics or those with cardiovascular disease who reported that provider usually or always listened carefully within the past year | Patient-centered | |
| Provider explained things | Percentage of diabetics or those with cardiovascular disease who reported that provider usually or always explained things clearly within the past year | Patient-centered | |
| Provider showed respect | Percentage of diabetics or those with cardiovascular disease who reported that provider usually or always showed respect within the past year | Patient-centered | |
| Provider spent time | Percentage of diabetics or those with cardiovascular disease who reported that provider usually or always spent enough time with them within the past year | Patient-centered | |
| Composite: Patient-centeredness | Percentage of diabetics or those with cardiovascular disease who reported that provider usually or always listened carefully, explained things clearly, showed respect to what they had to say, and spent enough time with them within the past year | Patient-centered | |
| CARDIOVASCULAR CONDITION CARE | |||
| Testing of blood pressure | Percentage of diabetics or those with cardiovascular disease who had testing of blood pressure level within the past year | Effective | |
| Dietary advice | Percentage of those with cardiovascular disease who ever received advice to eat fewer high fat and high cholesterol foods | Effective | |
| Exercise advice | Percentage of those with cardiovascular disease who ever received advice to exercise more | Effective | |
| Testing of blood cholesterol | Percentage of diabetics or those with cardiovascular who had testing of blood cholesterol within the past two years | Effective | |
| Influenza shot | Percentage of diabetics or those with cardiovascular disease who received an influenza vaccination within the past year | Effective | |
| Unable to get care | Percentage of diabetics or those with cardiovascular disease who reported that they sometimes or never got care for illness or injury as soon as wanted within the past year | Timely/Access | |
| Delays in medical care | Percentage of diabetics or those with cardiovascular disease who reported that they were unable or delayed in getting necessary medical care within the past year | Timely/Access | |
| Delays in dental care | Percentage of diabetics or those with cardiovascular disease who reported that they were unable or delayed in getting necessary dental care within the past year | Timely/Access | |
| Delays in prescriptions | Percentage of diabetics or those with cardiovascular disease who reported that they were unable or delayed in getting necessary prescription medications within the past year | Timely/Access | |
| Composite: Delays in care | Percentage of diabetics or those with cardiovascular disease who reported that they were unable or delayed in all three types of care: medical care, dental care, getting prescription medications within the past year | Timely/Access | |
| Provider listened | Percentage of diabetics or those with cardiovascular disease who reported that provider usually or always listened carefully within the past year | Patient-centered | |
| Provider explained things | Percentage of diabetics or those with cardiovascular disease who reported that provider usually or always explained things clearly within the past year | Patient-centered | |
| Provider showed respect | Percentage of diabetics or those with cardiovascular disease who reported that provider usually or always showed respect within the past year | Patient-centered | |
| Provider spent time | Percentage of diabetics or those with cardiovascular disease who reported that provider usually or always spent enough time with them within the past year | Patient-centered | |
| Composite: Patient-centeredness | Percentage of diabetics or those with cardiovascular disease who reported that provider usually or always listened carefully, explained things clearly, showed respect to what they had to say, and spent enough time with them within the past year | Patient-centered | |
| a Indicates one of the five quality of care domains identified by the IOM: Effective, timely/accessible, patient-centered, safe and efficient care. | |||
| Non-Hispanic White | Non-Hispanic Black | Hispanic, Any Race | ||||||||||
|---|---|---|---|---|---|---|---|---|---|---|---|---|
| Males | Females | Males | Males | Females | Males | |||||||
| 45-64 | ≥65 | 45-64 | ≥65 | 45-64 | ≥65 | 45-64 | ≥65 | 45-64 | ≥65 | 45-64 | ≥65 | |
| Diabetes Respondents (n=5,077) | ||||||||||||
| Sample size | 582 | 538 | 616 | 593 | 160 | 137 | 310 | 251 | 226 | 132 | 346 | 239 |
| Mean age in years | 56.2 | 73.8 | 55.5 | 75.5 | 55.4 | 73.4 | 55.2 | 73.7 | 54.0 | 72.9 | 54.1 | 73.6 |
| Medicaid recipient | 13.7% | 7.1% | 22.9% | 17.2% | 23.1% | 23.4% | 38.7% | 42.6% | 25.2% | 43.2% | 36.4% | 57.7% |
| Private insurance | 71.5% | 64.9% | 63.5% | 52.8% | 64.4% | 37.2% | 39.7% | 29.1% | 47.3% | 24.2% | 32.9% | 12.6% |
| Public insurance only | 19.1% | 35.1% | 26.1% | 47.2% | 28.1% | 62.8% | 45.8% | 70.9% | 26.5% | 75.8% | 38.2% | 84.1% |
| Uninsured | 9.5% | *** | 10.4% | *** | 7.5% | *** | 14.5% | *** | 26.1% | *** | 28.9% | 3.3% |
| No college | 56.2% | 57.6% | 62.7% | 74.5% | 63.8% | 73.0% | 70.6% | 80.5% | 84.5% | 85.6% | 85.0% | 88.7% |
| Cardiovascular Condition Respondents (n=23,235) | ||||||||||||
| Sample size | 3,171 | 2,401 | 3,252 | 3,292 | 639 | 437 | 1,185 | 794 | 671 | 343 | 939 | 682 |
| Mean age in years | 54.9 | 74.2 | 55 | 75.7 | 54.6 | 73.1 | 54.1 | 74.7 | 53.8 | 73 | 54.3 | 74.2 |
| Medicaid recipient | 7.5% | 6.2% | 11.8% | 11.2% | 14.4% | 24.7% | 25.8% | 37.5% | 18.5% | 37.3% | 29.3% | 52.3% |
| Private insurance | 79.0% | 67.3% | 76.7% | 59.1% | 66.0% | 43.0% | 54.2% | 32.0% | 55.0% | 28.3% | 41.6% | 16.3% |
| Public insurance only | 10.8% | 32.7% | 14.2% | 40.8% | 20.0% | 57.0% | 29.5% | 67.9% | 21.9% | 70.6% | 29.6% | 81.1% |
| Uninsured | 10.2% | 0.0% | 9.1% | 0.1% | 13.9% | *** | 16.4% | 0.1% | 23.1% | 1.2% | 28.8% | 2.6% |
| No college | 45.2% | 55.1% | 49.8% | 67.9% | 62.6% | 74.1% | 60.4% | 79.0% | 76.8% | 84.8% | 78.1% | 89.7% |
| *** = Data are statistically unreliable (cell size <100 or relative standard error >0.3) | ||||||||||||
| Relative Rates Comparing Men to Women | Relative Rates Comparing Adults 45–64 to Adults ≥65 | |||||||||||
|---|---|---|---|---|---|---|---|---|---|---|---|---|
| White 45-64 | White ≥65 |
Black 45-64 | Black ≥65 | Hispanic 45-64 | Hispanic ≥65 | White Male | White Female | Black Male | Black Female | Hispanic Male | Hispanic Female | |
| Diabetes Care | ||||||||||||
| Percentage of diabetics who had an HbA1c test in the past year | 1.02 | 0.99 | 0.93 | *** | 0.99 | 0.94 | 1.03 | 0.99 | *** | 1.01 | 0.98 | 0.93 |
| Percentage of diabetics who had their blood pressure checked in the past year | 0.98 | 1.00 | 0.98 | 1.00 | 0.98 | 0.98 | 0.98 | 1.00 | 0.99 | 1.01 | 0.95 | 0.95 |
| Percentage of diabetics who had their blood cholesterol checked in the past 2 years | 0.99 | 1.01 | 1.01 | 0.97 | 0.95 | 1.00 | 0.96 | 0.98 | 1.03 | 1.00 | 0.91 | 0.96 |
| Percentage of diabetics who received an eye examination in the past year | 0.97 | 1.02 | 0.91 | 0.93 | 1.10 | 0.98 | 0.84 | 0.88 | 0.89 | 0.91 | 0.89 | 0.79 |
| Percentage of diabetics who received a foot examination the past year | 1.02 | 1.06 | 0.97 | 0.91 | 1.06 | 0.96 | 1.01 | 1.04 | 1.01 | 0.95 | 0.96 | 0.86 |
| Composite: Percentage of diabetics who had an HbA1c test, eye and foot examination | 0.98 | 1.11 | 0.77 | 0.81 | 0.97 | 1.11 | 0.91 | 1.03 | 0.98 | 1.03 | 0.82 | 0.95 |
| Preventive Services | ||||||||||||
| Percentage of diabetics who received an influenza vaccine in the past year | 0.92 | 1.03 | 0.87 | 1.04 | 0.85 | 1.02 | 0.67 | 0.75 | 0.68 | 0.82 | 0.59 | 0.71 |
| Percentage of diabetics who received a dental check-up in the past year | 0.96 | 1.26 | 1.00 | 0.90 | 1.12 | 1.39 | 0.95 | 1.26 | 1.65 | 1.49 | 0.98 | 1.21 |
| Percentage of diabetic smokers who received advice to quit smoking in the past year | *** | *** | *** | *** | *** | *** | *** | *** | *** | *** | *** | *** |
| Access to Care | ||||||||||||
| Percentage of diabetics who reported problems receiving care as soon as they wanted in the past year | 0.71 | 1.34 | *** | *** | *** | *** | 1.40 | 2.64 | *** | *** | *** | *** |
| Percentage of diabetics who reported delays in getting necessary medical care in the past year | 0.53 | 1.11 | *** | *** | *** | *** | 1.54 | 3.24 | *** | *** | *** | *** |
| Percentage of diabetics who reported delays in getting necessary dental care in the past year | 0.70 | 0.50 | *** | *** | *** | *** | 3.14 | 2.27 | *** | 2.28 | *** | *** |
| Percentage of diabetics who reported delays in getting necessary prescription medications | 0.46 | 0.69 | *** | *** | *** | *** | 1.34 | 2.00 | *** | 1.86 | *** | 0.74 |
| Composite: Percentage of diabetics who were delayed in getting medical care, dental care, or prescription medications | 0.61 | 0.83 | 0.53 | 1.09 | 0.63 | *** | 1.43 | 1.95 | 0.82 | 1.68 | *** | 0.97 |
| Patient-Centeredness in Care | ||||||||||||
| Percentage of diabetics who felt their provider listened carefully | 1.00 | 1.01 | 1.06 | 0.98 | 1.01 | 1.06 | 0.96 | 0.97 | 1.02 | 0.94 | 0.89 | 0.94 |
| Percentage of diabetics whose provider explained things clearly | 1.00 | 1.01 | 1.01 | 1.01 | 0.98 | 1.13 | 0.97 | 0.98 | 0.95 | 0.95 | 0.89 | 1.02 |
| Percentage of diabetics whose provider showed respect | 1.00 | 0.99 | 1.02 | 0.95 | 1.02 | 1.04 | 0.96 | 0.96 | 0.98 | 0.92 | 0.97 | 0.99 |
| Percentage of diabetics whose provider spent enough time with them | 0.98 | 1.02 | 1.02 | 0.95 | 1.09 | 1.06 | 0.93 | 0.96 | 0.99 | 0.92 | 0.96 | 0.94 |
|
*** = Data are statistically unreliable (cell size <100 or relative standard error >0.3) Bold = Statistically significant difference (p<0.05) in RR Source: Agency for Healthcare Research and Quality, Center for Financing, Access and Cost Trends, Medical Expenditure Panel Survey. |
||||||||||||
| Relative Rates Comparing Men to Women | Relative Rates Comparing Adults 45–64 to Adults ≥65 | ||||||||||||||
|---|---|---|---|---|---|---|---|---|---|---|---|---|---|---|---|
| White 45-64 | White ≥65 |
Black 45-64 | Black ≥65 | Hispanic 45-64 | Hispanic ≥65 | White Male | White Female | Black Male | Black Female | Hispanic Male | Hispanic Female | ||||
| Cardiovascular Care | |||||||||||||||
| Percentage of cardio-vascular condition patients who had their blood pressure checked in the past year | 0.97 | 1.00 | 0.98 | 1.00 | 0.96 | 1.00 | 0.95 | 0.98 | 0.97 | 0.98 | 0.95 | 0.98 | |||
| Percentage of cardio-vascular condition patients who ever received advice to eat fewer high fat and high cholesterol foods | 1.03 | 1.08 | 0.99 | 0.86 | 1.00 | 1.07 | 1.12 | 1.18 | 1.14 | 0.99 | 1.01 | 1.08 | |||
| Percentage of cardio-vascular condition patients who ever received advice to exercise more | 0.95 | 1.06 | 0.91 | 1.00 | 0.93 | 1.01 | 1.17 | 1.30 | 1.12 | 1.24 | 1.09 | 1.19 | |||
| Access to Care | |||||||||||||||
| Percentage of cardio-vascular condition patients who reported problems receiving care as soon as they wanted in the past year | 0.96 | 1.14 | 0.53 | 1.07 | 1.02 | *** | 1.76 | 2.10 | 1.05 | 2.11 | *** | 1.84 | |||
| Percentage of cardio-vascular condition patients who reported delays in getting necessary medical care in the past year | 0.61 | 0.84 | 0.77 | 1.11 | 0.51 | *** | 1.90 | 2.59 | 1.71 | 2.47 | *** | 2.24 | |||
| Percentage of cardio-vascular condition patients who reported delays in getting necessary dental care in the past year | 0.63 | 0.56 | 0.73 | 0.89 | 0.81 | *** | 2.27 | 2.02 | 1.24 | 1.51 | *** | 1.80 | |||
| Percentage of cardio-vascular condition patients who reported delays in getting necessary prescription medications | 0.53 | 0.77 | 0.77 | 0.96 | 0.67 | *** | 1.45 | 2.09 | 1.21 | 1.50 | *** | 1.14 | |||
| Composite: Percentage of cardiovascular condition patients who were delayed in getting medical care, dental care, or prescription medications | 0.63 | 0.77 | 0.77 | 0.91 | 0.65 | 0.47 | 1.50 | 1.83 | 1.22 | 1.44 | 1.91 | 1.39 | |||
| Patient-Centeredness in Care | |||||||||||||||
| Percentage of cardio-vascular condition patients who felt their provider listened carefully | 1.01 | 1.03 | 1.00 | 1.01 | 1.01 | 1.04 | 0.97 | 0.98 | 0.96 | 0.97 | 0.93 | 0.96 | |||
| Percentage of cardio-vascular condition patients whose provider explained things clearly | 1.00 | 1.01 | 0.99 | 0.99 | 0.98 | 1.08 | 0.99 | 1.00 | 1.00 | 0.99 | 0.94 | 1.04 | |||
| Percentage of cardio-vascular condition patients whose provider showed respect | 1.01 | 1.01 | 0.98 | 0.97 | 1.00 | 1.02 | 0.97 | 0.97 | 0.97 | 0.96 | 0.97 | 0.99 | |||
| Percentage of cardio-vascular condition patients whose provider spent enough time with them | 1.01 | 1.03 | 1.01 | 0.98 | 1.00 | 1.04 | 0.96 | 0.98 | 0.96 | 0.94 | 0.92 | 0.96 | |||
|
*** = Data are statistically unreliable (cell size <100 or relative standard error >0.3) Bold = Statistically significant difference (p<0.05) in RR Source: Agency for Healthcare Research and Quality, Center for Financing, Access and Cost Trends, Medical Expenditure Panel Survey. |
|||||||||||||||
| Relative Rates Comparing Whites to Blacks |
Relative Rates Comparing Whites to Hispanics |
|||||||
|---|---|---|---|---|---|---|---|---|
| Male 45-64 | Male ≥65 | Female 45-64 | Female ≥65 | Male 45-64 | Male ≥65 | Female 45-64 | Female ≥65 | |
| Diabetes Testing | ||||||||
| Percentage of diabetics who had an HgA1c test in the past year | 1.10 | *** | 1.00 | 1.02 | 1.07 | 1.03 | 1.05 | 0.98 |
| Percentage of diabetics who had their blood pressure checked in the past year | 0.99 | 1.00 | 0.98 | 0.99 | 1.04 | 1.01 | 1.03 | 0.99 |
| Percentage of diabetics who had their blood cholesterol checked within the past 2 years | 0.98 | 1.05 | 1.00 | 1.01 | 1.07 | 1.01 | 1.03 | 1.00 |
| Percentage of diabetics who received an eye examination in the past year | 1.13 | 1.20 | 1.06 | 1.10 | 1.08 | 1.15 | 1.24 | 1.11 |
| Percentage of diabetics who received a foot examination the past year | 0.99 | 1.00 | 0.94 | 0.86 | 1.08 | 1.03 | 1.12 | 0.93 |
| Composite: Percentage of diabetics who had an HbA1c test, eye and foot examination | 1.33 | 1.43 | 1.05 | 1.05 | 1.27 | 1.15 | 1.26 | 1.16 |
| Preventive Services | ||||||||
| Percentage of diabetics who received an influenza vaccine in the past year | 1.45 | 1.46 | 1.36 | 1.48 | 1.36 | 1.19 | 1.26 | 1.18 |
| Percentage of diabetics who received a dental check-up in the past year | 1.05 | 1.82 | 1.10 | 1.30 | 1.15 | 1.18 | 1.34 | 1.29 |
| Percentage of diabetic smokers who received advice to quit smoking in the past year | *** | *** | *** | *** | *** | *** | *** | *** |
| Access to Care | ||||||||
| Percentage of diabetics who reported problems receiving care as soon as they wanted in the past year | *** | *** | 0.92 | *** | *** | *** | 0.81 | *** |
| Percentage of diabetics who reported delays in getting necessary medical care in the past year | *** | *** | 1.87 | *** | *** | *** | 1.24 | *** |
| Percentage of diabetics who reported delays in getting necessary dental care in the past year | *** | *** | 1.15 | 1.15 | 1.04 | *** | *** | 0.87 |
| Percentage of diabetics who reported delays in getting necessary prescription medications | *** | *** | 1.13 | 1.05 | *** | *** | 1.98 | 0.73 |
| Composite: Percentage of diabetics who were delayed in getting medical care, dental care or prescription medications | 1.56 | 0.90 | 1.37 | 1.18 | 1.52 | *** | 1.57 | 0.78 |
| Patient-Centeredness in Care | ||||||||
| Percentage of diabetics who felt their provider listened carefully | 0.97 | 1.02 | 1.02 | 0.99 | 1.02 | 0.95 | 1.03 | 1.00 |
| Percentage of diabetics whose provider explained things clearly | 1.04 | 1.01 | 1.05 | 1.01 | 1.07 | 0.98 | 1.05 | 1.10 |
| Percentage of diabetics whose provider showed respect | 1.02 | 1.04 | 1.04 | 1.00 | 0.98 | 0.99 | 1.00 | 1.03 |
| Percentage of diabetics whose provider spent enough time with them | 1.00 | 1.06 | 1.04 | 0.99 | 0.95 | 0.97 | 1.05 | 1.02 |
|
*** = Data are statistically unreliable (cell size <100 or relative standard error >0.3) Bold = Statistically significant difference (p<0.05) in RR Source: Agency for Healthcare Research and Quality, Center for Financing, Access and Cost Trends, Medical Expenditure Panel Survey. |
||||||||
| Relative Rates Comparing Whites to Blacks |
Relative Rates Comparing Whites to Hispanics |
|||||||
|---|---|---|---|---|---|---|---|---|
| Male 45-64 | Male ≥65 | Female 45-64 | Female ≥65 | Male 45-64 | Male ≥65 | Female 45-64 | Female ≥65 | |
| Cardiovascular Care | ||||||||
| Percentage of cardiovascular condition patients who had their blood pressure checked in the past year | 0.98 | 1.00 | 0.99 | 0.99 | 1.02 | 1.01 | 1.01 | 1.01 |
| Percentage of cardiovascular condition patients who ever received advice to eat fewer high fat and high cholesterol foods | 1.10 | 1.11 | 1.06 | 0.89 | 0.96 | 0.86 | 0.93 | 0.85 |
| Percentage of cardiovascular condition patients who ever received advice to exercise more | 1.03 | 0.99 | 0.99 | 0.94 | 0.97 | 0.90 | 0.94 | 0.86 |
| Access to Care | ||||||||
| Percentage of cardiovascular condition patients who reported problems receiving care as soon as they wanted in the past year | 1.41 | 0.84 | 0.79 | 0.79 | 0.64 | *** | 0.68 | 0.60 |
| Percentage of cardiovascular condition patients who reported delays in getting necessary medical care in the past year | 1.12 | 1.01 | 1.40 | 1.34 | 1.09 | *** | 0.91 | 0.78 |
| Percentage of cardiovascular condition patients who reported delays in getting necessary dental care in the past year | 0.75 | 0.41 | 0.87 | 0.65 | 0.65 | *** | 0.83 | 0.74 |
| Percentage of cardiovascular condition patients who reported delays in getting necessary prescription medications | 0.68 | 0.57 | 0.99 | 0.71 | 1.05 | *** | 1.32 | 0.72 |
| Composite: Percentage of cardiovascular condition patients who were delayed in getting medical care, dental care, or prescription medications | 0.88 | 0.71 | 1.07 | 0.84 | 1.02 | 1.30 | 1.05 | 0.80 |
| Patient-Centeredness in Care | ||||||||
| Percentage of cardiovascular condition patients who felt their provider listened carefully | 1.02 | 1.01 | 1.01 | 1.00 | 1.02 | 0.98 | 1.02 | 0.99 |
| Percentage of cardiovascular condition patients whose provider explained things clearly | 1.04 | 1.04 | 1.03 | 1.02 | 1.06 | 1.01 | 1.04 | 1.08 |
| Percentage of cardiovascular condition patients whose provider showed respect | 1.04 | 1.04 | 1.00 | 0.99 | 1.00 | 1.00 | 0.99 | 1.01 |
| Percentage of cardiovascular condition patients whose provider spent enough time with them | 1.05 | 1.05 | 1.04 | 0.99 | 1.03 | 0.99 | 1.02 | 1.00 |
|
*** = Data are statistically unreliable (cell size <100 or relative standard error >0.3) Bold = Statistically significant difference (p<0.05) in RR Source: Agency for Healthcare Research and Quality, Center for Financing, Access and Cost Trends, Medical Expenditure Panel Survey. |
||||||||
| White Male 45-64 |
White Male >65 | White Female 45-64 | White Female >65 | Black Male 45-64 | Black Male >65 | Black Female 45-64 | Black Female >65 | Hispanic Male 45-64 |
Hispanic Male >65 | Hispanic Female 45-64 | Hispanic Female >65 | |
|---|---|---|---|---|---|---|---|---|---|---|---|---|
| Diabetes Testing | ||||||||||||
| Percentage of diabetics who had an HgA1c test in the past year | 93.7 | 91.3 | 91.9 | 92.7 | 84.9 | * | 91.6 | 90.7 | 87.2 | 89.1 | 87.6 | 94.6 |
| Percentage of diabetics who had their blood pressure checked in the past year | 96.2 | 98.6 | 98.0 | 98.1 | 97.3 | 98.7 | 99.8 | 98.9 | 92.7 | 98.0 | 94.8 | 99.6 |
| Percentage of diabetics who had their blood cholesterol checked in the past 2 years | 96.0 | 99.6 | 97.2 | 98.9 | 98.1 | 95.1 | 97.2 | 97.5 | 89.8 | 98.4 | 94.5 | 98.4 |
| Percentage of diabetics who received an eye examination in the past year | 59.8 | 71.6 | 62.0 | 70.4 | 53.1 | 59.6 | 58.4 | 64.2 | 55.2 | 62.2 | 50.2 | 63.5 |
| Percentage of diabetics who received a foot examination the past year | 73.1 | 72.8 | 71.6 | 68.9 | 73.5 | 72.8 | 76.0 | 80.1 | 67.4 | 70.5 | 63.7 | 73.7 |
| Composite: Percentage of diabetics who had an HgA1c test, eye and foot examination | 44.0 | 48.2 | 44.9 | 43.6 | 33.0 | 33.6 | 42.9 | 41.6 | 34.5 | 41.9 | 35.6 | 37.7 |
| Preventive Services | ||||||||||||
| Percentage of diabetics who received an influenza vaccine in the past year | 51.7 | 76.9 | 56.1 | 74.5 | 35.7 | 52.5 | 41.2 | 50.3 | 37.9 | 64.4 | 44.6 | 63.0 |
| Percentage of diabetics who received a dental check-up in the past year | 53.9 | 56.5 | 56.4 | 44.7 | 51.1 | 31.0 | 51.4 | 34.5 | 46.9 | 48.1 | 42.0 | 34.6 |
| Percentage of diabetic smokers who received advice to quit smoking in the past year | *** | *** | 83.2 | *** | *** | *** | *** | *** | *** | *** | *** | *** |
| Access to Care | ||||||||||||
| Percentage of diabetics who reported problems receiving care as soon as they wanted in the past year | 11.8 | 8.4 | 16.6 | 6.3 | *** | *** | 18.1 | *** | *** | *** | 20.5 | *** |
| Percentage of diabetics who reported delays in getting necessary medical care in the past year | 8.7 | 5.6 | 16.4 | 5.1 | *** | *** | 8.8 | *** | *** | *** | 13.2 | *** |
| Percentage of diabetics who reported delays in getting necessary dental care in the past year | 8.8 | 2.8 | 12.6 | 5.5 | *** | *** | 10.9 | 4.8 | 8.5 | *** | *** | 6.3 |
| Percentage of diabetics who reported delays in getting necessary prescription medications | 8.3 | 6.2 | 18.0 | 9.0 | *** | *** | 15.9 | 8.6 | *** | *** | 9.1 | 12.3 |
| Composite: Percentage of diabetics who were delayed in getting medical care, dental care, or prescription medications | 18.8 | 13.1 | 31.0 | 15.9 | 12.0 | 14.7 | 22.7 | 13.5 | 12.4 | *** | 19.7 | 20.4 |
| Diabetes Patient-Centeredness in Care | ||||||||||||
| Percentage of diabetics who felt their provider listened carefully | 90.4 | 94.1 | 90.5 | 93.2 | 93.6 | 92.0 | 88.5 | 93.7 | 88.7 | 99.4 | 88.1 | 93.5 |
| Percentage of diabetics whose provider explained things clearly | 92.3 | 94.8 | 92.6 | 94.3 | 89.0 | 93.8 | 88.0 | 93.1 | 85.9 | 96.8 | 87.8 | 85.8 |
| Percentage of diabetics whose provider showed respect | 90.3 | 94.2 | 90.6 | 94.8 | 88.8 | 90.5 | 87.3 | 94.8 | 92.3 | 95.1 | 90.6 | 91.7 |
| Percentage of diabetics whose provider spent enough time with them | 85.5 | 91.6 | 86.9 | 90.1 | 85.4 | 86.4 | 83.8 | 90.9 | 90.3 | 94.0 | 83.0 | 88.3 |
|
*** = Data are statistically unreliable (cell size <100 or relative standard error >0.3) Source: Agency for Healthcare Research and Quality, Center for Financing, Access and Cost Trends, Medical Expenditure Panel Survey. |
||||||||||||
| White Male 45-64 |
White Male ≥65 | White Female 45-64 | White Female >65 | Black Male 45-64 |
Black Male ≥65 | Black Female 45-64 | Black Female ≥65 | Hispanic Male 45-64 |
Hispanic Male ≥65 | Hispanic Female 45-64 | Hispanic Female ≥65 | |
|---|---|---|---|---|---|---|---|---|---|---|---|---|
| Cardiovascular Care | ||||||||||||
| Percentage of cardiovascular condition patients who had their blood pressure checked in the past year | 92.9 | 97.8 | 95.6 | 97.4 | 94.6 | 97.7 | 96.6 | 98.2 | 91.2 | 96.5 | 95.1 | 96.9 |
| Percentage of cardiovascular condition patients who ever received advice to eat fewer high fat and high cholesterol foods | 68.2 | 61.0 | 66.2 | 56.3 | 62.1 | 54.7 | 62.5 | 63.4 | 71.2 | 70.6 | 71.1 | 66.1 |
| Percentage of cardiovascular condition patients who ever received advice to exercise more | 66.6 | 57.0 | 70.0 | 53.8 | 64.4 | 57.4 | 71.0 | 57.4 | 68.9 | 63.0 | 74.3 | 62.5 |
| Access to Care | ||||||||||||
| Percentage of cardiovascular condition patients who reported problems receiving care as soon as they wanted in the past year | 12.3 | 7.0 | 12.9 | 6.1 | 8.7 | 8.3 | 16.3 | 7.7 | 19.1 | *** | 18.8 | 10.2 |
| Percentage of cardiovascular condition patients who reported delays in getting necessary medical care in the past year | 7.0 | 3.7 | 11.4 | 4.4 | 6.2 | 3.6 | 8.1 | 3.3 | 6.4 | *** | 12.5 | 5.6 |
| Percentage of diabetics who reported delays in getting necessary dental care in the past year | 5.9 | 2.6 | 9.3 | 4.6 | 7.8 | 6.3 | 10.7 | 7.1 | 9.1 | *** | 11.2 | 6.2 |
| Percentage of cardiovascular condition patients who reported delays in getting necessary prescription medications | 5.8 | 4.0 | 10.9 | 5.2 | 8.5 | 7.0 | 11.0 | 7.3 | 5.5 | *** | 8.2 | 7.2 |
| Composite: Percentage of cardiovascular condition patients who were delayed in getting medical care, dental care, or prescription medications | 14.0 | 9.4 | 22.3 | 12.2 | 16.0 | 13.1 | 20.8 | 14.5 | 13.8 | 7.2 | 21.1 | 15.2 |
| Patient-Centeredness in Care | ||||||||||||
| Percentage of cardiovascular condition patients who felt their provider listened carefully | 92.3 | 95.5 | 91.4 | 93.0 | 90.9 | 94.3 | 90.5 | 93.4 | 90.4 | 97.6 | 89.6 | 93.6 |
| Percentage of cardiovascular condition patients whose provider explained things clearly | 93.3 | 94.2 | 93.1 | 93.2 | 90.0 | 90.2 | 90.4 | 91.3 | 87.8 | 93.0 | 89.5 | 86.5 |
| Percentage of cardiovascular condition patients whose provider showed respect | 93.0 | 95.4 | 91.6 | 94.1 | 89.0 | 92.1 | 91.2 | 95.4 | 92.7 | 95.1 | 93.0 | 93.5 |
| Percentage of cardiovascular condition patients whose provider spent enough time with them | 89.1 | 92.7 | 87.8 | 89.7 | 85.1 | 88.3 | 84.7 | 90.3 | 86.1 | 93.8 | 86.1 | 89.8 |
| Source: Agency for Healthcare Research and Quality, Center for Financing, Access and Cost Trends, Medical Expenditure Panel Survey. | ||||||||||||
| Total Number of Patients | Diabetes | Cardiovascular Conditions |
|---|---|---|
| Unweighted sample size | N=4,076 | N=17,636 |
| Weighted sample size | N=13,504,000 | N=57,707,000 |
| Characteristics | ||
| Age Group | ||
| 45–64 years | 54.4% | 55.7% |
| >65 years | 45.6% | 44.3% |
| Gender | ||
| Male | 48.4% | 46.2% |
| Female | 51.6% | 53.8% |
| Insurance Status a | ||
| 45–64 years | ||
| Any private insurance | 69.0% | 56.0% |
| Public insurance only | 20.2% | 10.9% |
| Uninsured | 10.8% | 10.1% |
| >65 years | ||
| Medicare/public insurance only | 44.8% | 39.1% |
| Medicare and any private insurance | 55.2% | 60.9% |
| Characteristic Profile (Combined Type of Characteristics) | ||
| 45–64 years, Male | ||
| Any private insurance, male | 73.7% | 80.4% |
| Public insurance only, male | 16.4% | 9.2% |
| Uninsured, male | 9.9% | 10.4% |
| 45–64 years, Female | ||
| Any private insurance, female | 64.4% | 77.6% |
| Public insurance only, female | 23.9% | 12.6% |
| Uninsured, female | 11.7% | 9.8% |
| >65 years, Male | ||
| Medicare and any private insurance, male | 62.9% | 67.4% |
| Medicare/public insurance only, male | 37.1% | 32.6% |
| >65 years, Female | ||
| Medicare and any private insurance, female | 48.2% | 56.3% |
| Medicare/public insurance only, female | 51.8% | 43.7% |
|
a Indicates insurance status in the previous year. Source: Agency for Healthcare Research and Quality, Center for Financing, Access and Cost Trends, Medical Expenditure Panel Survey. |
||
| All—Percentage | 45–64 | ≥65 | ||||||||||
|---|---|---|---|---|---|---|---|---|---|---|---|---|
| Any Private Insurance | Public Insurance Only | Uninsured | Medicare/Public Insurance Only | Medicare and Any Private Insurance | ||||||||
| Male, % |
Female, % | Male, % |
Female, % | Male, % |
Female, % | Male, % |
Female, % | Male, % |
Female, % | |||
| Diabetes patients (N) | 4,076 | 621 | 622 | 216 | 428 | 124 | 207 | 364 | 650 | 430 | 414 | |
| Mean age (in years) | — | 56 | 55 | 56 | 55 | 55 | 54 | 74 a | 75 a | 73 a | 75 a | |
| Race/Ethnicity | ||||||||||||
| Non-Hispanic White | 56.8% | 66.5% | 62.9% | 51.4% | 37.6% | 44.4% | 30.9% | 50.5% | 42.6% | 80.7% | 75.1% | |
| Non-Hispanic Black | 20.6% | 16.4% | 19.6% | 20.8% | 31.8% | 9.7% | 20.8% | 22.8% | 26.6% | 11.9% | 17.6% | |
| Hispanic, any race | 22.6% | 17.1% | 17.5% | 27.8% | 30.6% | 46.0% | 48.3% | 26.6% | 30.8% | 7.4% | 7.2% | |
| Education | ||||||||||||
| < High-school graduate | 71.0% | 56.4% | 59.5% | 81.9% | 82.5% | 75.0% | 85.0% | 79.9% | 86.9% | 54.0% | 68.8% | |
| Some college or higher | 29.0% | 43.6% | 40.5% | 18.1% | 17.5% | 25.0% | 15.0% | 20.1% | 13.1% | 46.0% | 31.2% | |
| Income | ||||||||||||
| Poor, near poor, low | 47.4% | 18.2% | 22.3% | 83.3% | 83.2% | 50.0% | 72.0% | 58.8% | 71.4% | 23.0% | 38.2% | |
| Middle or high | 52.6% | 81.8% | 77.7% | 16.7% | 16.8% | 50.0% | 28.0% | 41.2% | 28.6% | 77.0% | 61.8% | |
| Self-Rated Health Status | ||||||||||||
| Excellent, very good, good | 55.1% | 69.4% | 63.8% | 31.0% | 30.1% | 59.7% | 51.2% | 48.6% | 49.4% | 67.0% | 61.4% | |
| Fair or poor | 44.9% | 30.6% | 36.2% | 69.0% | 69.9% | 40.3% | 48.8% | 51.4% | 50.6% | 33.0% | 38.6% | |
| Cardiovascular patients (N) | 17,636 | 3,276 | 3,515 | 616 | 1,072 | 558 | 753 | 1,249 | 2,409 | 1,885 | 2,303 | |
| Mean age (in years) | — | 55 | 55 | 55 | 55 | 55 | 55 | 74 a | 76 a | 74 a | 75 a | |
| Race/Ethnicity | ||||||||||||
| Non-Hispanic White | 68.4% | 76.2% | 70.9% | 55.5% | 42.9% | 57.3% | 39.4% | 61.9% | 55.3% | 85.3% | 84.2% | |
| Non-Hispanic Black | 17.0% | 12.8% | 18.2% | 20.8% | 31.5% | 15.4% | 25.4% | 19.4% | 21.8% | 9.7% | 10.9% | |
| Hispanic, any race | 14.6% | 11.1% | 11.0% | 23.7% | 25.6% | 27.2% | 35.2% | 18.7% | 22.8% | 5.0% | 4.8% | |
| Education | ||||||||||||
| < High-school graduate | 61.3% | 44.2% | 46.5% | 81.3% | 78.7% | 71.5% | 78.4% | 75.7% | 82.1% | 52.4% | 64.3% | |
| Some college or higher | 38.7% | 55.8% | 53.5% | 18.7% | 21.3% | 28.5% | 21.6% | 24.3% | 17.9% | 47.6% | 35.7% | |
| Income | ||||||||||||
| Poor, near poor, low | 37.5% | 12.6% | 15.5% | 82.3% | 82.4% | 55.6% | 66.3% | 55.4% | 64.9% | 22.0% | 34.4% | |
| Middle or high | 62.5% | 87.4% | 84.5% | 17.7% | 17.6% | 44.4% | 33.7% | 44.6% | 35.1% | 78.0% | 65.6% | |
| Self-Rated Health Status | ||||||||||||
| Excellent, very good, good | 70.3% | 82.4% | 80.6% | 32.8% | 34.4% | 63.1% | 61.1% | 61.4% | 61.2% | 78.1% | 76.6% | |
| Fair or poor | 29.7% | 17.6% | 19.4% | 67.2% | 65.6% | 36.9% | 38.9% | 38.6% | 38.8% | 21.9% | 23.4% | |
|
a Age was top-coded at 85. Source: Agency for Healthcare Research and Quality, Center for Financing, Access and Cost Trends, Medical Expenditure Panel Survey. |
||||||||||||
| Patient Reported Receipt of the Following in the Past Yeara | All—Percentage | 45–64 | ≥65 | |||||||||
|---|---|---|---|---|---|---|---|---|---|---|---|---|
| Any Private Insurance | Public Insurance Only | Uninsured | Medicare/Public Insurance Only | Medicare and Any Private Insurance | ||||||||
| Male, % |
Female, % | Male, % |
Female, % | Male, % |
Female, % | Male, % |
Female, % | Male, % |
Female, % | |||
| Effectiveness of Care | ||||||||||||
| Testing of HbA1c | 91.67 | 93.15 | 93.62 | 92.38 | 88.55 | 78.99 | 80.79 | 92.50 | 92.08 | 90.04 | 94.38 | |
| Testing of blood pressure | 97.60 | 96.66 | 98.87 | 96.74 | 98.55 | 88.82 | 90.69 | 97.88 | 99.14 | 98.88 | 97.62 | |
| Testing of blood cholesterolb | 97.32 | 97.22 | 98.37 | 95.33 | 95.53 | 82.02 | 91.09 | 98.48 | 97.69 | 99.17 | 99.48 | |
| Receiving an eye examination | 63.41 | 62.56 | 64.70 | 47.24 | 58.22 | 46.96 | 33.09 | 67.58 | 66.06 | 69.90 | 70.92 | |
| Receiving a foot examination | 71.93 | 72.80 | 71.56 | 81.29 | 72.66 | 57.07 | 66.73 | 72.43 | 67.04 | 72.80 | 75.78 | |
| Composite: HbA1c, eye and foot examination | 43.16 | 44.53 | 47.94 | 31.62 | 39.04 | 33.48 | 24.16 | 45.29 | 38.33 | 46.35 | 47.64 | |
| Receiving an influenza shot | 59.41 | 48.15 | 55.81 | 52.81 | 45.15 | 35.17 | 41.19 | 74.31 | 64.54 | 72.29 | 74.22 | |
| Timeliness/Accessibility of Care | ||||||||||||
| Unable to get care for illness/ injury | 11.97 | 9.52 | 15.76 | * | 14.64 | * | * | 10.02 | 9.43 | * | * | |
| Delays in medical care | 8.33 | 6.21 | 10.87 | * | 20.33 | 11.93 | 21.70 | 4.56 | 6.37 | 5.29 | 3.77 | |
| Delays in dental care | 7.41 | 4.14 | 8.54 | 16.52 | 19.02 | 21.21 | 15.54 | 5.02 | 6.33 | * | 4.83 | |
| Delays in prescriptions | 10.17 | 7.21 | 13.46 | 11.17 | 21.05 | 10.02 | 21.20 | 5.66 | 10.47 | 6.04 | 8.20 | |
| Composite: delays in care | 18.70 | 13.05 | 23.26 | 25.99 | 36.80 | 30.41 | 33.09 | 11.71 | 17.52 | 12.64 | 14.82 | |
| Patient-Centeredness of Care | ||||||||||||
| Provider listened | 91.88 | 91.52 | 91.05 | 87.05 | 85.45 | * | 91.84 | 95.31 | 91.02 | 93.76 | 95.70 | |
| Provider explained things | 92.49 | 91.74 | 92.58 | 89.76 | 87.88 | * | 90.66 | 95.78 | 90.36 | 94.37 | 96.05 | |
| Provider showed respect | 92.05 | 90.67 | 91.67 | 90.16 | 86.69 | * | 86.96 | 94.72 | 92.90 | 93.54 | 96.04 | |
| Provider spent time | 88.06 | 86.73 | 87.20 | 83.97 | 81.85 | * | 86.53 | 92.67 | 87.46 | 90.34 | 92.59 | |
| Composite: Patient-centeredness | 90.14 | 89.21 | 89.84 | 87.16 | 84.07 | * | 88.07 | 93.51 | 89.64 | 92.04 | 93.58 | |
| Effectiveness of Care | ||||||||||||
| Testing of blood pressure | 95.74 | 93.68 | 96.83 | 96.92 | 96.74 | 83.38 | 85.26 | 97.73 | 97.25 | 97.62 | 97.58 | |
| Dietary advicec | 63.45 | 69.36 | 66.63 | 67.04 | 66.86 | 56.47 | 60.25 | 57.50 | 58.77 | 62.77 | 56.91 | |
| Exercise advicec | 63.01 | 68.27 | 71.84 | 63.79 | 67.31 | 55.80 | 65.54 | 54.49 | 53.59 | 58.83 | 55.88 | |
| Testing of blood cholesterolb | 93.80 | 92.97 | 94.45 | 93.73 | 92.43 | 76.66 | 79.98 | 95.97 | 95.44 | 96.73 | 95.68 | |
| Influenza shot | 51.79 | 34.66 | 41.17 | 47.03 | 41.63 | 25.29 | 27.30 | 66.44 | 64.68 | 72.70 | 72.66 | |
| Timeliness/Accessibility of Care | ||||||||||||
| Delays in medical care | 6.76 | 4.68 | 7.56 | 12.05 | 18.74 | 19.48 | 27.43 | 3.86 | 5.43 | 3.58 | 3.43 | |
| Delays in dental care | 6.34 | 3.92 | 6.91 | 15.18 | 18.16 | 17.34 | 21.61 | 4.11 | 6.16 | 2.34 | 4.18 | |
| Delays in prescriptions | 6.85 | 4.27 | 8.03 | 13.06 | 18.44 | 13.68 | 20.74 | 4.00 | 6.39 | 4.19 | 4.96 | |
| Composite: delays in care | 15.12 | 10.53 | 17.43 | 28.31 | 35.12 | 30.80 | 40.66 | 10.06 | 14.28 | 9.24 | 11.37 | |
| Unable to get care for illness/ injury | 10.31 | 9.64 | 10.76 | 13.59 | 17.06 | 30.67 | 31.55 | 6.45 | 8.57 | 7.32 | 4.80 | |
| Patient-Centeredness of Care | ||||||||||||
| Provider listened | 92.75 | 93.02 | 92.35 | 88.53 | 85.69 | 86.21 | 88.15 | 94.25 | 91.70 | 96.20 | 94.17 | |
| Provider explained things | 92.81 | 93.88 | 93.99 | 86.83 | 86.79 | 86.17 | 87.26 | 93.56 | 90.72 | 94.00 | 93.90 | |
| Provider showed respect | 93.26 | 93.82 | 93.00 | 88.88 | 86.84 | 83.92 | 87.29 | 94.89 | 92.87 | 95.27 | 95.26 | |
| Provider spent time | 89.23 | 89.80 | 88.58 | 83.60 | 81.79 | 80.21 | 83.34 | 91.40 | 88.29 | 92.97 | 90.89 | |
| Composite: Patient-centeredness | 91.84 | 92.47 | 91.93 | 86.86 | 84.85 | 84.10 | 86.05 | 93.36 | 90.66 | 94.45 | 93.30 | |
|
Proportions are weighted. aAll quality of care measures indicate care in the past year, unless otherwise noted. bTesting of blood cholesterol indicates testing in the past two years. cDietary advice and exercise advice indicates receipt of advice at any time in the past. * = Data are not statistically reliable (cell size <100 or relative standard error >0.3). Source: Agency for Healthcare Research and Quality, Center for Financing, Access and Cost Trends, Medical Expenditure Panel Survey. |
||||||||||||
| Quality of Care Indicator | Adjusted Odds Ratioa (95% CI) | |||||||||
|---|---|---|---|---|---|---|---|---|---|---|
| 45–64 | ≥65 | |||||||||
| Insurance Status | Gender | Insurance Status | Gender | |||||||
| Any Private Insurance (Ref) | Public Insurance Only | Uninsured | Male (Ref) | Female | Medicare and Any Private Insurance (Ref) | Medicare/Public Insurance Only | Male (Ref) | Female | ||
| Effectiveness of Care | ||||||||||
| Testing of HbA1c | 1.00 | 0.85 (0.53-1.38) | 0.35 (0.22-0.57)* | 1.00 | 1.02 (0.67-1.56) | 1.00 | 1.16 (0.74-1.81) | 1.00 | 1.49 (1.02-2.19) | |
| Testing of blood pressure | 1.00 | 1.37 (0.35-5.37) | 0.29 (0.11-0.73) | 1.00 | 2.15 (1.05-4.40) | 1.00 | 1.39 (0.53-3.66) | 1.00 | 1.01 (0.38-2.66) | |
| Testing of blood cholesterolb | 1.00 | 0.49 (0.22-1.12) | 0.17 (0.08-0.35)* | 1.00 | 1.68 (1.01-2.77) | 1.00 | 0.60 (0.21-1.67) | 1.00 | 1.05 (0.51-2.16) | |
| Receiving an eye examination | 1.00 | 0.88 (0.64-1.22) | 0.46 (0.33-0.63)* | 1.00 | 1.13 (0.91-1.41) | 1.00 | 0.97 (0.75-1.25) | 1.00 | 1.07 (0.84-1.36) | |
| Receiving a foot examination | 1.00 | 1.61 (1.12-2.32) | 0.82 (0.57-1.19) | 1.00 | 0.96 (0.73-1.25) | 1.00 | 0.75 (0.54-1.03) | 1.00 | 0.98 (0.75-1.28) | |
| Composite :HbA1c, eye and foot examination | 1.00 | 0.95 (0.67-1.35) | 0.60 (0.43-0.84) | 1.00 | 1.17 (0.94-1.46) | 1.00 | 0.91 (0.69-1.2) | 1.00 | 0.99 (0.76-1.29) | |
| Receiving an influenza shot | 1.00 | 1.01 (0.73-1.40) | 0.68 (0.48-0.96) | 1.00 | 1.25 (0.99-1.58) | 1.00 | 0.99 (0.71-1.39) | 1.00 | 0.91 (0.7-1.19) | |
| Timeliness/Accessibility of Care | ||||||||||
| Unable to get care for illness/injury | 1.00 | 0.52 (0.27-0.97) | 2.43 (1.22-4.86) | 1.00 | 1.27 (0.76-2.12) | 1.00 | 1.45 (0.71-2.97) | 1.00 | 0.75 (0.42-1.33) | |
| Delays in medical care | 1.00 | 1.79 (1.08-2.97) | 2.35 (1.40-3.96)* | 1.00 | 1.98 (1.38-2.84)* | 1.00 | 1.30 (0.75-2.24) | 1.00 | 1.02 (0.64-1.63) | |
| Delays in dental care | 1.00 | 2.92 (1.63-5.21)* | 3.60 (2.04-6.36)* | 1.00 | 1.46 (0.99-2.16) | 1.00 | 1.62 (0.90-2.93) | 1.00 | 1.67 (0.99-2.81) | |
| Delays in prescriptions | 1.00 | 1.20 (0.75-1.93) | 1.63 (0.98-2.73) | 1.00 | 2.11 (1.47-3.02)* | 1.00 | 1.07 (0.67-1.73) | 1.00 | 1.54 (0.97-2.43) | |
| Composite: Delays in care | 1.00 | 1.85 (1.26-2.72)* | 2.37 (1.54-3.67)* | 1.00 | 1.85 (1.39-2.47)* | 1.00 | 1.06 (0.72-1.56) | 1.00 | 1.34 (0.97-1.84) | |
| Provider listened | 1.00 | 0.94 (0.55-1.60) | 1.17 (0.61-2.22) | 1.00 | 1.00 (0.68-1.47) | 1.00 | 0.68 (0.41-1.14) | 1.00 | 0.85 (0.54-1.36) | |
| Provider explained things | 1.00 | 1.15 (0.66-2.00) | 0.98 (0.56-1.72) | 1.00 | 1.16 (0.79-1.70) | 1.00 | 0.73 (0.43-1.24) | 1.00 | 0.79 (0.51-1.23) | |
| Provider showed respect | 1.00 | 1.12 (0.70-1.82) | 0.74 (0.43-1.26) | 1.00 | 1.07 (0.73-1.56) | 1.00 | 0.86 (0.51-1.45) | 1.00 | 1.13 (0.72-1.77) | |
| Provider spent time | 1.00 | 1.02 (0.63-1.63) | 0.92 (0.52-1.62) | 1.00 | 1.09 (0.75-1.56) | 1.00 | 0.83 (0.52-1.33) | 1.00 | 0.90 (0.60-1.35) | |
| Composite: Patient-centeredness | 1.00 | 1.04 (0.71-1.52) | 0.48 (0.33-0.69)* | 1.00 | 1.22 (0.92-1.61) | 1.00 | 0.99 (0.69-1.42) | 1.00 | 1.12 (0.82-1.52) | |
|
Analyses are weighted. aAll models adjust for patient race/ethnicity, education, income, and self-rated health status. *P <0.002. Statistically significant results are indicated by bold font Source: Agency for Healthcare Research and Quality, Center for Financing, Access and Cost Trends, Medical Expenditure Panel Survey. |
||||||||||
| Quality of Care Indicator | Adjusted Odds Ratioa (95% CI) | ||||||||
|---|---|---|---|---|---|---|---|---|---|
| 45–64 | ≥65 | ||||||||
| Insurance Status | Gender | Insurance Status | Gender | ||||||
| Any Private Insurance (Ref) | Public Insurance Only | Uninsured | Male (Ref) | Female | Medicare and Any Private Insurance (Ref) | Medicare/Public Insurance Only | Male (Ref) | Female | |
| Effectiveness of Care | |||||||||
| Testing of blood pressure | 1.00 | 1.44 (0.96-2.15) | 0.28 (0.21-0.37)* | 1.00 | 1.67 (1.35-2.07)* | 1.00 | 0.97 (0.67-1.42) | 1.00 | 0.98 (0.69-1.37) |
| Dietary advicec | 1.00 | 1.00 (0.82-1.23) | 0.69 (0.57-0.84)* | 1.00 | 0.93 (0.85-1.02) | 1.00 | 0.97 (0.85-1.10) | 1.00 | 0.90 (0.80-1.02) |
| Exercise advicec | 1.00 | 0.79 (0.65-0.95) | 0.65 (0.54-0.79)* | 1.00 | 1.21 (1.09-1.35)* | 1.00 | 0.90 (0.79-1.01) | 1.00 | 0.95 (0.86-1.06) |
| Testing of blood cholesterolb | 1.00 | 1.12 (0.86-1.47) | 0.29 (0.23-0.37)* | 1.00 | 1.22 (1.01-1.48) | 1.00 | 0.97 (0.71-1.32) | 1.00 | 0.86 (0.62-1.19) |
| Influenza shot | 1.00 | 1.22 (1.01-1.48) | 0.60 (0.48-0.74)* | 1.00 | 1.26 (1.13-1.41)* | 1.00 | 0.81 (0.68-0.96) | 1.00 | 1.00 (0.90-1.12) |
| Timeliness/Accessibility of Care | |||||||||
| Unable to get care for illness/injury | 1.00 | 0.94 (0.62-1.43) | 3.02 (2.15-4.24)* | 1.00 | 1.13 (0.86-1.49) | 1.00 | 1.22 (0.83-1.77) | 1.00 | 0.88 (0.63-1.23)) |
| Delays in medical care | 1.00 | 1.77 (1.34-2.35)* | 3.99 (3.09-5.16)* | 1.00 | 1.72 (1.46-2.02)* | 1.00 | 1.36 (1.03-1.80) | 1.00 | 1.15 (0.86-1.53) |
| Delays in dental care | 1.00 | 2.19 (1.53-3.13)* | 3.39 (2.61-4.40)* | 1.00 | 1.56 (1.31-1.86)* | 1.00 | 1.36 (1.00-1.84) | 1.00 | 1.61 (1.25-2.08)* |
| Delays in prescriptions | 1.00 | 1.48 (1.13-1.93) | 2.41 (1.88-3.08)* | 1.00 | 1.84 (1.53-2.22)* | 1.00 | 1.03 (0.78-1.37) | 1.00 | 1.34 (1.07-1.66) |
| Composite: Delays in care | 1.00 | 1.71 (1.40-2.09)* | 2.83 (2.33-3.43)* | 1.00 | 1.72 (1.53-1.94)* | 1.00 | 1.13 (0.92-1.38) | 1.00 | 1.34 (1.16-1.55)* |
| Patient-Centeredness of Care | |||||||||
| Provider listened | 1.00 | 0.72 (0.52-1.00) | 0.62 (0.44-0.87) | 1.00 | 0.91 (0.76-1.09) | 1.00 | 0.69 (0.50-0.95) | 1.00 | 0.65 (0.51-0.84)* |
| Provider explained things | 1.00 | 0.71 (0.52-0.98) | 0.56 (0.41-0.78)* | 1.00 | 1.05 (0.85-1.28) | 1.00 | 0.88 (0.66-1.17) | 1.00 | 0.90 (0.70-1.15) |
| Provider showed respect | 1.00 | 0.75 (0.55-1.02) | 0.50 (0.36-0.70)* | 1.00 | 0.91 (0.75-1.11) | 1.00 | 0.81 (0.59-1.12) | 1.00 | 0.89 (0.68-1.16) |
| Provider spent time | 1.00 | 0.78 (0.58-1.05) | 0.62 (0.46-0.82)* | 1.00 | 0.92 (0.78-1.08) | 1.00 | 0.81 (0.63-1.04) | 1.00 | 0.74 (0.61-0.90) |
| Composite: Patient-centeredness | 1.00 | 1.12 (0.91-1.38) | 0.40 (0.33-0.49)* | 1.00 | 1.46 (1.29-1.64)* | 1.00 | 0.93 (0.78-1.11) | 1.00 | 0.86 (0.74-1.00) |
|
Analyses are weighted.
|
|||||||||