
U.S. Department of Health and Human Services
Market Changes in the Supply and Use of Home Health Services: 1996-1999
Frank Porell, Ph.D., University of Massachusetts, Boston
Korbin Liu, Ph.D., The Urban Institute
Douglas Wissoker, Ph.D., The Urban Institute
David P. Brungo, M.B.A., Ph.D., Candidate University of Massachusetts, Boston
January 2004
PDF Version (87 PDF pages)
This report was prepared under contract #HHS-100-97-0010 between the U.S. Department of Health and Human Services (HHS), Office of Disability, Aging and Long-Term Care Policy (DALTCP) and the Urban Institute. For additional information about this subject, you can visit the DALTCP home page at http://aspe.hhs.gov/_/office_specific/daltcp.cfm or contact the ASPE Project Officers, William Marton and Hakan Aykan, at HHS/ASPE/DALTCP, Room 424E, H.H. Humphrey Building, 200 Independence Avenue, S.W., Washington, D.C. 20201. Their e-mail addresses are: William.Marton@hhs.gov and Hakan.Aykan@hhs.gov.
The opinions and views expressed in this report are those of the authors. They do not necessarily reflect the views of the Department of Health and Human Services, the contractor or any other funding organization.
TABLE OF CONTENTS
- 1. BACKGROUND AND OUTLINE OF THE REPORT
- 1.1. Introduction
- 1.2. Background
- 1.3. Outline of the Report
- 2. HHA CLOSURE RATES AMONG GEOGRAPHIC MARKET AREAS: 1996-1999
- 2.1. Introduction
- 2.2. Data and Methodology
- 2.3. Empirical Results
- 2.4. Discussion
- 3. CHANGES IN MEDICARE HOME HEALTH AGENCY SUPPLY: 1996-1999
- 3.1. Introduction
- 3.2. Background
- 3.3. Data and Methodology
- 3.4. Empirical Results
- 3.5. Discussion
- Appendix 3.A. Methodology for Classifying HHA Service Area Changes
- 4. CHANGES IN MEDICARE UTILIZATION
- 4.1. Introduction
- 4.2. Approach and Data Sources
- 4.3. Empirical Results
- 4.4. Discussion
- Appendix 4.A. States by Census Region
- 5. GEOGRAPHIC PATTERNS OF MEDICARE HHA SUPPLY CHANGES: 1996-1999
- 5.1. Introduction
- 5.2. Data and Methodology
- 5.3. Empirical Results
- 5.4. Discussion
- Appendix 5.A. Supply Expansion and Contraction Measures
- 6. DISCUSSION
- LIST OF FIGURES
- FIGURE 2.1: Prevalence Rates of HHA Closures among HSMAs
- FIGURE 5.1: The Range of Agency As Geographic Service Area with Reimbursement Level P0
- FIGURE 5.2: Service Areas for Agencies A & B with Reimbursement Level P0
- FIGURE 5.3: Changed Service Areas for Agencies A & B After Lower Reimbursement Rate P1
- FIGURE 5.4: New Market Entry by Agency C After Service Area Contractions by Agencies A & B
- FIGURE 5.5: Service Area Expansion by Agency A Following the Service Area Contraction by Agency B
- FIGURE 5.6: Geographic Distribution of HSMAs by Level of Medicare HHA Supply Contraction
- FIGURE 5.7: Geographic Distribution of HSMAs by Level of Medicare HHA Supply Expansion
- LIST OF TABLES
- TABLE 2.1: Self-Containment of HSMAs and Counties in the Delivery of Medicare HHC Visits in 1996
- TABLE 2.2: HSMA Geographic Attributes by Category of HHA Closure Rate
- TABLE 2.3: HSMA Market Area Attributes by Category of HHA Closure Rates
- TABLE 3.1: Categories of Change in Medicare HHA Supply 1996-1999 with Selected Agency Attributes
- TABLE 3.2: Variable Definitions and Descriptive Statistics
- TABLE 3.3: Components of Change in Medicare Beneficiaries Served 1996-1999
- TABLE 3.4: Multinomial Logit Model Results for HHA Supply Decisions 1996-1999
- TABLE 4.1: Number of HHA Users per 1000 Enrollees in HSMAs, by Age and Gender, 1996-1999
- TABLE 4.2: Patterns of Medicare HHA Supply, 1996-1999
- TABLE 4.3: Comparisons of Percent of HHAs that Closed in 1996-1999 and the Corresponding Percent of Total Users They Served in 1996
- TABLE 4.4: OLS Estimates of the Effect of Closures on Change in Use Rate Between 1996 and 1999
- TABLE 4.5: Two-Stage Least Squares Estimates of the Effect of Closures on Change in Use Rate Between 1996 and 1999
- TABLE 5.1: Variable Definitions and Descriptive Statistics
- TABLE 5.2: HSMAs Cross-Classified by Levels of HHA Supply Contraction and Expansion
- TABLE 5.3: Multinomial Logit Model Empirical Results
ACKNOWLEDGEMENTS
This research report was supported by the U.S. Department of Health and Human Services, Office of the Assistant Secretary for Planning and Evaluation, under Contract No. 100-97-0010-24. The views in this report are solely those of the authors and do not necessarily represent the views of the Urban Institute, University of Massachusetts, or the U.S. Department of Health and Human Services. The authors are grateful to Kamal Hijjazi, Cille Kennedy, and Hakan Aykan who served as project officers at times during this study. Hakan Aykan provided very thoughtful and extensive comments on earlier drafts of this report. We are particularly grateful to Kamal Hijjazi for his guidance and technical assistance in the early development phases of this study.
A number of individuals contributed valuable technical assistance at various stages of the study. We thank Thy Dao for constructing the 1996-1999 files containing linked information on Medicare claims, provider characteristics, and geographic locations. Laura MacDougall and Dongsoo Lee provided technical assistance in analytic file construction and preparation of tables and figures for several of the chapters. We also thank Brian Overington for his help in preparing several chapters of this report, and Josephine Sturgis who provided clerical assistance in the preparation of the report. Any remaining errors are the responsibility of the authors.
EXECUTIVE SUMMARY
Two of the most prominent changes that took place in the home health care (HHC) delivery system over the three years following the Balanced Budget Act (BBA) of 1997 were a nearly 50% decrease in Medicares HHC expenditures and the market exit of a substantial number of home health agencies (HHAs). These changes prompted concerns from advocates and the home health industry about the potential impact of agency closures on access to home health services by Medicare beneficiaries, especially among the sickest beneficiaries and those living in rural areas.
Studies by official agencies, such as the U.S. General Accounting Office (GAO) and the U.S. Department of Health and Human Services, Office of Inspector General, examined the impact of the BBA policies on beneficiaries and providers. While documenting changes in the supply of HHAs, these studies concluded that agency closings did not cause a shortage of Medicare home health providers and that beneficiaries access to services were not generally affected. Our research builds on these prior studies, and examines, in greater detail, dynamic responses of HHAs within delineated health services market areas (HSMAs). We analyze changes between 1996 and 1999 in market entry and exit of HHAs, as well as changes in the expansion or contraction of service areas by ongoing agencies. We then relate home health utilization changes to such supply changes within HSMAs. Our aim was to address three substantive issues:
- To document changes in the structure and composition of Medicare HHC markets associated with the interim payment system (IPS);
- To develop a fuller understanding of the supply behavior (exit, entry, contraction, expansion) following the IPS;
- To identify changes in beneficiary home health utilization associated with supply changes of HHAs.
Our market area analyses of changes between 1996 and 1999 indicated that those geographic locations where agency closures were the greatest were the same ones where new agency entry or service area expansion of existing agencies was the greatest. Hence, while reports of significant agency closures portended serious HHA supply problems, potential gaps in service area coverage left by those exiting agencies were largely filled by others. Our findings that beneficiary utilization rate changes were only slightly affected by agency closures are consistent with the findings that supply of agencies was not depleted because of the closings. They are also consistent with GAOs conclusion that beneficiary access to Medicare home health services was not compromised by agency closures.
We found that certain groups of HHAs were more predisposed to exit or contract their service areas than others. Notably, higher rates of closure were associated with for-profit, freestanding, and recently certified agencies. In addition, rates of closure were considerably higher in certain regions of the country. Similar findings emerged in prior studies on the subject, but we also found that the agencies that were likely to enter market areas or expand service areas had about the same characteristics. Recently certified agencies, for example, were among the most dynamic providers. We infer from these results that such agencies were very flexible in their response to Medicare payment policies and market conditions.
Although Medicare home health use declined dramatically after the IPS, its major effect appears to be a reduction of number of visits per user, rather than reductions in the number of users per Medicare enrollee. Hence, access to Medicare HHC did not seem to be a major problem. We also found that agency closures, per se, did not greatly increase the likelihood of not obtaining any Medicare home health services. It was beyond the scope of our study, as well as prior ones, to determine if the generalized reductions in utilization following IPS resulted in negative health outcomes for Medicare enrollees. We are pretty confident, however, that agency closures were not a big part of the issue. Overall utilization reductions appeared to be due primarily to changes in payment policies, per se, and not to the intermediate factor of agency closings.
Given the dynamic behavior of the Medicare HHA industry found in this study, future research would also benefit from examining the service area expansion and contraction, as well as actual closures and openings of HHAs. Measurement of these types of activities helps to provide, for example, a fuller explanation of supply-related effects on beneficiary utilization and access to services. A natural application of this framework may be an examination of the impact of changes after Medicare started paying for home health services under a prospective payment system in 2000.
1. BACKGROUND AND OUTLINE OF THE REPORT
1.1. Introduction
During the three years following the Balanced Budget Act (BBA) of 1997, significant changes took place in the home health care (HHC) delivery system. Two of the most prominent changes were the drop in Medicares HHC expenditures by nearly 50% and the market exit of a substantial number of home health agencies (HHAs). These changes prompted concerns from advocates and the home health industry about the potential impact of agency closures on access to home health services by Medicare beneficiaries, especially among the sickest beneficiaries and those living in rural areas.
Studies by official agencies, such as the U.S. General Accounting Office (GAO) and the U.S. Department of Health and Human Services (HHS), Office of Inspector General (OIG), examined the impact of the BBA policies on beneficiaries and providers. While documenting changes in the supply of HHAs, these studies concluded that agency closings did not cause a shortage of Medicare home health providers and that beneficiaries access to services were not generally affected.
Because of the policy urgency of the perceived effects of the HHA closures, nearly all of the studies were short-term, had limited scopes of work, or covered few geographic entities. Our research builds on these prior studies, and examines, in greater detail, dynamic responses of HHAs within delineated health services market areas (HSMAs).1 We analyze changes between 1996 and 1999 in market entry and exit of HHAs, as well as changes in the expansion or contraction of service areas by ongoing agencies. We then relate home health utilization changes to such supply changes within HSMAs. Our aim was to address three substantive issues:
- To document changes in the structure and composition of Medicare HHC markets associated with the interim payment system (IPS);
- To develop a fuller understanding of the supply behavior (exit, entry, contraction, expansion) following the IPS;
- To identify changes in beneficiary home health utilization associated with supply changes of HHAs.
The next section of this chapter presents background information on the Medicare home health benefit, trends in spending and use leading up to the 1997 BBA, home health policies in the BBA, and impact of those policies on providers and utilization rates. In subsequent chapters of this report, we deal more deeply with patterns of HHA closures, market expansion and contraction, as well as provide a unique and thorough analysis of market supply responses--and potential changes in utilization that resulted--using HSMAs as the units of observation. We wrap things up by discussing the potential implications of our findings for policy and research.
1.2. Background
A. Medicare Home Health Benefit
Medicare finances home health services for enrollees who require intermittent or part-time skilled nursing care and therapy services, and who are homebound. These services must be prescribed, (and re-certified every 62 days), by a physician. There is no prior hospitalization requirement or limit on the number of visits a person may receive. Nor is there a co-payment for Medicare home health visits under Medicares Part A hospital insurance program. Although the Medicare home health benefit was originally conceived to be a post-hospital extended care service, it evolved during the 1980s into more general home-based care for individuals requiring nursing or rehabilitative care. Despite the broadening of the benefits intent, Medicare spending for home health grew only modestly during this period, in large part because of relatively strict, and inconsistent, interpretation by Medicare fiscal intermediaries of coverage and eligibility rules. In 1988, however, a class-action lawsuit against HHS (Duggan v. Bowen 1988), which administers the Medicare program, resulted in a liberalization of coverage and eligibility standards. New guidelines provided more explicit definitions of when patients' conditions constituted need for intermittent skilled nursing care. In addition, they provided that need for skilled management and evaluation (not necessarily along with skilled nursing care) would qualify an individual for the benefit, and that care needs could be chronic rather than progressively improving. These revisions expanded the number of beneficiaries eligible for home health services.
B. Rapid Growth in Medicare Home Health Spending
After the Duggan v. Bowen case, spending on Medicares home health benefit grew rapidly. Between 1988 and 1997, spending increased an average of 28.2% annually, from $1.9 billion to $17.8 billion (GAO 1999; Health Care Financing Administration (HCFA) 1998). This growth has been attributed primarily to application of the new guidelines (Bishop, Kerwin & Wollack 1999; McCall, Komisar, Petersons & Moore 2001; GAO 1998), including some states Medicare maximization policies that fostered coverage of some of the long-term care (LTC) costs of beneficiaries eligible for both Medicare and Medicaid (GAO 1998).
Growth in spending during this period reflected dramatic increases in utilization, both in terms of the number of beneficiaries receiving services and the amount of care they received. Between 1988 and 1997, the number of beneficiaries receiving Medicare HHC increased by 225% (from 1.6 million to 3.6 million), while visits per user increased by 343% (from 23 to 79 visits per user).
C. 1997 Balanced Budget Act HHA Provisions
Concerned about the rapid growth in home health expenditures, Congress mandated in the BBA of 1997 that Medicare HHAs be paid through a prospective payment system (PPS; implemented eventually in October 2000). Recognizing that the development of a PPS for HHAs would take considerable time, Congress also mandated that an IPS be imposed immediately to slow expenditure growth. Centers for Medicare and Medicaid Services (CMS) began phasing in the IPS as early as October 1997 depending on an HHAs cost reporting year. The BBA also tightened eligibility rules for the home health benefit by clarifying the definition of intermittent skilled nursing care and excluded venipuncture (blood drawing) as a sole qualification for home health services.
The IPS established lower per-visit payment limits, as well as a per-beneficiary limit on HHAs. The per-visit limits were reduced from 112% of the national mean cost per-visit to 105% of the national median cost per-visit. The per-beneficiary payment limit was calculated by summing 75% of an agencys costs per beneficiary and 25% of the average cost per beneficiary for agencies in its census region. The per-beneficiary limit is calculated differently for agencies participating in Medicare for at least a full year by October 1, 1994 and for newer agencies (GAO 1998). Of the various provisions of the IPS, the per-beneficiary limit was expected to reduce payments the most severely.
Revisions to the IPS by Congress in October 1998 increased payments to HHAs by upping the per-visit limit to 106% of median per-visit costs, and changing the per-beneficiary limits for HHAs depending on their cost reporting year. In general, HHAs established prior to 1994 that had annual costs lower than the national median received an incremental payment, HHAs entering the program between 1994 and 1998 were limited to 100% of national costs, and new HHAs (i.e., those entering the market in 1999 or after) were subject to per-beneficiary limits set at 75% of national costs. These revisions were designed, in part, to prevent new HHAs from being able to gain reimbursement advantages over existing HHAs (National Health Policy Forum 1999).
D. Impact of the IPS on Spending, Provider Supply, and Utilization
After the IPS was implemented, total Medicare home health spending decreased by over 50% (from around $16.4 billion to around $7.8 billion), and per-user spending decreased by 37%. As a result of the dramatic decline in spending, the Congressional Budget Office (CBO) in March 1999 revised its pre-BBA projections of home health savings by a factor of four, projecting that the BBA would reduce Medicare home health outlays by $64 billion through 2002 (CBO 1999 as cited in Bishop, Kerwin & Wallack 1999).
Changes in HHA Supply After the IPS. Coincident with the dramatic reduction in Medicare expenditures following the IPS, a large number of HHAs exited the Medicare program, likely because the new payments were insufficient to meet their costs or, perhaps, profit expectations. Nationally, 26% of the HHAs, participating in Medicare in 1996, were no longer participating in the program by 1999. The net decline in participating Medicare HHAs between 1996 and 1999 was only 15%, however, because other agencies started providing Medicare home health services after 1996.
Changes in the supply of HHAs after the IPS varied widely with respect to agency characteristics and geographic location. For example, between 1996 and 1999, proprietary HHAs had the greatest net decline (-21%), while both non-profit and government agencies had much smaller declines (about 7% each). HHAs in the largest metropolitan areas were also more likely to exit the Medicare program; 30% of such HHAs dropped out between 1996 and 1999. Because metropolitan areas, relative to less populated areas, may have had an abundant supply of HHAs, beneficiaries needs resulting from the closure of some agencies could be met by ongoing ones. In contrast, where relatively few agencies were available, for example in rural areas, community needs could have made it more difficult for HHAs to close.
The closures of so many HHAs after the IPS prompted short-term policy studies by GAO (1998, 1999) and HHS/OIG (2000). GAO found that, despite the high HHA closure rate, the number of Medicare participating agencies in 1999 was still substantial due to the rapid growth of agencies between 1990 and 1997 (GAO 1999). GAO also found that agencies that stopped participating in Medicare were distinctive in their regional and provider characteristics. Approximately 40% of the agencies that closed were located in three states (i.e., Louisiana, Oklahoma, and Texas), which were among those with the highest recent growth in number of agencies. Consistent with this trend, many agencies that closed were among those with fewer than five years of participation in Medicare. Relative to agencies that continued to participate in Medicare after the IPS, agencies that closed were also more likely to have been of proprietary ownership, located in urban areas, freestanding, and served lower than average numbers of patients.
In its study, GAO (1998) also made the important distinction between agency closures and agency branch closures. Under Medicare rules, HHA branches are not considered independent providers. Rather, they are integral parts of the parent agency. As such, branches are not individually surveyed or certified for Medicare compliance, and are not required to file a unique Medicare cost report. In general, it was often financially advantageous for an HHA to have the parent unit based in an urban locale (with higher wage index and reimbursement), while branches provided services in areas with lower wage indices. The distinction between agency and branch closures was reiterated after the home health industry reported numbers of agency closures that were substantially higher than those calculated by GAO.
E. Changes in Medicare Home Health Use After the IPS
Consistent with spending decline after the IPS, Medicare home health services utilization declined between 1996 and 1999. County-level Medicare home health use rates declined by 29%, on average, between 1996 and 1999 (Liu, Wissoker, Porell & Overington 2003). This change reflects a substantial drop in the use rate from 104 per 1000 enrollees in 1996 to 72 per 1000 enrollees in 1999.
Changes in the use rates between 1996 and 1999 were about the same for various demographic groups by age, gender and race. While changes in use rates varied only slightly by urban and rural location, regional differences in beneficiary utilization rate changes were considerable. For example, where use rates declined by about 20% in the Mid-Atlantic and Pacific regions, the decline was 37% in the West South Central region and 32% in the East South Central region, two regions that had the highest use rates in 1996.
Although users per agency declined only modestly, the number of visits per user declined dramatically from 79 visits per user in 1996 to 38 visits per user in 1999. Visits per user declined more among proprietary HHAs (54%) than among voluntary and government agencies, both of which averaged declines of about 42%. Virtually no difference in average visits per users was found by urban/rural status. By region, the smallest decline in visits per user was 32% in the Mid-Atlantic region (e.g., New York, Pennsylvania), while the largest percent decline was found in the West South Central region (e.g., Texas, Oklahoma). In general, the greater the number of average visits provided by agencies in a region before the BBA, the greater was the decline in number of visits after the BBA. This type of response would be expected in light of the per-beneficiary cost limit imposed by the IPS.
F. IPS Effects on Sub-groups of Beneficiaries
The dramatic decrease in utilization after IPS raised the question of whether access for sub-groups of beneficiaries would be affected. Special concerns were expressed for rural communities, which may have fewer alternatives, and for beneficiaries with chronic illness that often incur costs higher than the caps that were imposed under IPS (Smith & Rosenbaum 1998; Komisar & Feder 1998).
McCall, Petersons, Moore & Korb (2003) compared the characteristics of home health users and non-users, as well as the utilization of home health services, between 1997 and 1999. They found that home health users were very similar for both years and only small significant differences existed with respect to demographics, geographic region and supply of county-level acute and post-acute resources. A notable difference was that post-BBA users were more likely to be disabled and have prior hospital care. They also found slightly greater reductions in use among beneficiaries age 85 and over, living in states with high historical Medicare home health use, and in states with Medicaid buy-in.
McCall et al., (2003) also found different patterns of service provision across the six home health service disciplines. Specifically, home health aide visits decreased by 54%, medical social worker visits decreased by 38%, skilled nursing visits decreased by 29%, occupational therapy visits decreased by 20%, and physical therapy visits decreased by 7%. In contrast, only speech-language pathologist visits increased by 6%.
G. HHA Closures and Beneficiary Access
A key focus of GAOs (1998, 1999) studies was the relationship between HHA closures and beneficiary access. For those studies, the GAO examined HHA certification status and beneficiary utilization information from Medicare administrative records, and conducted interviews with stakeholders, including hospital discharge planners, consumer advocates, state agency officials, and HHA representatives.
Although GAO found a high (14%) closure rate of Medicare participating HHAs after implementation of the IPS in October 1997, it did not conclude that the reduced capacity would be a threat to beneficiary access to the benefit, largely because of the very rapid growth in the number of agencies leading up to 1997.2 GAO found large declines in both rates of beneficiary use and number of visits among users after IPS was implemented. In addition, while the IPS narrowed variations in use among counties, substantial variation continued to exist. Despite the utilization changes, interviews with hundreds of stakeholders indicated that, in general, Medicare beneficiary access to home health services was not greatly affected by the agency closures. Some providers indicated, however, that individuals with greater needs (e.g., diabetics, wound care patients, individuals with Alzheimers disease) required a greater effort to be placed. Similarly, Smith, Maloy & Hawkins (1999, 2000) found that the sickest home health beneficiaries were more likely to experience more limited access.
OIG (2000) also found suggestions that some hospital discharge planners were experiencing placement difficulties for potential home health beneficiaries on occasion as a result of process oriented changes in HHAs since the implementation of the IPS, including stricter Medicare home care eligibility criteria and enforcement, an apparent closer preadmission scrutiny of potential patients medical conditions, fewer HHAs in certain geographic areas, and HHA staffing shortages. In sum, these studies on beneficiary access suggested that closure of HHAs after the IPS was implemented did not generally affect access to the Medicare home health benefit.
1.3. Outline of the Report
In this chapter we have provided background information on the Medicare home health benefit, home health policies in the BBA, and a summary of the findings of past research regarding the impact of those policies on providers and utilization rates. The outline of the remainder of the report is as follows. Chapter 2 contains a descriptive analysis of geographic patterns of HHA closures between 1996 and 1999. Unlike prior studies, we created and analyzed HSMAs as the geographic units of observation. In Chapter 3 we consider two other forms of HHA supply response to the Medicare IPS aside from agency closure, namely, the contraction or expansion of an agencys geographic service area. We estimate the magnitude of HHA supply response with changes in HHAs geographic service areas, and report the findings of an empirical analysis of agency and market area factors influencing the various supply decisions of individual agencies. In Chapter 4 we examine potential utilization impacts associated with changes in the supply of HHAs. We report the findings of an empirical analysis of Medicare HHC utilization rate changes associated with changes in the supply of HHAs between 1996 and 1999. This is followed in Chapter 5 by an empirical investigation whether those market areas where substantial reductions in HHA supply occurred as a consequence of agency closures and geographic service area contractions also experienced substantial HHA supply expansion as a consequence of market entry and service area expansion by other agencies. In the final section, we discuss the implications of our findings for policy and research.
2. HHA CLOSURE RATES AMONG GEOGRAPHIC MARKET AREAS: 1996-1999
2.1. Introduction
This chapter describes the geographic pattern of Medicare HHA closures that followed implementation of the Medicare IPS and examines characteristics that distinguish market areas with higher versus lower rates of agency closures between 1996 and 1999. Its purpose is to provide an empirical context for the three empirical analysis chapters that follow. Since changes in Medicare HHA supply that occurred after IPS implementation are the main focus of this study geographic market areas should be properly delineated to approximate the concept of an economic market. As one researcher investigating patients hospital admission choices asserted, "If we want to be sure we capture the full extent of consumer behavior within local markets, we must address the issue of what constitutes a market" (Dranove, White & Wu1993). This point is probably equally, if not more important for the study of the supply behavior of HHAs the impacts of this supply behavior upon beneficiary access to the Medicare HHC benefit.
GAOs (1999) study of the geographic distribution of HHA closures that followed implementation of the IPS employed counties as geographic units. There are extreme variations in the land area and population sizes of counties (Porell, Tompkins & Turner 1990). San Bernadino County, California with a land area of 20,064 square miles is larger than the area of seven of the states in the United States. In contrast, the independent city of Emporia, Virginia is a county spanning little more than two square miles, with a population of less than 5,000 in 1990. Whereas the entire Metropolitan Statistical Area (MSA) of Los Angeles is comprised of a single county with a population exceeding seven million persons, 18 different counties, with a combined population about 1/3 of Los Angeles county, comprise the MSA of Atlanta, Georgia. Given the political origins of counties as jurisdictional units, there is little reason to expect that county geographic boundaries will coincide with what one might think of as a health care market area. Accordingly, we address the concept of geographic market area and the geographic units employed as markets before examining geographic patterns and market characteristics associated with HHA closures between 1996 and 1999.
2.2. Data and Methodology
A. Data Sources
The major sources of data used in this study are Medicare administrative records maintained by CMS. They include 1996 and 1999 Medicare HHA claims, Medicare's enrollment files, and data from the Online Survey, Certification and Reporting (OSCAR) system. We also use variables from the 2000 Area Resource File (ARF).
Medicare HHA claims data include information on number of visits, by specialty, age and gender, and diagnoses of users. The year 1996 is the latest full calendar year preceding implementation of the IPS on October 1, 1997. The year 1999 was the most recent full calendar year of claims data available at the start of the study. It precedes the implementation of the Medicare HHC PPS that occurred in October 2000. Medicare enrollment data provided denominator information for the construction of utilization rates.
The OSCAR system provides information from the state survey and certification process to identify and characterize providers that participate in Medicare and Medicaid. Medicare Provider of Service (POS) files derived from the OSCAR system provide information on ownership, geographic location, certification dates of Medicare providers, the number of employees of various types (for example, inhalation therapists, occupational therapists, and physical therapists) and the number of different types of beds and care units, and other attributes of HHAs participating in Medicare.
We derived a number of variables characterizing the HHAs and the market areas they are located. With data from the OSCAR, we derived source variables on control of ownership (e.g., proprietary, non-profit), hospital-based affiliation, dates of participation in Medicare, and geographic location. OSCAR data on staffing enabled us to construct various measures of staffing, by type of staff (e.g., nurses, physical therapists). The ARF files provided information on geographic characteristics of the HHAs, such as whether they were located in metropolitan areas, non-metropolitan urban areas, or rural areas. ARF also provided information on other providers in the area such as hospitals. We used Medicare claims and enrollment data to measure utilization rates and amounts of HHA visits recorded in 1996 and 1999.
B. Geographic Market Areas
Geographic supply analyses should employ geographic units that approximate the economic concept of a geographic market area. Distinct geographic market areas have long been defined to exist when supply and demand forces outside the geographic area are small relative to those within (i.e., when the geographic market is self-contained). Using their shipments approach, Elzinga and Hogarty (1973) describe a geographic market area as being selfcontained when producers within that market area export few goods out of the area (i.e., little outside from inside), and consumers within that market area import few goods into the area (i.e., little inside from outside).
The greater is the prevalence of border-crossing among counties in the delivery of HHC visits, the more difficult it is not only to reliably identify the beneficiary population potentially affected by HHA closures, but also to assess potential mediating effects of supply response behavior of agencies that did not close. Based on the concept of an economic market area, our study draws upon the work of Makuc, Haglund, Ingram, Kleinman & Feldman (1991) in which the authors measured shipments with 1988 county-to-county patient origin hospital data for Medicare beneficiaries. The authors define a population import of hospital services to be a hospital admission of a local resident to a hospital located outside of that residents geographic market area, and a supplier export of services as a hospital admission of a non-resident a hospital based inside the market area. Employing an explicit objective of minimizing imports and exports of hospital services, statistical cluster analysis techniques were used to identify some 800 HSMAs in the United States as clusters containing at least one county.
This study uses HSMAs as the geographic unit of analysis to assess Medicare HHA supply change associated with agency closures from 1996 through 1999. Although the HSMAs of Makuc et al. (1991) were delineated using data on Medicare inpatient hospital admissions rather HHC visits, patient origin Medicare HHC visit data for 1996 suggest that HSMAs are also much more self-contained for counties for HHA visits. The top portion of Table 2.1 displays the respective distributions of county and HSMAs among categories defined by the percentage of total 1996 visits to resident Medicare HHC users made by HHAs based in the same market area. In nearly 85% of HSMAs, local HHAs delivered 75% or more of the total volume of Medicare HHC visits received by beneficiary residents in 1996. In contrast, in 1996 local agencies delivered at least 75% of total Medicare HHC visits received by beneficiary residents for only 22% of counties. When geographic areas are weighted to reflect differences in the relative volume of visits among geographic market areas, HSMA-county differences are even more striking. The bottom portion of Table 2.1 contains data about the degree to which HHAs based in a market area serve local resident beneficiaries. When HSMAs rather than counties are used to delineate market areas, a much higher percentage of total visits delivered by HHAs based in a market area are delivered to local residents of that same market area. In nearly 73% of HSMAs local beneficiary residents received 75% or more of total visits delivered in 1996 by HHAs based in the HSMA. In contrast, in only 56% of counties did local beneficiaries accounted for three-quarters of the visits by HHAs based in the county. When differences in HHA visit volumes are accounted for with relative weights, again the HSMA-county differences are accentuated. Finally, we consider the prevalence of geographic market areas served entirely by HHAs based in other market areas. In 1996 there were more than 700 counties in the United States with resident Medicare beneficiaries (of a total of about 3,080 counties) with no HHAs based within their boundaries. Whereas nearly a quarter of counties (i.e., 23%) had no HHAs in 1996, there were no HHAs based in only about 2% of HSMAs (i.e., 13 out of 803).
The HSMAs developed by Makuc et al. (1991) were developed to represent economic health care markets due to their explicit objective of minimizing border-crossing by beneficiaries for hospital care. Given the high prevalence of HHC episodes initiated by hospital stays, market areas derived from Medicare hospital patient origin data are likely to correspond well with Medicare HHC delivery patterns. This assertion is supported by a comparison of county and HSMA market areas with respect to agency border-crossing in the delivery of Medicare HHC visits. This comparison showed that HSMAs are much more self-contained than counties for Medicare HHC services. In other words, the local nature of the supply of and demand for Medicares home health benefit is more profound when assessed for market areas defined as HSMAs than for counties. As such, HSMAs represent an attractive alternative to counties for analysis of Medicare HHA supply changes.
C. Definition of HHA Closure
In order to identify Medicare HHAs that closed between 1996 and 1999 it was first necessary to adopt a definition of what constitutes an active HHA. To estimate the number of HHAs that were "active" in the Medicare program in 1996 and 1999, we examined information from the OSCAR and the claims. While the OSCAR provides information on "termination dates" we discovered some inconsistencies between whether an agency was considered active by OSCAR, and whether we located Medicare claims for the year. Hence, for the purpose of identifying HHA closures, we decided to designate agencies as active in 1996 and in 1999 based on whether Medicare claims were recorded for each of the given years.
In the descriptive analysis of HHA closures that follows in this chapter, agency closures are defined simply in terms of the presence of Medicare claims for an agency in 1996 and or 1999.3 That is, HHAs with Medicare claims in 1996 but not in 1999 are defined as agencies that closed.
D. Market Area HHA Closure Rates
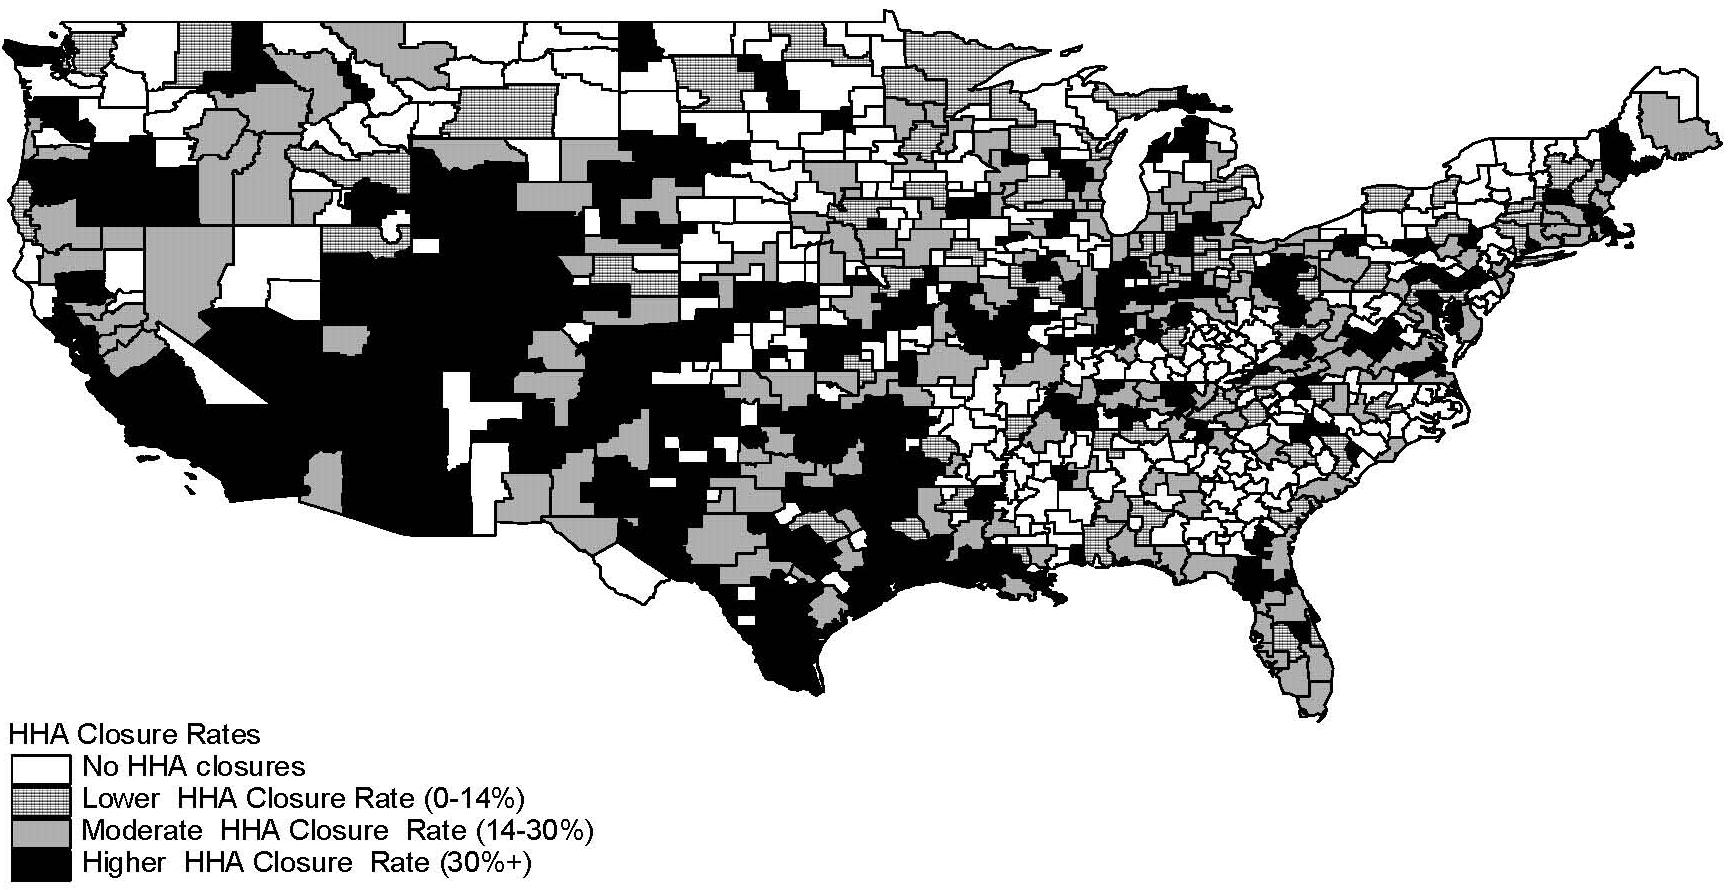
To assess geographic concentration of HHA closures between 1996 and 1999, we computed unweighted HHA closures rates for HSMAs. Each active HHA was based in an HSMA in 1996 using the agencys five-digit zip code recorded in the Medicare POS file. The unweighted HHA closure rate is simply the number of HHAs that were active in 1996 but not in 1999 in an HSMA as a percentage of the total number of active HHAs based in the HSMA in 1996.4 Using this convention, we then defined four categories of HHA closure rates based on the quartiles of the distribution of HHA closure rates among the 790 HSMAs with at least one HHA in 1996. Since the 330 HSMAs with no HHA closures between 1996 and 1999 account for more than 25% of HSMAs, all of these HSMAs were assigned to the lowest quartile category of No Closures. The remaining three categories are based on the remaining quartile values of the HSMA distribution and are described as: Lower Closure Rate (i.e., HSMAs with a positive HHA closure rate less than or equal to 14.3%); Moderate Closure Rate (i.e., HSMAs with an HHA closure rate greater than 14.3% but less than or equal to 30%), and Higher Closure Rate (i.e., HSAs with an HHA closure rate greater than 30%).
2.3. Empirical Results
A. Geographic Patterns of HHA Closure Rates
Figure 2.1 contains a map displaying the geographic distribution of HSMAs with different HHA closure rates. HSMAs with moderate or higher closure rates seem to be much more prevalent in the south central, mountain, and western areas of the United States HSMAs with none or lower agency closure rates appear to be a little more concentrated in the northeast and north central areas of the country.
Geographic variables describing system patterns in agency closure rates among HSMAs are reported in Table 2.2. The geographic patterns indicated on the map in Figure 2.1 are reflected in differing distributions of HSMAs among Census divisions when HSMAs are stratified by closure rate category. Relative to other closure categories, HSMAs with the highest agency closure rates are clearly over-represented in the West South Central, Mountain and West Census divisions.
Interestingly, other data reported in Table 2.2 suggests that HSMAs where no closures occurred are very different from all other HSMAs with respect to population size and metropolitanization. HSMAs with no closures, on average, had a markedly smaller 1996 populations (145,077) than all other HSMAs. The average population size of HSMAs where relatively few closures occurred (500,788) modestly exceeded that of HSMAs with the highest closure rates (458,938). With the exception of HSMAs with no closures, HSMA agency closure rates tend to vary inversely with the percentage of HSMA population living in a metropolitan area. This pattern lies in stark contrast to nonmetropolitan character of HSMAs with no closures, where only around 21% of total population was living in a metropolitan county in 1996.
B. Characteristics of HSMAs Associated with HHA Closure Rates
Aside from their geographic concentration in the Southwestern United States and population differences, HSMAs with high prevalence rate of agency closures are likely to differ from HSMAs with lower or no agency closures in ways that provide some insights into factors contributing to HHA market exits. Table 2.3 contains sample means for a series of variables describing agency composition, market area, Medicare HHA service use, and HHA supply attributes for HSMAs comprising each of the four closure rate groups defined above.
Agency Composition. Table 2.3 shows HHA closure rates among HSMAs vary with HSMA agency composition with respect to tenure of Medicare program participation. For example, the average number of years of HHA Medicare participation in all HSMAs in 1996 was around 11.4 years. However, successively higher closure rates are found in HSMAs served by agencies with fewer average years of Medicare participation. HSMAs with no closures were served by HHAs with an average of about 14 years of Medicare tenure in 1996. HSMAs with lower and moderate closure rates were served by HHAs with an average of 12 years and ten years tenure in 1996, respectively. Finally, HSAs with higher closure rates were served by HHAs with an average of only eight years of Medicare tenure. In particular, HHAs with less than five years of Medicare participation tenure appear to be at higher risk of closure. A greater percentage of the HHAs based in HSMAs with higher closure rates had less than five years of Medicare program tenure than in HSMAs with lower closure rates or no closures.
When considering an HHAs proprietary status with respect to closures, the data in Table 2.3 suggest that for-profit HHAs were at greater risk of closure than other forms of ownership. For example, for-profit HHAs comprised greater than 50% of agencies based in HSMAs with the highest closure rates. In stark contrast, on average less than 20% of HHAs in HSMAs with no closures were for-profit agencies. For-profit agencies clearly comprise a successively increasing percentage of HHAs that were based in HSMAs in the low, moderate and higher closure rate categories.
An HHAs organizational setting seemed to have a less consistent association with closures. Table 2.3 breaks out the composition of hospital-based vs. freestanding agencies in HSMAs with different closure rates. Overall, HSMAs with a greater percentage of freestanding HHAs appear to have higher closure rates, but this association did not appear to trend as clearly or consistently as with proprietary status. Among HSMAs where there were no closures, hospital-based and freestanding HHAs were roughly equally represented, each comprising nearly 50% of all HHAs on average. However, in HSMAs for all other closure categories freestanding HHAs outnumbered hospital-based HHAs ranging from about 62% of HHAs in the moderate closure rate sub-group to a high of nearly 70% of HHAs among HSMAs with the highest closure rates.
Market Competition Attributes. In what might be considered a reflection of the degree of HHA market saturation in an HSMA, the data in Table 2.3 suggest that HSMAs with greater numbers of HHAs experienced successively higher rates of agency closures. For example, on average, it appears that HSMAs with the highest closure rates were served by over five times as many HHAs as HSMAs where no closures occurred (22.5% vs. 4.2 %, respectively). Table 2.3 also shows how HSMA markets broke out according to their market concentration, which was measured via a Herfindel index. This index represents the extent to which the supply of the Medicare home health benefit in 1996 was controlled by a relatively small number of HHAs based in the HSMA. As might be expected, there were no HHA closures in HSMAs where the supply of the Medicare home health benefit was dominated by relatively few HHAs, as evidenced by a higher average Herfindel index (0.51). However, and perhaps contrary to what might be expected, an inverse relationship was observed between the average Herfindel indices among HSMAs in the other closure rate categories. Note that HSMAs experiencing the highest rate of closures scored a higher average Herfindel index compared to HSMAs in both the moderate and low closure rate categories (0.28, 0.23 and 0.21, respectively).
Medicare HHA Service Use. Overall, HHAs provided an average of around 28,200 visits to Medicare annually in 1996. Average annual visits per HHA in 1996 were higher in HSMAs experiencing successively lower closure rates, ranging from around 20,200 visits per year in HSMAs in higher closure rate category to around 32,800 visits per year in HSMAs where no closures occurred. HHAs based in HSMAs with higher closure rates appear to exhibit more visit-intensive practice styles than HHAs based in other market areas. Agencies based in HSMAs with the highest closure rates provided 77 visits per beneficiary served, on average, in 1996 compared to the lower visit rates per beneficiary (ranging from 66 to 60 annual visits per beneficiary) of HHAs in HSMAs with lower closure rates.
Medicare HHA and Nursing Home Bed Supply. The data in Table 2.3 suggest that HSMAs with the highest closure rates had nearly double the supply of HHAs per beneficiary (6.3 HHAs/10,000 beneficiaries) compared all other HSMAs (3.6, 2.8, and 3.5 HHAs/10,000 beneficiaries for HHAs in the moderate closure rate, lower closure rate, and no closure categories, respectively). A similar pattern is evident in the HHA staffing level data. HSMAs with the highest closure rates also had more full-time registered nurses (RNs) and nurse aides on average per resident Medicare beneficiary in 1996 than HSMAs with lower closure rates or no closures. Since these HSMAs also had a greater supply of Medicare-certified nursing home beds (56.7) per older Medicare beneficiary (i.e., 75 years old and over) compared to all other closure rate groups in 1996, these data suggest that LTC and post-acute care (PAC) supply was relatively abundent in the HSMAs with the highest HHA closure rates.
2.4. Discussion
This descriptive analysis of differences among HSMAs with varying agency closure rates between 1996 and 1999 suggest that HSMAs with the highest closure rates exhibit some very distinctive characteristics. Foremost these HSMAs were highly concentrated in the South Central, Mountain, and Western Census divisions of the United States. These HSMAs tended to be less populated and had greater shares of non-metropolitan population than all other HSMAs except those where no agency closures occurred. HSMAs where no closures occurred were generally comprised of the least populated non-metropolitan counties.
HSMAs with higher agency closure rates differed rather markedly from other HSMAs with respect to the composition of agencies serving the HSMA in 1996. For-profit agencies, freestanding agencies, and agencies that only recently obtained Medicare certification all comprised a much greater share of the agencies based in HSMAs with the highest closure rates. Furthermore, HHA provider supply in HSMAs with the highest closure rates was considerably greater, as reflected by the number of agencies, RN staff, and HHA staff per resident Medicare beneficiary than in other HSMAs. Finally, agencies based in HSMAs with the greatest closure rates also appear to exhibit more visit-intensive practice styles, as reflected by higher rates of visits per beneficiary served than agencies based elsewhere.
Overall, HSMAs with the highest agency closure rates between 1996 and 1999 appear to be market areas where Medicare HHA supply was likely saturated by recent market entries of smaller, for-profit agencies exhibiting more visit-intensive practice styles. While these characteristics are suggestive of excess supply in these HSMAs, such a conclusion is premature without additional corroborating empirical evidence indicating that access to Medicare HHC services has not been impaired in these market areas. Furthermore, it is not immediately evident that agency closures tell the entire story of HHA supply response after IPS implementation. These descriptive analyses have not considered other ways that agencies may have reduced Medicare HHA supply. Agency closures may understate the agency supply contraction that followed IPS implementation if substantial numbers of agencies that remained open discontinued serving Medicare beneficiaries in portions of their geographic service areas. Some agencies may have also expanded Medicare HHA supply through new market entry, while others may have initiated service delivery in areas, thus expanding their geographic service areas. In the next chapter, we investigate the magnitude of these other forms of Medicare HHA supply response after the IPS, as well as agency and market area attributes associated with the supply responses of individual agencies.
| FIGURE 2.1: Prevalence Rates of HHA Closures among HSMAs |
 |
| TABLE 2.1: Self-Containment of HSMAs and Counties in the Delivery of Medicare HHC Visits in 1996 | ||||
| % Visits from Local HHAs | Unweighted Geographic Units | Geographic Units Weighted by 1996 HHA Visits | ||
| % of Counties | % of HSMAs | % of Weighted Counties | % of Weighted HSMAs | |
| A. Distributions of the Percentage of Visits to Resident Beneficiaries Made by HHAs Based in the Same County or HSMA | ||||
| 0% - 9.99% | 27.08 | 3.05 | 4.01 | 0.19 |
| 10.0% - 24.99% | 5.81 | 2.28 | 2.46 | 0.29 |
| 25.0% - 49.99% | 16.99 | 10.28 | 7.77 | 2.61 |
| 50.0% - 74.99% | 21.55 | 26.78 | 63.41 | 12.25 |
| 75.0% - 89.99% | 16.74 | 36.80 | 13.03 | 72.73 |
| 90.0% - 100.0% | 11.82 | 20.81 | 9.32 | 11.92 |
| TOTAL | 100 | 100 | 100 | 100 |
| B. Distributions of the Percentage of Visits by HHAs Based in a County or HSMA Made to Resident Beneficiaries | ||||
| 0% - 9.99% | 0.76 | 2.84 | 0.20 | 0.06 |
| 10.0% - 24.99% | 3.50 | 0.39 | 3.02 | 0.06 |
| 25.0% - 49.99% | 14.86 | 5.54 | 10.71 | 2.52 |
| 50.0% - 74.99% | 25.07 | 18.68 | 67.06 | 12.47 |
| 75.0% - 89.99% | 28.92 | 34.15 | 13.65 | 69.77 |
| 90.0% - 100.0% | 26.89 | 38.40 | 5.36 | 15.12 |
| TOTAL | 100 | 100 | 100 | 100 |
| TABLE 2.2: HSMA Geographic Attributes by Category of HHA Closure Rate (1996-1999) | |||||
| HSMA Attributes | None | Lower HHA Closure Rate | Moderate Closure Rate | Higher Closure Rate | All HSMAs |
| No HHA Closures 1996-99 n=330 | HHA Closures as % of HHAs in 1996 (1-14.3%) n=73 | HHA Closures as % of HHAs in 1996 (14.3-30%) n=183 | HHA Closures as % of HHAs in 1996 (30+%) n=204 | n=790 | |
| Geographic Location Attributes | |||||
| Total population 1996 | 145,077 | 500,788 | 474,911 | 458,938 | 335,399 |
| Metropolitan Area Population as % of Total | |||||
| HSMA population | 21.3% | 62.7% | 55.3% | 43.7% | 38.8% |
| Census Division (% of HSMAs) | |||||
| New England | 2.4% | 2.7% | 4.9% | 2.5% | 3.0% |
| Middle Atlantic | 8.4% | 12.3% | 3.8% | 2.9% | 6.3% |
| East North Central | 9.0% | 26.0% | 20.2% | 13.2% | 14.3% |
| West North Central | 24.7% | 12.3% | 14.8% | 15.7% | 18.9% |
| South Atlantic | 17.5% | 16.4% | 17.5% | 9.3% | 15.3% |
| East South Central | 16.3% | 11.0% | 8.7%% | 5.9% | 11.4% |
| West South Central | 9.9% | 9.6% | 13.7% | 25.5% | 14.8% |
| Mountain | 7.2% | 5.5% | 9.3% | 14.7% | 9.5% |
| Pacific | 4.5% | 4.1% | 7.1% | 10.3% | 6.6% |
| TABLE 2.3: HSMA Market Area Attributes by Category of HHA Closure Rates (1996-1999) | |||||
| HSMA Attributes | No Closures | Lower Closure Rate | Moderate Closure Rate | Higher Closure Rate | All HSMAs |
| No HHA Closures 1996-99 n=330 | HHA Closures as % of HHAs in 1996 (1-14.3%) n=73 | HHA Closures as % of HHAs in 1996 (14.3-30%) n=183 | HHA Closures as % of HHAs in 1996 (30+%) n=204 | n=790 | |
| Medicare Program Participation | |||||
| Mean years of Medicare participation | 14.1 | 12.2 | 10.2 | 8.0 | 11.4 |
| HHAs less than 1 year | 6.7% | 10.8% | 17.4% | 21.5% | 13.4% |
| HHAs between 1-5 years | 14.0% | 21.4% | 22.8% | 30.5% | 21.0% |
| HHAs between 5-10 years | 13.0% | 13.9% | 11.1% | 10.7% | 12.0% |
| HHAs 10 years or more | 66.3% | 54.0% | 48.7% | 37.3% | 53.6% |
| Proprietary Status | |||||
| For-profit HHAs | 19.2% | 36.3% | 44.0% | 51.9% | 35.0% |
| Voluntary non-profit HHAs | 44.4% | 40.9% | 35.2% | 28.2% | 37.8% |
| Government HHAs | 36.5% | 22.8% | 20.9% | 19.9% | 27.3% |
| Organization Type | |||||
| Hospital-based HHAs | 49.8% | 32.8% | 35.8% | 29.7% | 39.8% |
| Freestanding HHAs | 48.6% | 64.2% | 61.8% | 68.3% | 58.2% |
| HSMA Market Characteristics | |||||
| Number of HHAs | 4.2 | 12.9 | 15.6 | 22.5 | 12.4 |
| Herfindal Index of Market Concentration | 0.51 | 0.21 | 0.23 | 0.28 | 0.36 |
| Medicare HHA Service Use | |||||
| Average annual Medicare users per HHA | 2,107 | 7,125 | 7,702 | 6,224 | 4,930 |
| Average annual visits per Medicare user | 60.2 | 62.2 | 65.5 | 77.0 | 65.9 |
| Annual HHA visits per resident beneficiary | 8.8 | 7.0 | 7.6 | 10.1 | 8.7 |
| LTC Supply Indicators | |||||
| HHAs per 10,000 resident beneficiaries | 3.5 | 2.8 | 3.6 | 6.3 | 4.2 |
| HHA RN FTEs per 1,000 resident beneficiaries | 3.53 | 3.14 | 3.44 | 4.10 | 3.62 |
| HHA aid FTEs per 1,000 resident beneficiaries | 3.96 | 3.43 | 3.60 | 5.18 | 4.15 |
| Medicare-certified nursing home beds per 1,000 beneficiaries 75+ years | 43.43 | 32.37 | 38.74 | 56.72 | 44.75 |
3. CHANGES IN MEDICARE HOME HEALTH AGENCY SUPPLY: 1996-1999
3.1. Introduction
Closure of many Medicare HHAs following implementation of the IPS mandated by the BBA of 1997 was a concern of policy makers, stakeholders, and advocacy groups. GAO (1999) found that over the 18 months that followed implementation of the IPS in October 1997, 760 HHAs closed, either voluntarily or involuntarily, and only 45 HHAs entered the market nationwide. OIG (2000) reported that the number of Medicare-certified HHAs decreased by 25% overall from 1997 to 1999.
Past studies of changes in the supply of Medicare HHAs after IPS implementation have employed data from the Medicare OSCAR system to analyze (GAO 1999; OIG 2000). OSCAR system data are helpful in identifying agencies that either no longer participate at all in the Medicare program or which have merged with another Medicare-certified HHA. However, they do not contain information on a less obvious way that HHA supply can be reduced, namely, by active HHAs shrinking their geographic service areas. That is, rather than discontinuing all service to Medicare beneficiaries, an agency may opt to only discontinue service in a portion of its geographic service area, for example, by the closure of one or more of its branches or subunits. In addition, because the provider surveys entered into OSCAR are conducted in up to18 month intervals, counts of certified agencies for any particular year may be inaccurate because of lags in reporting.
This chapter expands upon previous research addressing the question of how supply of Medicare HHAs changed after implementation of the IPS in two important ways. First, Medicare HHA claims activity is used together with Medicare certification status from the OSCAR system to determine the Medicare service activity status of HHAs. Second, changes in the supply of Medicare HHC is more broadly defined by considering not only agency closings, but also agencies that changed their geographic service areas following implementation of the IPS. Descriptive analyses provide some new insight about the magnitude of both of these sources of Medicare HHC supply change following implementation of the IPS. Multivariate analyses provide a deeper understanding of how HHAs responses to the IPS varied with respect to characteristics of agencies and the geographic markets they served.
3.2. Background
Beginning in the late 1980s, spending on Medicares home health benefit grew rapidly. Between 1988 and 1997, spending increased an average of 28.2% annually, from $1.9 billion to $17.8 billion (GAO 1999; HCFA 1998). This growth has been attributed primarily to a loosening of eligibility and coverage criteria in 1989 in response to a class action suit involving inconsistent interpretations of these criteria by Medicare fiscal intermediaries (Bishop, Kerwin & Wollack 1999; McCall, Komisar, Petersons & Moore 2001; GAO 1998), as well as some states Medicare maximization policies that took advantage of more liberal Medicare guidelines to cover some of the costs associated with LTC for beneficiaries eligible for both Medicare and Medicaid (GAO 1998). The BBA of 1997 required the HCFA (now CMS) to replace its cost-based reimbursement systems to PPS in many settings, including hospital outpatient departments, skilled nursing facilities, HHAs, inpatient rehabilitation facilities and LTC hospitals (Medicare Payment Advisory Commission 2000). The reimbursement changes of the BBA were intended to slow spending growth and provide incentives to providers in these settings to deliver care more efficiently. For HHAs, the BBA sought to impose limits on spending per beneficiary and per visit (National Health Policy Forum 1999).
Recognizing that the development of a PPS for HHAs would take considerable time, CMS created an IPS to affect a more immediate slowing of expenditure growth. CMS began phasing in the IPS as early as October 1997 depending upon an HHAs cost reporting year, with original expectations that the PPS would be fully implemented by October 1999 (later delayed until October 1, 2000). Under the IPS, HHAs continued to be reimbursed according to their costs, but these costs were subject to two cost limits in the aggregate: an area-specific per-visit ceiling that was more stringent than pre-IPS reimbursement, and an annual maximum HHA payment limit that considered the total number of beneficiaries served using an annual maximum per-beneficiary amount.
A dramatic contraction in Medicare home health expenditures was observed following implementation of the IPS. Whereas Medicare expenditures per home health fee-for-service user increased by an average annual rate of about 22% from 1992-1997, they decreased by an average annual rate of about -27% between fiscal years 1997 and 1999 (MedPAC 2000). According to McCall, Kosimar, Petersons & Moore (2001), total spending decreased over 50% (from around $16.4 billion to around $7.8 billion), total per-beneficiary spending decreased 50% (from around $500 to around $248), and annual per-user spending decreased 37% (from around $4,969 to around $3,110). Likewise, the total number of visits per-user decreased around 41%. Payments per-visit increased over this period by 7% (from around $63.00 to around $67.40).
In their 1998 report, the GAO described the impact of the IPS in terms of agency closures. In sum, GAO (1998) indicated that there were more HHAs in August 1998 than there were in October 1996, and that recent closures were dwarfed by longer-run industry growth. Since the implementation of the IPS in October 1997 through June 1998, 554 HHAs closed voluntarily nationwide, with an additional 206 closing involuntarily due primarily to a failure to meet minimum quality or financial standards. During the same period, only 45 HHAs entered the market nationwide. An OIG (2000) report indicated that the number of HHAs decreased by 25% overall from 1997 to 1999.
For the three years prior to the implementation of the IPS, an annual average of 285 HHAs closed voluntarily and 62 closed involuntarily (during the same three-year period, an average of 1,227 HHAs opened each year). Half of these closures were concentrated in four states; California, Louisiana, Oklahoma and Texas. Moreover, HHAs that closed voluntarily were more likely to be smaller (treating an average of 166 beneficiaries compared with 385 beneficiaries for HHAs that remained open) and provided more treatments per beneficiary (averaging over 90 visits per beneficiary compared to about 65 for HHAs that remained open). These factors may suggest that less efficient HHAs were less able to accommodate the changes to their reimbursement (GAO 1998), but much in the literature suggests that providers that focus on meeting the needs of more complex, higher cost beneficiaries are more likely to be negatively impacted by the reimbursement limits and blended rates of the IPS (GAO 1998; National Health Policy Forum 1999; Bishop, Kerwin & Wallack 1999).
An important distinction between agency closures and agency branch closures is made in the GAO (1998) report. Under Medicare rules, HHA branches are not considered independent providers. Rather, they are part and parcel of the parent agency. As such, branches do not receive unique provider certification, are not individually surveyed or certified for Medicare compliance, and are not required to file a unique Medicare cost report. In general, it was often financially advantageous for a branch to operate under a parent agency that had more attractive reimbursement as a result of their urban locale and higher wage index, while the branch provided services in an area with a lower wage index. This distinction was reiterated after reports from the home health industry about agency closures were substantially higher than those calculated by GAO.
3.3. Data and Methodology
A. Data Sources
Multiple data sources were employed in the study. Medicare HHC claims data for the calendar years 1996 and 1999 were used to determine the activity status of HHAs and to delineate their geographic service areas. The year 1996 is the latest full calendar year preceding implementation of the IPS on October 1, 1997. The year 1999 was the most recent full calendar year of claims data available at the start of the study. It precedes the implementation of the Medicare HHC PPS that occurred in October 2000. The Medicare POS files for 1996 and 1999, derived from the OSCAR system, contained information on Medicare certification status and several organizational attributes of agencies. Medicare Denominator File (MDF) data from 1996 were aggregated to produce measures of the total Medicare beneficiary population residing in geographic health service market areas.
Finally, county-level data from the 2000 ARF on hospitals and nursing homes were used to specify various indicators reflecting the supply of LTC services for the multivariate analysis.
B. Components of Medicare HHA Supply Changes
Although complete market exit and market entry by HHAs via changes in Medicare certification status clearly represent changes in Medicare HHA provider supply, these are not the only ways in which Medicare HHA supply changes can occur. While still retaining their Medicare certification, some HHAs may decrease Medicare HHA supply by contracting their geographic service area and visit volume, perhaps through the closure of branches or subunits. Other certified HHAs may increase Medicare HHA supply by adding staff to serve additional beneficiaries in an expanded geographic service area.
Medicare HHA supply changes, as reflected by increased or decreased visit capacity, can also occur in the absence of agency closures or any changes in HHAs' geographic service areas. However, there is an important fundamental geographic basis underlying policy concerns about the many HHA closures that followed implementation of the IPS. When Medicare HHA supply reductions occur via agency closure (or geographic service area contraction), the potential adverse impacts on beneficiary access are spatially concentrated in geographic areas where service is discontinued. Given the geographic basis of HHC service delivery, travel costs naturally limit the geographic extent of HHA service areas, which in turn, may limit the number of agencies able to expand service to affected areas. Potential access problems may be of particular concern in places where Medicare beneficiaries are served by a handful of HHAs. If the Medicare HHA supply reductions that followed the IPS resulted from proportional reductions in staffing and service capacity among all Medicare-certified HHAs, it is doubtful that there would be a similar level of policy concern about potential access problems.
In this study Medicare HHA supply changes are broadly defined to encompass not only market exits and entries, but also significant changes in agencies geographic service areas. When an HHA fully exits the Medicare home health market, the agency discontinues service to all Medicare beneficiaries in the service area it previously served. Similarly, when an HHA is a new market entrant, service is initiated to all Medicare beneficiaries in the new geographic service area where the agency willingly provides visits. Under this line of reasoning, HHAs which exhibit significant contractions or expansions of their geographic service areas can be viewed as partial market exits or partial market entries in the sense that service is discontinued to or added for some, but not all beneficiaries.
C. Requirements for Active Medicare Service
Measuring HHA supply changes in ways other than Medicare certification status requires consideration of what level of service to Medicare beneficiaries is necessary for an HHA to be actively serving Medicare beneficiaries. Although a reliable measure of Medicare certification would certainly seem to be a necessary condition for active Medicare service, it may not be sufficient for practical measurement of HHA supply changes. National Medicare HHA claims data for 1996 and 1999 reveal that a small but significant number of Medicare-certified HHAs actually serve very few Medicare beneficiaries annually. For example, 559 HHAs, amounting to 5.7% of the 9,806 HHAs with at least one Medicare visit claim in 1996, served ten or fewer different beneficiaries in 1996. The market behavior of HHAs serving so few patients is unlikely to have much practical significance for measuring HHA supply change. As part of the changes in Medicare participation rules made in 1997 designed to screen out problem providers, agencies were required to serve at least ten patients before seeking Medicare certification (GAO 1999). While these rules could be used as a basis for defining active Medicare service, there are practical difficulties in measuring geographic service area changes for HHAs serving so few users. As any assumed minimum beneficiary threshold will be arbitrary, active service to Medicare beneficiaries is conservatively defined in this study to be the provision of visits to more than 20 different beneficiaries annually. There were 958 HHAs, which accounted for 0.22% of total Medicare HHA visits in 1996, considered to be inactive in 1996 under this definition. Among these 958 HHAs, 208 of them were certified but also inactive in 1999, and 434 of them were no longer Medicare-certified in 1999. There were also 211 HHAs that obtained Medicare certification after 1996 but did not meet the minimum beneficiary service threshold in 1999. These latter 853 HHAs that did not actively serve Medicare beneficiaries in either 1996 and/or 1999 under the assumed threshold were excluded from the study, leaving 10,034 HHAs that met the active Medicare service requirement in 1996 and/or 1999.
D. Classification of Medicare HHA Supply Changes
A methodology was developed to classify HHAs that actively served Medicare beneficiaries in at least one of the years 1996 or 1999 into one of six mutually exclusive categories:
- HHA market exit: This category includes HHAs that actively served beneficiaries in 1996 with no Medicare claims in 1999.
- HHA service area contraction: This category includes: (1) HHAs that actively served beneficiaries in both 1996 and 1999 and contracted their geographic service area between 1996 and 1999, and (2) HHAs with Medicare claims in both 1996 and 1999 that actively served beneficiaries only in 1996.
- HHA service area expansion: This category includes: (1) HHAs that actively served beneficiaries in both 1996 and 1999 and expanded their geographic service area between 1996 and 1999, and (2) HHAs with Medicare claims in both 1996 and 1999 that actively served beneficiaries only in 1999.
- HHA service area change: This category includes HHAs that actively served beneficiaries in both 1996 and 1999 whose geographic service area changed between 1996 and 1996 due to both discontinued service in some areas and expansion of service to others.
- HHA service area stable: This category includes HHAs that actively served beneficiaries in both 1996 and 1999 whose geographic service area was relatively stable between 1996 and 1999.
- HHA new market entrant: This category includes HHAs that actively served beneficiaries in 1999 with no Medicare claims in 1996.
A summary of the methodology employed to classify HHA geographic service area changes as expanding, contracting, stable, or changed, is contained in the Appendix 3.A.
Table 3.1 contains information about the distribution of 10,034 HHAs that actively served Medicare beneficiaries in either 1996 or 1999 or both years among the six Medicare HHA supply change categories defined above. The relatively conservative criteria used to classify HHAs as expanding or contracting their service areas have produced a set of HHA classifications exhibiting a high degree of face validity. Among HHAs classified as contracting their service areas, about 36.3% of total beneficiaries served in 1996 lived in zip codes that were subsequently dropped from these HHAs geographic service areas. Only 3.2% of beneficiaries served in 1999 by HHAs in this group lived in zip codes that were newly served in 1999. A reciprocal pattern to this one is found for HHAs classified as expanding their geographic service areas. Whereas only 2.5% of beneficiaries served by these HHAs in 1996 lived in zip codes that were later dropped from an HHAs service area, 39.2% of beneficiaries served in 1999 lived in zip codes that were not previously served by these HHAs in 1996. Among HHAs classified as having stable geographic service areas, only 3.2% of beneficiaries served in 1996 and 4.1% of beneficiaries served in 1999 lived in zip codes that were dropped and added to these HHAs service areas between 1996 and 1999, respectively. A relatively small number of HHAs, accounting for only 3.7% of active HHAs in 1996, could not be classified as either expanding or contracting their service areas under the classification criteria employed. As expected, a relatively high percentage of beneficiaries served by these HHAs in 1996 and 1999, respectively, lived in zip codes that were dropped (18.5%) or added between 1996 and 1999.
Table 3.1 also contains information about distance traveled to beneficiaries served by HHAs in 1996 and 1999. Mean distance traveled to beneficiaries in their service areas among HHAs that contracted their service areas declined by about three miles between 1996 and 1999, presumably as a consequence of a tendency to discontinue service in more distant than closer zip codes.5 On the other hand, the mean distance traveled to beneficiaries in their service areas among HHAs that expanded their service areas increased by about 4.3 miles, presumably as a consequence of a tendency to add service in more distant than closer zip codes. In stark contrast to these two groups of HHAs, there was very little if any change in mean travel distance to beneficiaries in the service areas of HHAs with stable geographic service areas.
Table 3.1 shows similar differences among categories in the data on changes in staffing levels for RNs and certified nurse aides (CNAs). The decrease in mean RN and CNA staffing among HHAs with stable service areas reflects broader overall trends of supply contraction in the HHA industry following the IPS. Nevertheless, the data suggest that on average HHAs that were classified as contracting their service areas exhibited larger percentage decreases in staffing, particularly for RNs. The mean staffing level changes among HHAs classified as expanding their geographic service areas are sharply different from all other categories of HHAs. On average HHAs that expanded their service areas exhibited RN and CNA staffing levels in 1999 that were 83% and 23% higher than those in 1996, respectively. Overall these supporting data also suggest of a high degree of construct validity in the HHA response classifications.
E. Variable Specification
Multivariate analyses were performed to identify agency and market area attributes associated with the categorization of HHA supply changes described above. Table 3.2 contains a summary of definitions for all specified independent variables. Here we discuss the rationale for specification of these variables and their expected relationships with the outcome variable, or the likelihood that HHAs responded to the IPS through market exit, service area expansion, service area contraction, or a changed service area, relative to maintaining a stable geographic service area. Given our premise that the motivations for service area contraction and expansion are similar to the more extreme respective responses of market exit and entry, generally it is expected that most independent variables should have the same directional influence on these two outcomes. Weaker relationships are expected for service area contraction outcome relative to market exit, however. Expectations about the signs of variables with respect to the outcome of changed service areas are uncertain given the mixed nature of this form of supply response.
Agency Attributes. Dummy variables were specified for variables measuring the ownership status, organizational setting, and organizational structure of HHAs. GAO (1999) found that for-profit HHAs were disproportionately over-represented among market exits relative to government and voluntary non-profit agencies. In addition to a dummy variable distinguishing proprietary HHAs a separate dummy variable was specified for HHAs with government control. Voluntary non-profit control served as the reference class. Given the broader service missions that are likely to influence the behavior of non-profit agencies, for-profit HHAs are expected to be more likely than their voluntary non-profit counterparts to exit and to contract their service areas, and less likely to expand their service areas. As government HHAs may be less dependent on Medicare revenue than are voluntary non-profit agencies, government HHAs are expected to be less likely to exit and contract their service areas than non-profit HHAs.
Expectations about differences service area expansion among HHAs with different control status are uncertain. To the extent that many service area expansions reflect an agency responding to service demands of beneficiaries in places affected by closures and/or service area contractions, government HHAs may be less likely than voluntary non-profit agencies to fill those needs given their service missions. A dummy variable was specified to distinguish HHAs based in hospitals or nursing facilities from freestanding agencies. Such facility-based agencies should be less dependent on Medicare HHC revenues than freestanding agencies since they also receive patient revenue for institutional care. More modest market responses are expected for facility-based agencies (i.e., less likely to contract or expand their service areas, and to exit) than freestanding agencies.
A count variable was specified as the number of subunits and/or branches operated by an agency in 1996 to distinguish HHAs whose market response to the IPS may have been influenced by changes in Medicare participation rules in 1997. GAO (1999) noted that prior to 1997 it was common for a parent HHA to set up branches or semi-autonomous subunits for delivery of services. While a parent HHA may maintain some administrative control over a subunit, subunits are required to independently meet Medicare certification requirements and are supposed to serve patients in a different geographic area than the parent organization. On the other hand branches are not autonomous organizations and are not required to independently meet certification requirements from the parent organization. Changes in Medicare participation rules implemented in 1997 clarified the rules that branches had to be located sufficiently close to the parent organization (about ½-1 hour driving time) so that the parent organization could effectively manage the operation and service delivery without independent Medicare certification (GAO 1999). As a consequence of these changes in Medicare participation rules, HHAs operating subunits and/or branches in 1996 are expected to be more likely than their counterparts without such an organizational structure to exit and contract their geographic service areas. The expected effect of subunits and branches on service area expansion is uncertain. While Medicare participation rule changes might be expected to have a negative effect on service area expansion, the infrastructure of closed branches may facilitate an agencys ability to expand its service area under its parent agency.
GAO (1999) found that HHAs with less than five years of Medicare program tenure were disproportionately over-represented among closed agencies. As HHAs of longer Medicare program tenure should be more likely to have been able to achieve administrative and operational efficiencies compared to HHAs of shorter tenure, agencies with longer tenure should be less likely to contract their service area or exit the market. In addition, a separate dummy variable to distinguish agencies with Medicare certification dates after the start of the 1994 fiscal year. In contrast to established agencies whose per-beneficiary payment limits under the IPS were largely based on their own historical program experience, per-beneficiary payment limits for HHAs without a full year of program experience in fiscal year 1994 were fully based on the national median for established agencies. If recent market entrants tend to have per-beneficiary costs lower than established HHAs nationally, they should be less likely to exit or contract their service area, and more likely to expand their service area than established HHAs. On the other hand, national limits based on established HHAs should adversely affect recent market entrants with higher per-beneficiary costs.
The remaining two agency variables represent attributes associated with Medicare service delivery. Total beneficiaries served in 1996, was specified as an indicator of the scale of Medicare service provision by the HHA. GAO (1999) found that smaller HHAs serving fewer Medicare beneficiaries were disproportionately over-represented among closed agencies. HHAs serving larger volumes of beneficiaries annually should be less constrained by per-beneficiary limits imposed by the IPS because per-beneficiary costs will be affected as much by a relatively small number of high cost patients. The expected effect of total beneficiaries served on the likelihood of service area expansion is uncertain. The IPS did not provide any positive incentives for expansion by larger HHAs. The last agency attribute, average visits per beneficiary served in 1996, was specified as an indicator of the intensity of visits provided by HHAs to patients. While it is not equivalent to an agencys per-beneficiary costs, it should be fairly highly correlated with it. Since an agencys per-beneficiary limit was partially based on its own historical cost experience and partially based on the median values of HHAs in its region, per-beneficiary limits imposed with the IPS were more stringent for HHAs with higher costs per beneficiary served. Accordingly, HHAs that provided more visits per beneficiary served in 1996 should be more likely to exit and contract their service areas, and less likely to expand their service areas.
Market Area Attributes. Two variables were specified as indicators of the level of Medicare HHC demand from residents of the market area of each HHA using the county-based HSMAs developed by Makuc, Haglund, Ingram, Kleinman & Feldman (1991) as the geographic units.6 Since Medicare beneficiaries aged 75 years and older exhibit much higher Medicare HHC utilization rates than younger beneficiaries, market area Medicare HHC demand attributes were measured with data on this subset of the aged Medicare population. The size of an HHAs Medicare HHC market was specified as the number of Medicare beneficiaries aged 75 years and older in the HSMAs within an HHAs service area in 1996. Since travel costs should impede the delivery of HHC visits to distant patients, a demand density variable was specified to distinguish rural and urban HSMAs. The density of Medicare HHC market demand was specified as Medicare beneficiaries aged 75 year or older in 1996 per square mile for HSMAs within an HHAs service area.7 In general, HHAs providing visits in market areas with greater Medicare HHC demand should be less likely to exit and contract their service areas, and more likely to expand their service areas.
The presence of other competitor HHAs serving beneficiaries in the same market area is likely to affect supply responses by individual agencies. A count of active HHAs with service areas within the HSMAs served by an HHA in 1996 was specified as an indicator of competitive market structure and potential oversupply of Medicare HHC capacity. HHAs serving patients in market areas with more competitors should be more likely to exit or contract their service areas in response to the IPS than HHAs serving in market areas with lesser Medicare HHC supply. The effect of competitor agencies on the likelihood of expansion is uncertain. To the extent that more competitors reflects oversupply more than competition, having more competitor agencies should have a negative effect on the likelihood of service area expansion. An HHAs market share of total Medicare beneficiaries receiving visits in 1996 within the HSMA it serves was specified as an additional separate indicator of the HHAs competitive position relative to other agencies serving patients in the same market area. An HHA with a relatively small market share may behave differently than an otherwise similar one with a relatively large share in the same market area. HHAs with relatively larger market shares should be more able to maintain stable geographic service areas given their dominant market presence. On the other hand, the effect of a smaller market share on market response is less clear. While contraction by HHAs with smaller market shares may make them vulnerable to a greater risk of exit, such HHAs may also respond strategically by expanding service in areas where service was discontinued by other agencies.
To the extent that their service are substitutable for Medicare HHC visits, other sources of PAC and LTC supply in an HHAs market area, such as nursing homes, chronic disease hospitals, and LTC hospitals may also influence individual HHA supply decisions. Two variables were specified as indicators of other sources of PAC and LTC supply: nursing home beds per resident beneficiary 75 years and older and the count of LTC and chronic disease hospitals in the HSMAs served by an HHA. HHAs serving patients in market areas with greater supplies of other PAC and LTC resources should be more likely to exit and contract their service area, and less likely to expand their service areas.
Finally, GAO (1999) found that closed HHAs were disproportionately over-represented in southwestern states of Texas, Oklahoma, and Louisiana. Although a fairly large set of agency and market area variables were specified as factors likely to influence individual HHA supply decisions, some important factors may remain unspecified. Eight regional dummy variables corresponding to Census Divisions as defined by the U.S. Bureau of the Census were specified to capture unspecified residual influences associated with regional location.
3.4. Empirical Results
A. Components of Change in Medicare Beneficiaries Served 1996-1999
Table 3.3 contains information about changes in the volume of beneficiaries served for each category of HHAs, and gives some indication of the relative net contributions of market exits, service area contractions and expansions, and market entry to the 25% net national decline in Medicare beneficiaries served by active HHAs, a decline from 3,994,963 beneficiaries served in 1996 to 2,995,812 served in 1999. HHAs that closed after 1996 served more than 558, 000 beneficiaries in 1996 that they no longer served in 1999, a substantial amount relative to the net decrease of nearly one million Medicare beneficiaries served by HHAs in 1999 relative to 1996. However, HHA exits are only one of several sources that contributed to this overall net decline. HHAs which significantly contracted their geographic service areas served more than 244,000 fewer beneficiaries overall in 1999 relative to 1996. A little more than half of this net decrease was associated with discontinued service in the dropped portions of their 1996 geographic service areas. Note also that HHAs with stable geographic service areas served more than one-half million fewer beneficiaries in 1999 than 1996, an amount nearly as large as the volume of beneficiaries served by exiting HHAs. Finally, the data also show that a sizable minority of HHAs expanded Medicare HHA via expansion of their geographic service areas. HHAs expanding their geographic service areas served nearly 195,000 more beneficiaries in 1999 than 1996. While roughly three-fourths of this net increase was attributable to service in expanded portions of their geographic service areas, there was also a net increase of nearly 56,000 beneficiaries served in portions of their service areas that were already served in 1996. It is also notable that the net increase in beneficiaries served by HHAs expanding their geographic service areas was actually larger than the nearly 132,000 beneficiaries served by new market entrant HHAs in 1999.
Previous studies have focused nearly exclusively on the high number of agency closures that occurred after implementation of the IPS (GAO 1999; OIG 2000). However, decomposing the overall change in the volume of Medicare beneficiaries served between 1996 and 1999 into multiple sources suggests a more complex picture of HHA supply response to the IPS than has been commonly portrayed in other studies. While more modest than that associated with closures and new market entry, the supply changes associated service area contractions and expansions by active HHAs were not trivial by any means. Our multivariate analysis results impart some additional insight about the factors influencing individual HHA supply decisions after implementation of the IPS.
B. Multivariate Analysis Results
Table 3.4 contains empirical results from a multinomial logit model that was fitted on the supply decisions of 9,061 active HHAs in 1996. Odds ratio transformations of the estimated parameters are reported to facilitate interpretation of the results. Since five alternative supply decision outcomes were specified, there are four sets of estimated coefficients for each independent variable specified in the model. Each of the four odds ratio estimates is interpreted with respect to the common reference outcome of stable service area. Conventional tests of multicollinearity and other sensitivity analyses of the model specification suggested that the estimated model parameters were robust.
Agency Attributes. Most of the ownership status and organizational variables were significantly associated with HHAs supply decisions with signs consistent with expectations. For-profit HHAs were more likely to have contracted their service area (OR=1.85), changed their service area (OR=2.31, or exited the market (OR=1.60)) than to have maintained a stable geographic service area relative to otherwise similar voluntary non-profit agencies. The odds of market exit over a stable service area were about 60% higher among for-profit agencies relative to their non-profit counterparts. While government-owned HHAs were also less likely to close than voluntary non-profit agencies (OR=0.46), in contrast to for-profit HHAs, the odds of service area expansion over a stable market area were about 59% lower among government-owned HHAs relative to voluntary non-profits. Facility-based agencies were very unlikely to exhibit changes of any type in their service areas. For example, the estimated parameters suggest that odds of contracting and expanding their service areas rather than maintaining a stable service area were about 56% and 59% lower, respectively, among facility-based HHAs relative to their freestanding agency counterparts.
HHAs with geographically-dispersed organizational structures with branches and/or subunits in 1996 were more likely to either have contracted (OR=1.18) or changed (1.09) their service area, or to close altogether (OR=1.12), than their counterparts without branches or subunits. The odds of service area contraction were particularly high among HHAs with multiple branches and/or subunits. For example, the expected odds of service area contraction over a stable service area are suggested to increase by about 18% for each additional branch and/or subunit of the parent organization in 1996.
The effects of Medicare program tenure on HHA supply response were varied. Very recent market entrant HHAs were both more likely to close (OR=1.56) and to expand (OR=2.49) their service areas than agencies that were Medicare-certified before October 1993. For, example, the odds of expanding rather than maintaining a stable service area between 1996 and 1999 were about 2.49 times higher among very recent market entrants relative to otherwise similar HHAs with longer Medicare program tenures. This may reflect pressure on upstart HHAs to offset the arguably higher costs associated with initiating their business and avoid a likely large financial loss via exiting the market right away. Additional years of Medicare program tenure generally were not associated with any supply response other than service area contraction. For each additional year of certification, the odds of service area contraction over a stable service area decreased by nearly 2%.
HHAs serving greater volumes of Medicare beneficiaries in 1996 were less likely to have contracted or changed their service area, or to have closed altogether, than smaller agencies. The odds of an HHA contracting or changing its service area, or closing altogether over maintaining a stable service area are suggested to decrease by roughly 3-5% for each 100 additional beneficiaries served in 1996. Agencies serving larger volumes of Medicare beneficiaries were also much less likely to expand their service areas. The odds of service area expansion over maintaining a stable service area are suggested to decrease by almost 12% for each 100 additional beneficiaries served in 1996.
Finally, the per-beneficiary limits imposed on HHAs under the IPS appear to have influenced HHA supply decisions in the manner expected. HHAs with more visit-intensive practice styles were at greater risk of closure and service area contraction, and were less likely to expand their service area, than agencies providing fewer average visits per beneficiary in 1996. The odds of service area contraction and closure over maintaining a stable service area are both suggested to increase by roughly 2%, and the odds of service area expansion to decrease by almost 5% for every ten visits higher was an agencys average annual visits per beneficiary served in 1996.
Market Area Attributes. HHA supply decisions following the IPS appear to have been modestly influenced by the size and density of Medicare market HHC demand. An HHAs odds of service area contraction and closure over maintaining a stable service area decreased by almost 2% for each additional 10,000 Medicare beneficiaries residing in their health service market area. The risks of contraction and closure were unrelated to the spatial density of Medicare service demand. However, the expected odds of an HHA expanding over maintaining a stable service area are suggested to have increased by nearly 8% for each additional 100 Medicare beneficiaries aged 75 years or more per square mile in their health service market area.
An HHAs risks of closure and service area changes of all types were all influenced not only by the market presence of competitor HHAs in their health service market area, but also by their relative competitive standing as reflected by their market share of beneficiaries served. The estimated parameters for the variable active Medicare HHAs suggest that the odds of an HHA contracting its service area, expanding it, or closing altogether, over maintaining a stable service area roughly increased between 3-5% for each ten HHAs serving beneficiaries in the same health service market area in 1996. A uniform pattern of odds ratios less than one for the beneficiary market share variable suggests that HHAs serving greater market shares of Medicare beneficiaries in 1996 were most likely to maintain a stable geographic service area over the next three years. For example, the odds of service area contraction, expansion, or closure over maintaining a stable service area, are estimated to be about 5-8% lower for each additional percentage point higher was an agencys 1996 share of Medicare beneficiaries served in their market area. Interestingly, the results suggest that presence of competitor agencies and an agencys relative market share influenced the odds of service area expansion, contraction, and closure in the same way. While one can only speculate without further analysis, this finding could be the result of some agencies expanding their service areas to meet the needs of beneficiaries previously served by agencies that contracted their service areas or closed.
Mixed empirical results were found regarding the influence of the supply of other PAC and LTC resources on HHA supply decisions. Consistent with expectations, HHAs in market areas with more LTC and chronic disease hospitals are suggested to be at greater risk of closure (OR=1.26) and a changed service area (OR=1.39) than otherwise similar agencies in market areas with fewer facilities. In contrast, HHAs in market areas with greater nursing home bed supply are suggested to have lower odds of contracting their service areas (OR=0.97).
Lastly, several census division regional dummy variables were significant suggesting there were some regional factors beyond those specified in the model that influenced HHA supply decisions. The expected odds of closure over a stable service are suggested to be more than 3.5 times higher among HHAs located in either the Mountain or Pacific census divisions relative to otherwise similar agencies in the New England census division. Given the large magnitude of these regional differences, it is interesting that the closure outcome dummy variable corresponding to the West South Central Region (containing Arkansas, Louisiana, Oklahoma, and Texas) was insignificant. In light of earlier GAO (1999) findings that the bulk of HHA closures occurred in Louisiana, Oklahoma, and Texas. On the other hand HHAs located in the South Atlantic (OR=1.73), East South Central (2.83), and West South Central (OR=1.85) census divisions were much more likely to expand their service area relative to otherwise similar agencies in the New England census division. This would suggest that the most important factors associated with closures in those states have been specified in the multinomial logit model.
3.5. Discussion
In this study we have employed Medicare HHC claims data and a broader definition of HHA supply changes than simply closure to investigate factors associated with HHA supply response to implementation of the IPS in 1997. Similar to past research, our empirical investigation of HHA supply changes following the IPS portrays an HHA industry with serious declines in supply. In contrast to earlier studies, however, our analyses indicate that the surge of HHA closures between 1997 and 1999 that have received so much attention do not fully reflect the magnitude of HHA supply response to the IPS. An examination of changes in geographic patterns of service to Medicare beneficiaries among HHAs actively serving Medicare beneficiaries in the years following the IPS reveals substantial dynamics in local HHA supply that rival the magnitude of supply changes associated with agency closures. Given the relative magnitudes of HHA supply changes associated with geographic service area contraction and expansion found in this study, further analysis is warranted regarding the spatial distribution of these service area changes to better understand their potential impacts on access.
It is important to assess the degree to which HHA supply reductions associated with service area contraction occurred in the same or different market areas as closures. If HHA service area contractions largely occurred in the same geographic market areas as closures, agency closures may understate the potential for access problems. On the other hand, if HHA service area contraction largely occurred in different geographic markets from markets with high agency closures, potential beneficiary access problems may be more difficult to identify by simple comparisons of rates of change in Medicare HHC utilization changes in markets with and without high prevalence of agency closures. Similarly, it is important to assess the degree to which the geographic distribution of HHA service area expansions and new HHA market entrants coincided so as to have offsetting effects on potential access problems.
General findings from our multivariate empirical analysis of individual HHA supply decisions suggest that the geographic distributions of HHA service area contractions and closures may coincide. This analysis suggests that HHA service area contractions were largely associated with the same factors as agency closures. HHAs that closed or contracted their service areas both tended to freestanding, for-profit agencies, with subunits or branches, with relatively fewer years of Medicare program tenure. The per-beneficiary limits imposed by the IPS were more likely to adversely affect agencies that served smaller volumes of beneficiaries with relatively higher costs per beneficiary. Agencies that closed or contracted their geographic service areas both generally served fewer Medicare beneficiaries but provided more visits per beneficiary served than other HHAs that maintained or expanded their geographic service areas after the IPS. Finally, HHAs that closed or contracted their service areas both tended to serve relatively small shares of the total volume of Medicare beneficiaries served in more competitive geographic markets served by many other agencies.
Our multivariate empirical findings hint that the geographic distribution of HHA service area expansions may also coincide with those of closures and service area contractions. HHAs that expanded their service areas tended to be smaller, freestanding agencies under voluntary non-profit ownership, that acquired Medicare-certified within a couple of years of IPS implementation. Similar to HHAs which contracted their service areas or closed, HHAs that expanded their service areas tended to serve relatively small market shares of beneficiaries in more competitive geographic market areas served by many other HHAs. They differed from contracting and closed agencies, however, in that they were likely to have been constrained by per-beneficiary cost limits since on average, they provided relatively fewer visits per beneficiary served in 1996. The overall pattern of empirical results suggests that many HHAs that expanded their service area, may have done so in places previously served by HHAs that contracted supply.
This study has produced a more comprehensive picture of the magnitude and complexity of changes in HHA supply that occurred following implementation of the IPS. The insights it has added about various sources of supply response, and the factors contributing to the HHA supply decisions suggest that observed reductions in HHA supply reflected rational market decisions by agencies responding to very significant changes in the payment system. While our study findings are richer than earlier studies, they similarly suggest that the HHA supply reductions following the IPS more likely reflect the loss of marginal agencies in geographic markets with an abundance of supply in 1996.
Appendix 3.A. Methodology for Classifying HHA Service Area Changes
Geographic Service Area Delineation
Geographic service areas were first delineated for each active HHA in 1996 and 1999 using an iterative approach commonly employed for the delineation of hospital service areas where zip codes accounting for the most patients are sequentially added one at a time to the service area, each time adding fewer patients, until some threshold percentage of patients served is reached (Garnick, Luft, Robinson & Tetreault 1987; Goody 1993; Slifkin, Ricketts & Howard 1996). Only five-digit zip codes involving service to two or more beneficiaries by the HHA were used to delineate service areas. Preliminary analyses suggested that many zip codes where only one beneficiary was served reflected idiosyncratic situations, including for example, long-distance moves by beneficiaries during the year that are not reflected in the beneficiary residence zip code on Medicare claims data.8 Employing a threshold percentage of 90%, each HHA's geographic service area included either: (1) the zip codes with the greatest numbers of beneficiaries served that collectively accounted for 90% of all beneficiaries served over the year by the HHA; or (2) all zip codes involving visits to two or more beneficiaries if the 90% threshold was not met. The selected zip codes comprising the service areas of HHAs active in 1996 collectively accounted for 89.3% of all Medicare beneficiaries served by these same HHAs in 1996, with duplicated counts of beneficiaries who were served by more than one HHA during the year.
Zip Codes Added or Dropped from HHA Service Areas
For each HHA, zip codes comprising its service area in 1996 and 1999 were then classified into one of three categories: (1) zip codes served in 1996 but not 1999; (2) zip codes served in 1999 but not 1996; and (3) zip codes served in both 1996 and 1999. Zip codes involving visits to two or three beneficiaries in one of the years that were not served in the other year were counted as being served in both 1996 and 1999 to reduce the chances of their misclassification due to sampling variation.9 Beneficiaries served in zip codes assigned to these three categories were aggregated to the HHA level to produce four summary totals of beneficiaries served: (1) beneficiaries served in 1996 of zip codes served by the HHA in both 1996 and 1999; (2) beneficiaries served in 1996 of zip codes no longer served by the HHA in 1999; (3) beneficiaries served in 1999 of zip codes served by the HHA in both 1996 and 1999, and (4) beneficiaries served in 1999 of zip codes newly served by the HHA in 1999.
Classification of HHA Service Area Changes
Each of the 7,021 HHAs that actively served beneficiaries in both 1996 and 1999 were then classified into categories of expanded, contracted, changed, or stable geographic service area between 1996 and 1999 based on the relative magnitudes of the four summary variables containing counts of beneficiaries served in dropped, added, and continuously served zip codes. Since most HHAs discontinued service to some zip codes in 1999 that were served in 1996 and/or added service to zip codes in 1999 that were not served in 1996, the general aim was to distinguish those HHAs with service area changes large enough to be of practical significance from other HHAs whose geographic service areas were relatively stable over time.
We first considered what level of beneficiary service contraction or expansion is necessary to have practical significance. Suppose that in 1999 an HHA no longer served a subset of zip codes that accounted for 1% of total beneficiaries in 1996, and the HHA does not serve beneficiaries in any newly added zip codes in 1999. While this may technically be viewed as a service area contraction, it is unlikely to have much practical significance. Recognizing that any minimum threshold will be arbitrary, a minimum threshold percentage of 20% of total beneficiary service volume was chosen as a classification parameter. Under this assumed threshold three important subsets of HHAs were assigned to categories:
- First, an HHA that discontinued service in 1999 to beneficiaries of some zip codes served in 1996, and that did not initiate service in 1999 to beneficiaries of any zip codes that were not also served in 1996, can be classified as having contracted its service area if service in the dropped zip codes satisfy the 20% threshold.
- Second, an HHA that continued to serve in 1999 beneficiaries of all zip codes previously served in 1996, and that initiated service in 1999 to beneficiaries of other zip codes, can be classified as having expanded its service area if the added zip codes satisfy the assumed 20% thresholds for 1996 and 1999.
- Third, an HHA that discontinues service to some zip codes and/or newly expands service to other zip codes can be classified as having a stable service area if neither of the assumed 20% beneficiary service thresholds for 1996 and 1999 is met.
The assumed 20% beneficiary service threshold alone is not sufficient, however, to classify those HHAs that contracted or expanded their service areas vis-à-vis both discontinuing service to beneficiaries of some zip codes and initiating service to beneficiaries of other zip codes between 1996 and 1999. Here the relative magnitudes of beneficiary service volume in zip codes dropped and added must be considered. It seems reasonable to generally expect that HHAs contracting their service areas should have served many more beneficiaries in 1996 in the zip codes dropped from its service area than they later served in newly added zip codes in 1999. Likewise, HHAs expanding their service areas should serve many more beneficiaries in newly served zip codes in 1999 than they served in 1996 in zip codes dropped from its service area.
While any definition of many more will be arbitrary, many more was defined in this study to be at least five times larger. That is, to be classified as contracting its service area, an HHA must have served five times as many beneficiaries in 1996 in the zip codes dropped from its service area than it later served in 1999 in newly added zip codes. Similarly, classification of expanded service area required that beneficiaries in newly added zip codes outnumber those in dropped zip codes by a factor of five. All remaining HHAs that both dropped and added zip codes from their service areas that did not meet these relative service volume requirements were assigned to a residual category of HHAs with changed service areas.
Given that arbitrary assumptions were employed in the classification process, sensitivity analyses were performed to assess the sensitivity of the initial assignments to marginal changes in the assumed classification parameters. The service area data of HHAs with parameter-sensitive classifications that served at least 500 beneficiaries annually were manually compared with the norms of HHAs comprising the shifted categories. As a consequence of these comparisons, 24 HHAs in the residual category of changed service area were reclassified. Ten of these HHAs were reassigned to the contracted service area category, with the remainder were reassigned to the expanded service area category.
| TABLE 3.1: Categories of Change in Medicare HHA Supply 1996-1999 with Selected Agency Attributes | ||||||||
| Variable | HHA Supply Change Category 1996-1999 | |||||||
| Market Exit | Service Area Contraction | Service Area Expansion | Service Area Changed | Service Area Stable | New Market Entrant | Total 1996 | Total 1999 | |
| Beneficiary Service Attributes | ||||||||
| Number of HHAs | 2,143 | 1,027 | 942 | 342 | 4,710 | 870 | 9,164 | 7,891 |
| % of total 1996 | 23.4% | 11.2% | 10.3% | 3.7% | 51.4% | 100.0% | ||
| % of total 1999 | 13.0% | 11.9% | 4.3% | 59.7% | 11.0% | 100.0% | ||
| Medicare beneficiaries served 1996 | 558,493 | 343,651 | 167,120 | 85,626 | 2,840,073 | 3,994,963 | ||
| Beneficiaries served in dropped zip codes 1996 | 558,493 | 124,851 | 4,122 | 15,836 | 90,967 | 794,269 | ||
| Service in dropped zip codes as % of 1996 total | 100.0% | 36.3% | 2.5% | 18.5% | 3.2% | 19.9% | ||
| Medicare beneficiaries served 1999 | 99,163 | 362,048 | 71,599 | 2,331,417 | 131,585 | 2,995,812 | ||
| Beneficiaries served in added zip codes 1999 | 3,200 | 142,054 | 19,926 | 96,665 | 131,585 | 393,430 | ||
| Service in added zip codes as % of 1999 total | 3.2% | 39.2% | 27.8% | 4.1% | 1000% | 13.1% | ||
| Travel Distance Attributes1 | ||||||||
| Mean distance from HHA to beneficiary in miles 1996 | 16.89 | 12.28 | 21.40 | 10.13 | ||||
| Mean distance from HHA to beneficiary in miles 1999 | 13.84 | 16.57 | 19.30 | 10.25 | ||||
| Mean change in distance 1996-1999 in miles | -3.05 | 4.29 | -2.10 | 0.12 | ||||
| HHA Staffing Levels2 | ||||||||
| Mean RN FTEs 1996 | 12.82 | 7.10 | 8.19 | 17.96 | ||||
| Mean RN FTEs 1999 | 8.28 | 13.01 | 7.81 | 15.84 | ||||
| Mean change in RN FTEs 1996-99 | -35.4% | 83.2% | -4.6% | -11.8% | ||||
| Mean CNA FTEs 1996 | 14.63 | 7.56 | 10.95 | 17.34 | ||||
| Mean CNA FTEs 1999 | 9.58 | 9.31 | 9.60 | 12.94 | ||||
| Mean change in CNA FTEs 1996-1999 | -34.5% | 23.1% | -12.3% | -25.4% | ||||
| ||||||||
| TABLE 3.2: Variable Definitions and Descriptive Statistics | ||||
| Variable | Definition | Source | Mean | SD |
| Ownership Status | ||||
| For-profit | Yes=1, No=0 | POS | 0.545 | 0.498 |
| Government | Yes=1, No=0 | POS | 0.146 | 0.353 |
| Voluntary not-for-profit (reference) | Yes=1, No=0 | POS | 0.309 | 0.462 |
| Organizational Setting | ||||
| Hospital-based | Yes=1, No=0 | POS | 0.299 | 0.458 |
| Freestanding (reference) | Yes=1, No=0 | POS | 0.701 | 0.458 |
| Organizational Structure | ||||
| Branches and subunits | A count of branches and/or subunits operated by the HHA in 1996. | POS | 0.602 | 1.839 |
| Medicare Program Tenure | ||||
| Medicare program tenure | Years of Medicare program certification as of 1/1/1996. | POS | 9.028 | 9.064 |
| Recent market entrant | Medicare program certification before 10/1/1993, otherwise=0 | POS | 0.326 | 0.469 |
| Medicare Service Delivery Attributes | ||||
| Beneficiaries served 1996 | Total Medicare beneficiaries (in 100s) served by the HHA with 1+ visits in 1996. | claims | 4.400 | 7.948 |
| Visits per beneficiary served 1996 | Average visits (in 10s) per beneficiary served in 1996. | claims | 8.231 | 5.828 |
| Medicare HHC Demand Attributes | ||||
| Medicare market demand size | Medicare beneficiaries 75 yrs and older (in 10,000) in market area 1996. | MDF | 6.893 | 10.402 |
| Medicare market demand density | Medicare beneficiaries 75 yrs and older (in 100s) per square miles in market area 1996. | MDFARF | 0.276 | 1.020 |
| Medicare HHC Market Area Attributes | ||||
| Active Medicare HHAs | The number of HHAs (in 10s) with catchment areas within the market areas served by the HHA. | POSclaims | 5.757 | 8.290 |
| Market share of beneficiaries served | The percentage of total beneficiary users in the geographic market area that area served by the HHA. | claims | 6.674 | 11.085 |
| Other LTC Supply Indicators | ||||
| Nursing home bed supply | Medicare-certified nursing home beds per 100 beneficiaries 75 years and older in the market area. | MDFARF | 4.094 | 4.766 |
| Chronic disease and LTC hospitals | Number of LTC and chronic disease hospitals in market area 1996 | ARF | 0.090 | 0.461 |
| Census Division | ||||
| New England (reference) | HHA headquarters in ME,NH,VT,MA,RI,CT=1, otherwise=0 | POS | 0.047 | 0.211 |
| Middle Atlantic | HHA headquarters in NY,NJ,PA=1, otherwise=0 | POS | 0.065 | 0.247 |
| East North Central | HHA headquarters in OH,MI,IN,IL,WI=1, otherwise=0 | POS | 0.149 | 0.356 |
| West North Central | HHA headquarters in MN,MO,IA,KS,NE,SD,ND=1, otherwise=0 | POS | 0.108 | 0.311 |
| South Atlantic | HHA headquarters in DE,MD,DC,VA,WV,NC,SC,GA,FL=1, otherwise=0 | POS | 0.116 | 0.320 |
| East South Central | HHA headquarters in KY,TN,AL,MS=1, otherwise=0 | POS | 0.064 | 0.244 |
| West South Central | HHA headquarters in LA,TX,AR,OK=1, otherwise=0 | POS | 0.279 | 0.448 |
| Mountain | HHA headquarters in MT,WY,CO,NM,AZ,UT,ID,NV=1, otherwise=0 | POS | 0.099 | 0.299 |
| Pacific | HHA headquarters in CA,OR,WA=1, otherwise=0 | POS | 0.072 | 0.259 |
| NOTES: POS=Medicare Provider of Service file; ARF=Area Resource File; Claims=100% Medicare HHA claims data; MDF=Medicare Denominator File. | ||||
| TABLE 3.3: Components of Change in Medicare Beneficiaries Served 1996-1999 | |||||||
| Variable | HHA Supply Change Category 1996-1999 | ||||||
| Market Exit | Service Area Contraction | Service Area Expansion | Service Area Changed | Service Area Stable | New Market Entrant | Net Change 1996-99 | |
| Beneficiaries Served | |||||||
| Number of HHAs | 2,143 | 1,027 | 942 | 342 | 4,710 | 870 | -1,273 |
| Medicare beneficiaries served 1996 | 558,493 | 343,651 | 167,120 | 85,626 | 2,840,073 | 0 | |
| Beneficiaries served in dropped zip codes 1996 | 558,493 | 126,880 | 5,398 | 16,731 | 96,913 | 0 | |
| Medicare beneficiaries served 1999 | 0 | 99,163 | 362,048 | 71,599 | 2,331,417 | 131,585 | |
| Beneficiaries served in added zip codes 1999 | 0 | 3,984 | 144,348 | 21,017 | 104,629 | 131,585 | |
| Sources of Change in Beneficiaries Served | |||||||
| Continuously served zip codes | 0 | -121,592 | 55,978 | -18,313 | -516,372 | 0 | -600,299 |
| Zip codes dropped from HHA service areas | -558,493 | -126,880 | -5,398 | -16,731 | -96,913 | 0 | -804,415 |
| Zip codes added to HHA service areas | 0 | 3,984 | 144,348 | 21,017 | 104,629 | 131,585 | 405,563 |
| Total | -558,493 | -244,488 | 194,928 | -14,027 | -508,656 | 131,585 | -999,151 |
| TABLE 3.4: Multinomial Logit Model Results for HHA Supply Decisions 1996-1999 | ||||||||||||
| Variables | Contract Service Area/ Stable Service Area | Expand Service Area/ Stable Service Area | Changed Service Area/ Stable Service Area | Market Exit/ Stable Service Area | ||||||||
| OR1 | t | p-value | OR | t | p-value | OR | t | p-value | OR | t | p-value | |
| Ownership Status (not-for-profit) | ||||||||||||
| For-profit | 1.849 | 5.35 | 0.000 | 1.109 | 0.90 | 0.370 | 2.313 | 4.34 | 0.000 | 1.599 | 5.42 | 0.000 |
| Government | 1.198 | 1.25 | 0.210 | 0.410 | -4.87 | 0.000 | 0.885 | -0.45 | 0.654 | 0.457 | -6.20 | 0.000 |
| Organizational Setting | ||||||||||||
| Hospital-based | 0.436 | -6.95 | 0.000 | 0.370 | -7.62 | 0.000 | 0.268 | -5.93 | 0.000 | 0.493 | -7.87 | 0.000 |
| Organizational Structure | ||||||||||||
| Branches and subunits | 1.184 | 7.14 | 0.000 | 0.991 | -0.19 | 0.852 | 1.090 | 2.15 | 0.032 | 1.119 | 5.03 | 0.000 |
| Medicare Program Tenure | ||||||||||||
| Medicare program tenure | 0.983 | -2.38 | 0.017 | 0.977 | -2.56 | 0.011 | 0.993 | -0.63 | 0.526 | 0.990 | -1.70 | 0.090 |
| Recent market entrant | 1.003 | 0.03 | 0.974 | 2.490 | 7.79 | 0.000 | 1.326 | 1.84 | 0.066 | 1.560 | 5.48 | 0.000 |
| Medicare Service Delivery Attributes | ||||||||||||
| Beneficiaries served 1996 (100s) | 0.963 | -3.63 | 0.000 | 0.881 | -6.45 | 0.000 | 0.971 | -2.01 | 0.044 | 0.952 | -5.52 | 0.000 |
| Visits per beneficiary served 1996 (10s) | 1.023 | 2.88 | 0.004 | 0.954 | -5.10 | 0.000 | 1.013 | 1.17 | 0.243 | 1.021 | 3.16 | 0.002 |
| Medicare HHC Demand Attributes | ||||||||||||
| Medicare market demand size (10,000s) | 0.983 | -2.00 | 0.045 | 0.998 | -0.19 | 0.848 | 1.017 | 1.25 | 0.210 | 0.977 | -3.12 | 0.002 |
| Medicare market demand density (100s/m2) | 1.050 | 1.22 | 0.224 | 1.079 | 2.27 | 0.023 | 0.893 | -0.76 | 0.449 | 0.897 | -1.41 | 0.158 |
| Medicare HHC Market Structure Attributes | ||||||||||||
| Active Medicare HHAs (10s) | 1.046 | 4.47 | 0.000 | 1.028 | 2.72 | 0.006 | 1.040 | 2.79 | 0.005 | 1.043 | 5.15 | 0.000 |
| Market share of beneficiaries served (%) | 0.921 | -8.59 | 0.000 | 0.954 | -4.64 | 0.000 | 0.979 | -2.01 | 0.045 | 0.947 | -8.94 | 0.000 |
| Other LTC Supply Indicators | ||||||||||||
| Nursing home bed supply (/100 capita) | 0.966 | -2.95 | 0.003 | 1.004 | 0.35 | 0.726 | 1.004 | 0.24 | 0.813 | 0.999 | -0.09 | 0.931 |
| Chronic disease and LTC hospitals | 0.893 | -1.02 | 0.309 | 1.164 | 1.39 | 0.165 | 1.392 | 2.86 | 0.004 | 1.258 | 3.07 | 0.002 |
| Census Division (New England) | ||||||||||||
| Middle Atlantic | 0.935 | -0.25 | 0.802 | 1.423 | 1.15 | 0.250 | 1.044 | 0.11 | 0.913 | 1.058 | 0.26 | 0.798 |
| East North Central | 1.277 | 1.07 | 0.284 | 1.078 | 0.27 | 0.787 | 0.625 | -1.29 | 0.198 | 1.184 | 0.90 | 0.366 |
| West North Central | 1.545 | 1.81 | 0.071 | 0.793 | -0.76 | 0.447 | 0.898 | -0.28 | 0.782 | 1.248 | 1.11 | 0.265 |
| South Atlantic | 1.339 | 1.28 | 0.202 | 1.732 | 2.00 | 0.045 | 0.747 | -0.79 | 0.427 | 1.208 | 1.00 | 0.317 |
| East South Central | 1.188 | 0.69 | 0.488 | 2.832 | 3.46 | 0.001 | 1.013 | 0.03 | 0.974 | 0.710 | -1.54 | 0.122 |
| West South Central | 0.911 | -0.37 | 0.708 | 1.851 | 2.13 | 0.033 | 1.144 | 0.36 | 0.720 | 1.217 | 0.99 | 0.322 |
| Mountain | 0.872 | -0.52 | 0.602 | 0.986 | -0.05 | 0.963 | 0.687 | -0.92 | 0.360 | 2.214 | 3.99 | 0.000 |
| Pacific | 1.370 | 1.25 | 0.212 | 1.753 | 1.91 | 0.056 | 1.184 | 0.43 | 0.666 | 2.002 | 3.46 | 0.001 |
Log likelihood=-9,907.61 Pseudo-R squared=0.1465 N=9.061
| ||||||||||||
4. CHANGES IN MEDICARE UTILIZATION
4.1. Introduction
The 1997 BBA dramatically reduced Medicare home health spending from $16 billion in 1996 to $7 billion in 1999, and contributed to a 15% decline in the number of Medicare participating HHAs between 1996 and 1999. Although the central feature of the BBAs home health provisions was the mandate for a PPS, it was the IPS that actually caused the structural change in spending. Also required by the BBA, the IPS went into effect in October 1997. Notably, the 50% reduction in spending between 1996 and 1999 associated with the IPS was followed by negligible changes in spending levels after the PPS was implemented in October 2000. Hence, questions concerning changes in Medicare beneficiaries access to home health services as a result of the BBA might logically refer to the impact of the IPS, rather than the PPS.
After the IPS went into effect, utilization of Medicare home health dropped dramatically in terms of use rates and the number of visits per user. While the payment limits imposed by the IPS put a significant amount of pressure on HHAs to limit utilization, a substantial number of HHAs exited the Medicare program. The dramatic decrease in utilization and agency closings raised questions about whether beneficiaries were retaining access to Medicare home health services. Special concerns were express about rural communities which may have fewer alternatives when a local agency closes and about beneficiaries with chronic illness who were likely to incur higher costs than the amounts of the cost limits established by the IPS (Smith and Rosenbaum 1998; Komisar and Feder 1998).
Responding to Congressional concerns about HHA closures and beneficiary access, GAO conducted studies of Medicare HHC focusing on those concerns (GAO 1998, 1999). For those studies, the GAO examined HHA certification status and beneficiary utilization information from Medicare administrative records, and conducted interviews with stakeholders, including hospital discharge planners, consumer advocates, state agency officials, and HHA representatives.
Although GAO found a high (14%) closure rate of Medicare participating HHAs after implementation of the IPS in October 1997, it did not conclude that the reduced capacity would be a threat to beneficiary access to the benefit, largely because there had been a very rapid growth in the number of agencies leading up to 1997.10 Despite the high HHA closure rate after the IPS was implemented, the number of Medicare participating agencies in 1999 was comparable to the number of participating HHAs before the rapid growth period. GAO also found that agencies that stopped participating in Medicare were distinctive in their regional and provider characteristics. Approximately, 40% of the agencies that closed were located in there states (i.e., Louisiana, Oklahoma, and Texas), which were among those with the highest recent growth in number of agencies. Consistent with this trend, many agencies that closed were among those with under five years of participation in Medicare. Relative to agencies that continued to participate in Medicare after the IPS, agencies that closed were also likely to have been of proprietary ownership, located in urban areas, freestanding, and served lower than average numbers of patients.
GAO found large declines in both rates of beneficiary use and number of visits among users after IPS was implemented. In addition, while the IPS narrowed variations in use among counties, substantial variation continued to exist. Despite the utilization changes, interviews with hundreds of stakeholders indicated that, in general, Medicare beneficiary access to home health services were not greatly affected by the agency closures. Some providers indicated, however, that individuals with greater needs (e.g., diabetics, wound care patients, individuals with Alzheimers disease) required a greater effort to be placed. In sum, the GAO studies findings suggested that closure of HHAs after the IPS was implemented did not generally affect access to Medicare home health benefit.
Analyses in this chapter build on these prior descriptive studies by GAO (and other official agencies) and focus on the question of how Medicare home health utilization changed after the implementation of the IPS, as a function of HHA closures. Our findings address HSMA-level utilization rate and agency closure patterns between 1996 and 1999. Estimates from multivariate analyses provide insight on the impact of agency closures on utilization rate changes. Findings in this chapter are generally consistent with those in which we conducted a similar analysis at the county-level (Liu, Wissoker, Porell & Overington 2003).
4.2. Approach and Data Sources
We conducted HSMA-level, multivariate analyses to estimate the impact of agency closures on Medicare home health utilization. We examined the extent to which agency closings affected use rates between 1996 and 1999, years before and after the implementation of the IPS. HSMA-level changes in Medicare home health users between 1996 and 1999 were estimated as a function of various measures of agency supply change between the two years. In particular, we examined: (1) percent of Medicare participating agencies in 1996 that became inactive by 1999; (2) percent of users in 1996 served by the closed agencies; and (3) net change in the number of agencies between 1996 and 1999. We included, in our models, variables on the demographic composition of HSMAs (e.g., age, sex) and distributions of characteristics of agencies (e.g., ownership, recentness of certification). We also addressed the likelihood that changes in agency closings are endogenous with utilization changes.
The major source of data used in this study was Medicare administrative records maintained by CMS. The data sets included 1996 and 1999 Medicare HHA claims, Medicare's enrollment files, and data from the OSCAR system. We also used information from the 2000 ARF. Medicare HHA claims data provided the number of home health users, while Medicare enrollment data provided denominator information for the construction of utilization rates. Data from the OSCAR provided information on characteristics of providers, including control of ownership (e.g., proprietary, non-profit) and date of participation in Medicare. The ARF files provided information on geographic characteristics of the HHAs, such as whether they were located in metropolitan areas, non-metropolitan urban areas, or rural areas.
We used 100% Medicare claims and enrollment data in 1996 and in 1999 to compare Medicare beneficiary use per thousand enrollees (Users/1000) in those two years. The rates were calculated at the HSMA level to assess geographic variations in beneficiary use. In both 1996 and 1999, users of the Medicare home health benefit resided in the same 803 HSMAs in the United States. We designated agencies active in a given year if they had Medicare claims for that year. We also examined HSMAs by age (65, 65-74, 75-84, 85+), gender (male, female), and race (White, non-White) compositions of their enrollees, and by population density (in terms of locations being primarily metropolitan or adjacent to metropolitan areas, non-adjacent to metropolitan areas, or in rural areas).
4.3. Empirical Results
We present our findings in three sections. We first examine statistics on changes in HSMA-level, utilization rates between 1996 and 1999. We then examine patterns of HHA of closures between 1996 and 1999. Whereas the first two sections present descriptive statistics on the outcome of interest (utilization changes) and the intervention of interest (agency closure), the third section presents estimates from our multivariate analysis of the extent to which agency closure affected utilization rate changes after implementation of the IPS.
A. Changes in Medicare HHA Utilization between 1996 and 1999
We first examined utilization rates and changes by sub-groups of Medicare beneficiaries of HSMAs to derive insight on whether particular sub-groups were disproportionately affected by the IPS. On average, HSMA-level Medicare home health use rates declined by 28% between 1996 and 1999. This change reflects a substantial drop in the use rate from 100 per 1000 enrollees in 1996 to 71 per 1000 enrollees in 1999 (Table 4.1).
While Medicare home health use rates increase with age of enrollees, changes in the use rates between 1996 and 1999 were about the same for each of the age groups. Similarly, females have higher use rates than males, but the average percent change was essentially the same for males and females. By race, Whites and non-Whites have approximately the same average number of users per HSMA in both years 1996, but declines in use rates between 1996 and 1999 were slightly lower for non-Whites (25%) than for Whites (28%). These findings suggest that, whereas the IPS had a large impact on use rates between 1996 and 1999, most demographic sub-groups of Medicare beneficiaries were not disproportionately affected by the trend. Non-Whites did have a smaller decline than Whites in use rates, but we were unable to explain, in this study, the causes behind this differential.
B. Agency Closure Patterns between 1996 and 1999
This section highlights changes between 1996 and 1999 in the supply of Medicare HHAs. In 1996, 9,797 HHAs submitted claims to the Medicare program while, in 1999, only 8,305 agencies were active Medicare providers, resulting in a 15% net decline in the number of participating HHAs (Table 4.2). Between 1996 and 1999, the actual closure rate among HHAs that provided Medicare services in 1996 was 26%. Thus, while one-quarter of active agencies in 1996 closed, entry of new agencies after 1996 led to a net change between 1996 and 1999 of only 15%.
Table 4.2 also presents the changes in supply by control of ownership. Proprietary HHAs had the greatest net decline (21%) between 1996 and 1999, while both non-profit and government agencies had much smaller declines of about 7% each. Closure rates among participating HHAs in 1996 were greatest for proprietary agencies (36%). Non-profits had a lower percentage of closings (15%) than proprietary ones, while government HHAs were most stable. Proprietary HHAs also had the highest ratio of new Medicare providers in 1999, but the new entrants were much smaller in number than those that closed.
Changes in the home health provider market also varied among urban and rural locations. The largest metropolitan areas had the highest proportion of HHA closures (30%) between 1996 and 1999. Although non-metropolitan urban areas had the next highest proportion of agency closures, changes in such areas were about the same as those of small urban or rural areas. Despite the higher number of new starts between 1996 and 1999 in the metropolitan areas, in contrast to the other geographic areas, the metro counties still experienced the largest net decline in HHAs between 1996 and 1999.
The higher percent of agency closings in the largest metropolitan areas, relative to less populated areas, suggests that such areas may have had an abundant supply of HHAs and that needs resulting from the closures of some agencies could be met by other HHAs. In contrast, where relatively few agencies were available, for example in rural areas, community needs could have made it more difficult for HHAs to close.
Finally, Table 4.2 shows variations across regions in HHA closures and net changes in the supply of agencies. (See Appendix 4.A for listing of states in each region.) Notably, HHA closures were particularly high in the West South Central (35%), Mountain (32%) and Pacific (36%) regions. Net changes in the supply of agencies were also higher in these same regions. These regions contain certain states that were identified to have notably high rates of HHA closings after the BBA (GAO 1998). Some of the states with the high percentage of HHA closings were also those with the most agencies before the BBA. Other states, however, also had relatively large numbers of HHAs in 1996, but had relatively high retention rates among their active agencies. These states included Illinois, Minnesota, and New York. These latter states tended to have lower than average utilization (user rates and number of visits per user) before the IPS, and might, therefore, have been better able to adjust to the per-beneficiary payment limits imposed by the IPS.
Market Share of Closed Agencies. An important perspective on the impact of agency closings is the market share of total utilization associated with those agencies. Table 4.3 presents the percent of HHAs that closed, by facility and geographic characteristics, and the percentage of total users in 1996 that they served. Overall, the 26% of agencies that closed between 1996 and 1999 served only 14% of the total users in 1996.
Percent of total users also varied by agency and geographic characteristics. For example, in the East North Central Region, the 21% of agencies that closed accounted for 11% of total users. In contrast, in the Mountain and Pacific regions the closed agencies represented over 30% of all agencies active in 1996, but accounted for only 12% of total users in 1996. These findings suggest that the impact on utilization of the closed agencies was likely to be smaller than the agency closure rates implied.
C. Impact of Agency Closures on Medicare Home Health Utilization
The preceding two sections presented descriptive statistics on changes in home health use and changes in number of HHAs between 1996 and 1999. Here, we present findings from our analysis to relate the two phenomena. We estimated multivariate regression models to better understand the relationship between agency closures and use of home health services. The dependent variable is the percentage change between 1996 and 1999 in the use of home health services per 1000 enrollees within an HSMA. Agency closings are measured as the percentage of agencies in an HSMA that served beneficiaries in the HSMA in 1996, but had no Medicare claims in 1999. Control variables include the age, gender, and race distributions of enrollees in the HSMA, urban/rural location, number of agencies in the HSMA in 1996, the profit status of those agencies, and the share that were certified between 1993 and 1996 (i.e., recently certified Medicare providers).
Findings from an ordinary least squares (OLS) regression model are presented in the first column of Table 4.4. We found that the percentage of closures has a negative effect on the use rate, with a 10% increase in the share of HHAs closed leading to a 2.9% drop in the use rate. The coefficient for agency closure is statistically significant, and it implies a relatively small effect. For example, in the extreme, if all agencies closed, we would predict only 29% drop in service use. One cause of the relatively small coefficient is that in many areas, new agencies opened and remaining agencies expanded to pick up much of the slack. We also know that the HHAs that closed served fewer beneficiaries relative to those that remained open, so even with no new agencies or expansion of existing ones, impact of the closings would have been relatively small.
To test out these possible explanations, we examined two other measures of HHA supply: (1) the percentage of users served in 1996 by closed facilities;11 and (2) the net change in the number of agencies between 1996 and 1999.12 The findings are presented in columns two and three of Table 4.4, and show that, controlling for the size (number of users) of the closed agencies and agencies that open, effects of closures on utilization rates are small. When controlling for size of agencies, we see that a 10% reduction in HHAs leads to only a 1.4% reduction in the utilization rate, about half the impact we found when did not control for number of patients served (Column 1). This finding is consistent with descriptive results that agencies that closed tended to serve fewer beneficiaries, on average, than did agencies that continued to participate in Medicare after the IPS. Because some new agencies initiated Medicare participation between 1996 and 1999, it is also not surprising that a smaller impact on utilization change was found when we examined the effects of net change in the number of agencies.
Two-Stage Least Squares. Next, we used two-stage least squares to control for the possibility that closings within a county are endogenous. That is, part of the relationship between the use rate and the closings rate is not causal, but due to common variables that affect both measures. For instance, factors that affect the closure rate (e.g., oversupply of services in the HSMA, payment rules) may affect both the use rate in the county and rate of closures. A simple regression of the two variables may overstate the causal relationship between the variables.
To estimate the two-stage model, we require at least one instrument--a variable that affects the rate of closures in the HSMA but has no direct effect on the use rate. Finding such a variable is difficult, because reductions in service (cutbacks) may be a step on the way to closure of a facility so that factors that affect one are likely to affect both. We assume that: (1) the share of recently certified (i.e., between 1993 and 1996) agencies in the HSMA; and (2) the number of agencies in the HSMA each affects the share of facilities that close, but that neither has an effect on the use rate conditional on the extent of closures.13 These would be valid if: (1) recently certified agencies operated at existing capacity until they decided to close; and (2) agencies in HSMAs with an oversupply of agencies were more likely to close, but no more likely to reduce their services. In each case, we believe that the effect through closures is the primary effect, but that there is a small indirect effect as well.14
The two-stage least squares models, which are presented in Table 4.5, indicate effects similar to those observed in the OLS models, although they are estimated much less precisely as reflected in the larger standard errors. The increased standard errors result from reduced independent variation in the predicted measure of closures as compared to the actual measure. For instance, the point estimate in column 1 implies that a 10% increase in the closure rate would lead to a drop in the use rate by 3.2%. Measurement of closures controlling for size of agencies led to similar findings, while findings on net change in agencies became insignificant.
Findings in this chapter are consistent with those from a prior one that focused on counties, rather than HSMAs, as the unit of observation (Liu, Wissoker, Porell & Overington 2003). In that study, we were able to control for other variables, such as geographic region, and had many more cases to analyze. We experimented with other models in that analysis, but also found similarly weak effects of closures on utilization rate changes between 1996 and 1999. We varied the instruments used and obtained qualitatively the same results. For example, when we used the number of agencies in 1996 and the number of agencies interacted with urban status as instruments, suggested by findings from the recent GAO (1999) report, we found a small and statistically insignificant positive impact. Other choices of instruments led to small negative findings.
4.4. Discussion
Major reductions in Medicare spending and high rates of HHA closings followed the implementation of the BBA mandated IPS. Beyond the specific payment provisions in the IPS that led to a general reduction in utilization rates, it seemed plausible that the large number of HHAs that discontinued participation in Medicare would exacerbate reductions in utilization. Our analysis extended prior research to estimate the impact of HHA closures and utilization changes after implementation of the IPS.
We explored a number of different models in the two-stage regression analyses and found varying effects. In virtually all cases, however, the size of the coefficient was small, indicating that, while HHA closings probably had an effect on utilization rate change, that effect was small. These findings are consistent with that of a simple comparison of counties with zero HHA closings and those with any number of HHA closings (Liu, Wissoker, Porell & Overington 2003). Counties with no HHA closings among their 1996 providers had a reduction in utilization rate of 27%, while HSMAs that lost at least one HHA provider had a reduction in utilization of 32%. Thus, our findings suggest that changes in utilization rates after the IPS was implemented were attributable primarily to the direct effects of payment policy incentives and only marginally through changes in the supply of HHAs.
Our findings are generally consistent with those of GAO in terms of the supply capacity of HHAs after the IPS. Although our analyses do not directly address changes in access to Medicare home health services, some findings are relevant to this question. Changes in use rates before and after the IPS were quite similar by demographic characteristics of Medicare enrollees and by urban/rural location, suggesting that, on average, particular sub-groups did not appear to have been disproportionately affected. In the separate analysis of counties, we identified areas where utilization rates declined by 59% or more (Liu, Wissoker, Porell & Overington 2003). It is reasonable to assume that beneficiaries living in these counties might have encountered reduced access to the Medicare home health benefit. It is notable that most of these locations were in Small Urban or Rural locations.
In conclusion, while the BBA mandated IPS had a remarkable impact on Medicare home health utilization, these outcomes were not significantly affected by the closing of participating HHAs. Thus, future policy considerations of the Medicare home health benefit might usefully focus more on ensuring access to sub-groups of beneficiaries, particularly those with conditions requiring higher than average number of visits and those residing in rural areas, than on addressing the capacity of the home health industry.
Appendix 4.A. States by Census Region
| Region | Abbreviation | States Included |
| New England | NE | Maine, New Hampshire, Vermont, Massachusetts, Connecticut, Rhode Island |
| Middle Atlantic | MA | New York, New Jersey, Pennsylvania |
| East North Central | ENC | Ohio, Michigan, Indiana, Illinois, Wisconsin |
| West North Central | WNC | Minnesota, Iowa, Missouri, Kansas, Nebraska, South Dakota, North Dakota |
| South Atlantic | SATL | Delaware, Maryland, District of Columbia, Virginia, West Virginia, North Carolina, South Carolina, Georgia, Florida |
| East South Central | ESC | Kentucky, Tennessee, Mississippi, Alabama |
| West South Central | WSC | Arkansas, Louisiana, Texas, Oklahoma |
| Mountain | Mountain | Montana, Wyoming, Colorado, New Mexico, Arizona, Utah, Idaho, Nevada |
| Pacific | Pacific | Washington, Oregon, California, Hawaii, Alaska |
| TABLE 4.1: Number of HHA Users per 1000 Enrollees in HSMAs, by Age and Gender, 1996-1999 | |||
| 1996 | 1999 | Percent Change* | |
| All HSMAs (n=803) | 100.1 | 70.8 | -28% |
| 65 | 48.2 | 34.4 | -26 |
| 65-74 | 63.8 | 44.7 | -29 |
| 75-84 | 147.2 | 102.1 | -29 |
| 85+ | 230.3 | 163.3 | -28 |
| Male | 79.6 | 56.8 | -27 |
| Female | 116.1 | 81.7 | -28 |
| White | 98.5 | 69.8 | -28 |
| Non-White | 99.1 | 70.1 | -25 |
| * Percent change is the mean of the county percent difference in use rates between 1996 and 1999. Non-White rates calculated for counties with non-zero non-White use. | |||
| TABLE 4.2: Patterns of Medicare HHA Supply, 1996-1999 | ||||||
| Active in 1996 | Active in 1999 | Between 1996-99 | ||||
| Closed | Open | Percent Closed | Net Change | |||
| U.S.* | 9797 | 8305 | 2571 | 1079 | 26.2% | -15.2% |
| Voluntary | 2977 | 2739 | 453 | 215 | 15.2 | -8.0 |
| Proprietary | 5467 | 4296 | 1984 | 813 | 36.3 | -21.4 |
| Government | 1353 | 1270 | 134 | 51 | 9.9 | -6.1 |
| Metropolitan | 6568 | 5425 | 1972 | 829 | 30.0 | -17.4 |
| Non-Metropolitan | 756 | 656 | 158 | 58 | 20.9 | -13.2 |
| Small Urban | 1956 | 1754 | 354 | 152 | 18.1 | -10.3 |
| Rural | 473 | 422 | 85 | 34 | 18.0 | -10.8 |
| NE | 450 | 382 | 108 | 40 | 24.0 | -15.1 |
| MATL | 629 | 580 | 98 | 49 | 15.6 | -7.8 |
| ENC | 1427 | 1278 | 306 | 157 | 21.4 | -10.4 |
| WNC | 1080 | 949 | 222 | 91 | 20.6 | -12.1 |
| SATL | 1102 | 1044 | 205 | 147 | 18.6 | -5.2 |
| ESC | 591 | 550 | 71 | 30 | 12.0 | -6.9 |
| WSE | 2768 | 2182 | 979 | 393 | 35.4 | -21.2 |
| Mountain | 726 | 567 | 231 | 72 | 31.8 | -21.9 |
| Pacific | 980 | 725 | 349 | 94 | 35.6 | -26.0 |
| * Excludes Alaska. | ||||||
| TABLE 4.3: Comparisons of Percent of HHAs that Closed in 1996-1999 and the Corresponding Percent of Total Users They Served in 1996 | ||
| Percent Agency Closing | Percent of Total Users | |
| All HHAs | 26.2% | 14.0% |
| Voluntary | 15.2 | 8.9 |
| Proprietary | 36.3 | 22.7 |
| Government | 9.9 | 5.8 |
| Metropolitan | 30.0 | 15.2 |
| Non-Metropolitan Urban | 20.9 | 9.6 |
| Small Urban | 18.1 | 10.0 |
| Rural | 18.0 | 9.0 |
| NE | 24.0 | 12.2 |
| MATL | 15.6 | 6.7 |
| ENC | 21.4 | 11.2 |
| WNC | 20.6 | 15.7 |
| SATL | 18.6 | 11.1 |
| ESC | 12.0 | 6.2 |
| WSE | 35.4 | 26.5 |
| Mountain | 31.8 | 12.4 |
| Pacific | 35.6 | 12.1 |
| TABLE 4.4: OLS Estimates of the Effect of Closures on Change in Use Rate Between 1996 and 1999(Test-statistics in parentheses) | |||
| Model by Definition of Closure | |||
| % Closures | Weighted % Closures | Net Change in Agencies | |
| % Agencies serving any enrollees that closed between 1996 and 1999 | -0.292*(-4.21) | ||
| % Agencies serving any enrollees that closed between 1996 and 1999, weighted by use | -0.140*(-4.66) | ||
| % Difference in number of agencies serving any enrollees between 1996 and 1999 | 0.182*(6.72) | ||
| County Characteristics | |||
| Age distribution of enrollees: | |||
| % 65-74 | 0.169(0.90) | 0.210(1.11) | 0.083(0.45) |
| % 75-84 | -0.200(-0.76) | -0.142(-0.54) | -0.250(-0.97) |
| % 85 plus | 0.480(1.20) | 0.384(0.96) | 0.552(1.40) |
| % Female enrollees | -0.152(-0.63) | -0.211(-0.88) | -0.067(-0.29) |
| % White enrollees | 0.025(0.62) | 0.031(0.77) | 0.027(0.70) |
| Metro and adjacent | 1.333(1.47) | 1.27(1.40) | 1.33(1.49) |
| Not adjacent to metro area | -0.277(-0.22) | -0.440(-0.35) | -0.010(-0.01) |
| Characteristics of Agencies Serving Any Enrollees | |||
| % For-profit | 0.171*(2.74) | 1.34*(2.20) | 0.130*(2.17) |
| % Non-profit | 0.311*(5.20) | 0.286*(4.78) | 0.273*(4.63) |
| % Certified since 1992 | -0.007(-0.15) | -0.068(-1.54) | -0.091*(-2.13) |
| # HHAs in 1996 | -0.001(-0.32) | -0.000(-0.09) | -0.000(-0.12) |
| Use rate in 1996 | -101.0*(-6.96) | -96.5*(-6.64) | -94.38(-6.58) |
| Constant | -32.6(-2.16) | -31.3(-2.08) | -29.2(-1.97) |
| Number of observations | 803 | 803 | 803 |
| R-squared | 0.22 | 0.22 | 0.25 |
| * p0.05. | |||
| TABLE 4.5: Two-Stage Least Squares Estimates of the Effect of Closures on Change in Use Rate Between 1996 and 1999(Test-statistics in parentheses) | |||
| Model by Definition of Closure | |||
| % Closures | Weighted % Closures | Net Change in Agencies | |
| % Agencies serving any enrollees that closed between 1996 and 1999 | -0.320*(-2.57) | ||
| % Agencies serving any enrollees that closed between 1996 and 1999, weighted by use | -0.340*(-2.47) | ||
| % Difference in number of agencies serving any enrollees between 1996 and 1999 | 0.697(1.85) | ||
| County Characteristics | |||
| Age distribution of enrollees: | |||
| % 65-74 | 0.171(0.86) | 0.381(1.50) | 0.041(0.19) |
| % 75-84 | -0.207(0.79) | -0.057(-0.20) | -0.394(-1.23) |
| % 85 plus | 0.514(1.19) | 0.434(1.02) | 1.040(1.39) |
| % Female enrollees | -0.168(-0.68) | -0.349(-1.18) | 0.110(0.42) |
| % White enrollees | 0.022(0.56) | 0.023(0.57) | 0.002(0.05) |
| Metro and adjacent | 1.28(1.44) | 1.33(1.46) | 1.63(1.50) |
| Not adjacent to metro area | -0.271(-0.22) | -1.00(-0.75) | 0.085(0.06) |
| Characteristics of Agencies Serving Any Enrollees | |||
| % For-profit | 0.174*(2.40) | 0.160*(2.24) | 0.160(1.83) |
| % Non-profit | 0.309*(5.28) | 0.269*(4.23) | 0.209(2.25) |
| % Certified since 1992 | a | a | a |
| # HHAs in 1996 | a | a | a |
| Use rate in 1996 | -100.6*(-6.98) | -87.6*(-5.70) | 69.6*(-3.02) |
| Constant | -31.7(-2.17) | -34.8(-2.31) | -30.7(-1.77) |
| Number of observations | 803 | 803 | 803 |
| R-squared | 0.22 | 0.18 | b |
| * p0.05. a.Instrument assumed to predict closures, but not change in use rate. b.R-squared estimated to be negative. | |||
5. GEOGRAPHIC PATTERNS OF MEDICARE HHA SUPPLY CHANGES: 1996-1999
5.1. Introduction
In the two years that followed implementation of the IPS for Medicare HHC mandated by the BBA of 1997, a substantial number of Medicare HHAs closed (GAO 1999; OIG 2000). While these agency closures occurred throughout most of the country, they were heavily concentrated in the southwestern states of Arkansas, Louisiana, Oklahoma, and Texas (GAO 1999). In addition to 2,143 agency closures, analyses reported in Chapter 3 show that Medicare HHA supply was further reduced as a consequence of 1,027 agencies substantially reducing the spatial extent of their geographic service areas between 1996 and 1999. Whereas closed agencies had served about 558,000 Medicare beneficiaries in 1996, HHAs that contracted their service areas served about 127,000 beneficiaries in 1996 in places they no longer served in 1996.
All empirical research to date, including our results reported in Chapter 4, suggest that these large HHA supply reductions had only modest adverse impacts upon access to care, as reflected by greater reductions in Medicare HHC utilization rates in affected areas (McCall, Petersons, Moore & Korb 2003). Even analyses that were focused on Medicare HHC utilization changes among high cost Medicare HHC users, who were more likely to have been affected because of per beneficiary limits imposed by the IPS on agency payments, have suggested that IPS impacts were modest (McCall, Korb, Petersons & Moore 2003).
Given the magnitude and geographic concentration of agency closures and service area reductions that followed implementation of the IPS, what factors might explain their apparently modest impacts on Medicare HHC utilization rates in affected areas? One plausible explanation may be that in places with a higher incidence of closures and service area contractions, there was greater Medicare HHA supply expansion that may have partially offset these substantial supply reductions. If this was so, HHA supply expansion may have blunted expected adverse impacts of the vast HHA supply reductions upon beneficiary access to Medicare HHC services in affected areas.
To better understand the market supply behavior of Medicare HHAs following implementation of the IPS, this study examines geographic patterns of Medicare HHA supply contractions and expansions that occurred after implementation of the IPS. Its purpose is to investigate the degree to which greater Medicare HHA supply expansion between 1996 and 1999 occurred in the same geographic market areas where there were substantial reductions in Medicare HHC supply. This study entails two related analyses. First, there is a descriptive analysis comparing geographic patterns of Medicare HHA supply contraction and expansion among market areas between 1996 and 1999. Second, we draw upon classical location theory to develop and estimate a multivariate model where geographic HHA supply expansion is specified an endogenous economic response to HHA supply contraction and other market demand and supply factors. These empirical analyses provide some new insights about the important role that local market area HHA supply adjustments played in maintaining beneficiary access to Medicare HHC services after implementation of the IPS.
5.2. Data and Methodology
A. Data Sources
Multiple data sources were employed in the study. Medicare HHC claims data for the calendar years 1996 and 1999 were used to determine the activity status of HHAs and to delineate their geographic service areas. The year 1996 is the latest full calendar year preceding implementation of the IPS on October 1, 1997. The year 1999 was the most recent full calendar year of claims data available at the start of the study. It precedes the implementation of the Medicare HHC PPS that occurred in October 2000. The Medicare POS files for 1996 and 1999, derived from the OSCAR system, contained information on Medicare certification status and several organizational attributes of agencies. Medicare beneficiary population data for geographic market areas were obtained from MDF for 1996 and 1999. Finally, the 2000 ARF was used to specify market area supply variables for alternative sources of LTC and PAC, such as nursing home beds.
B. Conceptual Framework
Time and monetary travel costs in the delivery of HHC services are an important component in the production costs of these services. These travel costs will naturally limit the geographic extent of HHA service areas. Since HHC services are also unlikely to be seen as a highly differentiated product in the eyes of consumers, the location patterns and geographic service areas of HHAs are likely to be similar to those of market-oriented economic activities selling undifferentiated goods to a geographically-dispersed consumer population.
Market-oriented economic activities, such as retail establishments, tend to exhibit dispersed location patterns because individual stores are essentially selling the same items and consumers tend to patronize the nearer stores over farther ones (Beckmann 1968; Hoover 1975). Irregularities in the spatial distribution of consumer demand, organizational factors, agglomeration economies, among other factors, add complexity to the actual location patterns and geographic service areas of such market-oriented economic activities. Nevertheless a simplified geographic market area model based on the classical models of Losch (1944) and Christaller (1933) provides a useful conceptual framework for examining geographic changes in Medicare HHA supply.
Under the simplest market area model, all potential HHC consumers are assumed to reside in locations that are uniformly distributed over a featureless plain. Agencies are assumed to: (1) produce an undifferentiated service with production costs per visit that are constant, exclusive of delivery costs; (2) face an exogenous market reimbursement rate per visit that must cover both production and delivery costs; and (3) have delivery costs that are a simple linear function of distance from the agencys base site. Under these assumptions, Figure 5.1 shows the geographic service area of an isolated hypothetical Agency A to be a circle centered at the base site location with a radius determined by the reimbursement rate P0 and delivery costs per unit of distance. In the absence of competitor HHAs in its vicinity, the range of the agencys geographic service area will extend from the agencys base site up to a point where the sum of production and delivery costs for a visit exceeds the reimbursement rate for a visit.
This simple service area model is expanded in Figure 5.2 by adding a second Agency B in the vicinity of Agency A. Agency B is assumed to incur similar delivery costs, but it is less efficient, and has higher production costs per visit relative to Agency A. As a consequence of its higher production costs, Agency Bs geographic service area is smaller than Agency As given the reimbursement rate P0. The geographic service areas of the two agencies partially overlap each other. Since visits are assumed to be undifferentiated in the eyes of patients, the two agencies will both serve patients in the portions of their service area that overlap.
Figure 5.3 illustrates some market dynamics, as Agencies A and B both contract their geographic service areas when the reimbursement rate P0 is lowered to P1, leaving some beneficiaries at risk of being left unserved. Note that if the reimbursement rate is lowered enough, an agency will eventually be unable to supply a minimum threshold level of visits needed to sustain economic feasibility and the agency will be at high risk of complete market exit via closure.
Two potential forms of supply expansion as a form of market response by agencies are illustrated in Figure 5.4 and Figure 5.5. Assuming that the demand from the unserved population shown earlier in Figure 5.3 is large enough to support a new market entrant, Figure 5.4 shows how new market entry by a third Agency C may fill the gap in demand in places no longer served by some agencies because of service area contractions and/or market exit. Finally, in Figure 5.5 we relax the assumption of constant production costs to permit economies of scale in production costs associated with higher volumes of visits. Even with the lower reimbursement rate of P1, Agency A could find it attractive to expand its geographic service area to encompass places no longer served by Agency B if there are economies of scale in the production of visits. Previous research has produced mixed findings regarding economies of scale in HHC provision. Whereas Nyman and Dowd (1991) found modest diseconomies of scale, Schmitz (1989) found significant scale economies at low volumes of visits. Bishop and Kenny (1995) only found modest economies of scale for rural HHAs. No economies or diseconomies of scale were found for HHAs serving urban areas.
Prior to the IPS, HHAs had relatively little pressure on them to be concerned with operational and/or financial efficiency. Introduction of the IPS made Medicare HHC reimbursements more stringent for many HHAs, imposing greater fiscal pressure on agencies in varying degrees (Bishop, Kerwin & Wallack 1999; Medicare Payment Advisory Commission 1999; GAO 1999). Greater fiscal pressure associated with the IPS should have increased the likelihood of both geographic service area contraction and market exit for many agencies, particularly the less efficient ones. The thinning out of competitor HHAs that occurred after IPS implementation also likely created some incentives for service area expansion and/or market entry by other agencies in the same market area. This conceptual reasoning, based upon the classical market area models of Christaller and Losch, leads us to posit that geographic Medicare HHA supply expansion between 1996 and 1999, as reflected by the new market entry of HHAs and/or geographic service area expansion by existing HHAs, will be greater in health service market areas that experienced greater reductions in Medicare HHA supply due to agency closures and service area contraction.
C. Geographic Supply Expansion and Contraction Measures
In accord with the classical market area model outlined above, Medicare HHA supply expansion and contraction was measured via changes in the geographic service areas of HHAs between 1996 and 1999. Geographic expansion in Medicare HHA supply can occur through market entry and geographic service area expansion by existing agencies. Similarly, Medicare HHA supply reduction will result from market exits and geographic service area contraction by existing agencies.
Measures of geographic HHA supply expansion and contraction were computed for 802 HSMAs defined by Makuc, et al. (1991) for the continental United States. Being comprised of one or more counties, HSMAs are much too large to be useful in delineating the geographic service areas of individual agencies. Consequently, supply changes were first measured for five-digit zip code areas comprising the geographic service areas of all Medicare HHAs in 1996 and/or 1999. These zip code-level measures were subsequently aggregated to HSMA-level measures, since economic market criteria were explicitly used in their empirical construction (Makuc et al., 1991).
Supply expansion for a zip code area between 1996 and1999 was measured in terms of the volume of Medicare beneficiaries that were served in 1999 by either agencies that added service to that zip code in 1999 as part of a significant expansion of their overall geographic service area between 1996 and 1999, or new Medicare market entrant HHAs. Similarly, supply contraction in a zip code area between 1996 and1999 was measured in terms of the volume of resident Medicare beneficiaries that were served in 1996 by agencies that no longer served any beneficiaries of that zip code in 1999 because of market exit or significant geographic service area contraction.
Since the total volume of Medicare HHC users varies substantially among HSMAs, and the national volume of Medicare HHC users decreased substantially between 1996 and 1999, beneficiary HHC user counts reflecting expansion and contraction were both divided by a common baseline measure of total Medicare HHC users in the HSMA in 1996. By using the Medicare HHC users in 1996 to standardize both measures of geographic supply change, their relative magnitudes are not affected by differences in rates of decline in Medicare HHC utilization among HSMAs. Further details concerning the steps used to construct the geographic measures of HHA supply expansion and contraction are included in Appendix 5.A at the end of the chapter.
D. Model Specification
We do not consider it to be very plausible that new market entry and geographic service area expansion were significant factors leading to the surge of agency closures that followed implementation of the Medicare IPS in 1997. Rather, it is far more reasonable that supply expansion occurred as HHAs responded to the service demand of beneficiaries living in places no longer served by some agencies due to closure or service area contraction. However, even if Medicare HHA geographic supply expansion and supply contraction between 1996 and 1999 are highly correlated among market areas, its causal basis cannot be easily established empirically. Estimation of a model where geographic HHA supply expansion is explicitly specified to be a function of HHA supply contraction requires specification of one or more instruments for the endogenous HHA supply contraction variable. This task is particularly difficult because supply expansion and contraction represent alternative agency supply responses to common changing market factors. For example, an exogenous increase in demand for Medicare HHC resulting from population growth should not only make expansion by an agency more likely, but it should also make contraction less likely. It is extremely difficult to find a potential instrumental variable that effects HHA supply contraction but not supply expansion.
As a consequence of these modeling problems, our multivariate empirical analysis is focused on supply and demand factors associated with the covariation between HHA geographic supply expansion and contraction among market areas. More specifically, we investigate factors distinguishing market areas where both significant geographic HHA supply expansion and contraction occurred from market areas where either significant HHA supply contraction or supply expansion occurred, and from market areas where neither supply expansion nor contraction occurred.
E. Variable Specification
Table 5.1 contains a summary of definitions for the dependent variable and all independent variables.
Dependent Variable. Employing the market-level HHA geographic supply contraction and expansion measures described earlier, covariation in rates of geographic HHA supply expansion and contraction was specified via a four-category nominal classification variable defined by the cross-classification of each HSMA on two variables: (1) a binary variable distinguishing HSMAs with HHA supply expansion rates above or below the median rate of 2.5% among all market areas; and (2) a binary variable distinguishing HSMAs with HHA supply contraction above and below the median rate of 6.3% among all market areas. This cross-classification yielded four sub-groups of HSMAs:
- 284 HSMAs with high rates of both HHA supply expansion and contraction;
- 284 HSMAs with low rates of both HHA supply contraction and expansion;
- 117 HSMAs with high rates of HHA supply contraction and low rates of expansion;
- 117 HSMAs with high levels of HHA supply expansion and low rates of supply contraction.
HSMAs with the highest rates of HHA supply change are not discriminated in this classification. Use of more stringent criteria, such as the upper quartile of the HSMA distribution, would be more effective in discriminating HSMAs with the highest expansion and contraction rates. However, greater discrimination at the top portions of these distributions is obtained at the cost of much less discrimination among HSMAs in the remainder of each distribution.15 Since there were only modest differences in empirical results when quartiles rather than medians were used to classify HSMAs, we opted for the classification based on medians since an above/below the median categorization of high versus low is easier to understand, which facilitates interpretation of the empirical results.
Medicare HHA Supply. Local HHA supply in an HSMA was measured in terms of aggregate full-time equivalent (FTE) employment of RNs and CNAs among agencies based in an HSMA per 1,000 resident Medicare beneficiaries in 1996. Since RNs and CNAs generally comprise the two largest sub-groups of HHA staff, RN and CNA FTE employment totals should reflect effects of differences in agency size that are not accounted for in a simple count of agencies based in HSMAs. To the extent that higher aggregate HHA staffing per resident beneficiary prior to IPS implementation in 1996 reflects excess Medicare HHA supply, a higher rate of geographic HHA supply contraction between 1996 and 1999 is expected in such market areas. However, the expected effect of greater baseline HHA supply on positive covariation between HHA supply expansion and contraction is uncertain. On one hand, if potential service gaps to beneficiaries are more likely to be met by HHAs concurrently serving beneficiaries in those places no longer served by exiting agencies in HSMAs with greater baseline HHA supply, a lower rate of HHA geographic supply expansion and negative covariation is expected. On the other hand, if a greater baseline HHA supply in an HSMA indicates a greater capacity for other HHAs to expand their geographic service areas to fill potential gaps in service demand arising from agency closures, a positive covariation between rates of HHA supply contraction and expansion is expected.
Agency Market Composition. Agencies with higher per-beneficiary costs that obtained Medicare certification dates after the start of the 1994 fiscal year were particularly vulnerable to closure because their per-beneficiary limits imposed by the IPS were not based on historical program experience. However, this greater vulnerability could have spurred some of these recent market entrant HHAs to expand their market presence as a means of reducing their risk of closure. Our empirical findings reported earlier in Chapter 3 indicated that recent market entrant HHAs were not only at greater risk to exit the market, but they were also much more likely to expand their geographic service area relative to older agencies. However, once new entry effects are controlled, a longer tenure of Medicare certification was found to be associated with greater market stability as reflected by lower risks of market exit, service area contraction, and service area expansion. Accordingly, we expect that both geographic HHA supply expansion and contraction rates should be greater in HSMAs with greater percentages of beneficiaries served by recent market entrant HHAs in 1996, and both should be lower in HSMAs where a greater percentage of beneficiaries were served by HHAs with ten or more years of Medicare program certification.
Two variables were specified to measure the composition of for-profit and government-owned HHAs serving Medicare HHC users in market areas. HSMAs with a greater percentage of Medicare HHC users served by for-profit HHAs are expected to demonstrate higher rates of geographic HHA supply contraction. GAO (1999) found that for-profit HHAs were disproportionately over-represented among market exits relative to other agencies. Empirical results reported earlier in Chapter 3 also indicated that for-profit agencies were more likely to exit or contract their geographic service areas than other agencies. Expectations about rates of HHA supply expansion with respect to the market composition of for-profit agencies are uncertain, however. We reported earlier in Chapter 3 that for-profit HHAs were no different from non-profit agencies with respect to service area expansion. However, the higher prevalence of for-profit agencies among recent market entrant HHAs in 1996 suggests that for-profit agencies may also face smaller entry barriers than other ownership types. Since government-owned HHAs should be less dependent on Medicare revenue than not-for-profit and for-profit agencies, the supply response of government HHAs is expected to be less sensitive to market changes associated with changes in Medicare payments. Accordingly, both less geographic supply expansion and contraction are expected in HSMAs where a greater percentage of resident beneficiaries were served by government-owned HHAs in 1996.
HHAs based in a hospital or nursing facility should also be less dependent on Medicare HHC revenues than freestanding agencies since they also receive patient revenue for institutional care. Consequently, the market supply behavior of freestanding HHAs should be more sensitive to changing market conditions than institutional-based agencies. Geographic supply expansion and contraction are both expected to be greater in HSMAs where a greater percentage of beneficiaries were served by freestanding agencies in 1996.
Population Demand. Geographic HHA supply expansion is generally expected to occur as a response to exogenous increases in population demand for Medicare HHC services, such as population growth. The percentage change in Medicare beneficiaries aged 75 years and older between 1996 and 1999 was specified as an indicator of the growth rate in demand for Medicare HHC services in an HSMA. Greater HHA supply expansion is expected in HSMAs that experienced greater growth in older Medicare beneficiaries between 1996 and 1999. Although a decline in the population of older Medicare beneficiaries should increase the likelihood of HHA supply contraction, nearly 90% of HSMAs experienced growth in older beneficiary population between 1996 and 1999, and only modest population declines were observed in the remaining HSMAs.
Supply of Substitute Care for Medicare HHC. Medicare-certified nursing home beds per resident beneficiary 75 years and older in 1996 was specified as an indicator of a potential supply of substitute care for Medicare HHC visits in an HSMA. Most beneficiaries may prefer aging in place with HHC services over institutional nursing home care, provided there are enough HHAs in their community. The substitutability of nursing home care for Medicare HHC may be greater in places with relative few HHAs and a comparatively ample supply of nursing homes. To the extent that nursing home care is substitutable for Medicare HHC, greater supply contraction and lesser supply expansion by Medicare HHAs is expected in HSMAs with greater nursing home bed supply.
5.3. Empirical Results
A. Descriptive Statistics
In addition to their definitions, Table 5.1 contains summary descriptive statistics for all specified variables. Since the population-based variables specified in the models should be less vulnerable to sampling variation among HSMAs with larger Medicare beneficiary populations, standardized case-weights, proportional to the square root of total Medicare population in 1996, were employed in these descriptive statistics and subsequent multivariate analyses.
The sample means for agency composition variables suggest that in 1996, substantial percentages of Medicare HHC users were served by for-profit agencies (33.3%), freestanding agencies (57.5%), and agencies with Medicare certification for more than ten years (69.6%). Relatively small percentages of 1996 Medicare HHC users were served by recent market entrants (9.7%) and government-owned agencies (14.6%). On average, beneficiary HHC users in 1996 were served by agencies providing a relatively high volume of visits per beneficiary served (62 visits/beneficiary served).
There was modest growth in Medicare HHC demand, as reflected by a 6% increase of in the number of Medicare beneficiaries aged 75 years or more, on average, among HSMAs. Finally, the large standard deviation relative to the mean HHA RN and CNA staff per beneficiary suggests a skewed distribution of Medicare HHA supply levels among HSMAs in 1996.
The sample means for the two variables used to construct our categorical dependent variable are also reported in Table 5.1. The sample mean for the variable indicating the level of Medicare HHA geographic supply contraction between 1996 and 1999 was about 14%. This can be broadly interpreted as meaning that about 14% of Medicare beneficiaries with two or more Medicare HHC visits in 1996 were served by agencies that no longer served their residence zip code area in 1999. Since the same denominator, (i.e., beneficiaries with two or more HHC visits in 1996) is employed in our measure of geographic HHA supply expansion, its sample mean of nearly 8% suggests that considerable geographic supply expansion also occurred over the same time period.
B. Geographic Patterns of HHA Supply Contraction and Expansion
The geographic distribution of HSMAs where there was substantial Medicare HHA geographic supply contraction was fairly concentrated. Figure 5.6 contains a map showing the HSMAs with the greatest and least Medicare HHA supply contraction between 1996 and 1999. More specifically, it distinguishes HSMAs falling in the highest quartile of the distribution of the geographic HHA supply contraction measure, and HSMAs where no geographic supply contraction occurred, from all other HSMAs. Similar to our findings reported in Chapter 3 and those reported by GAO (1999) for agency closures, when both agency closures and shrinking geographic service areas are considered, HSMAs with the greatest Medicare HHA supply contraction between 1996 and 1999 are still largely found in the Southwestern United States.
The geographic distribution of HSMAs where substantial Medicare HHA geographic supply expansion occurred was also fairly concentrated. Figure 5.7 displays HSMAs where the greatest and least Medicare HHA supply expansion occurred between 1996 and 1999. Similar to Figure 5.6, it distinguishes HSMAs in the highest quartile of the distribution of the geographic HHA supply expansion measure, and those HSMAs where no geographic supply expansion occurred, from all other HSMAs. Figure 5.7 shows that HSMAs with the greatest Medicare HHA supply expansion between 1996 and 1999 are also generally located in the Southwestern United States.
A visual comparison of the geographic patterns in Figure 5.6 and Figure 5.7 suggests a moderately strong tendency for greater Medicare HHA geographic supply expansion in HSMAs where there was greater geographic supply contraction. This is supported by the cross-classification of the mapped categorical data reported in Table 5.2. The null hypothesis of independence between HHA supply contraction and expansion was strongly rejected (p0.001). Classifications of HHA geographic supply contraction and expansion agreed for about 59% of the HSMAs, and the level of association between the two ordinal classification variables, as reflected by a gamma statistic of 0.66, suggest a moderately strong positive association between levels of Medicare HHA geographic supply expansion and contraction among HSMAs.
C. Multivariate Analysis Results
Multivariate analyses were performed to identify agency and market population demand factors associated with the covariation between Medicare HHA supply contraction and expansion among HSMAs. Because there is no natural ordering between two categories of the dependent variable described earlier (i.e., the two categories where there is no concordance between levels of HHA supply expansion and contraction), a multinomial logistic regression analysis was employed for parameter estimation. Observations were weighted with normalized case-weights proportional to the square root of the 1996 Medicare beneficiary population of an HSMA.
Table 5.3 contains the empirical results from a multinomial logit model that was fitted with observations on 802 HSMAs. Odds ratio transformations of the estimated parameters are reported to facilitate interpretation of the results. Since four categorical outcomes were specified, there are three independent sets of estimated coefficients for each independent variable that are interpreted with respect to an omitted reference category. The first three major columns of Table 5.3 contain odds ratio estimates that are interpreted with respect to a common reference category low HHA supply expansion and low HHA supply contraction rates. In the last column we report additional odds ratio estimates using a different reference category, namely, high supply expansion and high HHA supply contraction rates. These latter odds ratio estimates do not contain any new statistical information since they can be derived from the same logistic model coefficients that produced the odds ratios in the first three columns. They are reported to facilitate our interpretation of some results.
High Versus Low HHA Supply Expansion with Low HHA Supply Contraction. Relative to the reference category of little or no Medicare HHA supply contraction or expansion, the odds ratios in the first column of Table 5.3 suggest that HSMAs were more likely to exhibit only high geographic HHA supply expansion when there was a greater market presence of for-profit (OR=1.017, p =0.008), freestanding (OR=1.008, p=0.087) and very recent market entrant HHAs (OR=1.035, p=0.075). For example, relative to little or no supply expansion or contraction, the odds of significant geographic HHA supply expansion without supply contraction are expected to increase by about 1.7% for each additional percentage point increase in the percentage of Medicare HHC users in an HSMA served by a for-profit agency.
Medicare HHA supply expansion also appears to be associated with increasing demand for Medicare HHC services. Relative to the same reference category of HSMAs without any significant geographic HHA supply changes, HSMAs were more likely to exhibit high HHA supply expansion and little or no supply contraction when there was greater growth in demand for Medicare HHC services, as reflected by a higher rate of growth in beneficiaries aged 75 years or more (OR=1.069, p=0.056). Relative to little or no supply expansion or contraction, the expected odds of high geographic HHA supply expansion with little supply contraction in an HSMA are increased by about 6.9% for each additional percentage point higher was its percentage growth rate of beneficiary residents age 75 years and older between 1996 and 1999. Finally, although the baseline level of per capita Medicare HHA staff in an HSMA was not significant, the marginally significant estimated odds ratio for nursing home bed supply (OR=0.941, p=0.097) suggests that high Medicare HHA geographic supply expansion without supply contraction was less likely to occur in HSMAs where there was a greater baseline supply of nursing home beds, which may serve as a potential substitute for Medicare HHC.
High Versus Low HHA Supply Contraction with Low HHA Supply Expansion. Relative to the reference category of little or no Medicare HHA supply contraction or expansion, HSMAs were more likely to exhibit only high geographic HHA supply contraction when there was a greater market presence of for-profit (OR=1.02, p=0.004), very recent market entrant (OR=1.055, p=0.003), and freestanding HHAs (OR=1.009, p=0.099), and a lesser market presence of agencies that were Medicare-certified for ten years or more (OR=0.984, p=0.026). For example, relative to little or no supply expansion or contraction, the expected odds of high geographic HHA supply contraction with little or no supply expansion in an HSMA are increased by about 5.5% for each additional percentage point increase in the baseline percentage of Medicare HHC users served by recent market entrant agencies in 1996.
High Versus Low on Both HHA Supply Contraction and Expansion. All but two of the odds ratio estimates distinguishing HSMAs that had high levels of both HHA supply contraction and expansion from those with little geographic HHA supply change of either form were highly significant. Similar to the two outcome categories already discussed, HSMAs were more likely to exhibit both high geographic HHA supply contraction and expansion over low levels on both geographic supply change measures when there was a greater market presence of for-profit (OR=1.037, p0.001), recent market entrant (OR=1.078, p0.001), and freestanding HHAs (OR=1.019, p0.001), and a lesser market presence of agencies with longer tenures of Medicare certification (OR= 0.976, p0.001) and government-owned agencies (OR=0.967, p0.001). A greater population growth rate of Medicare beneficiaries aged 75 years or older in an HSMA was also associated with increased odds of high HHA expansion and contraction over a low level on both supply change measures (OR=1.11, p=0.001).
In HSMAs with higher baseline aggregate level of RN and CNA agency staff per resident beneficiary there were decreased odds of both high geographic HHA supply contraction and expansion relative to little or no supply change on both measures. These results suggest that excess HHA supply, per se, was unlikely to be the driving factor behind the substantial Medicare HHA supply contraction that occurred in some market areas. However, this does not mean that greater baseline HHA supply did not contribute at all to the substantial supply changes that occurred after IPS implementation. The fourth column of Table 5.3 contains estimated odds ratios for the same outcome category as column two with the changed reference category of "low HHA supply expansion and high supply contraction." The estimated odds ratio for the baseline HHA supply variable indicates that relative to the reference category of only high Medicare HHA supply expansion, HSMAs with greater baseline HHA supply were less likely to exhibit both high geographic HHA supply expansion and contraction (OR=0.988, p=0.039). In other words, in those market areas where a high level of geographic HHA supply contraction occurred, HSMAs with greater baseline HHA supply were less likely to exhibit a high level of geographic HHA supply expansion. Presumably agencies that remained open in such HSMAs with high baseline HHA supply were more likely to fulfill the service demands of beneficiaries living in areas affected by agency closures without expanding their geographic service areas.
Lastly, the marginally significant and positive estimated odds ratio for nursing home bed supply (OR=1.05, p=0.099) suggests that a greater baseline supply of nursing home beds in an HSMA increased the odds of both geographic HHA supply expansion and contraction over little or no HHA supply change of either form. Stated differently, this result suggests that a stable Medicare HHA supply was less likely in HSMAs with greater baseline nursing home bed supply.
5.4. Discussion
This study sought an answer to what might explain the apparent modest impacts of that vast reduction in HHA supply had on Medicare HHC utilization rates in affected areas following implementation of the Medicare IPS. We sought to shed some empirical insight into the HHA supply behavior that followed implementation of the IPS by investigating the degree to which greater Medicare HHA supply expansion between 1996 and 1999 occurred in the same market areas where substantial reductions in Medicare HHC supply occurred. Given the importance of travel costs in the delivery of HHC services, we drew upon classical geographic retail location theory to distinguish geographic Medicare HHA supply expansion from other changes in Medicare HHC utilization rates over time. More specifically, Medicare HHA supply expansion was measured in terms of service initiated to beneficiaries in geographic areas between 1996 and 1999 by new market entrants and/or by Medicare-certified agencies that expanded their geographic service areas. Medicare HHA supply contraction was similarly measured in terms of discontinued service to beneficiaries in geographic areas by agencies that either closed, or contracted their geographic service areas between 1996 and 1999. By measuring Medicare HHA supply change in geographic terms we were able to assess the degree to which places with Medicare HHA geographic supply expansion coincided with those where geographic supply contraction occurred.
Our descriptive analyses of geographic patterns in rates of Medicare HHA supply contraction and expansion strongly suggests that geographic HHA supply expansion was generally much greater in the market areas where greater Medicare HHA supply contraction occurred between 1996 and 1999. Multivariate statistical analyses of the covariation between geographic Medicare HHA supply contraction and expansion rates imparted some insights about factors contributing to their concordance.
Our multivariate empirical findings suggest that geographic Medicare HHA supply was responsive to economic demand factors, such as a the growth rate in the population of older Medicare beneficiaries and baseline supply levels of HHA and nursing home beds. However, they also suggest that the composition of agencies serving a market area was a particularly important factor in determining how elastic Medicare HHA supply changes were after IPS implementation. Rates of Medicare HHA supply contraction and expansion both tended to be greater in market areas where there was a greater market presence of for-profit agencies, freestanding agencies, and very recent market entrants. Medicare HHA supply was less elastic with respect to rates of contraction and expansion in market areas with a greater market presence of government-owned agencies and agencies with a decade or more of Medicare certification experience.
There were "two-sided sword" effects associated with a greater market presence of for-profit, freestanding, and recent entrant HHAs in a market area. A greater market presence of such agencies contributed not only to the substantial reductions in HHA supply that followed Medicare IPS implementation, but also to the substantial HHA supply expansion that followed in many market areas as well. These HHA supply expansions most likely blunted some of the potential adverse impacts of the initial supply reductions induced by the Medicare IPS on Medicare HHC utilization rates in affected market areas. Overall our empirical findings suggest that implementation of the Medicare IPS spurred a rather complex set of dynamic supply responses by individual agencies that are not immediately evident in aggregated data.
Given the general concordant pattern found between geographic Medicare HHA supply contraction and expansion rates, it is natural to ask how much of the potential gap in service demand induced by HHA supply reductions was likely to have been filled by geographic expansion in Medicare HHA supply? It is hard to answer this question because of obvious difficulties in measuring a gap in service demand in places affected by HHA supply reductions when Medicare HHC utilization rates generally decreased across the board between 1996 and 1999. However, the relative magnitude of aggregate values of our Medicare HHA supply contraction and expansion measures for the nation as a whole may provide a hint of the answer. These data suggest that for every ten 1996 Medicare HHC users who were served by an agency that closed or contracted its service area to exclude their residence area, there were six 1999 Medicare HHC user residents served by a new market entrant or an agency expanding its geographic service area. Nationally, the rate of Medicare HHC users per 1,000 beneficiaries in 1996 was only about 70% of the higher corresponding national use rate in 1996. Taken together, these data suggest that geographic Medicare HHA supply expansion was probably large enough to directly offset a very sizable portion, but not the entire amount, of the decrease in Medicare HHA supply specifically associated with agency closures and HHA service area contractions between 1996 and 1999.
This analysis has some potential limitations. First, this analysis has been only focused on geographic supply expansion and contraction by HHAs. It does not take any account of other forms of supply response, such as an agency serving more or fewer beneficiaries within a portion of its geographic service area that was unchanged between 1996 and 1999. While this is a limitation, the geographic dimension of our supply change measures is important for making a theoretical distinction between a supply change and a simple change in the rate of Medicare HHC utilization. Although our measures of supply change are derived from changes in Medicare HHC utilization, the only utilization changes that are counted as supply changes are those associated with agencies discontinuing or introducing service to zip code areas.
Another limitation is that we were unable to estimate a causal multivariate model in which Medicare HHA supply contraction exerts a direct effect on HHA supply expansion. We have no evidence of a causal relationship between our two measures, nor any evidence that supply contraction preceded expansion. A strong interpretation of the study results requires the assumption that geographic supply expansion was affected by HHA supply reductions but not vice versa. While we believe this assumption to be reasonable given the rash of agency closures that followed implementation of the IPS, it is possible that some HHAs contracted their service area and others were driven to market exit by the geographic supply expansion of other HHAs.
In closing, this analysis has produced some empirical support for the premise that there was greater geographic supply expansion by Medicare HHAs between 1996 and 1999 in market areas affected by larger HHA supply decreases stemming from agency closures and geographic service area contractions. The study results suggest that this supply response may have been an important contributing factor to the relatively modest adverse impacts that large HHA supply reductions had upon access to Medicare HHC service, as reflected by greater reductions in Medicare HHC utilization rates, in affected areas.
Appendix 5.A. Supply Expansion and Contraction Measures
Measures of geographic HHA supply expansion and contraction were constructed through a series of steps described here. First, a patient origin matrix of counts of Medicare HHC users in each zip code area served by various HHAs in 1996 and 1999 was derived by aggregating individual Medicare HHC claims data in the respective years. Second, geographic service areas were delineated for each active HHA in 1996 and 1999 with these patient origin data using an iterative approach commonly employed for the delineation of hospital service areas (Garnick., Luft, Robinson & Tetreault 1987; Goody 1993; Slifkin, Ricketts & Howard 1996). Among all zip codes involving service to at least two beneficiaries by an HHA, those accounting for the most patients were sequentially added one at a time to the service area, each time adding fewer patients, until a 90% threshold percentage of patients served was reached. Third, once the zip codes comprising the geographic service areas of all HHAs were delineated in 1996 and 1999, a minimum 5% market share threshold was then used to distinguish the subset of agencies that were the most significant providers of Medicare HHC services to beneficiaries of each zip code area. That is, only agencies that accounted for at least 5% of total Medicare HHC users in a given year for a zip code area were counted as serving beneficiaries at all in a zip code.
Significant Medicare HHC providers for each zip code in 1999 were then classified into one of three categories: a new Medicare HHA market entrant, an HHA that expanded its geographic service area between 1996 and 1999, and a residual category of HHAs with either a changed or stable geographic service area based on classifications described earlier in Chapter 3 of this report.16
The number of resident Medicare HHC users of zip code area served by a significant HHA provider in 1999 that did not previously serve residents of that zip code in 1996, was used as an indicator of Medicare HHA supply expansion. All beneficiaries of a zip code who were served in 1999 by a new market entrant HHA were clearly counted as reflecting supply expansion. For beneficiaries served by any given HHA classified as expanding its service area between 1996 and 1999, the beneficiaries served in 1999 were only counted as service volume reflecting supply expansion if that particular zip code was not included in that HHAs geographic service area in 1996. Similarly, the number of resident Medicare HHC users of a zip code area served by a significant HHA provider in 1996 that no longer served residents of that zip code in 1999 was used as an indicator of Medicare HHA supply contraction. All beneficiaries of a zip code who were served in 1996 by an HHA classified as a market exit were again obviously counted as reflecting supply contraction. However, for beneficiaries served by any particular HHA classified as contracting its service area between 1996 and 1999, beneficiaries served in 1996 were only counted as service volume reflecting supply contraction if that particular zip code was dropped from that HHAs geographic service area in 1996.
A number of HHAs with stable or changed service areas between 1996 and 1999 also discontinued service to beneficiaries in some zip codes after 1996 and/or newly added service to beneficiaries of other zip codes in 1999. Furthermore, some HHAs with stable geographic service areas that served more beneficiaries of certain zip codes in 1999 than in 1996. These alternative forms of new or expanded service to a zip code were not classified as supply expansion because the overall market response of such HHAs did not indicate significant geographic service area expansion. To the extent that such HHA service changes are more likely to occur as a response to gaps in service to beneficiaries arising from agency closures or service area contractions than elsewhere, our measure of Medicare HHA supply expansion will understate actual HHA supply response to potential service gaps associated with such supply reductions.
The counts of beneficiary served used to measure supply expansion and contraction in each zip code area were then aggregated over all zip codes within each HSMA to produce a total count at the market area. These beneficiary counts cannot be directly employed as indicators of the magnitude of Medicare HHA supply expansion or contraction, however, because there are substantial differences in total beneficiaries served among various zip codes and HSMAs throughout the country. Accordingly, the aggregated counts of beneficiaries served used to indicate supply contraction and expansion were standardized by dividing them by total beneficiaries served in 1996 prior to implementation of the IPS. More specifically, the level of Medicare HHA supply reduction in an HSMA was measured as the aggregated count of beneficiaries served in 1996 by HHAs that subsequently closed or contracted their service area as a proportion of total beneficiaries served by all HHAs in 1996. Since the volume of beneficiaries served generally declined throughout the country between 1996 and 1999 after IPS implementation, the same baseline measure of total beneficiaries served in 1996 in the HSMA was used to standardize the aggregate measure of geographic supply expansion. By using total beneficiaries served in 1996 to standardize both of the measures of geographic supply changes among HSMAs, the relative magnitude of the two standardized measures is not altered by any differences in the overall rates of decline in Medicare HHC utilization rates among HSMAs.
| FIGURE 5.1: The Range of Agency As Geographic Service Area with Reimbursement Level P0 |
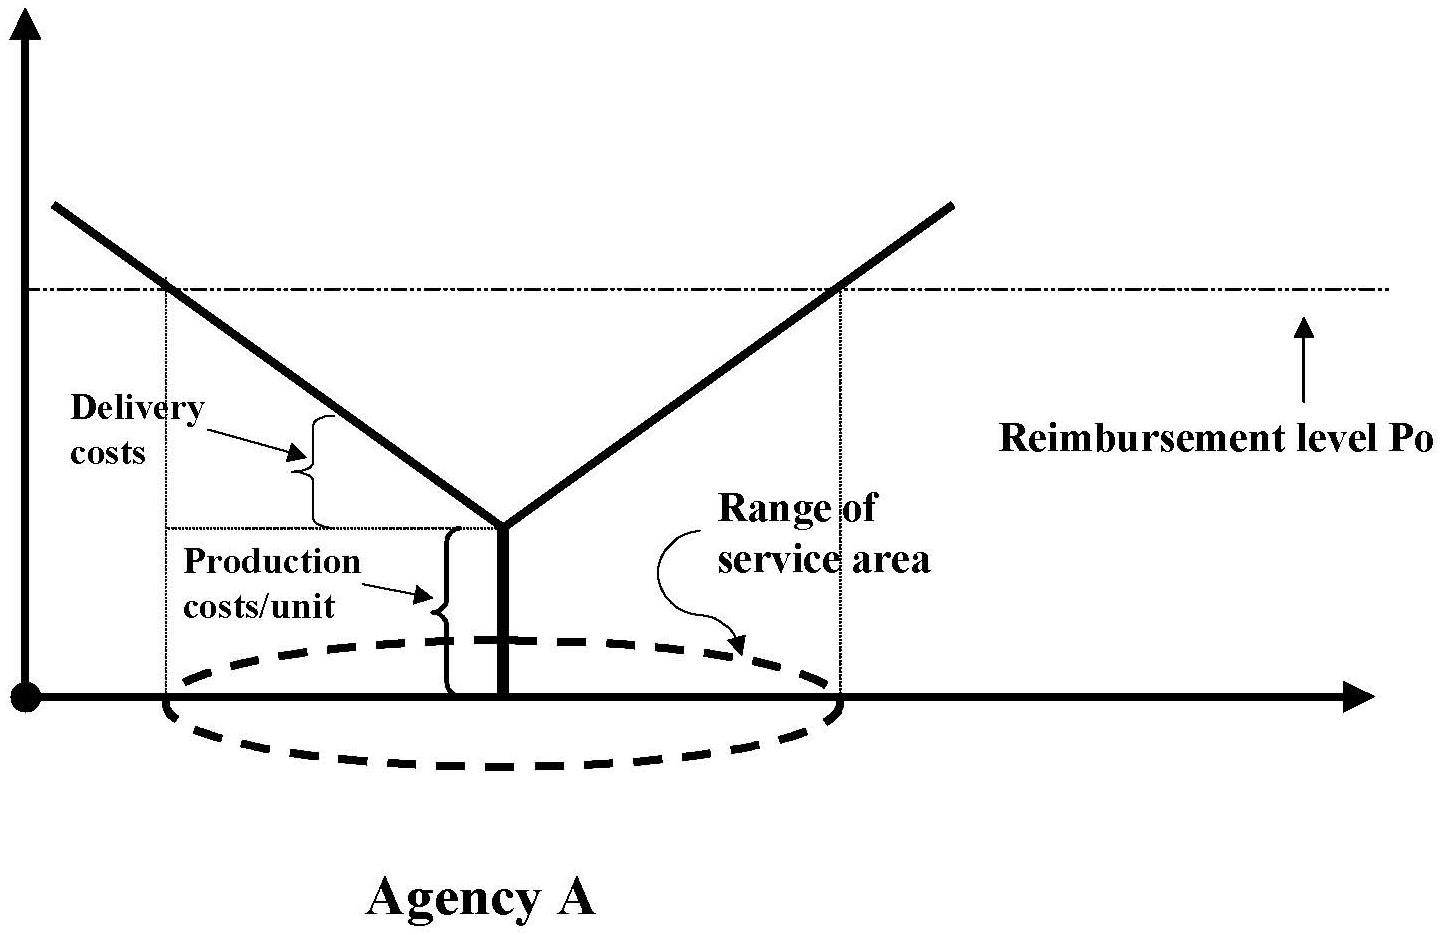 |
| FIGURE 5.2: Service Areas for Agencies A & B with Reimbursement Level P0 |
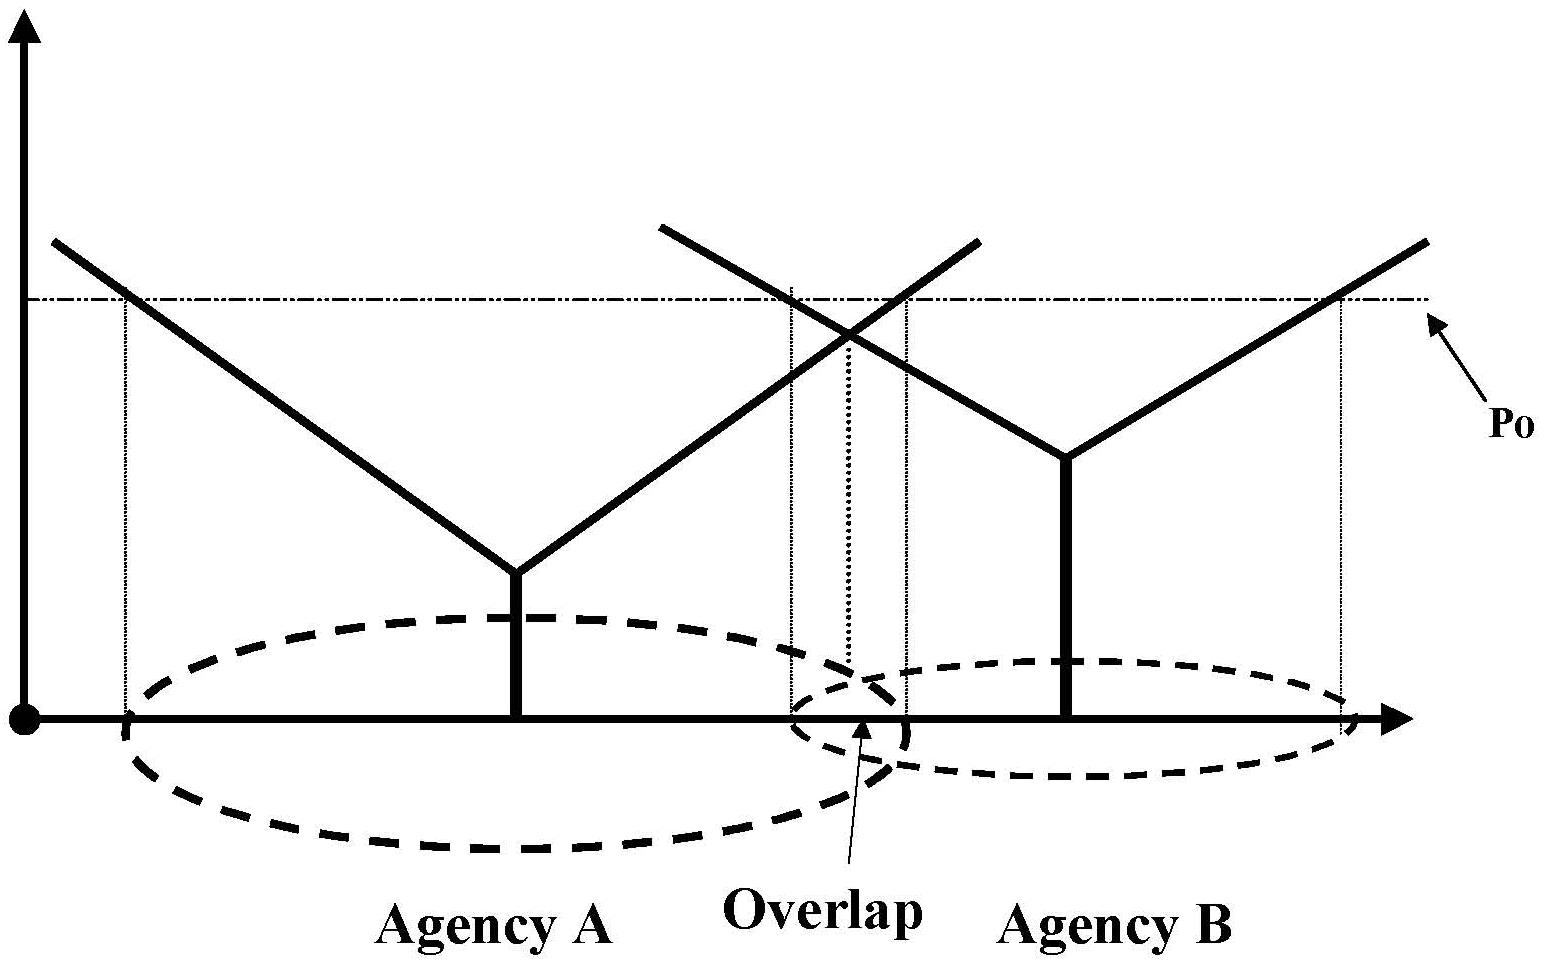 |
| FIGURE 5.3: Changed Service Areas for Agencies A & B After Lower Reimbursement Level P1 |
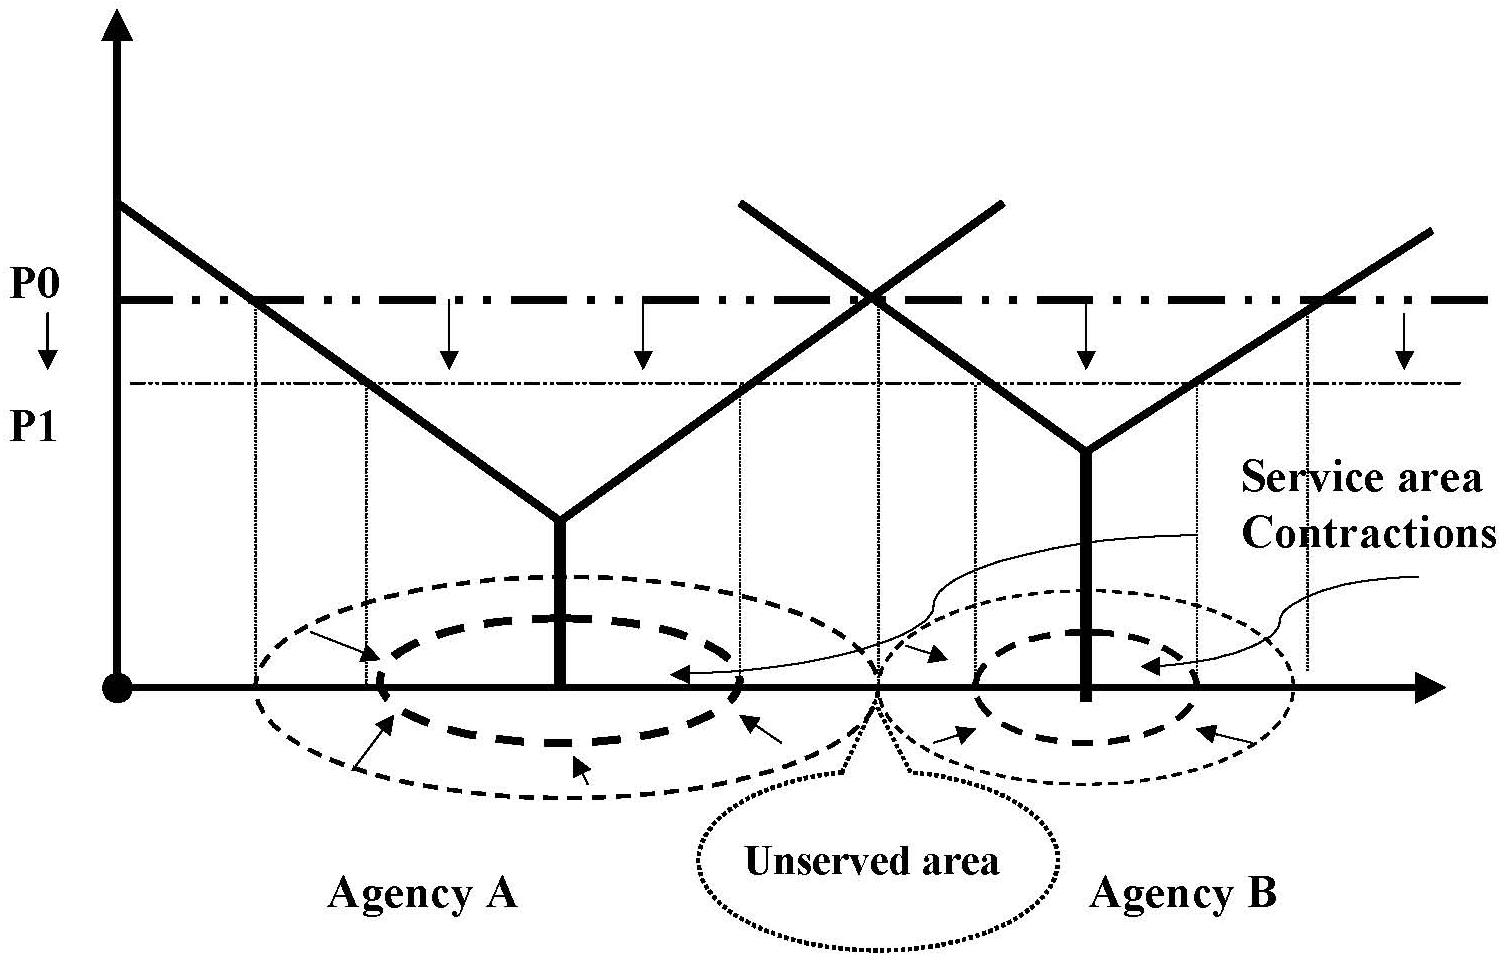 |
| FIGURE 5.4: New Market Entry by Agency C After Service Area Contractions by Agencies A & B |
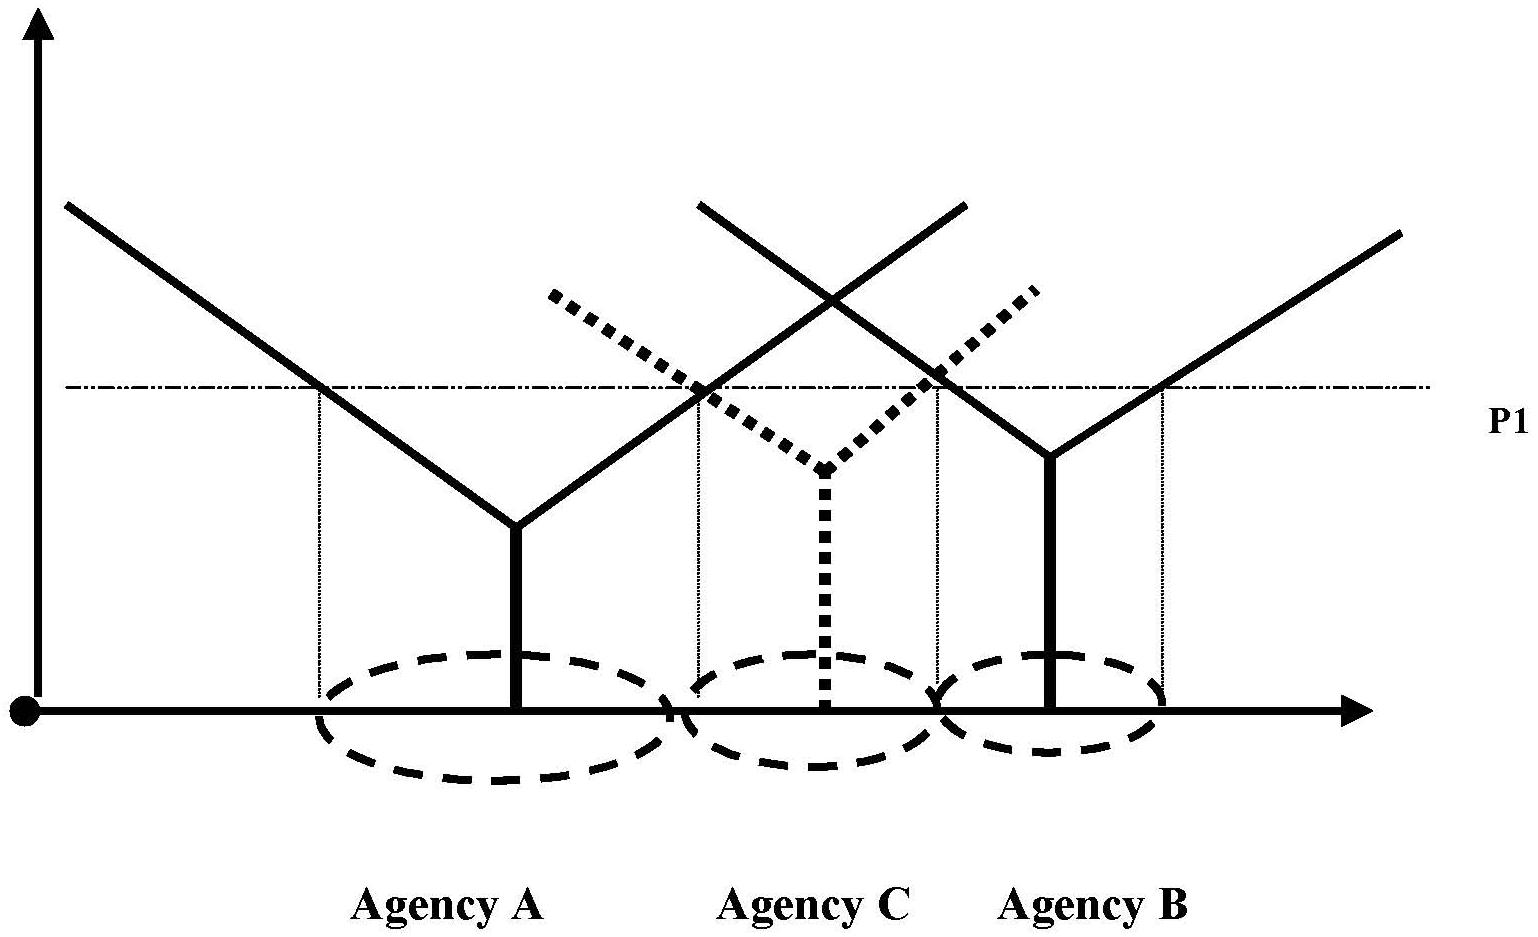 |
| FIGURE 5.5: Service Area Expansion by Agency A Following the Service Area Contraction by Agency B |
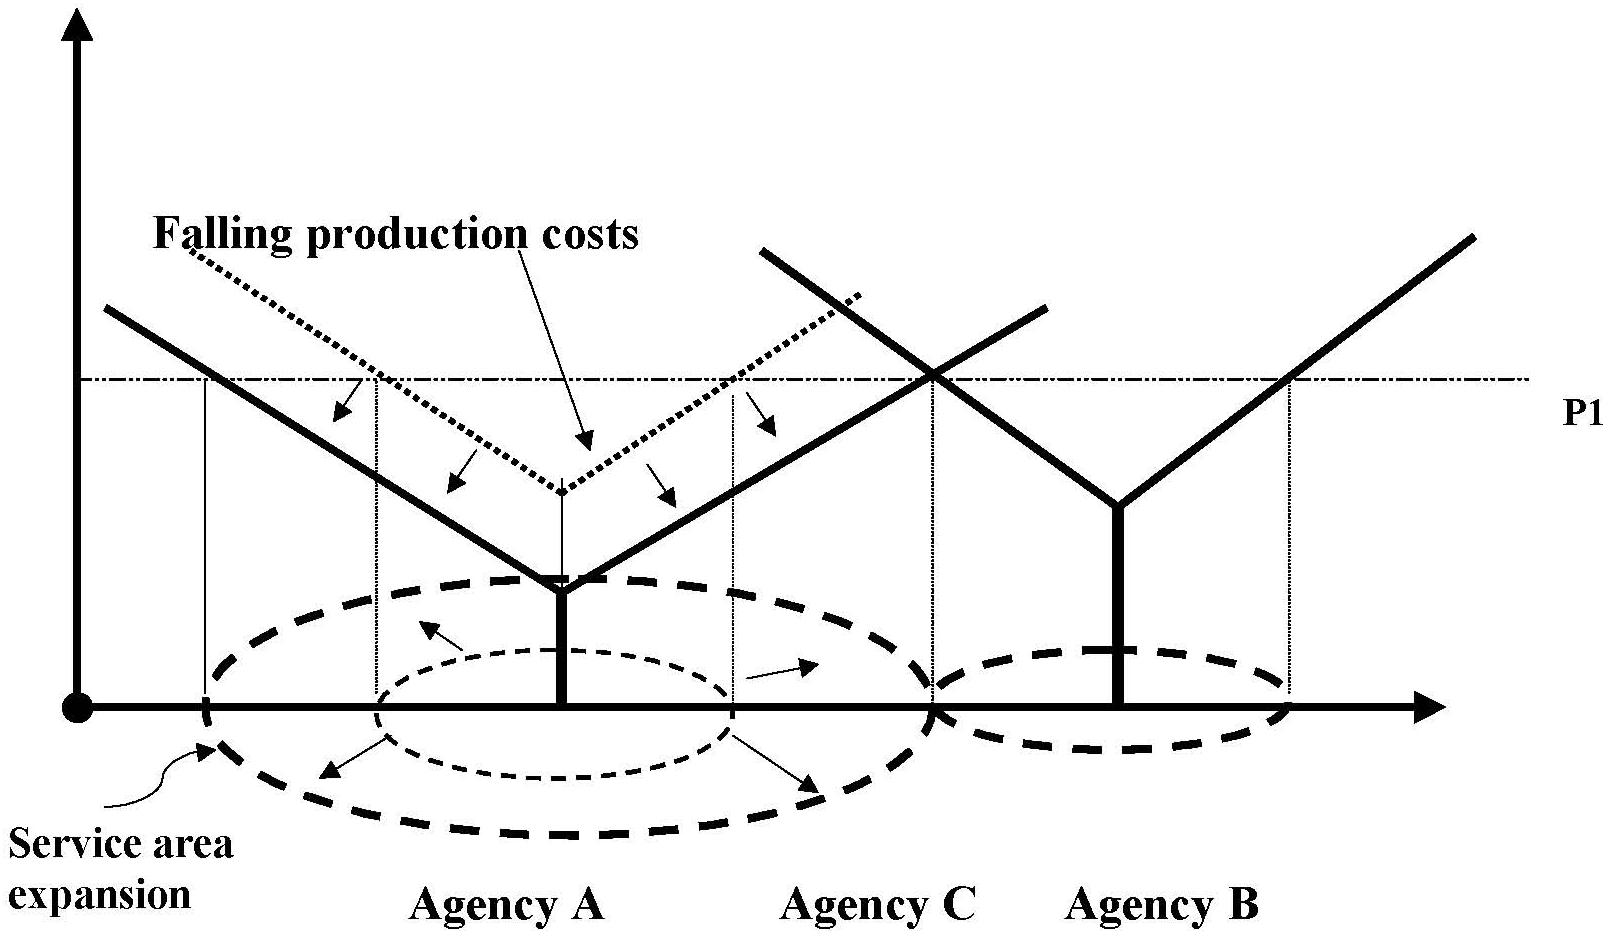 |
| FIGURE 5.6: Geographic Distribution of HSMAs by Level of Medicare HHA Supply Contraction |
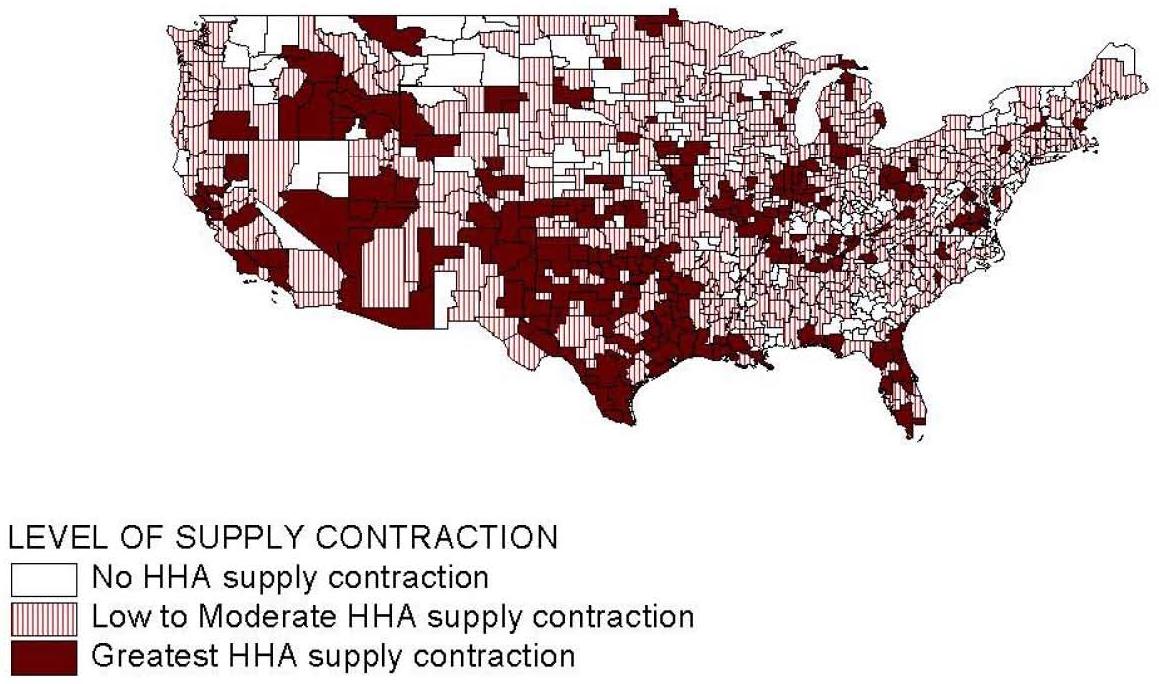 |
| FIGURE 5.7: Geographic Distribution of HSMAs by Level of Medicare HHA Supply Expansion |
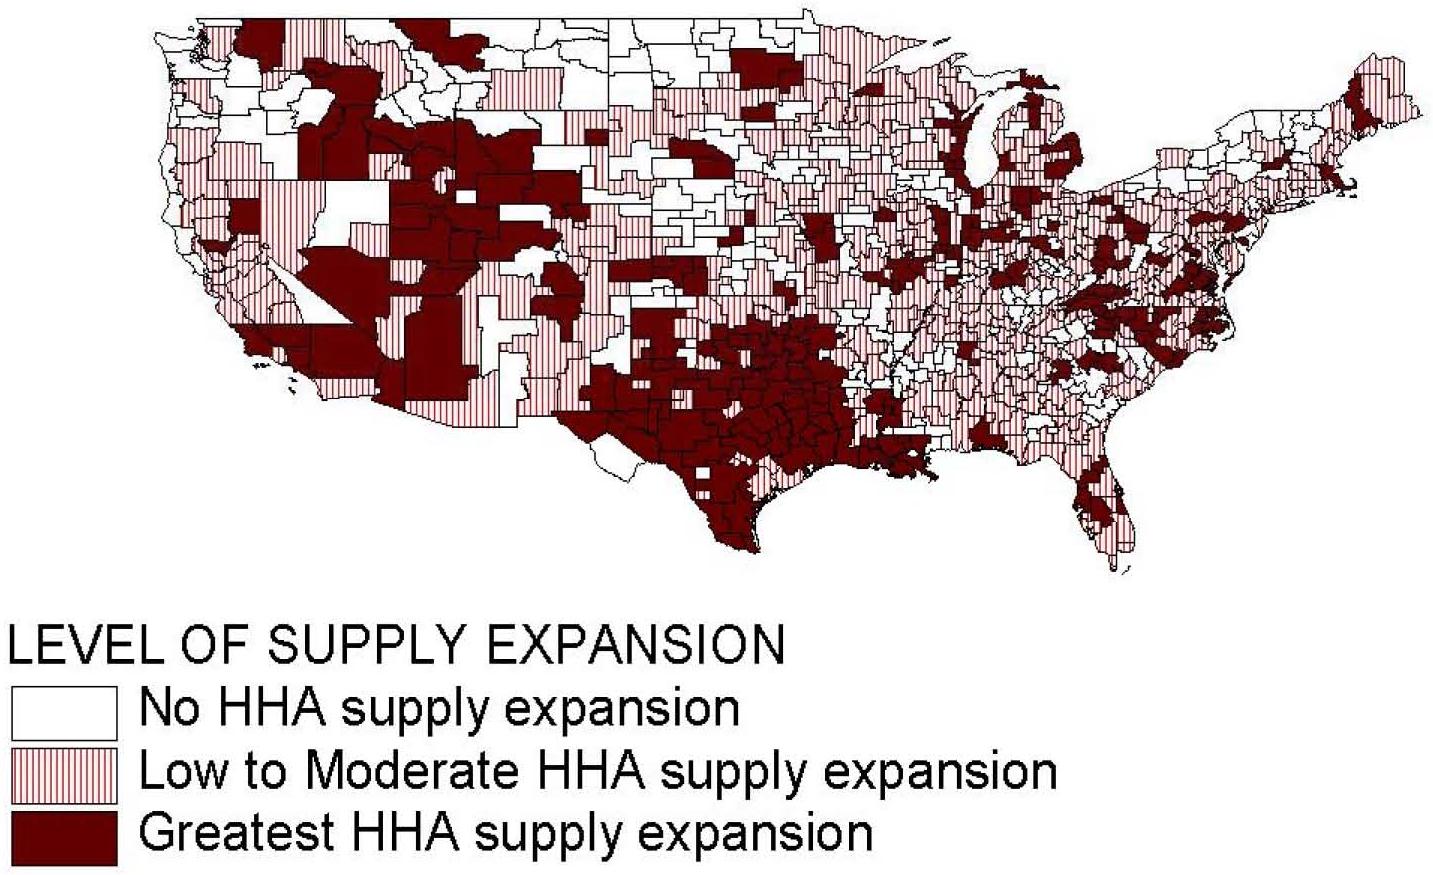 |
| TABLE 5.1: Variable Definitions and Descriptive Statistics (N=802) | ||||
| Variable | Definition | Source | Mean1 | SD |
| Dependent Variable | ||||
| HHA supply expansion-contraction category | A four-category nominal variable: HHA supply contraction and expansion rates are both below their respective medians (35.4%); HHA supply expansion rate is above the median and supply contraction rate is below the median (17.2%); HHA supply expansion rate is below the median and supply contraction rate is above the median (17.2%); HHA supply contraction and expansion rates are both above their respective medians (35.4%). | Claims | ||
| Independent Variables | ||||
| HHA Supply | ||||
| HHA RN and CNA FTE per beneficiary | FTE RN and CNA staff of HHAs based in HSMA in 1996 per 1,000 resident Medicare beneficiaries. | POSMDF | 20.59 | 38.29 |
| Agency Market Composition | ||||
| Recent market entrants | Percentage of Medicare HHC users in 1996 served by HHAs that obtained Medicare certification after 10-1-1993. | POSClaims | 9.67 | 11.40 |
| Longer-tenured agencies | Percentage of Medicare HHC users in 1996 served by HHAs with 10+ years of Medicare certification. | POSClaims | 69.62 | 22.79 |
| For-profit agencies | Percentage of Medicare HHC users in 1996 served by for-profit HHAs. | POSClaims | 33.30 | 24.46 |
| Government-owned agencies | Percentage of Medicare HHC users in 1996 served by government-owned HHAs. | POSClaims | 14.57 | 19.74 |
| Freestanding agencies | Percentage of Medicare HHC users in 1996 served by freestanding HHAs. | POSClaims | 57.54 | 24.13 |
| Population Demand | ||||
| Population growth | Percentage change in beneficiaries aged 75 years and older between 1996 and 1999. | MDFARF | 6.15 | 4.21 |
| Supply of Substitute Care for Medicare HHC | ||||
| Nursing home bed supply | Medicare-certified nursing home beds per 100 beneficiaries 75 years and older in the market area in 1996. | MDFARF | 3.39 | 4.49 |
NOTES: POS=Medicare Provider of Service file; ARF=Area Resource File; Claims=100% Medicare HHA claims data; MDF=Medicare Denominator File.
| ||||
| TABLE 5.2: HSMAs Cross-Classified by Levels of HHA Supply Contraction and Expansion | |||||
| Level of HHA Supply Contraction | Total | ||||
| None | Low to Moderate | Greatest | |||
| Level of HHASupply Expansion | None | 123(66.49%) | 106(25.42%) | 21(10.45%) | 250(31.13%) |
| Low to Moderate | 48(25.95%) | 238(57.07%) | 66(32.84%) | 352(43.84%) | |
| Greatest | 14(7.57%) | 73(17.51%) | 114(56.72%) | 201(25.03%) | |
| Total | 185(100.0%) | 417(100.0%) | 201(100.0%) | 803(100.0%) | |
| Chi square (4df) = 254.6 gamma = 0.6623) (asymptotic standard error = 0.035) | |||||
| TABLE 5.3: Multinomial Logit Model Empirical Results1 | ||||||||
| Variable | HE&LC/LE&LC2 | LE&HC/LE&LC | HE&HC/LE&LC | HE&HC/HE&LC | ||||
| OR3 | p-value | OR | p-value | OR | p-value | OR | p-value | |
| HHA Supply | ||||||||
| HHA RN and CNA FTE per beneficiary | 0.996 | 0.474 | 1.001 | 0.729 | 0.989 | 0.054 | 0.988 | 0.039 |
| Agency Market Composition | ||||||||
| Recent market entrants | 1.035 | 0.075 | 1.055 | 0.003 | 1.078 | 0.000 | 1.022 | 0.122 |
| Longer-tenured agencies | 1.006 | 0.414 | 0.984 | 0.026 | 0.976 | 0.000 | 0.992 | 0.237 |
| For-profit agencies | 1.017 | 0.008 | 1.020 | 0.004 | 1.037 | 0.000 | 1.017 | 0.006 |
| Government-owned agencies | 0.997 | 0.592 | 0.996 | 0.527 | 0.967 | 0.000 | 0.970 | 0.000 |
| Freestanding agencies | 1.008 | 0.087 | 1.009 | 0.099 | 1.019 | 0.000 | 1.010 | 0.085 |
| Population Demand | ||||||||
| Population growth | 1.069 | 0.056 | 1.044 | 0.249 | 1.110 | 0.001 | 1.063 | 0.077 |
| Supply of Substitute Care for Medicare HHC | ||||||||
| Nursing home bed supply | 0.941 | 0.097 | 1.016 | 0.618 | 1.050 | 0.099 | 1.033 | 0.308 |
Pseudo-Rsquare = 0.18 N = 802
| ||||||||
6. DISCUSSION
Reports of significant closures of HHAs following the BBA mandated IPS led to concerns by policy makers that access to the benefit by Medicare beneficiaries was compromised. Initial studies by GAO, and others, concluded that the closures of HHAs was primarily a response to an oversupply of agencies before the IPS, and that beneficiaries were not harmed. While documenting the decline in numbers of certified agencies, those studies did not investigate the complex behavior of the home health industry, including service area expansions and contractions of ongoing agencies and the entry of new agencies to meet the gaps left by exiting ones. Our aim, in this study, was to derive a more detailed accounting of changes in Medicare HHA supply after the IPS was implemented. We examined geographic area expansions and contractions as well as agency closures. We focused on the supply dynamics within HSMAs to capture what the net changes might have implied for access by individuals living in those areas.
Our market area analyses indicated that those geographic locations where agency closures were the greatest were the same ones where new agency entry or service area expansion of existing agencies was the greatest. Hence, while reports of significant agency closures portended serious HHA supply problems, potential gaps in service area coverage left by those exiting agencies were largely filled by others. Our findings that beneficiary utilization rate changes were only slightly affected by agency closures are consistent with the findings that supply of agencies was not depleted because of the closings. They are also consistent with GAOs conclusion that beneficiary access to Medicare home health services was not compromised by agency closures.
We found that certain groups of HHAs were more predisposed to exit or contract their services than others. Notably, higher rates of closure were associated with for-profit, freestanding, and recently certified agencies. In addition, rates of closure were considerably higher in certain regions of the country. Similar findings emerged in prior studies on the subject, but we also found that the agencies that were likely to enter market areas or expand service areas had about the same characteristics. Recently certified agencies, for example, were among the most dynamic providers. We infer from these results that such agencies were very flexible in their response to Medicare payment policies and market conditions. Because recently certified agencies tended to have higher than average costs per case before the IPS, they were more likely to exit the Medicare program or contract their service areas. We speculate that older agencies might have been more integrated in the community and would be more reluctant to exit the program totally. Despite having higher per patient costs before the IPS, it is possible that some recently certified agencies could also readily reduce services per patient or derive some new organizational identities that enabled them to function profitably under the IPS payment rules. For example, expanding services areas through creation of branch offices in lower paid areas, if their main offices were in higher paid areas, seems like a possible strategy for such agencies. Furthermore, among some of the more efficient smaller agencies that were recently certified, service area expansion may have been a strategic decision to enhance their prospects of meeting Medicare IPS per patient cost limits. Expanding the volume of Medicare beneficiaries served by an agency should reduce the potential influence of individual outlier patients on Medicare per patient costs.
Although Medicare home health use declined dramatically after the IPS, the major effect was the reduction of number of visits per user, rather than reductions in the number of users per Medicare enrollee. Hence, access to Medicare HHC did not seem to be a major problem. We also found that agency closures, per se, did not greatly increase the likelihood of not obtaining any Medicare home health services. It was beyond the scope of our study, as well as prior ones, to determine if the generalized reductions in utilization following IPS resulted in negative health outcomes for Medicare enrollees. We are pretty confident, however, that agency closures were not a big part of the issue. Overall utilization reductions appeared to be due primarily to changes in payment policies, per se, and not to the intermediate factor of agency closings. Other recent research also suggests that only individuals with high levels of dependency in activities of daily living were likely to be disproportionately affected by the IPS, and only in terms of number of visits received rather than the receipt of any HHC (Liu, Long & Dowling 2003).
Our study employed available administrative information from Medicare enrollment and claims files, as well as data on participating providers of care. We attempted to maximize the potential of such information, but we identified relevant issues for which the data were unable to address. One of these topics was the question of whether exiting agencies were, in fact, purchased by other home health entities. In this case, we would have observed an exit and a possible expansion of another agency, yet there might not have been an actual change in service provision capacity. Another issue was the closure of agency branches which we attempted to identify, but found difficult to delineate clearly because of unevenness in the reporting of such data. We identified contractions in service areas that spanned great distances, speculating that these had to reflect branch closings, but were unable to determine the cause with certainty. Despite our inability to identify specific individual agency market behaviors that contributed to changes in the geographic service area changes of many agencies after the IPS, the net effects of such agency market behaviors should be reflected in our geographic measures of supply change.
In general, the administrative information available from the OSCAR system was uneven because of lags in reporting. These problems stem from possible delays in agency surveys (the source of OSCAR data) and inconsistency in reporting of events such as branch closings. We were also concerned about the accuracy of OSCAR reporting on Medicare activity status of agencies, but were able to address this question by designating agencies as participating in Medicare in a given year if they filed Medicare claims for that year.
Since changes in Medicare HHA supply that occurred after IPS implementation was the main focus of this study, we gave careful consideration to the geographic dimension of HHC service delivery in measuring supply changes. First, geographic information on beneficiary residence zip codes from Medicare claims data (i.e., beneficiary residence zip code) was combined with OSCAR data on provider site location to delineate the geographic service or catchment areas of individual agencies before and after IPS implementation. Second, HSMAs, as delineated by Makuc et al. (1991), were employed as larger geographic market areas in which agencies compete among themselves at some level in serving Medicare beneficiaries. The economic definition of a distinct geographic market area is one where supply and demand forces outside the geographic area are small relative to those within (i.e., a geographic market should be relatively self-contained). Since HSMAs were created with the explicit purpose of approximating economic market areas for health services, they were used as geographic units for aggregating the various supply responses of individual HHAs for market area-level analysis of Medicare HHA supply changes. By first measuring the supply responses of individual agencies in terms of changes in their geographic service areas (including market entry and exits as extreme changes in service areas), and then aggregating these individual agency supply responses to the level of geographic economic market areas, we were able to uncover a complex set of market dynamics set into action after Medicare IPS implementation that would not otherwise be evident in aggregate Medicare HHC data.
In conclusion, given the dynamic behavior of the Medicare HHA industry, we think that future research would also benefit from examining the service area expansion and contraction, as well as actual closures and openings of HHAs. Measurement of these types of activities helps to provide, for example, a fuller explanation of supply-related effects on beneficiary utilization and access to services. A natural application of this framework may be an examination of the impact of changes after Medicare started paying for home health services under a PPS in 2000. More generally, market areas appear to be a natural observation unit for examining changes over time of one or multiple types of provider types.
REFERENCES
Beckmann, M. (1968). Location Theory (New York, NY: Random House).
Bishop, C.E., & Kenney, G. (1995). Home Health Costs in Urban and Rural Areas (Waltham, MA: Brandeis University Health Policy Research Consortium).
Bishop, C.E., Kerwin, J. & Wallack, S.S. (1999). The Medicare home health benefit: Implications of recent payment changes. Care Management Journals 1(3): 1-7.
Christaller, W. (1933). Die zentralin Orte in Suddeutschland (Jena: Gustav Fischer). C.W. Baskin (tr.). (1966). Central Places in Southern Germany (Englewood Cliffs, NJ: Prentice-Hall).
Dranove, D., White, W., & Wu, L. (1993). Segmentation in local hospital markets. Medical Care 31(1): 52-64.
Duggan vs. Bowen, U.S. District Court for the District of Columbia, Number 87-0383, August 1, 1988.
Elzinga, K., & Hogarty, T. (1973). The problem of geographic market delineation in anti-merger suits. Ant-Trust Bulletin 18: 45-81.
Garnick, D., Luft, H., Robinson, J. & Tetreault, J. (1987). Appropriate measures of hospital service areas. Health Services Research 22: 69-89.
Goody, B. (1993). Defining rural hospital markets. Health Services Research 28(2): 283-200.
Hoover, E. (1975). An Introduction to Regional Economics (New York, NY: Alfred A. Knopf).
Komisar, H.L. & Feder, J. (1998). The Balanced Budget Act of 1997: Effects on Medicares Home Health Benefit and Beneficiaries Who Need Long-Term Care. New York, NY: The Commonwealth Fund.
Liu, K., Long, S., & Dowling, K. (2003). Medicare interim payment systems impact on Medicare home health utilization. Health Care Financing Review 25(1): 81-97.
Liu, K., Wissoker, D., Porell, F., & Overington, B. (2003). Changes in the Use of Medicare Home Health Services: 1996-1999. Report to the Office of the Assistant Secretary for Planning and Evaluation, Department of Health and Human Services. September 2003.
Losch, A. (1944). Die raumliche Ordnung der Wirtschaft (Jena: Gustav Fischer). W.H. Woglom (tr.). (1954). The Economics of Location (New Haven, CT: Yale University Press).
Makuc, D., Haglund, B., Ingram, D., Kleinman, J., & Feldman, J. (1991). Vital and Health Statistics--Health Service Areas for the United States (Series 2: No.112). (PHS-92-1386).
McCall, N., Komisar, H., Petersons, A., & Moore, S. (2001). Medicare home health before and after the BBA. Health Affairs 20(3): 189-198.
McCall, N., Petersons, A., Moore, S. & Korb, J. (2003). Utilization of home health services before and after the Balanced Budget Act of 1997: What were the initial effects? Health Services Research 38(1) Part I: 85-106.
McCall, N., Korb, J., Petersons, A., & Moore, S. (2003). Reforming Medicare payment: Early effects of the 1997 Balanced Budget Act on postacute care. The Milbank Quarterly 81(2): 277-303.
Medicare Payment Advisory Commission. (1999). Report to the Congress: Selected Medicare Issues. Washington, DC.
Medicare Payment Advisory Commission. (2000). Report to the Congress: Medicare Payment Policy. Washington, DC.
National Health Policy Forum. (1999). Access to Home Health Services under Medicares Interim Payment System (Issue Brief no.744) (Washington, DC: The George Washington University).
Nyman, J., & Dowd, B. (1991). Cost function analysis of Medicare policy: Are reimbursement limits for rural home health agencies sufficient? Journal of Health Economics 10(3): 313-327.
Office of Inspector General. (1999). Medicare Beneficiary Access to Home Health Agencies (OEI-02-99-00530). U.S. Department of Health and Human Services, Online. Available: http://www.dhhs.gov/progorg/oei.
Office of Inspector General. (2000). Medicare Beneficiary Access to Home Health Agencies: 2000 (OEI-02-00-00320). U.S. Department of Health and Human Services, Online. Available: http://www.dhhs.gov/progorg/oei.
Porell, F., Tompkins, C., & Turner, W. (1990). Alternative geographic configurations for basing Medicare payments to HMOs. Health Care Financing Review 11(3) Spring 1990: 17-30.
Schmitz, R. (1989). The Cost of Home Health Visits, 1981-1986 (Cambridge, MA: Abt Associates, Inc.).
Slifkin, R., Ricketts, T., & Howard, H. (1996). Potential effects of managed competition in rural areas. Health Care Financing Review 17(4): 143-156.
Smith, B. & Rosenbaum, S. (1998). Medicare Home Health Services: An Analysis of the Implications of the Balanced Budget Act of 1997 for Access and Quality (Washington, DC: The George Washington University Center for Health Policy Research).
U.S. General Accounting Office (GAO). (1998). Medicare Home Health Benefit: Impact of Interim Payment System and Agency Closures on Access to Services (HEHS-98-238).
U.S. General Accounting Office (GAO). (1999). Medicare Home Health Agencies: Closures Continue, with Little Evidence Beneficiary Access is Impaired (HEHS-99-120).
U.S. Health Care Financing Administration. (1998). Health Care Financing Review (Statistical Supplement).
NOTES
-
For the purpose of this study, the term market area will be used to describe a geographic entity that will be used as the unit of analysis. A market area might be as small as a zip code or as large as a combination of two or more countries.
-
For example, there were 10,000 Medicare participating HHAs in 1997, as a result of a doubling of agencies between 1990 and 1997.
-
In later chapters a minimum threshold volume of annual beneficiaries is imposed as an additional requirement for classification as active service to Medicare beneficiaries. Since the threshold only affects the classification of several hundred HHAs nationally in either year, the results in this chapter are not sensitive to this added requirement.
-
Visit-weighted HHA closure rates were also computed for the purpose of sensitivity analysis. The visit-weighted closure rate identifies the number of HHA visits in 1996 provided by HHAs that closed between 1996 and 1999, as a percentage of total HHA visits in 1996 provided by active HHAs based in an HSMA. Descriptive analyses employing visit-weighted closure rates were very similar to those discussed here and are not reported.
-
Mean distance traveled to beneficiaries in their service areas for each year was computed as a beneficiary-weighted average of the straight-line distance between the centroids of the zip code of the HHA contained in Medicare POS file data and the centroids of zip codes contained in an HHAs service area.
-
Makuc et al. (1991) created HSMAs with Medicare hospital patient origin data by aggregating together one or more counties in such a way that the resultant geographic areas were relatively self-contained in the sense that relatively few local beneficiaries were hospitalized outside the HSMA and local hospitals served relative few beneficiaries who were not residents of the HSMA. Our computed 1996 HHA service area data suggest that HSMAs are relatively self-contained with respect to Medicare HHC as well. In 1996, more than 75% of HHAs had service areas where more than 90% of patients lived in the same HSMA as the agency site as reported in Medicare OSCAR data.
-
Although, on average more than 90% of the patients in an HHAs service area were residents of the same HSMA in which the agency was sited, these variables were constructed as weighted averages of HSMA data for HHAs that served beneficiaries from more than one HSMA.
-
There were much higher prevalence rates of: (1) HHA and beneficiary residence locations in different states; (2) a distance of 120 miles or more between HHA and beneficiary residence zip code locations; and (3) beneficiaries who were served by multiple HHAs during the year that were not located in the general vicinity of each other.
-
If it is assumed beneficiaries served in a zip code are events distributed under a Poisson distribution with an expected value equal to beneficiaries served by the HHA in either 1996 or 1999, one can compute the chances that the zip code will not be in the HHAs service area in the other year. The probabilities that zip codes involving service to only two and three beneficiaries in 1996 will not be contained in the HHAs service area in 1999 due to chance are about 0.41 and 0.20, respectively.
-
For example, there were 10,000 Medicare participating HHAs in 1997, as a result of a doubling of agencies between 1990 and 1997.
-
This was calculated as the percent of users in 1996 served by agencies that closed divided by the users in 1996 served by all agencies.
-
This was calculated by subtracting the number of HHAs in 1996 from the number of HHA in 1999, and then by dividing the difference by the number of HHAs in 1996.
-
GAO (1999) found that a large percent (64%) of agencies closing after the BBA were those whose tenure under Medicare was less than five years. It also concluded that a large number of HHAs that closed were located in geographic areas with a large supply of agencies in the first place.
-
GAO (1999) found that agencies that closed in 198 had an 8% decline in number of beneficiaries between 1996 and 1997; active agencies, by comparison, had only a 1.6% decline.
-
When the upper quartile is used to distinguish HSMAs with high rates of supply change, there are 113 and 515 HSMAs with high and low rates for both supply expansion and contraction, respectively. The two remaining sub-groups of HSMAs with divergent high/low rates of expansion and contraction each contain 87 HSMAs. HSMAs with no geographic supply contraction at all are grouped with HSMAs having supply contraction rates approaching 20% under this classification.
-
New market entrant HHAs included agencies that obtained Medicare certification between 1997 and 1999, and provided visits to more than 20 Medicare beneficiaries in 1999. HHAs with expanded service areas include: (1) HHAs with Medicare certification in both 1996 and 1999 that served more than 20 Medicare beneficiaries in 1999, but not in 1996; and (2) Medicare-certified HHAs serving more than 20 beneficiaries in both 1996 and 1999 that substantially expanded their geographic service area between 1996 and 1999. An HHA classified as expanding their geographic service area when: (1) service was continued in 1999 to all zip codes served in 1996, and beneficiaries of new served zip codes in 1999 amounted to at least 20% of total beneficiaries served in 1996 and 1999; or (2) when five times as many beneficiaries of zip codes added to its service area were served in 1999 than were served in 1996 in zip codes dropped from its service area, and beneficiaries of new served zip codes in 1999 amounted to at least 20% of total beneficiaries served in 1996 and 1999.