
U.S. Department of Health and Human Services
Pilot Long-Term Care Awareness Campaign: Phase I Final Report
MEDSTAT
February 24, 2006
This report was prepared under contract #HHS-100-03-0022 between the U.S. Department of Health and Human Services (HHS), Office of Disability, Aging and Long-Term Care Policy (DALTCP) and MEDSTAT. For additional information about this subject, you can visit the DALTCP home page at http://aspe.hhs.gov/_/office_specific/daltcp.cfm or contact the ASPE Project Officer, Hunter McKay, at HHS/ASPE/DALTCP, Room 424E, H.H. Humphrey Building, 200 Independence Avenue, S.W., Washington, D.C. 20201. His e-mail address is: Hunter.McKay@hhs.gov.
The opinions and views expressed in this report are those of the authors. They do not necessarily reflect the views of the Department of Health and Human Services, the Research Triangle Institute or any other funding organization.
TABLE OF CONTENTS
- I. INTRODUCTION
- Campaign Overview
- Campaign Sponsors and Participating States
- Campaign Materials
- Campaign Components
- State Activities
- Targeted Funding for State Health Insurance Assistance Program (SHIP)
- II. COMMUNICATIONS STRATEGY
- Overview
- Media Initiative
- Public Service Announcements (PSAs)
- Achieving Media Goals
- Public Relations and Publicity
- III. RESPONSE ANALYSIS
- Response Volume, Distribution and Response Rates
- Bulk Fulfillment Orders
- Website Visits
- Consumer Website
- Cost Per Response
- Evaluation
- State Health Insurance Assistance Programs (SHIPs) Encounters
- IV. IMPACTS, ANALYSIS AND CONCLUSION
- Industry Activities and Impacts
- Impact on Consumer Behavior
- State Activity Impact
- Conclusion
- APPENDIX A: RESPONSE ANALYSIS
- APPENDIX B: SHIP AGENCY ENCOUNTER FORM
EXECUTIVE SUMMARY
The Department of Health and Human Services (HHS) designed and implemented the Phase I Long-Term Care Pilot Awareness Campaign, called "Own Your Future," to promote increased awareness among recent retirees and near retirees about the importance of planning ahead for future long-term care needs. Specifically, in January 2005, the Office of the Assistant Secretary for Planning and Evaluation, the Administration on Aging and the Centers for Medicare and Medicaid Services, working closely with the National Governors Association and the National Conference of State Legislatures launched the "Own Your Future" Pilot Long-Term Care Awareness Campaign in five states: Arkansas, Idaho, Nevada, New Jersey and Virginia.
Many people today do not think about their future long-term care needs and therefore fail to plan appropriately. If individuals and families are more aware of their potential need for long-term care, they are more likely to take steps to prepare for the future. From a public policy perspective, increased planning for long-term care is likely to increase private financing, and may reduce the burden on public financing sources.
Campaign Materials and Activities
The Campaign used materials that were developed, tested and approved by the HHS as part of an earlier awareness effort. These materials included:
- Tri-fold brochure with tear-out business reply postcard offering the Long-Term Care Planning Kit.
- Television and Radio spot featuring a boomer-aged woman who is thinking about her father's long-term care needs when she realizes that she should begin to plan ahead for herself as well.
- Follow-up postcard reminding consumers to order the Long-Term Care Planning Kit.
- The Long-Term Care Planning Kit, which featured two elements:
- A 28-page brochure describing what is and what is not covered by public programs related to long-term care. The brochure also describes several ways to plan ahead, addressing legal issues, assessing services and private financing options for long-term care.
- An audio CD with interviews of persons engaged in different types of planning activities such as obtaining a reverse mortgage, making home modifications, or buying long-term care insurance.
The core components of the Campaign were a direct mail initiative and a media initiative. The direct mail component included a letter from the Governor of each state to every household with a member between the ages of 50 and 70. The letter included the tri-fold brochure described above as well as a toll-free number through which the Long-Term Care Planning Kit could be requested. Over 2.1 million letters were sent to households across the five pilot states. Follow-up postcards to remind those in the target group of the availability of the Planning Kit were also used.
The second component of the Campaign was a series of paid media spots to further publicize the toll-free number for ordering the Planning Kit. Paid media included television and radio spots selected to maximize exposure in the target audience of 50-70 year olds.
The core Campaign components outlined above were supported by a series of state-specific activities designed to take advantage of local resources and information dissemination opportunities. All these activities were directed at encouraging consumers to call or write to order the Long-Term Care Planning Kit.
The table below shows the mix of communications used in each of the Campaign states.
| State | Direct Mail Quantity | In-Home Date for Direct Mail | Governor's Press Event | Media | Follow-up Postcard |
| Arkansas | 298,367 | 1/28/05 | 1/28/05 | TV only | 3/7/05 |
| Idaho | 125,717 | 1/19/05 | 1/10/05 | Radio and TV | 3/7/05 |
| Nevada | 229,186 | 2/1/05 | 2/3/05 | TV only | 3/7/05 |
| New Jersey | 821,797 | 2/7/05 | Not applicable | Radio only | 3/21/05 |
| Virginia | 630,488 | 1/19/05 | 1/10/05 | TV only* | 3/7/05 |
| TOTAL | 2,105,555 | ||||
| * Used in selective media markets only | |||||
Campaign Results
Over all the Campaign states, the unduplicated response rate is 7.7%. While response rates were highest in Virginia (9.1%), in all states, the response rate meets or exceeds our baseline estimate of 5% which is considered an appropriate response rate for a social marketing campaign. These response rates are also significantly higher than comparable private sector direct mail campaigns (which might see responses of 0.5-2.0%). As mentioned earlier, New Jersey's response rate of 7.5% is especially impressive considering the fact that no paid television media was used there.
| Response Rates as of 7/26/05 | ||
| State | Total Orders | Individuals* |
| Arkansas | 7.4% | 5.2% |
| Idaho | 8.7% | 7.9% |
| Nevada | 9.3% | 8.0% |
| New Jersey | 7.9% | 7.5% |
| Virginia | 10.3% | 9.1% |
| TOTAL CAMPAIGN STATES | 8.8% | 7.7% |
| * Represents non-duplicated orders | ||
The Pilot Campaign had broad-based appeal. Interest in the Planning Kit was evident across all demographic groups. Specifically, there was little difference in the response rates across socio-demographic groups within or across the Campaign states. While interest in planning is evident across all the socio-demographic groups within the target population, the "typical" responder across all states is as follows:
- Age 58;
- Household income of $60,000-$75,000;
- A homeowner with a median home value of $130,000;
- Has some college education or more; and
- Over one-third of the responders are married.
In particular, the Campaign appears to have successfully reached the "Tweeners" -- those individuals of more moderate income and assets who have planning options but are potentially vulnerable to spend-down to Medicaid if they do not learn about and adopt such planning options. Differences in responder and non-responder profiles across states primarily reflect differences in the underlying target population in those states. No state-specific patterns were identified with respect to who responded and who did not respond to the Campaign messages.
Other key findings of the Campaign include the following:
- Public sector sponsorship of the Campaign is critical to achieving good response rates and ensuring consumer confidence in the objectivity of the information provided.
- Direct mail appears to be a more cost-effective communication vehicle than paid media. While it remains to be seen whether consumers exposed to the paid media are different in terms of their attitude or behavior change as a result of the Campaign, there was no significant difference in response rates between "media" and "non-media" states. Also, given the cost of paid media in most major media markets, direct mail is a more cost-effective and sustainable option, at least in terms of generating reasonable response rates.
- The Campaign helped raise awareness among state policymakers of the need for an integrated approach to fostering private responsibility for long-term care planning. Subsequent to the Campaign, two of the states have initiated activities to offer a long-term care insurance program for public employees and retirees.
- The Campaign has also renewed a collaboration between the public and private sectors with the unified objective of raising awareness and education on these critical issues.
Following the success of Phase I, HHS announced plans in July 2005 to initiate Phase II in order to enable additional states, selected through a competitive application process, to participate in the "Own Your Future" Campaign.
Additional information on the Campaign can be found at http://www.ltcaware.info.
Consumers can view or download the Long-Term Care Planning Kit at a newly created consumer information website found at http://www.aoa.gov/ownyourfuture/.
I. INTRODUCTION
Campaign Overview
The Long-Term Care Awareness Campaign is a five-state pilot project to increase consumer awareness about planning ahead for long-term care. Many people today do not think about their future long-term care needs and therefore fail to plan appropriately. Also, while a growing number of consumers today appreciate the value of planning ahead, research indicates that they need and want help understanding how to do so. If individuals and families are more aware of their potential need for long-term care, and have information about specific "how to plan" strategies, they are more likely to take steps to prepare for the future.
Currently, the Medicaid program serves as the largest payer for long-term care services. State governments are becoming increasingly aware that the likely demands on their long-term care systems will, in the not too distant future, exceed their ability to meet the demand through Medicaid and other public programs. States are well-positioned to offer counseling and assistance to persons participating in long-term care planning activities through their aging services networks, state health insurance assistance programs (SHIPs), state employee benefit programs and other state and local programs.
From a public policy perspective, increased planning for long-term care can increase private financing and help reduce the burden on already strapped public financing sources. Planning ahead for long-term care needs can also have a favorable impact on the quality of choices and financial protection available to individuals. Because it addresses housing, lifestyle, care needs and financial issues, the Long-Term Care Awareness Campaign has relevance to a broad spectrum of consumers.
Campaign Sponsors and Participating States
The Department of Health and Human Services (HHS) designed and implemented the Phase I Long-Term Care Pilot Awareness Campaign, called "Own Your Future," to promote increased awareness among recent retirees and near retirees about the importance of planning ahead for future long-term care needs. Specifically, in January 2005, the Office of the Assistant Secretary for Planning and Evaluation, the Administration on Aging and the Centers for Medicare and Medicaid Services (CMS), working closely with the National Governors Association (NGA) and the National Council of State Legislators launched the "Own Your Future" Pilot Long-Term Care Awareness Campaign in five states: Arkansas, Idaho, Nevada, New Jersey and Virginia. The states were selected in collaboration with the NGA.
The Campaign represents a unique partnership between the Federal Government and states to offer a consistent message about planning ahead for long-term care. Communications through the sponsorship of the Governor as a credible source of information was an important design element of the Campaign in order to address the "information clutter" directed at consumers; they are bombarded with information from the Internet, on television and in print ads about retirement planning and long-term care from private companies selling financial products. A central premise of the Campaign is that the information has more credibility both because it comes from a neutral and trusted source and because it is not attempting to endorse any specific action or product.
Campaign Materials
The Campaign materials, which were developed, tested and approved by the HHS as part of an earlier awareness effort, consisted of the following pieces:
- Tri-fold brochure with tear-out business reply postcard (BRC) offering the Long-Term Care Planning Kit.
- Television and Radio spot featuring a boomer aged woman who is thinking about her father's long-term care needs when she realizes that she should begin to plan ahead for herself as well.
- Follow-up postcard reminding consumers that the Long-Term Care Planning Kit is available.
- The Long-Term Care Planning Kit, which featured two elements:
- A 28-page brochure describing what is and what is not covered by public programs related to long-term care. The brochure also describes several ways to plan ahead, addressing legal issues, assessing services and private financing options for long-term care.
- An audio CD with interviews of persons engaged in several different types of planning activities such as obtaining a reverse mortgage, making home modifications, setting up a power of attorney, or buying long-term care insurance.
The Campaign materials can be viewed at http://www.ltcaware.info/answers.jsp.
Campaign Components
The core components of the Campaign were a direct mail initiative and a media initiative. The direct mail component included a letter from the Governor of each state to every household with a member between the ages of 50 and 70. The letter included the tri-fold brochure described above as well as a toll-free number through which the Long-Term Care Planning Kit could be requested. Over 2.1 million letters were sent to households across the five pilot states. Follow-up postcards to remind those in the target group of the availability of the Planning Kit were also used. The second component of the Campaign was a series of paid media spots to further publicize the toll-free number for ordering the Planning Kit. Paid media included television and radio spots selected to maximize exposure in the target audience of 50-70 year olds.
All these activities were directed at encouraging consumers to call or write to order the Long-Term Care Planning Kit.
State Activities
The core Campaign components outlined above were supported by a series of state-specific activities designed to take advantage of local resources and information dissemination opportunities. Site visits were conducted in person and/or by telephone with each participating state to help them define state-specific activities to complement the core Campaign components.
The result was a state-specific plan that provided not only broad education materials (the Planning Kit) but which also included state-specific resources and referrals. Among these state-specific activities were the following:
- The Governors in Idaho, Nevada and Virginia provided a personal introductory message to the beginning of the television spot.
- All the Governors included a personal letter in the Long-Term Care Planning Kit that identified state and local resources for consumers interested in learning more about their long-term care planning options.
- Four of the five Governors held press conferences to launch the Campaign.
- The Campaign was mentioned in the Governor's State of the State address in Idaho and Nevada.
- In Virginia, Governor Warner sent an e-mail message to all state employees encouraging them to order the Planning Kit and reminding them of the state long-term care insurance benefit. He also participated in a local radio interview show about planning for long-term care needs.
- In New Jersey, an article on the Campaign was written and placed in a statewide business magazine to help raise awareness among employers.
The Governors' letters and video messages can be viewed at the following link: http://www.ltcaware.info/pilotstates.jsp.
Targeted Funding for State Health Insurance Assistance Programs (SHIPs)1
In each of the five Campaign states, the Governor included a letter with the Planning Kit that identified state-specific resources for additional information on long-term care services and options. Both the Planning Kit and the Governor's letter referred consumers wanting additional information to their SHIPs. To better respond to the expected increase in public requests for information on how to plan for long-term care needs, CMS provided specialized training and targeted funds for SHIPs on long-term care financing issues. Additional Long-Term Care Planning Kits were distributed upon request as needed through the SHIP and Area Agencies on Aging (AAAs) in the pilot states.
II. COMMUNICATIONS STRATEGY
Overview
The chart below summarizes the communications strategy and timeframe for each Campaign state. The use of media varied by state due to budget and logistical constraints, as well as a desire to test alternative communication strategies across the five pilot states. Direct mail was a core component of the Campaign in all five states. This included both the initial Governors' letter mailing (with the tri-fold brochure) and the follow-up postcard. The quantities and dates for each are shown below. The media campaign varied by state and is described in detail in the following section.
| State | Direct Mail Quantity | In-Home Date for Direct Mail | Governor's Press Event | Media | Follow-up Postcard |
| Arkansas | 298,367 | 1/28/05 | 1/28/05 | TV only | 3/7/05 |
| Idaho | 125,717 | 1/19/05 | 1/10/05 | Radio and TV | 3/7/05 |
| Nevada | 229,186 | 2/1/05 | 2/3/05 | TV only | 3/7/05 |
| New Jersey | 821,797 | 2/7/05 | Not applicable | Radio only | 3/21/05 |
| Virginia | 630,488 | 1/19/05 | 1/10/05 | TV only* | 3/7/05 |
| TOTAL | 2,105,555 | ||||
| * Used in selective media markets only | |||||
Media Initiative
The comprehensive eight week media campaign began the week of January 31st. The goal of the media plan was to use general television and direct response radio to reach adults ages 50-70 to create awareness and generate response to the Governor's letter. For television, the objective was to reach at least 80% of the target population a minimum of five times over the course of eight weeks. For radio, used primarily in Idaho and New Jersey, the strategy was to adequately reach the target audience.
A variety of television and radio spots ran frequently over this eight week time period in most media markets. In addition to paid media running on the NBC, CBS and ABC affiliates in these markets, Public Service Announcement (PSA) aired on these and other stations.
The overall objective of the media campaign was to achieve individual market delivery of 175 general television target rating points per week in all markets and 50 direct response radio target rating points per week in Idaho and New Jersey for a sustained period of eight weeks. The result is 1,400 total target rating points in television and 400 total radio target rating points in Idaho and New Jersey over the eight weeks.
In Idaho, using a mix of television and radio increased the total exposure of the program by reaching people with one media who are not covered by the other media. Including direct response radio in the mix increased the frequency of the message among adults most likely to respond to the Governor's letter.
In Arkansas, all the television ad units were 30-second spots. In Idaho, Nevada, and Virginia, 75% of the television spots were purchased as 30-second ad units and 25% were bought as 60-second spots. In these three states, the Governors each created a 30-second add-on to the television spot which formed the basis of the 60-second spot. A 30-second ad unit was utilized for radio in both the Idaho and the New Jersey market. In Virginia, the television media buy was limited to specific media markets in Southern Virginia due to cost considerations. Therefore, a smaller share of the overall state population was targeted for the paid media campaign in Virginia (66%) relative to the scope of the media buy in the other states (75% in Idaho and 92% in Nevada).
The media activity focused on the stations, shows, and times of day best suited to reaching the 50+ target market. The media buy was designed to generate 1,400 Gross Rating Points (GRPs) which has been identified as an appropriate market saturation to adequately reach the target market with repeated exposures.
| Audience Delivery by Market | ||
| Arkansas, Nevada, Virginia: TV Only | Audience Reach | Average Message Frequency |
| TV at 175 TRPS per week | 88% | 16 times |
| Idaho: TV and Radio | ||
| TV at 175 TRPS per week | 88% | 16 times |
| Radio at 50 TRPS per week | 50% | 8 times |
| Combined TV and Radio | 94% | 19 times |
| New Jersey: Radio only | ||
| Radio at 50 TRPS per week | 50% | 8 times |
The television media buy took advantage of high viewing times among older adults by airing the spots Monday through Friday in early morning news, daytime, early fringe, early news and prime access. Older adults are heavy news viewers and so the programming included the local noon news as part of the daytime mix. Cost efficient weekend programming was used on an individual market basis.
The table below shows the media markets in which air time was purchased and also highlights some of the programs on which media spots aired in each state.
| Pilot State | Media Markets | Percent of State Population in the Media Market | Programs (examples) |
| Arkansas | Fort Smith, Jonesboro, Little Rock, North Little Rock | 76% | CBS Sunday Morning News; Jeopardy; Wheel of Fortune; News at 5; Today Show; Good Morning America; Regis & Kelly; News Midday; Judge Judy; Good Morning Arkansas |
| Idaho | Boise, Idaho Falls, Twin Falls | 75% | CBS Sunday Morning; Price is Right; Jeopardy; Idaho News; Inside Edition; Good Morning America; Wheel of Fortune; Noon News; Today Show; Dr. Phil; Young & Restless; CBS Evening News; News at Five |
| Nevada | North Vegas, Las Vegas, The Lakes, Reno, Nellis AFB | 92% | Action News; Today Show; Jeopardy; Wheel of Fortune; First News; News at Noon; Oprah; Good Morning America |
| New Jersey | Statewide -- radio only | Not estimated | Radio news and talk shows |
| Virginia | Charlottesville, Harrisonburg, Roanoake, Lynchburg, Norfolk, Virginia Beach, Richmond | 66% | Noon News; Today Show; Sunrise News; Wheel of Fortune; Life with Regis; Jeopardy; Millionaire; Dr. Phil; Price is Right; Family Feud; Face the Nation; The Early Show; Good Morning Virginia; Judge Joe |
Public Service Announcements (PSAs)
PSAs are a unique form of advertising in which spots deemed to be a benefit to the community are aired by a station at no charge. By law, each station must air a designated amount of PSAs each month. Each station involved in the general advertising buy was asked to place the 30-second PSA spot at a certain frequency level based on the dollar amount of the buy awarded to the station. Frequency targets were established for each station based on the approved budget for the market.
The ability to place PSA spots was enhanced by the nature and extent of the paid media buy. Across all media markets, a total of 3,107 PSA television spots and 1,036 radio spots aired over the eight week duration of the media component of the Campaign. The number of PSA spots airing by market was as follows:
| State | Media Market | PSA Spots Aired |
| Idaho | Boise | 390 |
| Idaho Falls | 417 | |
| Twin Falls | 227 | |
| Arkansas | Ft. Smith | 409 |
| Jonesboro | 40 | |
| Little Rock | 199 | |
| Nevada | Las Vegas | 134 |
| Reno | 140 | |
| Virginia | Charlottesville | 167 |
| Harrisonburg | 120 | |
| Norfolk-Virginia Beach | 150 | |
| Richmond | 235 | |
| Roanoke-Lynchburg | 156 | |
| RADIO ONLY | ||
| Idaho | 646 | |
| New Jersey | 485 |
Although there was no paid media buy for television in New Jersey, PSAs were also delivered to 11 local New Jersey television stations. WTXF (Fox Philadelphia) aired the PSA in its February rotation for a minimum of four times. News-12 scheduled the PSA in its April rotation.
Achieving Media Goals
Using a combination of paid media and bonus/PSA spots in the same media markets resulted in excellent coverage consistent with the objectives of achieving 1,400 GRPs in each media market. The chart below shows the extent to which this objective was obtained. A score of 100% means that the number of GRPs achieved through the actual exposure the paid and bonus spots received exactly equaled the number of spots ordered for that market. A score over more than 100% means that the media spots ran more often than specified in the media buy, generating more than 1,400 GRPs. And a score of less than 100% means that the spot did not air as often as desired, falling slightly short of the GRP objective in that market. Overall, because of the excellent placement of non-paid "bonus" PSA exposure, in addition to the paid media buy, we achieved more than 100% of our objective in most markets.
| State | Market | Delivery of TargetedGross Rating Points |
| Idaho | Boise | 100% |
| Idaho Falls | 203% | |
| Twin Falls | 141% | |
| Arkansas | Ft. Smith | 153% |
| Jonesboro | 120% | |
| Little Rock | 111% | |
| Nevada | Las Vegas | 136% |
| Reno | 136% | |
| Virginia | Charlottesville | 186% |
| Harrisonburg | 122% | |
| Norfolk-Virginia Beach | 124% | |
| Richmond | 148% | |
| Roanoke-Lynchburg | 115% | |
| TOTAL TV | All Markets Above | 136% |
| Idaho | Radio Only | 93% |
| New Jersey | Radio Only | 151% |
| TOTAL RADIO | Idaho and New Jersey | 109% |
Public Relations (PR) and Publicity
A Governor's press event was convened in all but one of the Campaign states. In Idaho and Nevada, the Governor's announcement of the Campaign was included in the State of the State address.
Articles on the Campaign have appeared in a variety of national industry papers and local press. Examples include the Richmond-Times Dispatch, Las Vegas Sun, Las Vegas Review Journal, National Underwriter and Sales Strategy Magazine. Local evening news also mentioned the Governors' press events on the day those events took place.
Additional communications and publicity were especially strong in Virginia. In addition, the Commonwealth of Virginia conducted a Valentine's Day mailing to state employees (via e-mail communication) to publicize the Awareness Campaign. In January, radio station WFED in Virginia broadcast an interview with HHS Assistant Secretary Michael O'Grady about the Campaign. The following week, Governor Warner of Virginia participated in a local radio talk show -- "Your Legacy, Your Life" on the same station.
In Virginia, the state aging networks hosted information booths at local fairs and festivals. Long-term care specialists were on hand to promote and distribute the Planning Kit and to speak with consumers. The state also convened a number of educational presentations at local community and non-profit group functions.
An article on the Campaign also ran in the magazine for the New Jersey Business and Industry Association, New Jersey Business. New Jersey also created a news release focused in a New Jersey resident who shared her story of planning for her mother's long-term care needs. This "real life story" was used to raise interest in the Awareness Campaign. The news release (attached) included the toll-free number for ordering the Planning Kit. The release appeared in publications in Cherry Hill and Southern New Jersey, representing close to 200,000 readers.
Selected articles and news releases on the Campaign can be viewed at: http://www.ltcaware.info/campnews.jsp.
III. RESPONSE ANALYSIS
Response Volume, Distribution and Response Rates
Tool kit requests were tracked on a weekly basis. As of July 26, there were over 190,000 tool kit requests (not including bulk fulfillment orders described later in this report). The table below summarizes tool kit requests by state. Not surprisingly, given the population size, timing and intensity of the Virginia Campaign relative to the other Campaign states, they had a significant share of tool kit requests to date (34%). New Jersey, also a larger Campaign state, accounts for 34% of the total requests, impressive results considering that, due to media costs, television was not utilized in New Jersey. Arkansas and Nevada are next, with 12% and 11% of tool kit requests respectively. Idaho accounts for 6% of the total tool kit requests, and about 3% of tool kit requests are from non-Campaign states (or from "unknown" states). While still small, the largest share of kit request from non-Campaign states are from adjacent states -- specifically New York (1.1%), Maryland (0.3%) and Washington D.C. (0.4%).
| Tool Kit Requests as of 7/26/05 | ||
| State | Tool Kit Requests | % of Total |
| Arkansas | 22,002 | 12% |
| Idaho | 10,882 | 6% |
| Nevada | 21,288 | 11% |
| New Jersey | 65,105 | 34% |
| Virginia | 65,189 | 34% |
| TOTAL CAMPAIGN STATES | 184,466 | 97% |
| Other states or Unknown* | 6,316 | 3% |
| GRAND TOTAL | 190,782 | 100% |
| * Kit requests received after June 13 were not identified by state, therefore just over 1,400 of these 6,316 kit requests could not be allocated to any specific state. | ||
Response rates are calculated as the total number of tool kits fulfilled per state divided by the number of households in the direct mail campaign for that state. Response rates are summarized in the chart below. It shows both the response rate considering total orders and a response rate based on unique individuals placing orders, removing duplicate orders placed by the same individual. This means that individuals requesting more than one Planning Kit are counted only once in the second column, whereas the first column includes some duplicate requests. Individuals may have made duplicate requests in order to share a Planning Kit with family members or friends, or if they had not yet received the first order placed in the timeframe they expected. New Jersey had the lowest rate of duplicate orders, possibly due to the fact that no paid television was used there.
Over all Campaign states, the unduplicated response rate is 7.7%. Response rates are highest in Virginia (9.1%). In all states, the response rate meets or exceeds our baseline estimate of 5% which is considered an appropriate response rate for a social marketing campaign. These response rates are also significantly higher than comparable private sector direct mail campaigns (which might see responses of 0.5-2.0%). As mentioned earlier, New Jersey's response rate of 7.5% is especially impressive considering the fact that no paid television media was used there.
| Response Rates as of 7/26/05 | ||
| State | Total Orders | Individuals* |
| Arkansas | 7.4% | 5.2% |
| Idaho | 8.7% | 7.9% |
| Nevada | 9.3% | 8.0% |
| New Jersey | 7.9% | 7.5% |
| Virginia | 10.3% | 9.1% |
| TOTAL CAMPAIGN STATES | 8.8% | 7.7% |
| * Represents non-duplicated orders | ||
Tool kit requests by day and week, in general, increased as both the direct mail and media communications took place. Peak weeks were the weeks from February 11th through March 11th. The largest volume of kit requests in one week occurred during the week ending 2/18, with over 43,000 requests. The largest single day of activity to date took place on February 14th, most likely the result of the Commonwealth of Virginia's Valentine's Day communication initiative. Of the 25,000 requests on that day, over 16,000 came from Virginia residents.
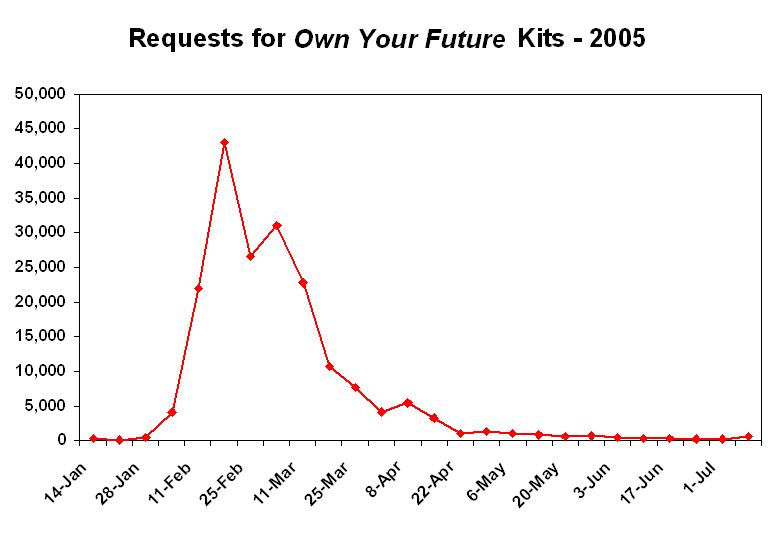
| Tool Kit Requests by Date through 7/26/05 | ||
| Week Ending | Tool Kit Requests | Percent of Total |
| 1/14 | 380 | 1% |
| 1/21 | 177 | 1% |
| 1/28 | 439 | 1% |
| 2/4 | 4,131 | 2% |
| 2/11 | 21,990 | 12% |
| 2/18 | 43,046 | 23% |
| 2/25 | 26,562 | 14% |
| 3/4 | 31,112 | 16% |
| 3/11 | 22,786 | 12% |
| 3/18 | 10,781 | 6% |
| 3/25 | 7,679 | 4% |
| 4/1 | 4,182 | 2% |
| 4/8 | 5,450 | 3% |
| 4/15 | 3,255 | 2% |
| 4/22 | 1,040 | 1% |
| 4/29 | 1,294 | 1% |
| 5/6 | 1,109 | 1% |
| 5/13 | 913 | 1% |
| 5/20 | 619 | 1% |
| 5/27 | 720 | 1% |
| 6/3 | 497 | 1% |
| 6/10 | 335 | 1% |
| 6/17 | 385 | 1% |
| 6/24 | 246 | 1% |
| 7/1 | 193 | 1% |
| Through 7/26 | 599 | 1% |
| TOTAL | 190,782 | 100% |
The majority of kit requests (67%) came in through the BRC portion of the tri-fold brochure included in the mailing along with the Governor's letter. On May 31st, the cell center for the 1-866-PLAN-LTC phone line closed to new kit requests. Consumers were referred instead to a newly established consumer website where they could download the Planning Kit). Between January 1st and May 31st, the call center received over 44,000 calls. Of these, approximately 85% resulted in a completed tool kit request. The remaining 15% either abandoned the call during the Interactive Voice Response (IVR) scripting (3%) or did not provide complete mailing data to enable fulfillment (12%). Only a very small portion of callers, about 2%, requested transfer to a live operator during the call.
The timing of responses received by telephone vs. BRC suggests some small "lift" in response rates as a result of the follow-up postcard. Prior to the postcard drop, over 90% of the Planning Kit orders were received by BRC. The postcard reinforced the 1-866-PLAN-LTC number but did not include a return reply mail component. Therefore, individuals who requested a Planning Kit specifically as a result of the reminder provided by the follow-up postcard could only order their kit by telephone. This probably explains the "lift" in call center volume and the drop in BRC activity around the weeks immediately following receipt of the follow-up postcard. It also suggests that consumers are very accepting of use of a BRC as a response vehicle, preferring it to a toll-free phone line, when both options for response are available at the same time.
Data on source was collected only for kit requests coming in by telephone. Callers initially had the option to identify one source, not multiple sources. Or they could by-pass the source question entirely. A script change was made mid-way in the campaign to facilitate the capture of television as a source. Callers were only asked to indicate "Yes or No" whether they heard about the Campaign from a television ad. Source information, therefore, is limited to the 11% of total kit requests that both came in by telephone and answered the source questions. For those providing information on source, the majority of callers mention "other" which may refer to the direct mail piece they received. The percent of respondents citing television as where they heard about the Campaign was 38% in Idaho, 36% in Nevada and 33% in Virginia. These three Campaign states have included the 30-second add-on to the television spot with the Governor's message. While television spots also ran in Arkansas, they did not include a Governor's message. In that state, a smaller share (23%) cite television as a source. In New Jersey, where there were no television spots, only 5% cite television as a source.
The table below shows the distribution of source for those callers who responded to that question in the IVR prompt. As noted above, these responses represent only about 11% of the total kit requests.
| "How did you hear about the campaign?" (responses through 4/23/05) | |||
| State | TV | Radio | Other |
| Arkansas | 23% | 2% | 75% |
| Idaho | 38% | 2% | 60% |
| Nevada | 36% | 3% | 62% |
| New Jersey | 5% | 3% | 92% |
| Virginia | 33% | 2% | 65% |
| OVERALL | 24% | 2% | 74% |
Given the limited data on source for the kit requests, it is difficult to evaluate the impact that media had on the Campaign results. One outcome of the use of television and radio might have been to foster a certain amount of duplicate kit requests. An individual receiving the Governor's letter might have returned the BRC and then subsequently saw a television spot. Perhaps this "reminder" caused them to order the kit a second time if they had not yet received the original order they placed. The evidence for this lies in the slightly higher rate of duplicate kit orders in states where television spots aired and a smaller rate of duplicate orders in New Jersey, where there was no paid media buy for television.
Bulk Fulfillment Orders
An additional 19,341 tool kits were fulfilled through bulk-order requests. This includes special requests made by SHIP agencies for distribution to consumers at local meetings and seminars, as well as bulk orders taken on the program website for industry, government, media and others. Therefore, a total of about 210,000 tool kits have been disseminated, with at least 90% of them going directly to fulfill consumer requests.
The majority of bulk fulfillment orders to date have been from agents, brokers and financial planners. The second largest category of requests has come from insurance companies. The SHIP agencies and other education or government entities represent about 16% of the bulk orders for tool kit distribution to consumers.
In addition, members of the media, insurance companies, agents and others could place bulk orders for the tri-fold. These were reportedly used for distribution at consumer meetings, seminars or as part of a direct mail campaign to consumers. Over 179,000 tri-fold brochures have been distributed in response to these bulk order requests. As of April 30th, over 90% of the total kit requests received matched back to the direct mail list used for the initial Governors' mailings. This suggests that about 10% of the total kit requests in Campaign states came from other distribution channels. This might include both responses to the television and radio campaign from individuals outside of the targeted age 50-70 population as well as requests from respondents who received their kit as a result of these bulk order tri-folds distributed by sources other than the Campaign's direct mail effort (e.g., insurance agent, SHIP agency or other).
Website Visits
A Campaign website was established to help inform government, media, industry and others about the Campaign. Representatives from these groups could view or download Campaign materials on the website, and could also place an order for bulk fulfillment. The website was not designed to support consumer kit requests (however the Phase II Campaign will have a consumer-focused website where individuals can download or submit orders for the Planning Kit.)
The website, http://www.ltcaware.info provided specifics on Campaign news and events in each of the pilot states:
- Project Timeline. Identified key dates for each state in the Campaign including the Governors' press events, direct mail drop dates, and the start and end dates for the media campaign.
- Pilot Campaigns. Provided a summary and PDFs of state-specific materials including press releases and the Governors' letters. The Governors' video messages were also included here.
- Campaign Presentations. Included copies of major talks, articles or presentations that pertain to the Campaign.
- Campaign News. A place to post new information about Campaign events.
- Long-Term Care Planning Kit. The tri-fold brochure, Planning Kit, television spot and audio CD could be downloaded or viewed here.
- Bulk Materials Order Form. Public agencies, insurers, educators and other entities could request bulk order of Campaign materials. Specifically, each entity making a request could order up to 250 tri-folds and up to 20 Planning Kits. Bulk Orders were taken through the end of February 2005.
From January 1st through October 10th, the website received over 25,900 visits. A visit is a series of actions that begins when a visitor views their first page from the server and ends when the visitors leaves the site or remains idle on the site for more than 30 minutes. Over 1,600 (or about 6%) of the visits to the website can be identified specifically as from an insurance company domain name. Other domain names like Yahoo, AOL or Verizon do not identify any specific user type.
Visits to the website were tracked by state. The largest number of visits were from California, Texas, New York, Virginia, New Jersey, Washington DC, Georgia, and Missouri (together accounting for 55% of the visits.)
The website received over 6,700 requests to view or download the Long-Term Care Planning Kit. Users were requested to identify their affiliation, as shown in the chart below.
| Website Kit Requests by Affiliation | |
| Affiliation | Percent of Requests |
| Insurance Agent | 51% |
| Not specified | 19% |
| Consumer | 18% |
| Other | 10% |
| Government Agency | 2% |
| Media | 1% |
Consumer Website
In order to meet the needs of consumers who continued to call or write for the Planning Kit after the May 31st pilot end date, we established a consumer-focused website that would provide consumers with the ability to download the Planning Kit and to listen to the audio CD tracks. The consumer website can be found at http://www.aoa.gov/ownyourfuture/.
Since it began, the Consumer Website has received 351 requests to download the Planning Kit. Some basic information has been collected on individuals who made these requests. Over half (54%) are associated with the insurance industry, while consumers represent 30% of those using the site. Individuals from New Jersey and Virginia represent over half of all the site users. Just over 40% of the website users are not from any of the Phase I Campaign states.
| Category | Number | Percent |
| Consumer | 106 | 30% |
| Insurance Industry | 189 | 54% |
| Government | 45 | 13% |
| Other | 11 | 3% |
| TOTAL | 351 | 100% |
| Category | Number | Percent |
| New Jersey | 105 | 30% |
| Virginia | 72 | 21% |
| Arkansas | 18 | 5% |
| Nevada | 13 | 4% |
| Idaho | 6 | 2% |
| CAMPAIGN STATES | 214 | 61% |
| Massachusetts | 13 | 4% |
| New York | 6 | 2% |
| Michigan | 5 | 1% |
| Colorado | 8 | 2% |
| Texas | 16 | 5% |
| California | 15 | 5% |
| Washington | 6 | 2% |
| TOTAL | 351 | 100% |
Most people using the site to download the Planning Kit heard about the Campaign from the original Governor's letter (37%), suggesting that the mail piece has a relatively long "shelf life." Other sources include "word of mouth" or a wide variety of "other" sources.
| How Heard About Campaign | Number | Percent |
| Governor letter | 127 | 37% |
| Other | 122 | 36% |
| Word of mouth | 78 | 23% |
| TV | 8 | 2% |
| Radio | 4 | 1% |
| TOTAL | 339 | 100% |
Cost Per Response
Expenditures for the communications component of the Campaign budget, including the print production of materials, initial Governors' mailing, follow-up postcards, media and PR costs totaled just over $2.28 million. This does not include call center costs or costs incurred by the fulfillment center to take and process kit requests which were absorbed internally by CMS. While it does include the production and printing costs associated with the Planning Kit, the costs associated with the development, testing and creation of the materials were supported by other funds.
The major cost component was the Governors' letter and tri-fold brochure mailing to the more than 2.1 million households (38% of the communications budget). Media and PR accounted for about 26% of the communication expenditures. The follow-up postcard represented 20% of Campaign expenses for communications. Production and collation of the Planning Kit represented about 8% of these "outside" communication costs (keeping in mind that this does not include the cost of taking and filling the kit request order). Other cost components include purchase of the direct mail list, shipping and bulk order fulfillment.
The cost per kit response calculated for each state is shown below. The major factors driving differences in the cost per response across the states are the different mix of communications used in the states as well as differences in the states' response rates to the Campaign. New Jersey, where television was not used as a communication element, has the lowest cost per response at $9.60. Idaho had the highest cost per response, at $15.07, because of both the use of paid media and the lower response rate in Idaho relative to the other states where media was purchased. Although Virginia is a more costly media market than the other states where media was purchased, the high response rate and selective use of the media buy in Virginia helped generate a lower cost per response than in the other "media" states.
| State | Cost Per Response |
| Arkansas | $12.81 |
| Idaho | $15.07 |
| Nevada | $13.68 |
| New Jersey | $9.60 |
| Virginia | $9.98 |
| TOTAL | $12.40 |
Evaluation
The Campaign evaluation included two important components:
- Response Analysis. Analysis of the timing and nature of responses to Campaign activities. To augment the analysis of responders (i.e., individuals requesting the Long-Term Care Planning Kit), key demographic information from public data sources was appended to the direct mail file. Most of the appended data are data available through public sources like the 2000 census. In this component, we compared results across states with different communication strategies (e.g., paid media, Governor message and other differences) as well as comparing responders and non-responders within and across states.
- Baseline and Follow-up Surveys. Survey respondents include individuals between the ages of 50 and 70 in the Campaign states for a total of 4,500 households (1,500 each in New Jersey and Virginia and 500 in each of the remaining Campaign states). The baseline pre-Campaign survey was conducted in November and December 2004. It gathered data about consumer awareness and understanding of key long-term care planning options and behaviors, including: understanding of long-term care issues and concepts; personal experiences with long-term care and caregiving; financial planning options; and lifestyle choices, such as home modification and relocation. The post-Campaign interview, is being conducted with the same group of 4,500 respondents, and explores changes in key attitudes or planning activities as well as exposure to and opinions of the Campaign activities. The post-Campaign survey also includes a sample of individuals who requested the long-term care planning kit but were not included in the baseline interview. Including these respondents will better enable us to evaluate differences between responders and non-responders to the Campaign message. Field work for the follow-up survey is expected to be complete by mid-December 2005.
This section summarizes key findings of the Responder Analysis.
Results of the Baseline and Follow-up Surveys (once complete) will be provided in a separate report.
The Response Analysis suggests that the Pilot Campaign had broad-based appeal. Interest in the Planning Kit was evident across all demographic groups. Specifically, there was little difference in the response rates across socio-demographic groups within or across the Campaign states, however response rates were slightly higher at the older ages, higher incomes and higher educational levels. This finding is consistent across the Campaign states.
While interest in planning is evident across all the socio-demographic groups within the target population, the "typical" responder across all states is as follows:
- Age 58;
- Household income of $60,000-$75,000;
- A homeowner with a median home value of $130,000;
- Has some college education or more; and
- Over one-third of the responders are married.
Differences in responder and non-responder profiles across states primarily reflect differences in the underlying target population in those states. No state-specific patterns were identified with respect to who responded and who did not respond to the Campaign messages.
There are several possible explanations for why we do not observe significant differences in the demographic profiles of responders compared either across states or with non-responders:
- Because the Campaign message was broadly targeted to encompass a wide variety of planning activities, it had some element of appeal to people in all age, income, education and life stage groups. This broad-based appeal was in fact an important objective of the Campaign.
- Attitudes, much more than demographics, tend to differentiate "planners" from "non-planners." Other research suggests that attitudes are much more powerful in explaining and identifying different planning behaviors and therefore may also motivate someone to request the Planning Kit (or not) more strongly than any demographic trait. The baseline and follow-up survey should shed more light on key attitudinal differences across states and between responders and non-responders.
- The quality of some components of the appended data may well be a factor. Because some of the data are ascribed and not actual data specifically associated with each respondent, actual differences for some variables may be muted. A comparison of the appended data with actual demographics (as self-reported on the baseline survey) was conducted for approximately 4,500 responder records. The appended data performed very well, in terms of matching up with actual responses, with respect to age, gender, marital status and home ownership. The appended data performed less well with respect to income and education, variables which may be more likely to predict attitude and behavioral differences.
The detailed data tables summarizing trait-specific response rates and the profile of responders and non-responders in each state are attached as Appendix A.
State Health Insurance Assistance Programs (SHIPs) Encounters
SHIPs provide counseling on a wide range of health insurance issues, including Medicare, Medicaid, long-term care insurance and supplemental insurance options. To better respond to the expected increase in public requests for information on how to plan for long-term care needs, CMS provided them with targeted funds and specialized training on long-term care financing issues. The SHIPs used a specially created Encounter Form to track inquiries to their agencies from consumers in the Campaign states. A copy of the SHIP Encounter Form is attached as Appendix B.
Although the telephone number for the local SHIP agencies was included in the Planning Kit, only a very small portion of the consumers who received the Long-Term Care Planning Kit or heard about the campaign contacted their SHIP agency for additional counseling or information. A total of 275 SHIP Encounter Forms were received. New Jersey had the most SHIP agency level activity, accounting for over two-thirds of these encounters. The remaining Campaign states reported only a handful of Campaign-based inquiries.
It is unclear why most consumers did not reach out to their SHIP agency. In part it may be that they are not familiar with or aware of the agency's functions and need more than just a name and telephone number to encourage them to reach out. Since a significant portion of the consumers receiving the Planning Kit are not yet Medicare-eligible, they may not have any familiarity with the concept of a SHIP agency and may have other avenues for seeking out insurance and planning information and advice.
While the number of Campaign-specific inquiries coming into the SHIP agencies was small, these agencies also conducted some outreach to consumers in their communities, distributing Planning Kits at a variety of consumer seminars and meetings. In total, just under 3,000 Planning Kits were distributed through the SHIP and AAAs in the pilot states.
The table below summarizes characteristics of those individuals who consulted by telephone or in person with their local SHIP agency to learn more about long-term care planning.
| SHIP Agency Consumer Encounters | ||
| Characteristic | Category | Percent |
| Age | 50 years old | 5% |
| 50-59 | 32% | |
| 60-64 | 22% | |
| 65-69 | 25% | |
| 70-74 | 10% | |
| 75 and older | 6% | |
| Gender | Male | 48% |
| Female | 54% | |
| Marital Status | Married | 62% |
| Not married | 38% | |
| Home Ownership | Yes | 89% |
| No | 11% | |
| Has Children | Yes | 77% |
| No | 23% | |
| Education | High school graduate or less | 23% |
| Some college | 22% | |
| College graduate | 30% | |
| Some graduate school or beyond | 25% | |
| Contact Type | Telephone | 91% |
| In-person | 9% | |
| Already Has Planning Kit | Yes | 90% |
| No | 10% | |
| Who Information is For | Self | 97% |
| Other | 3% | |
| How Heard About Campaign? | TV | 5% |
| Radio | 1% | |
| 84% | ||
| Other | 10% | |
| Primary Topic of Interest | LTC insurance | 81% |
| Reverse mortgage | 4% | |
| Home modification | 0% | |
| Medicaid/Medicare | 4% | |
| Legal issues | 1% | |
| LTC services/options | 2% | |
| Other LTC finance | 3% | |
| Other | 5% | |
IV. IMPACTS, ANALYSIS AND CONCLUSION
Industry Activities and Impacts
The insurance industry has been actively supportive of the Awareness Campaign. While insurers have purposefully not been involved directly with any of the Campaign activities, many insurers have initiated activities within their own distribution systems to help publicize and support the concept of consumer education and awareness in general and of the Campaign specifically.
Examples of some industry activities around the Campaign include the following:
- Direct mail activities tailored to mention the Campaign and focused on consumers in the Pilot Campaign states. In some cases, the direct mail pieces were sent by agents and brokers representing one or more insurers and in other cases, the direct mail was sent directly from an insurer.
- Some insurers created direct mail pieces and programs specifically to mention the Campaign, while other insurers used the time period to send their traditional direct mail piece(s) to consumers in the Campaign states.
- Increased agent seminar programs in the Campaign states scheduled to dovetail with the timeframe of the Campaign.
- Promotion and distribution of a privately produced consumer education booklet on long-term care to complement the Campaign materials.
- Re-enrollment of the Commonwealth of Virginia's long-term care benefit for employees.
- Coverage of the Campaign in industry newsletters to agents and insurers including National Underwriter, American's Health Insurance Plan's (AHIP) Coverage Magazine, Sales Strategies and others.
- Links to the Campaign website from other industry websites used by both agents and consumers.
- Presentations by Campaign representatives at industry conferences including the AHIP Fall Forum, Long Term Care Insurance Producers' Summit and others.
Some insurers have shared with us anecdotal information about the impact that the Campaign has had on both responses and inquiries as well as on sales. Others have done more in-depth tracking of results and provided more measurable impact of the Campaign.
Some of the impacts and outcomes industry has mentioned are the following:
- Seminar attendance in the Campaign states is up compared with attendance at a similar time last year and compared with seminar attendance in non-Campaign states.
- Many clients have the Planning Kit in-hand when the agent makes a sales call. Those that have the Planning Kit appears to be a step or two ahead on the "learning curve" on these issues compared with prospects who have not received the Planning Kit. Agents indicate that "readiness to buy" is enhanced among those that have received the Planning Kit.
- The Commonwealth of Virginia had a very strong re-enrollment Campaign in its state employees' long-term care benefit.
- Some insurers are seeing an "uptick" in both responses and in sales in Campaign states compared to either non-Campaign states or compared with the same time last year.
- Some insurers report higher response rates to their direct mail pieces for first quarter 2005 compared with the same direct mail piece used in 2004. In particular, one distributor indicated that six out of ten of their direct mail pieces performed better during the Campaign timeframe than they had in 2004. The remaining four creative pieces performed either the same or slightly worse.
One insurer tracked their response rates and sales activities in Campaign states against the timeframe of Campaign activities and in comparison with controls in non-Campaign states. They report the following positive impact on both responses and sales:
- Direct mail response rates increased between 37% and 172% during the prime phase of the Campaign (mailing of the Governors' letters).
- Response rate spikes for isolated weeks are as high as 245%.
- Response rate increases were concentrated in a 2-4 week time period during the Campaign.
- A unique direct mail package designed to complement the Campaign drew more than 1,000 responses.
- Agents perceived increased consumer "readiness to buy" during the sales process among those that had received the Planning Kit.
- Sales volume in the Campaign states has been 15% higher on average than in the non-Campaign states, with weekly surges in sales at selected Campaign weeks of up to 97% above sales volume in non-Campaign states.
- The favorable sales impact, based on current data trends, is expected to continue as awareness increases.
Impact on Consumer Behavior
While there is preliminary evidence of increased sales and response rates specific to long-term care insurance, some analysts suggest it is "too soon" to perceive significant behavioral impacts of the Awareness Campaign. The "sales cycle" for long-term care insurance is typically many months long, and the timeframe from sale to "premium on the books" adds on 45-60 days or more to that sales cycle. Also many factors influence results, so it may be difficult to attribute additional sales or premiums coming in during the first six months of 2005 as due to the Campaign. It is possible, however, that individuals who had been interested in long-term care insurance or had considered it previously but not yet acted on that interest were encouraged by the independent information and education provided by the Campaign to finally take action.
We also do not have information on Campaign impacts in other areas such as home modification, reverse mortgages, service planning, legal issues and the other "long-term care planning" topics also included in the Campaign materials.
The findings from the post-Campaign follow-up survey will be an important element in assessing the extent to which consumers in the pilot states were exposed to and influenced by the Awareness Campaign. (Results will be available shortly and will be summarized in a separate report.) The survey asks about exposure to the Campaign messages and asks about specific actions taken in response to the materials (e.g., visiting an agent, buying long-term care insurance, considering a reverse mortgage, and other actions). In addition to the follow-up survey, AHIP has included a question about the Awareness Campaign in its 2005 general population and long-term care insurance surveys.
It is also possible that we may see an impact of using media in selected Campaign states in terms of the effect of the Campaign on attitudes and behavior, even though media did not appear to significantly influence response rates for the Planning Kit materials. It is possible that the media exposure added a personalized and "second touch" to the messaging and, as a result, was more effective in influencing behavior than just the direct mail message.
State Activity Impact
Following the Campaign, the pilot states continue to be active in promoting long-term care education and awareness. In all the states, the SHIP agencies have enhanced resources, staffing and training to address long-term care planning needs. Since the Campaign, both Idaho and Arkansas have begun the process of implementing a long-term care insurance program for state employees and retirees. Idaho is working with Aetna and will soon begin the education, marketing and enrollment process. These are important initiatives that can further enhance consumer awareness even beyond the target market of state employees and retirees. In other states, the market penetration of private long-term care insurance is favorably impacted by the presence of a public employees' program.
Also, a number of other states (e.g., New York) have earmarked funds for a state-crafted Long-Term Care Awareness Campaign. Several states have also expressed interest in participating in the Phase II of the "Own Your Future" Long-Term Care Awareness Campaign.
Conclusion
The Phase I Pilot Awareness Campaign achieved impressive response rates across all of the pilot states. The Long-Term Care Planning Kit seems to have broad-appeal across all demographic groups within the target market. In particular, the Campaign appears to have successfully reached the "Tweeners" -- those individuals of more moderate income and assets who have planning options but are potentially vulnerable to spend-down to Medicaid if they do not learn about and adopt such planning options.
Other key findings of the Campaign include the following:
- Public sector affinity and sponsorship of the Campaign is critical to achieving good response rates and ensuring consumer confidence in the objectivity of the information being provided.
- Direct mail appears to be a more cost-effective communication vehicle than paid media. While it remains to be seen whether consumers exposed to the paid media are different in terms of their attitude or behavior change as a result of the Campaign, there was no significant difference in response rates between "media" and "non-media" states. Also, given the cost of paid media in most major media markets, direct mail is a more cost-effective and sustainable option, at least in terms of generating reasonable response rates.
- There is good consumer acceptance of BRCs as a response vehicle, thus minimizing or eliminating the need for a more costly live-operator or voice response telephone system to take Planning Kit orders. In the Phase II Campaign we hope to further test the cost-effectiveness of using a consumer website to take and fulfill Planning Kit orders, hopefully further reducing the cost of fulfillment requests.
- The Campaign helped raise awareness among state policymakers of the need for an integrated approach to fostering private responsibility for long-term care planning.
- The Campaign has also renewed a collaboration between the public and private sectors with the unified objective of raising awareness and education on these critical issues.
APPENDIX A: RESPONSE ANALYSIS
| TABLE A. Trait-Specific Response Rates | ||||||
| Characteristics | TOTAL | AR | ID | NJ | NV | VA |
| AGE | ||||||
| 45 to 54 | 6% | 4% | 6% | 6% | 6% | 7% |
| 55 to 64 | 7% | 4% | 7% | 7% | 7% | 8% |
| 65 and over | 7% | 5% | 8% | 7% | 9% | 8% |
| GENDER | ||||||
| Male | 7% | 4% | 7% | 7% | 8% | 8% |
| Female | 5% | 3% | 5% | 5% | 5% | 6% |
| INCOME | ||||||
| $15,000 | 6% | 5% | 7% | 6% | 7% | 7% |
| $15,000 - $19,999 | 6% | 4% | 7% | 6% | 8% | 7% |
| $20,000 - $29,999 | 6% | 4% | 7% | 6% | 7% | 7% |
| $30,000 - $39,999 | 6% | 4% | 7% | 6% | 7% | 8% |
| $40,000 - $49,999 | 6% | 4% | 7% | 6% | 7% | 8% |
| $50,000 - $59,999 | 7% | 5% | 8% | 6% | 7% | 8% |
| $60,000 - $74,999 | 7% | 5% | 7% | 6% | 7% | 8% |
| $75,000 - $99,999 | 7% | 5% | 8% | 7% | 7% | 7% |
| $100,000 - $124,999 | 7% | 5% | 8% | 7% | 7% | 7% |
| $125,000 - $149,999 | 7% | 6% | 8% | 7% | 8% | 7% |
| $150,000 - $249,999 | 7% | 4% | 9% | 7% | 8% | 7% |
| $250,000 plus | 7% | 0% | 0% | 7% | 4% | 7% |
| EDUCATION | ||||||
| 9th grade | 6% | 0% | 8% | 5% | 6% | 5% |
| 12th grade | 6% | 4% | 6% | 7% | 7% | 7% |
| HS Diploma | 6% | 4% | 6% | 7% | 7% | 8% |
| Some College | 7% | 5% | 7% | 7% | 8% | 8% |
| Associate Degree | 7% | 5% | 8% | 7% | 8% | 8% |
| College Degree | 7% | 5% | 8% | 7% | 7% | 8% |
| Graduate Degree | 7% | 0% | 0% | 7% | 0% | 7% |
| TABLE B. Responder Profile | ||||||
| Data Element | TOTAL | AR | ID | NJ | NV | VA |
| AGE | ||||||
| 50 | 1% | 1% | 1% | 1% | 1% | 1% |
| 50-54 | 29% | 27% | 28% | 31% | 25% | 30% |
| 55-59 | 27% | 25% | 27% | 27% | 26% | 27% |
| 60-64 | 23% | 24% | 22% | 22% | 24% | 22% |
| 65-69 | 17% | 19% | 17% | 16% | 19% | 16% |
| 70+ | 4% | 4% | 4% | 3% | 5% | 3% |
| Median Age | 58 | 59 | 58 | 58 | 59 | 58 |
| GENDER | ||||||
| Male | 48% | 42% | 49% | 50% | 48% | 47% |
| Female | 52% | 58% | 51% | 50% | 52% | 53% |
| MARITAL STATUS | ||||||
| Married | 37% | 41% | 38% | 35% | 35% | 38% |
| INCOME | ||||||
| $15,000 | 3% | 6% | 4% | 1% | 6% | 3% |
| $15,000 - $19,999 | 2% | 4% | 2% | 1% | 2% | 2% |
| $20,000 - $29,999 | 6% | 14% | 8% | 3% | 5% | 7% |
| $30,000 - $39,999 | 10% | 21% | 14% | 5% | 8% | 12% |
| $40,000 - $49,999 | 12% | 18% | 19% | 8% | 12% | 15% |
| $50,000 - $59,999 | 11% | 12% | 16% | 9% | 12% | 12% |
| $60,000 - $74,999 | 14% | 9% | 13% | 15% | 17% | 13% |
| $75,000 - $99,999 | 20% | 10% | 16% | 26% | 23% | 18% |
| $100,000 - $124,999 | 11% | 4% | 6% | 16% | 10% | 9% |
| $125,000 - $149,999 | 4% | 1% | 1% | 7% | 3% | 4% |
| $150,000 - $249,999 | 6% | 1% | 1% | 9% | 3% | 5% |
| $250,000 plus | 1% | 0% | 0% | 1% | 0% | 1% |
| Median | $60,000 - $75,000 | $40,000 - $50,000 | $50,000 - $60,000 | $75,000 - $100,000 | $60,000 - $75,000 | $60,000 - $75,000 |
| OWN HOME | ||||||
| Yes | 66% | 54% | 55% | 71% | 61% | 67% |
| Median value | $130,000 | $63,000 | $76,000 | $182,000 | $123,000 | $101,000 |
| EDUCATION | ||||||
| 9th grade | 0% | 0% | 0% | 0% | 0% | 0% |
| 12th grade | 3% | 5% | 1% | 3% | 3% | 3% |
| HS Diploma | 19% | 45% | 9% | 14% | 16% | 20% |
| Some College | 45% | 39% | 73% | 40% | 69% | 40% |
| Associate Degree | 9% | 5% | 8% | 11% | 8% | 9% |
| Bachelor's Degree | 23% | 7% | 9% | 31% | 4% | 26% |
| Graduate Degree | 0% | 0% | 0% | 0% | 0% | 1% |
| LOCATION | ||||||
| Media market | 46% | 76% | 75% | 0% | 92% | 66% |
| TABLE C. Non-Responder Profile | ||||||
| Data Element | TOTAL | AR | ID | NJ | NV | VA |
| AGE | ||||||
| 50 | 0% | 0% | 0% | 0% | 0% | 0% |
| 50-54 | 34% | 33% | 35% | 36% | 32% | 34% |
| 55-59 | 27% | 27% | 26% | 27% | 28% | 28% |
| 60-64 | 20% | 21% | 20% | 20% | 21% | 20% |
| 65-69 | 15% | 17% | 16% | 15% | 16% | 15% |
| 70+ | 3% | 3% | 3% | 3% | 3% | 3% |
| Median Age | 57 | 57 | 57 | 57 | 57 | 57 |
| GENDER | ||||||
| Male | 37% | 34% | 38% | 36% | 37% | 47% |
| Female | 63% | 66% | 62% | 64% | 63% | 53% |
| MARITAL STATUS | ||||||
| Married | 48% | 49% | 47% | 56% | 46% | 49% |
| INCOME | ||||||
| $15,000 | 3% | 5% | 4% | 2% | 6% | 3% |
| $15,000 - $19,999 | 2% | 4% | 2% | 1% | 2% | 2% |
| $20,000 - $29,999 | 6% | 15% | 8% | 3% | 4% | 7% |
| $30,000 - $39,999 | 11% | 23% | 16% | 6% | 9% | 13% |
| $40,000 - $49,999 | 13% | 19% | 21% | 8% | 12% | 15% |
| $50,000 - $59,999 | 11% | 11% | 15% | 10% | 12% | 12% |
| $60,000 - $74,999 | 14% | 8% | 13% | 15% | 17% | 13% |
| $75,000 - $99,999 | 20% | 9% | 15% | 26% | 24% | 17% |
| $100,000 - $124,999 | 10% | 4% | 5% | 15% | 10% | 8% |
| $125,000 - $149,999 | 4% | 1% | 1% | 6% | 3% | 3% |
| $150,000 - $249,999 | 5% | 0% | 1% | 8% | 2% | 5% |
| $250,000 plus | 1% | 0% | 0% | 1% | 0% | 1% |
| Median | $60,000 -$75,000 | $40,000 -$50,000 | $40,000 -$50,000 | $75,000 -$100,000 | $60,000 -$75,000 | $50,000 -$60,000 |
| OWN HOME | ||||||
| Yes | 72% | 55% | 57% | 80% | 67% | 73% |
| Median value | $127,000 | $62,000 | $75,000 | $178,000 | $122,000 | $98,000 |
| EDUCATION | ||||||
| 9th grade | 0% | 0% | 0% | 0% | 0% | 0% |
| 12th grade | 3% | 5% | 1% | 3% | 3% | 3% |
| HS Diploma | 20% | 46% | 10% | 15% | 16% | 21% |
| Some College | 46% | 38% | 73% | 41% | 68% | 42% |
| Associate Degree | 9% | 4% | 7% | 11% | 7% | 8% |
| Bachelor's Degree | 21% | 6% | 9% | 29% | 5% | 24% |
| Graduate Degree | 1% | 0% | 0% | 0% | 0% | 1% |
| LOCATION | ||||||
| Media market | 46% | 77% | 72% | 0% | 93% | 67% |
| TABLE D. Responders vs. Non-Responders Profile: All States | ||
| Data Element | Responders | Non-Responders |
| AGE | ||
| 50-54 | 15% | 19% |
| 55-59 | 14% | 15% |
| 60-64 | 12% | 11% |
| 65-69 | 9% | 8% |
| 70+ | 2% | 1% |
| Median Age | 58 years | 57 years |
| GENDER | ||
| Male | 48% | 37% |
| Female | 52% | 63% |
| MARITAL STATUS | ||
| Married | 37% | 48% |
| INCOME | ||
| $15,000 | 3% | 3% |
| $15,000 - $19,999 | 2% | 2% |
| $20,000 - $29,999 | 6% | 6% |
| $30,000 - $39,999 | 10% | 11% |
| $40,000 - $49,999 | 12% | 13% |
| $50,000 - $59,999 | 11% | 11% |
| $60,000 - $74,999 | 14% | 14% |
| $75,000 - $99,999 | 20% | 20% |
| $100,000 - $124,999 | 11% | 10% |
| $125,000 - $149,999 | 4% | 4% |
| $150,000 - $249,999 | 6$ | 5% |
| $250,000 plus | 1% | 1% |
| Median | $60,000 - $74,999 | $60,000 - $74,999 |
| HOMEOWNER | ||
| Yes | 66% | 72% |
| Median home value | $130,000 | $127,000 |
| EDUCATION | ||
| 9th Grade | 0% | 0% |
| 12th Grade | 3% | 3% |
| HS Diploma | 19% | 20% |
| Some College | 45% | 46% |
| Associate Degree | 9% | 9% |
| Bachelor's Degree | 23% | 21% |
| Graduate Degree | 0% | 1% |
| LOCATION | ||
| Media market | 46% | 46% |
| TABLE E. Arkansas Responders vs. Non-Responders | ||
| Data Element | Responders | Non-Responders |
| AGE | ||
| 50-54 | 27% | 33% |
| 55-59 | 25% | 27% |
| 60-64 | 24% | 21% |
| 65-69 | 19% | 17% |
| 70+ | 4% | 3% |
| Median Age | 59 years | 57 years |
| GENDER | ||
| Male | 42% | 34% |
| Female | 58% | 66% |
| MARITAL STATUS | ||
| Married | 41% | 49% |
| INCOME | ||
| $15,000 | 6% | 5% |
| $15,000 - $19,999 | 4% | 4% |
| $20,000 - $29,999 | 14% | 15% |
| $30,000 - $39,999 | 21% | 23% |
| $40,000 - $49,999 | 18% | 19% |
| $50,000 - $59,999 | 12% | 11% |
| $60,000 - $74,999 | 9% | 8% |
| $75,000 - $99,999 | 10% | 9% |
| $100,000 - $124,999 | 4% | 4% |
| $125,000 - $149,999 | 1% | 1% |
| $150,000 - $249,999 | 1% | 0% |
| $250,000 plus | 0% | 0% |
| Median | $40,000 - $49,999 | $40,000 - $49,999 |
| HOMEOWNER | ||
| Yes | 54% | 55% |
| Median home value | $63,000 | $62,000 |
| EDUCATION | ||
| 9th Grade | 0% | 0% |
| 12th Grade | 5% | 5% |
| HS Diploma | 45% | 46% |
| Some College | 39% | 38% |
| Associate Degree | 5% | 4% |
| Bachelor's Degree | 7% | 6% |
| Graduate Degree | 0% | 0% |
| LOCATION | ||
| Media market | 76% | 77% |
| TABLE F. Idaho Responders vs. Non-Responders | ||
| Data Element | Responders | Non-Responders |
| AGE | ||
| 50-54 | 28% | 35% |
| 55-59 | 27% | 36% |
| 60-64 | 22% | 20% |
| 65-69 | 17% | 16% |
| 70+ | 4% | 3% |
| Median Age | 58 years | 57 years |
| GENDER | ||
| Male | 49% | 38% |
| Female | 51% | 62% |
| MARITAL STATUS | ||
| Married | 38% | 47% |
| INCOME | ||
| $15,000 | 4% | 4% |
| $15,000 - $19,999 | 2% | 2% |
| $20,000 - $29,999 | 8% | 8% |
| $30,000 - $39,999 | 14% | 16% |
| $40,000 - $49,999 | 19% | 21% |
| $50,000 - $59,999 | 16% | 15% |
| $60,000 - $74,999 | 13% | 13% |
| $75,000 - $99,999 | 16% | 15% |
| $100,000 - $124,999 | 6% | 5% |
| $125,000 - $149,999 | 1% | 1% |
| $150,000 - $249,999 | 1% | 1% |
| $250,000 plus | 0% | 0% |
| Median | $50,000 - $59,999 | $40,000 - $49,999 |
| HOMEOWNER | ||
| Yes | 55% | 57% |
| Median home value | $76,000 | $75,000 |
| EDUCATION | ||
| 9th Grade | 0% | 0% |
| 12th Grade | 1% | 1% |
| HS Diploma | 9% | 10% |
| Some College | 73% | 73% |
| Associate Degree | 8% | 7% |
| Bachelor's Degree | 9% | 9% |
| Graduate Degree | 0% | 0% |
| LOCATION | ||
| Media market | 75% | 72% |
| TABLE G: Nevada Responders vs. Non-Responders | ||
| Data Element | Responders | Non-Responders |
| AGE | ||
| 50-54 | 25% | 32% |
| 55-59 | 26% | 28% |
| 60-64 | 24% | 21% |
| 65-69 | 19% | 16% |
| 70+ | 5% | 3% |
| Median Age | 59 years | 57 years |
| GENDER | ||
| Male | 48% | 37% |
| Female | 52% | 63% |
| MARITAL STATUS | ||
| Married | 35% | 46% |
| INCOME | ||
| $15,000 | 6% | 6% |
| $15,000 - $19,999 | 2% | 2% |
| $20,000 - $29,999 | 5% | 4% |
| $30,000 - $39,999 | 8% | 9% |
| $40,000 - $49,999 | 12% | 12% |
| $50,000 - $59,999 | 12% | 12% |
| $60,000 - $74,999 | 17% | 17% |
| $75,000 - $99,999 | 23% | 24% |
| $100,000 - $124,999 | 10% | 10% |
| $125,000 - $149,999 | 3% | 3% |
| $150,000 - $249,999 | 3% | 2% |
| $250,000 plus | 0% | 0% |
| Median | $60,000 - $74,999 | $60,000 - $74,999 |
| HOMEOWNER | ||
| Yes | 61% | 67% |
| Median home value | $123,000 | $122,000 |
| EDUCATION | ||
| 9th Grade | 0% | 0% |
| 12th Grade | 3% | 3% |
| HS Diploma | 16% | 16% |
| Some College | 69% | 68% |
| Associate Degree | 8% | 7% |
| Bachelor's Degree | 4% | 5% |
| Graduate Degree | 0% | 0% |
| LOCATION | ||
| Media market | 92% | 93% |
| TABLE H: New Jersey Responders vs. Non-Responders | ||
| Data Element | Responders | Non-Responders |
| AGE | ||
| 50-54 | 32% | 36% |
| 55-59 | 27% | 27% |
| 60-64 | 22% | 20% |
| 65-69 | 16% | 15% |
| 70+ | 3% | 3% |
| Median Age | 58 years | 57 years |
| GENDER | ||
| Male | 50% | 36% |
| Female | 50% | 64% |
| MARITAL STATUS | ||
| Married | 35% | 56% |
| INCOME | ||
| $15,000 | 1% | 2% |
| $15,000 - $19,999 | 1% | 1% |
| $20,000 - $29,999 | 3% | 3% |
| $30,000 - $39,999 | 5% | 6% |
| $40,000 - $49,999 | 8% | 8% |
| $50,000 - $59,999 | 9% | 10% |
| $60,000 - $74,999 | 15% | 15% |
| $75,000 - $99,999 | 26% | 26% |
| $100,000 - $124,999 | 16% | 15% |
| $125,000 - $149,999 | 7% | 6% |
| $150,000 - $249,999 | 9% | 8% |
| $250,000 plus | 1% | 1% |
| Median | $75,000 - $99,999 | $75,000 - $99,999 |
| HOMEOWNER | ||
| Yes | 71% | 80% |
| Median home value | $182,000 | $178,000 |
| EDUCATION | ||
| 9th Grade | 0% | 0% |
| 12th Grade | 3% | 3% |
| HS Diploma | 14% | 15% |
| Some College | 40% | 41% |
| Associate Degree | 11% | 11% |
| Bachelor's Degree | 31% | 29% |
| Graduate Degree | 0% | 0% |
| LOCATION | ||
| Media market | 0% | 0% |
| TABLE I: Virginia Responders vs. Non-Responders | ||
| Data Element | Responders | Non-Responders |
| AGE | ||
| 50-54 | 31% | 34% |
| 55-59 | 27% | 28 |
| 60-64 | 22% | 20% |
| 65-69 | 16% | 15% |
| 70+ | 3% | 3% |
| Median Age | 58 years | 57 years |
| GENDER | ||
| Male | 47% | 47% |
| Female | 53% | 53% |
| MARITAL STATUS | ||
| Married | 38% | 49% |
| INCOME | ||
| $15,000 | 3% | #5 |
| $15,000 - $19,999 | 2% | 2% |
| $20,000 - $29,999 | 7% | 7% |
| $30,000 - $39,999 | 12% | 13% |
| $40,000 - $49,999 | 15% | 15% |
| $50,000 - $59,999 | 12% | 12% |
| $60,000 - $74,999 | 13% | 13% |
| $75,000 - $99,999 | 18% | 17% |
| $100,000 - $124,999 | 9% | 8% |
| $125,000 - $149,999 | 4% | 3% |
| $150,000 - $249,999 | 5% | 5% |
| $250,000 plus | 1% | 1% |
| Median | $60,000 - $74,999 | $50,000 - $59,999 |
| HOMEOWNER | ||
| Yes | 67% | 73% |
| Median home value | $101,000 | $98,000 |
| EDUCATION | ||
| 9th Grade | 0% | 0% |
| 12th Grade | 3% | 3% |
| HS Diploma | 20% | 21% |
| Some College | 40% | 42% |
| Associate Degree | 9% | 8% |
| Bachelor's Degree | 26% | 24% |
| Graduate Degree | 1% | 1% |
| LOCATION | ||
| Media market | 66% | 67% |
APPENDIX B: SHIP AGENCY ENCOUNTER FORM
Instructions: Long-Term Care Awareness Campaign SHIP Encounter Form
Thank you for taking the time to collect some basic information about the individual requesting long-term care counseling information.
The information on this form is critical to our evaluation of the "Own Your Future" Long-term Care Awareness Campaign. It is strictly confidential and will be used only for research purposes. Individuals will not be identified and their responses will be aggregated with all other respondents in the Campaign. Individuals may refuse to answer any or all items. Their responses (or refusal to respond) will not in any way affect their Medicare or Medicaid benefits.
Brief instructions for each data elements follow.
Date: Please provide the date on which your contact with the individual is taking place.
Name and Zip Code: Please provide both the first and last name of the individual you are counseling. Please also provide their home zip code This information will only be used for research purposes to match the individual with our database used in the direct mail campaign so that we can track whether people who received the Campaign mailings sought out information from their local SHIP agency. We need both name and zip code to facilitate a match.
Demographic Information: Please indicate the individual's age range, gender, marital status, education, whether they own a home and whether they have children. This will help us better understand the personal situation of people who seek SHIP counseling.
Contact type: Please indicate whether the counseling is in-person or telephonic.
Planning Tool Kit. Please indicate whether the individual has already received the Long-term Care Planning Tool Kit prior to inquiring with their SHIP agency?
Who is the information for: Please indicate whether the individual is seeking information for themselves (and/or a spouse) or some other friend or family member.
How did they hear about the Awareness Campaign? Please check all that apply and indicate how the individual heard about the Campaign. This information is critical so that we can evaluate the significant resources spent on media and direct mail outreach.
Primary LTC Topic of Interest: Please check all that apply to indicate the topics of most interest to the individual.
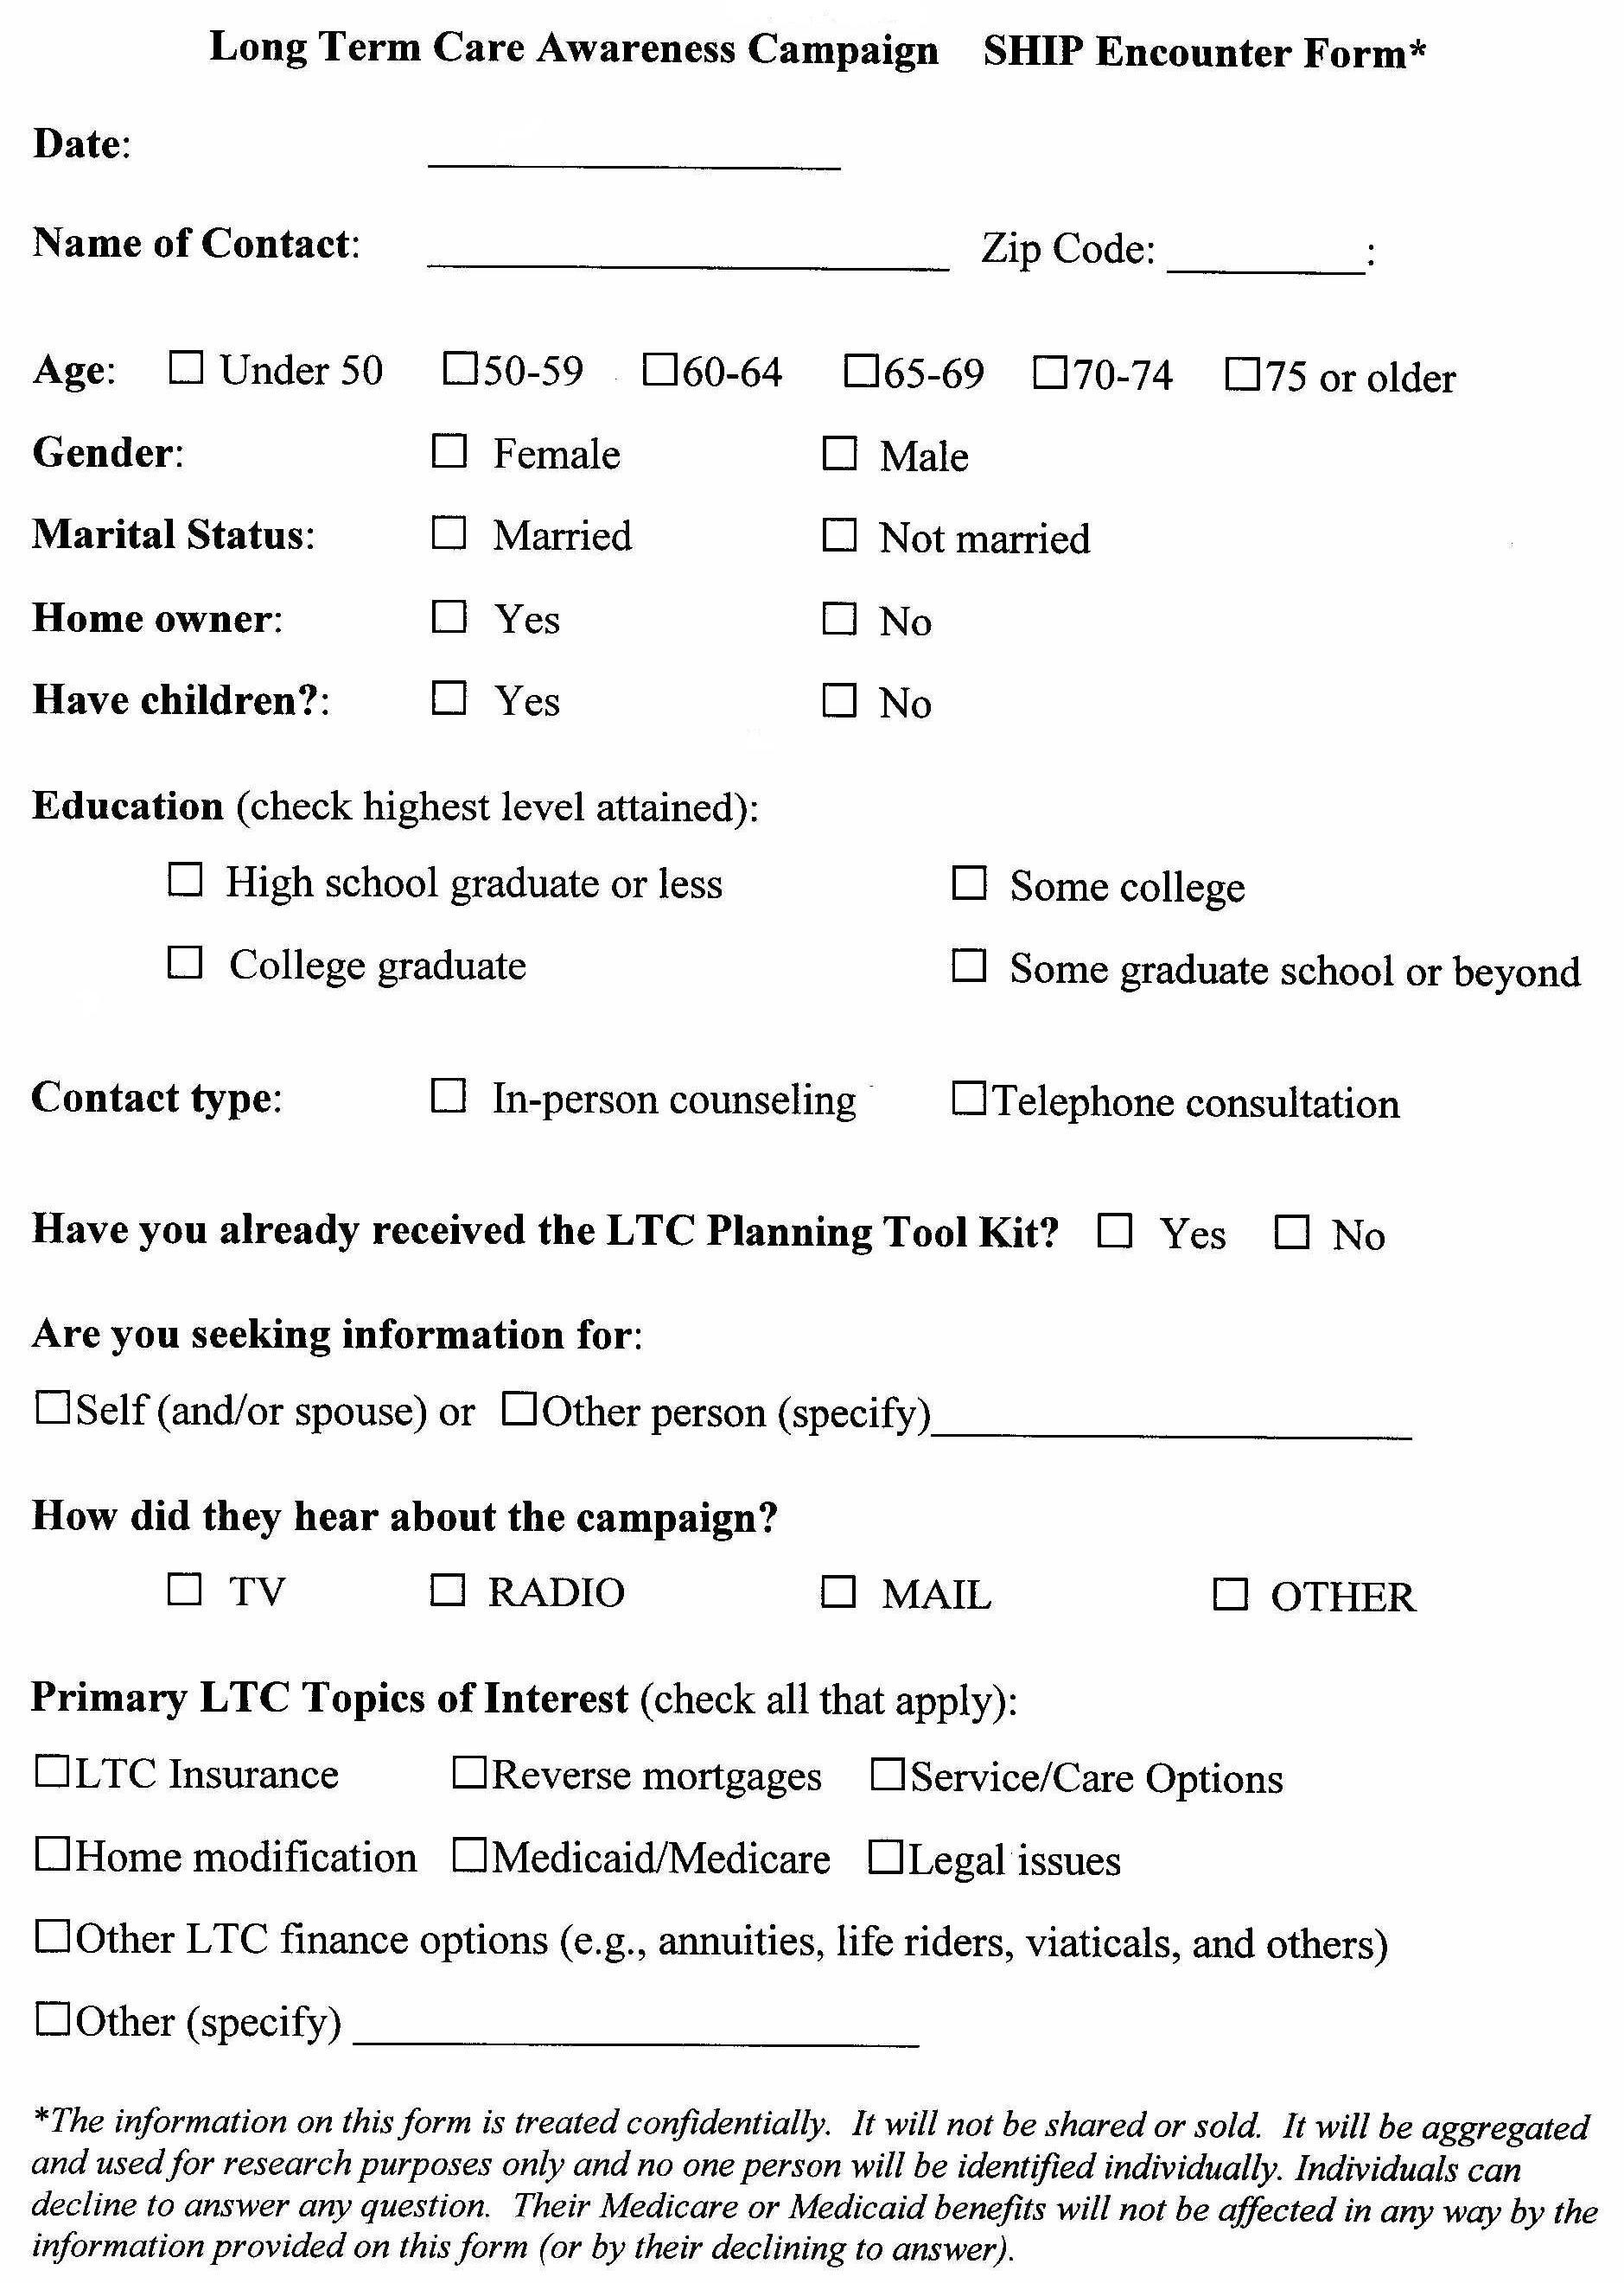
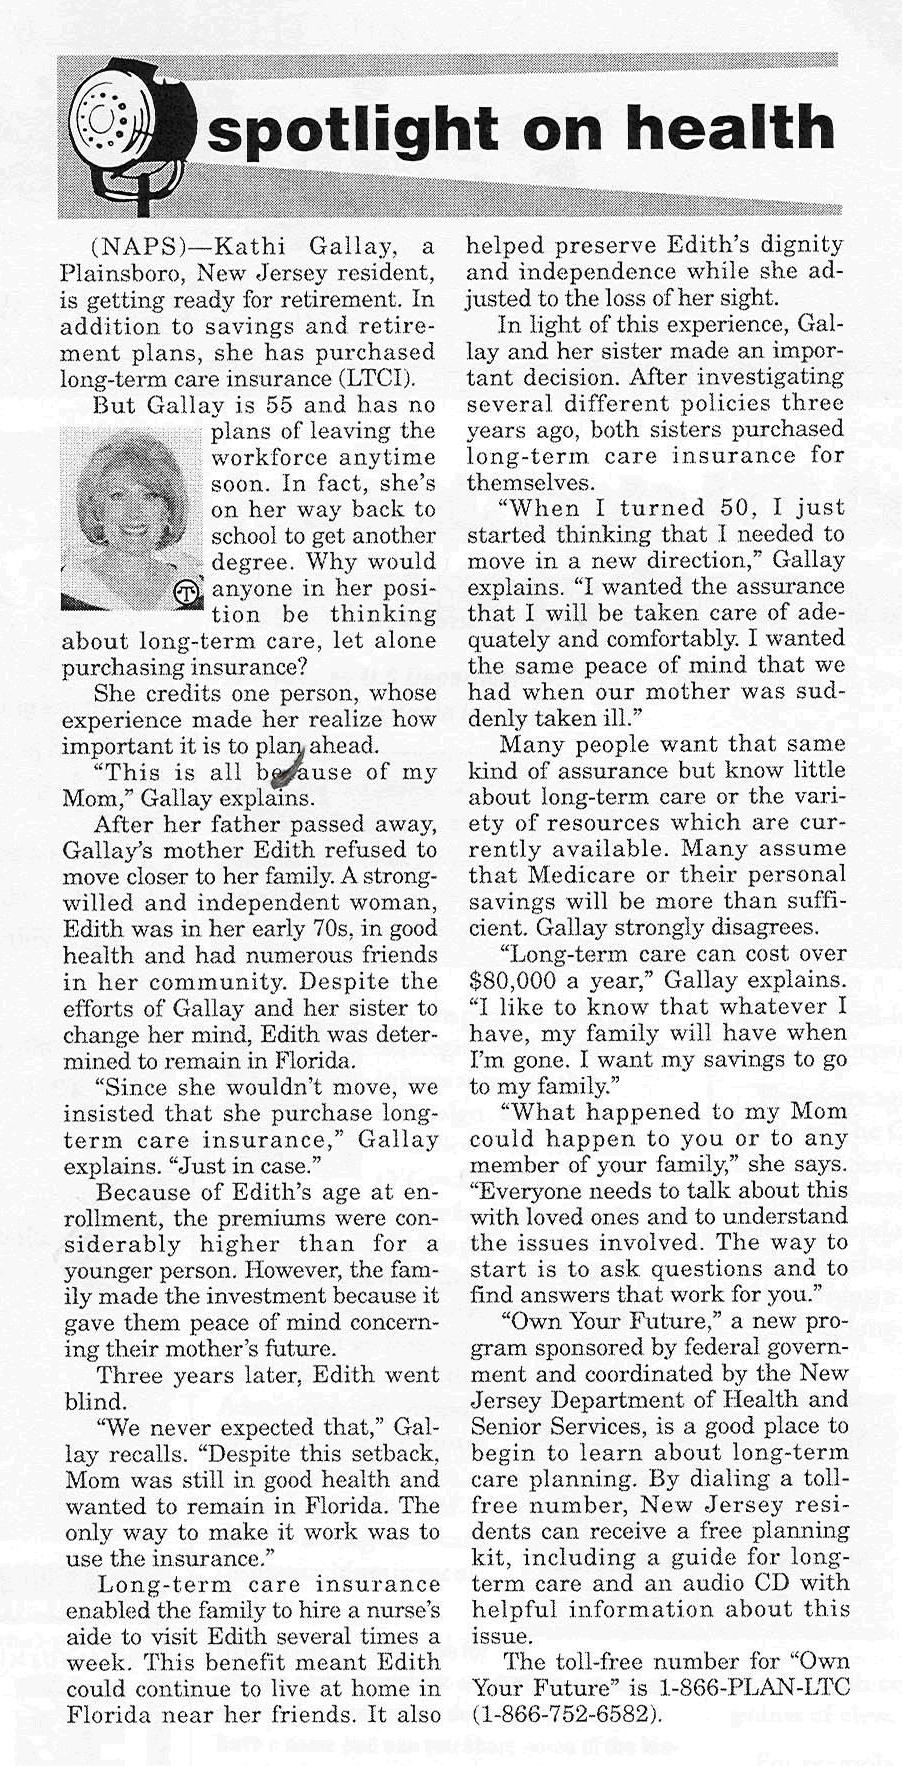
NOTES
-
The State Health Insurance Assistance Program (or SHIP) is a national program that offers one-on-one health care and insurance counseling and assistance to people with Medicare and their families. Through federal grants directed to states, SHIPs provide free counseling and assistance on a wide range of health insurance issues, including Medicare, Medicaid, long-term care insurance and supplemental insurance options. This support is provided via telephone and face-to-face interactive sessions, public education presentations and programs, and media activities. Approximately two-thirds of the country's SHIP agencies are located within a state's Department of Aging, while the remaining third are housed within a state's Insurance Department.