
U.S. Department of Health and Human Services
Searching for a Needle in a Haystack: Creative Use of the Decennial Census Dress Rehearsal Data to Find Board and Care Places in Central Missouri
Mary Naifeh andWilliam Downs
Bureau of the Census, Housing and Household Economics Statistics Division
February 1992
PDF Version: http://aspe.hhs.gov/daltcp/reports/1992/haystk.pdf (65 PDF pages)
This report was prepared under contract between the U.S. Department of Health and Human Services (HHS), Office of Family, Community and Long-Term Care Policy (now the Office of Disability, Aging and Long-Term Care Policy (DALTCP)) and the Bureau of the Census. For additional information about the study, you may visit the DALTCP home page at http://aspe.hhs.gov/_/office_specific/daltcp.cfm or contact the office at HHS/ASPE/DALTCP, Room 424E, H.H. Humphrey Building, 200 Independence Avenue, SW, Washington, DC 20201. The e-mail address is: webmaster.DALTCP@hhs.gov. The DALTCP Project Officer was Robert Clark.
The opinions and views expressed in this report are those of the authors. They do not necessarily reflect the views of the Department of Health and Human Services, the contractor or any other funding organization.
TABLE OF CONTENTS
- APPENDICES
- APPENDIX A: Dress Rehearsal Counties
- APPENDIX B: Group Quarters Categories
- APPENDIX C: Dress Rehearsal Disability Questions
- APPENDIX D: Facsimile of Survey Questionnaire
- APPENDIX E: Field Debriefing Memo
- APPENDIX F: Computations for Ratio of Identified to Expected Number of Board and Care Places
- APPENDIX G: Computations for Estimates of Board and Care Places
- APPENDIX H: CPS, March 1990, Table 16, Number of Nonrelatives in Household
- LIST OF FIGURES
- FIGURE 1: Board and Care Status by 1988 Dress Rehearsal Frame
- FIGURE 2: Services Provided by Board and Care Places
- FIGURE 3: Disabilities of Persons in Housing Units: Board and Care Population
- FIGURE 4: Disabilities of Persons in Group Quarters: Board and Care Population
- FIGURE 5: Age of Nonrelatives in Housing Units and Group Quarters
- FIGURE 6: Age and Disability of Population in Board and Care Housing Units
- LIST OF TABLES
- TABLE 1: Number of Places in Each Frame
- TABLE 2: Outcome of Survey
- TABLE 3: Board and Care Status of the 326 Places Initially Defined as Board and Care
- TABLE 4: Board and Care Status by Survey Frame
- TABLE 5: Board and Care Status in 1990 by Type of Place and Same/Difference from 1988
- TABLE 6: Presence of Nonrelatives at Time of Survey and Prior 3 Years
- TABLE 7: Number of Nonrelatives in Board and Care Housing Units and Group Quarters
- TABLE 8: Board and Care Places Providing Indicated Service
- TABLE 9: Combinations of Service Provided by Board and Care Places: Frequencies and Percent of Places
- TABLE 10: Group Quarters by Board and Care Status
- TABLE 11a: Single Disabilities by Type of Place
- TABLE 11b: Disability Combinations by Type of Place
- TABLE 12: Age Groups by Type of Place
- TABLE 13: Age by Disability by Type of Place
- TABLE 14: Social Security and Veterans Administration Disability Payments
- TABLE 15: Unit Ownership or Operation
- TABLE 16: Number and Percent of Licensed Places From the Lewin/ICF List Which Match the Board and Care Survey Places
- TABLE 17: Survey Frame of Matched Places
- TABLE 18: Description of Places Which Are on Both the Survey and Lewin/ICF List
EXECUTIVE SUMMARY
PURPOSE
The purpose of this survey is to determine 1) whether the Census provides a suitable frame for selecting board and care places and 2) whether the questionnaire will elicit sufficient information to identify such places. Board and care places are housing units or group quarters which provide room, meals and one or more services to dependent persons. The services center on activities of daily living or instrumental activities of daily living. They can be as concrete as assisting the dependent person with eating or as abstract as providing protective oversight.
METHODS
Drawn from the central Missouri census dress rehearsal file, the survey included three frames. Two were housing units and one was group quarters. The housing unit frames were designated by the number of nonrelatives and, in some cases, the presence of a disabled household member. The nonrelatives were classified as housemate, roommate, boarder, roomer, foster child or other nonrelative. All households with three or more nonrelatives were included in the survey. Since the number of households with one or two nonrelatives was very large and since there was a limited budget, additional criteria were used to select households with one or two nonrelatives. Households with one or two nonrelatives in the above specified categories were included if they were long form respondents and they had a disabled member in the household.
The Group Quarters were selected by category. we included every place in the categories designated by the sponsor. The categories were selected to be inclusive.
The survey was conducted in three stages: 1) a mail out/ mail back questionnaire with a second mailing to places which did not respond within three weeks, 2) a telephone followup, and 3) personal visits.
FINDINGS
-
Eighty six percent of the places provided completed questionnaires; 13 percent were vacant or no longer in existence.
-
Identified board and care places were 1.3 to 7.2 times expert estimates. Two different estimates and the decision to include or exclude group quarters account for the wide range.
-
The screening questions were effective: 3.4 percent of housing units and 37 percent of group quarters were board and care.
Unit screening questions effectively distinguished board and care places from places such as boarding homes which housed independent nonrelatives. It did not separate board and care places from those with professional care services such as skilled nursing facilities.
-
Among housing units, the proportion of board and care places is higher for places which have the same owner/renter as 2 1/2 years ago (i.e. during the dress rehearsal) (7 percent) than it is for places with a different owner or renter. It is also higher among long form respondents who reported a disabled household member in the dress rehearsal (6.6 percent) than it is among long form respondents with 3 or more nonrelatives and no disabled household member or among short form respondents with 3 or more nonrelatives with disability status not known.
-
The 5 board and care places whose survey responses led to the incorrect conclusion that they were not board and care (i.e. false negatives) included 3 units which do not provide meals and-2 places which misreported the presence of nonrelatives.
-
The 169 places whose survey responses led to the incorrect conclusion that they were board and care (i.e. false positives) included 90 places with professional services, 50 places with independent nonrelatives some of whom are quasi-families, 23 foster families and 6 schools, prisons or converted units.
-
Board and care places usually provide both protective oversight and housekeeping services. Eighty four percent of housing units and 97 percent of group quarters provide at least these two services.
-
The presence of nonrelatives, a census and unit screener, appears to be frequently misreported. Among housing units with the same owner/renter as 1988, 48 percent claim to house only relatives during the period of the dress rehearsal through the survey.
-
Provision of services to nonrelatives is also misreported. Fifty eight percent of respondents in housing units with independent nonrelatives claimed to provide one or more of the ADL (activities of daily living) or IADL (instrumental activities of daily living) services to nonrelatives. Many confused a division of labor with the provision of services.
-
Eighty percent of Group Quarters were board and care, professional care facilities or vacant/delete. However, 10 of the Group Quarter categories contain no board and care places.
-
Most (78 percent) board and care housing units have clients who have physical disabilities and/or mental problems. Most (83 percent) board and care group quarters have clients with mental problems and/or mental retardation, or physical disabilities and/or senility, or mental problems and/or substance abuse.
-
Board and care housing units in this survey usually care for either adults 65 or older only or those under 65 only. Most board and care group quarters care for both persons 65 or older and persons under 65.
-
Most board and care housing units (62 percent) have one of four disability and age combinations. They have clients with physical disabilities who are either 65 and over or under 65, or clients with mental/emotional problems who are under 65 or under 18.
-
Half of the board and care housing units and 82 percent of board and care group quarters have one or more clients who receive social security or veterans' administration payments because of their disability.
-
The match rate between the survey and the independent Lewin/ICF list of licensed places was high. Overall, 80 percent (n=107) of the licensed places on the Lewin list are in the survey. A maximum of between 10 and 27 places on the Lewin list that could have been on the survey were not on the survey.
-
The survey identified more board and care units than did the list of licensed places. There were 157 board and care places in the survey; 47 of these board and care places were not on the Lewin/ICF list of licensed places.
-
The survey identified most of the board and care housing units. The matched places were primarily from group quarters, and secondarily from the frame of 3 or more nonrelatives. One place was in the frame of 2 nonrelatives.
-
The matched places include both board and care and professional care facilities.
CONCLUSIONS AND RECOMMENDATIONS
-
The decennial census provides feasible frames for a national study of board and care places. It effectively targets housing units with a board and care population.
-
Two alternative frames of housing units for a national survey are presented. The first replicates the housing unit frames of the pretest; the second uses long form respondents only. In both alternatives, group quarters are treated separately. Either separate questionnaires are developed, or group quarters data are collected in conjunction with other surveys.
-
Recommendations which could reduce survey costs include 1) conducting research to examine characteristics of nonrelatives in survey housing units such as their age, educational status, and tenure in relation to the units' board and care status in order to eliminate places housing college students and other young adults sharing living quarters for financial or social reasons only, 2) more extensive and detailed use of reverse telephone directories, and 3) screening potential target housing units clustered in limited geographical areas.
-
Recommendations which improve data quality include 1) the development of separate questionnaires for housing units and group quarters, 2) adding questions to distinguish places providing more sophisticated professional and medical care from board and care places, 3) revising the service question or adding instructions so that the response reflects services to dependent persons, 4) obtaining data for each person rather than aggregated responses, and 5) reduction/ elimination of the "other" catch-all category.
INTRODUCTION
This report presents the results of research designed to locate and describe board and care places. The Assistant Secretary for Planning and Evaluation in the Office of the Secretary and the Office of the Assistant Secretary for Health in the Public Health Service in the U.S. Department of Health and Human Services jointly sponsored the survey. They contracted with the Bureau of the Census to conduct the survey in FY 1990 - FY 1991.
The purpose of this survey is to determine 1) whether the decennial Census provides a suitable frame for selecting board and care places and 2) whether the questionnaire will elicit sufficient information to identify such places. Board and care places are housing units or group quarters which provide room, meals and one or more services to dependent persons. The services center on activities of daily living or instrumental activities of daily living. They can be as concrete as assisting the dependent person with eating or as abstract as providing protective oversight.
Board and care places are part of a continuum of living arrangements. On one side are places that rent rooms or spaces and those which provide room and board to independent persons; on the other side are places that provide varying levels of professional services such as skilled nursing care or professional therapeutic services to dependent persons.
Neither the prevalence of board and care places nor the demand for them is known. However, several demographic trends indicate there may be an increasing need for such places. Longer life expectancy at older ages is increasing the size of the frail elderly population. At the same time, fewer family members may be available to care for elderly or other dependent family members as a result of high labor force activity by both men and women, divorce and separation and substantial geographic mobility.
SURVEY POPULATION
The survey population was drawn from the 1988 census dress rehearsal file from central Missouri. It included the City of St. Louis, all of Boone, Camden, Cole, Cooper, Franklin, Gasconade, Howard, Laclede, Maries, Miller, Moniteau, Morgan, Osage and Pulaski counties as well as parts of Audrain, Calloway, Chariton, Crawford and St. Louis counties. (See Appendix A.) This area comprises a large metropolitan center, suburbs, smaller cities and rural areas.
The final sample of 1754 included 288 group quarters, and 1466 housing units. The group quarters were all those places from the Missouri dress rehearsal classified in categories selected by the sponsors as potential board and care classes. The categories are inclusive. A wide net was cast so that any place which might be a board and care place was likely to be included. A list of the categories is in Appendix B. Since the Missouri dress rehearsal site does not have one or more places in every group quarters' classification, other census categories may include board and care places.
Two frames contributed to the 1466 housing units. They were delineated by three criteria:
- type of census form (i.e. short or long),
- number of nonrelatives of selected types, and
- a yes response to the disability questions for one or more household members.
The census dress rehearsal fielded two types of questionnaires: a short form and a long form. The long form was sent to 1 out of 6 households. The long form contains all of the questions found on the short form plus additional questions on disability and demographic characteristics. Both the short form and the long form obtained data on the relationship to householder of every household member.
Nonrelatives who were classified as
- roomer, boarder or foster child,
- housemate, roommate or
- other nonrelative
made the household a potential subject. Nonrelatives who were unmarried partners or paid employees were excluded. Subsequent discussion in this report will use the term "nonrelatives" to mean nonrelatives of the three types listed above.
There was some discussion about including the "housemate, roommate" category. Board and care places were found in each of the three nonrelative categories used by the Bureau of the census in the 1988 dress rehearsal. However, most of the places classified by the survey as board and care claimed only one type of nonrelative.
-
49 percent identified each of their nonrelatives as "roomer, boarder or foster child".
-
22 percent checked the "housemate, roommate" boxes for each of their nonrelatives.
-
22 percent checked the "other nonrelative" boxes for each of their nonrelatives.
-
6 percent checked two or three of the nonrelative types.
The disability questions were asked only on the long form and applied only to persons 15 years of age or older. (See Appendix C for the disability questions.) The disability questions ask whether a health condition of 6 or more months duration limits or prevents employment or inhibits a person's mobility or personal care activities.
The number of households with nonrelatives decreases as the number of nonrelatives in the household increases. There were 1,208 households with 3 or more nonrelatives, 2,234 households with 2 nonrelatives and 11,719 households with 1 nonrelative in the 1988 census dress rehearsal.
There were two frames for housing units. The first frame included all households with three or more nonrelatives. The second frame contains housing units with one or two nonrelatives which meet additional criteria. Because there were a large number of places with one or two nonrelatives, and there was a limited budget, all of these households could not be included. Nevertheless, there was substantial interest in collecting data on board and care housing units with one or two clients. In order to collect data within the budget constraints, a frame was designed to include a select subsample of these housing units. The stratum was chosen in such a way that selected units were more likely to be board and care than those drawn from a random sample. This frame included all of the long form respondent households with one or two nonrelatives which had one or more disabled members over the age of 15. The added specifications of long form respondents and a disabled household member over 15, radically decreased the number of eligible households to 258 units while probably increasing the likelihood that they would be board and care. Since many board and care places are assumed to have few members it was important to include the units with only one or two nonrelatives. This frame is subdivided into housing units with one nonrelative and housing units with two nonrelatives.
| TABLE 1. Number of Places in Each Frame | |
| N | Frame |
| 1208 | 3 or more nonrelatives |
| 48 | long form, 2 nonrelatives, one or more members disabled |
| 210 | long form, 1 nonrelative, one or more members disabled |
| 288 | group quarters |
The four frames for housing units and group quarters and the number of units in each frame are shown in Table 1. Note that for long form frames with 1 or 2 nonrelatives, the household member with a disability is not necessarily a nonrelative.
Since the first frame contains both short and long form respondents with 3 or more nonrelatives and since the long form provides data about household members with a disability, this frame is subdivided when it is pertinent to do so. Of the 1208 housing units in the frame with 3 or more nonrelatives,
- 1094 are short form respondents,
- 86 are long form respondents with no disabled household member and
- 28 are long form respondents with one or more disabled residents.
Some cautionary notes must be sounded. Long form response rates with sample data for the census dress rehearsal were approximately 90 percent of those mailed out. That is, 10 percent of long form respondents either did not return their questionnaire or the data which was on the long form portion (i.e. sample data) was blank. This ultimate response rate is lower than typical census response rates. Furthermore, this lower response rate is exacerbated by differential response rates. Typically, response rates are higher for educated, middle-class, suburbanites than for their counterparts. The subpopulation most likely to respond may be one of the least likely to operate board and care homes.
QUESTIONNAIRE DEVELOPMENT
The questionnaire was designed with the small board and care home in mind. Subject experts suggest that the modal caregiver is likely to be a female with limited education. Consequently, every effort was made to keep the language and concepts as simple as possible and to limit skip patterns. As a result, most questions required checking the appropriate box or writing in the number of people with a given characteristic. Appendix D has a replica of the questionnaire.
There were three skip patterns but only one would have applied to board and care places. That is, respondents for board and care places would respond to all of the questions in the order presented unless they had no nonrelatives living with them at present. In this case they would skip one question about the number of nonrelatives (# 6b). Places which were not board and care ideally would have skipped to the last question either after the two questions about the presence of nonrelatives (# 6a and 7) or after the questions about services (# 8a through 8i).
Some questions on the questionnaire were culled from related surveys and modified for the target population; other questions were developed specifically for this survey. The questions asked about the type of unit or place, its existence at the time of the census dress rehearsal, services provided, existence, number and characteristics of clients/patients at the present or the past three years.
The questionnaire was pre-tested on nine Board and Care places in the Washington, D.C. area. Eight were small residential units and one was a large group quarters. Some questions were modified as a result of this pretest.
DATA COLLECTION
The questionnaire was fielded in three stages. The first stage was mail out/ mail back; the second was a telephone follow-up; the third stage was a personal visit.
Following OMB approval, the first wave of the mail out/ mail back was sent in November, 1990. It was sent to all housing units and group quarters with a unique address. Some group quarters had duplicate address listings. These were held back for personal visit only. For the places with duplicate address listings, Field division was advised that there may be more than one unit at a given address and the places may have diverse populations. Eighteen percent (n=306) returned their questionnaires from the first mail out.
A second questionnaire was mailed in early December, 1990 to each unit with a unique address which did not respond to the first questionnaire. Places which the post office returned as vacant or could not find were not sent a second questionnaire. The field staff confirmed that vacant places were, in fact, unoccupied. Ten percent (n=176) returned questionnaires from the second wave. Typical for surveys, the total return for the mail out/mail back stage was 28 percent (n=482).
At the beginning of the field work, headquarters staff provided telephone numbers for 45 percent of the places. Reverse directories were the source for most of the numbers. Generally, these directories cover only urban areas. In this instance one Haynes directory covered the St. Louis metropolitan area, a second Haynes directory covered outlying suburbs of St. Louis and a Polk directory covered the Columbia metropolitan area. The Haynes directory indicates the number of years the resident has lived at the given address. This was valuable information since the dress rehearsal occurred two and one half years before the survey.
The initial telephone response rate of 68% of the 99 units assigned to telephone interview suggests that reverse directories are cost effective. However, the timing and duration of the telephone interview stage probably reduced the overall rate. Since survey response rates typically are low during the Christmas holidays, a hiatus in activity was anticipated. However, some telephone followup commenced. Ultimately census employees obtained complete interviews by telephone from 287 places resulting in completion of 23 percent of the remaining interviews or 16 percent of the total survey population.
Census field representatives completed the remaining 964 interviews during the personal visit phase. Interviewers were tenacious. Many made several personal calls in an effort to locate the respondent. The disposition of the remaining 21 interviews is not known because they were not classified in the boxes for the disposition of cases.
Complete interviews with the owner, renter, spouse, proprietor, manager, or assistant manager were obtained for most of the sample. Table 2 reveals that 86 percent (n=1501) answered the applicable questions. A few additional interviews (n=6) were completed by proxies. Nine percent (n=161) of the places were vacant and four percent (n=74) of the addresses were deletes because the unit does not exist. Fewer than six cases occurred in any of the other categories: partial interview, refused, noninterview and last resort.
| TABLE 2. Outcome of Survey | ||
| Survey | Outcome | Percent |
| Complete interview: target | 1502 | 85.6 |
| Partial interview: target | 2 | 0.1 |
| Complete interview: proxy | 6 | 0.3 |
| Refused | 4 | 0.2 |
| Noninterview: other | 2 | 0.1 |
| Vacant | 160 | 9.1 |
| Delete | 73 | 4.2 |
| Last resort | 5 | 0.3 |
Some of the questionnaires may have been forwarded or misdirected because of ambiguous addresses. One hundred fifty five respondents indicated that their address was different from that of the address label. Most of these (n=105) were addressed to a Rural Route, P.O. Box, General Delivery, city name only or individual name and city. Two additional questionnaires were addressed to trailer parks. These 107 account for 69% of those who indicated their address differed from that on the label. In addition, fourteen had designations such as 1/2 (e.g. 4537 1/2 Main St.) or apartment numbers. Some respondents noted that the post office changed their address from the one on the label.
Approximately 7 weeks into the personal visit followup, one of the sponsors and the project managers made a site visit to St. Louis. Each one accompanied one of the field representatives on interviews in the morning. In the afternoon, the field representatives and their supervisors discussed their observations of the data collection. The report of the Field Coordinator is in Appendix E.
DATA REVIEW AND EDIT
The central purpose of this research is to evaluate how well the screening questions identify board and care places. These are defined as facilities which provide meals and one or more other services to nonrelatives. It was apparent that the collected data did not separate board and care places from those which provide professional care such as hospitals and skilled nursing facilities. In addition, there were some anomalous results such as places that provide services but no meals to nonrelatives and places that claim to provide services to nonrelatives while stating that they house only relatives.
In order to assess the research results more carefully, the project manager reviewed the questionnaires of three groups of places:
- those that claimed to provide services but no meals (n=38),
- those that claimed to house only relatives presently and in 1988 but which also stated they provide services to non relatives (n=11), and
- those that qualified as board and care places (n=326).
If comments or information on the questionnaire clarified the nature of the place, the board and care status was edited to reflect the additional information. In most cases telephone calls to respondents were necessary to ascertain whether the unit was a board and care place.
FALSE NEGATIVES
Among the 38 places in the first category, 3 units not initially classified as board and care were reclassified as a result of this review. These places do provide services to dependent nonrelatives. For example, one of the places provides services to substance abusers but each person prepares his/her own meals.
Most (i.e. 31) of the units housed nonrelatives who were roommates or who rented rooms or space in the respondent's unit. Four were unusual cases. They illustrate the difficulty of classifying some places. None of these four are classified as board and care places in this survey.
Two of the four housed roommates who had been in the state hospital for the mentally ill. The two roommates shared chores and helped each other. Some services were provided by a third party but that party did not reside in the unit. Specifically, an agency returned a certain amount of their check to them for their budgeted expenses.
Another residence housed two single parents, one with three children and the other with one. In addition, three juveniles who were put out of their own homes lived there. It was the researcher's impression that this was an informal arrangement.
In the fourth instance, the respondent rented space to his foster son and the foster son's wife and child. The foster son and his family, in turn, provided room and services to an elderly man who was unrelated to them.
Eleven of the 621 respondents (1.77 percent) who stated that no nonrelatives currently reside at the unit and none resided there during the past three years claimed to provide one or more services to nonrelatives. Two of these places actually house nonrelatives. These are board and care places and were reclassified as such. The other 9 house relatives only. These respondents missed or ignored the skip pattern. Their board and care status remained unchanged.
FALSE POSITIVES
The third and most important review covered all places that initially qualified as board and care. Three hundred twenty six of the 1754 (18.59%) claimed to provide services to nonrelatives and had nonrelatives currently living at the residence and/or had nonrelatives living there during the prior 3 years. It was clear that at least some of these were likely to provide more sophisticated services than typical board and care places. Address labels suggested that medical hospitals, psychiatric facilities and other group quarters with professional services were included in the sample frames.
The data from the questionnaire discriminated board and care places from boarding houses and places that housed college roommates; they did not separate board and care places from professional care facilities such as hospitals.
Each of the questionnaires was reviewed and, in many cases a follow up telephone call was made to obtain the data needed to classify the unit in question.
Table 3 shows the number and categories of the 326 units initially defined as board and care. It is divided into those which we classified as board and care and those we classified as not board and care.
| TABLE 3. Board and Care Status of the 326 Places Initially Defined as Board and Care | ||
| Number | Percent | |
| BOARD AND CARE PLACES | ||
| Board & Care | 76 | 23.3 |
| Board & Care: Nonrelatives wrong | 2 | 0.61 |
| Board and Care but no meals | 3 | 0.92 |
| Group home | 23 | 7.06 |
| Residential Care Facility I | 16 | 4.91 |
| Residential Care Facility II | 16 | 4.91 |
| Residential Care Facility: d.k. level | 6 | 1.84 |
| Residential Care Facility & ICF | 3 | 0.92 |
| Board & Care + professional services | 1 | 0.31 |
| Drug/alcohol abuse | 6 | 1.84 |
| Facility for mentally retarded | 2 | 0.61 |
| Dont know: probably board & care | 3 | 0.92 |
| EXCLUDED FROM BOARD AND CARE | ||
| Intermediate Care Facility (ICF) | 16 | 4.9 |
| Skilled Nursing Facility (SNF) | 37 | 11.3 |
| ICF & Skilled Nursing Facility | 3 | 0.92 |
| Nursing level not specified | 13 | 3.99 |
| General hospital | 3 | 0.92 |
| Psychiatric facility | 14 | 4.29 |
| Physical rehabilitation | 5 | 1.53 |
| Boarding school | 4 | 1.23 |
| Foster parent | 23 | 7.06 |
| Rent room with services | 5 | 1.53 |
| Rooming house or staff residence | 2 | 0.61 |
| Religious men or women | 22 | 6.75 |
| Roommates or fraternities | 17 | 5.21 |
| Cohabiting adults with children | 3 | 0.92 |
| Duplicate | 2 | 0.61 |
Of the 326 places initially classified as board and care, 48 percent ( n=157) retained the designation. For purposes of this analysis board and care places include both state licensing categories (e.g. RCF I, group home) and descriptive categories (e.g., places treating substance abuse).
Most (i.e. 169) of these 326 units are not board and care. These are false positives. The largest group (n=90) includes places with substantial professional services such as nursing homes with skilled or intermediate nursing care, and general and psychiatric hospitals. The second largest group (n=49) is independent nonrelatives, some of whom are quasi-families. For example, one household houses the former live-in housekeeper who is now elderly. Many are groups of religious men or women who may care for elderly members. The third group is foster parents (n=23). There are only one or two places in each of the other categories. These categories are:
- prisons which provide or provided skilled care in the past but whose essential identification is that of a prison,
- schools for the blind or deaf,
- doctors offices converted from other uses which may have been board and care.
Although no tallies were kept, it is the project manager's impression that many of the respondents reinterviewed by phone identified their place by state licensing terms such as "RCF" or "group home". Pre-test questionnaire respondents tended to use the terms of the District of Columbia's licensing agency. This suggests that future research may find it effective to use locally relevant categories in addition to descriptors to identify places. The locally relevant terms would facilitate accurate response of licensed places. Its effect on unlicensed places is not known.
EXPERT ESTIMATES OF BOARD AND CARE PLACES
The census screeners proved effective in narrowing the search for the board and care subpopulation needle in the demographic haystack. The ratio of survey board and care places to expected board and care places range from a minimum of 1.3, or 30 percent more places than expected, to a high of 7.2 times the number of expected places.
Experts had estimated that between one-twentieth and one-tenth of one percent of all places (i.e. housing units and group quarters) are board and care facilities. We estimate how many board and care places we would expect to find using these percentages for housing units alone and for housing units and group quarters combined.
Although the estimated percentages are believed to apply to housing units and group quarters combined, we also calculate the more conservative estimate of housing units only. The ratio of the survey board and care housing units to the estimated board and care housing units will be lower than comparable figures for housing units and group quarters because there are relatively few group quarters in the dress rehearsal site and because they comprise the majority of board and care places in the survey. In other words, when using housing units only rather than housing units and group quarters, the total number of units is only marginally smaller but the number of survey board and care units is substantially smaller. (Appendix F shows the computations annotated with explanations.)
The simplifying assumption in these calculations is that the dress rehearsal file contains all housing units and group quarters. Although roughly 10 percent of long form respondents either did not respond or did not provide sample data, this assumption is consistent with the fact that places lacking data could not enter the survey population. Applying these two estimates of one-tenth and one-twentieth of one percent to the 394,425 housing units and group quarters in the Missouri dress rehearsal site (i.e. returned questionnaires) gives estimates of 394 and 197 board and care places respectively. Assuming an even distribution of places among all group quarters and housing units with nonrelatives in the selected categories, the resulting percentages yield 43 expected board and care places for the one tenth of 1 percent estimate and 22 expected places for the one-twentieth of 1 percent estimate.
Among housing units and group quarters in the survey, 157 of the 1754 places (9 percent) were identified as board and care. Depending on which estimate (one-tenth or one-twentieth of 1 percent) is used, this represents between 3.6 and 7.2 times the expected number of board and care places.
Since group quarters comprise a small part of the base but a large part of the board and care units and since group quarters were selected by their category names, estimates are made for housing units only. For housing units only the estimate of board and care units are 38 and 19 for one-tenth and one-twentieth of one percent respectively. The 50 board and care housing units identified in the survey are 1.3 (for one-tenth of one percent) and 2.6 (for one-twentieth of one percent) times the expected number of board and care places.
EFFECTIVENESS OF THE CENSUS SCREENER
We turn now to the survey results. The results give the percentage of survey units or survey units of a given type which exhibit the characteristics in question. They are not estimates for the dress rehearsal site.
For the units in the survey, 37 percent of group quarters and 3.4 percent of housing units are board and care. Since group quarters were included on the basis of their category and housing units were targeted primarily on the basis of the number of nonrelatives, it is not surprising that group quarters include more board and care units.
The 3.4 percent of housing units which are board and care places is an average across the frames. For purposes of comparison, the frame for 3 of more nonrelatives is subdivided by census form and, for long form respondents, presence of disabled members. Figure 1 and Table 4 reveal the notable differences between the frames. The use of long form respondents in conjunction with the disability question yields higher proportions of board and care places than short form respondents.
| FIGURE 1. Board and Care Status by 1988 Dress Rehearsal Frame |
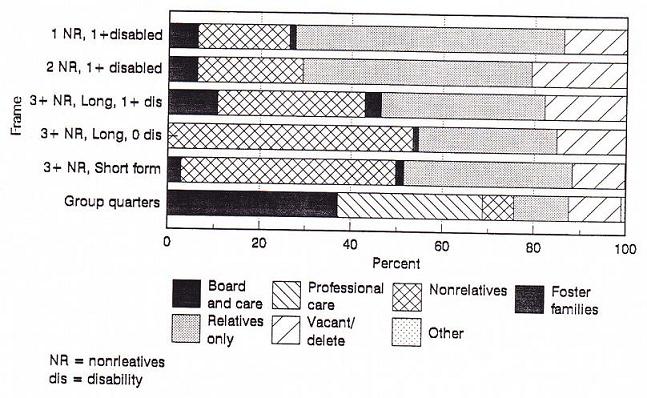 |
Both the number and percentage of board and care places is small. Only 3 percent of short form respondents (n=31) and 3 percent of long form respondents with three or more nonrelatives are board and care units. However, if long form respondents with three or more nonrelatives are separated according to whether or not there is a disabled household member the results are striking. Though small in number, 11 percent of long form respondents having 3 or more nonrelatives and a disabled household member are board and care places (3 units). In contrast, none of the long form respondents with three or more nonrelatives but no disabled member are board and care. The percentages are intermediate and similar for long form respondents with one or two nonrelatives and at least one disabled person. Six percent of each frame (13 units and 3 units respectively) are board and care units.
Given the difference in the selection and outcome of group quarters vis a vis housing units, the analysis in this report is done separately for these two categories.
| TABLE 4. Board and Care Status by Survey Frame(Frequencies and Column Percentages) | ||||||||
| Board and Care Status | Frame (# of nonrelatives disability, census form) | |||||||
| Housing Units | Group Quarters | Total | ||||||
| Total | 1 1+ Long | 2 1+ Long | 3+ 1+ Long | 3+ 0 Long | 3+ d.k. Short | |||
| Board & Care | 503.41 | 136.19 | 36.25 | 310.71 | 00 | 312.83 | 10737.15 | 157 |
| Nonrelatives | 62242.43 | 4220 | 1122.92 | 932.14 | 4653.49 | 51446.98 | 206.94 | 642 |
| Foster parent(s) | 241.64 | 31.43 | 00 | 13.57 | 11.16 | 191.74 | 00 | 24 |
| Professional care facility | 00 | 00 | 00 | 00 | 00 | 00 | 9131.6 | 91 |
| Prison, school, doctors office | 20.14 | 00 | 00 | 00 | 00 | 20.18 | 20.69 | 4 |
| Relatives only | 58539.9 | 12358.57 | 2450 | 1035.71 | 2630.23 | 40236.75 | 3411.81 | 619 |
| Vacant/delete/other | 18312.48 | 2913.81 | 1020.83 | 517.86 | 1315.12 | 12611.52 | 3411.81 | 217 |
| Total | 1466 | 210 | 48 | 28 | 86 | 1094 | 288 | 1754 |
STABLE PLACES
Since some places changed hands between the dress rehearsal in March, 1988 and the survey in November, 1990, a refinement of these figures for board and care places is possible by separating those places which had the same owner, renter or facility in the 1988 dress rehearsal from those which commenced operations or had a change of owner/renter since March, 1988.
| TABLE 5. Board and Care Status in 1990 by Type of Place and Same/Different fro 1988(Frequencies and Column Percentages) | ||||||
| Same as 1988 | Different from 1988 | |||||
| Housing Units | Group Quarters | Total | Housing Units | Group Quarters | Total | |
| Board & Care | 476.75 | 10542.86 | 152 | 30.51 | 222.22 | 5 |
| Nonrelatives | 28240.52 | 166.53 | 298 | 33657.24 | 333.33 | 339 |
| Foster parent(s) | 243.45 | 00 | 24 | 00 | 00 | 0 |
| Professional care facility | 00 | 8835.92 | 88 | 00 | 222.22 | 2 |
| Prison, school, doctors office | 20.29 | 20.82 | 4 | 00 | 00 | 0 |
| Relatives only | 33748.42 | 3213.06 | 369 | 24341.4 | 222.22 | 245 |
| Vacant/delete/other | 40.57 | 20.82 | 6 | 50.85 | 00 | 5 |
| Total | 696 | 245 | 941 | 587 | 9 | 596 |
| Missing | 217 | |||||
Table 5 shows that for residences which house the same owner or renter as April, 1988, seven percent of the housing units are board and care. This is double the 3.4 percent of all housing units which are board and care. Only one half of one percent of those residential units which claimed to be living elsewhere in April of 1988 were board and care units in late 1990.
The results are less dramatic for group quarters. Forty three percent of the places which existed in April of 1988 compared to 37 percent of all group quarters are board and care.
Note that a larger proportion of housing units than group quarters change occupancy. Forty percent of the survey housing units changed hands during the 2 1/2 years between the dress rehearsal and the survey. A substantially smaller 3 percent of group quarters changed during this period.
CHARACTERISTICS OF PLACES THAT ARE NOT BOARD AND CARE
Although our focus is on board and care places, it is useful to know the characteristics of sample units which are not board and care. Between 73 and 84 percent of the occupied housing units in each frame house only relatives or house nonrelatives but do not provide pertinent services. There is a notable pattern among the frames. Frames with one or two nonrelatives (50 to 58 percent) are more likely than those with 3 or more nonrelatives (30 to 37 percent) to report having only relatives at present and during the past three years. Frames with 3 or more nonrelatives (32 to 53 percent) are more likely than frames with 1 or 2 nonrelatives (20 to 23 percent) to report having nonrelatives currently or during the past three years. Perhaps places that have few nonrelatives do not recall their presence in the past and/or may be more likely to misreport their relationship status. More benignly, this may reflect the response of different household members. One researcher using the 1980 census remarked that many children appeared to be identified as nonrelatives by their step parents. Although stepchildren may have been more accurately identified in the 1988 dress rehearsal as a result of a specific category for them, an inaccurate relationship for some household members may have occurred.
EFFECTIVENESS OF UNIT SCREENING QUESTIONS
Two sets of questions comprised the unit screeners. The first asked about the presence and number of nonrelatives; the second inquired about the types of services provided to nonrelatives. The question numbers are given in parentheses.
The two questions about the presence of nonrelatives were linked to time. The first (# 6a) asked whether nonrelatives currently lived at the survey site. A later question (# 7) asked whether nonrelatives lived at the survey place during the prior three years. This question allows us to screen in places that may have been board and care places in the past but no longer are or who may not have clients at the time of the survey. For those who stated they had nonrelatives currently living with them, a subsequent question asked for the number of nonrelatives.
The second element is a set of nine questions (# 8a to 8i) directed only to those who have or had nonrelatives living with them. Each question asks whether or not a given service which may be provided by a board and care facility is or is not provided for nonrelatives living at the survey unit. The services are designed to cover a wide variety of dependent populations: elderly, mentally ill, mentally retarded, substance abusers, and physically disabled.
PRESENCE OF NONRELATIVES
Among board and care places, sheltering nonrelatives seems to be fairly consistent over time. Most places which currently house nonrelatives, had nonrelatives living there in the past three years. Table 6 shows that 76 percent of housing units and 91 percent of group quarters which are board and care currently have nonrelatives in residence and had them in the past three years also. Only 14 percent of housing units and 5 percent of group quarters which are board and care had no nonrelatives at the time of the survey but did have them in the past three years.
| TABLE 6. Presence of Nonrelatives at Time of Survey and Prior 3 Years(Frequencies and Percent of Total) | ||||
| Nonrelatives Live Here | Past 3 Years | |||
| At Time of Survey | Yes | No | No Response | Total |
| HOUSING UNITS | ||||
| Yes | 3876 | 36 | 12 | 4284 |
| No | 714 | 00 | 00 | 714 |
| No response | 12 | 00 | 00 | 12 |
| Total | 4692 | 36 | 12 | 50100 |
| GROUP QUARTERS | ||||
| Yes | 9790.65 | 21.87 | 10.93 | 10093.46 |
| No | 54.67 | 21.87 | 00 | 76.54 |
| No response | 00 | 00 | 00 | 00 |
| Total | 102 95.33 | 4 3.74 | 10.93 | 107100 |
NUMBER OF NONRELATIVES
Not surprisingly, the number of nonrelatives in board and care housing units is smaller than the number in board and care group quarters. One half of the board and care housing units have 1 or 2 nonrelatives and two thirds have six or fewer. In comparison, 76 percent of board and care group quarters shelter 10 or more nonrelatives (Table 7).
| TABLE 7. Number of Nonrelatives in Board and Care Housing Units and Group Quarters (Frequencies and Column Percentages) | |||
| Number of Nonrelatives | Housing Units | Group Quarters | Total |
| 0 | 12 | 00 | 1 |
| 1 | 1632 | 00 | 16 |
| 2 | 918 | 21.87 | 11 |
| 3 | 36 | 00 | 3 |
| 4-6 | 510 | 32.8 | 8 |
| 7-9 | 510 | 1312.15 | 18 |
| 10-19 | 510 | 3330.84 | 38 |
| 20-29 | 12 | 1312.15 | 14 |
| 30-49 | 00 | 1413.08 | 14 |
| 50-99 | 00 | 1816.82 | 18 |
| 100-199 | 00 | 32.8 | 3 |
| No response | 510 | 87.48 | 13 |
| Total | 50 | 157 | |
NUMBER AND TYPES OF SERVICES
The second component of the board and care criteria is the provision of meals and one or more other services. In addition to preparing meals, questions about seven other services as well as an open-ended question about "other services" were asked.
Among housing unit respondents, the proportion providing any given service is between 64 percent and 96 percent. Table 8 shows that more than 90 percent of the board and care places provide protective oversight and more than 90 percent provide housekeeping services while just under two thirds provide daily care and phone assistance. Roughly three quarters provide help with taking medicine, money management and outside activities.
More than 90 percent of all group quarters places provide each of the services except for money management which is provided by 73 percent of the group quarters.
| TABLE 8. Board and Care Places Providing Indicated Service (Percent of places responding Yes to given question) | ||
| Services Provided | Housing Unit | Group Quarters |
| Protective oversight | 92% | 100% |
| Daily care | 64% | 93% |
| Housekeeping | 96% | 97% |
| Money management | 70% | 73% |
| Phone assistance | 66% | 92% |
| Help w/ medicine | 76% | 97% |
| Activities outside | 78% | 95% |
More germane is the combination of services provided. Although board and care places provide a wide variety of services, Figure 2 and Table 9 show that most provide protective oversight and housekeeping services either alone or with additional services. Eighty four percent of housing units and 97 percent of group quarters which are board and care places provide these two central services either alone or with additional services. Although the majority of both housing units and group quarters provide both services along with four or five additional services, group quarters are more likely to provide a wider range of services. Ninety three percent of group quarters provide six or seven services including protective oversight and housekeeping compared to 68 percent of housing units.
| TABLE 9. Combinations of Service Provided by Board and Care Places: Frequencies and Percent of Places | |||
| Services | Housing Units | Group Quarters | Total |
| 2-5 services w/ PH | 816 | 43.74 | 12 |
| 6-7 services w/PHMTX | 3468 | 10093.46 | 134 |
| 1 service: PDMA or PO | 36 | 10.93 | 4 |
| 2-4 services: misc | 510 | 21.86 | 7 |
| Total | 50 | 107 | 157 |
| P= Protective oversight H= Housekeeping A= Activities Outside Home X= Help with medicine M= Money management D= Daily care T= Telephone Assistance O= Other services | |||
| FIGURE 2. Services Provided by Board and Care Places |
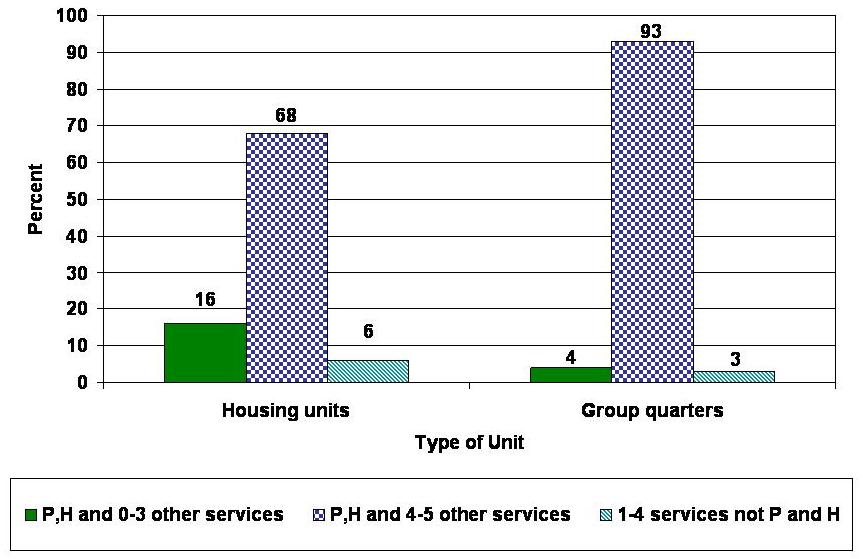 |
| P= protective oversight H= housekeeping |
The question about "other services" was more misleading than enlightening. Board and care places in housing units which responded yes to the other services question answered yes to four or more of the specified services. Thus no additional units were identified as board and care places as a result of this question.
The problems with the "other services" question were diverse. Miscoding, misinterpretation and no specification occurred.
Among the four respondents who responded yes only to the other services item, one person wrote in "None -- no one but me" meaning she lived alone. A second is a religious group which provides meals to nonresident homeless people. The remaining two respondents checked "yes" but did not specify the service provided.
Given that "other services" is not illuminating and not specific, this analysis focused on the seven specified services other than preparing meals.
MISREPORTING
Each of the unit screeners appears to be misreported by at least some of the respondents.
The two questions about the presence of nonrelatives allow a check for consistency between the dress rehearsal and the survey. If responses to the dress rehearsal questionnaire were accurate, respondents in every place that did not have a change in the owner, renter or type of place should have answered "yes" to at least one of the questions about the presence of nonrelatives.
Among those places where the respondent lived or the facility existed in April of 1988, 48 percent of the respondents in housing units and 13 percent of group quarter's respondents claimed to shelter only relatives. For respondents in housing units, this response about nonrelatives is inconsistent with the responses in the dress rehearsal.
Responses to questions about services to nonrelatives is misreported in a number of ways. Those who claim to have only relatives at present and in the recent past either misunderstood the question, misreported the presence of nonrelatives or, most likely, missed the skip pattern. Fifty six percent of respondents in units housing only relatives since the dress rehearsal claim to provide one or more services to nonrelatives.
Fifty eight percent of respondents in housing units sheltering nonrelatives and which are not board and care claim to provide one or more services to nonrelatives. The key factor differentiating these places from board and care is that independent persons shared household tasks rather than a caregiver providing services to dependent persons. Some seem to confuse a division of labor with the provision of services. College roommates, fraternities, medical residents, and co-renters on limited incomes reported providing services to nonrelatives. In one unit, a fraternity claimed to provide all of the services listed to its members. In another example, a college student sharing an apartment said he helped with "activities outside the residence" because only he owned a vehicle and he took his roommates grocery shopping.
This result suggests that the questions about services provided to dependent nonrelatives need more precision. Perhaps the question should specify that these services are provided to persons whose physical limitations or mental conditions prevent them from living independently. It is also necessary to distinguish whether the recipient is a dependent or independent person. In addition, close editing and followup may be needed in any future survey.
GROUP QUARTERS CATEGORIES
The final task for evaluating the unit screeners is to examine the outcome for group quarters. Eighty one percent of the group quarters are either board and care (37%), facilities with staff that provide professional services (32%), schools (1%), places which are now vacant or demolished (11%), or duplicate questionnaire sent to a given place (1%).
Another 12 percent report having only relatives and 7 percent have nonrelatives but do not qualify as board and care. Most of these group quarters with nonrelatives which are not board and care are places that do not provide services. Some are religious groups; others are fraternities or college roommates; and the remaining three are diverse categories. Group quarters with relatives only reported no nonrelatives at the time of the survey and none in the past three years.
To improve future studies, it is useful to distinguish group quarters categories which have board and care places from categories which do not. All of the places in 4 categories are board and care; none of the places in 10 categories are board and care; in the remaining 10 categories some are board and care and some are not.
Table 10 divides group quarters' categories by board and care, professional facilities, not board and care places and mixed types. For mixed types, the proportion which are board and care is given in parentheses.
| TABLE 10. Group Quarters by Board and Care Status | |
| ALL PLACES ARE BOARD AND CARE | |
| Group home mentally ill: state | |
| Mentally retarded state or local | |
| Group home mentally retarded, private | |
| Group home drug/alcohol abuse | |
| SOME PLACES ARE BOARD AND CARE (Percentage board and care is in parentheses) | |
| Group home mentally ill: private | 86% |
| Mentally retarded private | 94% |
| Other hospitals | 4% |
| Elderly private dont know if profit | 40% |
| Elderly public county or city | 13% |
| Elderly private non-profit | 39% |
| Elderly private profit | 39% |
| Drug/alcohol abuse | 36% |
| Group home other | 50% |
| Room/boarding house | 50% |
| NO PLACES IN THESE CATEGORIES ARE BOARD AND CARE (categories in parentheses) | |
| Physically handicapped orthopedic, public (professional) | |
| Physically handicapped orthopedic, private (relatives only) | |
| Blind, public (school) | |
| Deaf-dont know (school) | |
| Mentally ill, federal (professional) | |
| Mentally ill, state or local (professional/relatives only/vacant) | |
| Mentally ill, private (professional/relatives only/nonrelatives) | |
| Elderly, dont know (professional/vacant | |
| Elderly public, federal (professional) | |
| Elderly public, state (vacant) | |
| KEY: Professional = Facility with professional services (e.g. hospital). Relatives only = No nonrelatives currently or in past 3 years. Nonrelatives = Nonrelatives reside there but no services provided. Vacant = Place is vacant or no longer exists. | |
CHARACTERISTICS OF BOARD AND CARE UNITS
Having compared the screening indicators for board and care places, this analysis examines selected characteristics of these places. The analysis is exploratory. The purpose of this section is to describe the population and ownership characteristics of board and care places in this survey, specifically the disability and age of the resident nonrelatives, the receipt of disability payments and the type of ownership or operation. Characteristics of board and care housing units are described separately from those of board and care group quarters.
DISABILITIES OF NONRELATIVES
Respondents classified the disabilities of their nonrelatives. The six broad disability categories in addition to an "other" category were:
- physical disability,
- senility or forgetfulness
- mental or emotional problem
- mental retardation
- autism, epilepsy or cerebral palsy
- drug or alcohol dependency
Almost four fifths of the housing units have nonrelatives with disabilities in two single categories and approximately four fifths of the group quarters have nonrelatives with disabilities concentrated in three combination categories with two common disabilities.
The disabilities of nonrelatives in housing units are diverse but typically dependent residents in housing units have one or both of the two most prevalent disabilities. Figure 3 and Table 11a show that 78 percent of the 50 board and care housing units (n= 39) claimed residents had physical disabilities and/or mental or emotional problems. Some of these places housed clients with other kinds of disabilities. In order not to count places more than once, a sieve technique was used for classification. If a place could be classified in the first category (viz. mentally ill), it could not be classified in subsequent categories, even if the place housed persons with the less prevalent disabilities.
| TABLE 11a. Single Disabilities by Type of Place(Frequencies and Column Percentages) | |||
| Disabilities | Housing Units | Group Quarters | Total |
| I or I+: 1st app | 2652 | 8377.57 | 109 |
| P or P+: 2nd app | 1326 | 1614.95 | 29 |
| R or R+: 3rd app | 24 | 00 | 2 |
| No I,P or R: 4th app | 12 | 65.61 | 7 |
| Other/no disabled/no nonrelatives | 816 | 21.87 | 10 |
| Total | 50 | 107 | 157 |
| I=Mental illness P=Physical disability R=Mental Retardation app= application order in sieve technique | |||
| FIGURE 3. Disabilities of Persons in Housing Units Board and Care Population |
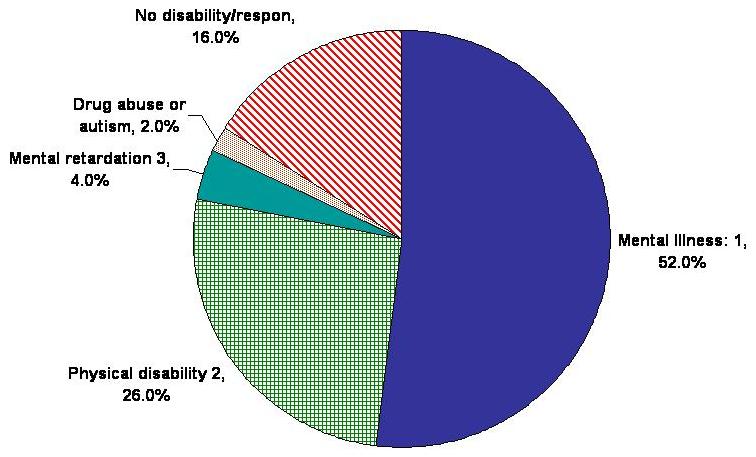 |
| Numbers next to legend names show order of application. Order is determined by prevalence of disability in board and care housing units. |
The disabilities of nonrelatives in group quarters cluster in three particular combinations each having at least two common disabilities. Shown in Figure 4 and Table 11b, 83 percent of the group quarters generally have nonrelatives with one or more of the following combinations and seventy four percent of the group quarters have nonrelatives in the first two categories:
- mental or emotional problems and mental retardation,
- physical disability and senility or forgetfulness,
- mental/ emotional problems and drug/ alcohol dependency.
| TABLE 11b. Disability Combinations by Type of Place(Frequencies and Column Percents) | |||
| Disabilities | Housing Units | Group Quarters | Total |
| P & S w/other dis. | 1020 | 4037.38 | 50 |
| MI & MR w/other dis. | 1020 | 3936.45 | 49 |
| MR & D w/ other dis. | 36 | 109.35 | 13 |
| 1 disability: misc. | 918 | 98.41 | 18 |
| 1 + other category | 36 | 10.93 | 4 |
| 2: misc. (not other) | 36 | 21.87 | 5 |
| 3-4: misc. (not other) | 48 | 43.74 | 8 |
| other disability only | 12 | 21.87 | 3 |
| No disabled/no nonrelatives | 714 | 00 | 7 |
| Total | 50 | 107 | 157 |
| MI=Mental illness MR= Mental retardation S=Senility P=Physical disability D=Substance abuse | |||
This does not mean that any nonrelative necessarily has two or more of the disabilities indicated but that the place cares for people with the kinds of designated disabilities. Note that there may be nonrelatives with other kinds of disabilities as well. For example, a group quarters with nonrelatives in all six of the disability categories would be included in the 83 percent figure.
| FIGURE 4. Disabilities of Persons in Group Quarters: Board and Care Population |
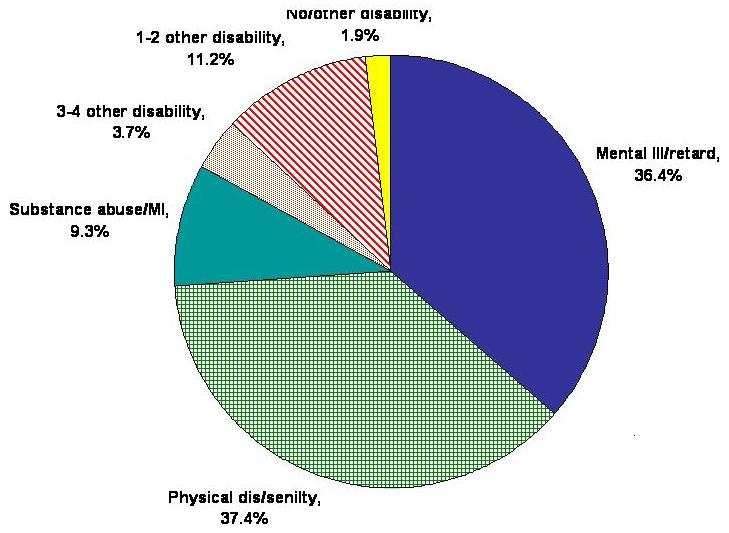 |
| Paired disability groups occur with and without other disabilities present. Pairs applied in order of prevalence. |
AGE
Five broad age groups were specified on the questionnaire. They identified:
- children (17 or younger),
- young adults (18-21),
- adults (22-64),
- young older (65-84 and
- old old (85 or over).
Figure 5 and Table 12 illustrate the differences between residents of housing units and group quarters board and care places.
Seventy two percent of board and care places in housing units cared either for elderly persons only (24 percent) or they cared only for persons under age 65 only (48 percent). Ten percent cared for persons under age 65 as well as persons 65 years of age or older and ten percent cared for children under age 18 only. No place cared exclusively for young adults 18-21.
| TABLE 12. Age Groups by Type of Place(Frequencies and Column Percentages) | |||
| Age Groups | Housing Units | Group Quarters | Total |
| No nonrelatives/not reported | 48 | 54.67 | 9 |
| Under 18 only | 510 | 00 | 5 |
| 1-21 and 18-21 | 00 | 21.87 | 2 |
| Under 64 only/2 or more ages | 2448 | 2523.36 | 49 |
| 65 or older | 1224 | 1816.82 | 30 |
| Under 65 & 65 or older | 510 | 5753.27 | 62 |
| Total | 50 | 107 | 157 |
| FIGURE 5. Age of Nonrelatives in Housing Units and Group Quarters |
 |
Board and care places which are group quarters are somewhat different. Seven tenths of these places house at least some persons 65 years of age or older. Seventeen percent of the places have persons over 65 only and 53 percent of the places have persons over 65 as well as persons under 65. Another 23 percent care for persons under age 65 only. Only two places had persons solely between the ages of 1 and 21 or 18 and 21 at the time of the survey. The place with persons under 18 as well as 18 to 21 was a facility with over 100 mentally retarded persons which designated at least three disability categories. The place with persons 18 to 21 only, treated 20 substance abuse clients and designated only one disability category.
| FIGURE 6. Age and Disability of Population in Board and Care Housing Units(Percent of total units) |
 |
| Numbers next to legend show order of application. Order is determined by the prevalence of the disability in board and care housing units. |
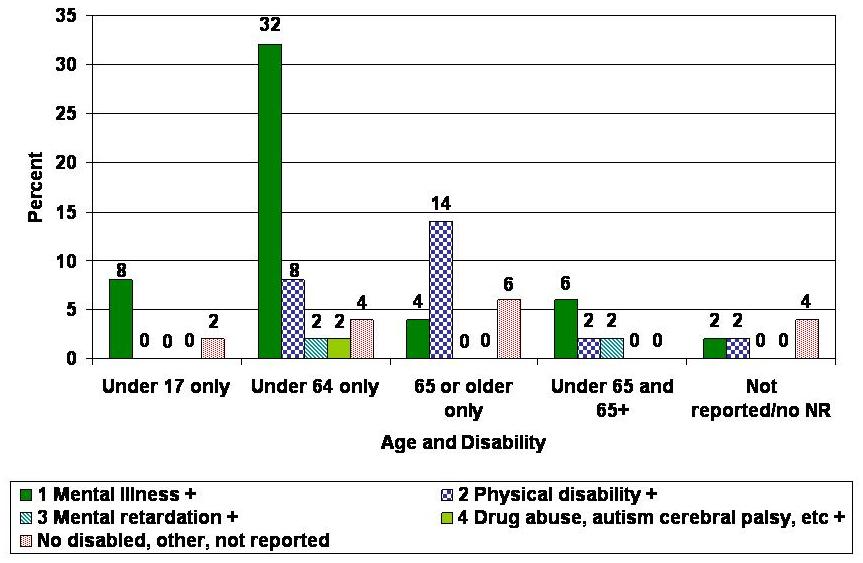
AGE, DISABILITY AND SERVICES
Although there exists no a priori hypothesis of the combination of characteristics most likely to occur in board and care places, we examine the various combinations of age, disability and services for housing and group quarters. The prevalence of joint characteristics may point to interesting features of board and care places.
The survey tapped two population characteristics of the board and care population: broad age groups and disabilities. Figure 6 and Table 13 show that 62 percent of board and care places in housing units occur in 4 of the 25 possible combinations:
- Adults under 65 with mental or emotional problems,
- Under 17 with mental or emotional problems,
- Under 65 with physical disabilities, and
- 65 or older with physical disabilities.
These disabilities may occur alone or there could be other disabilities among the clients at the subject units.
| TABLE 13. Age by Disability by Type of Place(Frequencies and Percent of Total) | ||||||
| No NR/Not Reported | 1-17 &/or 18-21 | Under 65/2+ Ages | 65 or Older | Under 65 or 65 + | Total | |
| HOUSING UNITS | ||||||
| I or I+: 1st app | 12 | 48 | 1632 | 24 | 36 | 2652 |
| P or P+: 2nd app | 12 | 00 | 48 | 714 | 12 | 1326 |
| R or R+: 3rd app | 00 | 00 | 12 | 00 | 12 | 24 |
| No I,P or R: 4th app | 00 | 00 | 12 | 00 | 00 | 12 |
| Other/no dis/NR | 24 | 12 | 24 | 36 | 00 | 816 |
| Total | 48 | 510 | 2448 | 1224 | 510 | 50100 |
| GROUP QUARTERS | ||||||
| I or I+: 1st app | 54.67 | 00 | 1917.76 | 109.35 | 4945.79 | 8311.57 |
| P or P+: 2nd app | 00 | 10.93 | 43.74 | 43.74 | 76.54 | 1614.95 |
| R or R+: 3rd app | 00 | 00 | 00 | 00 | 00 | 00 |
| No I,P or R: 4th app | 00 | 10.93 | 10.93 | 32.8 | 10.93 | 65.61 |
| Other/no dis/NR | 00 | 00 | 10.93 | 10.93 | 00 | 21.87 |
| Total | 54.67 | 21.87 | 2523.36 | 1816.82 | 5753.27 | 107100 |
| I=Mental illness P=Physical disability R=Mental retardation | ||||||
In group quarters 73% of places house adults under 65, 65 or older or both with mental or emotional problems. Most places reported other disability categories as well.
Combining either age groups or types of disability with kinds of services provides little additional information. Since 68 percent of board and care residential units and 93 percent of board and care group quarters provide six or seven services including protective oversight and housekeeping, the most prevalent combinations always occur within this service category. Furthermore the most prevalent age and disability categories reflect those which dominate the bivariate distributions. Since these tabulations shed little light on board and care places there is no further discussion of them. Seventy two percent of board and care places in housing units cared either for elderly persons only (24 percent) or they cared only for persons under age 65 only (48 percent). Ten percent cared for persons under age 65 as well as persons 65 years of age or older and ten percent cared for children under age 18 only. No place cared exclusively for young adults 18-21.
DISABILITY PAYMENTS
Most of the board and care places have one or more nonrelatives who receive either Social Security or Veterans payments because of their disability. However, this pattern is more pronounced for group quarters than it is for housing units. Shown in Table 14, 82 percent of group quarters have one or more persons receiving disability payments compared with 50 percent of housing units.
| TABLE 14. Social Security and Veterans Administration Disability Payments (Frequencies and Column Percents) | |||
| Disability Payments | Housing Units | Group Quarters | Total |
| Yes | 2550 | 8882.24 | 113 |
| No | 2244 | 1816.82 | 40 |
| No response | 36 | 10.93 | 4 |
| Total | 50 | 107 | 157 |
OWNERSHIP OR OPERATION
Board and care places in housing units tend to be operated as a private business or by an individual. Table 15 shows that 80 percent of board and care housing units claim private operation. Group quarters are almost evenly split between private ownership or operation (49 percent) and operation as a nonprofit organization (48 percent).
| TABLE 15. Unit Ownership or Operation(Frequencies and Column Percentages) | |||
| Type of Operation | Housing Units | Group Quarters | Total |
| Government agency | 24 | 43.74 | 6 |
| Nonprofit organization | 510 | 5147.66 | 56 |
| Private individual/business | 4080 | 5248.6 | 92 |
| More than 1 box marked | 12 | 00 | 1 |
| No response | 24 | 00 | 2 |
| Total | 50 | 107 | 157 |
SURVEY SUMMARY
Both the census screeners and the unit screeners identified board and care places. However the unit screeners did not discriminate board and care places from professional care facilities. Nevertheless, the screeners did substantially better than expert estimates would lead us to expect.
In addition to identifying board and care places, broad information about the age and disability characteristics of the dependent population as well as some data about the size of these places, the services they provide and their operation was obtained. Furthermore, this data is available for both residential units and the larger group quarters.
COMPARISON TO AN INDEPENDENT LIST
The presence of an independent list of licensed places provides a unique opportunity to evaluate how completely we targeted licensed board and care places. Comparing survey units with those of the independent list, we determine what proportion of eligible licensed places are in the survey. In addition, we note the number of survey places which are not on the
The state of Missouri has extensive licensing requirements. Under certain conditions, they license places which have only one client. The Department of Health and Human Services contracted with Lewin/ICF to develop a list of the names and addresses of licensed places. Drug and alcohol abuse treatment centers and foster homes were excluded from the Lewin/ICF list. This list was matched to the board and care survey using the following method.
Since the survey only targeted places in the dress rehearsal site, which is in central Missouri, we made a file of places on the Lewin/ICF list that had zip codes which matched the ones in the dress rehearsal site. Places on the Lewin/ICF list were then hand matched to places on the survey list. Out of 210 places, there were 102 matches and 8 probable matches (or 110 matches). However, three of these were duplicates so there are effectively 107 matches.
Since it is known that the zip code boundaries are wider than the dress rehearsal boundaries, the next step required identifying which of the remaining 100 places were likely survey targets. Survey candidates were distinguished by a number of factors which are listed below.
| Element | Criterion |
| Location | In dress rehearsal site |
| Time | Licensing date before 3/88 dress rehearsal |
| Start up | Commenced operation at least 6 months before dress rehearsal |
| Size | Client population was 3 or more now or in 3/88 |
| Type | Client population is a board and care population |
| Care | Client resides at facility |
| Current | Listed phone is in operation |
We obtained telephone numbers from reverse directories for places which did not have them on the Lewin list and, to the extent possible, we conducted brief telephone interviews with administrators and supervisory staff. Places not interviewed were located on maps to determine if they were in the dress rehearsal site.
As a result of these interviews and the research, we identified 10 places which appear to be survey candidates and 55 which are not. Most of the latter are excluded because they are outside the dress rehearsal area but between 1 and 5 cases were excluded for other reasons. The number of places and the reasons for their exclusion are listed below.
- 38 were outside the dress rehearsal site.
- 5 did not exist at the time of the dress rehearsal.
- 2 were apartment complexes with 1 or 2 residents per unit.
- 4 were not target populations (e.g. prisoners).
- 2 provided only day care.
- 2 had 1 or 2 persons in March, 1988.
- 1 was licensed after March, 1988.
- 1 was licensed between 10/87 and 3/88 and had few clients initially.
In addition, eighteen were excluded for the following reasons.
- 7 were licensed for 1 or 2 beds.
- 1 city/zip code was not in the dress rehearsal site.
- 7 telephones were disconnected or not in service.
Places with 1 or 2 persons would be in the survey only if they received and returned the long form of the census dress rehearsal questionnaire and reported a disabled household member.
We assume that places with numbers not in service are either not in operation or demolished.
Of the remaining 20 places, 3 are duplicates and 17 are in the dress rehearsal site but could not be contacted by phone because either no number was available or no one answered. Consequently, it is not known if the places actually are eligible target units. The many reasons why these 17 places may not be eligible units reflect those which identify excluded places: date commencing operation, size and type of population, presence of 24 hour care and current status as a residence for a dependent population. Another possibility is that some of these may not have responded to the 1988 dress rehearsal.
Table 16 summarizes the outcome for places on the Lewin/ICF list which are in the dress rehearsal site and presumably could have been on the survey. It also shows board and care places identified in the survey which are not on the list of licensed places.
- a minimum of 80 percent (n=107) of licensed places on the Lewin/ICF list were on the survey,
- a maximum of 20 percent (n=27) of places were not on the survey.
- forty seven board and care places identified on the survey were not on the list of licensed places
| TABLE 16. Number and Percent of Licensed Places From the Lewin/ICF List Which Match the Board and Care Survey Places | |||
| Lewin List | Board and Care Survey | ||
| Yes | No | Total | |
| Yes | 10779.85 | 27 20.15 | 134 |
| No, Board and Care | 47100.0 | N/A | 47 |
| No, not Board and Care | 1600 100.00 | N/A | 1600 |
| Total | 1754 | 27 | 1781 |
| Duplicates 3 | |||
The 47 board and care places which are only in the survey would not be on the Lewin/ICF list if they care only for children, treated substance abusers, or were not licensed because places with these characteristics were not included on the Lewin/ICF list.
Most of the places on the Lewin/ICF list which matched survey places were either group quarters or residences with 3 or more nonrelatives (Table 17). Eighty two percent of the matched places were group quarters, 17 percent were from the 3 or more nonrelatives and only 1 percent was from the long form, 2 nonrelatives and one household member with a disability frame.
| TABLE 17. Survey Frame of Matched Places | ||
| Frame | N | Percent |
| Group Quarters | 88 | 82.2 |
| 3+ Nonrelatives | 18 | 16.8 |
| Long form, 2 Nonrelatives, 1 or more Disabled | 1 | 0.9 |
| Total | 107 | 100.0 |
| Duplicates | 3 | |
Table 18 shows that most -- but not all -- of the matched places are board and care places or places that care for dependent persons. Sixty one percent of the matched cases are board and care, 22 percent are facilities which provide professional services and 2 percent are foster families or undefined.
Sixteen percent of the matched places do not provide care services. These places were vacant, or nonexistent, had relatives only, or housed nonrelatives but did not qualify as board and care places.
| TABLE 18. Description of Places Which Are on Both the Survey and Lewin/ICF List | ||
| Description | N | Percent |
| Board and Care | 65 | 60.7 |
| Professional Care Facility | 23 | 21.5 |
| Foster Families/misc. | 2 | 1.9 |
| Nonrelatives, Relatives and No response | 17 | 15.9 |
| Total | 107 | 100.0 |
| Duplicates | 3 | |
For the 11 places that had only relatives or nonrelatives but were not board and care,
- 5 were group quarters and
- 6 were from the frame with 3 or more nonrelatives
Three of the 6 were long form respondents and in each of these cases the disabled household member(s) were related to the householder.
CONCLUSION
The results of matching the survey data with an independent list indicate that the search for board and care places was notably successful, capturing at least 80 percent of the places on the independent list. However, while it did not capture all licensed places, it did capture some places which may be unlicensed. Places may be unlicensed because of ignorance, disinterest or an active intent to be unknown to regulating officials.
ESTIMATE OF BOARD AND CARE PLACES FOR DRESS REHEARSAL SITE AND U.S.
Following are estimates of board and care housing units in the dress rehearsal site and the United States. The estimates only include housing units; they do not include group quarters. For the dress rehearsal site the 107 board and care group quarters can be added for a total. However, comparable data on board and care group quarters for the United States is not available.
We estimate that there are 141 board and care housing units for the central Missouri dress rehearsal site. Appendix G shows the calculations. The calculations require multiplying the long form board and care units by two factors, 1.11 to account for the 90 percent data capture rate and 6 to account for the 1 in 6 sampling for the long form. These numbers were then added to the number of board and care units from the frame for 3 or more nonrelatives.
These 141 board and care units comprise .62 percent of the 22,660 households with nonrelatives of any kind and .93 percent of households with nonrelatives who belong to the three categories used in the sampling frames (i.e. roommates and housemates, roomer, boarder or foster child, and other nonrelative).
Any estimate for the United States requires additional simplifying assumptions. In order to use the data from this survey, one assumes that the central Missouri dress rehearsal site is either a microcosm of the U.S. or a reasonable average for the United States. There is no data to suggest that central Missouri is such a microcosm. However, lacking a better model, we make the very general assumption that the dress rehearsal site data provides a reasonable average. The amount and direction of any bias is not known but this provides a working estimate that can be revised or replaced when a better model or better data becomes available.
Applying the .93 percent figure to the 6,317,000 households with 1 or more nonrelatives gives an estimate of 39,165 board and care housing units in the U.S. The household figure is from the Current Population Survey of March, 1990, Table 16 which is reproduced in Appendix H. When using this rough estimate, remember that it is housing units only; group quarters are excluded.
RECOMMENDATIONS
Following are some recommendations generated from the pretest. Ideally, they will strengthen future research.
-
More precision is needed in the questionnaire. Since board and care homes are part of a continuum, it is necessary to separate them from units on either side which are not board and care. Boarding homes and rental rooms are often distinguished by the nonrelative status and services question. Still needed is a question or questions which would screen out skilled nursing facilities and other places which provide more professional services. In doing this, one observation from interviews of the 'hot house' respondents should be kept in mind. Most of these respondents distanced themselves from a stronger question about medical care. As a result of the reaction, the question was modified.
-
Separate questionnaires are needed for group quarters and housing units. The use of single questionnaire created some confusion among respondents.
-
Clarify the services to dependent nonrelatives. Distinguish people who are capable of living independently but do not because of economic or social reasons from those who are truly dependent. Distinguish a division of labor from the provision of services to dependent persons. This may require phone or personal visit followup if a mail out/ mail back instrument is used. Close editing and followup is essential.
-
Use the Census identifier (e.g. District Office/Address Register Area/ Block/ Map Spot/ ID) rather than a sequence number because consecutive sequence numbers are reassigned at the second mailout. This results in different units sharing the same sequence number.
-
Resolve multiple entries in the field. That is, obtain correct data if respondent marks two boxes.
-
Include a clerical operation in Jeffersonville to make the documents ready for keying. This may involve computing percentages of a number when a number was requested but a percentage was entered, transferring a code that was circled or entered above its coding block, or entering a number when the word representing the number is written out.
-
Resolve duplicates before keying, preferably in the field office.
-
Output area code and telephone number as separate items.
-
Key any portion of the telephone number even if it is incomplete.
-
Consider using long form respondents as the frame for future research. In this research long form respondents with a disabled household member targeted a larger proportion of board and care places. In the long form frame with 3 or more nonrelatives, the few board and care places had one or more disabled members. None had no disabled member. However, sixteen percent of board and care places claimed to have no disabled persons or no nonrelatives.
-
Consider using state licensing categories in addition to generic descriptive categories to identify board and care units.
FEASIBILITY OF A NATIONAL STUDY
A national study requires many considerations but the results of the pretest provide pertinent data about:
- the feasibility of using the decennial census to define survey frames,
- incorporating group quarters and housing units in the same survey,
- the effect of changing residences,
- the use of reverse directories,
- possible misreporting of nonrelative status and
- the potential for identifying areas with high concentrations of housing units sheltering nonrelatives but with few board and care places.
Survey results suggest that the decennial census provides suitable frame(s) for a national study of board and care places. However, since the two basic types of places, housing units and group quarters, are very different, they must be distinguished.
Selected on the basis of their category classification, board and care places which are group quarters are easier to locate. It may be both possible and preferable to identify these in conjunction with other existing surveys or to treat these places separately from housing units.
At a minimum, a separate questionnaire is needed: one for group quarters and a different one for housing units. Due to cost considerations, one questionnaire was used for both housing units and group quarters in the pretest survey. Questions were worded to apply to these diverse places and some questions applied only to one type of place. This necessary compromise created some confusion. In fact, some respondents wrote in comments expressing a degree of frustration. Separate questionnaires are likely to improve data quality and responses while marginally reducing respondent burden. In addition, the resulting simplification of the questionnaire is likely to be very important for a population with limited education.
For housing units, the use of information gleaned from the pretest provides a basis for locating board and care places by selecting housing units which have specific characteristics. There are two alternatives to be considered.
The first alternative uses the same housing unit frames as the pretest. These frames identified more board and care places than would be expected given expert estimates prior to the survey but the board and care places comprised only 3.4 percent of all housing units selected for the pretest. In other words, 50 of the 1466 housing units were board and care. Thus, although the census screening questions narrowed the field to places with one or two potential board and care characteristics, a large number of housing units still had to be surveyed to find a small number of board and care places. However these board and care places exceeded the expected number of units.
The second alternative uses only long form respondents. Based on the findings that
- the pretest had a higher percentage of board and care places among long form respondents with a disabled household member than among either short form respondents with 3 or more nonrelatives or all survey housing units and
- the pretest had no board and care units among long form respondents with three or more nonrelatives but no disabled household members,
future research should consider using the long form respondents for the frame in order to use the additional information about disability. Screening on the basis of two characteristics, nonrelatives and disability, is likely to result in higher percentages of board and care places among survey units than using only the number of nonrelatives. However, some sampling of long form respondents with no disability should be considered since ten percent of the board and care places reported on the survey that they housed no disabled dependent persons. The results would be weighted to provide estimates of the total number of board and care places. It should be remembered that the numbers of board and care units in the long form frames were small but the percentages of units that were board and care were always larger than for all housing units or housing units with three or more nonrelatives from the short form. Consequently, this alternative is likely to be more cost effective.
The Department of Health and Human Services sponsored a second research project during 1990-1991 to identify potential board and care places. Mentioned earlier, this is the Lewin/ICF list of licensed places. Under contract to HHS, Lewin/ICF developed a list of licensed places that could be board and care. The Lewin/ICF list contains licensed places but they are not necessarily board and care places.
Sponsors of future research may wish to consider using this source as a supplement to or in conjunction with research using decennial census frames. Comparisons of places on the Lewin/ICF list with the list of places on the census pretest revealed that some places were only on one of the lists. Between 10 and 27 potential board and care places were only on the Lewin/ICF list and 47 identified board and care places were only on the census pretest survey. Furthermore, most of the places on the Lewin/ICF list which matched the survey list were group quarters; only a small proportion were housing units. Eighty eight of the 107 places were group quarters, nineteen were housing units and 3 were duplicates. Of the nineteen housing units, only 10 of the Lewin/ICF places (20 percent) were among the 50 board and care housing units on the pretest survey; 9 were not board and care places. Since
- there is substantial interest in unlicensed places and the census frame is the only one of these two sources capable of capturing unlicensed places,
- the census pretest captured more of the board and care places than the Lewin/ICF list and
- 80 percent of the identified board and care housing units are only on the census pretest
the decennial census is a more productive source for future research.
Lists of licensed places from each state could be the basis for a supplemental survey in future research or they could be part of a dual estimation procedure. Note, however, that state licensing requirements vary. Some experts suggest that Missouri has more rigorous licensing standards than many other states. To the extent this is true, the Missouri list is likely to encompass a larger proportion of board and care places than many other states. Future research may wish to survey places on state lists of licensed places which are not included in a survey developed from census frames. If only housing units are included in a census based survey, then licensed places which are group quarters would be excluded and only housing units not covered by the census frames would be interviewed in the supplemental survey. If the pretest results are representative and similar frames are used, then the number is likely to be relatively small. Using the matched places for the Lewin/ICF list and the census pretest as a guide, most places (82 percent) were group quarters. Among the other 18 percent, twelve percent were from the short form frames and six percent were on the long form frames.
Using licensed lists for a supplemental survey would be more practical if the survey used frames similar to the pretest which are designed to tap most of the board and care population (viz. all housing units with three or more nonrelatives and long form respondents with 1 or 2 nonrelatives and a disabled household member). If the frames are likely to capture most of the community based dependent care facilities then a high match rate is possible. However, if frames such as long form respondents form the basis for the survey then a high match rate is unlikely. Since long forms were sent to 1 in 6 housing units, most units would have no chance of being in the survey and thus no chance of being matched to an independent list.
Other information from the survey may prove useful in reducing survey costs and/or improving quality: residential mobility, the use of reverse directories, misreporting of nonrelatives and the existence of clusters of housing units with a large proportion of units with nonrelatives but a small proportion of board and care units.
Over half (53 percent) of the housing units in the pretest had a change of owner/tenant or were vacant or deleted. These are places whose population characteristics in 1988 indicated they were potential board and care places. Reflecting their changed composition, very few of these housed board and care clients. Elimination or reduction of personal visits to these places would reduce survey costs substantially. Reverse directories may be helpful here. The Haynes reverse directories indicate the length of residence and the Polk directory notes the presence of a new householder. Assuming telephone numbers are available, restricting the followup of respondents in housing units with a new tenant or owner to telephone calls could reduce field costs while verifying the information that there are new occupants and ascertaining board and care status.
Many of the households in the pretest were college roommates or young adults sharing living quarters. Reducing personal visits to this population would also be cost effective. Some reverse directories indicate occupation, including the designation of student. Households with designated characteristics (e.g. students) could be restricted to telephone followup only insofar as telephone numbers are available.
Although there is not sufficient data to make a definitive statement, some preliminary evidence supports the ad hoc assumption that many units with nonrelatives are clustered in a limited geographical area. The subject ARAB contain proportionately more housing units than expected if one assumed an even distribution of housing units. Note that these areas do have a few board and care units.
For example, in the Columbia district office, six percent of the Address Register Areas (ARA) (i.e. 19 out of 318 ARAs) contain 57 percent of the pretest housing units for that district office (i.e. 414 of the 724 housing units in the survey) but only 17 percent of the board and care places (4 of the 24). Since most of these ARAs are near universities and colleges (viz. the University of Missouri at Columbia, Columbia College and Stephens College which are geographically close together) there are likely to be many residences of students and staff.
Additional suggestive evidence is found in tenure and residential mobility. Eighty nine percent of the 414 housing units either had a new resident since the 1988 dress rehearsal (84 percent) or were vacant (5 percent). Most of these were renters: 73 percent of the 414 housing units housed renters who moved in after April 1, 1988. The combination of renting, recent residential mobility and proximity to colleges is typical of a college student/ young adult population. A strategy for quickly screening these places could retain response quality while reducing response burden and field costs. Population characteristics such as age and educational enrollment may provide additional clues regarding places unlikely to be board and care. Additional research would be needed to examine this possibility.
In addition to using reverse directories in specified cases such as those above, telephone followup could be used to reduce the field costs of nonresponse followup in general. Recall that the initial telephone followup attained a high percentage of completed questionnaires.
Forty percent of housing unit respondents claim to house only relatives currently and since the dress rehearsal in 1988. This is not accounted for by changes in the resident owner or tenant: 48 percent of housing units with the same owner or tenant claimed to have only relatives during the period between the dress rehearsal and the survey. Refining the questionnaire to require data on each individual in a manner similar to the decennial census questionnaire may provide more accurate data or at least provide a basis for examining possible reasons for discrepancies. Comparison of survey results with the 1988 dress rehearsal file may provide additional clues.
In short the decennial census is a viable source for future research. The results of this pretest suggest some methods of refining the search to obtain valid results while containing some of the costs inherent in searching for a needle in a haystack.
APPENDIX A. DRESS REHEARSAL COUNTIES
| GEOGRAPHIC COMPONENTS OF 1988 CENSUS DRESS REHEARSAL IN CENTRAL MISSOURI | |||
| All of: | Part of: | ||
| FIPS County Code | County | FIPS County Code | County |
| 019 | Boone | 007 | Audrian |
| 029 | Camden | 027 | Calloway |
| 051 | Cole | 041 | Chariton |
| 053 | Cooper | 055 | Crawford |
| 071 | Franklin | 189 | St. Louis County |
| 073 | Gasconade | ||
| 089 | Howard | ||
| 105 | Laclede | ||
| 125 | Maries | ||
| 131 | Miller | ||
| 135 | Moniteau | ||
| 141 | Morgan | ||
| 151 | Osage | ||
| 169 | Pulaski | ||
| 510 | St. Louis City | ||
APPENDIX B. GROUP QUARTERS CATEGORIES
| GROUP QUARTERS INCLUDED IN BOARD AND CARE SURVEY | |
| GQ Number | Description |
| 17 | Group Home Mentally Ill State |
| 18 | Group Home Mentally Ill Private |
| 32 | Physically Handicapped Orthopedic Public |
| 33 | Physically Handicapped Orthopedic Private |
| 35 | Blind Public |
| 37 | Deaf-Dont Know |
| 42 | Mentally Retarded Private |
| 43 | Mentally Retarded State or Local |
| 46 | Mentally Ill Federal |
| 47 | Mentally Ill State or Local |
| 48 | Mentally Ill Private |
| 53 | Other Hospitals |
| 58 | Group Home Mentally Retarded Private |
| 60 | Elderly Private Dont Know If Profit |
| 61 | Elderly Dont Know |
| 62 | Elderly Public Federal |
| 63 | Elderly Public State |
| 64 | Elderly Public County or City |
| 66 | Elderly Private Non-Profit |
| 67 | Elderly Private Profit |
| 70 | Drug/Alcohol Abuse |
| 76 | Group Home Drug/Alcohol Abuse |
| 79 | Group Home Other |
| 80 | Room/Boarding House |
APPENDIX C. DRESS REHEARSAL DISABILITY QUESTIONS
18. Does this person have a physical, mental or other health condition that has lasted for 6 or more months and which --
-
Limits the kind or amount of work this person can do at a job?
Yes No
-
Prevents this person from working at a job?
Yes No
19. Because of a health condition that has lasted for 6 or more months, does this persons have any difficulty --
-
Going outside the home alone, for example, to shop or visit a doctors office?
Yes No
-
Taking care of his or her own personal needs, such as bathing, dressing, or getting around inside the home?
Yes No
APPENDIX D. FACSIMILE OF SURVEY QUESTIONNAIRE1
BOARD AND CARE SURVEY
OMB No. 0990-0189: Approval Expires 10/31/91.
U.S. Department of CommerceBureau of the CensusActing as collecting agent for the U.S. Department of Health and Human Services
NOTICE: Your report to the Census Bureau is confidential by law (title 13, U.S. Code). It may be seen only by sworn Census employees and may be used only for statistical purposes.
We estimate that it will take from 5 to 20 minutes to complete this questionnaire, with 8 minutes being the average time. If you have any comments regarding any aspect of this survey, send them to the Office of Management and Budget, Office of Information and Regulatory Affairs. Paperwork Reduction Project 0990-0189 Washington DC 20503; and to the Associate Director for Management Services, Paperwork Reduction Project 0990-0189 Room 2027, FB3 Bureau of the Census, Washington, DC 20233. Direct any other questions to our Kansas City Regional Office on (913) 236-3728.
FROM THE DIRECTORBUREAU OF THE CENSUS
The Bureau of the Census is conducting a survey for the Department of Health and Human Services. This survey will identify places where persons with physical or mental disabilities live and receive some kind of support services from someone not related to them. Your participation in this survey is critical to our success in understanding the role of these types of places in helping people.
Some of the support services provided may include:
- Helping people with personal grooming.
- Taking them shopping or to the doctor's office.
- Preparing meals and making beds for them.
- Helping them manage their money.
- Looking out for their general well-being.
- Having a general idea of their whereabouts throughout the day.
We have identified your address as a place where one or more of these important services may be provided. Please fill out this questionnaire as completely and accurately as you can. We estimate that it will take about 8 minutes to complete. Even if your residence does not fit the description above, we would like you to answer the first seven questions.
While your participation is voluntary, we would appreciate your returning this questionnaire within five days of receiving it. Please note that although your phone number is requested in this survey, the Census Bureau will use if only if it needs to contact you for futher clarification of the information you are providing. All information will be kept strictly confidential; the Census Bureau will use the data only for statistical purposes.
Thank you for your cooperation in this important survey. We are very grateful for your help.
Sincerely,Barbara Everitt Bryant
If this place is a private residence, the owner or principal renter should complete the questionnaire. We would like it to be completed by the person in charge who is most familiar with the day-to-day activities at the residence. If this place is a group home or other facility, the proprietor or manager should complete the questionnaire. Please mark (X) your answers in the column on the right.
1. Name -- Please print  _________________________
2a. If this place is a private residence, Are you the (Mark (X) only one)
- _____ owner?
- _____ principal renter?
- _____ other? -- Specify your relationship to the owner or principal renter _________________________
- _____ Mark (X) here if this place is a group residence
b. Did you live here on April 1, 1988?
- _____ Yes
- _____ No
3a. If this place is a group home or other facility, Are you the (Mark (X) only one)
- _____ proprietor?
- _____ manager?
- _____ other? -- Specify your relationship to the proprietor or manager _________________________
- _____ Mark (X) here if this place is a private residence
b. Was this facility open on April 1, 1988?
- _____ Yes
- _____ No
4a. Is the address of this residence the same as the address shown on the mailing label of this questionnaire?
- _____ Yes
- _____ No
b. If it is NOT the same, please print the correct address.
Number or box, street or route _________________________City or town _________________________State _________________________ ZIP Code __________
5. What is the phone number at this residence? Include area code _________________________
6a. Do any nonrelatives currently live here? "Nonrelatives," refer to people who are NOT related to you by marriage/living together as married, by birth, or by adoption.
- _____ Yes
- _____ No -- Go to question 7
b. If you answered "Yes" to question 6a, How many nonrelatives currently live here? Do NOT include yourself _________________________ Number of nonrelatives
7. Did any nonrelative live here at some time during the last 3 years?
- _____ Yes
- _____ No -- Go to question 14
8. Do you provide any of the following support services to one or more of the nonrelatives currently living at this reisdence? -- If only relatives currently live here, please answer based on the services you provided to nonrelatives who lived here most recently.
a. Protective oversight: someone is available who knows generally where the residents are or who can provide advice or help when needed
- _____ Yes
- _____ No
b. Daily care services: someone is available to help with personal care such as bathing, dressing, eating, getting in or out of bed, or going to the bathroom.
- _____ Yes
- _____ No
c. Preparing meals: someone is available to prepare to to help prepare meals.
- _____ Yes
- _____ No
d. Housekeeping: someone is available to do or to help with chores such as washing clothes, washing dishes, dusting furniture, or making beds.
- _____ Yes
- _____ No
e. Money management: someone is available to help with keeping track of bills, handling cash, etc.
- _____ Yes
- _____ No
f. Telephone assistance: someone is available to help with making phone calls.
- _____ Yes
- _____ No
g. Helping with medicine: someone is available to help with medicine that may be self-administered.
- _____ Yes
- _____ No
h. Activities outside the residence: someone is available to help with walking or getting around outside, shopping for groceries, going to the doctor's office, etc.
- _____ Yes
- _____ No
i. Other services provided.
- _____ Yes -- Specify _________________________
- _____ No
NOTE -- If you have NOT provided support services at this residence to nonrelatives, please go to question 14.
9. Do any of the nonrelatives currently living here have:
a. a physical disability?
- _____ Yes
- _____ No
b. senility or forgetfulness?
- _____ Yes
- _____ No
c. a mental or emotional problem?
- _____ Yes
- _____ No
d. mental retardation?
- _____ Yes
- _____ No
e. autism, epilepsy, or cerebral palsy?
- _____ Yes
- _____ No
f. drug or alcohol dependency?
- _____ Yes
- _____ No
g. any other health problem that prevents him/her from living independently?
- _____ Yes -- Specify _________________________
- _____ No
10. Do any of the nonrelatives currently living here receive Social Security or Veterans payments because of a disability?
- _____ Yes
- _____ No
11. About how many of the nonrelatives currently living here are (_____ Mark (X) here if only relatives currently live here)
a. age 17 or younger? _________________________ Number of nonrelatives
b. age 18 through 21? _________________________ Number of nonrelatives
c. age 22 through 64? _________________________ Number of nonrelatives
d. age 65 through 84? _________________________ Number of nonrelatives
e. age 85 or older? _________________________ Number of nonrelatives
12. Currently, what is the maximum number of nonrelatives who could reside here AND receive support services from you? _________________________ Number of nonrelatives
13. In the future, do you plan on providing nonrelatives with support services other than room and meals at this address?
- _____ Yes
- _____ No
14. Is this residence owned or operated (Mark (X) only one):
- _____ by a local, State, or Federal Government agency?
- _____ privately by a nonprofit organization?
- _____ privately by an individual or business?
Remarks -- Please use this space for any explanations that may be essential in understanding your reported data. Reference item number and page number. ____________________________________________________________________________________________________
FOR CENSUS USE
1. Disposition of case
- _____ MO/MB I
- _____ MO/MB II
- _____ TEL FU
- _____ PV FU
2. Record of contacts
| Contact Number | Tel or PV | Date | Time | Interviewer Code | Outcome Code | Comments, Appointments, Etc. | |
| Month | Day | ||||||
| 1 | am.pm. | ||||||
| 2 | am.pm. | ||||||
| 3 | am.pm. | ||||||
| 4 | am.pm. | ||||||
| 5 | am.pm. | ||||||
| 6 | am.pm. | ||||||
| 7 | am.pm. | ||||||
| Final outcome | |||||||
b. Outcome codes
01. Complete interview with household member or facility manager02. Partial interview with household member or facility manager03. Complete interview with proxy04. Partial interview with proxy05. Noninterview -- refused06. Noninterview -- not at home07. Noninterview -- other08. Vacant09. Delete -- Specify reason _________________________10. Last resort
3a. JIC1
- _____
- _____
- _____
- _____
- _____
- _____
- _____
- _____
- _____
b. JIC2
- _____
- _____
- _____
- _____
- _____
- _____
- _____
- _____
- _____
APPENDIX E. FIELD DEBRIEFING MEMO
 | UNITED STATES DEPARTMENT OF COMMERCE Bureau of the Census Washington, D.C. 20233 |
March 27, 1991
| MEMORANDUM FOR | Vaughn Paddock Chief, Field Evaluation Operations Branch |
| From: | Carol A. Comisarow Survey Statistician Field Division |
| Subject: | Board and Care Survey Field Debriefing |
Overview
A field debriefing for supervisors and interviewers who worked on the Board and Care Survey Missouri Pretest was held in St. Louis on February 12. Participants included survey sponsors, Field Division headquarters staff, the survey supervisor, Supervisory Field Representatives (SFRs), and Field Representatives (FRs). The survey sponsors attending were Bill Downs and Mary Naifeh from Housing and Household Economic Statistics Division and Bob Clark from the Department of Health and Human Services. I represented Field Division headquarters staff and chaired the debriefing proceedings.
The debriefing's objective was to gain a better understanding of field operations for the Board and Care Survey Pretest. Field Rep comments and concerns are helpful in planning a potential national Board and Care Survey. We wanted to learn what worked well, what did not work well, and what improvements the survey supervisor, SFRs, and FRs would suggest regarding procedures, materials, and the questionnaire.
Before the afternoon debriefing, we spent the morning observing Board and Care Survey field interviews the survey supervisor had assigned each St. Louis FR. The field visit helped us to evaluate respondent reaction to the survey and to understand field problems.
Survey Materials
During the debriefing, FRs had few comments about the Field Representative's Self Study. They felt that the Self Study provided a good orientation for the survey. Several FRs suggested that we increase the time allotted to complete the Self Study from 3 hours to 4 hours.
FRs and SFRs had more comments on the Field Representative's Manual. Several thought that a glossary was necessary. For instance, the terms "private residence" and "group home" should be defined to help FRs, classify units whose status was unclear. Decennial-released FRs were inclined to use the census definition of group home which requires the presence of 10 or more unrelated people, but the Board and Care Survey sample includes group homes with fewer than 10 people.
FRs found that the Manual answered most of their questions. The sections which were used most frequently included those on telephone techniques, vacancy rules, and mover rules. FRs suggested expanding the section on mover rules to include more information regarding follow up on movers. The survey supervisor, Donna Edwards, suggested that the manual should include instructions on what to do if the address is different from the address reported in the 1988 Dress Rehearsal.
The 1988 Dress Rehearsal map-spotted ARA maps were generally adequate to locate rural addresses. FRs did not report any significant problems associated with locating addresses.
The Questionnaire
The survey supervisor, SFRs, and FRs made several recommendations concerning the Board and Care Survey questionnaire. FRs recommended combining items 2 and 3, which identify the respondent's eligibility to answer the survey and their status on April 1, 1988. FRs suggested moving item 4, which verifies the address, to the front page of the questionnaire so FRs could refer to the respondent's address easily without flipping the page.
Several FRs found the wording of item 7 awkward, and recommended rephrasing it by deleting the reference period. Apparently, referencing the last 3 years caused some respondents who had nonrelatives currently living with them to respond negatively which skipped them past the questions about support services and characteristics of dependent nonrelatives. One FR thought questions on support services and health problems should be screened according to the age of the dependent population. The questions were designed with an adult dependent population in mind, so some questions do not apply to children who are dependent nonrelatives.
FRs recommended emphasizing "dependent" when asking about providing support services to nonrelatives. Healthy nonrelatives living together wanted to answer "yes" to support services questions (that is, they help each other with preparing meals and housekeeping). FRs had to explain that to qualify, the nonrelative must be dependent upon the care giver for these services.
Item 10 asks whether the nonrelative receives Social Security or Veterans payments because of a disability. Often, the care giver does not know whether elderly nonrelatives are receiving Social Security primarily because of age or, because of a pre-existing medical condition.
The St. Louis SFR suggested accepting either a number or a percentage in response to item 11 which lists the number of nonrelatives by age category. She found that group home administrators are more likely to know the percentage of residents who fall into each age category rather than the exact number.
FRs thought that the 8-minute time estimate to complete an average interview was reasonably accurate. Interviews at sample units with no dependent nonrelatives required considerably less time, though. FRs cited a range of 42 seconds to 2 hours to complete the interview.
Survey Procedures and Materials
FRs did not follow the suggested 3 callbacks for personal visit interviews. They found that limiting callbacks to just 3 did not allow them to get complete interviews in some instances. They recommended increasing the number of authorized callbacks.
FRs were asked whether adding flashcards would help them explain the definitions of support services, the types of disabilities that require custodial care, and the classifications of group homes. Most FRs did not recommend using flashcards since flashcards would simply be another item for which they would need to keep track.
A couple of FRs did recommend providing callback cards to help arrange appointments for return personal visits. Another FR recommended using "Type C" to remove certain units from the sample. For example, a number of sample addresses had been demolished since the Dress Rehearsal.
Respondent Reaction
FRs reported that respondents did not understand the survey, but were willing to tolerate an 8-minute interview since the FR was already there. Those respondents who reacted negatively considered the survey a waste of time and did not feel it pertained to them. Respondents had no specific reaction to the Letter from the Director -- most simply handed the letter back without reading it. In the sense of looking "official" though, the letter probably served a useful purpose.
Most FRs took very few proxy interviews. Some FRs guessed that only 1% of their interviews were by proxy. Proxies were limited to household members at private residences and to supervisory employees at group homes. FRs found that proxies were very knowledgeable. In fact, a couple of FRs suggested that group home administrators, bookkeepers, and head nurses who served as proxies were more knowledgeable than the proprietors and managers who are the preferred respondents.
Respondents needed explanations for some census concepts, such as "nonrelative" or "live here." This prompted FRs to question whether mail returns would be as accurate as personal visit and telephone interviews since mail return respondents had no one to explain census terms.
The St. Louis SFR said that during personal visit interviews she handed a blank questionnaire to the respondent so the respondent could follow along. This allowed the respondent to read definitions of support services which appear on the questionnaire and calmed respondent concerns about the nature of the interview.
Summary
Respondents generally were cooperative, although many did not understand the purpose of the survey. Respondents mentioned that they assumed since the survey was voluntary, they did not need to complete and return the questionnaire that they received in the mail.
FRs recommended a number of questionnaire changes which would help the interview go more smoothly, but they did not find the questionnaire especially difficult to use. FRs found that most of their cases ended in complete interviews.
cc: R. Blass (FLD) S. Lavin J. Jaworski W. Downs (HHES) M. Naifeh
APPENDIX F. COMPUTATIONS FOR RATIO OF IDENTIFIED TO EXPECTED NUMBER OF BOARD AND CARE PLACES
| BOARD AND CARE PLACES | ||
| Proposed fraction of total: | 1/10 of 1% | 1/20 of 1% |
1. Housing units and group quarters in dress rehearsal: 394,425 | 394.425 | 197.2125 |
2. Board and care places house nonrelatives of categories 9,10,13. Percentage of expected B&C places to places with these nonrelatives. | 394.425 / 15,875 = 2.48% | 197.2125 / 15,875 = 1.24% |
3. If the percentages in step 2 were evenly spread among places with nonrelatives of type 9,10 and 13, how many board and care places would we expect to find in the survey? | 0.0248 x 1754 = 43.499 | 0.0124 x 1754 = 21.7496 |
4. What is ratio of places identified in survey to expected places? | 157 / 43 = 3.65 | 157 / 22 = 7.13 |
| Repeating computations with housing units only--no group quarters. | ||
1. Housing units and group quarters in dress rehearsal: 393,711 | 393.711 | 196.855 |
2. Board and care places house nonrelatives of categories 9,10,13. Percentage of expected B&C places to places with these nonrelatives. | 393.711 / 15,161 = 2.6% | 196.855 / 15,161 = 1.3% |
3. If the percentages in step 2 were evenly spread among places with nonrelatives of type 9,10 and 13, how many board and care places would we expect to find in the survey? | 1466 x 0.026 = 38.116 | 1466 x 013 = 19.058 |
4. What is ratio of places identified in survey to expected places? | 50 / 38 = 1.32 | 50 / 19 = 2.63 |
APPENDIX G. COMPUTATIONS FOR ESTIMATES OF BOARD AND CARE PLACES
Computations for Estimate of Board and Care Places in the Census Dress Rehearsal Site and the United States
| Frame | Number of Board and Care Places | N x 1.11 x 6 (Long Form) | Rounded |
| Long, 1 NR | 13 | 86.58 | 87 |
| Long, 2 NR | 3 | 19.98 | 20 |
| 3+ NR | 34 | 34 | |
| Total | 141 | ||
| NR= Nonrelatives | |||
Long form board and care units are multiplied by 1.11 to account for the 90% response rate. They are multiplied by 6 because the long form was sent to a sample of approximately 1 in 6 households.
There were 22660 households in the census dress rehearsal site with one or more nonrelatives and 15164 households with nonrelatives of the three types used in the survey (roomer, boarder or foster child, housemate or roommate, and other nonrelative).
| For all nonrelatives: | For specified nonrelatives: |
| 141/22660 = 0.0062 | 141/15164 = 0.0093 |
The Current Population Survey for March, 1990 estimates there are 6,317,000 households with one or more nonrelatives. (The nonrelative's relationship to householder is not given.) Multiplying this by .0062 provides an estimate of board and care places in the U.S. if the distribution of board and care places by number of nonrelatives in the nation is similar to the distribution in the survey.
.0062 X 6,317,000 = 39,165
APPENDIX H. CPS, MARCH 1990, TABLE 16, NUMBER OF NONRELATIVES IN HOUSEHOLD
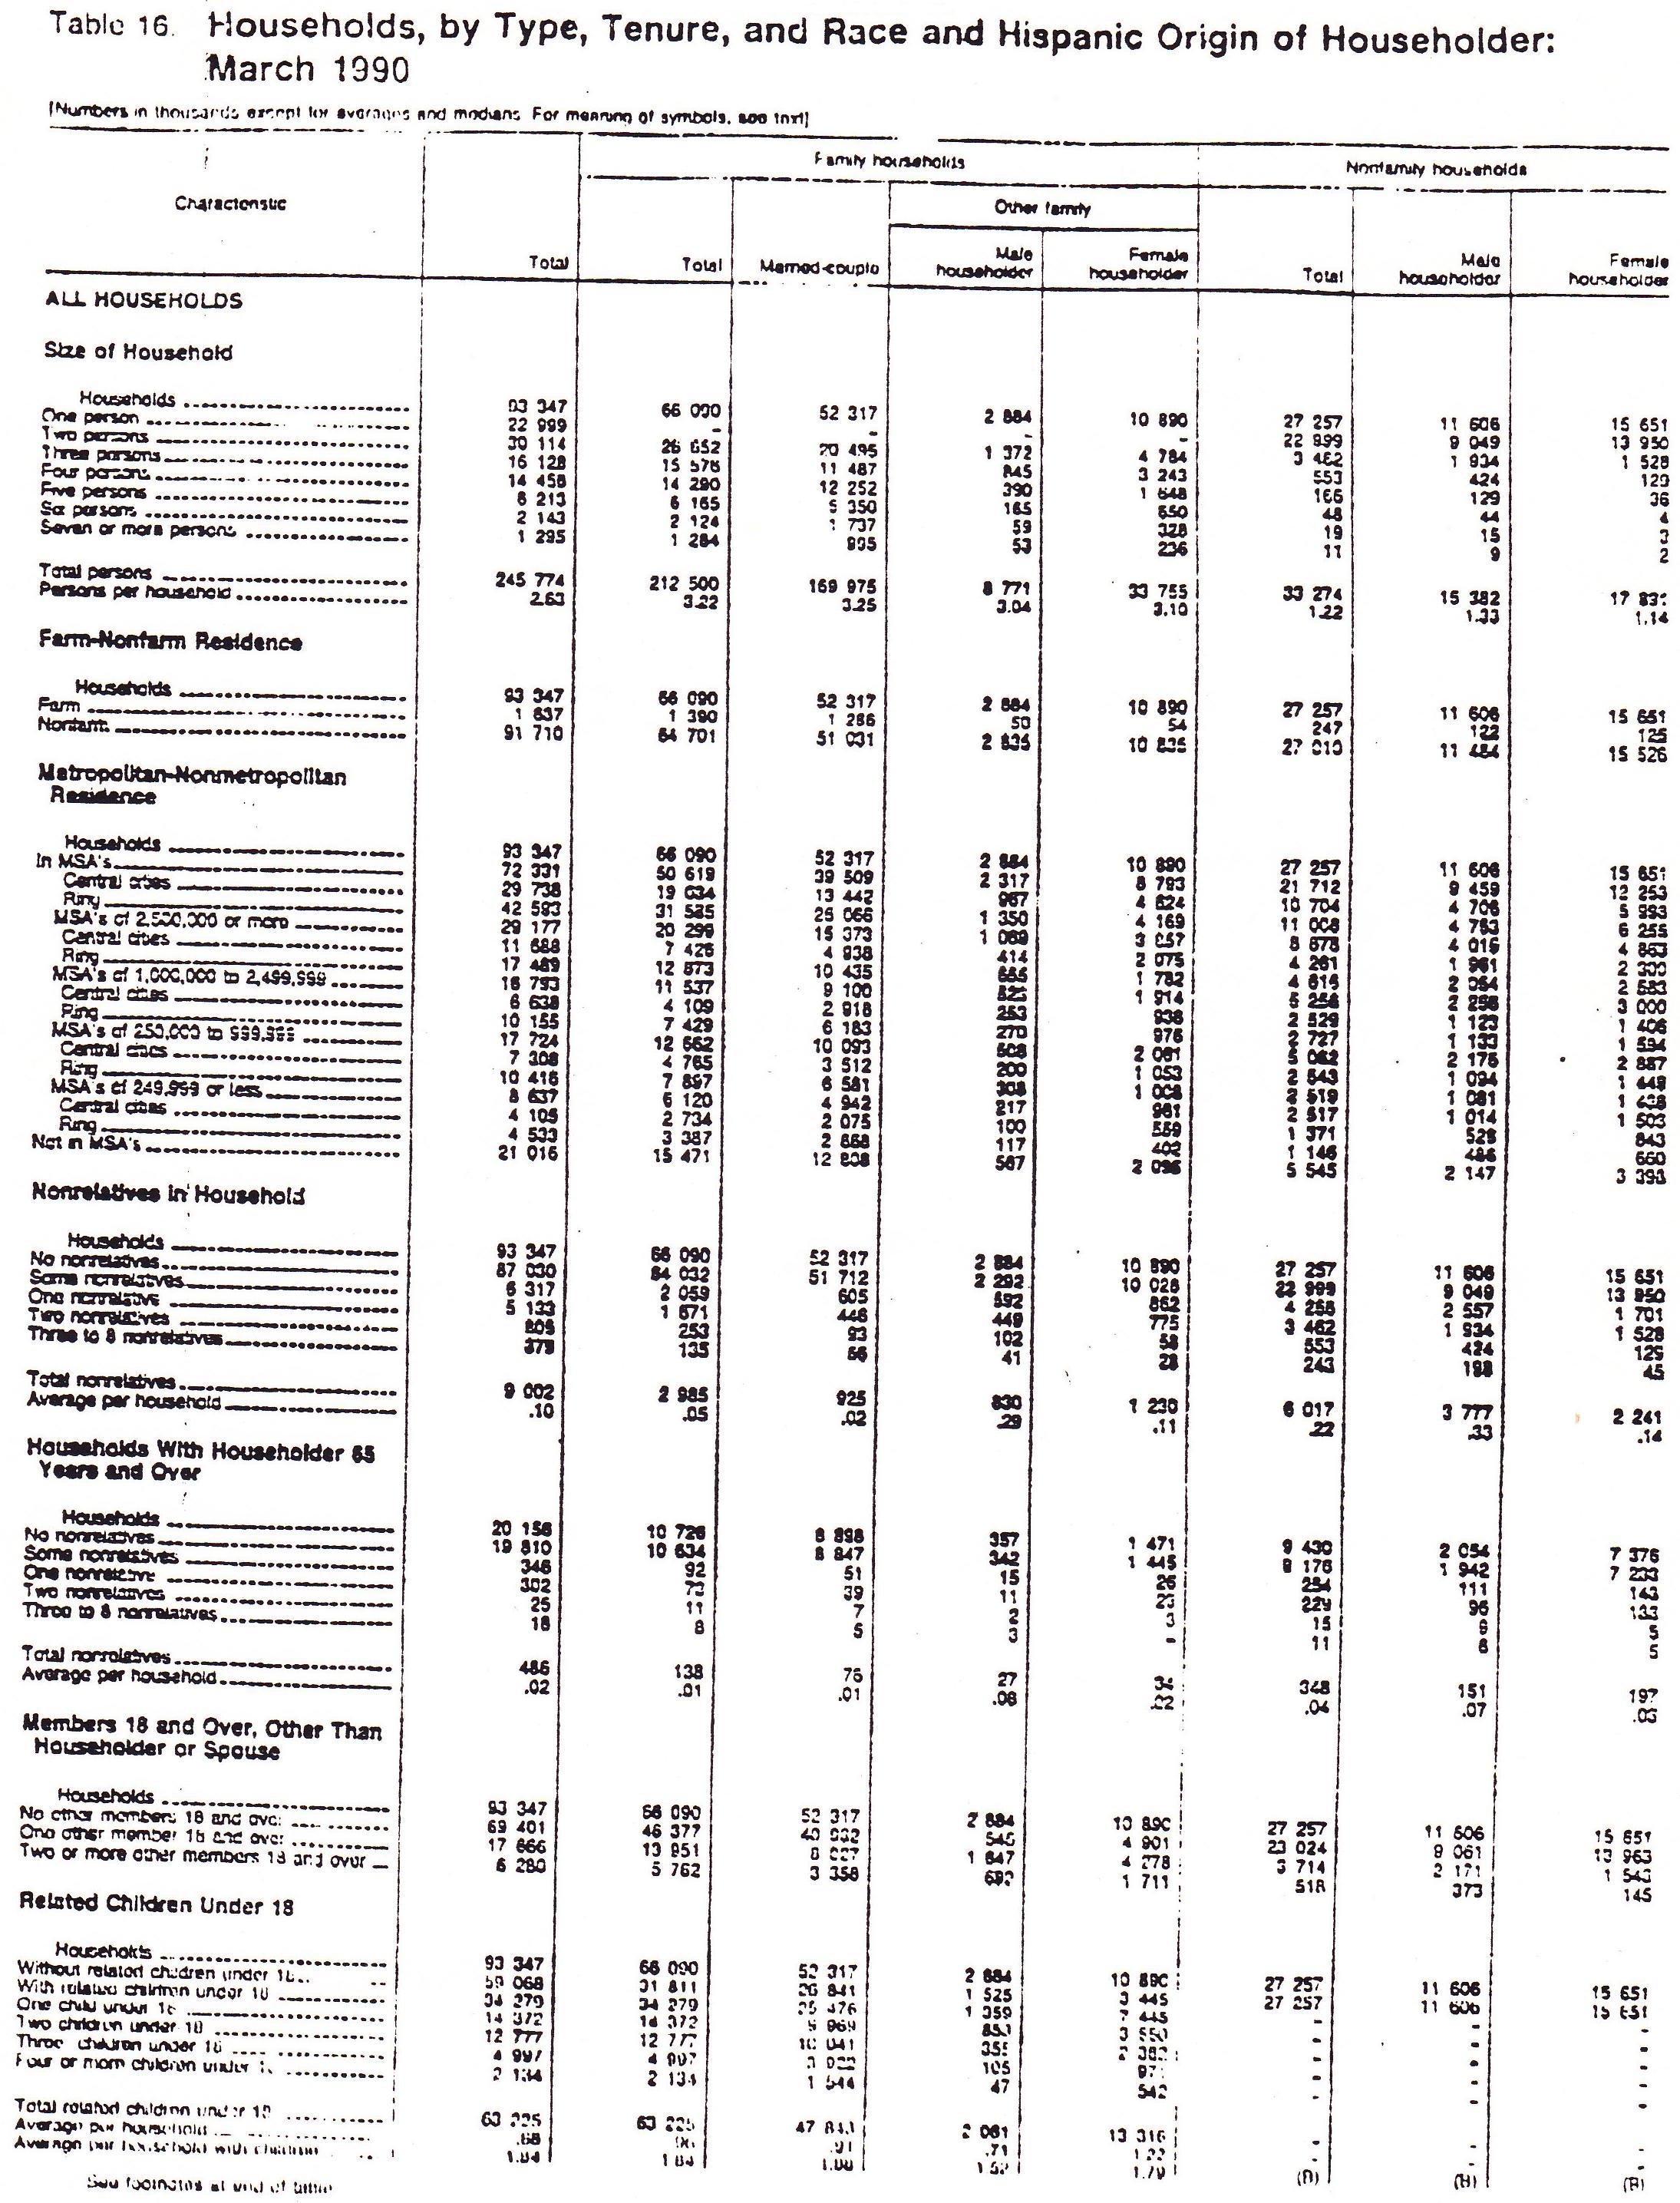
NOTES
-
This appendix is a recreation of the questions asked on the survey. It is not an exact replica of the form itself. See the PDF version (http://aspe.hhs.gov/daltcp/reports/haystk.pdf) of this report for a scanned version of the survey.
NATIONAL BOARD AND CARE SURVEY DESIGN REPORTS AVAILABLE
- Searching for a Needle in a Haystack: Creative Use of the Decennial Census Dress Rehearsal Data to Find Board and Care Places in Central Missouri
- Executive Summary http://aspe.hhs.gov/daltcp/reports/1992/haystkes.htm
- HTML http://aspe.hhs.gov/daltcp/reports/1992/haystk.htm
- PDF http://aspe.hhs.gov/daltcp/reports/1992/haystk.pdf
INSTRUMENTS AVAILABLE
- All Respondents Questionnaire
- HTML http://aspe.hhs.gov/daltcp/instruments/AllResp.htm
- PDF http://aspe.hhs.gov/daltcp/instruments/AllResp.pdf
- Interagency Councils Questionnaire
- HTML http://aspe.hhs.gov/daltcp/instruments/IntCoun.htm
- PDF http://aspe.hhs.gov/daltcp/instruments/IntCoun.pdf
- Licensure Questionnaire
- HTML http://aspe.hhs.gov/daltcp/instruments/Licensure.htm
- PDF http://aspe.hhs.gov/daltcp/instruments/Licensure.pdf
- Local Agency Questionnaire
- HTML http://aspe.hhs.gov/daltcp/instruments/LocalAg.htm
- PDF http://aspe.hhs.gov/daltcp/instruments/LocalAg.pdf
- Local Ombudsman Questionnaire
- HTML http://aspe.hhs.gov/daltcp/instruments/LocalOm.htm
- PDF http://aspe.hhs.gov/daltcp/instruments/LocalOm.pdf
- Payment/Eligibility Questionnaire
- HTML http://aspe.hhs.gov/daltcp/instruments/PayElig.htm
- PDF http://aspe.hhs.gov/daltcp/instruments/PayElig.pdf
To obtain a printed copy of this report, send the full report title and your mailing information to:
U.S. Department of Health and Human ServicesOffice of Disability, Aging and Long-Term Care PolicyRoom 424E, H.H. Humphrey Building200 Independence Avenue, S.W.Washington, D.C. 20201FAX: 202-401-7733Email: webmaster.DALTCP@hhs.gov
RETURN TO:
Office of Disability, Aging and Long-Term Care Policy (DALTCP) Home [http://aspe.hhs.gov/_/office_specific/daltcp.cfm]Assistant Secretary for Planning and Evaluation (ASPE) Home [http://aspe.hhs.gov]U.S. Department of Health and Human Services Home [http://www.hhs.gov]