
Monday, January 25, 2021
Printer Friendly Version in PDF Format (17 PDF pages)
Research Update on Racial and Ethnic Disparities in Dementia
Jennifer J. Manly
email: jjm71@cumc.columbia.edu
@ManlyEpic
@ManBrickLab
Columbia University Medical Center, Taub Institute for Research on Alzheimer's Disease and the Aging Brain
- Supported by
- NIA R01AG16206, R01AG028786, RF1AG056164 (PI: Manly)
- NIA RF1AG054070 (PIs: Manly/Brickman)
- NIA RF1AG058067 (PIs: Brickman/Manly)
- NINDS U01NS041588 (PIs: Howard/Manly)
- NIA RF1AG054023 (PI: Mayeux)
Figure 2. Dementia Incidence Rates per 1000 Person-Years by Age and Race-Ethnicity, 2000-2013
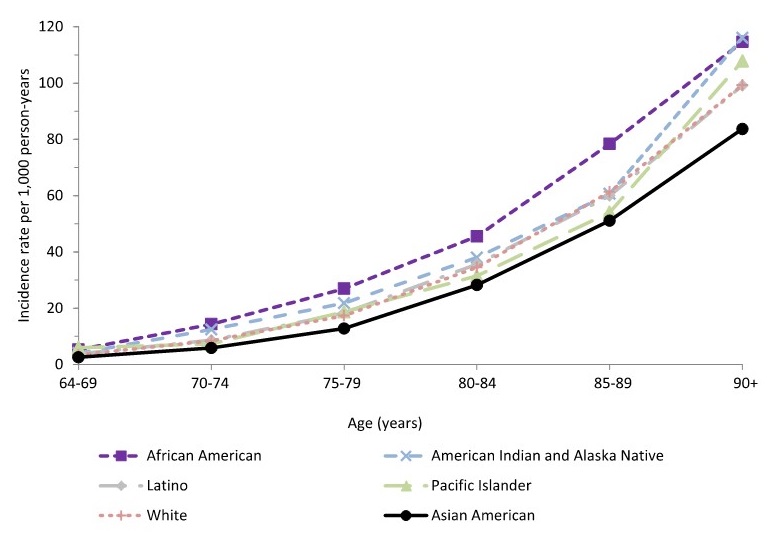 |
| Evidence of Racial/Ethnic Disparities, Kaiser Permanente Northern California, Mayeda et al., 2016 |
Trends in Relative Incidence and Prevalence of Dementia Across Non-Hispanic Black and White Individuals in the United States, 2000-2016
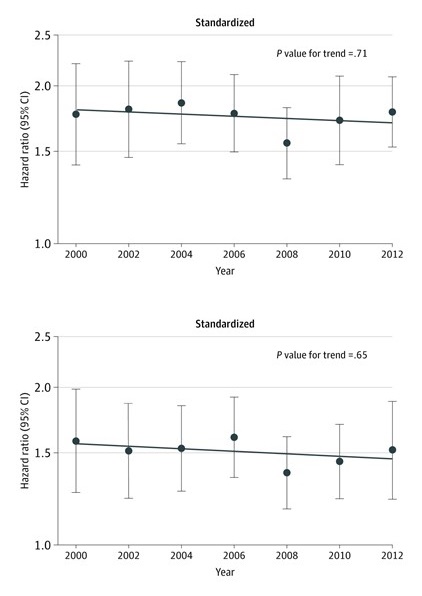 |
| Power et al., 2020 |
Cerebrovascular disease
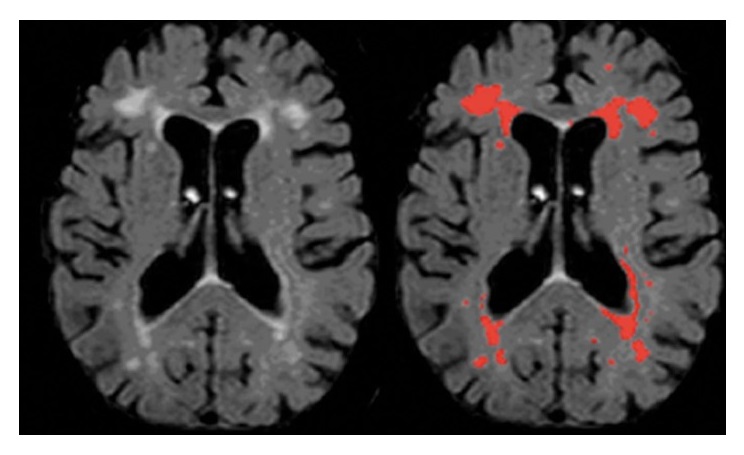 |
| Brickman et al., Arch Neurol, 2008 |
WMH and language
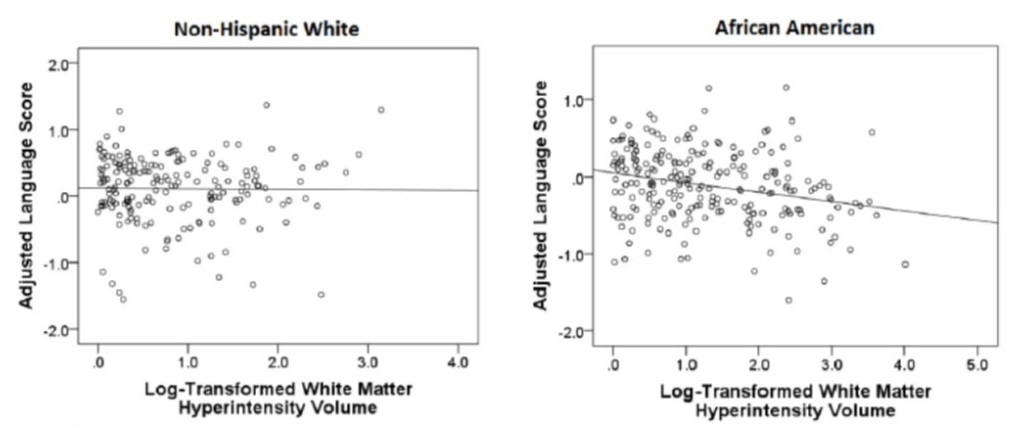 |
| Zahodne et al, CAR 2015 |
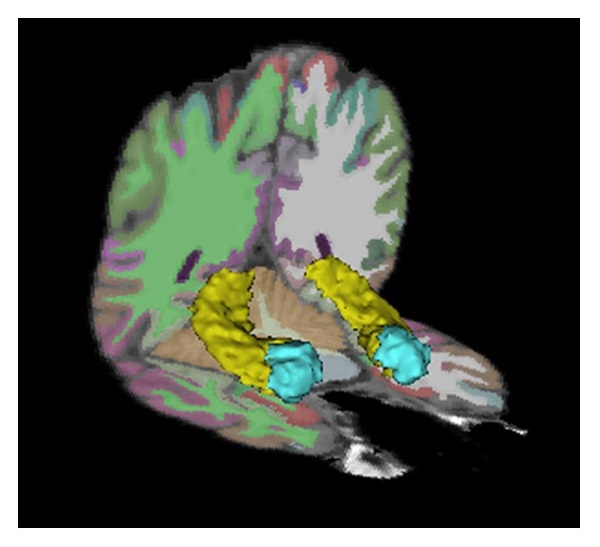
Hippocampal volume
 |
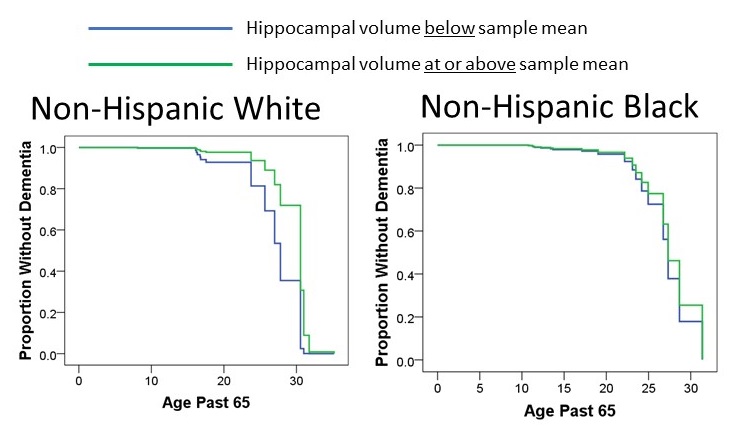
Hippocampal vol. and incident dementia
 |
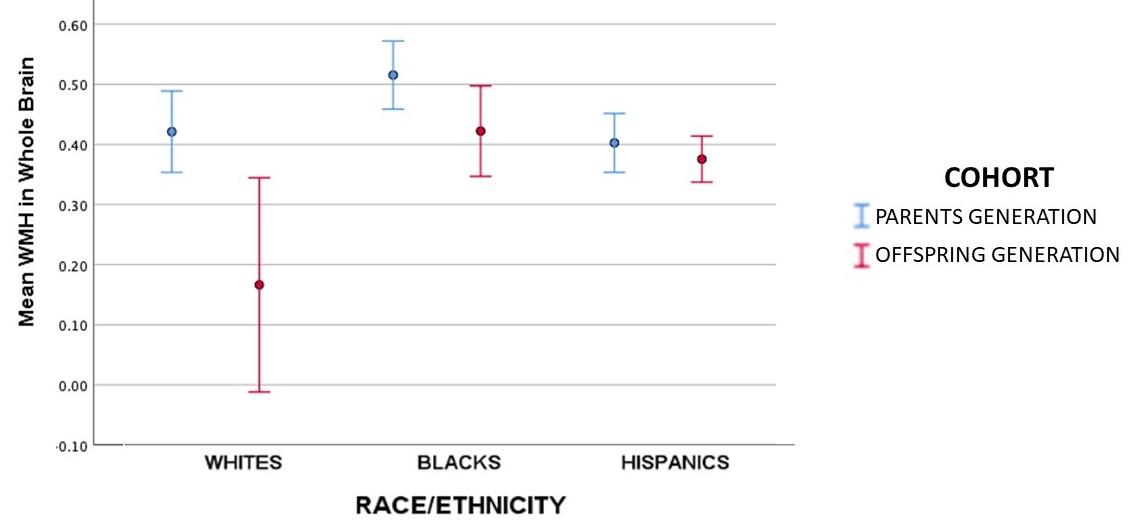
Intergenerational differences in white matter hyperintensity volume
 |
Morris et al. 2019 conclude that there are race-dependent biological mechanisms that contribute to expression of AD
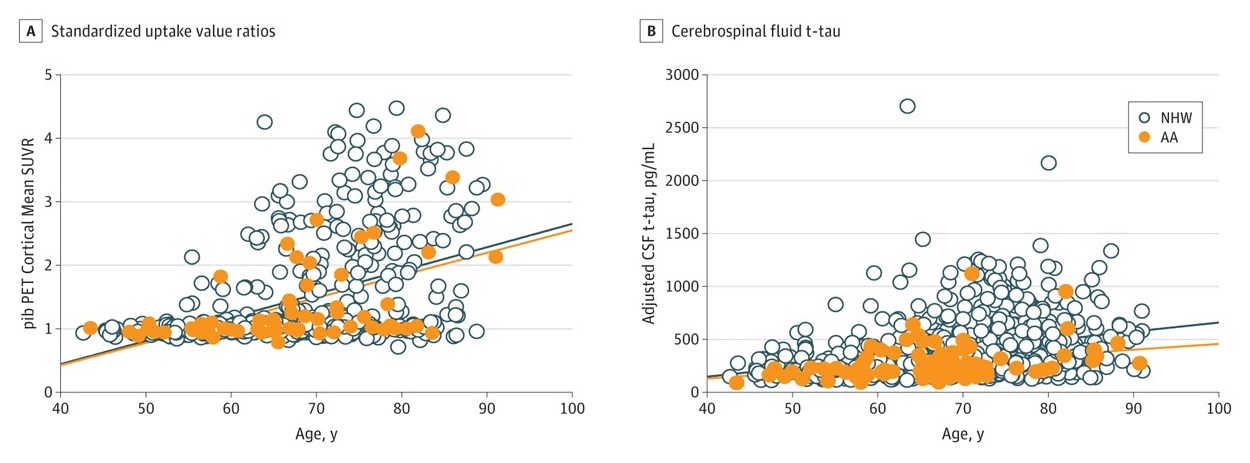 |
| Karin L. Meeker, PhD, Julie K. Wisch, PhD, Darrell Hudson, PhD, Dean Coble, PhD, Chengjie Xiong, PhD, Ganesh M. Babulal, PhD, OTD, Brian A. Gordon, PhD, Suzanne E. Schindler, MD, PhD, Carlos Cruchaga, PhD, Shaney Flores, BS, Aylin Dincer, BA, Tammie L. Benzinger, MD, PhD, John C. Morris, MD, and Beau M. Ances, MD, PhD. Socioeconomic Status Mediates Racial Differences Seen Using the AT(N) Framework. |
In NACC, Whites with MCI had higher likelihood of progression to dementia than Blacks with MCI… why?
 |
| Gleason et al., Alzheimer's and Dementia, 2019 |
Receiver operating curves for classification of clinical diagnosis of AD with plasma biomarkers
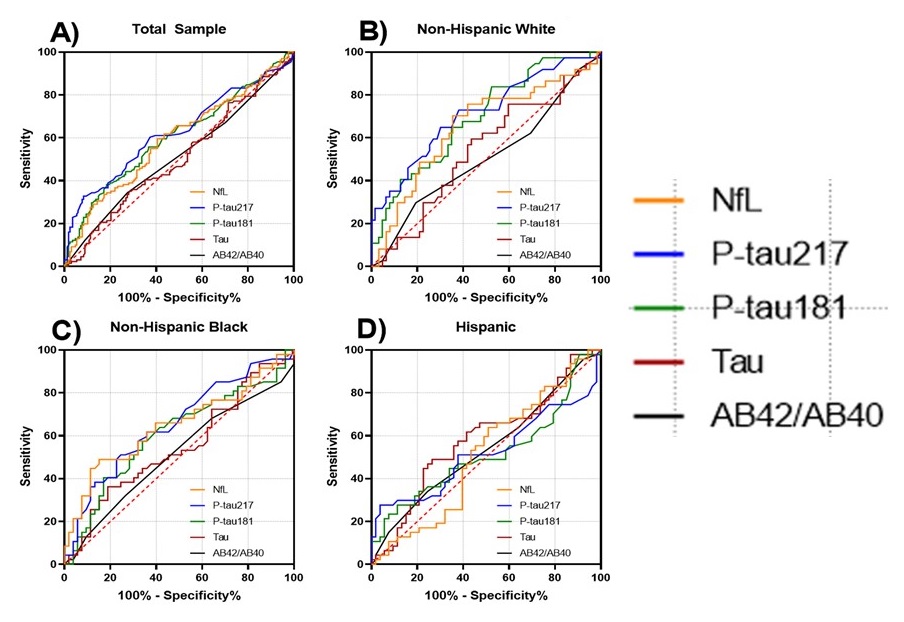 |
| Brickman et al., under review |
Alzheimer's Disease and All-cause Dementia Mortality by Race and Place of Birth
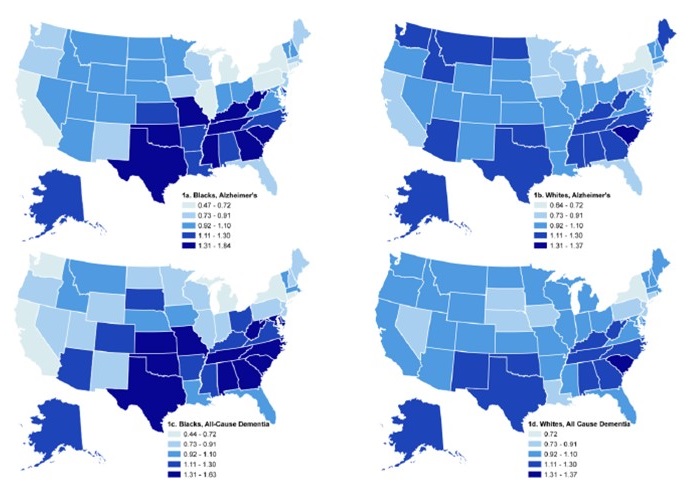 |
| Glymour et al., Alzheimer Dis Assoc Disord 2011 Odds ratios for Alzheimer's or all-cause dementia-related mortality in 2000, by race and state of birth, compared to the national average, based on empirical Bayes (shrinkage) random effect estimates from logistic models, US born blacks and whites ages 65-89. |
Racial disparities by US region of primary school education in HRS
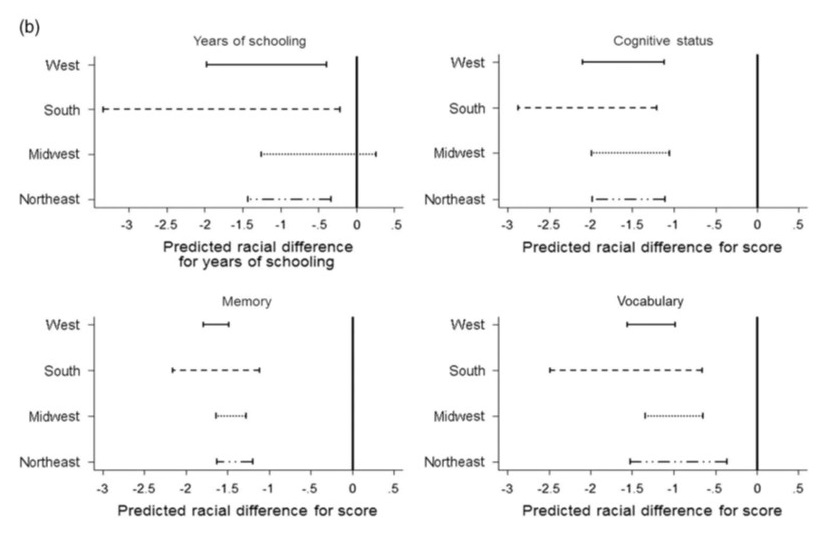 |
| Liu, Glymour, Zahodne, Weiss, and Manly, JINS (2015) |
Place of birth and dementia risk among Kaiser Northern CA participants
| Figure. Cumulative Incidence Dementia Adjusted for Death Rates by Birth Place |
|---|
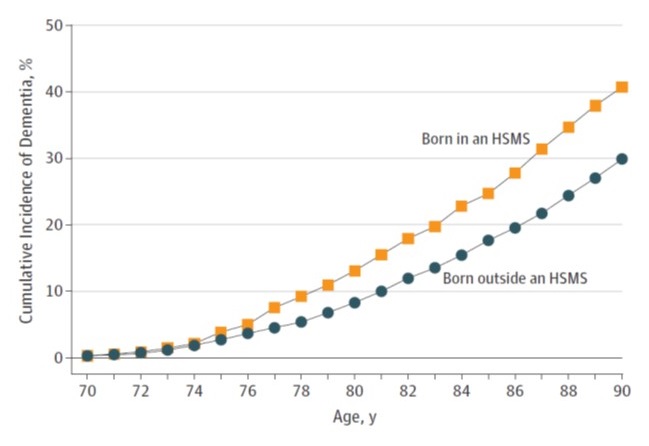 |
| High stroke mortality states: top quintiles of stroke mortality rates (i.e., states with >83 stroke deaths per 100 000 people older than 35 years) Alabama, Alaska, Arkansas, Louisiana, Mississippi, Oklahoma,Tennessee, SouthCarolina, and West Virginia. All participants had been in Northern California for 23+ years (since 1973) |
| Gilsanz et al., JAMA Neurol 2017 |
Global cognition, early-life residence, and schooling at age 12
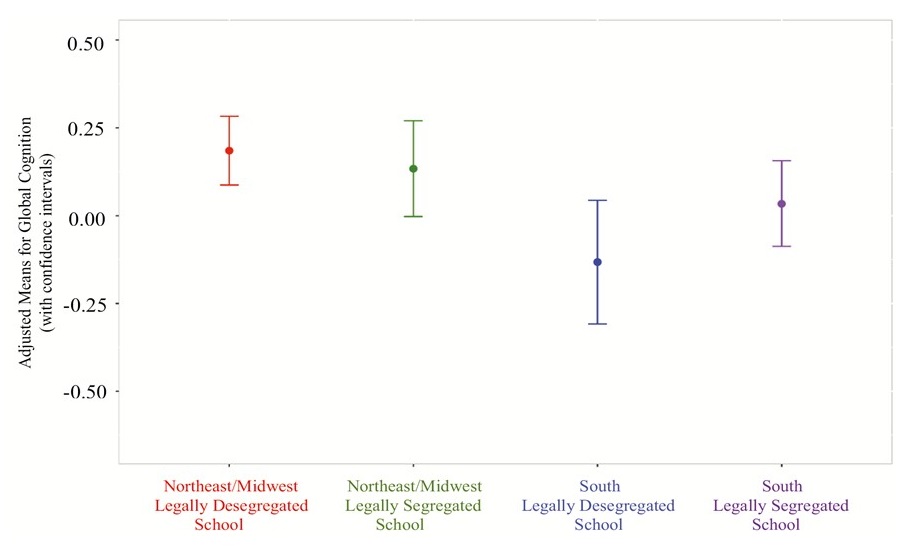 |
| Lamar et al., 2020 |
Counties with the highest % of Blacks and Latinos living with dementia also have fewer neighborhood resources
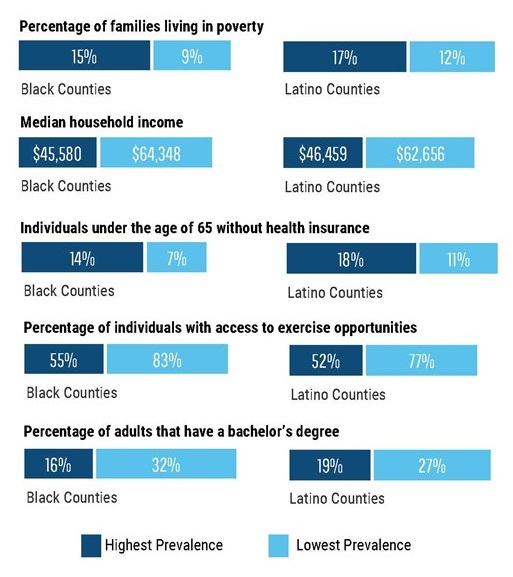 |
| Mudrazija, Vega, Resendez, and Monroe (2020) |
UK Policy Change Increased Executive Functioning in Late Life
| Figure 9. Effect of 1947 Reform on Executive Functioning (Conditional on Leaving Before 16) |
|---|
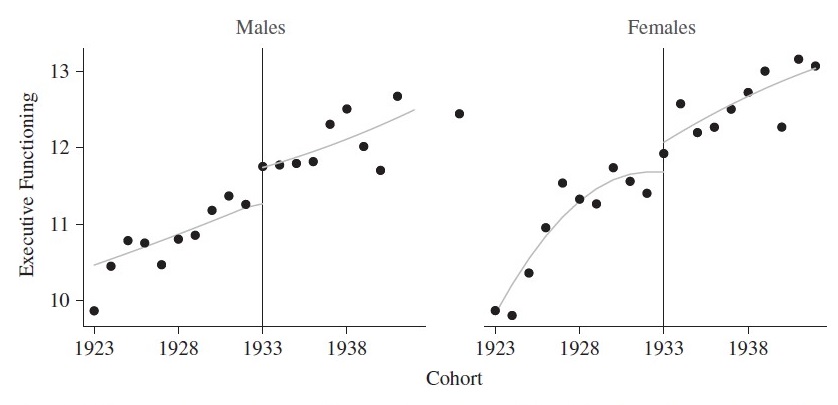 |
| From Banks and Mazzona, 2012 |
Natural Experiments: IV Estimates for Education
HRS through 2002, n=10,964
| Estimated effect of 1 year ed'n on cognitive test scores | ||||
|---|---|---|---|---|
| Model covariates | Memory | Cognition | ||
| βIV | 95% CI^ | βIV | 95% CI^ | |
| 1. Unadjusted | 0.33 | (0.27, 0.39) | 0.19 | (0.12, 0.26) |
| 2. Birthyear, and sex | 0.30 | (0.14, 0.46) | 0.34 | (0.05, 0.63) |
| 3. Model 2 + birth state | 0.18 | (0.02, 0.33) | 0.03 | (-0.22, 0.27) |
| 4. Model 3 + state condns | 0.34 | (0.11, 0.57) | -0.06 | (-0.37, 0.26) |
| 5. OLS estimates | 0.09 | (0.08, 0.10) | 0.15 | (0.14, 0.16) |
| Glymour, JECH, 2008 | ||||
Less memory decline in older adults born later
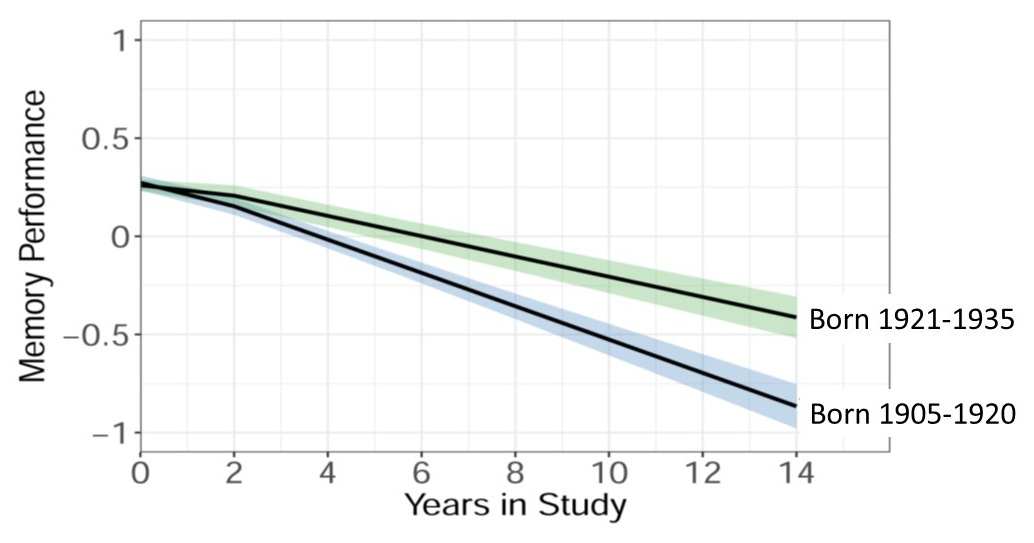 |
| Vonk et al., 2019 |
REGARDS Participants are more geographically diverse than other US cohorts of older adults
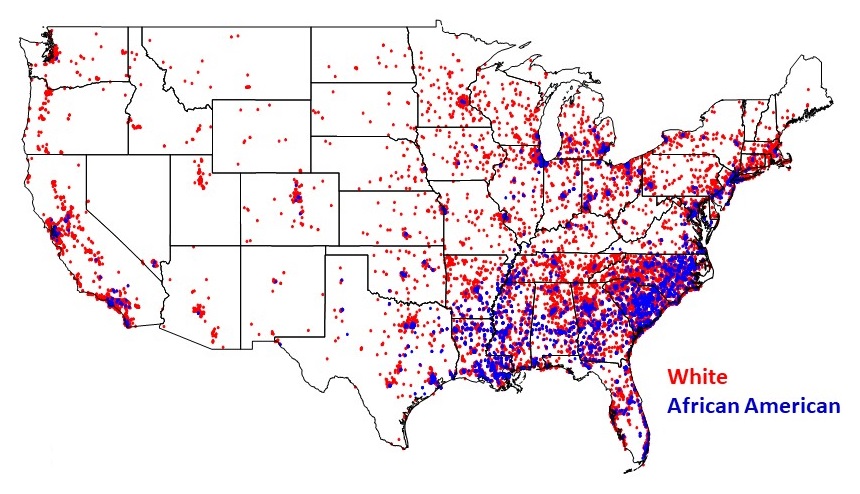 |
| N = 30,239 |
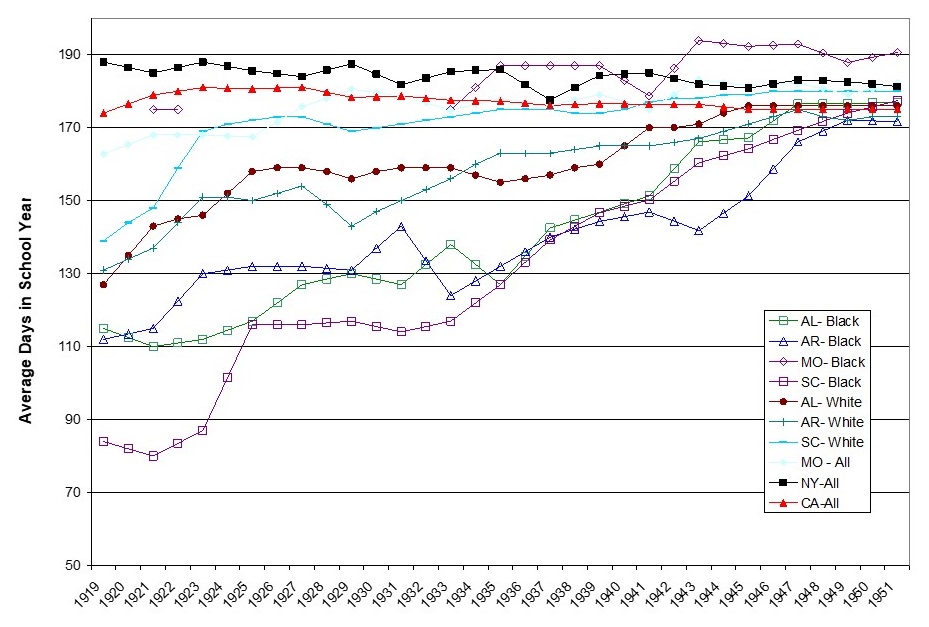
Length of School Year
 |
Student Teacher Ratio
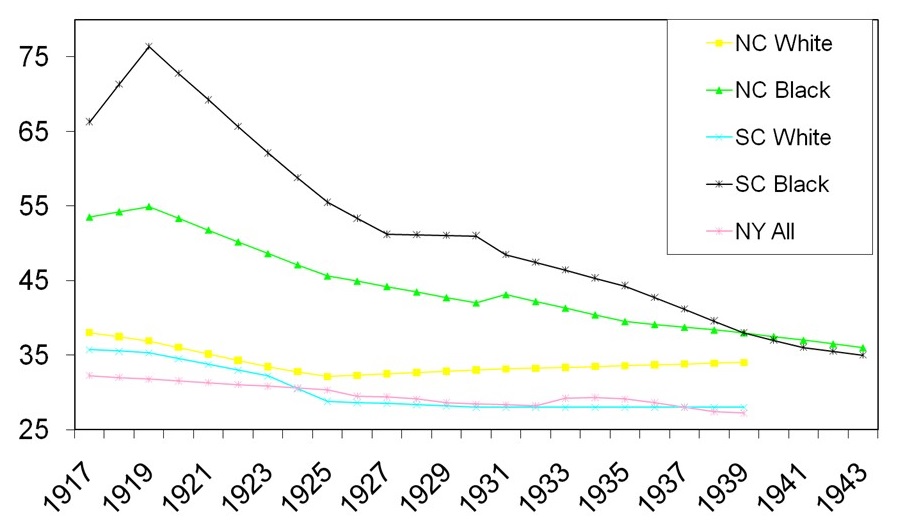 |
Historical investments in quality of schooling and cognition in later life
School quality provides less protection to Black peole from impairment
| Table 8. Odds Ratios for prediction of prevalent cognitive impairment (N=19,795) | ||||
|---|---|---|---|---|
| Variable | Model 1 | Model 2 | Model 3 | Model 4 |
| PPYEd | 0.61 (0.58, 0.63) | |||
| PPYED in BM | 0.86 (0.78, 0.95) | 0.79 (0.67, 0.92) | 0.80 (0.69, 0.94) | |
| PPYED in BW | 0.80 (0.73, 0.88) | 0.73 (0.63, 0.84) | 0.75 (0.64, 0.86) | |
| PPYED in WM | 0.73 (0.65, 0.83) | 0.61 (0.49, 0.75) | 0.63 (0.51, 0.78) | |
| PPYED in WW | 0.70 (0.60, 0.81) | 0.59 (0.47, 0.74) | 0.61 (0.49, 0.77) | |
| Model 3 = Model 2 + State Fixed Effects Model 4 = Model 3 + Parents Education Manly, Murchland, Glymour, et al., under review |
||||
Project Talent, 1960
- Nationally representative longitudinal study
- In 1960 377,015 9th-12th graders from 1,255 schools were assessed
- Schools were randomly sampled from cells based on region and type of school across the US
- Large number of siblings, including twins, within sampled schools
- Substantial minority representation within the sample
- All students in grades 9-12 were selected to participate in two full days of data collection
- Study collected extensive personality, knowledge, and cognitive ability data, and completion of an extensive demographic questionnaire
- Follow-up surveys were administered at 1, 5, and 11 years after each grade cohort graduated high school
Project Talent school quality factor
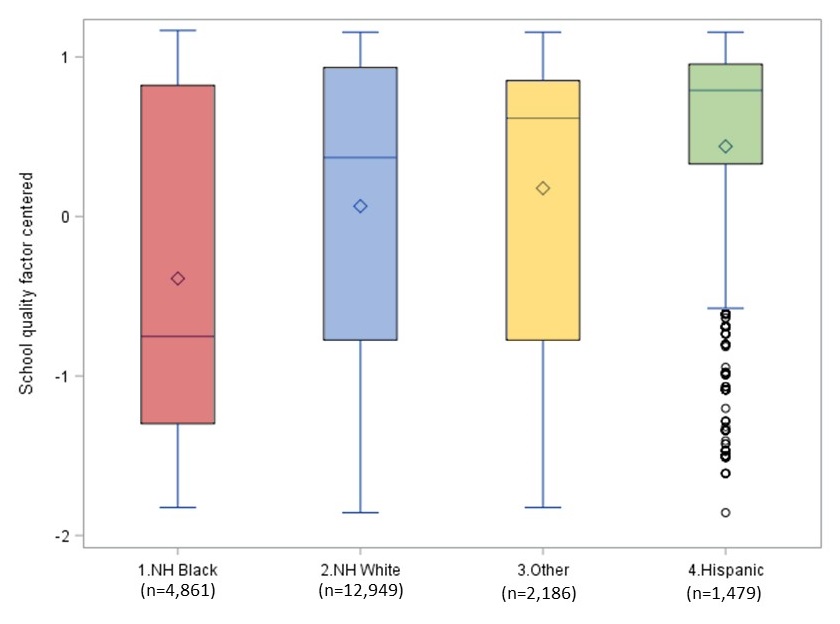 |
School quality association with SCC (AD8)
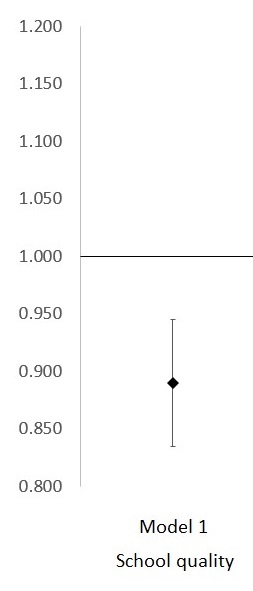 |
School quality and SCC by race/ethnicity
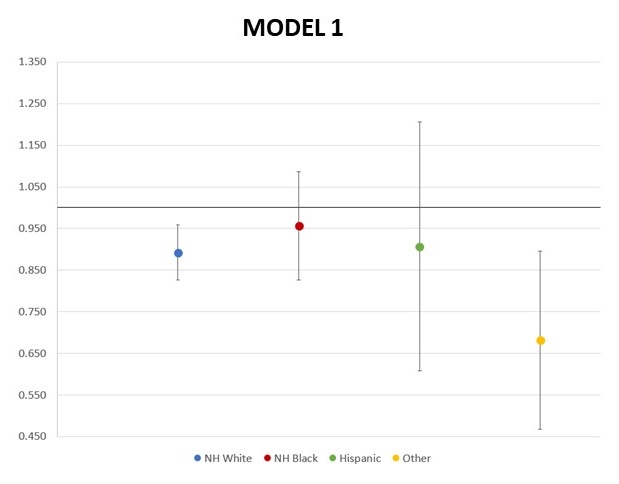 |
School Quality and Cognition
| Association* of change in school quality (SD) to level of cognitive abilities (SD) | |
|---|---|
| Variable | Beta (95% CI) |
| CERAD learning | 0.06 (0.01; 0.10) |
| CERAD delayed savings | 0.02 (-0.03; 0.07) |
| Animal fluency | 0.04 (-0.002; 0.09) |
| Letter F fluency | 0.05 (0.005; 0.09) |
| *Linear regression adjusting for 1960 cognitive aptitude, sex/gender, age, and a composite measure of parental socioeconomic status, and census region | |
Years of school contributes to cognitive reserve in Whites, but not Black or Hispanic older adults
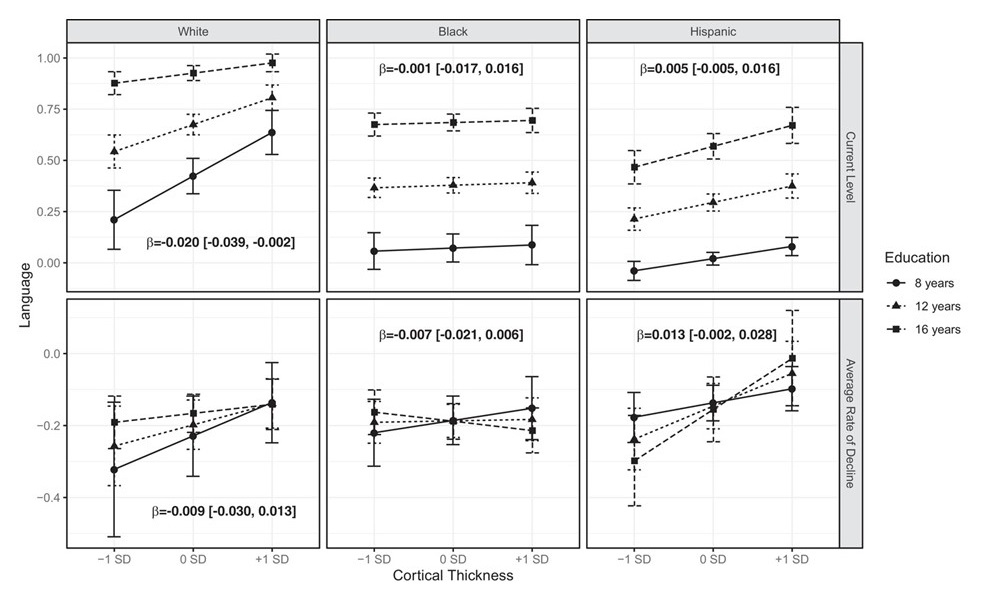 |
| Avila et al., 2020 |
NIA Disparities Research Framework
| FUNDAMENTAL FACTORS: Ethnicity, Gender, Age, Race, Disability Status, Identity | |||
|---|---|---|---|
| Environmental | Sociocultural | Behavioral | Biological |
| Geographical and Polical Factors Structural Bias Immigration/Documentation Criminalization Residential Segregation Urban/Rural Toxins/Exposures |
Cultural Factors Values Prejudice Norms Traditions Religion Collectictive Responses |
Coping Factors Active Coping Problem Solving Stress Management Cognitive Reframing Emotional Regulation |
Physiological Indicators Co-Morbidies Cardiovascular Sympathetic Nervous System HPA Axis Inflammation |
| Socioeconomic Factors Education Income/Wealth Occupation Limited English |
Social Factors Institutional Racism Family Stress Financial Stress Occupational Stress Residential Stress Social Mobility Social Network |
Psychosocial Risk/Resilience Social Support Discrimination Pessimism Optimism Control |
Genetic Stability Telomere Attrition Epigenetic Alteration Loss of Proteostasis |
| Health Care Access Insurance Quality Literacy Numeracy |
Psychological Factors Self Concepts Stigma Bias Loneliness Stereotypes |
Health Behaviors Smoking Anger/Violence Alcohol/Drug Nutrition Physical Activity |
Cellular Function and Communication Deregulated Nutrient Sensing Mitochondrial Dysfunction Cellular Senescence Cellular Stress Response Stem Cell Exhaustion Intercellular Communication |
| Lifecourse Perspective | |||
| Hill et al., 2015 | |||
Eliminating brain health disparities
- Changing healthy behaviors and lifestyle choices will not eliminate disparities in dementia (fundamental social causes)
- There is evidence that lifecourse social factors, most patterned by structural racism, influence dementia risk and resilience
- Include population feasible biomarkers to determine relative contribution
- Economic and social policies are brain health policies
- Policies to repair the intergenerational impact of racism and discrimination on wealth
- Invest in schools and teachers to increase educational quality
- Provide funds to decrease neighborhood inequalities
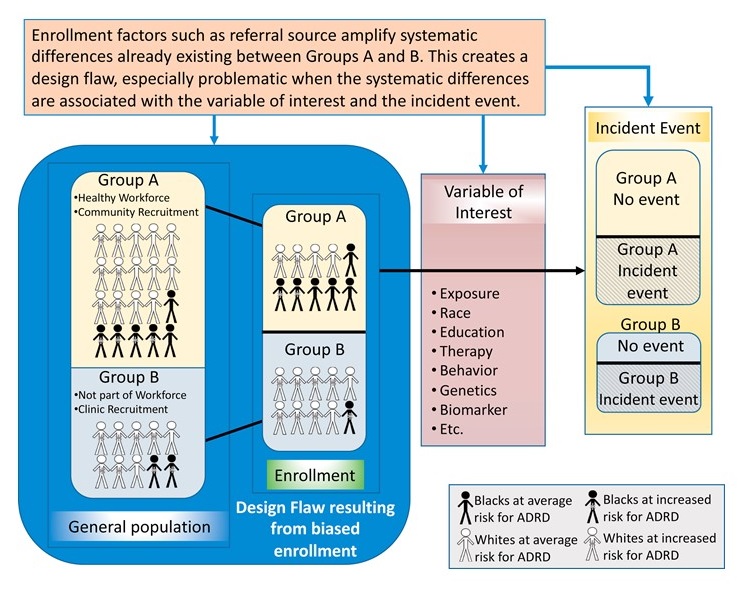
- The most informative research on mechanisms of dementia disparities is not from convenience samples, but from population representative random samples
Files
Document
mtg39-slides3.pdf (pdf, 2.61 MB)