
U.S. Department of Health and Human Services
TANF Recipients as Potential Long-Term Care Workers: An Assessment of the Prospects in the District of Columbia, Illinois, Maryland and South Carolina
Gretchen Kirby, LaDonna Pavetti, Jeffrey Max and Jesse Gregory
Mathematica Policy Research, Inc.
March 2005
This report was prepared under contract #HHS-100-03-0024 between the U.S. Department of Health and Human Services (HHS), Office of Disability, Aging and Long-Term Care Policy (DALTCP) and Mathematica Policy Research, Inc. For additional information about the study, you may visit the DALTCP home page at http://aspe.hhs.gov/daltcp/home.htm or contact the ASPE Project Officer, Charlene Liggins, at HHS/ASPE/DALTCP, Room 424E, H.H. Humphrey Building, 200 Independence Avenue, SW, Washington, DC 20201. Her e-mail address is: Charlene.Liggins@hhs.gov.
The opinions and views expressed in this report are those of the authors. They do not necessarily reflect the views of the Department of Health and Human Services, the contractor or any other funding organization.
TABLE OF CONTENTS
- I. INTRODUCTION
- II. CHARACTERISTICS OF LTC JOBS AND WORKERS
- A. Employment Requirements
- B. Required and Desired Job Skills
- C. Characteristics of LTC Jobs
- D. Characteristics of LTC Workers
- III. CHARACTERISTICS AND CIRCUMSTANCES OF TANF CASE HEADS IN SELECTED STATES
- A. Characteristics of Jobs Held by TANF Recipients
- B. Employment Experiences of TANF Case Heads
- C. Prevalence of Potential Liabilities for Employment Among TANF Case Heads
- IV. SINGLE-PARENT TANF HEADS AS LTC WORKERS
- A. The Influence of Liabilities on the Likelihood of Substantial Employment
- B. The Influence of Multiple Liabilities on the Likelihood of Substantial Employment
- C. Estimating the Potential Pool of LTC Workers Among Single-Parent TANF Case Heads
- D. Characteristics and Liabilities of Potential LTC Workers
- E. Conclusion
- APPENDICES (also available as separate PDF files)
- APPENDIX A: Summary Table for the TANF Caseload Surveys (PDF File)
- APPENDIX B: Measures of Personal Liabilities (PDF File)
- APPENDIX C: State-Specific Data on Employment, Demographic Characteristics and Employment Liabilities (PDF File)
- APPENDIX D: State-Specific Predicted Employment Probabilities (PDF File)
- LIST OF FIGURES
- FIGURE III.1. Current Employment Status of the Heads of Single-Parent TANF Cases in Selected States
- LIST OF TABLES
- TABLE II.1. Employment Requirements for Nurse Aides and Home Health Aides
- TABLE II.2. Job Skills for Nurse Aides and Home Health Aides
- TABLE II.3. Characteristics of Nurse Aides
- TABLE III.1. Characteristics of the Heads of Single-Parent TANF Cases in Select States
- TABLE III.2. Comparison of Characteristics of TANF Case Heads and TANF LTC Workers in Select States
- TABLE III.3. Characteristics of Current or Most Recent Jobs Held by TANF Case Heads
- TABLE III.4. Compensation on Current or Most Recent Job Held by TANF Case Heads
- TABLE III.5. Characteristics of LTC Jobs Currently or Recently Held by TANF Case Heads
- TABLE III.6. Potential Liabilities for Employment
- TABLE III.7. Summary of Potential Liabilities for Employment of TANF LTC Workers, Currently Employed TANF Case Heads, and All TANF Case Heads in Select States
- TABLE IV.1. Employment Probabilities by Characteristics of the Heads of Single-Parent TANF Cases in the Four Study States
- TABLE IV.2. Employment Probabilities by Characteristics of the Heads of Single-Parent TANF Cases in Each Study State for Liabilities with a Significant Influence on Employment
- TABLE IV.3. Employment Probabilities by Number of Liabilities for TANF Case Heads in All Four Study Sites
- TABLE IV.4. TANF Case Heads by Potential for Employment in LTC Industry
- TABLE IV.5. Characteristics of TANF Case Heads in the Potential Pool of LTC Workers and Current or Recent TANF LTC Workers
- TABLE IV.6. Potential Liabilities for Employment of TANF Case Heads in the Potential Pool of LTC Workers and Current or Recent TANF LTC Workers
- TABLE A.1. Summary Table for the TANF Caseload Surveys
- TABLE A.2. Post-Stratification Adjustment
- TABLE A.3. Sampling Weights
- TABLE A.4. Non-response Adjustment Factors
- TABLE A.5. Post-stratification Adjustments
- TABLE A.6. Final Weights
- TABLE C.1. Employment Characteristics of the Heads of Single-Parent TANF Cases in Select States
- TABLE C.2. Characteristics of the Heads of Single-Parent TANF Cases in Select States
- TABLE C.3. Characteristics of Current or Most Recent Job Held by TANF Case Heads
- TABLE C.4. Compensation on Current or Most Recent Job Held by TANF Case Head
- TABLE C.5. Any Performance of Job Tasks on Current or Most Recent Job Among TANF Cases
- TABLE C.6. Regular Performance of Job Tasks on Current or Most Recent Job Among TANF Cases
- TABLE C.7. Physical Health
- TABLE C.8. Mental Health
- TABLE C.9. Chemical Dependence
- TABLE C.10. Transportation Use and Problems
- TABLE C.11. Potential Liabilities for Employment
- TABLE C.12. Number of Potential Liabilities for Employment
- TABLE D.1. Employment Probabilities by Characteristics of the Heads of Single-Parent TANF Cases in the District of Columbia
- TABLE D.2. Employment Probabilities by Characteristics of the Heads of Single-Parent TANF Cases in Illinois
- TABLE D.3. Employment Probabilities by Characteristics of the Heads of Single-Parent TANF Cases in the Maryland
- TABLE D.4. Employment Probabilities by Characteristics of the Heads of Single-Parent TANF Cases in South Carolina
I. INTRODUCTION
Attracting and retaining employees to care for the elderly, disabled, and chronically ill is a growing concern to program administrators in the long-term care (LTC) industry and policymakers in the broader health care arena. Broader demographic and economic factors combined with issues internal to the LTC industry are creating a shortage of workers that is expected to increase dramatically over the next several years. In 2006, the first members of the baby boom generation will turn 60. As this generation ages, the nation will experience an unprecedented increase in the size of the elderly population. As a result, the demand for LTC workers, specifically nurse and home health aides, is expected to increase by 40 percent. At the same time, recipients of cash assistance (i.e., welfare) from the Temporary Assistance for Needy Families (TANF) program are seeking opportunities to move from welfare to work within an environment marked by time limits and work requirements. In this paper we analyze survey data from four states to determine the extent to which current TANF recipients potentially could fill some of the unmet demand for LTC workers.
In 2000, there were 1,090,000 nurse and home health aides employed in nursing and personal care facilities, residential care, and home health care services. By 2010, Bureau of Labor Statistics (BLS) estimates project a need for a total of 1,515,000 workers in these areas (DHHS, DOL 2003). The largest growth in the demand for LTC workers is expected in home health care services because LTC trends indicate that a growing proportion of elderly individuals are choosing to remain in their homes rather than move into nursing homes. As a result of these trends, BLS estimates indicate that personal and home care assistance will be the fourth-fastest growing occupation by 2006 (Stone and Wiener 2001).
While there will be great demand for LTC workers, several factors are limiting their supply. These factors are primarily economic and result from the internal characteristics of LTC jobs and the external influences of local economies. LTC jobs tend to pay low wages, offer few benefits, and are physically demanding. The desirability of these jobs will vary with the vigor of the local economy. For example, the relative availability of other entry-level jobs can make attracting and maintaining LTC workers competitive.
Many initiatives have been suggested or implemented to address the mismatch between supply and demand in the LTC industry. These supply-side solutions focus on either: (1) increasing the attractiveness of LTC jobs through wage supplements, increased fringe benefits, or developing career ladders, and (2) identifying and developing new pools of LTC workers. Welfare recipients are one such potential pool of workers.
Welfare reform legislation in 1996 introduced increased work requirements for recipients of TANF. Recent proposals for reauthorization of TANF under consideration in Congress include requirements that states engage a majority of TANF families in work or other related activities for 40 hours per week. To meet these new requirements, states are likely to be looking for innovative strategies to help TANF recipients find long-term employment--and the LTC industry may present such an opportunity.
The LTC industry's need for workers and TANF recipients' need for jobs could be mutually beneficial if, indeed, recipients' characteristics, skills, and circumstances match the requirements, accessibility, and availability of LTC jobs. In this paper, we provide a brief overview of what is already known about the characteristics of LTC jobs and the individuals who hold them, focusing on nurse aides and home health aides. We then use survey data from the District of Columbia and three states (Illinois, Maryland, and South Carolina) to examine the characteristics and circumstances of all single-parent TANF case heads, and of those recipients who are or have recently been employed in the LTC industry. Finally, we use multivariate analysis to predict the likelihood of employment among current TANF recipients and use the results to estimate the proportion of the current TANF caseload that could potentially be employed in the LTC industry and describe their characteristics. We conclude this paper with a brief discussion of the potential policy and/or program initiatives that this analysis suggests.
II. CHARACTERISTICS OF LTC JOBS AND WORKERS
Nurse aides and home health aides are the front-line workers who provide direct care to our nation's elderly, disabled, and chronically ill in LTC facilities (typically nursing homes) or in the individual's home. While they are often tasked with many functions--ranging from providing basic personal and nursing care to acting as patient confidante and family counselor--they are considered low-skilled workers in a field with little job advancement. In this chapter, we examine the employment requirements for nurse aides and home health aides, the skills that are required and desired by employers, and the characteristics of these jobs in terms of pay, benefits, and retention. We then look at what is currently known about the basic demographic characteristics of nurse aides in both institutional and home-based care settings.
A. Employment Requirements
Employment in paraprofessional direct care positions such as nurse aides and home health aides does not require an advanced degree, or even completion of high school. Nevertheless, there are some requirements for employment in these LTC positions that fall into two categories (1) training and certification, and (2) personal background and characteristics (Table II.1).
1. Training and Certification
The Omnibus Budget Reconciliation Act of 1987 (OBRA 87) introduced minimum requirements for nurse aide training and certification by creating the Nurse Aid Training and Competency Evaluation Program (NATCEP). Nurse aides employed in nursing care facilities that receive Medicaid or Medicare reimbursement must be certified, and states must establish training programs that assist individuals in gaining certification. For certification, candidates must complete a state-approved training program that meets the minimum federal requirements of 75 hours of training, with at least 16 hours devoted to supervised clinical training (Rehnquist 2002). They must also pass a state competency exam comprised of a written and/or oral component and a skills-demonstration component.
States may include additional requirements or set higher minimums for the number of training hours. All of our study sites have training requirements that are higher than federal minimums. Illinois and the District of Columbia require 120 hours of training, Maryland requires 100 hours, and South Carolina 80 hours (Table II.1). Illinois, Maryland, and South Carolina more than double the federal standard by requiring 40 hours of clinical training.
| TABLE II.1. Employment Requirements for Nurse Aides and Home Health Aides | |||||||
| Nurse Aides | Home Health Aides | ||||||
| Training/Certification Requirements | |||||||
| Federal Requirements | |||||||
Certification required for employment in nursing homes participating in Medicaid and Medicare. Certification requirements:
| Training and competency exam (similar to certification requirements) required for home health aides employed by Medicare-certified home health agencies. | ||||||
| State Requirements | |||||||
States must meet federal minimums for hours of training. The study states have set the following minimums:
| Requirements for other home health aides vary by state and, often, employer. Minimum requirements tend to be age (at least 18) and literacy. | ||||||
| Personal Characteristics | |||||||
| No criminal background | No criminal background | ||||||
| Good physical health | Good physical health | ||||||
| Good mental health | Good mental health | ||||||
| Good oral and written English skills | Good oral and written English skills | ||||||
| High school/GED may be preferred, but not required by employer | High school/GED may be preferred, but not required by employer | ||||||
| Driver's license may be preferred or required by employer | |||||||
| SOURCES: Rehnquist (2002); PHI (2003); District of Columbia DOH (2004); Illinois DOPH (2004a); Illinois DOPH (2004b); Joslin et al. (2002); Maryland COHMH (2004). | |||||||
Half of all states, including three of our study sites--the District of Columbia, Illinois, and South Carolina--have one prescribed statewide training curricula for nurse aides (DHHS 2002). The majority of state-approved training programs (60 percent) are provided through nursing homes or other LTC facilities. In the District of Columbia, however, there are no facility-based training programs for nurse aides. There were five non-facility-based training programs available to the District of Columbia residents in 2002. Programs that are not facility-based are typically conducted in educational settings such as high schools or community colleges by either non-profit or for-profit entities.
Upon gaining employment, certified nurse aides are required by federal standards to participate in a minimum of 12 hours of in-service training each calendar year. This additional training is intended to address any skill deficiencies or provide new or supplemental information that can improve the care provided to residents. All of our study sites maintain, but none exceed, this 12-hour in-service training requirement.
Home health aides provide nursing and personal care assistance to enable individuals to live in their own homes or a community-based setting, rather than an institution. Home health aides may be self-employed or employed by a home health care agency that works in much the same way as a temporary placement agency. Training requirements for home health aides vary by state and can be quite minimal, such as requirements that a worker be at least 18 years of age and able to read, write, and speak English. However, home health aides who serve Medicare patients must be certified and are subject to the same training requirements as nurse aides in Medicare- and Medicaid-certified nursing facilities, as discussed above (Long and Pindus 1994).
2. Personal Characteristics
Beyond training requirements, there are a number of personal characteristics that serve as prerequisites for employment as a nurse aide or home health aide (Table II.1). Primary among these is that any individual placed on a state nurse aide registry or employed by a home health agency must undergo a criminal background check and have no convictions considered to be disqualifying. Individuals seeking employment in these direct care positions must also be in good physical and mental health, able to withstand the extreme physical and emotional demands placed on them. These jobs require assisting patients in activities of daily living (ADLs) such as bathing and dressing, which may require physically helping patients out of bed and assisting them in their movement. Nurse aide positions, in particular, require long hours of standing or walking as well as exposure to hazardous chemicals and infectious bodily fluids. In fact, workplace injuries rank among the highest in nursing homes. In 1999, 13 in every 100 employees in a nursing home incurred an injury, compared with 8 in every 100 construction workers (Scanlon 2001). Working in direct care, individuals often develop emotional ties to their patients and the patient's family and, as a result, it can be emotionally wearing to watch as a patient grows sicker and suffers indignities (Joslin et al. 2002). LTC workers can also experience emotional strains that result from the abusive behavior of patients. It is important that workers can handle the emotional strains of caring for patients who face serious physical and/or mental illnesses and who may be approaching the end of their lives.
Another requirement, as specified by state documents, is the ability to read, write, and follow instructions, typically in English or in a language understood by a large percentage of patients under care. As front-line workers, nurse aides and home health aides often serve as the primary source of day-to-day information about patient status and progress and must communicate this information effectively to registered nurses and/or other health care providers. They are also required to follow specific instructions about the care each patient must receive. Communication among all members of a patient's care team is critical to the overall quality of patient care; primary care providers must be able to understand instructions from superiors and provide information back to them (Joslin et al. 2002).
Nurse aides and home health aides are not typically required to hold a high school diploma or its equivalent, although some employers may have this requirement. Generally, aides are required to be 18 years or older and have completed at least eight years of school. Unlike nurse aides, home health aides may have patients in multiple locations and must travel to their homes. Some home health agencies may therefore require that employees have a valid driver's license in order to lessen the risk of transportation problems that can disrupt patient care.
B. Required and Desired Job Skills
The job skills required of nurse aides are taught in state-approved training programs as required under federal law. These skills fall into six specific areas, as listed in Table II.2: (1) personal care skills, such as taking and recording vital signs, measuring and recording height and weight, caring for a patient's environment, recognizing and reporting abnormal changes in body functioning, (2) basic nursing skills, such as bathing, dressing, toileting, skin care, eating, transferring, positioning, turning, (3) basic restorative skills, such as addressing behaviors of patients with dementia, communicating and responding to residents with cognitive impairments (4) mental health and social service skills, such as training patients in self care, maintaining range of motion, bowel and bladder training, caring for and using prosthetic and orthotic devices, (5) ability to care for cognitively impaired resident care, such as responding to residents' behavior, raising awareness of developmental tasks associated with the aging process, communication with patient's family for emotional support, and (6) protecting residents' rights by providing privacy and confidentiality, promoting residents' rights to make personal choices to accommodate their needs.
The job skills that may be required of home health aides are more diverse (Long and Pindus 1994). Some may be certified to perform medically oriented services that are reimbursable by Medicare and therefore have skills comparable to those of a nurse aide. Others may not handle the more severe or debilitating conditions faced by patients in nursing homes, but are expected to provide a range of non-medically oriented services. In contrast to nurse aides, many home health aides are expected to perform basic household maintenance tasks (light cleaning, preparing meals) and assist patients in cognitive and life management activities. These latter activities are often referred to as instrumental activities of daily living (IADLs) and include assisting patients with shopping, management of medical appointments, and money management.
Aside from the required skills necessary to successfully perform the functions of a nurse aide or home health aide, there are additional skills and personal characteristics that can increase the quality of care provided to patients and, possibly, the level of job satisfaction among workers (Table II.2). These "desired" skills may not determine entry into the LTC field, but are necessary for building an effective and dedicated workforce. To develop this list, we examined the LTC literature for qualities associated with job retention, and those considered important to increasing the overall quality of the workforce and, ultimately, the care of patients.
| TABLE II.2. Job Skills for Nurse Aides and Home Health Aides | |
| Nurse Aides | Home Health Aides |
| Required Job Skills | |
| Personal care skills | Personal care skills |
| Basic nurse skills | Basic nurse skills |
| Basic restorative skills | Ability to complete household maintenance tasks |
| Ability to address mental health and social service needs | Ability to assist in cognitive and life management activities |
| Ability to care for cognitively-impaired residents | Others such as basic restorative skills and ability to care for cognitively-impaired clients are dependent on employer and clients |
| Knowledge of residents rights | |
| Desired Skills | |
| Strong interpersonal skills; cultural competency; sensitive to individual needs and preferences | Strong interpersonal skills; cultural competency; sensitive to individual needs and preferences |
| Self-motivated; ability to work independently | Ability to work without direct supervision |
| Time management | Trustworthy |
| Stress management | Mature; reliable |
| Ability to juggle multiple tasks and responsibilities | |
| SOURCES: Rehnquist (2002); PHI (2003); Joslin et al. (2002); Stone and Wiener (2001). | |
Employers seek both nurse aides and home health aides with strong interpersonal skills. Workers must interact with patients on an intense one-on-one basis. Those who are sensitive to patients' needs and preferences, and respectful of different cultures and customs will be most successful at making patients feel safe, comfortable, and supported (Joslin et al. 2002).
All aides, regardless of the care setting, must be self-motivated and able to work independently. In nursing homes, nurse aides report to registered nurses who often have multiple duties and many staff members to supervise (Stone and Wiener 2001). In this setting, it is advantageous to have nurse aides who are confident enough to perform their functions without a great deal of supervision. Home health aides have no direct supervision on the job site and, therefore, must be able to respond to unexpected situations using their own judgment.
The care setting does determine the importance of some desired skills over others. In an institutional care setting, nurse aides often care for 10-15 patients on one shift (Rehnquist 2002). Individuals who possess the skill to manage time and stress, and who have the ability to juggle multiple tasks and responsibilities tend to remain in nurse aide positions (Stone and Wiener 2001). Home health aides may not have the same kind of pressures. Rather, it is important to employers and patients that they are trustworthy because they are performing their work in patients' homes when others may not be present. For home health aides, maturity and reliability are also important given the independent nature of their work and patients' dependence on them to show up and perform the tasks expected (PHI 2003).
C. Characteristics of LTC Jobs
LTC jobs, specifically nurse aide and home health aide positions, are entry-level, low-wage positions. As with child care, LTC workers themselves are highly valued by the families with whom they work, but more broadly, their jobs are viewed as low-skilled and somewhat undesirable. Direct care positions provide low wages, limited benefits, and little opportunity for wage growth and career advancement.
1. Wages and Benefits
LTC positions provide pay that is slightly above minimum wage. As a result, nearly half of all LTC workers live in households with incomes below 200 percent of the federal poverty level.1 Wage estimates generally range between $7.00 and $9.00 per hour. In 1999, the mean hourly wage of all direct care positions--including nursing aides, orderlies, attendants, home health care aides, and personal and home care aides--was $8.59 (Scanlon 2001). The mean hourly wage of direct care positions in our study states ranged from $7.54 in South Carolina to $9.29 in the District of Columbia. The mean hourly wage was $8.16 in Illinois and $8.98 in Maryland. For comparative purposes, these wage levels are slightly higher than or comparable to those of housekeepers and fast food cooks in our study sites, but lower than factory workers.
Nurse aides, particularly those with certification, receive higher wages than less regulated home health care aides. In 2000, the median hourly wage among nurse aides, orderlies, and attendants was $8.89 based on data from the BLS. In comparison, the median hourly wage of home health care and personal aides was $7.50 (DHHS, DOL 2003). An analysis of median hourly wages for direct care positions in residential settings in 2000, found that home health aides generally earned higher median wages than personal aides and attendants (PHI 2003). Home health aides' wages ranged by state from a low of $6.60 in Texas to a high of $11.45 in Connecticut, presumably reflecting differing economic conditions, costs of living, and demand for LTC workers. According to this study, in 2000, the average median hourly wage for home health aides across the country was $8.23.
Direct care workers have lower rates of health insurance coverage when compared with all workers as a whole. Overall, 16 percent of all workers did not have health insurance coverage in 1999, while 25 and 32 percent of nurse aides and home health aides, respectively, went uninsured (Scanlon 2001). About one in every ten aides was covered by Medicaid, with rates of 9.9 percent for workers in nursing homes and 11.1 percent for those in home-based settings. Just over two of every five U.S. workers have pension coverage, a rate that is 20 to 25 percentage points higher than that among direct care workers.
Working in an institutional setting may have some advantage over home-based care when it comes to benefit receipt. Based on 1999 BLS data, higher proportions of nurse aides working in nursing homes had employer-sponsored health insurance and pension coverage than did home health care aides (Scanlon 2001). Nearly three in every five nursing home aides had employer-sponsored health insurance, compared with about one in every two home health aides. One in every four nursing home aides had pension coverage, compared with one in every five home health aides.
2. Shifts and Hours
The existing literature on LTC has scant specific information on the hours and shifts that are typical of jobs in this area. However, it can be expected that nurse aides in nursing homes are likely to have varied shifts to cover the round-the-clock care needed for some patients in these settings. In contrast, home health aides are predominantly expected to work during standard daytime hours. But the number of hours of work per week is likely to be higher and more stable among nurse aide positions in nursing homes than home health aide positions. Home health aides, particularly those who work for independent clients rather than home health agencies, may find it difficult to accumulate an adequate number of hours of work per week (PHI 2003). In addition, home health aides who care for multiple clients must travel between client homes and are rarely compensated for this additional time.
3. Retention
Nursing home administrators are increasingly concerned with high turnover rates that are costly to the institution and disruptive to the staff and to the care that residents receive. Estimates on turnover rates range dramatically across studies, with some nursing homes reporting rates of 100 percent or more over the course of a year (Stone and Wiener 2001). On average, the national turnover rate for direct care workers is estimated to be between 40 and 75 percent (PHI 2003). While these rates are high and of concern, they tend to reflect turnover among a relatively small percentage of LTC workers. The majority of LTC workers remain in the field for some time; about one in five workers churn through the industry, accounting for most of the turnover (Joslin et al. 2002). As is true in most industries, those workers who leave tend to do so within the first year (PHI 2003; Joslin et al. 2002).
Some of the impediments to the recruitment of LTC workers also lead workers to leave their jobs. Nurse aides and home health aides report low wages and poor benefits as primary reasons for leaving jobs. Other reasons are more job-specific. Nurse aides often cite high stress and low job satisfaction as reasons for leaving. Some individuals find it difficult to handle the time pressures associated with caring for multiple residents in a nursing home setting. Nurse aides who leave also tend to feel undervalued and underutilized in the care planning for residents (Stone and Wiener 2001). Nurse aides have the most frequent and consistent contact with nursing home residents and often want an avenue for input into patient care plans. Those who express dissatisfaction with their job tend to feel discounted by health care professionals and isolated from the decisions affecting the residents. Other reasons that nurse aides cite for leaving jobs include difficulty getting along with co-workers and/or supervisors (PHI 2003). Although home health aides do not encounter these issues in their one-on-one work with clients, they do report experiencing a similar lack of respect and feeling undervalued. In addition, home health aides list inflexible work hours among the reasons for leaving LTC jobs.
D. Characteristics of LTC Workers
Nurse aides and home health aides are predominantly low-educated women with children under the age of 18. Few men work in these particular LTC positions; about nine in every ten workers are female. About three of every four nurse aides in nursing homes and two of every three home health aides have attained an educational level of no more than high school (Table II.3). While the majority of nursing home and home health aides are white and have been married at some point, they are more likely to be nonwhite, unmarried and with a child under the age of 18 than the general workforce (Scanlon 2001). For example, a GAO analysis of 1998-2000 March Supplement data from the Current Population Survey (CPS) found that 26 percent of the general workforce was non-White (not shown), compared with 43 percent of nurse aides and home health aides.
With a basic understanding of the characteristics of LTC workers and the jobs they hold, we turn, in the next chapter, specifically to TANF recipients to assess how closely they may match the needs of the LTC industry.
| TABLE II.3. Characteristics of Nurse Aides | ||
| Nurse Aides Working In | ||
| Nursing Homes | Home Health Care(Home Health Aides) | |
| Gender | ||
| - Female | 90.9 | 89.2 |
| - Male | 9.1 | 10.8 |
| Average age | 37.0 | 41.3 |
| Race/Ethnicity | ||
| - White, non-Hispanic | 56.6 | 48.5 |
| - African-American, non-Hispanic | 31.8 | 33.8 |
| - Hispanic and other | 11.5 | 17.6 |
| Marital Status | ||
| - Married | 39.4 | 43.5 |
| - Never married | 36.8 | 26.9 |
| - Widowed, divorced, separated | 23.8 | 29.5 |
| Education | ||
| - Less than high school diploma/GED | 22.6 | 21.4 |
| - High school diploma/GED | 50.0 | 40.7 |
| - More than high school diploma/GED | 27.3 | 37.9 |
| Children | ||
| - None | 43.7 | 49.9 |
| - Any under 18 years | 56.3 | 51.1 |
| Unmarried with children | 32.4 | 24.6 |
| Immigration | ||
| - Native born | 88.9 | 79.6 |
| - Immigrant | 11.1 | 20.4 |
| SOURCE: GAO analysis of combined 1998, 1999, and 2000 CPS, March Supplements. Adapted from Scanlon (2001). | ||
III. CHARACTERISTICS AND CIRCUMSTANCES OF TANF CASE HEADS IN SELECTED STATES
To assess the degree to which single-parent TANF case heads can serve as a promising source of LTC workers, we can examine the extent to which their demographic and personal characteristics fit with what is known about those of successful LTC workers and the requirements of LTC jobs. In this chapter, we make use of a rich set of survey data available from three states--Illinois, Maryland, and South Carolina--and the District of Columbia to conduct an analysis of the match between the characteristics of TANF recipients and those desired in LTC workers. This analysis is guided by the following research questions:
- How do the demographic characteristics of TANF case heads compare with the desired characteristics of LTC workers?
- How do the characteristics of the jobs typically held by TANF case heads compare with those in the LTC industry?
- What is the prevalence of specific employment liabilities among TANF case heads, particularly those that could inhibit employment in the LTC industry?
The data for this analysis were gathered through a common survey instrument, the TANF Caseload Survey, that collects data on the characteristics, circumstances, and job readiness of single-parent TANF case heads. The survey was fielded in six states to a random sample of single-parent families receiving TANF benefits at the time the survey sample was selected. (See Appendix A for an overview of the survey sample.)
While the survey was not developed specifically for this study, the use of a common survey instrument makes the data comparable across the sites and enables a rich secondary analysis of how well-matched TANF case heads are to employment in the LTC industry. These surveys were designed to collect information not easily obtainable from state administrative records. Thus, they provide a rich source of data on challenges commonly faced by TANF recipients. These include personal challenges such as physical and mental health problems, domestic violence, learning disabilities, and chemical dependency and situational challenges such as problems locating child care or transportation, providing specialized care for a friend or family member or housing instability.
The TANF Caseload Survey data have some limitations with implications for the findings presented in this report. As with all survey-based findings, there is the possibility of recall errors in responses to survey questions, bias resulting from non-response by some sample members, and misreporting in responses to sensitive questions. The degree of recall errors in these survey-based findings is likely to be minimized because of the short timeframe between sampling and conducting the interviews, and the short survey field periods in each of the sites. The surveys achieved relatively high response rates, ranging from 72 to 78 percent.2 Nevertheless, this means that 22 to 28 percent of sample members did not complete an interview, either because they were not reached or because they ended the interview before completion. All data have been adjusted to account for survey non-response by weighting the respondents on the basis of characteristics obtained from state TANF administrative records (Appendix A provides a description of the survey and the weighting procedures).
The TANF Caseload Surveys were not fielded in a random set of states in order to be representative of the nation. Instead, they were fielded in states that responded to a Request for Proposals and were awarded grants from the U.S. Department of Health and Human Services Office of the Assistant Secretary for Planning and Evaluation. As such, the findings in this report apply only to the study sites and cannot be generalized to all TANF recipients or to all states in the nation.
A. Characteristics of Single-Parent TANF Cases
Similar to the characteristics of LTC workers as presented in Chapter II, TANF case heads are nearly all women, with low levels of education, and children under the age of 18 (Table III.1). Women head nearly all (98 percent) of the single-parent TANF cases in each of the four sites. Given that TANF supports low-income families with children, virtually all of the cases have children under the age of 18.3 TANF households have a median number of two children present. The majority of single-parent TANF households in the four sites have children under the age of five, with the median age the youngest child being two years in half of the sites, and three years in the other half.
TANF case heads in the study sites reported lower levels of education than that seen among LTC workers. While 77 and 79 percent of nurse aides in home-based settings and nursing homes, respectively, have at least completed high school or its equivalent (Table II.3), only 56-63 percent of TANF case heads across the sites achieved this level of education (Table III.1). The proportion of case heads that have education beyond high school ranged from 28 to 33 percent in the study sites. While this is comparable to the prevalence of post-secondary education among nurse aides in home-based settings (27 percent), it is lower than the 38 percent found among nurse aides in nursing homes.
| TABLE III.1. Characteristics of the Heads of Single-Parent TANF Cases in Select States(Percentages, Unless Stated Otherwise) | ||||
| District ofColumbia | Illinois | Maryland | SouthCarolina | |
| Gender | ||||
| - Female | 98 | 99 | 97 | 98 |
| - Male | 2 | 1 | 3 | 2 |
| Age | ||||
| - Younger than 25 years | 29 | 36 | 34 | 41 |
| - 25 to 34 years | 38 | 35 | 34 | 37 |
| - 35 years or older | 33 | 30 | 32 | 22 |
| Average age (years) | 30.7 | 29.5 | 30.5 | 28.6 |
| Median age (years) | 29 | 28 | 29 | 26 |
| Race/Ethnicity | ||||
| - White, non-Hispanic | 1 | 11 | 13 | 25 |
| - African-American, non-Hispanic | 97 | 79 | 84 | 72 |
| - Hispanic and other | 1 | 11 | 3 | 3 |
| Marital Status | ||||
| - Married | 3 | 7 | 4 | 3 |
| - Never married | 88 | 74 | 76 | 68 |
| - Widowed, divorced, separated | 9 | 19 | 20 | 29 |
| Highest Education Completed | ||||
| - Less than high school diploma/GED | 38 | 44 | 42 | 38 |
| - High school diploma/GED | 30 | 28 | 26 | 30 |
| - More than high school diploma/GED | 33 | 28 | 32 | 32 |
| Number of Children Less than Age 18 in Household | ||||
| Average | 2.6 | 2.7 | 2.2 | 2.1 |
| Median | 2 | 2 | 2 | 2 |
| Age of Youngest Child | ||||
| - Less than 1 year | 15 | 28 | 19 | 23 |
| - 1 to 5 years | 56 | 46 | 48 | 54 |
| - 6 to 14 years | 26 | 24 | 30 | 20 |
| - 15 years or older | 3 | 2 | 3 | 3 |
| Average age of youngest child | 4.1 | 3.9 | 4.3 | 3.6 |
| Median age of youngest child | 3 | 2 | 3 | 2 |
| Sample Size | 420 | 416 | 819 | 1,120 |
| SOURCE: 2001-2003 TANF Caseload Surveys from the District of Columbia, Illinois, Maryland, and South Carolina.NOTES: The survey data have been weighted to be representative of all single-parent TANF recipients in each state. Survey item non-response may cause the sample sizes for specific variables to be smaller than those shown. Rounding may cause percentages to sum to something other than 100. | ||||
On other demographic dimensions, TANF case heads in the study sites look slightly different than LTC workers in general. On average, TANF case heads in the sites are younger than LTC workers. The average age of a single-parent TANF case head across the sites hovers in the late 20s to low 30s, while LTC workers, on average, are in their upper 30s to lower 40s. Higher proportions of TANF case heads are African-American and have never been married than those seen among the LTC workforce. The substantial majority of TANF cases across the sites--and virtually all of the cases in the District of Columbia--are African-American. Because of both the nature of the TANF program and the specific focus of these surveys on single-parent cases, very low proportions of TANF case heads in the sites--7 percent or less--were married at the time of the survey.
Table III.2 presents data from across the study sites on the characteristics of all TANF recipients and specifically of "TANF LTC workers"--those currently or recently employed as nurse aides in nursing and personal care facilities or as home health aides.4 With one exception, TANF LTC workers appear almost identical to the full single-parent TANF caseload across the sites (Table III.2). The one potential difference is in the age distribution: fewer than one-quarter of TANF LTC workers are younger than age 25, compared to about a third of all TANF recipients. This finding is consistent with available information on the LTC workforce. However, unlike the LTC workforce, TANF LTC workers do not appear to have higher levels of education than all TANF case heads in the study sites.
B. Employment Experiences of TANF Case Heads
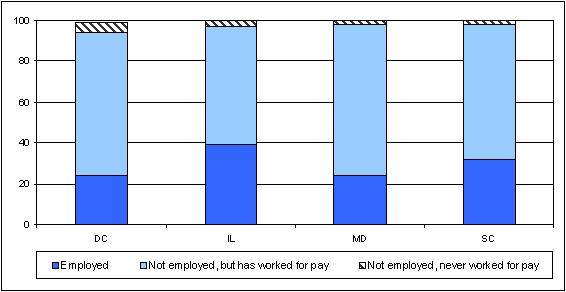
Since the passage of welfare reform in 1996, growing proportions of TANF case heads have moved into employment. Across the country, 28 percent were working at the time of the 2002 National Survey of American Families (Zedlewski 2003). One in every four single-parent TANF case heads was working at the time of the TANF Caseload Surveys in the District of Columbia and Maryland, and about one in every three in South Carolina (Figure III.1). In Illinois, a higher proportion (39 percent) of the caseload was working, presumably a result of Illinois' policy initiatives that allow recipients to combine work with welfare receipt (Kirby et al. 2003).5
The majority of single-parent TANF case heads in the study sites have been employed at some point, even if they were not working at the time of the survey. Very low proportions (3-5 percent) have never worked for pay (Figure III.1).
| TABLE III.2. Comparison of Characteristics of TANF Case Heads and TANF LTC Workers in Select States(Percentages, Unless Stated Otherwise) | ||
| TANF LTC Workers in the Study Statesa | All TANF Recipients in the Study Statesa | |
| Gender | ||
| - Female | >99 | 98 |
| - Male | 1 | 2 |
| Age | ||
| - Younger than 25 years | 23 | 35 |
| - 25 to 34 years | 50 | 35 |
| - 35 years or older | 27 | 30 |
| Average age (years) | 30.3 | 29.8 |
| Median age (years) | 30 | 28 |
| Race/Ethnicity | ||
| - White, non-Hispanic | 10 | 12 |
| - African-American, non-Hispanic | 81 | 82 |
| - Hispanic and other | 10 | 6 |
| Marital Status | ||
| - Married | 8 | 5 |
| - Never married | 74 | 76 |
| - Widowed, divorced, separated | 17 | 19 |
| Highest Education Completed | ||
| - Less than high school diploma/GED | 39 | 42 |
| - High school diploma/GED | 29 | 28 |
| - More than high school diploma/GED | 31 | 30 |
| Number of Children Less than Age 18 in Household | ||
| Average | 2.8 | 2.5 |
| Median | 3 | 2 |
| Age of Youngest Child | ||
| - Less than 1 year | 25 | 23 |
| - 1 to 5 years | 51 | 49 |
| - 6 to 14 years | 24 | 25 |
| - 15 years or older | 1 | 3 |
| Average age of youngest child (years) | 3.6 | 4.0 |
| Median age of youngest child (years) | 2 | 2 |
| Sample Size | 161 | 2,775 |
SOURCE: 2001-2003 TANF Caseload Surveys from the District of Columbia, Illinois, Maryland, and South Carolina.NOTES: The survey data have been weighted to be representative of all single-parent TANF recipients in each state. Survey item nonresponse may cause the sample sizes for specific variables to be smaller than those shown. Rounding may cause percentages to sum to something other than 100.
| ||
| FIGURE III.1. Current Employment Status of the Heads of Single-Parent TANF Cases in Select States (Percentages) |
 |
Among those who have worked for pay, periods of employment are relatively short, but the jobs tend to be full-time and during regular daytime business hours. TANF case heads in the four sites held their current or most recent job for between 12 and 13 months on average (Table III.3). However, the median length of employment on that job was typically just four or five months. About three in five recipients across the sites worked over 35 hours per week in their most recent job, and the majority (55-58 percent) worked a regular daytime shift.
1. Characteristics of Jobs Held by TANF Recipients
The distribution of industries in which TANF case heads were employed varied across the four sites. A substantial fraction of case heads in all the sites were employed in the accommodation and food industry, often as hotel room attendants and fast food service workers. Other industries with higher concentrations of TANF workers in one or more of the sites include retail and other services, and business, administrative and professional services. Consistent across the sites, about one in ten TANF case heads held their most recent or current job in the health care industry. In a closer examination of the combination of industry and occupation codes across the sites, the percentage of case heads currently or recently employed in LTC ranged from 5 percent in the District of Columbia and South Carolina to 8 percent in Illinois (Table III.3).
| TABLE III.3. Characteristics of Current or Most Recent Jobs Held by TANF Case Headsa(Percentages, Unless Stated Otherwise) | ||||
| District ofColumbia | Illinois | Maryland | SouthCarolina | |
| Length of Employment on Job | ||||
| Average number of months | 12.7 | 11.9 | 13.3 | 12.1 |
| Median number of months | 5 | 5 | 4 | 5 |
| Hours Worked Per Week | ||||
| - Less than 20 | 10 | 8 | 10 | 8 |
| - 20 to 34 | 30 | 33 | 29 | 33 |
| - 35 or more | 60 | 59 | 61 | 58 |
| Average hours worked per week | 34.6 | 34.2 | 35.0 | 33.8 |
| Median hours worked per week | 40 | 35 | 40 | 35 |
| Shift or Time of Day Worked | ||||
| - Regular day time shift | 57 | 56 | 58 | 55 |
| - Morning or afternoon shift | 3 | 6 | 4 | 8 |
| - Evening or night shift | 21 | 22 | 19 | 16 |
| - Irregular, split, or rotating shift | 11 | 11 | 12 | 19 |
| - Other | 8 | 5 | 7 | 2 |
| Industry | ||||
| - Manufacturing | 1 | 7 | 4 | 12 |
| - Retail | 12 | 17 | 13 | 20 |
| - Accommodation and Food | 18 | 29 | 16 | 28 |
| - Health Care | 10 | 11 | 10 | 10 |
| - Social/Educational Services | 15 | 3 | 7 | 5 |
| - Business/Administrative/Professional Services | 26 | 14 | 16 | 6 |
| - Other Services | 9 | 10 | 5 | 14 |
| - Other | 10 | 8 | 29 | 5 |
| Current or Recent Employment in LTC | 5 | 8 | 6 | 5 |
| Sample Size | 398 | 401 | 804 | 1,086 |
SOURCE: 2001-2003 TANF Caseload Surveys from the District of Columbia, Illinois, Maryland, and South Carolina.NOTES: The survey data have been weighted to be representative of all single-parent TANF recipients in each state. Survey item non-response may cause the sample sizes for specific variables to be smaller than those shown. Rounding may cause percentages to sum to something other than 100.
| ||||
The jobs held by single-parent TANF case heads in the four sites tended to have low wages, offer few benefits, and provide little opportunity for advancement. Although the distribution of wage levels varied across sites, at least half of the TANF case heads in Illinois, Maryland, and South Carolina earned wages under $7.00 per hour (Table III.4). The median hourly wage rate was slightly higher in the District of Columbia--$7.50 per hour--presumably owing to the fact that it is exclusively a metropolitan area with a preponderance of government and administrative jobs and a high cost of living. Nonetheless, median wage levels in all four sites were generally lower than those reported for LTC positions (as presented in Chapter II).
In general, 30-47 percent of case heads in the study sites reported that their current or more recent employer offered benefits--including paid sick, vacation, and holiday leave, and health insurance (Table III.4). However, we cannot discern the proportion of TANF case heads that actually received these benefits. Therefore, these estimates provide the upper bound of benefit receipt. We can safely assume that case heads actually received paid sick, vacation, and holiday time when it was offered. However it is not safe to assume that case heads received employer-sponsored health insurance when it was offered, because plans often require an employee co-payment that is cost-prohibitive to some TANF case heads.
Regardless, rates of reported availability of health benefits appear lower among TANF case heads than among nurse and home health aides in LTC positions. As discussed in Chapter II, nearly half of home health aides (47 percent) and nearly three in five aides in nursing homes (57 percent) actually received health insurance coverage from their employer, based on a GAO analysis of data from the CPS 1998-2000 March Supplements (Scanlon 2001). In comparison, the percentage of TANF case heads that reported the availability of employer-sponsored health insurance ranged from 34 percent in Illinois to 47 percent in Maryland.
Based on the same CPS data, about 20-25 percent of LTC workers received pension coverage. Somewhat comparable percentages of TANF case heads in the four sites reported the availability of a retirement plan--ranging from 22 percent in Illinois to 32 percent in Maryland. Once again, the rate of actual participation in such plans may be lower.
According to a self-assessment, about half of all single-parent TANF case heads in each of the four sites felt that they have little to no opportunity for advancement in their current or most recent job (Table III.4). In general, less than one in every five case heads believed they have or had a great deal of opportunity for advancement in their current or most recent employment.
| TABLE III.4. Compensation on Current or Most Recent Job Held by TANF Case Headsa(Percentages, Unless Stated Otherwise) | ||||
| District ofColumbia | Illinois | Maryland | SouthCarolina | |
| Hourly Wageb | ||||
| - Less than $5.15 | 11 | 20 | 10 | 15 |
| - $5.15 to 6.00 | 6 | 25 | 14 | 27 |
| - $6.01 to 7.00 | 27 | 21 | 27 | 25 |
| - $7.01 to 8.00 | 16 | 13 | 19 | 15 |
| - $8.01 to 9.00 | 12 | 9 | 10 | 8 |
| - $9.01 to 10.00 | 10 | 6 | 7 | 4 |
| - More than $10.00 | 17 | 6 | 12 | 6 |
| Average hourly wage (dollars) | $8.44 | $7.12 | $7.90 | $7.03 |
| Median hourly wage (dollars) | $7.50 | $6.50 | $7.00 | $6.50 |
| Fringe Benefits Available | ||||
| - Paid sick leave | 38 | 31 | 39 | 29 |
| - Paid vacation | 43 | 40 | 46 | 40 |
| - Paid holidays | 47 | 41 | 51 | 38 |
| - Health insurance | 45 | 34 | 47 | 42 |
| - Retirement plan | 29 | 22 | 32 | 29 |
| Opportunity for Advancement (Self-assessment) | ||||
| - Great deal | 22 | 16 | 18 | 19 |
| - Some | 30 | 26 | 26 | 23 |
| - A little | 17 | 23 | 26 | 19 |
| - None | 32 | 34 | 31 | 38 |
| Sample Size | 398 | 401 | 804 | 1,086 |
SOURCE: 2001-2003 TANF Caseload Surveys from the District of Columbia, Illinois, Maryland, and South Carolina.NOTES: The survey data have been weighted to be representative of all single-parent TANF recipients in each state. Survey item non-response may cause the sample sizes for specific variables to be smaller than those shown. Rounding may cause percentages to sum to something other than 100.
| ||||
2. Comparisons Between LTC Jobs and All Jobs Held by TANF Recipients
The characteristics of LTC jobs held by TANF case heads across the four study sites appear quite similar to those of all jobs held by case heads. As with all jobs held by TANF case heads, the majority of LTC jobs are full-time, during regular daytime hours, and of short duration (Table III.5). There are two dimensions on which LTC jobs appear to differ from other jobs held by TANF case heads: the availability of employer-offered benefits and the perception of advancement opportunities.
Higher proportions of TANF case heads who are or who have recently been LTC workers reported the availability of fringe benefits (with the exception of a retirement plan) than did the general TANF population that has ever been employed. For example, about half of TANF case heads who work or recently worked in LTC reported the availability of health insurance, nearly half were offered paid sick leave, and nearly three in every five were offered paid vacation or holidays on the job (Table III.5). These rates are 11-15 percentage points higher than those for all employed TANF case heads in the four sites. The availability of a retirement plan to TANF LTC workers appears similar to that of all TANF case heads who have ever been employed.
Case heads who are currently or who have recently been LTC workers appear to perceive less opportunity for advancement on the job than that reported by all TANF case heads who have ever been employed. Only about one in ten LTC workers reported a great deal of opportunity for advancement; nearly half reported no advancement opportunity at all (Table III.5).
Lack of advancement opportunities or poor job characteristics (i.e., low pay, hours, or benefits), however, were not the most prevalent reasons given for leaving LTC jobs. When questioned on the reason for leaving their most recent job, case heads who most recently worked as a nursing assistant or home health aide most often cited pregnancy or maternity leave (30 percent) or difficulties associated with their own health (16 percent). Just under 10 percent gave reasons associated with the job itself--such as wanting to work more hours, not liking the work or finding it too stressful, having problems with co-workers, or incurring injuries on the job. Just over 15 percent were either fired, laid-off, or had a short-term assignment that ended. The remainder gave reasons that were exogenous to the job--such as family or personal issues, child care, transportation, or returning to school.
C. Prevalence of Potential Liabilities for Employment Among Tanf Case Heads
The TANF Caseload Surveys provide a rich source of information on personal circumstances and characteristics that can contribute to or inhibit employment. In this section, we examine the prevalence of 16 "personal liabilities" that have the potential to interfere with a TANF recipient's ability to obtain and maintain employment.6 We group these liabilities into three main categories: (1) human capital deficits, (2) personal challenges, and (3) logistical and situational challenges.7 We first examine the prevalence of these potential liabilities among TANF case heads in each of the four sites, and then for case heads who are or who have recently been employed in LTC jobs.
| TABLE III.5. Characteristics of LTC Jobs Currently or Recently Held by TANF Case Headsa(Percentages, Unless Stated Otherwise) | ||
| LTC Workers in the Study States | All TANF Recipients in the Study States | |
| Length of Employment on Job | ||
| Average number of months | 13.6 | 12.4 |
| Median number of months | 5 | 5 |
| Hours Worked Per Week | ||
| - Less than 20 | 8 | 9 |
| - 20 to 34 | 30 | 32 |
| - 35 or more | 62 | 59 |
| Average hours worked per week | 34.5 | 34.3 |
| Median hours worked per week | 38 | 37 |
| Shift or Time of Day Worked | ||
| - Regular day time shift | 64 | 56 |
| - Morning or afternoon shift | 4 | 6 |
| - Evening or night shift | 18 | 20 |
| - Irregular, split, or rotating shift | 10 | 12 |
| - Other | 3 | 5 |
| Hourly Wageb | ||
| - Less than $5.15 | 7 | 16 |
| - $5.15 to 6.00 | 19 | 20 |
| - $6.01 to 7.00 | 29 | 24 |
| - $7.01 to 8.00 | 19 | 15 |
| - $8.01 to 9.00 | 10 | 10 |
| - $9.01 to 10.00 | 7 | 7 |
| - More than $10.00 | 9 | 9 |
| Average hourly wage (dollars) | $7.39 | $7.50 |
| Median hourly wage (dollars) | $7.00 | $7.00 |
| Fringe Benefits Available | ||
| - Paid sick leave | 46 | 34 |
| - Paid vacation | 55 | 42 |
| - Paid holidays | 59 | 44 |
| - Health insurance | 51 | 40 |
| - Retirement plan | 30 | 27 |
| Opportunity for Advancement (Self-assessment) | ||
| - Great deal | 11 | 18 |
| - Some | 21 | 26 |
| - A little | 20 | 22 |
| - None | 48 | 34 |
| Sample Size | 161 | 2,775 |
SOURCE: 2001-2003 TANF Caseload Surveys from the District of Columbia, Illinois, Maryland, and South Carolina.NOTES: The survey data have been weighted to be representative of all single-parent TANF recipients in each state. Survey item non-response may cause the sample sizes for specific variables to be smaller than those shown. Rounding may cause percentages to sum to something other than 100.
| ||
1. Human Capital Deficits
Human capital represents the level of education and work experience that individuals bring to the labor market, and is strongly associated with their employment and earning potential. Deficits in human capital include the lack of a high school diploma or its equivalent, limited work experience, and the lack of relevant skill sets. TANF case heads are known to have low levels of education; about two in every five TANF case heads in each of the four sites lack a high school diploma or GED (Table III.6).
While the majority of TANF case heads have work experience and familiarity with common job tasks, about one in four have deficits in these areas of human capital across the sites. For example, the percentage of TANF recipients who have performed fewer than four common job tasks--for example, talking with customers face to face, filling out forms, and working with cash registers or other electronic machines--ranged from 25 percent in South Carolina to 28 percent in Illinois. Similarly, the percentage of TANF case heads with limited work experience--those who have worked less than 50 percent of the time since they turned 18--was 21 percent in Maryland, 24 percent in Illinois, and 27 percent in the District of Columbia (Table III.6). This figure was lower in South Carolina (18 percent), possibly due to the age distribution of single-parent TANF case heads or to low benefit levels that make being on assistance less attractive.
LTC jobs, as low-skilled positions, do not require a great deal of human capital. While individual employers may require a high school diploma or its equivalent or a certain number of months or years of experience, these are not industry standards. We would therefore not expect that TANF case heads would be excluded from LTC jobs because of these particular human capital deficits. However, the lack of a high school diploma could prevent advancement in the field. For example, a step up to licensed practical nurse (LPN) would require a high school diploma or its equivalent.
For descriptive purposes only, we looked at the level of familiarity with a subset of three job tasks that are particularly pertinent to employment in LTC jobs. These tasks include: (1) talking with customers face to face, which is related to working one-on-one with patients daily, (2) reading instructions or reports, which corresponds to reading care plans and following the instructions of health care professionals, and (3) keeping watch over gauges or instruments, which is related to taking temperatures, blood pressure, and reading specific medical instruments. We found that most TANF case heads had experience with at least one of the tasks related to LTC jobs. Only relatively small percentages of TANF case heads in each of the sites (ranging from 9 to 13 percent) have never performed any of the three tasks related to LTC employment (Table III.6).
| TABLE III.6. Potential Liabilities for Employment(Percentages, Unless Stated Otherwise) | ||||
| District ofColumbia | Illinois | Maryland | SouthCarolina | |
| Human Capital Deficits | ||||
| - No high school or GED | 38 | 44 | 42 | 38 |
| - Limited work experiencea | 27 | 24 | 21 | 18 |
| - Performed fewer than four common job tasks | 26 | 28 | 26 | 25 |
| - Never performed LTC related job tasksb | 11 | 13 | 9 | 9 |
| Personal Challenges | ||||
| - Physical health problemc | 16 | 21 | 23 | 22 |
| - Mental health problemd | 21 | 25 | 29 | 29 |
| - Chemical dependencee | 3 | 3 | 5 | 1 |
| - Severe physical domestic violence in past year | 14 | 13 | 14 | 14 |
| - Possible presence of learning disability | 8 | 12 | 11 | 11 |
| - Criminal recordf | 7 | 8 | 14 | 10 |
| - Difficulty with English | 1 | 2 | 1 | 1 |
| Logistical and Situational Challenges | ||||
| - Child or other family member or friend with a health problem or special needg | 32 | 34 | 33 | 32 |
| - Pregnant | 5 | 8 | 5 | 5 |
| - Child under age 1 in household | 15 | 28 | 19 | 23 |
| - Transportation problemh | 20 | 21 | 26 | 31 |
| - Child care problemh | 42 | 31 | 41 | 31 |
| - Unstable housingi | 13 | 23 | 20 | 22 |
| Presence of at Least One Major Liability to LTC Employmentj | 10 | 10 | 14 | 10 |
| Presence of at Least One Moderate Liability to LTC Employmentk | 31 | 37 | 40 | 37 |
| No Liabilities to LTC Employment | 65 | 59 | 50 | 54 |
| Number of Liabilities | ||||
| - 0 | 10 | 6 | 5 | 6 |
| - 1 | 17 | 15 | 16 | 15 |
| - 2 or 3 | 41 | 40 | 40 | 41 |
| - 4+ | 32 | 39 | 39 | 37 |
| Sample Size | 420 | 416 | 819 | 1,120 |
SOURCE: 2001-2003 TANF Caseload Surveys from the District of Columbia, Illinois, Maryland, and South Carolina.NOTES: The survey data have been weighted to be representative of all single-parent TANF recipients in each state. Survey item non-response may cause the sample sizes for specific variables to be smaller than those shown. Rounding may cause percentages to sum to something other than 100.
| ||||
2. Personal Challenges
Many individuals overcome significant personal challenges to gain and maintain employment. However, such challenges can affect employment if they are severe enough to be debilitating--for example, a severe physical or mental health problem--or if they limit the possible avenues for employment, as would the existence of a criminal record or difficultly with English. TANF case heads tend to experience personal challenges at a higher rate than the U.S. population as whole (Danziger et al. 2000).
Physical and mental health problems were the most prevalent personal challenges among TANF case heads in the four sites. About one in every five case heads reported a physical health problem in Illinois, Maryland, and South Carolina (Table III.6). In the District of Columbia, a slightly lower proportion (16 percent) had a physical health problem. About 29 percent of TANF case heads in Maryland and South Carolina, and 21 and 25 percent of case heads in the District of Columbia and Illinois, respectively, had a mental health problem.
Lower, but not insignificant, portions of TANF case heads in the sites experienced severe physical domestic violence in the past year, showed signs of a learning disability, or had a criminal record. Across the sites, about one in every seven TANF case heads experienced severe physical domestic violence in the past year, and about one in ten showed signs of a learning disability. The percentage of TANF case heads that reported having a criminal record ranged from a low of 7 percent in the District of Columbia to a high of 14 percent in Maryland.
Very small percentages of TANF case heads in the four sites were chemically dependent or had difficulty with English. Previous studies have found higher prevalence rates of chemical use or abuse within the TANF population. Our study measured chemical dependence, which is more severe than use or abuse. The prevalence rates we found--which ranged from 1 to 5 percent across the four sites--are lower than those under studies measuring use or abuse. Only 1 to 2 percent of TANF case heads in the sites reported difficulty with English because it is not their native language.
As discussed in Chapter II, there are certain personal characteristics that are, in essence, prerequisites for employment in the LTC industry. At the very least, LTC workers cannot have a criminal record that includes any state-specified disqualifying crimes and they should not be dependent on drugs or alcohol. We consider these two personal challenges "major" liabilities to LTC employment. (In this analysis, we count a recipient's report of any criminal record as a major liability to LTC employment, since the survey does not gather details on specific crimes.) Based on these prerequisites, 10 percent of TANF case heads in Illinois, Maryland, and South Carolina, may be excluded from LTC employment because of a criminal record or chemical dependence (Table III.6). In the District of Columbia 14 percent of TANF case heads experience one of the major liabilities to LTC employment. LTC workers should also have good physical and mental health and strong English skills. These personal liabilities are less severe, but could still inhibit a portion of the caseload from pursuing employment in LTC jobs. Between 31 to 40 percent of TANF case heads across the four states experience at least one of these "moderate" liabilities to LTC employment. A substantial proportion, anywhere from one-half to two-thirds of the caseload across the four sites, experiences none of the five liabilities to LTC employment.
3. Logistical and Situational Challenges
Logistical and situational challenges are often temporary circumstances that are exogenous to the individual's personal characteristics. Transportation, child care, and unstable housing are included in this report as logistical challenges; caring for a child, family member, or friend with a health problem or special need, being pregnant, or having a child under the age of one in the household are included as situational challenges.
Based on the surveys, child care was the most prevalent logistical challenge reported by TANF case heads across the four sites. About 40 percent of case heads in the District of Columbia and Maryland, and 30 percent of case heads in Illinois and South Carolina reported having a child care problem that interfered with their ability to take a job or maintain a job or participate in education or training activities (Table III.6). Substantial proportions of TANF case heads also reported experiencing a transportation problem or having unstable housing. Transportation appeared less problematic for TANF case heads in the District of Columbia and Illinois (20 and 21 percent, respectively) than for those in Maryland and South Carolina (26 and 31 percent, respectively). TANF case heads in the District of Columbia and the majority of case heads in Chicago, Illinois or its surrounding suburbs had strong public transportation systems at their disposal. In comparison with the other sites, the District of Columbia had the lowest percentage of TANF case heads who experienced unstable housing (13 percent), defined as having been evicted or having moved two or more times in the past year. In the three states, 20 to 23 percent of TANF case heads had unstable housing situations.
One-third of TANF case heads across the sites were caring for a child or other family member or friend with a health problem or special need. Depending on the intensity of the care needed, it may interfere with an individual's ability to hold a full-time job. However, this circumstance can also be a potential draw into the LTC field. Some women identify LTC as a career interest as a result of providing informal care to a family member or friend (Joslin 2002). An employment opportunity in LTC may be a natural progression for a woman with a personal interest and some experience in the area, and who has relatively few other employment options available to her based on limited education and/or work experience.
Some circumstances--such as pregnancy or the care of an infant--are time-limited, typically affecting employment for only a finite period. Small percentages of TANF case heads, ranging from 5 to 8 percent across the sites, were pregnant at the time of the interviews. However, substantial portions of case heads (from 15 to 28 percent) had a child under the age of one in the household.
4. Presence of Multiple Employment Liabilities
The majority of TANF case heads in each of the study sites experienced multiple liabilities that may reduce their chances of finding employment or staying employed for an extended period of time (see Table III.6). The proportion of the caseload with two or more potential employment liabilities ranged from a low of 74 percent in the District of Columbia to a high of 79 percent in Illinois and Maryland. At least 30 percent of TANF case heads in each of the four sites experienced four or more potential employment liabilities. The presence of multiple employment liabilities is important because previous research shows that the likelihood of working 30 or more hours per week is significantly lower for TANF case heads experiencing multiple challenges; this is especially true for case heads that experience four or more challenges (Kirby et al. 2003).
5. Employment Liabilities of TANF LTC Workers
Surprisingly, with only a few exceptions, similar proportions of TANF recipients who are employed in the LTC industry and all TANF case heads reported the presence of potential employment liabilities (Table III.7). Only 4 percent of TANF recipients who are currently working or have worked in the LTC field did not report any potential liabilities for employment, while 7 percent of all case heads reported no potential employment liabilities. The presence of multiple potential liabilities is almost identical. In contrast, 13 percent of TANF case heads currently employed in any field did not experience any of the potential employment liabilities and only one-quarter experienced four or more.
While the proportion of TANF LTC workers who reported physical health problems is 7 percentage points lower than that reported by all TANF case heads (14 percent vs. 21 percent), it is identical to the proportion reported by currently employed TANF case heads. TANF LTC workers appear just as likely as all TANF recipients to experience other personal challenges that might preclude employment in the LTC field--for example, mental health problems, chemical dependence, or a past criminal record. Not surprisingly, a slightly smaller proportion of TANF LTC workers reported never having performed any of the three LTC related tasks than that seen among all TANF recipients.
The rates at which TANF LTC workers encounter a child care problem or experience unstable housing were generally lower than those among all TANF case heads in the study sites, but were similar to the rates among currently employed TANF case heads. The prevalence of a child care problem among TANF LTC workers was 26 percent, 9 percentage points lower than that for all TANF case heads in the sites, but similar to currently employed TANF case heads. Similarly, the rates at which TANF LTC workers and all currently employed TANF case heads experienced unstable housing (15 and 16 percent, respectively) were four to five percentage points lower than that seen among all TANF case heads. One possible reason for these differences is that TANF recipients who cannot find stable and reliable child care or housing may be less likely to pursue LTC or any other employment because of the emphasis on being able to work regularly scheduled hours.
| TABLE III.7. Summary of Potential Liabilities for Employment of TANF LTC Workers, Currently Employed TANF Case Heads, and All TANF Case Heads in Select States(Percentages, Unless Stated Otherwise) | |||
| TANF LTC Workers in the Study Statesa | Currently Employed TANF Case Heads in the Study Statesa | All TANF Case Heads in the Study Statesa | |
| Human Capital Deficits | |||
| - No high school or GED | 39 | 37 | 42 |
| - Limited work experienceb | 21 | 13 | 23 |
| - Performed fewer than four common job tasks | 26 | 22 | 27 |
| - Never performed LTC related job tasks | 7 | 6 | 11 |
| Personal Challenges | |||
| - Physical health problemd | 14 | 14 | 21 |
| - Mental health probleme | 31 | 17 | 26 |
| - Chemical dependencef | 3 | 2 | 3 |
| - Severe physical domestic violence in past year | 15 | 12 | 14 |
| - Possible presence of learning disability | 11 | 8 | 11 |
| - Criminal recordg | 8 | 9 | 10 |
| - Difficulty with English | 2 | 2 | 2 |
| Logistical and Situational Challenges | |||
| - Child or other family member or friend with a health problem or special needh | 48 | 33 | 33 |
| - Pregnant | 12 | 3 | 6 |
| - Child under age 1 in household | 25 | 20 | 23 |
| - Transportation problemi | 25 | 18 | 23 |
| - Child care problemi | 26 | 24 | 35 |
| - Unstable housingj | 15 | 16 | 20 |
| Presence of at Least One Major Liability to LTC Employmentk | 10 | 10 | 12 |
| Presence of at Least One Moderate Liability to LTC Employmentl | 38 | 27 | 37 |
| No Liabilities to LTC Employment | 56 | 67 | 57 |
| Number of Liabilities | |||
| - 0 | 4 | 13 | 7 |
| - 1 | 17 | 18 | 16 |
| - 2 or 3 | 40 | 44 | 41 |
| - 4+ | 39 | 25 | 37 |
| Sample Size | 161 | 780 | 2,775 |
SOURCE: 2001-2003 TANF Caseload Surveys from the District of Columbia, Illinois, Maryland, and South Carolina.NOTES: The survey data have been weighted to be representative of all single-parent TANF recipients in each state. Survey item non-response may cause the sample sizes for specific variables to be smaller than those shown. Rounding may cause percentages to sum to something other than 100.
| |||
One personal liability appears more prevalent among TANF LTC workers than among employed TANF case heads, or among the general single-parent caseloads in each of the sites: nearly half (48 percent) of all TANF LTC workers reported caring for a child or other family member or friend with a health problem or special need (Table III.7). This rate is 15 percentage points higher than that for currently employed case heads and for all TANF case heads in the study sites. As previously discussed, it is possible that individuals facing this liability may find LTC jobs attractive and be able to transition relatively easily into the field.
These findings suggest that even though most TANF recipients face one or more potential employment liabilities, these liabilities do not appear to automatically preclude them from being able to work in the LTC field. Instead, it appears that the same factors that influence TANF recipients' overall employment prospects will influence their suitability for employment in the LTC field.
IV. SINGLE-PARENT TANF HEADS AS LTC WORKERS
In the previous chapter, we examined TANF recipients' assets and liabilities and compared them to the characteristics of the LTC workforce. In this chapter, we extend this analysis by using a multivariate model to understand the extent to which the TANF case heads' potential liabilities influence the likelihood that they are employed for 30 or more hours per week. We then use this information to estimate the proportion of the caseload that might be suitable LTC employees. Finally, in order to help states identify important factors to address in LTC training programs for TANF recipients, we describe the demographic characteristics and potential employment liabilities of the group of TANF case heads who seem most suited for employment in the LTC industry. We conclude with a summary of our results and a discussion of their implications.
A. The Influence of Liabilities on the Likelihood of Substantial Employment
Prior to the passage of welfare reform, experts predicted that proposed policies like time limits would eventually result in a large number of families losing their primary means of support. These concerns were based on sophisticated microsimulation models that predicted very low rates of employment among welfare recipients. Thus, the massive exodus from the rolls shortly after the passage of welfare reform was quite unexpected. Employment rates among even the most disadvantaged recipients were surprisingly high, largely due to the combined effects of a healthy economy and stringent work requirements for the majority of the TANF caseload. Welfare offices discovered that many recipients who were previously deemed unemployable could find employment, although many had difficulty staying employed.
While the presence of a potential liability does not automatically preclude employment, some liabilities might have a much greater influence on employment than others. To identify those factors with significant influence, we used a multivariate model to estimate the independent impact of each of 16 liabilities on the probability that a TANF recipient will find employment.
We estimated models for (1) a pooled sample of TANF recipients in all four states and (2) each state separately. The models included and controlled for each recipient's gender, age, race/ethnicity, marital status, number of children, and age of the youngest child. In addition, the pooled model included site controls. The pooled model, with its larger sample size, provides more precise estimates than those for the individual states. These results can be interpreted as the "average" influence of the 16 liabilities across the four states. We estimated models for each of the states separately because the pooled results may mask important differences across the states--for example, the recipients' diverse characteristics, states' different policies and programs to address liabilities, and the local labor market opportunities for people experiencing various liabilities. We present our results first for the pooled model, then for each of the individual states.
Table IV.1 presents predicted probabilities for the pooled model, assuming that a TANF case head has "average" characteristics and the specific liability identified. This model predicts that six liabilities have a significant influence on employment. Limited work experience reduces the probability of employment by 16 percentage points--lowering it to 21 percent. Physical and mental health problems, both personal challenges, reduce the probability of employment by 13 and 7 percentage points, respectively. Three logistical and situational challenges also have significant influence: being pregnant reduces the probability of employment by 16 percentage points, the presence of a child under the age of one reduces it by 9 percentage points, and reporting a problem with child care reduces it by 14 percentage points.
In Table IV.2, we present the liabilities that significantly influence employment in each of the four states. (Predicted probabilities for all the liabilities for each state appear in Appendix D.) Limited work experience significantly reduces the probability of employment among TANF case heads in all sites except South Carolina, where this liability is less prevalent, possibly because TANF benefits are so low. Maryland is the only state where not having performed four common job tasks significantly reduces the likelihood of employment, possibly because people with greater job skills may have a more difficult time finding employment in a tighter labor market.
The effect of personal challenges is quite different across the four sites. In Maryland and the District of Columbia, none of the personal challenges has a significant effect. In South Carolina, however, physical health problems, chemical dependency, and possible presence of a learning disability significantly reduce the likelihood of employment among TANF case heads. The "average" TANF recipient with a chemical dependency issue has only a 3 percent probability of employment in South Carolina; a possible learning disability reduces the probability of employment by 26 percentage points, to 13 percent.
In all of the sites except Maryland, a child care problem significantly lowers the probability of employment--by 11 percentage points in the District of Columbia, 17 percentage points in South Carolina, and 21 percentage points in Illinois. Maryland is the only site where pregnancy and having a child under age one in the household significantly decreases the probability of employment. Pregnant TANF case heads in Maryland have only a 5 percent probability of employment (compared to 31 percent for a recipient with no liabilities). Having a family member or friend with a health problem or special need is a significant liability only in the District of Columbia, where the probability of employment declines by 12 percentage points.
| TABLE IV.1. Employment Probabilities by Characteristics of the Heads of Single-Parent TANF Cases in the Four Study States(Percentages, Unless Stated Otherwise) | |||||
| Specific Liability | Prevalence(%) | Direction and Significance of Effect | Predicted Probability of Working 30 Hours | Difference from Probability with No Liabilities | |
| Pooled Sample | |||||
| - No Employment Liabilities | 7 | 37 | |||
| Human Capital Deficits | |||||
| - No high school diploma or GED | 42 | - | 34 | -3 | |
| - Limited work experience | 23 | - | *** | 21 | -16 |
| - Performed fewer than four common job tasks | 27 | - | 32 | -5 | |
| Personal Challenges | |||||
| - Physical health problem | 21 | - | *** | 24 | -13 |
| - Mental health problem | 26 | - | * | 30 | -7 |
| - Chemical dependence | 3 | - | 32 | -5 | |
| - Severe physical domestic violence in past year | 14 | - | 37 | 0 | |
| - Possible presence of learning disability | 11 | - | 36 | -1 | |
| - Criminal record | 10 | - | 37 | 0 | |
| - Difficulty with English | 2 | - | 35 | -2 | |
| Logistical and Situational Challenges | |||||
| - Child or other family member or friend with a health problem or special need | 33 | - | 35 | -2 | |
| - Pregnant | 6 | - | ** | 21 | -16 |
| - Child under age 1 in household | 23 | - | ** | 28 | -9 |
| - Transportation problem | 23 | - | 35 | -2 | |
| - Child care problem | 35 | - | *** | 23 | -14 |
| - Unstable housing | 20 | - | 34 | -3 | |
| SOURCE: Based on the results of a logit model predicting the probability of working 30 hours per week using data from the 2002 TANF Caseload Surveys from the District of Columbia, Illinois, Maryland, and South Carolina.NOTE: The model included and controlled for client's gender, age, race/ethnicity, marital status, number of children, age of youngest child, and site. */**/*** Estimated effect of specified liability on employment is statistically significant at the .10/.05/.01 level. | |||||
| TABLE IV.2. Employment Probabilities by Characteristics of the Heads of Single-Parent TANF Cases in Each Study State for Liabilities with a Significant Influence on Employmenta(Percentages, Unless Stated Otherwise) | |||||
| Specific Liability | Prevalence(%) | Direction and Significance of Effect | Predicted Probability of Working 30 Hours | Difference from Probability with No Liabilities | |
| District of Columbia | |||||
| - No employment liabilities | 10 | 30 | |||
| - Limited work experience | 27 | - | ** | 12 | -18 |
| - Child or other family member or friend with a health problem or special need | 32 | - | ** | 18 | -12 |
| - Child Care problem | 42 | - | * | 19 | -11 |
| Illinois | |||||
| - No employment liabilities | 6 | 46 | |||
| - Limited work experience | 24 | - | * | 31 | -15 |
| - Physical health problem | 21 | - | * | 30 | -16 |
| - Child Care problem | 31 | - | *** | 25 | -21 |
| Maryland | |||||
| - No employment liabilities | 5 | 31 | |||
| - Limited work experience | 21 | - | *** | 12 | -19 |
| - Performed fewer than four common job tasks | 26 | - | * | 20 | -11 |
| - Pregnant | 5 | - | *** | 5 | -26 |
| - Child under age 1 in household | 19 | - | * | 21 | -10 |
| South Carolina | |||||
| - No employment liabilities | 6 | 39 | |||
| - Physical health problem | 22 | - | *** | 19 | -20 |
| - Chemical dependence | 1 | - | *** | 3 | -36 |
| - Possible presence of learning disability | 11 | - | *** | 13 | -26 |
| - Child Care problem | 31 | - | *** | 22 | -17 |
SOURCE: Based on the results of distinct logit models predicting the probability of working 30 hours per week in the District of Columbia, Illinois, Maryland, and South Carolina using data from the 2002 TANF Caseload Surveys.NOTE: Each model included and controlled for client's gender, age, race/ethnicity, marital status, number of children, and age of youngest child.
| |||||
B. The Influence of Multiple Liabilities on the Likelihood of Substantial Employment
In some cases, it is the presence of multiple, rather than individual liabilities that most influences the likelihood of employment. The impact of an individual liability, such as a mental health problem, might be exacerbated by the existence of additional liabilities such as problems with child care or transportation. While any of these liabilities alone may not significantly influence the likelihood of employment, in combination, they may. In the section, we examine how the number of liabilities a TANF case head faces can affect the likelihood of employment.
Table IV.3 shows that the predicted probability of employment for the average TANF case head in the pooled sample falls from 33 percent for those with no liabilities, to 24 percent for those with two to three liabilities, and to only 13 percent for those with four or more liabilities. The presence of four or more liabilities significantly reduces the likelihood of employment in all four states. The presence of multiple liabilities has the largest effect in Maryland, where two to three liabilities significantly reduces the probability of employment by 15 percentage points, and four or more liabilities by 24 percentage points.
C. Estimating the Potential Pool of LTC Workers Among Single-Parent Tanf Case Heads
In this section, we utilize several factors--the predicted probabilities of employment from our multivariate model, information on liabilities that are likely to make it difficult for TANF case heads to find employment in the LTC industry and information on recipients' current employment--to estimate the proportion of TANF case heads potentially employable in the LTC industry. The predicted employment probability of a TANF case head is considered average if it falls one standard deviation above or below the average predicted probability. If his or her predicted probability is below this level, we define it as low, and above this level as high probability. For the pooled model, an average probability of employment is between 8 and 32 percent; high and low probabilities fall above and below this range, respectively.
For the purpose of identifying a potential pool of LTC workers, we classify TANF recipients as having a high, moderate, or low potential for employment in the LTC industry. TANF case heads have a high potential for LTC employment if: (1) they are currently unemployed; (2) have an average or above average probability of being employed 30 or more hours a week; and (3) they experience none of the liabilities to LTC employment. We also include employed recipients who earn a wage lower than the median LTC wage and have no fringe benefits or opportunity for advancement. The proportion of TANF recipients identified as having a high potential for LTC employment ranges from just over a third of the caseload in Maryland, to 42 percent in the District of Columbia (Table IV.4). In the pooled sample, 38 percent of TANF case heads are classified as having a high potential for LTC employment. Within this group of high potential TANF case heads, the large majority are unemployed with an average probability of employment. The LTC industry represents an opportunity for job improvement for a very small percentage of TANF case heads, ranging from 0 to 4 percent across the four sites.
| TABLE IV.3. Employment Probabilities by Number of Liabilities for TANF Case Heads in All Four Study Sites | ||||
| Number of Employment Liabilities | Direction and Significance of Effect | Predicted Probability of Working 30 Hours | Difference from Probability with No Liabilities | |
| Pooled Samplea | ||||
| - No liabilities | 33b | |||
| - One liability | - | 28 | -5 | |
| - Two to three liabilities | - | * | 24 | -9 |
| - Four or more liabilities | - | *** | 13 | -20 |
| District of Columbia | ||||
| - No liabilities | 26 | |||
| - One liability | - | 26 | 0 | |
| - Two to three liabilities | - | 17 | -9 | |
| - Four or more liabilities | - | *** | 9 | -17 |
| Illinois | ||||
| - No liabilities | 37 | |||
| - One liability | - | 32 | -5 | |
| - Two to three liabilities | - | 32 | -5 | |
| - Four or more liabilities | - | ** | 19 | -18 |
| Maryland | ||||
| - No liabilities | 34 | |||
| - One liability | - | * | 20 | -14 |
| - Two to three liabilities | - | ** | 19 | -15 |
| - Four or more liabilities | - | *** | 10 | -24 |
| South Carolina | ||||
| - No liabilities | 32 | |||
| - One liability | + | 35 | +3 | |
| - Two to three liabilities | - | 23 | -9 | |
| - Four or more liabilities | - | *** | 12 | -20 |
SOURCE: Based on the results of logit models predicting the probability of working 30 hours per week using data from the 2002 TANF Caseload Surveys from the District of Columbia, Illinois, Maryland, and South Carolina.NOTE: The models included and controlled for client's gender, age, race/ethnicity, marital status, number of children, and age of youngest child. The model using pooled data from all four sites also included site controls. */**/*** Estimated effect of specified number of liabilities on employment is statistically significant at the .10/.05/.01 level.
| ||||
| TABLE IV.4. TANF Case Heads by Potential for Employment in LTC Industry(Percentages, Unless Stated Otherwise) | |||||
| District ofColumbia | Illinois | Maryland | SouthCarolina | AllStudyStatesa | |
| High Potential for LTC Employment | |||||
| - High probability of employment, no LTC liabilitiesb | 6 | 10 | 9 | 9 | 11 |
| - Average probability of employment, no LTC liabilitiesb | 35 | 24 | 24 | 28 | 25 |
| - Employed in job not comparable to LTC employment | 0 | 4 | 2 | 1 | 2 |
| Subtotal -- High Potential | 42 | 37 | 34 | 38 | 38 |
| Moderate Potential for LTC Employment | |||||
| - High probability of employment, moderate LTC liabilitiesb | 5 | 2 | 6 | 2 | 4 |
| - Average probability of employment, moderate LTC liabilitiesb | 14 | 13 | 15 | 18 | 14 |
| Subtotal -- Moderate Potential | 19 | 15 | 21 | 20 | 18 |
| Total Potential Pool of LTC Workersc | 61 | 52 | 56 | 58 | 56 |
| Current or Recent LTC Employment | 5 | 8 | 6 | 5 | 6 |
| Low Potential for LTC Employment | 34 | 40 | 38 | 37 | 38 |
| Total Caseload | 100 | 100 | 100 | 100 | 100 |
SOURCE: Analysis of 2001-2003 TANF Caseload Surveys from the District of Columbia, Illinois, Maryland, and South Carolina.
| |||||
We identify unemployed TANF recipients as having a moderate potential if they meet the same criterion as high potential recipients, except they experience one or more of the moderate liabilities to LTC employment. Moderate liabilities to LTC employment include a physical health problem, mental health problem, or difficulty with English. TANF recipients with a moderate potential for LTC employment represent approximately 20 percent of the caseload in the District of Columbia, Maryland, and South Carolina, and 15 percent in Illinois.
When we combine TANF recipients having a high potential and moderate potential, the potential pool of LTC workers expands to over half the caseload in every state. The potential pool of LTC workers represents 52 percent of TANF case heads in Illinois, 56 percent in Maryland, 58 percent in South Carolina and 61 percent in the District of Columbia, respectively.
The remaining TANF case heads not included in the potential pool of LTC workers are those who currently or recently held LTC jobs or those who have a low potential for employment in the LTC industry. Recipients with a low potential for LTC employment are unemployed TANF case heads who experience a major liability to LTC employment or who have a low probability of employment. As described in Chapter III, a criminal record and chemical dependence are defined as "major" liabilities to LTC employment. We also include in this group employed recipients who earn a wage greater than or equal to the median wage of LTC workers, receive any fringe benefits, or report any room for advancement. These TANF case heads represent 34 percent of TANF case heads in the District of Columbia, 37 percent in South Carolina, 38 percent in Maryland, and 40 percent in Illinois. In Illinois, nearly one quarter of TANF case heads (22 percent of the caseload) are included in the "low potential for LTC employment" group because they are employed in a comparable or better job. The pooled sample of TANF case heads from all states shows that 38 percent have a low potential for LTC employment.
We can estimate the number of potential LTC employees in each state based on the state population of single-parent TANF cases at the time of the survey, and the proportion of TANF case heads identified as potentially employable in the LTC industry. This suggests 7,270 potential LTC employees in the District of Columbia; 17,417 in Illinois; 8,886 in Maryland; and 6,381 in South Carolina. Applying the results of the pooled sample analysis to the total number of TANF case heads in all four sites yields an estimate of just over 40,000 recipients potentially employable in the LTC industry, including approximately 27,000 who have a high potential for LTC employment.
D. Characteristics and Liabilities of Potential LTC Workers
This section looks more closely at the characteristics and personal liabilities of the TANF case heads identified as potential LTC workers. Table IV.5 shows that the potential pool of LTC workers has characteristics similar to TANF case heads currently employed in LTC employment. The educational attainment of the two groups is roughly the same, with approximately 40 percent lacking a high school diploma. The racial make-up of the potential pool is also similar, with approximately 80 percent African-American, 12 percent White, and 7 percent Hispanic or other race. There is a slight difference in the age distribution, with half of those working in the LTC industry between the ages of 25 and 34, and an even distribution across age groups for the potential pool.
A comparison of TANF case heads employed in LTC to those who are potentially employable illuminates few major differences in liabilities between the two groups (Table IV.6). The potential pool has similar proportions of TANF recipients with limited work experience, no high school diploma, or lack of job skills. A criminal record is the only personal challenge with a significant difference between the two groups. This difference is a result of our selection criteria for the pool that excludes anyone with a criminal record or chemical dependency. The largest difference between the two groups is in the proportion of TANF case heads with a child or other family member or friend with a health problem or special need. This is most likely due to the fact that individuals who have experience taking care of family members or friends are often attracted to LTC employment. Significantly fewer TANF case heads in the potential pool are pregnant, with a six percentage point difference between the two groups.
| TABLE IV.5. Characteristics of TANF Case Heads in the Potential Pool of LTC Workers and Current or Recent TANF LTC Workersa | ||
| TANF LTC Workers in the Study State | Potential Pool of LTC Workers | |
| Gender | ||
| - Female | >99 | 99 |
| - Male | 1 | 1 |
| Age | ||
| - Younger than 25 years | 23 | 36 |
| - 25 to 34 years | 50 | 34 |
| - 35 years or older | 27 | 31 |
| Average age (years) | 30.3 | 28.3 |
| Median age (years) | 30 | 25 |
| Race/Ethnicity | ||
| - White, non-Hispanic | 10 | 12 |
| - African-American, non-Hispanic | 81 | 81 |
| - Hispanic and other | 10 | 7 |
| Marital Status | ||
| - Married | 8 | 5 |
| - Never married | 74 | 76 |
| - Widowed, divorced, separated | 17 | 19 |
| Highest Education Completed | ||
| - Less than high school diploma/GED | 39 | 40 |
| - High school diploma/GED | 29 | 31 |
| - More than high school diploma/GED | 31 | 29 |
| Number of Children Less than Age 18 in Household | ||
| Average | 2.8 | 2.5 |
| Median | 3 | 2 |
| Age of Youngest Child | ||
| - Less than 1 year | 25 | 23 |
| - 1 to 5 years | 51 | 49 |
| - 6 or older | 25 | 25 |
| Average age of youngest child (years) | 3.6 | 2.3 |
| Median age of youngest child (years) | 2 | 2 |
| Sample Size | 161 | 1,609 |
SOURCE: Based on data from the 2002 TANF Caseload Surveys from the District of Columbia, Illinois, Maryland, and South Carolina.
| ||
| TABLE IV.6. Potential Liabilities for Employment of TANF Case Heads in the Potential Pool of LTC Workers and Current or Recent TANF LTC Workersa | ||||
| Current or Recent TANF LTC Workers | Potential Pool of LTC Workers | Difference from Current or Recent LTC Workers | Significance of Difference | |
| Human Capital Deficits | ||||
| - No high school diploma or GED | 39 | 40 | +1 | |
| - Limited work experience | 21 | 18 | -3 | |
| - Performed fewer than four common job tasks | 26 | 26 | 0 | |
| Personal Challenges | ||||
| - Physical health problem | 14 | 19 | +5 | |
| - Mental health problem | 31 | 22 | -9 | |
| - Chemical dependence | 3 | 0 | -3 | |
| - Severe physical domestic violence in past year | 15 | 12 | -3 | |
| - Possible presence of learning disability | 11 | 10 | -1 | |
| - Criminal record | 8 | 0 | -8 | *** |
| - Difficulty with English | 2 | 2 | 0 | |
| Logistical and Situational Challenges | ||||
| - Child or other family member or friend with a health problem or special need | 48 | 31 | -17 | *** |
| - Pregnant | 12 | 6 | -6 | * |
| - Child under age 1 in household | 25 | 24 | -1 | |
| - Transportation problem | 25 | 21 | -4 | |
| - Child care problem | 26 | 33 | +7 | |
| - Unstable housing | 15 | 19 | -4 | |
| Multiple Liabilities | ||||
| - No liabilities | 4 | 8 | +4 | * |
| - One liability | 17 | 18 | +1 | |
| - Two to three liabilities | 40 | 45 | +5 | |
| - Four or more liabilities | 39 | 29 | -10 | * |
| Sample Size | 161 | 1,609 | ||
SOURCE: Based on data from the 2002 TANF Caseload Surveys from the District of Columbia, Illinois, Maryland, and South Carolina. */**/*** Estimated difference between potential pool of LTC workers and current or recent LTC workers is statistically significant at the .10/.05/.01 level.
| ||||
TANF case heads are more likely to work if they do not experience multiple liabilities. Table IV.6 shows that the potential pool of LTC workers has a lower rate of TANF case heads with four or more liabilities than current or recent LTC workers--29 percent versus 39 percent, respectively. A higher proportion of potentially employable TANF recipients experience no liabilities, representing eight percent of the potential pool.
E. Conclusion
As TANF recipients continue to face an array of work requirements, time limits, and sanctions requiring their eventual transition into employment, the LTC industry represents a realistic opportunity for a substantial portion of TANF case heads. Our analysis supports the consideration of TANF recipients as a potential source of workers to meet the growing demands of the LTC industry. We find that just over half of the caseload in Illinois, 56 percent in Maryland, 58 percent in South Carolina, and 61 percent in the District of Columbia, meet the basic needs of LTC employment.
However, in order to create a stable pool of workers, such an effort is likely to require an investment in some services to address the liabilities found among the potential pool of LTC workers. While the characteristics of this potential pool are comparable, if not better than TANF recipients currently employed in the LTC industry, recipients in the potential pool experience a range of liabilities. A third of the potential pool experience child care problems, 20 percent have transportation problems, and over 25 percent have performed fewer than four common job tasks. Even if these liabilities do not preclude recipients from becoming employed in the LTC industry, they may contribute to job loss among those who find employment, adding to a problem that the LTC industry is trying to remedy.
Addressing these potential liabilities may require the creation of a different kind of LTC training program. Existing LTC training programs focus primarily on the skills required to obtain certification and employment in the LTC industry. In order to address the needs of TANF recipients who face multiple liabilities to employment, these programs may want to consider expanding their services to include more individualized assistance with resolving liabilities to employment during training and after job placement. These services could be provided directly by the programs or through collaboration with an organization that has expertise in supporting TANF recipients in their transition to employment.
Other challenges also may need to be addressed to promote employment in the LTC industry among TANF recipients. Given the negative perceptions that surround employment in the LTC industry, marketing strategies may need to be developed to encourage TANF recipients to consider LTC employment as a positive alternative to their current situation. Marketing efforts may also be needed to encourage welfare offices to support TANF recipients who want to pursue careers in the LTC industry. This support could be in the form of financial assistance that helps to defray the cost of participating in a LTC training program or in the form of flexibility that allows TANF recipients to pursue short-term training rather than immediately looking for employment. TANF offices may also consider partnering with LTC providers to create certification and employment placement programs that are targeted to TANF recipients. Targeted programs could potentially increase TANF recipients' awareness of the opportunities in the LTC industry and make it easier for TANF recipients to access training, thereby increasing the likelihood that more TANF recipients will pursue training and employment in the LTC industry.
NOTES
-
Based on a General Accountability Office (GAO) analysis of data from the BLS (Scanlon 2001).
-
Appendix A offers details on the state TANF Caseload Surveys.
-
In a handful of cases, the household composition may have changed in the short timeframe from sample selection and the time of the survey such that children are no longer in the household and the TANF case is closed.
-
There were three different coding methods for industry and occupation used across the four sites. We examined the combination of industry and occupation codes independently in each site to identify case heads who clearly worked as nurse aides in an institutional setting or as home health aides either independently or through a home health care agency. TANF LTC workers comprise between 5 to 8 percent of TANF recipients in the four study sites as shown on Table III.3 in the next section.
-
These policies include a generous earnings disregard and stop the TANF time clock for periods while a recipient is employed at least 30 hours per week. Kirby et al. 2003 provides further details.
-
Appendix B provides details on how each liability is defined.
-
Appendix C provides detailed data tables on the liabilities that supplement the tables that are provided throughout this chapter.
REFERENCES
Acs, Gregory, and Pamela Loprest. "A Study of the District of Columbia's TANF Caseload." Washington, DC: The Urban Institute, October 2003.
Danziger, Sandra, Mary Corcoran, Sheldon Danziger, Colleen Heflin, Ariel Kalil, Judith Levine, Daniel Rosen, Kristin Seefeldt, Kristine Siefert, and Richard Tolman. "Barriers to the Employment of Welfare Recipients." Ann Arbor, MI: University of Michigan, Poverty Research and Training Center, February 2000.
District of Columbia Department of Health (DOH) Website. "Nurse Aide Candidate Handbook." Available at [http://www.dchealth.dc.gov/services/administration_offices/hra/hcfd/nurs.... Accessed February 2004.
Illinois Department of Public Health (DOPH) Website. "Nurse Aid Registry." [http://www.idph.state.il.us/nar/home.htm]. Accessed February 2004a.
Illinois Department of Public Health (DOPH) Website. Illinois Register. Notice of Proposed Amendments. [http://www.idph.state.il.us/nar/home.htm]. Accessed February 2004b.
Joslin, Susan, et al. "Training and Education: What Is Needed to Prepare Nursing Assistants to Deliver Good Care." In Appropriateness of Minimum Nurse Staffing Ratios in Nursing Homes: Part II. Baltimore, MD: Centers for Medicare & Medicaid Services. Available at the National Clearinghouse on the Direct Care Workforce website [http://www.directcareclearinghouse.org/r_art_det.jsp?res_id=1260]. March 2002.
Kirby, Gretchen, Thomas Fraker, LaDonna Pavetti, and Martha Kovac. "Families on TANF in Illinois: Employment Assets and Liabilities." Washington, DC: Mathematica Policy Research, Inc., June 2003.
Long, Sharon K., and Nancy M. Pindus. "Training Long-Term Care Workers: Lessons From Three Geriatric Aides Demonstration Projects and Selected Other Programs." Washington, DC: The Urban Institute, November 1994.
Maryland Department of Health and Mental Hygiene (DOHMH) Website. "Long Term Care. Medicaid Personal Care Program." Available at [http://www.dhmh.state.md.us/mma/longtermcare/html/Medicaid%20Personal%20Care.htm]. Accessed February 2004.
Ovwigho, Pamela C., Catherine E. Born, Ann Ferrero, and Correne Palazzo. "Life on Welfare: The Active TANF Caseload in Maryland." Baltimore, MD: University of Maryland, School of Social Work, February 2004.
Paraprofessional Healthcare Institute (PHI). "The Personal Assistance Services and Direct-Support Workforce: A Literature Review." Bronx, NY, June 12, 2003.
Rehnquist, J. "Nurse Aid Training." U.S. Department of Health and Human Services, Office of Inspector General, November 2002.
Scanlon, W. "Nursing Workforce: Recruitment and Retention of Nurses and Nurse Aides is a Growing Concern." GAO-01-750T. Testimony before the Committee on Health, Education, Labor and Pensions, U.S. Senate. Washington, DC: U.S. General Accounting Office, May 2001.
Stone, R. "Long-Term Care Workforce Shortages: Impact on Families." Policy Brief No. 3. Family Caregiver Alliance. October 2001.
Stone, Robyn I., and Joshua M. Wiener. "Who Will Care for Us? Addressing the Long-Term Care Workforce Crisis." Washington, DC: The Urban Institute and the American Association of Homes and Services for the Aging, October 2001. Available at [http://aspe.hhs.gov/daltcp/reports/ltcwf.htm]
U.S. Department of Health and Human Services, Office of Inspector General, Office of Evaluation and Inspections, Region V. "State Nurse Aide Training: Program Information and Data." OEI-05-01-00031. August 2002
U.S. Department of Health and Human Services and U.S. Department of Labor (DHHS, DOL). "The Future Supply of Long-Term Care Workers in Relation to the Aging Baby Boom Generation." Washington, DC, May 14, 2003. Available at [http://aspe.hhs.gov/daltcp/reports/ltcwork.htm].
Zedlewski, Sheila. "Work and Barriers to Work Among Welfare Recipients in 2002." Snapshots3 of America's Families. No. 3. Washington, DC: Urban Institute, August 2003.
APPENDIX A. DATA WEIGHTING METHODS
This appendix is also available as a separate PDF File.
Surveys rarely obtain information from everyone within the population of interest. As a result, it is necessary to differentially weight survey respondents to account for both the sampling frame (the probability of being selected into the sample) and for nonresponse among those who are sampled. In a survey that achieves less than a 100 percent response rate there is a risk that respondents may be systematically different from nonrespondents. Such differences would imply that the respondents should not be regarded as a random subsample of the full survey sample. If the survey data are not adjusted to mitigate these differences, such as by differentially weighting the survey respondents, it may be inappropriate to draw inferences about the sampling frame from statistics computed on the basis of the survey data.
This appendix describes the procedures that were used to develop weights for the Temporary Assistance for Needy Families (TANF) Caseload Survey data from Illinois, the District of Columbia, Maryland, and South Carolina. We followed three basic steps to create the weights. First, we created sampling adjustments to account for the number of TANF recipients in the full population represented by each individual in the survey sample. Second, we adjusted for potential non-response bias. And, third, we constructed post-stratification adjustments to ensure that the sum of the weighted survey respondents equals the sampling frame counts. While the steps were similar, the specific process employed within each step was different for Illinois than for the other three sites. We first describe the weighting procedures in Illinois separately and then describe the weighting procedures in the District of Columbia, Maryland, and South Carolina together. Table A.1 provides important details on the study populations, sample sizes and designs, and response rates for each of the sites.
A. Illinois
Component 1: Sampling weight
The sample weight for each case in the survey sample accounts for the number of cases it represents in the sampling frame, based on the sample selection procedure. The sample weight is the inverse of the actual probability of selection. The Illinois survey used a stratified sample with two strata, Cook County and downstate. Cook County was sampled at a marginally higher rate than downstate. For sampled cases in Cook County and downstate, respectively, the sampling weight is 62.93 and 63.09.
Component 2: Non-response adjustment factor
This component compensates for the reduction in the sample due to cases that could not be interviewed. It is the inverse of the survey response rate. Because the response rate was slightly lower in Cook County than downstate, the value of this component is slightly higher in Cook County (1.28) than downstate (1.25).
| TABLE A.1. Summary Table for the TANF Caseload Surveys | |||||
| State/Site | Description and Size of the Study Population | Sample Size and Design | Number of Completed Interviews | Survey Response Rate | Survey Fielding Period |
| District of Columbia | 11,918 single-parent TANF cases as of August 15, 2002. | 581 cases randomly selected from the full study population. | 420 of the 581 sample members | 72.3% | Mid-September 2002 - Mid-November 2002 |
| Illinois | 33,495 single-parent cases that were authorized to receive a TANF grant in November 2001. | 532 cases randomly selected from the full study population within two strata--residence in Cook County or in the rest of the state. | 416 of the 532 sample members | 78.2% | November 19, 2001 - March 3, 2002 |
| Maryland | 15,867 single-adult TANF cases with at least one recipient child in June 2002. | 1,146 cases drawn from the full study population: half randomly selected from Baltimore City and half randomly selected from the rest of the state. | 819 of the 1,146 sample members | 71.5% | August 19, 2002 - October 31, 2002 |
| South Carolina | 11,002 single-parent TANF cases in May 2002. | 1,493 cases drawn from the full study population within four strata:
| 1,120 of the 1,493 sample members | 75.0% | August 2002 - November 2002 |
Component 3: Post-stratification adjustment
This component of the survey weights is based on a post-stratification of the survey respondents into five cells as shown in Table A.2. This factor causes the sum of the weighted survey respondents to equal the number of cases in the sampling frame in each cell. The five cells were defined by three variables that were extracted from the Illinois DHS administrative data system in November 2001: residence in Cook County or downstate, the grantee's age less than or equal to 28 years or greater than 28 years, and a zero or positive TANF benefit amount. While in principle, these variables could be used to define eight cells, the infrequency of zero-benefit cases led us to consolidate them in a single cell. The values of the post-stratification adjustment factor range from 0.86 to 1.25. In general, the larger values are for cells containing cases with older grantees, who had a lower survey response rate than cases with younger grantees.
| TABLE A.2. Post-Stratification Adjustment | |||||
| Zero TANF Benefit | Positive TANF Benefit | ||||
| Cook County | Downstate | ||||
| 28 Years Old | >28 Years Old | 28 Years Old | >28 Years Old | ||
| Number of Survey Respondents | 30 | 184 | 129 | 48 | 25 |
| Weighted Number of Survey Respondents | 2,406 | 14,859 | 10,417 | 3,776 | 1,967 |
| Number of Cases in Sampling Frame | 2,859 | 12,728 | 12,074 | 3,378 | 2,456 |
| Adjustment Factor | 1.19 | 0.86 | 1.16 | 0.89 | 1.25 |
Final survey weights
The final weights for the survey respondents are the product of the three components discussed above. There is a unique weight for each of six cells, ranging in value from 69.17 to 98.24.1
B. District of Columbia, Maryland, and South Carolina
Component 1: Sampling weight
The sample weight for each case in the survey sample accounts for the number of cases it represents in the sampling frame, based on the sample selection procedure. The sample weight is the inverse of the actual probability of selection. DC had one strata; Maryland had two strata, Baltimore and the rest of the state; South Carolina had four strata--those subject to work requirements and under the 24-month time limit on benefits (mandated population), those exempt from work requirements (exempt population), those who have been granted an extension to the 24-month time limit (extended population), and those whose status could not be determined (unknown). Table A.3 presents the sampling weights for each site by strata.
| TABLE A.3. Sampling Weights | |
| Sampling Weight | |
| District of Columbia | 20.48 |
| Maryland | |
| - Baltimore | 17.86 |
| - Rest of State | 9.83 |
| South Carolina | |
| - Mandated Population | 14.01 |
| - Exempt Population | 3.77 |
| - Extended Population | 1.00 |
| - Unknown | 3.72 |
Component 2: Non-response adjustment factor (NAF)
A model predicting response was estimated, and respondents and nonrespondents were grouped by their predicted probability of being a respondent. The respondents were then weighted within these groups ("cells"), by the inverse of the overall response probability estimated in each cell. This process was conducted separately for each of the three sites (the District of Columbia, Maryland, South Carolina).
The first step was to estimate a model of response as a function of the covariates observed for all individuals in the sample. For each site, a model selection process was used to determine the variables that are the most predictive of whether someone was a respondent or nonrespondent. Variables were chosen using a model selection process involving univariate logistic regressions and a backward stepwise selection model.2
For the District of Columbia, the model of response included indicators for sanction at time of sample, receiving food stamps at time of sample, youngest child between 1 and 5 years of age, age younger than 25, and age between 25 and 34 years. The probability of response in Maryland was modeled using age, total amount of TANF grant received in June 2002, and an indicator for having two unique Maryland UI-covered employments in the second quarter of 2002. The South Carolina model of response included indicators for those between 28 and 34 years of age, food stamp receipt in December of 2002, and TANF receipt in October of 2002.
After the final model predicting response was selected for each site, the response cells were formed using the quantiles of the distribution of the predicted probabilities of response; the first cell contains individuals with the lowest predicted probabilities of response, and the last cell contains individuals with the highest predicted probabilities of response. The number of cells formed for each site was five or six, depending on the sample size for the site and the resulting adjustment weights. The non-response adjustment factor (NAF) is the inverse of the response rate in a cell, where the response rate is estimated as the number of respondents in that cell divided by the number of sampled individuals in that cell. Table A.4 presents the NAF for each cell by site.
Component 3: Post-stratification adjustment
A final poststratification adjustment was completed to ensure that the sum of the weighted survey respondents equaled the frame counts within the cells defined by covariates for each site (as determined in component 2). Unfortunately, full frame data were not available for all sites; limited frame data were available for the District of Columbia, and only the sampling strata counts and proportions were available for Maryland and South Carolina. In addition, the sampling strata for non-respondents were not available for use in constructing the South Carolina non-response weighting adjustments. Therefore, the post-stratification adjustments for the District of Columbia, South Carolina and Maryland are based on the sampling strata counts and proportions. These adjustments, presented in Table A.5, ensure that the sum of weighted respondents in each sampling strata equaled the sampling strata frame counts.
| TABLE A.4. Non-response Adjustment Factors | |||||
| Response Cell | Respondents | Sampled | Response Rate | NAF | |
| District of Columbia | 1 | 52 | 88 | 0.59 | 1.69 |
| 2 | 95 | 140 | 0.68 | 1.47 | |
| 3 | 49 | 67 | 0.73 | 1.37 | |
| 4 | 106 | 142 | 0.75 | 1.34 | |
| 5 | 118 | 145 | 0.81 | 1.23 | |
| Maryland | 1 | 142 | 227 | 0.63 | 1.60 |
| 2 | 156 | 224 | 0.70 | 1.44 | |
| 3 | 169 | 236 | 0.72 | 1.40 | |
| 4 | 174 | 229 | 0.76 | 1.32 | |
| 5 | 178 | 230 | 0.77 | 1.29 | |
| South Carolina | 1 | 86 | 155 | 0.55 | 1.80 |
| 2 | 78 | 116 | 0.67 | 1.49 | |
| 3 | 177 | 250 | 0.71 | 1.41 | |
| 4 | 100 | 131 | 0.76 | 1.31 | |
| 5 | 460 | 579 | 0.79 | 1.26 | |
| 6 | 219 | 262 | 0.84 | 1.20 | |
| TABLE A.5. Post-stratification Adjustments | |
| Post-stratification adjustment | |
| District of Columbia | 1.00 |
| Maryland | |
| - Baltimore | 1.01 |
| - Rest of State | 0.99 |
| South Carolina | |
| - Mandated Population | 1.00 |
| - Exempt Population | 1.00 |
| - Extended Population | 1.03 |
| - Unknown | 0.93 |
| TABLE A.6. Final Weights | ||||||
| Strata | Sampling Weight | Response Cell | NAF | Post- stratification adjustment | Final Weight | |
| District of Columbia | 1 | 20.48 | 1 | 1.69 | 1.00 | 34.66 |
| 1 | 20.48 | 2 | 1.47 | 1.00 | 30.18 | |
| 1 | 20.48 | 3 | 1.37 | 1.00 | 28.00 | |
| 1 | 20.48 | 4 | 1.34 | 1.00 | 27.43 | |
| 1 | 20.48 | 5 | 1.23 | 1.00 | 25.16 | |
| Maryland | 1 | 17.86 | 1 | 1.60 | 1.01 | 28.96 |
| 1 | 17.86 | 2 | 1.44 | 1.01 | 26.01 | |
| 1 | 17.86 | 3 | 1.40 | 1.01 | 25.30 | |
| 1 | 17.86 | 4 | 1.32 | 1.01 | 23.84 | |
| 1 | 17.86 | 5 | 1.29 | 1.01 | 23.41 | |
| 2 | 9.83 | 1 | 1.60 | 0.99 | 15.50 | |
| 2 | 9.83 | 2 | 1.44 | 0.99 | 13.92 | |
| 2 | 9.83 | 3 | 1.40 | 0.99 | 13.54 | |
| 2 | 9.83 | 4 | 1.32 | 0.99 | 12.76 | |
| 2 | 9.83 | 5 | 1.29 | 0.99 | 12.53 | |
| South Carolina | 1 | 14.01 | 1 | 1.80 | 1.00 | 25.12 |
| 1 | 14.01 | 2 | 1.49 | 1.00 | 20.73 | |
| 1 | 14.01 | 3 | 1.41 | 1.00 | 19.69 | |
| 1 | 14.01 | 4 | 1.31 | 1.00 | 18.26 | |
| 1 | 14.01 | 5 | 1.26 | 1.00 | 17.55 | |
| 1 | 14.01 | 6 | 1.20 | 1.00 | 16.68 | |
| 2 | 3.77 | 1 | 1.80 | 1.00 | 6.81 | |
| 2 | 3.77 | 2 | 1.49 | 1.00 | 5.62 | |
| 2 | 3.77 | 3 | 1.41 | 1.00 | 5.34 | |
| 2 | 3.77 | 4 | 1.31 | 1.00 | 4.95 | |
| 2 | 3.77 | 5 | 1.26 | 1.00 | 4.76 | |
| 2 | 3.77 | 6 | 1.20 | 1.00 | 4.52 | |
| 3 | 1.00 | 1 | 1.80 | 1.03 | 1.86 | |
| 3 | 1.00 | 2 | 1.49 | 1.03 | 1.53 | |
| 3 | 1.00 | 3 | 1.41 | 1.03 | 1.46 | |
| 3 | 1.00 | 4 | 1.31 | 1.03 | 1.35 | |
| 3 | 1.00 | 5 | 1.26 | 1.03 | 1.30 | |
| 3 | 1.00 | 6 | 1.20 | 1.03 | 1.23 | |
| 4 | 3.72 | 1 | 1.80 | 0.93 | 6.26 | |
| 4 | 3.72 | 2 | 1.49 | 0.93 | 5.16 | |
| 4 | 3.72 | 3 | 1.41 | 0.93 | 4.90 | |
| 4 | 3.72 | 4 | 1.31 | 0.93 | 4.55 | |
| 4 | 3.72 | 5 | 1.26 | 0.93 | 4.37 | |
| 4 | 3.72 | 6 | 1.20 | 0.93 | 4.16 | |
| NOTES: Strata values are as follows: Maryland: 1 = Baltimore, 2= rest of state; South Carolina: 1=mandated population, 2=exempt population, 3=extended population, 4=unknown. Final weights may vary from the product of the three component weights shown due to rounding. Component weights were rounded to two decimal places throughout this appendix for presentational purposes but were not rounded when calculating the final weight. | ||||||
Final survey weights
The final weights for the survey respondents in the District of Columbia, Maryland, and South Carolina are the product of the three components discussed above and are presented in Table A.6. There is a unique weight for each final cell, the number of which varies for each site based on the number of quantiles determined in component 2 multiplied by the number of sampling strata. There are 5 cells in the District of Columbia, 10 in Maryland, and 24 in South Carolina.
Notes
-
The six cells and their associated survey weights are: (1) zero TANF benefit, Cook County, 95.96; (2) zero TANF benefit, downstate, 93.48; (3) positive TANF benefit, Cook County, less than or equal to age 28, 69.17; (4) positive TANF benefit, Cook County, greater than age 28, 93.60; (5) positive TANF benefit, downstate, less than or equal to age 28, 70.38; (6) positive TANF benefit, downstate greater than age 28, 98.24.
-
Variables with substantial missing values were excluded from the analysis; missing values for variables with just a few missing values were imputed solely for the purpose of constructing these non-response weighting adjustments.
APPENDIX B. MEASURES OF PERSONAL LIABILITIES
This appendix is also available as a separate PDF File.
We used data collected in the Temporary Assistance for Needy Families (TANF) Caseload Surveys to create 16 measures of personal liabilities that TANF case heads bring to employment that are discussed throughout this report. These measures are defined as follows:
Human Capital Deficits
- No high school diploma, GED, or more. Did not complete high school, its equivalent, or receive any education beyond the high school level.
- Limited recent work experience. Worked for pay less than 50 percent of the time since turning age 18, based on a self-report.
- Performed fewer than four common job tasks. Has performed fewer than four of the following common job tasks on a daily or weekly basis: (1) talk with customers face to face, (2) talk with customers over the phone, (3) read instructions or reports, (4) write letters or memos, (5) work with a computer, such as word processing or data entry, (6) work with another electronic machine such as a cash register, bar code scanner, or calculator, (7) do arithmetic, including making change, (8) fill out forms, and (9) keep a close watch over gauges, dials, or instruments of any kind. The questions and scoring methods for this measure were adopted from the Women's Employment Study of the Poverty Research and Training Center, University of Michigan.
Personal Challenges
- Physical health problem. Self-reported fair or poor general health and a physical functioning score in the lowest quartile based on national norms adjusted for age and gender. Physical functioning was determined following the methodology of the Physical Functioning Scale of the SF-36 Health Survey that asks about ease in performing vigorous physical activities such as running or lifting heavy objects, moderate physical activities such as moving a table or pushing a vacuum cleaner, and daily physical activities such as carrying groceries, walking, and climbing stairs.
- Mental health problem. Experienced psychological distress in the past 30 days and/or probable major depression in the past year. Psychological distress was measured using the K6 Psychological Distress Symptom Scale that asks the frequency of feelings such as depression, hopelessness, restlessness, worthlessness, and nervousness. Individuals who scored 13 or more points on the K6 scale, which ranges from 0 to 24, were classified as experiencing distress. This validated scale has been used in the 2002 National Health Interview Survey and the 2001 National Household Survey on Drug Abuse. The probability of major depression was determined following the methodology of the Composite International Diagnostic Interview Short Form (CIDI-SF). Under this methodology, individuals with three or more of seven symptoms of major depression were classified as being at probable risk of major depression. Individuals who volunteered that they were on medication or anti-depressants also were classified as being at probable risk of major depression.
- Criminal Record. Self-report on the presence of a past criminal record.
- Severe physical domestic violence in past year. Experienced severe physical violence--hitting, beating, choking, using or threatening use of a weapon, or forcing sexual activity--from a domestic partner in the past year. This measure is based on a modified version of the Conflict Tactics Scale used in the Women's Employment Study of the Poverty Research and Training Center, University of Michigan.
- Chemical dependence. Assessed as having probable alcohol dependence and/or probable drug dependence. The probability of having alcohol or drug dependence was determined following the methodology of the CIDI-SF. Under this methodology, individuals with three or more of seven symptoms of dependence were classified as being at probable risk of dependence.
- Signs of a learning disability. A total score of 12 or more out of a possible 30 points on the Washington State Learning Disabilities Screener.
- Difficulty with English. Self-reported difficulty speaking, reading, or writing English because it is not her native language.
Logistical and Situational Challenges
- Child or other family member or friend with a health problem or special need. Self-report on having a child with health, behavioral, or other special needs and/or caring for an elderly, disabled, or sick family member or friend.
- Child under one year old. Self-report on presence of a child under the age of one in the household.
- Pregnant. Self-report on pregnancy.
- Child care problem. Self-report on having a child care problem that inhibits ability to take a job, to keep a job, or attend education or training activities. This summary measure was developed from a direct question about child care problems asked of case heads with children under the age of 15 and from two additional questions in which respondents could volunteer that child care was a reason for leaving her most recent job or for never having worked for pay.
- Transportation problem. Self-report on having a transportation problem that inhibits ability to take a job, keep a job, or attend education or training activities.
- Unstable housing. Moved two or more times and/or was evicted in the past year.
APPENDIX C. STATE-SPECIFIC DATA ON EMPLOYMENT, DEMOGRAPHIC CHARACTERISTICS AND EMPLOYMENT LIABILITIES
This appendix is also available as a separate PDF File.
| TABLE C.1. Employment Characteristics of the Heads of Single-Parent TANF Cases in Select States(Percentages, Unless Stated Otherwise) | ||||
| District ofColumbia | Illinois | Maryland | SouthCarolina | |
| Current Employment Status | ||||
| - Employed | 25 | 39 | 25 | 33 |
| - Not employed but has worked for pay | 70 | 58 | 74 | 64 |
| - Not employed; never worked pay | 5 | 3 | 2 | 3 |
| Proportion of Time Employed Since Age 18 | ||||
| - About 75 percent or more | 48 | 54 | 56 | 63 |
| - About 50 percent | 25 | 22 | 23 | 19 |
| - About 25 percent or less | 22 | 21 | 19 | 15 |
| - Not at all | 6 | 3 | 2 | 3 |
| Sample Size | 420 | 416 | 819 | 1,120 |
| SOURCE: 2001-2003 TANF Caseload Surveys from the District of Columbia, Illinois, Maryland, and South Carolina.NOTES: The survey data have been weighted to be representative of all single-parent TANF recipients in each state. Survey item non-response may cause the sample sizes for specific variables to be smaller than those shown. Rounding may cause percentages to sum to something other than 100. | ||||
| TABLE C.2. Characteristics of the Heads of Single-Parent TANF Cases in Select States(Percentages, Unless Stated Otherwise) | ||||
| District ofColumbia | Illinois | Maryland | SouthCarolina | |
| Gender | ||||
| - Female | 98 | 99 | 97 | 98 |
| - Male | 2 | 1 | 3 | 2 |
| Age | ||||
| - Younger than 25 years | 29 | 36 | 34 | 41 |
| - 25 to 34 years | 38 | 35 | 34 | 37 |
| - 35 years or older | 33 | 30 | 32 | 22 |
| Average age (years) | 30.7 | 29.5 | 30.5 | 28.6 |
| Median age (years) | 29 | 28 | 29 | 26 |
| Race/Ethnicity | ||||
| - White, non-Hispanic | 1 | 11 | 13 | 25 |
| - African-American, non-Hispanic | 97 | 79 | 84 | 72 |
| - Hispanic and other | 1 | 11 | 3 | 3 |
| Marital Status | ||||
| - Married | 3 | 7 | 4 | 3 |
| - Never married | 88 | 74 | 76 | 68 |
| - Widowed, divorced, separated | 9 | 19 | 20 | 29 |
| Highest Education Completed | ||||
| - Less than high school diploma/GED | 38 | 44 | 42 | 38 |
| - High school diploma/GED | 30 | 28 | 26 | 30 |
| - More than high school diploma/GED | 33 | 28 | 32 | 32 |
| Number of Children Less than Age 18 in Household | ||||
| Average | 2.6 | 2.7 | 2.2 | 2.1 |
| Median | 2 | 2 | 2 | 2 |
| Age of Youngest Child | ||||
| - Less than 1 year | 15 | 28 | 19 | 23 |
| - 1 to 5 years | 56 | 46 | 48 | 54 |
| - 6 to 14 years | 26 | 24 | 30 | 20 |
| - 15 years or older | 3 | 2 | 3 | 3 |
| Average age of youngest child | 4.1 | 3.9 | 4.3 | 3.6 |
| Median age of youngest child | 3 | 2 | 3 | 2 |
| Sample Size | 420 | 416 | 819 | 1,120 |
| SOURCE: 2001-2003 TANF Caseload Surveys from the District of Columbia, Illinois, Maryland, and South Carolina.NOTES: The survey data have been weighted to be representative of all single-parent TANF recipients in each state. Survey item non-response may cause the sample sizes for specific variables to be smaller than those shown. Rounding may cause percentages to sum to something other than 100. | ||||
| TABLE C.3. Characteristics of Current or Most Recent Job Held by TANF Case Headsa (Percentages, Unless Stated Otherwise) | ||||
| District ofColumbia | Illinois | Maryland | SouthCarolina | |
| Length of Employment on Job | ||||
| Average number of months | 12.7 | 11.9 | 13.3 | 12.1 |
| Median number of months | 5 | 5 | 4 | 5 |
| Hours Worked Per Week | ||||
| - Less than 20 | 10 | 8 | 10 | 8 |
| - 20 to 34 | 30 | 33 | 29 | 33 |
| - 35 or more | 60 | 59 | 61 | 58 |
| Average hours worked per week | 35 | 34 | 35 | 33.8 |
| Median hours worked per week | 40 | 35 | 40 | 35 |
| Shift or Time of Day Worked | ||||
| - Regular day time shift | 57 | 56 | 58 | 55 |
| - Morning or afternoon shift | 3 | 6 | 4 | 8 |
| - Evening or night shift | 21 | 22 | 19 | 16 |
| - Irregular, split, or rotating shift | 11 | 11 | 12 | 19 |
| - Other | 8 | 5 | 7 | 2 |
| Industry | ||||
| - Manufacturing | 1 | 7 | 4 | 12 |
| - Retail | 12 | 17 | 13 | 20 |
| - Accommodation and Food | 18 | 29 | 16 | 28 |
| - Health Care | 10 | 11 | 10 | 10 |
| - Social/Educational Services | 15 | 3 | 7 | 5 |
| - Business/Administrative/Professional Services | 26 | 14 | 16 | 6 |
| - Other Services | 9 | 10 | 5 | 14 |
| - Other | 10 | 8 | 29 | 5 |
| Current or Recent Employment in LTC | 5 | 8 | 6 | 5 |
| Sample Size | 398 | 401 | 804 | 1,086 |
SOURCE: 2001-2003 TANF Caseload Surveys from the District of Columbia, Illinois, Maryland, and South Carolina.NOTES: The survey data have been weighted to be representative of all single-parent TANF recipients in each state. Survey item non-response may cause the sample sizes for specific variables to be smaller than those shown. Rounding may cause percentages to sum to something other than 100.
| ||||
| TABLE C.4. Compensation on Current or Most Recent Job Held by TANF Case Heada(Percentages, Unless Stated Otherwise) | ||||
| District ofColumbia | Illinois | Maryland | SouthCarolina | |
| Hourly Wageb | ||||
| - Less than $5.15 | 11 | 20 | 10 | 15 |
| - $5.15 to 6.00 | 6 | 25 | 14 | 27 |
| - $6.01 to 7.00 | 27 | 21 | 27 | 25 |
| - $7.01 to 8.00 | 16 | 13 | 19 | 15 |
| - $8.01 to 9.00 | 12 | 9 | 10 | 8 |
| - $9.01 to 10.00 | 10 | 6 | 7 | 4 |
| - More than $10.00 | 17 | 6 | 12 | 6 |
| Average hourly wage (dollars) | $8.44 | $7.12 | $7.92 | $7.03 |
| Median hourly wage (dollars) | $7.50 | $6.50 | $7.00 | $6.50 |
| Fringe Benefits Available | ||||
| - Paid sick leave | 38 | 31 | 39 | 29 |
| - Paid vacation | 43 | 40 | 46 | 40 |
| - Paid holidays | 47 | 41 | 51 | 0 |
| - Health insurance | 45 | 34 | 47 | 42 |
| - Retirement plan | 29 | 22 | 32 | 29 |
| Opportunity for Advancement (Self-assessment) | ||||
| - Great deal | 22 | 16 | 18 | 19 |
| - Some | 30 | 26 | 26 | 23 |
| - A little | 17 | 23 | 26 | 19 |
| - None | 32 | 34 | 31 | 38 |
| Sample Size | 398 | 401 | 804 | 1,086 |
SOURCE: 2001-2003 TANF Caseload Surveys from the District of Columbia, Illinois, Maryland, and South Carolina.NOTES: The survey data have been weighted to be representative of all single-parent TANF recipients in each state. Survey item non-response may cause the sample sizes for specific variables to be smaller than those shown. Rounding may cause percentages to sum to something other than 100.
| ||||
| TABLE C.5. Anya Performance of Job Tasks on Current or Most Recent Job Among TANF Cases(Percentages) | ||||
| District ofColumbia | Illinois | Maryland | SouthCarolina | |
| Job Tasks Ever Performed | ||||
| - Talk with customers face to face | 82 | 82 | 85 | 85 |
| - Talk with customers over the phone | 58 | 55 | 57 | 55 |
| - Read instructinos or reports | 63 | 61 | 62 | 60 |
| - Write letters or memos | 44 | 36 | 42 | 34 |
| - Work with a computer | 49 | 42 | 45 | 43 |
| - Work with another electronic machine | 70 | 70 | 74 | 76 |
| - Do arithmetic | 62 | 64 | 68 | 71 |
| - Fill out forms | 66 | 61 | 64 | 63 |
| - Keep watch over gauges or instruments | 43 | 46 | 49 | 47 |
| Ever Performed at Least Any Four Job Tasks | 74 | 72 | 74 | 75 |
| Ever Performed Three Tasks Most Related to LTCb | 32 | 34 | 36 | 33 |
| Sample Size | 420 | 416 | 819 | 1,120 |
SOURCE: 2001-2003 TANF Caseload Surveys from the District of Columbia, Illinois, Maryland, and South Carolina.NOTES: The survey data have been weighted to be representative of all single-parent TANF recipients in each state. Survey item non-response may cause the sample sizes for specific variables to be smaller than those shown. Rounding may cause percentages to sum to something other than 100.
| ||||
| TABLE C.6. Regulara Performance of Job Tasks on Current or Most Recent Job Among TANF Cases(Percentages) | ||||
| District ofColumbia | Illinois | Maryland | SouthCarolina | |
| Job Tasks Regularly Performed | ||||
| - Talk with customers face to face | 79 | 80 | 84 | 82 |
| - Talk with customers over the phone | 55 | 51 | 53 | 50 |
| - Read instructinos or reports | 57 | 53 | 59 | 54 |
| - Write letters or memos | 38 | 30 | 36 | 27 |
| - Work with a computer | 45 | 37 | 41 | 38 |
| - Work with another electronic machine | 67 | 67 | 70 | 73 |
| - Do arithmetic | 60 | 60 | 63 | 68 |
| - Fill out forms | 61 | 55 | 59 | 56 |
| - Keep watch over gauges or instruments | 40 | 40 | 44 | 44 |
| Ever Performed at Least Any Four Job Tasks | 70 | 67 | 70 | 71 |
| Ever Performed Three Tasks Most Related to LTCb | 28 | 25 | 31 | 27 |
| Sample Size | 420 | 416 | 819 | 1,120 |
SOURCE: 2001-2003 TANF Caseload Surveys from the District of Columbia, Illinois, Maryland, and South Carolina.NOTES: The survey data have been weighted to be representative of all single-parent TANF recipients in each state. Survey item non-response may cause the sample sizes for specific variables to be smaller than those shown. Rounding may cause percentages to sum to something other than 100.
| ||||
| TABLE C.7. Physical Health(Percentages, Unless Otherwise Stated) | ||||
| District ofColumbia | Illinois | Maryland | SouthCarolina | |
| Overall Health (Self-Assessment) | ||||
| - Excellent | 30 | 23 | 20 | 21 |
| - Very good | 25 | 18 | 24 | 20 |
| - Good | 25 | 34 | 27 | 30 |
| - Fair | 16 | 18 | 19 | 16 |
| - Poor | 3 | 8 | 10 | 11 |
| Pregnanta | 5 | 8 | 5 | 5 |
| Physical Functioningb | ||||
| - 1st quartile of the U.S. population | 46 | 47 | 50 | 46 |
| - 2nd quartile of the U.S. population | 13 | 16 | 14 | 12 |
| - 3rd or 4th quartile of the U.S. population | 41 | 38 | 36 | 42 |
| - Below average for the U.S. population | 30 | 36 | 38 | 32 |
| Physical Health Problemc | 16 | 21 | 23 | 22 |
| Sample Size | 420 | 416 | 819 | 1,120 |
SOURCE: 2001-2003 TANF Caseload Surveys from the District of Columbia, Illinois, Maryland, and South Carolina.NOTES: The survey data have been weighted to be representative of all single-parent TANF recipients in each state. Survey item non-response may cause the sample sizes for specific variables to be smaller than those shown. Rounding may cause percentages to sum to something other than 100.
| ||||
| TABLE C.8. Mental Health(Percentages, Unless Stated Otherwise) | ||||
| District ofColumbia | Illinois | Maryland | SouthCarolina | |
| Experienced Psychological Distress in Past 30 Daysa | 10 | 12 | 17 | 17 |
| Experienced Major Depression in Past Yearb | 17 | 23 | 25 | 25 |
| Mental Health Problemc | 21 | 25 | 29 | 30 |
| Sample Size | 420 | 416 | 819 | 1,120 |
SOURCE: 2001-2003 TANF Caseload Surveys from the District of Columbia, Illinois, Maryland, and South Carolina.NOTES: The survey data have been weighted to be representative of all single-parent TANF recipients in each state. Survey item non-response may cause the sample sizes for specific variables to be smaller than those shown. Rounding may cause percentages to sum to something other than 100.
| ||||
| TABLE C.9. Chemical Dependence(Percentages) | ||||
| District ofColumbia | Illinois | Maryland | SouthCarolina | |
| Alcohol Dependencea | ||||
| - No alcohol dependence | 99 | 98 | 98 | 99 |
| - Probable alcohol dependence | 1 | 2 | 2 | 1 |
| Drug Dependenceb | ||||
| - No drug dependence | 98 | 98 | 96 | 99 |
| - Probable drug dependence | 2 | 2 | 4 | 1 |
| Any Chemical Dependencec | 3 | 3 | 5 | 1 |
| Sample Size | 420 | 416 | 819 | 1,120 |
SOURCE: 2001-2003 TANF Caseload Surveys from the District of Columbia, Illinois, Maryland, and South Carolina.NOTE: The survey data have been weighted to be representative of all single-parent TANF recipients in each state. Survey item non-response may cause the sample sizes for specific variables to be smaller than those shown. Rounding may cause percentages to sum to something other than 100.
| ||||
| TABLE C.10. Transportation Use and Problems(Percentages, Unless Stated Otherwise) | ||||
| District ofColumbia | Illinois | Maryland | SouthCarolina | |
| Primary Mode of Transportation to Work or Work-Related Activitya | ||||
| - Drives self | 11 | 22 | 19 | 49 |
| - Bus or public transportation | 3 | 5 | 5 | 5 |
| - Gets a Ride | 3 | 10 | 11 | 33 |
| - Walks | 80 | 61 | 61 | 7 |
| - Other | 3 | 3 | 5 | 6 |
| Length of Commute to Work or Work-Related Activity (in Minutes)a | ||||
| Average | 51 | 53.7 | 47.9 | 22.8 |
| Median | 45 | 45 | 40 | 15 |
| Does Not Have a Valid Driver's License | 62 | 51 | 63 | 35 |
| Does Not Own or Have Access to a Car | 68 | 62 | 67 | 39 |
| Self-Reported Transportation Problemb | 20 | 21 | 26 | 31 |
| Sample Size | 420 | 416 | 819 | 1,120 |
SOURCE: 2001-2003 TANF Caseload Surveys from the District of Columbia, Illinois, Maryland, and South Carolina.NOTES: The survey data have been weighted to be representative of all single-parent TANF recipients in each state. Survey item non-response may cause the sample sizes for specific variables to be smaller than those shown. Rounding may cause percentages to sum to something other than 100.
| ||||
| TABLE C.11. Potential Liabilities for Employment(Percentages, Unless Stated Otherwise) | ||||
| District ofColumbia | Illinois | Maryland | SouthCarolina | |
| Human Capital Deficits | ||||
| - No high school or GED | 38 | 44 | 42 | 38 |
| - Limited work experiencea | 27 | 24 | 21 | 18 |
| - Performed fewer than four common job tasks | 26 | 28 | 26 | 25 |
| - Has not regularly performed LTC related job tasksb | 72 | 75 | 69 | 73 |
| Personal Challenges | ||||
| - Physical health problemc | 16 | 21 | 23 | 22 |
| - Mental health problemd | 21 | 25 | 29 | 29 |
| - Chemical dependencee | 3 | 3 | 5 | 1 |
| - Severe physical domestic violence in past year | 14 | 13 | 14 | 14 |
| - Possible presence of learning disability | 8 | 12 | 11 | 11 |
| - Criminal recordf | 7 | 8 | 14 | 10 |
| - Difficulty with English | 1 | 2 | 1 | 1 |
| Logistical and Situational Challenges | ||||
| - Child or other family member or friend with a health problem or special needg | 32 | 34 | 33 | 32 |
| - Pregnant or child under age one in household | 21 | 36 | 24 | 28 |
| - Transportation problemh | 20 | 21 | 26 | 31 |
| - Child care problemh | 42 | 31 | 41 | 31 |
| - Unstable housingi | 13 | 23 | 20 | 22 |
| Sample Size | 420 | 416 | 819 | 1,120 |
SOURCE: 2001-2003 TANF Caseload Surveys from the District of Columbia, Illinois, Maryland, and South Carolina.NOTES: The survey data have been weighted to be representative of all single-parent TANF recipients in each state. Survey item non-response may cause the sample sizes for specific variables to be smaller than those shown. Rounding may cause percentages to sum to something other than 100.
| ||||
| TABLE C.12. Number of Potential Liabilities for Employment | ||||
| District ofColumbia | Illinois | Maryland | SouthCarolina | |
| Number of Human Capital Deficitsa | ||||
| - 0 | 42 | 39 | 44 | 46 |
| - 1 | 33 | 32 | 30 | 32 |
| - 2 | 17 | 22 | 20 | 17 |
| - 3 | 8 | 7 | 6 | 5 |
| Average | 0.9 | 1 | 0.9 | 0.8 |
| Median | 1 | 1 | 1 | 1 |
| Number of Personal Challengesb | ||||
| - 0 | 57 | 50 | 44 | 45 |
| - 1 | 25 | 28 | 29 | 32 |
| - 2 | 12 | 15 | 17 | 14 |
| - 3 | 5 | 6 | 7 | 8 |
| - 4 or more | 2 | 2 | 3 | 2 |
| Average | 0.7 | 0.8 | 1 | 0.9 |
| Median | 0 | 0 | 1 | 1 |
| Number of Logistical and Situational Challengesc | ||||
| - 0 | 27 | 24 | 20 | 22 |
| - 1 | 38 | 37 | 39 | 38 |
| - 2 | 24 | 24 | 27 | 27 |
| - 3 | 9 | 12 | 12 | 11 |
| - 4 | 2 | 3 | 2 | 2 |
| Average | 1.2 | 1.3 | 1 | 1.3 |
| Median | 1 | 1 | 1 | 1 |
| Number of All Potential Liabilities for Employment | ||||
| - 0 | 10 | 6 | 5 | 6 |
| - 1 | 17 | 15 | 16 | 15 |
| - 2 | 20 | 24 | 21 | 22 |
| - 3 | 21 | 16 | 19 | 19 |
| - 4 | 13 | 16 | 14 | 14 |
| - 5 | 10 | 10 | 13 | 13 |
| - 6 | 6 | 6 | 6 | 7 |
| - 7 or more | 3 | 7 | 6 | 3 |
| Average | 2.8 | 3.1 | 3.2 | 3 |
| Median | 3 | 3 | 3 | 3 |
| Sample Size | 420 | 416 | 819 | 1,120 |
SOURCE: 2001-2003 TANF Caseload Surveys from the District of Columbia, Illinois, Maryland, and South Carolina.NOTES: The survey data have been weighted to be representative of all single-parent TANF recipients in each state. Survey item non-response may cause the sample sizes for specific variables to be smaller than those shown. Rounding may cause percentages to sum to something other than 100.
| ||||
APPENDIX D. STATE-SPECIFIC PREDICTED EMPLOYMENT PROBABILITIES
This appendix is also available as a separate PDF File.
| TABLE D.1. Employment Probabilities by Characteristics of the Heads of Single-Parent TANF Cases in the District of Columbia(Percentages, Unless Stated Otherwise) | |||||
| Specific Liability | Prevalence(%) | Direction and Significance of Effect | Predicted Probability of Working 30 Hours | Difference from Probability with No Liabilities | |
| No Employment Liabilities | 10 | 30 | |||
| Human Capital Deficits | |||||
| - No high school diploma or GED | 38 | - | 24 | -6 | |
| - Limited work experience | 27 | - | ** | 12 | -18 |
| - Performed fewer than four common job tasks | 26 | - | 26 | -4 | |
| Personal Challenges | |||||
| - Physical health problem | 16 | + | 42 | +12 | |
| - Mental health problem | 21 | + | 36 | +6 | |
| - Severe physical domestic violence in past year | 14 | - | 19 | -11 | |
| - Possible presence of learning disability | 9 | - | 25 | -5 | |
| - Criminal record | 7 | + | 35 | +5 | |
| Logistical and Situational Challenges | |||||
| - Child or other family member or friend with a health problem or special need | 32 | - | ** | 18 | -12 |
| - Pregnant | 5 | + | 32 | +2 | |
| - Child under age 1 in household | 15 | - | 27 | -3 | |
| - Transportation problem | 19 | + | 40 | +10 | |
| - Child care problem | 41 | - | * | 19 | -11 |
| - Unstable housing | 13 | - | 24 | -6 | |
| SOURCE: Based on the results of a logit model predicting the probability of working 30 hours per week using data from the 2002 TANF Caseload Surveys from the District of Columbia.NOTE: The liabilities chemical dependence and difficulty with English are not included in this model because there is insufficient variation in these variables to measure their effect. The model included and controlled for client's gender, age, race/ethnicity, marital status, number of children, and age of youngest child. */**/*** Estimated effect of specified liability on employment is statistically significant at the .10/.05/.01 level. | |||||
| TABLE D.2. Employment Probabilities by Characteristics of the Heads of Single-Parent TANF Cases in Illinois(Percentages, Unless Stated Otherwise) | |||||
| Specific Liability | Prevalence(%) | Direction and Significance of Effect | Predicted Probability of Working 30 Hours | Difference from Probability with No Liabilities | |
| No Employment Liabilities | 6 | 46 | |||
| Human Capital Deficits | |||||
| - No high school diploma or GED | 44 | - | 43 | -3 | |
| - Limited work experience | 24 | - | * | 31 | -15 |
| - Performed fewer than four common job tasks | 28 | - | 42 | -4 | |
| Personal Challenges | |||||
| - Physical health problem | 21 | - | * | 30 | -16 |
| - Mental health problem | 25 | - | 37 | -9 | |
| - Chemical dependence | 3 | + | 47 | +1 | |
| - Severe physical domestic violence in past year | 13 | + | 49 | +3 | |
| - Possible presence of learning disability | 12 | + | 49 | +3 | |
| - Criminal record | 8 | + | 53 | +7 | |
| - Difficulty with English | 2 | - | 33 | -13 | |
| Logistical and Situational Challenges | |||||
| - Child or other family member or friend with a health problem or special need | 34 | + | 48 | +2 | |
| - Pregnant | 8 | - | 27 | -19 | |
| - Child under age 1 in household | 28 | - | 36 | -10 | |
| - Transportation problem | 21 | - | 40 | -6 | |
| - Child care problem | 31 | - | *** | 25 | -21 |
| - Unstable housing | 23 | - | 46 | 0 | |
| SOURCE: Based on the results of a logit model predicting the probability of working 30 hours per week using data from the 2001-2002 TANF Caseload Survey from Illinois.NOTE: The model included and controlled for client's gender, age, race/ethnicity, marital status, number of children, and age of youngest child. */**/*** Estimated effect of specified liability on employment is statistically significant at the .10/.05/.01 level. | |||||
| TABLE D.3. Employment Probabilities by Characteristics of the Heads of Single-Parent TANF Cases in Maryland(Percentages, Unless Stated Otherwise) | |||||
| Specific Liability | Prevalence(%) | Direction and Significance of Effect | Predicted Probability of Working 30 Hours | Difference from Probability with No Liabilities | |
| No Employment Liabilities | 5 | 31 | |||
| Human Capital Deficits | |||||
| - No high school diploma or GED | 42 | - | 30 | -1 | |
| - Limited work experience | 24 | - | *** | 12 | -19 |
| - Performed fewer than four common job tasks | 28 | - | * | 20 | -11 |
| Personal Challenges | |||||
| - Physical health problem | 21 | - | 23 | -8 | |
| - Mental health problem | 25 | - | 24 | -7 | |
| - Chemical dependence | 3 | - | 28 | -3 | |
| - Severe physical domestic violence in past year | 13 | - | 25 | -6 | |
| - Possible presence of learning disability | 12 | + | 38 | +7 | |
| - Criminal record | 8 | - | 22 | -9 | |
| Logistical and Situational Challenges | |||||
| - Child or other family member or friend with a health problem or special need | 34 | + | 37 | +6 | |
| - Pregnant | 8 | - | *** | 5 | -26 |
| - Child under age 1 in household | 28 | - | * | 21 | -10 |
| - Transportation problem | 21 | - | 30 | -1 | |
| - Child care problem | 31 | - | 26 | -5 | |
| - Unstable housing | 23 | - | 30 | -1 | |
| SOURCE: Based on the results of a logit model predicting the probability of working 30 hours per week using data from the 2002 TANF Caseload Survey from Maryland.NOTE: The liability difficulty with English is not included in this model because there is insufficient variation in the variable to estimate its effect. The model included and controlled for client's gender, age, race/ethnicity, marital status, number of children, and age of youngest child. */**/*** Estimated effect of specified liability on employment is statistically significant at the .10/.05/.01 level. | |||||
| TABLE D.4. Employment Probabilities by Characteristics of the Heads of Single-Parent TANF Cases in South Carolina(Percentages, Unless Stated Otherwise) | |||||
| Specific Liability | Prevalence(%) | Direction and Significance of Effect | Predicted Probability of Working 30 Hours | Difference from Probability with No Liabilities | |
| No Employment Liabilities | 6 | 39 | |||
| Human Capital Deficits | |||||
| - No high school diploma or GED | 38 | - | 37 | -2 | |
| - Limited work experience | 17 | - | 27 | -12 | |
| - Performed fewer than four common job tasks | 25 | - | 36 | -3 | |
| Personal Challenges | |||||
| - Physical health problem | 23 | - | *** | 19 | -20 |
| - Mental health problem | 30 | - | 31 | -8 | |
| - Chemical dependence | 1 | - | *** | 3 | -36 |
| - Severe physical domestic violence in past year | 14 | + | 43 | +4 | |
| - Possible presence of learning disability | 12 | - | *** | 13 | -26 |
| - Criminal record | 11 | - | 32 | -7 | |
| - Difficulty with English | 1 | + | 74 | +35 | |
| Logistical and Situational Challenges | |||||
| - Child or other family member or friend with a health problem or special need | 33 | + | 42 | +3 | |
| - Pregnant | 5 | - | 29 | -10 | |
| - Child under age 1 in household | 23 | - | 34 | -5 | |
| - Transportation problem | 31 | - | 33 | -6 | |
| - Child care problem | 31 | - | *** | 22 | -17 |
| - Unstable housing | 22 | - | 36 | -3 | |
| SOURCE: Based on the results of a logit model predicting the probability of working 30 hours per week using data from the 2002 TANF Caseload Survey from South Carolina.NOTE: The model included and controlled for client's gender, age, race/ethnicity, marital status, number of children, and age of youngest child. */**/*** Estimated effect of specified liability on employment is statistically significant at the .10/.05/.01 level. | |||||