
Monday, October 27, 2014
Long-Term Services and Supports:An Overview
Helen Lamont, Ph.D.
Office of Disability, Aging, and Long-Term Care Policy
Office of the Assistant Secretary for Planning and Evaluation
Long-Term Services and Supports
- aka “long-term care”
- Assistance with routine daily activities provided to people with functional limitations because of physical, cognitive or mental disability
- Measured with ADLs and IADLs
- Most prevalent among 65+ population, but not exclusive
- LTSS includes services like personal care, homemaker services meal assistance, transportation assistance, case management, etc.
Who uses LTSS?
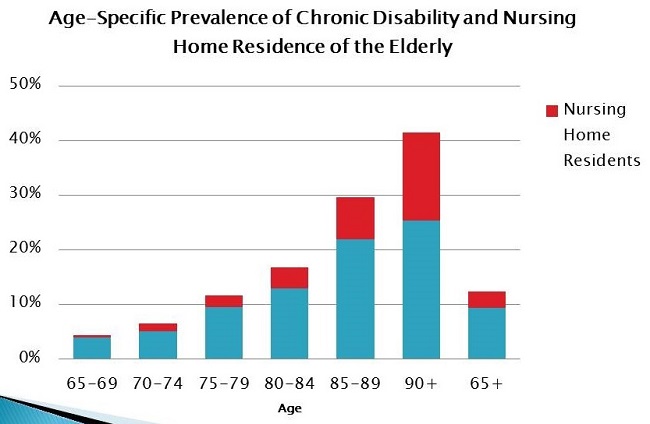 |
| Source: 2011 National Health and Aging Trends Study |
Likelihood of needing LTSS
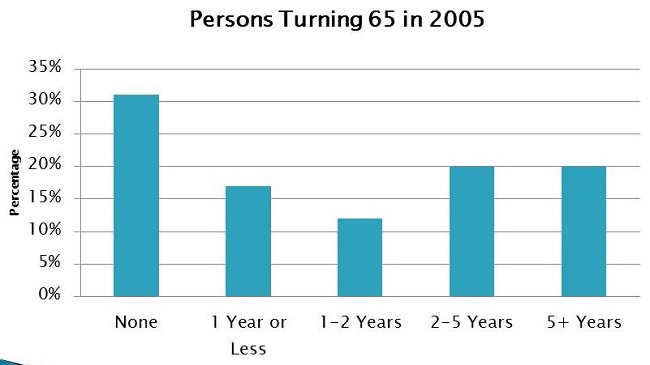 |
| Source: Kemper, Komisar and Alecxih (2005) |
Who provides LTSS?
- 95% of people get help from family and friends
- 65% rely exclusively on family and friends
- Only 1/3 use formal (paid) services and very few (5%) only use paid services As needs increase, paid care is more likely to be added
Source: 2011 National Study of Caregiving; Supplement to the National Health and Aging Trends Study
Informal caregivers
- Estimated 17.9 million caregivers providing 1.3 billion unpaid hours annually
- Most chronically disabled older adults have at least 2 people providing care-- increases with disability level
- More likely to be women (62%)
- Half are middle-aged (45-64)
- 29% daughters, 21.2% spouses, 18% sons, 22% other relatives like grandchildren and daughters-in-law
- Average 75 hours of help per month-- but lots of variability
Source: 2011 National Study of Caregiving; Supplement to the National Health and Aging Trends Study
Impacts of informal caregiving
- Almost 70% of caregivers report substantial positive aspects of caregiving
- 15% of caregivers report significant negative aspects like financial difficulties, stress, or physical strain-- higher among dementia caregivers
- Caregiver stress associated with poor health and increased likelihood of nursing home placement for care recipient
Source: 2011 National Study of Caregiving; Supplement to the National Health and Aging Trends Study
LTSS settings
- Provided in home, community settings, residential settings (assisted living), or nursing homes.
- Nursing facilities
- Compensatory, rehabilitative, psychosocial and social services to residents.
- Regulated by states with federal rules because payment sources are largely Medicare and Medicaid
- 2012: 1.4 million residents
- Residential care
- 24 hour supervision, assistance with ADLs, but not skilled nursing
- Regulated at state level-- payment sources are mostly private pay and some Medicaid
- 2012: 713,300 residents
Paid workforce
- Direct care workers-- staff who deliver formal LTSS
- Include nurse aides and home health aides
- Estimated 1.9 million direct care workers
- Demanding profession with low wages and limited benefits
- Challenges with recruitment and retention
Sources of LTSS payments
- In 2011, expenditures estimated at $425 billion.
- $291 billion care in home and community
- $134 billion institutional care
| Figure 2. Percentage Share of Spending on Long-Term Care for the Elderly, 2011 |
|---|
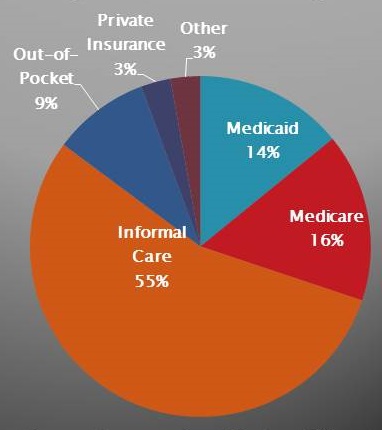 |
| Source: Congressional Budget Office, 2013 |
Financing
- Medicare*
- Medicaid
- Private out-of-pocket and long-term care insurance
Clarifying Medicare and LTSS
- Medicare designed to cover post-acute care
- Medicare does cover limited services
- Up to 100 days in a skilled nursing or rehabilitation facility after a hospitalization
- Home-health to the homebound meeting certain need requirements (recertified every 60 days)1
- But Medicare does not cover most long-term services and supports!
Medicaid
- Health care coverage for the poor and LTSS for disabled persons with limited financial resources
- Many older Americans with income and assets above poverty “spend down” their resources by paying out-of-pocket for LTSS
- Nursing home care is a required benefit
- States can choose to cover home and community-based services (HCBS) through “waivers,” but states can also limit number and type of beneficiaries who receive these services
- Medicaid financed by states and federal government; roughly 50:50
Out-of-pocket costs
- Average annual costs
- Nursing home: $85,235 single occupancy, $78,110 double occupancy
- Assisted living: $41,724
- Home care: $20/hr
- 10hrs/week=$11,400
- 8hrs/day=$58,240
Long-term care insurance
- Policies mostly purchased by middle-aged and older adults
- Healthy enough to pass underwriting
- Higher than average incomes
- 7.7 million policies in force
- Insurance payments account for 3.3% of spending on LTSS annually
The Aging Network
- Under Older Americans Act (OAA) through the Administration on Aging (part of ACL)
- Formula grant funding to states, distributed to network of regional Area Agencies on Aging (AAAs) or Aging and Disability Resource Centers (ADRCs) to provide LTSS
- Provide information & referral, HCBS, caregiver supports, congregate and home-delivered meals
- Funding levels in FY2014:
- HCBS: $347 million
- Meals: $811 million
- Caregiver supports: $146 million
Recent trends and developments
- 1999: Supreme Court Olmstead decision
- CLASS Act and Long-Term Care Commission
- Planning for LTSS
- HCBS Quality Measurement
- Potential for technological solutions
Questions???
Files
Document
Mtg14-Slides1.pdf (pdf, 1.14 MB)